Embed Size (px)
Citation preview

A hybrid and adaptive tool-path generation approach of rapid prototyping and manufacturing for biomedical models Jin, G. , Li, W.D. , Gao, L. and Popplewell, K. Author post-print (accepted) deposited in CURVE February 2013 Original citation & hyperlink: Jin, G. , Li, W.D. , Gao, L. and Popplewell, K. (2013) A hybrid and adaptive tool-path generation approach of rapid prototyping and manufacturing for biomedical models . Computers in industry, volume 64 (3): 336–349. http://dx.doi.org/10.1016/j.compind.2012.12.003 Copyright © and Moral Rights are retained by the author(s) and/ or other copyright owners. A copy can be downloaded for personal non-commercial research or study, without prior permission or charge. This item cannot be reproduced or quoted extensively from without first obtaining permission in writing from the copyright holder(s). The content must not be changed in any way or sold commercially in any format or medium without the formal permission of the copyright holders. This document is the author’s post-print version of the journal article, incorporating any revisions agreed during the peer-review process. Some differences between the published version and this version may remain and you are advised to consult the published version if you wish to cite from it.
CURVE is the Institutional Repository for Coventry University http://curve.coventry.ac.uk/open

A Hybrid and Adaptive Tool-path Generation Approach of Rapid Prototyping and Manufacturing for Biomedical Models
G.Q. Jin1, W.D. Li1*, L. Gao2, K. Popplewell1
1 Faculty of Engineering and Computing, Coventry University, Coventry CV1 5FB, UK
2 State Key Laboratory of Digital Manufacturing Equipment and Technology, Huazhong University of Science and Technology, Wuhan 430074, PR China
* Corresponding author: Tel: +44 (0)2476 88 8940; Email: [email protected]
ABSTRACT
In this paper, a hybrid and adaptive tool-path generation approach, which is able to improve geometrical accuracy and build time of Rapid Prototyping/Manufacturing (RP/M) for complex biomedical models, is presented. Firstly, NURBS (Non-Uniform Rational B-Spline)-based curves were introduced to represent the boundary contours of sliced layers to keep the high-fidelity information of original models. Secondly, a hybrid tool-path generation algorithm was then developed to generate contour and zigzag tool-paths. The contour tool-paths are used to fabricate the boundary and neighboring regions of each sliced layer to preserve geometrical accuracy, and zigzag tool-paths for the internal region of the layer to simplify computing processes and speed up fabrication. Thirdly, based on developed build time and geometrical accuracy analysis models, algorithms were designed to generate an adaptive speed of the RP/M’s nozzle/print head for the contour tool-paths to address the geometrical characteristics of each layer, and to identify the best slope degree of the zigzag tool-paths towards achieving the minimum build time. Finally, five case studies of biomedical models with different geometrical characteristics and complexity were used to verify and demonstrate the improved performance of the approach in terms of processing effectiveness, geometrical accuracy and algorithm robustness. Keywords: Rapid Prototyping, Rapid Manufacturing, Tool-path Generation, Biomedical Model 1. Introduction
In healthcare applications, a biomedical model of a patient offers surgeons a direct, full understanding of a
patient’s anatomy that cannot be obtained from Computed Tomography (CT) and Magnetic Resonance Imaging (MRI) images. Such a model can help surgeons identify diseases more easily for diagnosis and treatment planning, and reduce the risk of medical and operation problems. However, biomedical models such as anatomy model and patient specific implants are usually characterized with highly customized and complex geometry. It is difficult for the conventional manufacturing and machining processes such as forming, casting, turning and milling, etc. to fabricate the models. The Rapid Prototyping/Manufacturing (RP/M) technology has been identified as an innovative manufacturing technology in recent years [1]. Different from conventional forming and machining processes, it is an additive forming process by adding materials, layer-by-layer, as specified by a Computer-Aided Design (CAD) systems. The distinguished advantage of RP/M is that it is a mould-less process, suitable for free-form and complex geometrical model realization [2]. This kind of geometric flexibility of the RP/M technology and the complexity of biomedical models are the main reasons that RP/M is increasingly used in biomedical applications [3]. For complex biomedical models, it still needs to improve the current process planning strategies in the RP/M software packages significantly in the aspects of build time and geometrical quality. For instance, it could take tens of hours to process relatively small parts resulting in high cost of prototype manufacturing. Another challenging issue is geometrical inaccuracy inherent from the additive forming mechanism of RP/M, which is the obstacle to achieve high geometrical quality of biomedical products. Owing to quickly developed healthcare markets, it is imperative to develop more effective algorithms in RP/M to minimize build time and improve geometrical accuracy in order to meet the high-quality design and functional requirements of complex biomedical models [4].
Process planning is a critical task in RP/M to determine the build efficiency and geometrical accuracy. It consists of four essential tasks, i.e., orientation determination, support structure determination, slicing and tool-path generation (shown in Figure 1). The research presented in this paper focuses on the tool-path generation strategy in process planning to balance and optimize the build efficiency and geometrical accuracy of RP/M. A tool-path is the trajectory of the nozzle (e.g., in a Fused Deposition Modeling (FDM) system)/print head (e.g., in a 3D Printer) in a RP/M process to fill the boundary and interior areas of each sliced layer. Various types of

tool-path strategies and algorithms, such as zigzag, contour, spiral and partition patterns, were developed with different considerations on the build time, cost, geometrical quality, warpage, shrinkage, strength and stiffness of a RP/M model [5-11].
In this paper, a novel tool-path generation approach was developed to improve the RP/M model representation, tool-path generation and nozzle/print head speed control to be adaptive to the various geometrical properties of complex biomedical models. The approach includes the following algorithms:
• A slicing algorithm was designed to represent the boundary (contour) of each sliced layer in a Non-Uniform
Rational B-Spline (NURBS) curve. The NURBS-based representation can enhance the geometrical accuracy of a model during RP/M and replaces STL (Stereolithography)-based representation strategy, which is a de facto but less accurate standard to support RP/M in industries;
• For each layer, a hybrid tool-path generation algorithm was designed to generate a series of contour and internal offset tool-paths along the NURBS-based represented boundary of the model to improve the geometrical quality during RP/M, and zigzag tool-paths for the internal area of the model to simplify computing and fabrication processes. Also, an adaptive speed algorithm was developed to optimize the speed of the RP/M’s nozzle/print head adaptively for the various geometries of the model so as to improve the efficiency of contour tool-paths and with the most suitable slope degree of zigzag tool-paths leading to the shortest build time.
• To demonstrate the performance of this research in terms of processing efficiency and geometrical accuracy, five case studies of biomedical models with different geometrical characteristics and complexity were used for research verification.
2. Related Works
2.1 Model representation of RP/M
In RP/M, STL has been a widely adopted data standard. However, STL is less inaccurate in geometrical
representation and needs much more storage spaces for a complex model than parametric mathematical representation themes, such as NURBS, Bezier, B-Spline, etc. Recently, there are active research and development to introduce parametric mathematical representation to better support models of RP/M. In [12-13], arcs, lines and Bezier curves were used to describe the cross-sectional contour geometries of sliced layers. In the approach, a macro-AutoSection software package was developed to collect the sliced contour data and to support the RP/M process for a commercial Selective Laser Sintering (SLS) machine. In [14], an approach was developed to use lines, arcs and circles to represent the sliced contours of an AutoCAD solid model in an ASCII DXF file. Material information such as material type can also be saved to support RP/M. Ma et al. used NURBS to represent a RP/M model so as to obtain more accurate and smoother surface. In the meantime, a selective hatching strategy was applied to reduce build time and improve geometrical quality by fabricating the kernel region of the model using thicker sliced layers and the skin region of the model using thinner sliced layers [15]. In [16], a slicing algorithm was developed to use STEP and NURBS to represent a RP/M model. The algorithm consists of five steps: (1) to determine the orientation of a model to minimize build height, (2) to define the NURBS surface of the model, (3) to generate a boundary volume data structure, (4) to use a bi-sectional iteration routine method to solve the inter-sectional points, and (5) to categorize inter-sectional points to support an optimized RP/M process. Four models in different representation formats were used to validate the developed algorithm. In [17], a B-spline curve was reconstruction from cloud date to represent the contour curve of the model. Cloud point data was segmented to a number of layers along the fabrication direction of RP/M. The points were then projected to generate a 2D band on the mid-plane layer. A number of scattered points were
Biomedical CAD Models
Orientation determination
Support structure
determination Slicing
Tool-path generation 3D Printer
Fused Deposition Modeling (FDM)
Selective Laser Sintering/Melting
(SLS/SLM)
etc.
Process planning Rapid Prototyping/Manufacturing systems
Figure 1 Process planning and tool-path generation for RP/M systems.

picked up along the band and a B-spline curve was fitted to represent the contour curve of the layer. In [18], NURBS-based curves, surfaces, and solids are used to represent the anatomical modeling for RP/M fabrication. Cloud point data was first obtained from CT and MRI. The commercial medical imaging processing software (MIMICS) and computer-aided design software packages were then used for generating NURBS-based curves of the anatomical modeling.
In order to reduce modeling time and shorten overall time-to-market for Reverse Engineering (RE)-based products, research was developed to integrate the RE technology and RP/M representation by modeling point from cloud data generated by a Coordinate Measurement Machine (CMM) to support RP/M. A novel algorithm was designed to build a bridge between scattered points, and a slicing algorithm was designed to integrate RE-based data and RP/M [19]. The research has the following steps: (1) part digitization, (2) segmentation, (3) NURBS or B-Spline-based surface construction based on the segmented cloud data, and (4) slicing processing. An approach to generate a RP/M slicing file directly from image data was presented [20]. A digital camera was used to generate the cross-sectional images of a RE-based product, and the contour data of the product was computed and an algorithm was developed to generate a STL file and a RP/M slicing file from the contour data.
Some of the above research successfully adopted parametric representation such as Bezier, B-Spline and NURBS to improve the geometrical quality of RP/M models. However, a research gap exists between the parametric representation and the tool-path generation, and a smart tool-path solution is imperative to address the different geometrical characteristics of complex biomedical models in order to improve the build efficiency and geometrical accuracy of RP/M.
2.2 Tool-path generation in RP/M In RP/M, a tool-path is the trajectory of the nozzles/print head to fill the boundary and interior of each sliced
layer. The design of tool-paths will determine the geometrical quality, strength and stiffness of a model to be built, and efficiency of the RP/M process. Various types of tool-path patterns have been developed for RP/M, such as zigzag, contour, spiral and some space filling curves. A summary is shown in Table 1, and more explanations are given below.
Table 1 A summary of tool-path generation approaches in RP/M.
Works Tool-path patterns Major characteristics
Misra and Chang [5-6]
Zigzag The approach fills a layer along the X, Y or a specific direction, and it is easy for approach implementation but poor on geometrical quality.
Yang and Genesan [7-8]
Contour The approach builds a layer along its contour and offset curves following the boundary of the model. It ensures good geometrical quality but takes longer during model build compared to the zigzag tool-path generation.
Bertoldi et al. [9] Recursive Hilbert’s curve
More suitable for some regular boundaries and special geometric models. The build time will be longer than that of other conventional tool-path generation methods.
Lou et al. [10] Spiral More suitable for some special geometrical models due to improved computation.
Chiu et al. [11] Fractal curve It is only suitable for some special fractal models.
The zigzag tool-path generation is a typical method used in RP/M systems. Tool-paths will fill models line-
by-line along specific directions [5-6]. Though easy to implement, the generation has the following drawbacks: (1) if a model for RP/M is complex or has some hollow structures inside, some typical PR/M systems like SLS/Selective Laser Melting (SLM) and Fusion Deposition Modeling (FDM) have to position and reposition the print heads/nozzles frequently, leading to a poor building quality; (2) the model usually will have a warpage problem, which is caused by the fact that the tool-path will be along the same direction to build the whole model. The contour tool-path generation, which is another typical method, can improve the geometrical quality of models effectively by following the geometrical trend of the boundary contours [7-8]. Meanwhile, the method overcomes the warpage problem based on that fact that the tool-path direction is changed constantly along the contour curves of sliced layers. Nevertheless, when a boundary contour is irregular or has a hollow, island or ring structure, such as biomedical models, the computation process of the algorithms will be complicated.
For some special requirement, such as strength, stiffness and model bonding for some parts made by RP/M, space filling curves with pre-defined shapes were also been used for tool-path generation. A fractal approach was developed to generate Hilbert curve-based tool-paths for a FDM RP/M system [9]. Based on the method,

shrinkage during the RP/M fabrication process can be minimized but build time will be usually longer than that of traditional tool-path generation methods. The spiral tool-path generation was widely used in NC machining, especially for 2D pocket milling and uniform pocket cutting [10]. It can also be applied to solve the problems of zigzag tool-paths in the FDM process, but be more suitable for some special geometrical models due to complex computation. A novel method was developed to generate the tool-path of RP/M from the mathematical model of a fractal model [11]. It first generates a slab grid in each layer that consists of a number of pixels, and then checks the interior property of each pixel in the slab grid to create the slab model of the fractal model. The boundary of slab model is refined and the tool-path of RP/M can be generated from these boundaries. However, these research works could be only suitable for fractal models.
Based on the potentials of the above research in different conditions, it is expected to develop a smart and hybrid (combined) strategy to leverage the advantages of various tool-path generation strategies to be suitable for complex models in the RP/M processes. 2.3 Evaluation models and strategies in RP/M
Build time is an important factor to be considered in RP/M. Some build time analysis and prediction models
were developed. A detailed study of the laser scan mechanism in a SLS process was made in [21]. With the measurement results of different scan patterns and curing depths, formulas, which can be used to predict the total build time and the resultant curing depth for different laser powers, beam diameters and input curing depths of the SLS process, were developed. The work, however, only considered the total laser scan time and total recoating time, while more factors contributing to the total build time need to be incorporated to further improve the predictor. A build time analysis model for a FDM process was developed in [22]. The method takes account not only the deposition time, idle time, and nozzle repositioning time, but also cleaning time in the analysis model. Some parameters used to speed up the build time of FDM, including layer thickness, road width, table speed and repositioning distance and so on were identified. However, the research is specific for some deposition-based (FDM) RP/M processes.
To minimize build time spent on on-fabrication motion of tool-path generation, some heuristics algorithms were designed. The Asymmetric Traveling Salesman Problem (TSP) and Integer Programming (IP) was combined to design the time model [23]. From the model, two enhanced Genetic Algorithms (GA) were introduced to achieve the minimum time of the non-fabrication motion of RP/M. Another algorithm was developed for minimizing non-fabrication time by optimally connecting different tool-path segments [24]. The non-fabrication time problem was first formulated as a standard TSP in which precedence constraints were considered, and then some heuristic methods were applied to solve this problem. The disadvantage of the method is that it is difficult to be applied to complex biomedical models such as those including hollows and complex contours.
In RP/M, another important issue is how to evaluate the geometrical quality. Geometrical errors interaction and transferring mechanisms in the RP/M process were studied, in which a physical model was used to define the error interactions and transferring mechanisms [25-26]. Based on the geometrical approximation techniques, a geometrical model was developed to describe the relationships of geometrical errors. Then, based on a developed mathematical model, the effect of transformation of local errors was analyzed to obtain the global errors of multiple layers. The problem of the aforementioned method is that the described geometrical errors only involve profiling error, layer inclination and layer thickness variations, while other elements affecting the geometrical accuracy of RP/M process should be considered as well to further improve the mathematical analysis model. The effect of process parameters on the surface roughness of SLS was studied with the help of central rotatable composite design (CCD) of experiments [27]. Analysis of variance was made to study various surface roughness based on different build orientation, laser power, layer thickness, beam speed, and hatch spacing. A trust-region-based optimization method was employed to obtain a set of process parameters for obtaining the best surface finish. In [28], an approach to assess surface quality on textured surface in a FDM system was developed. The method developed a benchmark polygon model with different feature sizes and aspect ratios for fabrication in a FDM system with different build orientations. Based on that, the verification of surface quality with different texture dimensional parameters on textured surfaces of the model was analyzed. However, the testing results are still limited to a specific process.
Based on the above observations, innovative and adaptive strategies are desirable to develop more suitable and sensible build time mathematical module and geometrical accuracy mathematical module to evaluate various tool-path generation approaches, with a bid to further reduce the total build time and enhance geometrical accuracy during RP/M processes.
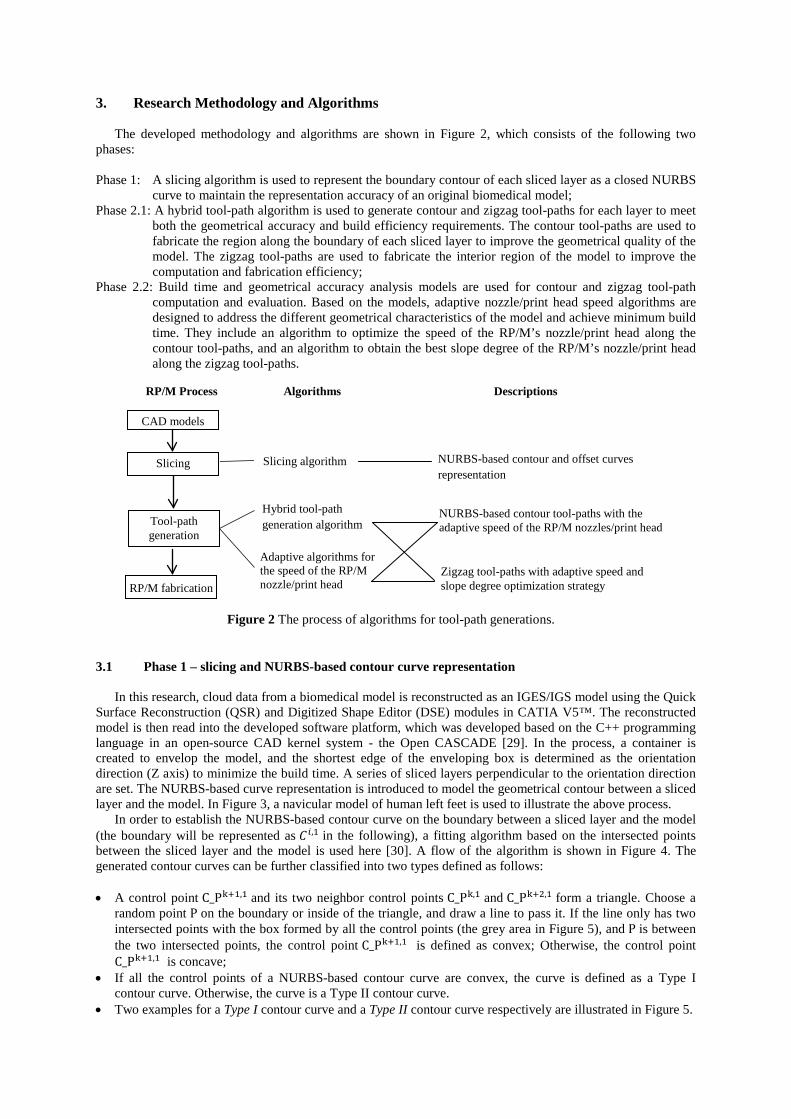
3. Research Methodology and Algorithms
The developed methodology and algorithms are shown in Figure 2, which consists of the following two phases:
Phase 1: A slicing algorithm is used to represent the boundary contour of each sliced layer as a closed NURBS
curve to maintain the representation accuracy of an original biomedical model; Phase 2.1: A hybrid tool-path algorithm is used to generate contour and zigzag tool-paths for each layer to meet
both the geometrical accuracy and build efficiency requirements. The contour tool-paths are used to fabricate the region along the boundary of each sliced layer to improve the geometrical quality of the model. The zigzag tool-paths are used to fabricate the interior region of the model to improve the computation and fabrication efficiency;
Phase 2.2: Build time and geometrical accuracy analysis models are used for contour and zigzag tool-path computation and evaluation. Based on the models, adaptive nozzle/print head speed algorithms are designed to address the different geometrical characteristics of the model and achieve minimum build time. They include an algorithm to optimize the speed of the RP/M’s nozzle/print head along the contour tool-paths, and an algorithm to obtain the best slope degree of the RP/M’s nozzle/print head along the zigzag tool-paths.
3.1 Phase 1 – slicing and NURBS-based contour curve representation
In this research, cloud data from a biomedical model is reconstructed as an IGES/IGS model using the Quick Surface Reconstruction (QSR) and Digitized Shape Editor (DSE) modules in CATIA V5™. The reconstructed model is then read into the developed software platform, which was developed based on the C++ programming language in an open-source CAD kernel system - the Open CASCADE [29]. In the process, a container is created to envelop the model, and the shortest edge of the enveloping box is determined as the orientation direction (Z axis) to minimize the build time. A series of sliced layers perpendicular to the orientation direction are set. The NURBS-based curve representation is introduced to model the geometrical contour between a sliced layer and the model. In Figure 3, a navicular model of human left feet is used to illustrate the above process.
In order to establish the NURBS-based contour curve on the boundary between a sliced layer and the model (the boundary will be represented as 𝐶𝑖,1 in the following), a fitting algorithm based on the intersected points between the sliced layer and the model is used here [30]. A flow of the algorithm is shown in Figure 4. The generated contour curves can be further classified into two types defined as follows:
• A control point C_Pk+1,1 and its two neighbor control points C_Pk,1 and C_Pk+2,1 form a triangle. Choose a
random point P on the boundary or inside of the triangle, and draw a line to pass it. If the line only has two intersected points with the box formed by all the control points (the grey area in Figure 5), and P is between the two intersected points, the control point C_Pk+1,1 is defined as convex; Otherwise, the control point C_Pk+1,1 is concave;
• If all the control points of a NURBS-based contour curve are convex, the curve is defined as a Type I contour curve. Otherwise, the curve is a Type II contour curve.
• Two examples for a Type I contour curve and a Type II contour curve respectively are illustrated in Figure 5.
CAD models
Slicing NURBS-based contour and offset curves representation
Tool-path generation
RP/M fabrication
NURBS-based contour tool-paths with the adaptive speed of the RP/M nozzles/print head
Zigzag tool-paths with adaptive speed and slope degree optimization strategy
RP/M Process Algorithms Descriptions
Slicing algorithm
Hybrid tool-path generation algorithm
Adaptive algorithms for the speed of the RP/M nozzle/print head
Figure 2 The process of algorithms for tool-path generations.

Figure 5 Examples of two different types of contour curves.
𝐶_𝑃𝑘,1
𝐶_𝑃𝑘,1
𝐶_𝑃𝑘+1,1
𝐶_𝑃𝑘+1,1
𝐶_𝑃𝑘+2,1 𝐶_𝑃𝑘+2,1
NUBBS-based contour curve - - 𝐶𝑖,1
X
X
X P
Intersection line X
X
X
X
X
X
X
P
(Convex) (Concave)
Intersected points
Calculate knot vector
Calculate chord length parameterization
Generate NURBS control points randomly
Apply an optimization algorithm (e.g., PSO) to identify the optimized control points
Apply general NURBS curve formulas to generate the
NURBS-based contour curve
Figure 4 The flow of generating a NURBS-based contour curve of a sliced layer.
(a) A navicular model for RP/M tool-path generation
(b) An enveloping box for the model and a sliced layer
(c) The cross-section segments (d) A NURBS-based contour curve generated by the slicing algorithm
Figure 3 An example to illustrate the slicing process of the developed approach.

3.2 Phase 2.1 – offset curve generation and an adaptive speed algorithm for contour tool-paths Offset curve generation for a Type I or Type II contour curve Type I contour curve
Based on the central point of the control points of the above generated contour curve, each control point for a new NURBS-based curve that offsets the contour curve (i.e., offset contour curve) is computed in the following.
𝐶_𝑃𝑘,𝑗 = 𝐷 + 𝛼 ∙ (𝐶_𝑃𝑘,1 − 𝐷) (1)
where 𝐶_𝑃𝑖,𝑗 represents an offset contour curve in the ith layer; D represents the geometric central point of the control points of the contour curve; 𝛼 is the ratio to generate the new control points of the offset contour curve (e.g., 𝛼 is set 0.9 in the following example). It is determined by the diameter of the RP/M’s nozzles/print head and the overlapping rate between two neighbor tool-path lines.
For instance, in Figure 6, a new control point 𝐶_𝑃𝑘,𝑗 of an offset contour curve is computed as follows.
𝑥(𝐶_𝑃𝑘,𝑗) = 𝑥(𝐷) + 0.9(𝑥(𝐶_𝑃𝑘,1) − 𝑥(𝐷)), and
𝑦(𝐶_𝑃𝑘,𝑗) = 𝑦(𝐷) + 0.9(𝑦(𝐶_𝑃𝑘,1) − 𝑦(𝐷)).
Figure 7 An example for processing a Type II contour curve.
𝐶_𝑃𝑘,1 (Concave)
𝐷2 .
𝐷1 .
New box 2 of control points
New box 1 of control points
A Type II contour curve
D
𝐶_𝑃𝑘,1
𝐶_𝑃𝑘,𝑗 Contour curve - 𝐶𝑖,1
𝛼 = 0.9
Offset contour curve - 𝐶𝑖,𝑗
X
Figure 6 New control points of an offset contour curve along boundary.

Type II contour curve
In the box of the control points of a Type II contour curve, each concave point will be connected with another control point in the box to separate the box as two or more control point boxes, where each control point is convex. An example is shown in Figure 7. In each box, new control points for offset contour curves are generated using the above Formula (1). Then all the control points in a control point box are then used to generate an offset contour curve.
With a series of 𝛼, the control points and the offset contour curves can be generated. Figure 8 shows the generated contour and offset tool-paths for the tibia model. Along the contour curve and its series of offset contour curves, NURBS-based contour tool-paths can be interpolated.
Adaptive speed algorithm of the RP/M’s nozzle/print head along the contour tool-paths In order to further optimize the build time, a contour or offset curve on a sliced layer is segmented according
to its geometrical characteristics (e.g., curvature). For instance, the segmented points in Figure 9(a) are used to divide the curve as bumpy and smooth segments. According to the smoothness of a segment, an adaptive algorithm is applied to slow down the speed of the RP/M’s nozzle/print head in the bumpy segments while keeping a higher speed in the smooth segments to ensure better build quality and optimized build efficiency. The flow of the segmentation and adaptive algorithm of the RP/M’s nozzle/print head is shown in Figure 10. Explanations are expanded below.
Segmented point
Bumpy segment
Smooth segments
Potential segmented
points
(a) An example of segmentation (b) Potential segmented points (c) Some removed points
Figure 9 Examples to illustrate the segmentation process for the adaptive speed algorithm.
The points are removed since they are too close to their neighbor points
jth contour or offset curve -
jiC ,
lth segment - ljiS ,,
Segmented point
Segmented point
Figure 8 Contour and offset tool-paths generated for the navicular model.

A series of discrete points with the same length along a contour or offset curve are set. The curvatures of the
points are normalized according to the following formula:
𝑁𝑜𝑟𝑚𝑎𝑙𝑖𝑧𝑎𝑡𝑖𝑜𝑛(𝑃𝑡) = 𝑃𝑐𝑢𝑟𝑣𝑎𝑡𝑢𝑟𝑒𝑡 − 𝑀𝑖𝑛𝑐𝑢𝑟𝑣𝑎𝑡𝑢𝑟𝑒
𝑀𝑎𝑥𝑐𝑢𝑟𝑣𝑎𝑡𝑢𝑟𝑒− 𝑀𝑖𝑛𝑐𝑢𝑟𝑣𝑎𝑡𝑢𝑟𝑒 (2)
where 𝑃𝑐𝑢𝑟𝑣𝑎𝑡𝑢𝑟𝑒𝑡 represents the curvature of Point t on the curve; 𝑀𝑖𝑛𝑐𝑢𝑟𝑣𝑎𝑡𝑢𝑟𝑒 and 𝑀𝑎𝑥𝑐𝑢𝑟𝑣𝑎𝑡𝑢𝑟𝑒 stand for the minimum and maximum curvatures of all the points respectively.
A threshold is set to filter out the discrete points with low curvatures, and the discrete points passing the
threshold are kept as potential segmented points (see the example in Figure 9(b)). Another threshold is set to remove those potential segmented points which distance from their neighbor potential segmented points is within this threshold (see the example in Figure 9(c)). Based on the segmentation process, the build time of the tool-paths on each contour or offset curve can be defined below.
𝑇𝑖𝑚𝑒(𝐶𝑖,𝑗) = ∑ (𝑇𝑖𝑚𝑒(𝑆𝑖,𝑗,𝑙))𝑚𝑙=1 (3)
where Time represents build time; 𝐶𝑖,𝑗 represents the jth contour or offset curve on the ith layer (a set of tool-paths will be generated along each curve); 𝑆𝑖,𝑗,𝑙 represents the lth segment in 𝐶𝑖,𝑗; 𝑚 is the total number of the segments in 𝐶𝑖,𝑗.
𝑇𝑖𝑚𝑒(𝑆𝑖,𝑗,𝑙) is further computed in the following. An adaptive speed algorithm for the RP/M’s nozzle/print
head along the tool-paths was developed. An example shown in Figure 11 is used to illustrate the concepts in the algorithm and the computation of 𝑇𝑖𝑚𝑒(𝑆𝑖,𝑗,𝑙).
The speed of the RP/M’s nozzle/print head along a contour-based tool-path can be defined below.
𝑉𝑖,𝑗,𝑙 = 𝐷𝑖𝑠𝑡𝑎𝑛𝑐𝑒(𝑆𝑖,𝑗,𝑙)𝐿𝑒𝑛𝑔𝑡ℎ(𝑆𝑖,𝑗,𝑙)
∙ 𝑉𝑚𝑎𝑥 (4)
where 𝑉𝑖,𝑗,𝑙 represents the speed of the RP/M’s nozzle/print head on the segment 𝑆𝑖,𝑗,𝑙 ; 𝐿𝑒𝑛𝑔𝑡ℎ(𝑆𝑖,𝑗,𝑙) represents the curve length of the segment; 𝐷𝑖𝑠𝑡𝑎𝑛𝑐𝑒(𝑆𝑖,𝑗,𝑙) represents the straight line length from the start point to the end point of the segment; 𝑉𝑚𝑎𝑥 stands for the maximum speed of a specific RP/M machine.
The build time spent on the segment 𝑆𝑖,𝑗,𝑙 is then computed as the following.
𝑇𝑖𝑚𝑒(𝑆𝑖,𝑗,𝑙) = 𝐿𝑒𝑛𝑔𝑡ℎ(𝑆𝑖,𝑗,𝑙)𝑉𝑖,𝑗,𝑙 = (𝐿𝑒𝑛𝑔𝑡ℎ�𝑆𝑖,𝑗,𝑙�)2
𝐷𝑖𝑠𝑡𝑎𝑛𝑐𝑒�𝑆𝑖,𝑗,𝑙�∙ 1𝑉 (5)
Apply a normalized method to the curvatures
Select potential segment points if the normalized point curvatures are
greater than a pre-set threshold value
Optimize the segments by removing some potential segments
Figure 10 The flow of the segmentation and adaptive speed algorithm for tool-paths.
Create discrete points with the same length on the curve
Apply adaptive speeds to the different segments
A contour or offset curve
Calculate curvatures of the points

In the end, the total build time of RP/M for contour and offset tool-paths based on the boundary of the ith
layer of RP/M is calculated below:
𝑇𝑖𝑚𝑒(𝐿𝑖) = ∑ 𝑇𝑖𝑚𝑒(𝐶𝑖,𝑗)𝑛𝑗=1 (6)
where Time represents build time; 𝐿𝑖 represents the ith sliced layer; 𝐶𝑖,𝑗 represents the jth contour or offset curve on the ith layer (a set of tool-paths will be generated along each curve); 𝑛 is the total number of the contour and offset curves on the ith layer. 3.3 Phase 2.2 – zigzag-based tool-path generation and adaptive algorithm for the zigzag tool-paths
When the contour or offset curves and related tool-paths have been generated, zigzag lines and tool-paths
will be then planned for the internal region of the model. The slope of the zigzag lines are chosen randomly and the overlapping rate between two neighbor zigzag lines can be decided by users (e.g., 50% step-over). In zigzag, there are two types of lines: a Type I zigzag line forms the main tool-paths, and a Type II zigzag is the connection line between two neighboring Type I lines. An example of the two type lines are shown in Figure 12.
Figure 12 Two type lines in zigzag tool-paths.
Type I line Turning point of two type lines
Type II line
jth contour offset curve - jiC ,
RP/M model
lth segment - ljiS ,,
𝐿𝑒𝑛𝑔𝑡ℎ(𝑆𝑖,𝑗,𝑙)
Figure 11 Illustration of the concepts of adaptive speed strategy based on the contour curve.
ith RP layer - 𝐿𝑖
𝐷𝑖𝑠𝑡𝑎𝑛𝑐𝑒(𝑆𝑖,𝑗,𝑙)

An adaptive algorithm was developed for the zigzag tool-path generation. In the adaptive algorithm, there are two strategies.
The first strategy is to obtain the most suitable slope of the zigzag direction for minimum length of tool-paths. In order to do obtain it, the direction of tool-paths can be rotated in a scope of [0°, 180°]. In the example of Figure 13, the slope degree can be incrementally changed, and the minimum length of tool-paths can be obtained from the interpolation curve of the results with the incremental changes. A Spline function was used for the interpolation curve. Figure 14 shows the interpolation curve built based on results of different slope degrees. From the curve, it can be obtained that at 148.3 degree the total length of the tool-paths will be minimum.
Figure 13 Incremental degrees of slopes for the minimum build time computing.
(a) 10 degree (b) 40 degree (c) 70 degree
(d) 110 degree (e) 140 degree (f)170 degree
Figure 14 The Spline interoperation curve for the best slope degree of zigzag tool-paths.

The second strategy is to control and manage the velocity of the RP/M’s nozzles/print head along zigzag
tool-paths adaptively. That is, for a Type I or Type II line, the nozzle/print head starts from a minimum speed, accelerates afterwards towards a maximum speed, and then decelerates to the minimum speed at the end of the entire line. The design is aimed to improve the efficiency of the RP/M process by accelerating or decelerating the nozzle/print head according to the geometrical characteristics. As thus, the following assumptions are made:
• The speed of the nozzle/print head from all the turning points of the two type lines is the minimum speed
(represented as 𝑉𝑚𝑖𝑛); • The maximum speed that the nozzle/print head can achieve is 𝑉𝑚𝑎𝑥 . The values of 𝑉𝑚𝑎𝑥 and 𝑉𝑚𝑖𝑛 will be set
according to the specification of a RP/M machine. Here an assumption is made to make 𝑉𝑚𝑎𝑥 twice of 𝑉𝑚𝑖𝑛; • The speed of the nozzle/print head in the zigzag tool-paths is either uniformly accelerated or deceleration
with an acceleration as 𝛽. Based on that, the adaptive strategy can be further represented as follows.
𝑉𝑚𝑎𝑥 = 2𝑉𝑚𝑖𝑛 (7)
𝑉𝑚𝑎𝑥 = 𝑉𝑚𝑖𝑛 + 𝛽𝑡 (8)
where 𝑡 is the time used to speed up the nozzle/print head from the minimum speed to the maximum speed, and 𝛽 is the acceleration.
From Formulas (12) and (13), 𝑡 can be deduced as: 𝑡 = 𝑉𝑚𝑖𝑛
𝛽 (9)
On the other hand, 𝐿𝑒𝑛𝑔𝑡ℎ = 1
2𝛽𝑡2 + 𝑉𝑚𝑖𝑛𝑡 (10)
The following will be obtained if Formulas (14) and (15) are combined:
𝐿𝑒𝑛𝑔𝑡ℎ = 3𝑉𝑚𝑖𝑛2
2𝛽 (11)
Based on the above analysis, there are three cases for the RP/M’s nozzle/print head to move on a segment:
• If the length of the segment is less than 3𝑉𝑚𝑖𝑛2
𝛽, the nozzle/print head’s speed could not reach the maximum
speed 𝑉𝑚𝑎𝑥 (shown in Figure 15(a));
• If the length of the segment is equals to 3𝑉𝑚𝑖𝑛2
𝛽, the nozzle/print head’s speed just reach the maximum speed
𝑉𝑚𝑎𝑥 in the middle of the segment (shown in Figure 15(b));
• If the length of the segment is less than 3𝑉𝑚𝑖𝑛2
𝛽, the nozzle/print head’s speed reach the maximum speed 𝑉𝑚𝑎𝑥
before the middle of the segment (shown in Figure 15(c)).
To summarize the above formulas, the time of a Type I or Type II line of zigzag will be computed as follows:
𝑇𝑖𝑚𝑒(𝐿𝐼𝑖,𝑘) =
⎩⎪⎪⎨
⎪⎪⎧
2𝑉𝑚𝑖𝑛𝛽
𝑖𝑓 𝐿𝑒𝑛𝑔𝑡ℎ(𝐿𝐼𝑖,𝑘) = 3𝑉𝑚𝑖𝑛
2
𝛽
−2𝑉𝑚𝑖𝑛𝛽
+ ��2𝑉𝑚𝑖𝑛𝛽
�2
+ 4𝐿𝑒𝑛𝑔𝑡ℎ(𝐿𝐼𝐼𝑗,𝑘)
𝛽 𝑖𝑓 0 < 𝐿𝑒𝑛𝑔𝑡ℎ(𝐿𝐼
𝑖,𝑘) < 3𝑉𝑚𝑖𝑛2
𝛽
2𝑉𝑚𝑖𝑛𝛽
+ 𝛽∗𝐿𝑒𝑛𝑔𝑡ℎ(𝐿𝐼𝐼𝑗,𝑘)−3𝑉𝑚𝑖𝑛
2
2𝛽∗𝑉𝑚𝑖𝑛 𝑖𝑓 3𝑉𝑚𝑖𝑛
2
𝛽< 𝐿𝑒𝑛𝑔𝑡ℎ(𝐿𝐼
𝑖,𝑘)
� (12)

𝑇𝑖𝑚𝑒(𝐿𝐼𝐼𝑗,𝑘) =
⎩⎪⎪⎨
⎪⎪⎧
2𝑉𝑚𝑖𝑛𝛽
𝑖𝑓 𝐿𝑒𝑛𝑔𝑡ℎ(𝐿𝐼𝐼𝑗,𝑘) = 3𝑉𝑚𝑖𝑛
2
𝛽
−2𝑉𝑚𝑖𝑛𝛽
+ ��2𝑉𝑚𝑖𝑛𝛽
�2
+ 4𝐿𝑒𝑛𝑔𝑡ℎ(𝐿𝐼𝐼𝑗,𝑘)
𝛽 𝑖𝑓 0 < 𝐿𝑒𝑛𝑔𝑡ℎ(𝐿𝐼𝐼
𝑖,𝑘) < 3𝑉𝑚𝑖𝑛2
𝛽
2𝑉𝑚𝑖𝑛𝛽
+ 𝛽∗𝐿𝑒𝑛𝑔𝑡ℎ(𝐿𝐼𝐼𝑗,𝑘)−3𝑉𝑚𝑖𝑛
2
2𝛽∗𝑉𝑚𝑖𝑛 𝑖𝑓 3𝑉𝑚𝑖𝑛
2
𝛽< 𝐿𝑒𝑛𝑔𝑡ℎ(𝐿𝐼𝐼
𝑗,𝑘)
� (13)
3.4 Geometrical accuracy analysis model
The tolerance distribution of RP/M can be defined as three scenarios: (1) negative, (2) positive, (3) a combination of both (showed in Figure 16). In this research, the negative tolerance distribution is used for geometrical accuracy analysis of RP/M models.
The geometrical accuracy of a RP/M model can be calculated below: 𝐴𝑐𝑐𝑢𝑟𝑎𝑐𝑦 (𝑅) = (𝐺𝑚𝑜𝑑𝑒𝑙 − 𝐺𝑒𝑟𝑟𝑜𝑟)/𝐺𝑚𝑜𝑑𝑒𝑙 ∗ 100% (14) where Accuracy(R) represents the geometrical accuracy; 𝐺𝑚𝑜𝑑𝑒𝑙 is the whole volume of the model; 𝐺𝑒𝑟𝑟𝑜𝑟 is
the whole volume error of the RP/M model. 𝐺𝑒𝑟𝑟𝑜𝑟 can be computed below: 𝐺𝑒𝑟𝑟𝑜𝑟 = ∑ 𝐺𝑒𝑟𝑟𝑜𝑟𝑖𝑛
𝑖=1 (15) where 𝑖 ∈ [1,𝑛] is the index of a sliced layer; 𝑛 is the total number of the layers; 𝐺𝑒𝑟𝑟𝑜𝑟𝑖 is the geometrical
error on the 𝑖P
th layer of the model. 𝐺𝑒𝑟𝑟𝑜𝑟𝑖 is from a type I error 𝐺𝑒𝑟𝑟𝑜𝑟_𝑡𝑦𝑝𝑒1
𝑖 and a type II error 𝐺𝑒𝑟𝑟𝑜𝑟_𝑡𝑦𝑝𝑒2𝑖 (showed in Figure 17). The two
errors are defined as follows:
3𝑉𝑚𝑎𝑥2
𝛽
(a) The length of a segment is less than 3𝑉𝑚𝑖𝑛2
𝛽
3𝑉𝑚𝑎𝑥2
𝛽
(b) The length of a segment equals 3𝑉𝑚𝑖𝑛2
𝛽
3𝑉𝑚𝑎𝑥2
𝛽
(c) The length of a segment is more than 3𝑉𝑚𝑖𝑛2
𝛽
Figure 15 Three cases of a segment and the speed of the RP/M’s nozzle/print head.
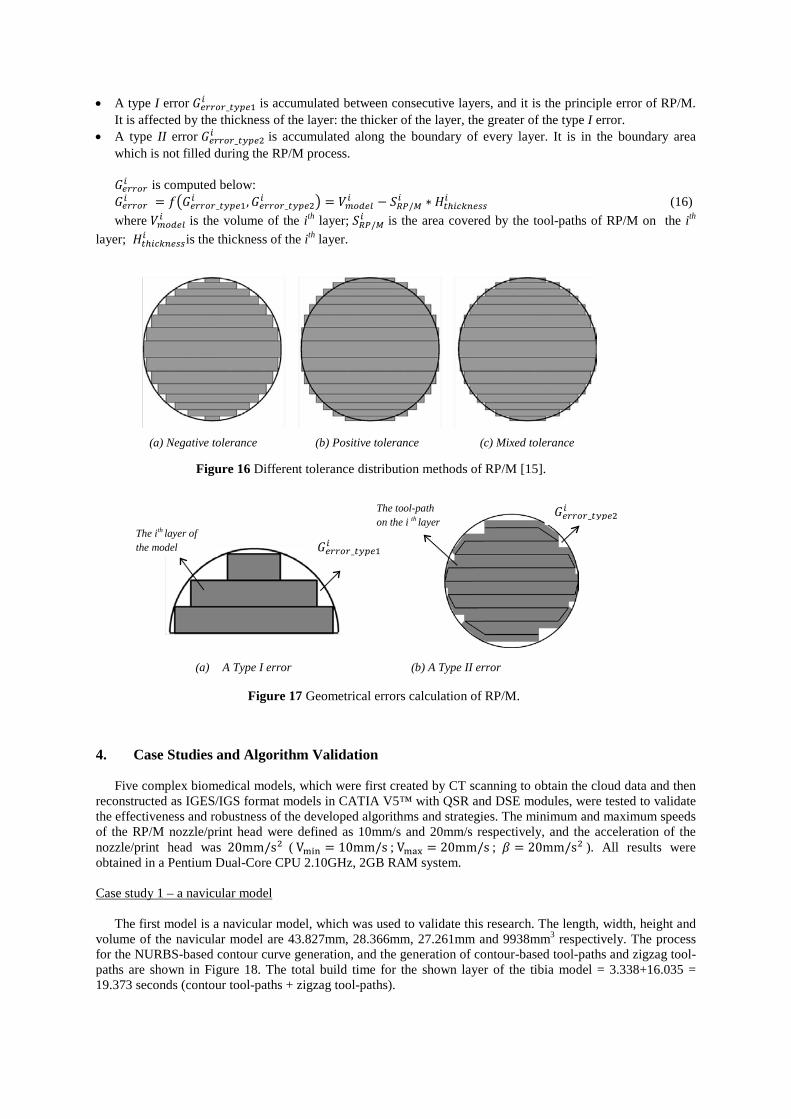
• A type I error 𝐺𝑒𝑟𝑟𝑜𝑟_𝑡𝑦𝑝𝑒1𝑖 is accumulated between consecutive layers, and it is the principle error of RP/M.
It is affected by the thickness of the layer: the thicker of the layer, the greater of the type I error. • A type II error 𝐺𝑒𝑟𝑟𝑜𝑟_𝑡𝑦𝑝𝑒2
𝑖 is accumulated along the boundary of every layer. It is in the boundary area which is not filled during the RP/M process. 𝐺𝑒𝑟𝑟𝑜𝑟𝑖 is computed below: 𝐺𝑒𝑟𝑟𝑜𝑟𝑖 = 𝑓�𝐺𝑒𝑟𝑟𝑜𝑟_𝑡𝑦𝑝𝑒1
𝑖 ,𝐺𝑒𝑟𝑟𝑜𝑟_𝑡𝑦𝑝𝑒2𝑖 � = 𝑉𝑚𝑜𝑑𝑒𝑙𝑖 − 𝑆𝑅𝑃/𝑀
𝑖 ∗ 𝐻𝑡ℎ𝑖𝑐𝑘𝑛𝑒𝑠𝑠𝑖 (16) where 𝑉𝑚𝑜𝑑𝑒𝑙𝑖 is the volume of the ith layer; 𝑆𝑅𝑃/𝑀
𝑖 is the area covered by the tool-paths of RP/M on the ith layer; 𝐻𝑡ℎ𝑖𝑐𝑘𝑛𝑒𝑠𝑠𝑖 is the thickness of the ith layer.
4. Case Studies and Algorithm Validation
Five complex biomedical models, which were first created by CT scanning to obtain the cloud data and then
reconstructed as IGES/IGS format models in CATIA V5™ with QSR and DSE modules, were tested to validate the effectiveness and robustness of the developed algorithms and strategies. The minimum and maximum speeds of the RP/M nozzle/print head were defined as 10mm/s and 20mm/s respectively, and the acceleration of the nozzle/print head was 20mm/s2 ( Vmin = 10mm/s ; Vmax = 20mm/s ; 𝛽 = 20mm/s2 ). All results were obtained in a Pentium Dual-Core CPU 2.10GHz, 2GB RAM system. Case study 1 – a navicular model
The first model is a navicular model, which was used to validate this research. The length, width, height and
volume of the navicular model are 43.827mm, 28.366mm, 27.261mm and 9938mm3 respectively. The process for the NURBS-based contour curve generation, and the generation of contour-based tool-paths and zigzag tool-paths are shown in Figure 18. The total build time for the shown layer of the tibia model = 3.338+16.035 = 19.373 seconds (contour tool-paths + zigzag tool-paths).
(a) A Type I error (b) A Type II error
Figure 17 Geometrical errors calculation of RP/M.
The ith layer of the model 𝐺𝑒𝑟𝑟𝑜𝑟_𝑡𝑦𝑝𝑒1
𝑖
The tool-path on the i th layer
𝐺𝑒𝑟𝑟𝑜𝑟_𝑡𝑦𝑝𝑒2𝑖
(a) Negative tolerance (b) Positive tolerance (c) Mixed tolerance
Figure 16 Different tolerance distribution methods of RP/M [15].

Case study 2 – an iliac model
The second model is an iliac model. The main slicing and tool-path generation is shown in Figure 19. The length, width, height and volume of the iliac model are 207.24mm, 153.47mm, 128.26mm and 282260mm3 respectively. The total build time for the shown layer of the iliac model = 13.379+39.567 = 52.946 seconds.
Case study 3 – a cuneiform model
The third biomedical model is a cuneiform model. The length, width, height and volume of the cuneiform
model are 29.620mm, 24.544mm, 23.607mm and 5897mm3 respectively. Figure 20 shows the process and geometrical results with the developed approach. The total build time for the shown layer of the talus model = 3.752+22.670 = 26.422 seconds.
(a) The iliac model (b) The slicing layer
(c) The sliced model (d) The generated tool-paths
Figure 19 Model 2 - an iliac model.
(a) The navicular model (b) The slicing layer
Figure 18 Model 1 – a navicular model.
(c) The sliced model (d) The generated tool-paths

Case study 4 – a cuboid model
The fourth model is a cuboid model. The length, width, height and volume of the human ear model are 31.823mm, 31.380mm, 31.235mm, and 10380mm3 respectively. The main slicing process and the generation of mixed tool-paths are shown in Figure 21. The total build time for the shown layer of the ear model = 5.168+32.110 = 37.278 seconds.
Case study 5 – a patella model
The fifth model is a patella model. The length, width, height and volume are 44.963mm, 39.006mm 23.972mm and 16108mm3 respectively. Figure 22 shows the main slicing process and tool-path generation process for this model. The total build time for the shown layer of the patella model = 5.222 +32.621 = 37.843 seconds.
(a) The cuboid model (b) The slicing layer
Figure 21 Model 4 - a cuboid model.
(c) The sliced model (d) The generated tool-paths
(a) The cuneiform model (b) The slicing layer
Figure 20 Model 3 - a cuneiform model.
(c) The sliced model (d) The generated tool-paths

5. Comparisons and Analysis 5.1 Build efficiency comparisons
The five biomedical models (shown in Figure 18-19, 21, 23 and 25) were also used for build efficiency comparisons. Table 2 shows the comparison results between this developed approach and typical zigzag tool-path generation approach in a uniform speed. All results were obtained in a Pentium Dual-Core CPU 2.10GHz, 2GB RAM system.
Table 2 Build time comparisons between this approach with zigzag tool-paths in uniform and adaptive speeds.
Build time Models
This approach (s)
Zigzag in uniform speed (s)
Reduced build time (%)
1 19.373 25.767 33.005 2 52.946 68.567 29.504 3 26.422 33.476 26.697 4 37.278 46.751 25.412 5 37.843 50.365 33.089
From the above data, it can be observed that the build time of this developed approach can be reduced about
30% compared to that of the zigzag tool-path generation approach in uniform speed. Also, the geometrical accuracy of this developed hybrid and adaptive tool-paths algorithm will be better than that of the zigzag tool-path generation approaches. The geometrical accuracy comparisons are explained below.
5.2 Geometrical accuracy comparisons
Figure 23 shows the comparisons of geometrical accuracy between this developed approach and typical zigzag tool-path generation approaches. The series of comparisons are based on an incremental 0.1mm of the diameter of RP/M nozzle/print head each time from 0mm until 1.9mm. All results were obtained in a Pentium Dual-Core CPU 2.10GHz, 2GB RAM system.
(a) The patella model (b) The slicing layer
Figure 22 Model 5 - a patella model.
(c) The sliced model (d) The generated tool-paths

(a) Model 1 (b) Model 2
(c) Model 3 (d) Model 4
(e) Model 5
Figure 23 Geometrical accuracy comparisons.
Compared with the typical zigzag tool-path generation approach, the developed adaptive tool-path generation approach can achieve much better geometrical accuracy of RP/M. For instance, for the model one, the geometrical accuracy is 97.986% by this developed approach with the diameter of RP/M’s nozzle/print head set as 0.3 mm, while the geometrical accuracy is only 94.884% of the typical zigzag tool-path generation approaches. With the increased diameter of the nozzle/print head, the difference gap between the two approaches is further increased. Therefore, this approach can achieve an overall improvement and a better balance of build efficiency and geometrical accuracy.
84
86
88
90
92
94
96
98
100
0 0.1 0.3 0.5 0.7 0.9 1.1 1.3 1.5 1.7 1.9 88
90
92
94
96
98
100
0 0.1 0.3 0.5 0.7 0.9 1.1 1.3 1.5 1.7 1.9
84
86
88
90
92
94
96
98
100
0 0.1 0.3 0.5 0.7 0.9 1.1 1.3 1.5 1.7 1.9
86
88
90
92
94
96
98
100
0 0.1 0.3 0.5 0.7 0.9 1.1 1.3 1.5 1.7 1.9
88
90
92
94
96
98
100
0 0.1 0.3 0.5 0.7 0.9 1.1 1.3 1.5 1.7 1.9
Diameter of Nozzles/Print heads (mm)
Diameter of Nozzles/Print heads (mm)
Zigzag tool-paths
Geo
met
rical
Acc
urac
y (%
)
This developed approach
Zigzag tool-paths
Geo
met
rical
Acc
urac
y (%
)
This developed approach
Geo
met
rical
Acc
urac
y (%
)
Diameter of Nozzles/Print heads (mm)
Diameter of Nozzles/Print heads (mm)
Zigzag tool-paths
This developed approach
Zigzag tool-paths
This developed approach
Geo
met
rical
Acc
urac
y (%
)
Geo
met
rical
Acc
urac
y (%
)
Diameter of Nozzles/Print heads (mm)
This developed approach
Zigzag tool-paths

6. Conclusions In this paper, adaptive tool-path generation algorithms and strategies have been presented to improve
geometrical accuracy and to reduce build time for biomedical model fabrication in RP/M. A series of tool-path generation optimization strategies in RP/M process planning were developed, including a slicing algorithm and NURBS-based representation, the hybrid contour and zigzag tool-path generation, adaptive speed control strategies, and the build time and geometrical accuracy analysis modules for the RP/M systems. In a summary, the features and contributions of the research are as follows:
• In order to maintain the geometrical accuracy of original biomedical models during the RP/M process, a
NURBS to represent-based slicing algorithm was designed. This algorithm can enable to establish a good original data source and ensure high information fidelity for further RP/M tool-path generation;
• Another challenging issue in RP/M is how to achieve a good balance between build efficiency and geometrical quality of models. The developed hybrid tool-path generation algorithms can effectively trade off the two objectives for an overall optimization. In meantime, the speed algorithms of contour and zigzag tool-paths for RP/M’s nozzle/print head can be used to further minimize build time and adaptive to various biomedical models according to their geometrical characteristics;
• In RP/M, it is essential to evaluate the build time and geometrical accuracy of a built model. In order to do so, mathematical models to analyze the build time and the geometrical accuracy of models with different parameters were designed. With the models, an effective guideline for parameter setting in a RP/M system can be introduced for algorithm evaluation and optimization, in a bid to reduce build time and improve geometrical accuracy;
• Five biomedical models with different complex shapes and geometries were used to verify and demonstrate that the developed approach has achieved significantly improved performance in terms of algorithm effectiveness, robustness and generality. The research provides a promising solution to be applicable to practical cases in biomedical industries.
Research is being undertaken in adaptive thickness adjustment to further improve the build efficiency and
geometrical accuracy of complex biomedical models in the RP/M processes. Relevant research is expected to be reported in future.
References [1] J.P. Kruth, G. Levy, F. Klocke, T.H.C. Childs, Consolidation phenomena in laser and powder-bed based layered
manufacturing. Annals of CIRP 56 (2007) 730-759. [2] D.L. Bourell, M.C. Leu, D.W. Rosen, Roadmap for additive manufacturing: Identifying the Future of Freeform
Processing. The University of Texas at Austion, Austin, Texas, 2009. [3] W. Sun, P. Lal, Recent development on computer aided tissue engineering – a review. Computer Methods and Programs
in Biomedicine 67 (2002) 85-103. [4] A. Marsan, D. Dutta, A survey of process planning techniques for layered manufacturing. Proceedings of the 1997
ASME Design Automation Conference, Sacramento, 1997. [5] D. Misra, V. Sundararajan, P.K. Wright, Zig-zag tool path generation for sculptured surface finishing. Dimacs Series in
Discrete Mathematics and Theoretical Computer Science 67 (2005) 265-280. [6] W.R. Chang, CAD/CAM for the selective laser sintering process. MS Thesis. University of Texas, Austin, USA, 1997. [7] Y. Yang, H.T. Loh, F.Y.H. Fuh, Y.G. Wang, Equidistant path generation for improving scanning efficiency in layered
manufacturing. Rapid Prototyping Journal 8(1) (2002) 30-37. [8] M. Genesan, G. Fadel, Hollowing rapid prototyping parts using offsetting techniques. Proceedings of the 5th
International conference on Rapid Prototyping. University of Dayton, (1994) 241-251 [9] M. Bertoldi, M.A. Yardimci, C.M. Pistor, S.I. Guceri, Domain decomposition and space filling curves in toolpath
planning and generation. Proceedings of the 1998 Solid Freeform Fabrication Symposium. The University of Texas at Austin, (1998) 267–274.
[10] M. Luo, D.H. Zhang, B.H. Wu, Y. Zhang, Optimisation of spiral tool path for five-axis milling of freeform surface blade. International Journal of Machining and Machinability of Materials 8(3-4) (2010) 266 – 282.
[11] W.K. Chiu, Y.C. Yeung, K.M. Yu, Toolpath generation for layer manufacturing of fractal objects. Rapid Prototyping Journal 12(4) (2006) 214 – 221.
[12] X. Chen, C. Wang, X. Ye, Y. Xiao, S. Huang, Direct slicing from PowerSHAPE models for rapid prototyping. International Journal of Advanced Manufacturing Technology 17 (2001) 543-547.
[13] Y. Shi, X. Chen, D. Cai, S. Huang, Application software system based on direct slicing for rapid prototyping. International Journal of Product Research 42 (2004) 2227-2242.
[14] W. Cao, Y. Miyamoto, Direct slicing from AutoCAD solid models for rapid prototyping. International Journal of

Advanced Manufacturing Technology 21 (2003) 739-742. [15] W. Ma, W.C. But, P. He, NURBS-based adaptive slicing for efficient rapid prototyping. Computer-Aided Design 36
(2004) 1309-1325. [16] B. Starly, A. Lau, W. Sun, W. Lau, T. Bradbury, Direct slicing of STEP based NURBS models for layered
manufacturing. Computer-Aided Design 37 (2005) 387-397. [17] F. Javidrad, A.R. Pourmoayed, Contour curve reconstruction from cloud data for rapid prototyping. Robotics and
Computer-Integrated Manufacturing 27(2) (2011) 397-404. [18] T. Jiang, F. Lin, S.I. Kaltman and W. Sun, Anatomical modeling and rapid prototyping assisted surgical reconstruction.
Proceedings of the Eleventh Solid Freeform Fabrication Symposium, University of Texas Austin 555-564. [19] Z.W. Yin, Direct integration of reverse engineering and rapid prototyping based on the properties of NURBS or B-
spline. Precision Engineering 28(3) (2004) 293-301. [20] Z. Liu, L. Wang, B. Lu, Integrating cross-sectional imaging based reverse engineering with rapid prototyping.
Computers In Industry 57 (2006) 131-140. [21] C.C. Chen, P.A. Sullivan, Predicting total build-time and the resultant cure depth of the 3D stereolithography process.
Rapid Prototyping Journal 2(4) (1996) 27 – 40. [22] W. Han, M.A. Jafari, K. Seyed, Process speeding up via deposition planning in fused deposition-based layered
manufacturing processes. Rapid Prototyping Journal 9(4) (2003) 212 – 218. [23] P.K. Wah, K.G. Murty, A. Joneja, L.C. Chiu, Toolpath optimization in layered manufacturing. IIE TRANSACTIONS
34(4) (2002) 335-347. [24] K. Castelino, R. D’Souza, P.K. Wright, Toolpath optimization for minimizing airtime during machining. Journal of
Manufacturing Systems 22(3) 1999 173-180. [25] W. Liu, L. Li, A.K. Kochhar, A method for assessing geometrical errors in layered manufacturing. Part 1: Error
interaction and transfer mechanisms. The International Journal of Advanced Manufacturing Technology 14(9) (1998) 637 – 643.
[26] W. Liu, L. Li, A.K. Kochhar, A method for assessing geometrical errors in layered manufacturing. Part 2: Mechanisms modeling and numerical evaluation. The International Journal of Advanced Manufacturing Technology 14(9) 1998 644 – 650.
[27] P.B. Bacchewar, S.K. Singhai, P.M. Pandey, Statistical modelling and optimization of surface roughness in the selective laser sintering process. Proceedings of the Institution of Mechanical Engineers, Part B: Journal of Engineering Manufacture 221(1) (2007) 35-52.
[28] A. Armillotta, Assessment of surface quality on textured FDM prototypes. Rapid Prototyping Journal 12(1) (2006): 35-41.
[29] Open CASCADE. Information on http://www.opencascade.org/. Last access on 15th March 2011. [30] Y.L. Ma, W.T. Hewitt, Point inversion and projection for NURBS curve and surface: control polygon approach.
Computer Aided Geometrical Design 20(2) (2003) 79-99.