Embed Size (px)
Citation preview

2021 Whatcom County Annual Report on Homelessness
1 | P a g e
A HOME FOR EVERYONE
Whatcom County Coalition to End Homelessness
2021 Annual Report
Part A: Point-in-Time Census of Homeless Residents
Part B: Public School Students and their Families
July 2021
Sponsored by:
Whatcom County Health Department
City of Bellingham
Whatcom County Coalition to End Homelessness
Whatcom Homeless Service Center at Opportunity Council

2021 Whatcom County Annual Report on Homelessness
2 | P a g e
For more information about Whatcom County’s Homeless Point-in-Time Count, this annual report, or our
community’s 10-Year Plan to End Homelessness, please contact:
Barbara Johnson-Vinna, Housing Specialist, Whatcom County Health Department
(360) 778-6046
Or
Chris D’Onofrio, Housing Specialist, Whatcom County Health Department
(360) 778-6049
Or
Teri Bryant, Director, Whatcom Homeless Service Center
(360) 255-2091

2021 Whatcom County Annual Report on Homelessness
3 | P a g e
Contents Disclaimer ...................................................................................................................................................................4
Introduction ................................................................................................................................................................4
Purpose of this report ............................................................................................................................................4
Criteria for counting homelessness ........................................................................................................................4
Limitations for counting homelessness ..................................................................................................................5
Understanding homelessness data ........................................................................................................................5
The homeless housing system in Whatcom County ...............................................................................................5
Part A: Point in Time Data & Analysis .........................................................................................................................7
Homeless individuals and households experiencing homelessness in Whatcom County .....................................7
Unsheltered and Sheltered Homeless Persons and Households ...........................................................................8
Number of homeless families with children ....................................................................................................... 10
Household Size and Composition ........................................................................................................................ 11
Sleeping location of single parent households .................................................................................................... 12
Sleeping location of two parent households ....................................................................................................... 12
Sleeping location of adult households with more two or more people ............................................................. 13
Sleeping location of unaccompanied adults (singles) ......................................................................................... 13
Sheltered and unsheltered households .............................................................................................................. 14
Age and gender ................................................................................................................................................... 16
Disabling Conditions ............................................................................................................................................ 16
Race and Ethnicity ............................................................................................................................................... 17
Location of most recent permanent residence ................................................................................................... 18
Homeless Veterans .............................................................................................................................................. 19
Part B: Homelessness of Public-School Students in Washington State and Whatcom County .............................. 20
Differences between homeless point-in-time count and homeless students in school data ............................. 21
Homelessness among students at public schools in Whatcom County .............................................................. 21
Public school homeless statistics by district ........................................................................................................ 21
Homelessness and academic achievement ......................................................................................................... 24
Appendix A: Sheltered and Unsheltered Survey Forms .......................................................................................... 25
Sheltered Form .................................................................................................................................................... 25
Unsheltered Form ................................................................................................................................................ 27

2021 Whatcom County Annual Report on Homelessness
4 | P a g e
Disclaimer:
The COVID-19 pandemic has been enormously disruptive in 2020 and 2021. COVID-19 impacted how people
experience homelessness and also significantly changed the way that the Point in Time (PIT) Count was
conducted. To decrease the risk of disease transmission for people collecting and responding to surveys, the
U.S. Department of Housing and Urban Development (HUD) issued new guidance for the 2021 count. That
guidance called for:
• Reducing face-to-face interaction with clients
• Not requiring a count of unsheltered households
• Limiting questions only to those necessary to perform an accurate count
• Increasing timespan for surveys to be conducted from a few days (previously) to several weeks
• Enlisting professional staff to complete surveys and minimize use of volunteers
The Washington State Department of Commerce, as the lead agency for our state, required a statewide count
only of individuals experiencing homelessness in emergency shelters and transitional housing. However, the
Whatcom Homeless Service Center and the Whatcom County Health Department chose to also conduct a count
of individuals experiencing unsheltered homelessness in Bellingham. This effort relied heavily on the
professional services of the Homeless Outreach Team (HOT), Coordinated Entry system administrators, and
other homeless service providers to safely collect information about people experiencing homelessness in our
community- both in shelters and outdoors. Their commendable efforts greatly improved the value of this
report’s information. However, because the methods used in 2021 were significantly different from prior years,
the ability to compare changes over time is limited. The charts in this report use dashed lines and alternate
colors to highlight this discontinuity. Further discussion is available in this report’s appendix.
Introduction Purpose of this report
The annual Point in Time Count report provides a deeper understanding of residents experiencing homelessness
in Whatcom County. Efforts to resolve homelessness for Whatcom County residents rely on accurate
information that provides a basis for an informed community response. The goal of this report is to educate and
empower service providers working with populations of people experiencing homelessness, local policy makers,
funding partners, and the concerned community members who seek to engage this challenge in meaningful
ways. The changes made in response to the COVID-19 pandemic limit our ability to measure this year’s numbers
against previous years, and graphs have utilized dashed lines to remind readers of the unique limitations of this
year’s data. Still, the systematic collection of information about homelessness makes it possible to observe
certain changes over time and to compare and analyze our county’s progress against the backdrop of regional
and national trends.
Criteria for counting homelessness
The Point in Time surveys provide information only about people who were experiencing homelessness in Whatcom
County overnight on January 28, 2021. Surveying took place over the following two weeks to allow a small number
of surveyors to interact with more individuals in dispersed locations. The surveys reflect only households who met a
specific definition of homelessness, which excludes people who were:
• couch surfing, or otherwise staying with friends or family and without a home of their own,
• formerly homeless households who resided in supportive, subsidized housing, or
• individuals who were homeless at their time of entry into prisons, jails, hospitals, or other institutions

2021 Whatcom County Annual Report on Homelessness
5 | P a g e
These surveys provide information only about households who were:
• residing in emergency shelters,
• transitional housing programs,
• subsidized motel rooms, or
• in unconventional sleeping places, such as tents, sidewalks, vehicles, or other places not intended to be used
for human habitation
Furthermore, the surveys capture information only for people who reported that they were homeless, on the
specific night of January 28, 2021, and in accordance with the above definitions. These criteria were established by
the United States Department of Housing and Urban Development, and they are applied consistently across
jurisdictions to allow for meaningful comparisons.
Limitations for counting homelessness National research indicates that Point in Time Counts underestimate the number of those who are experiencing
homelessness because:
• Participation is voluntary, and some choose not to be counted. This is especially true of immigrants,
even those with legal status, who fear reprisal as a result of participation.
• A point in time is just a “snapshot” and does not capture all those who cycle in and out of homelessness
over the year. Furthermore, “snapshots” will miss seasonal fluctuations that occur in our communities.
• It is difficult to find where all unsheltered people reside, and impossible to know all the places that
might provide unconventional shelter (i.e. tents, sheds, abandoned cars). For 2021, because of COVID-
19, traditional gathering places like libraries and food banks were unavailable as surveying locations.
Understanding homelessness data
The data presented in this report was provided to surveyors by individuals experiencing homelessness in
Whatcom County. Individuals responded verbally to questions and, in some cases, on behalf of household
members who were not present and/or not adults. It should be understood that the sensitive and personal
nature of some questions, as well as different interpretations of terms like disability, domestic violence, shelter,
or length of time homeless means that answers reflect the views of respondents, and do not necessarily meet
precise or standard definitions. Some participants chose to answer only some of the questions. The Point in
Time Count provides data that can be used for estimates, but it is not a comprehensive study of all people
experiencing homelessness.
The Point in Time count is only one of several sources of information about people experiencing homelessness.
Other sources include the Washington State Office of the Superintendent for Public Instruction, the local
Coordinated Entry database, records of the Washington State Department of Social and Health Services, and the
Homeless Management Information System.
The homeless housing system in Whatcom County This report is not intended to provide an overview of the many efforts underway to prevent and end
homelessness for Whatcom County households. Still, it’s important to recognize that many individuals and
households are no longer experiencing homelessness after being successfuly housed through community
programs. Specifically, there were 1,347 households (2,267 unique individuals) who received some form of
housing support through Whatcom County’s coordinated entry housing providers in 2020. Nearly half of those
households (637) benefited from new program openings in 2020, while the rest received services that continued

2021 Whatcom County Annual Report on Homelessness
6 | P a g e
from prior years. Of the 1,347 households, 377 received assistance to prevent eviction, and 654 of them (a total
of more than a thousand individuals) benefited from a stay at an emergency shelter, either with a locally-funded
stay at a motel or at one of several emergency shelters for specific vulnerable populations. Information from
these newly-housed individuals and families was not collected for this report. Another group not included is the
population of people who used the low-barrier shelter at Base Camp before data sharing began in November
2020.
Without the hard work of partner agencies and the supportive resources from local, state, and federal funders,
the 1,347 households who were served in 2020 may also have been counted in January 2021 when the surveys
were done. Partner agencies that participate in the local coordinated housing system include:
• Bellingham Housing Authority,
• Catholic Community Services,
• Domestic Violence and Sexual Assault Services of Whatcom County (DVSAS),
• Interfaith Coalition,
• Lake Whatcom Residential and Treatment Center,
• Lighthouse Mission Ministries,
• Lydia Place,
• Mercy Housing Northwest,
• Northwest Youth Services,
• Opportunity Council,
• Pioneer Human Services,
• Sun Community Services, and
• YWCA Bellingham
The effort and commitment of additional independent housing providers further reduces homelessness in
Whatcom County and adds much-needed capacity to a system in which the demand for housing services
exceeds supply. Agencies like HomesNOW, Engedi Refuge, New Way Ministries, Lummi Stepping Stones, Lummi
Victims of Crime, multiple clean and sober homes, and others deserve recognition for their work to end
homelessness as well.
A more in-depth overview of this system is available in the 2019 A Home For Everyone: Strategic Plan to End
Homelessness in Whatcom County, which can be found online at
https://www.whatcomcounty.us/DocumentCenter/View/44575/Strategic-Plan-to-End-Homelessness-in-
Whatcom-County-2019.

2021 Whatcom County Annual Report on Homelessness
7 | P a g e
Part A: Point in Time Data & Analysis
Homeless individuals and households experiencing homelessness in Whatcom County
Of those surveyed, a total of 859 individuals from 625 different households were found to be experiencing
homelessness in Whatcom County on January 28, 2021. For the purpose of this homeless count, households were
divided into two categories: sheltered and unsheltered. Households could be either individuals or families of
different configurations. Sheltered homeless individuals stayed in an emergency shelter or transitional housing
facility on the night before the count. Unsheltered individuals spent the night of January 28, 2021 outdoors, in cars,
or other places not meant for habitation.
The year-over-year change between 2020 and 2021 was a 22% increase in homeless persons counted (from 707
homeless persons in 2020 to 859 in 2021), and the total number of homeless individuals was the highest total
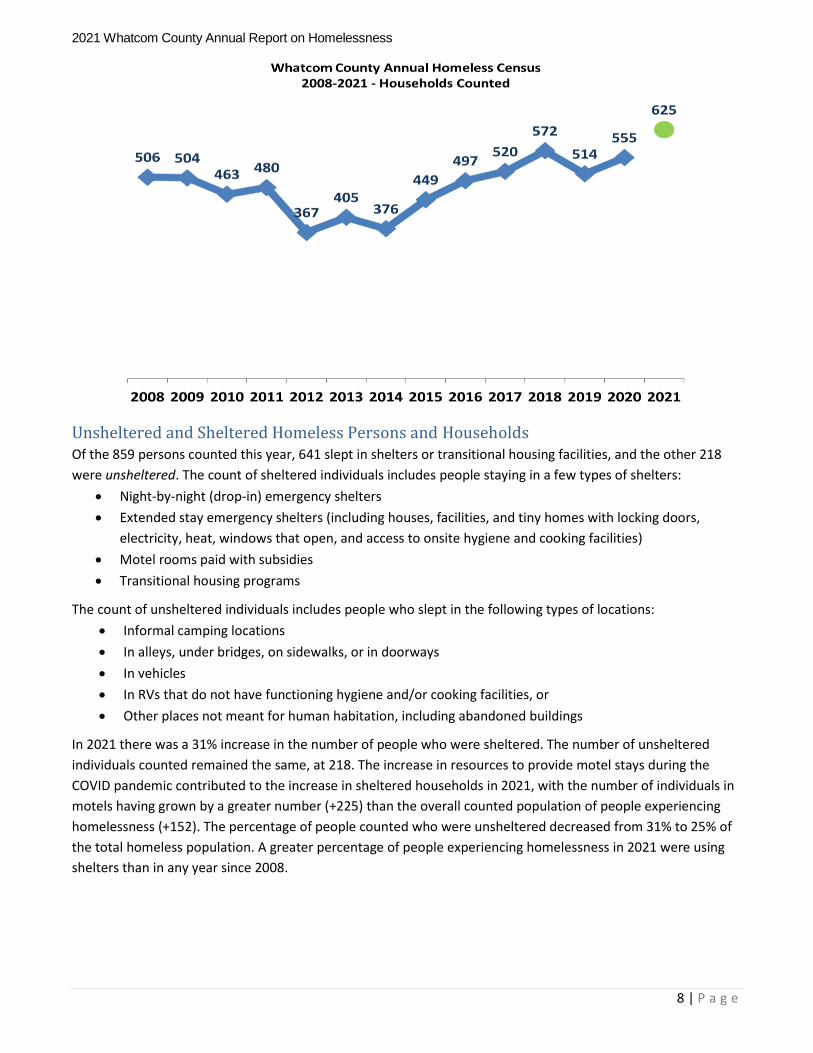
number since counting began in 2008. The year-over-year change in number of homeless households increased
by 13% between 2020 and 2021 (from 555 households to 625 households), and also is the highest number
reported since counting began in 2008.
2021 Whatcom County Annual Report on Homelessness
8 | P a g e
Unsheltered and Sheltered Homeless Persons and Households Of the 859 persons counted this year, 641 slept in shelters or transitional housing facilities, and the other 218
were unsheltered. The count of sheltered individuals includes people staying in a few types of shelters:
• Night-by-night (drop-in) emergency shelters
• Extended stay emergency shelters (including houses, facilities, and tiny homes with locking doors,
electricity, heat, windows that open, and access to onsite hygiene and cooking facilities)
• Motel rooms paid with subsidies
• Transitional housing programs
The count of unsheltered individuals includes people who slept in the following types of locations:
• Informal camping locations
• In alleys, under bridges, on sidewalks, or in doorways
• In vehicles
• In RVs that do not have functioning hygiene and/or cooking facilities, or
• Other places not meant for human habitation, including abandoned buildings
In 2021 there was a 31% increase in the number of people who were sheltered. The number of unsheltered
individuals counted remained the same, at 218. The increase in resources to provide motel stays during the
COVID pandemic contributed to the increase in sheltered households in 2021, with the number of individuals in
motels having grown by a greater number (+225) than the overall counted population of people experiencing
homelessness (+152). The percentage of people counted who were unsheltered decreased from 31% to 25% of
the total homeless population. A greater percentage of people experiencing homelessness in 2021 were using
shelters than in any year since 2008.

2021 Whatcom County Annual Report on Homelessness
9 | P a g e
The combined number of sheltered and unsheltered individuals experiencing homelessness, as counted for this
report, increased by 152 (more than 20%) from the 2020 total. However, the rates of growth for sheltered and
unsheltered homelessness are quite different. In the time since the count was conducted in 2020, the number of
individuals in shelters (including both emergency shelters and transitional housing) increased by more than 30%,
but the number experiencing unsheltered homelessness did not grow at all.
The uneven growth among these two categories of homeless households can largely be explained by the vastly
expanded access to motel rooms for families with children. The number of households in motels expanded from
eight in 2020 to 88 in 2021 (more detail about this provided in following sections). The relationship between
shelter availability and unsheltered homelessness continues to be a complex interaction; however, it reflects the
diverse and overlapping needs and desires of the many different people experiencing homelessness. On the
night of the count, January 28, more than 200 individuals slept outside in Whatcom County despite the
consistent availability of beds at the Base Camp low-barrier night-by-night shelter in downtown Bellingham
(there were 42 vacant beds on January 28).

2021 Whatcom County Annual Report on Homelessness
10 | P a g e
The number of individuals counted in 2021 increased by more than 20% from the previous year, and the number
of households rose by 13%. This indicates that homelessness, as defined in this report, increased by a greater
factor for multi-person households. This was a break from the previous year, when in 2020 there was only
minimal growth in number of individuals (1%), but significant growth in the number of households (8%).
Number of homeless families with children The largest contributing factor to the increase in the counted number of both households and individuals was
the number of families with children in emergency shelter. The number of families with children counted in
motels increased dramatically in 2021 following a vast expansion of the local motel program. From 2020 to
2021, the number of counted homeless families increased by 50% (from 64 to 96). Family composition is
reported through surveys and does not account for complex custody arrangements.
The expansion that made motel rooms available as emergency shelter for families with children was a response
to new challenges and resources that came about as a result of the COVID pandemic. With additional resources
that allowed housing agencies to place families into motels, those families, who may have been experiencing
housing instability for quite some time, officially met the criteria to be counted for the purposes of this report.
They also became much easier to locate and count, because they were formally engaged with the coordinated
housing system of Whatcom County. Ironically, the increased funding led to new placement options which
contributed to more families reported to be experiencing homelessness this year.
Although detailed explanations about the increased need for family shelter(s) are beyond the scope of this
report, anecdotal evidence suggests that families felt unsafe in doubled-up living arrangements due to increased
exposure to COVID-19, additional stress and financial hardship brought about by reduced economic activity, and
additional challenges associated with isolation and separation from support systems.
Sleeping Location of Households Counted in 2021

2021 Whatcom County Annual Report on Homelessness
11 | P a g e
Household Size and Composition Of the 625 homeless households counted, 513 (82%) were unaccompanied persons. There were 16 (3%) family
households with more than one person but without children. Families with children accounted for 96
households (15% of total households). Of the households with children, 65 were single-parent families and 31
families had both parents present. In addition, four households comprised of unaccompanied minors were
counted in 2021. Compared to last year, there was a 50% increase in households with children and an 8%
increase in households without children.
Household Type Number of Households Percent of Households
Adult Families without Children 16 3%
Single Parent with Children 65 10%
Two Parents with Children 31 5%
Unaccompanied Individuals 513 82%
Total 625 100%
Although the number of households with children increased most significantly in this year’s report, the
overwhelming majority of households continue to be comprised of single, unaccompanied adults. These one-
person households have historically been shown to be more likely to experience unsheltered and chronic
homelessness. Although the change in number of adult-only households counted this year is a smaller increase
than that for families with children, both the number of single adult households and multi-person adult
households without children grew as well.

2021 Whatcom County Annual Report on Homelessness
12 | P a g e
Sleeping location of single parent households
Sleeping location of two parent households

2021 Whatcom County Annual Report on Homelessness
13 | P a g e
Sleeping location of adult households with more two or more people
Sleeping location of unaccompanied adults (singles)

2021 Whatcom County Annual Report on Homelessness
14 | P a g e
Sheltered and unsheltered households
The two broad categories for sleeping locations are either sheltered or unsheltered. Sheltered locations are
further divided into transitional housing and emergency shelter programs (sometimes collectively referred to as
“interim housing). Although there are differences among transitional housing programs, they tend to resemble a
stable, predictable home for the medium-term, and emergency shelter stays usually are shorter, aiming to host
individuals or families for up to 90 days. There are many types of emergency shelters, some with drop-in
availability, some for specific populations (i.e. minors, survivors of domestic violence, etc.), some that use
congregate settings, and others that provide private bedrooms in more traditional residential settings. People
residing in either emergency shelters or transitional housing facilities are considered to continue experiencing
homeless because they do not benefit from the protections of a legally-binding lease for their home.
In 2021, 69% of all surveyed homeless households had spent the Point in Time Count night in a shelter or
transitional housing facility and the other 31% spent the night unsheltered.
• Of the 69% in shelters or transitional housing, more than four out of five (82%) were in an emergency
shelter, including subsidized motels, and the rest were in transitional housing (18%).
• Of the 31% of homeless households who were unsheltered, about three out of five (59%) were staying
outdoors, one in four (25%) slept in vehicles, and the remaining 16% were in a RV or boat that lacked
access to amenities such as water or electricity. One person reported having slept in an abandoned
building.
When compared to unsheltered counterparts, people sleeping in interim housing facilities (transitional housing
or emergency shelters) have more access to opportunities that can lead to long-term health improvement and
housing stability. Resources in shelters include hygiene facilities, food and drinking water, connections to
medical services, and often a place to safely store belongings. Still, the 2021 Point in Time count shows that
about a third of unaccompanied adults were experiencing unsheltered homelessness despite available beds in
shelters. Although it’s unlikely that shelters will ever meet all the needs of every individual, the 2021 count

2021 Whatcom County Annual Report on Homelessness
15 | P a g e
underscores that there is still progress to be made towards understanding the needs of those who prefer
unsheltered sleeping to available shelter beds.
The following graph shows the type of location where unsheltered survey participants reported having slept the
night of January 28.

2021 Whatcom County Annual Report on Homelessness
16 | P a g e
Age and gender Homeless persons were divided between persons who identified as males (53%), females (42%), and gender
nonconforming (less than 1%). Another five percent of respondents chose not to disclose or identify a gender.
There was a wide range of ages, spanning from infants less than a year old to seniors as old as 87. The median
age of all homeless persons, including children, was 36 years. Children under 10 years old accounted for 14% of
all identified individuals, and another 8% were between 10 and 17 years old. Together, children under the age of
18 accounted for more than one in five of all individuals counted.
Unaccompanied individuals tend to be older than members of multi-person households. The median age of
unaccompanied homeless persons was 48 years. Four unaccompanied minors (ages 16 to 17) were staying in an
emergency shelter for youth. Almost half (45%) of unaccompanied homeless persons were 35-54 years of age.
Unaccompanied persons aged 55-64 remain consistent from the 2020 count at 23%.
Disabling Conditions As a safety precaution during the COVID-19 pandemic, unsheltered respondents were asked fewer questions in 2021
and were not asked about the disability conditions detailed in this section. All who responded to this question were
individuals who stayed in emergency shelters or transitional housing. They were asked to indicate if they, or
members of their household, have any of the following five disabilities1:
1 The five categories of disabilities, as well as the specific wording to describe the categories, were determined by the US Department of Housing and Urban Development.

2021 Whatcom County Annual Report on Homelessness
17 | P a g e
• Mental Health (Substantial and Long Term)
• Chronic Health Condition (Permanently Disabling)
• Developmental Disability
• Physical Disability (Permanent)
• Chronic Substance Use
The chart below includes only persons who were staying in emergency shelters or transitional housing operated by
local providers including Domestic Violence and Sexual Assault Services (DVSAS), YWCA, Northwest Youth Services,
Opportunity Council, Lydia Place, Sun Community Services, Lighthouse Mission Ministries (not including the Base
Camp emergency shelter), HomesNOW!, Interfaith Coalition, Lummi Victims of Crime, and Engedi Refuge. Disability
information is available for only 473 of the 859 persons counted this year.
The disabling conditions asked about and reported for the 473 surveyed individuals were mental illness (33%),
chronic health conditions (27%), developmental disability (20%), permanent physical disabilities (17%), and chronic
substance use (10%). The data on disabling conditions is based on self-report, and it is acknowledged that negative
stigma may contribute to under-reporting of personal disabilities.
Disabilities are common among individuals experiencing homelessness, with many experiencing more than one
disability contributing to their housing insecurity. Disabilities are not unique to this population, however.
According to the CDC, about one in four adults in the United States has a disability. Based on the overall
prevalence of disabilities, and because the overwhelming majority of people with disabilities are not
experiencing homelessness, we can infer that although disabilities can contribute to the challenges of
homelessness and housing instability, the mere presence of a disability does not typically cause homelessness.
Race and Ethnicity Survey respondents were asked to list which race or races they identify with and results are shown below. Note that
20% of respondents did not answer this question.

2021 Whatcom County Annual Report on Homelessness
18 | P a g e
Race and ethnicity continue to be correlated with homelessness. The 2021 Point in Time count surveys show that
only 60% of the respondents experiencing homelessness told surveyors that they identify as white and non-Hispanic,
even though this demographic makes up more than 80% of the county’s population. The data is incomplete (20% did
not answer this question) and surveys were not conducted by outreach workers across all of Whatcom County, but
this information suggests that more work is needed to offset current systems that result in a greater portion of
people of color experiencing homelessness than their white neighbors. Although people of color in Whatcom County
experience poverty at higher rates than their white neighbors, this does not fully explain the disparities in
homelessness. For example, census data shows that the American Indian and Alaska Native population accounts for
about 5% of Whatcom resident in poverty, but this demographic accounts for 9% of people experiencing homeless,
as counted in this report. Adding further evidence of overrepresentation among the homeless community, surveys
were not conducted on site this year with either of Whatcom County’s two tribal communities, suggesting that the
undercount of non-white individuals may be significantly higher than it would be otherwise.
Location of most recent permanent residence The abbreviated 2021 surveys asked individuals who had stayed the previous night in shelters about the location
of their most recent permanent housing, prior to entering homelessness. Of the 195 individuals who answered
this question, a little more than three out of five (62%) reported that their most recent stable housing was in
Whatcom County. Although surveys were completed with only a subset of the population in 2021, the results
are consistent with prior years that have found fairly stable responses to this question. Historical information
indicates that a steady 60-70% of people experiencing homelessness in Whatcom County had their most recent
permanent housing in this county, regardless of newly expanded or reduced services.

2021 Whatcom County Annual Report on Homelessness
19 | P a g e
Homeless Veterans Surveyors counted 37 homeless veteran households in 2021. 32 of these households were comprised of a single
person, three were households that included children, and two more included more than one adult, but no
children. Of all the veteran households experiencing homelessness, 14 of them were unsheltered, and eight of
those unsheltered households were experiencing chronic homelessness.
Despite significant progress over the last five years in reducing homelessness experienced by veterans,
additional resources are necessary to achieve our objective of ending homelessness for all veterans in Whatcom
County. As evidenced by dramatic declines in the number of veterans experiencing homelessness a decade ago,
new programs and new resources have shown to be effective in reducing the number of veterans that become,
or continue to be, homeless.

2021 Whatcom County Annual Report on Homelessness
20 | P a g e
Part B: Homelessness of Public-School Students in Washington State and
Whatcom County
In 2004, the U.S. Department of Education began requiring states to report data on homeless students in all
local school districts as part of their Consolidated State Performance Report.
Previous Point in Time count reports in Whatcom County have included information about homelessness from
the Washington State Office of the Superintendent for Public Instruction (OSPI), which was a cumulative count
of all students who experienced episodes of homelessness at some point during the school year. The OSPI’s
approach to reporting on homelessness changed in the last year, and their figures now include only the students
who were enrolled prior to the first school day of October. As a result, the newly reported numbers are lower,
because students that enroll after the beginning October are not included in the report.
The figure below shows the number of homeless students in Washington State public schools over the last six
years. Note that these figures reflect the definition of homeless children included in Subtitle VII-B of the
McKinney-Vento Act2, a definition that is different than the one used by HUD and elsewhere in this report, and
as noted above, includes only students enrolled in the district prior to October.
2 Individuals who lack a fixed, regular, and adequate nighttime residence including, children and youths who are sharing the housing of other persons due to loss of housing, economic hardship, or a similar reason; are living in motels, hotels, trailer parks, or camping grounds due to the lack of alternative adequate accommodations; are living in emergency or transitional shelters; are abandoned in hospitals; or are awaiting foster care placement; children and youths who have a primary nighttime residence that is a public or private place not designed for or ordinarily used as a regular sleeping accommodation for human beings; children and youths who are living in cars, parks, public spaces, abandoned buildings, substandard housing, bus or train stations, or similar settings; and migratory children who qualify as homeless.

2021 Whatcom County Annual Report on Homelessness
21 | P a g e
Differences between homeless point-in-time count and homeless students in school data School districts and the OSPI report data on homelessness that is different than the countywide annual Point in
Time homeless count in two important respects. First, the Point in Time homeless count is a snapshot of
homelessness on a single day in the community, whereas the data reported by schools are cumulative over the
course of a school year (meaning they add together everyone who is homeless at any point during the school
year). Secondly, the PIT Count data includes only people who are “literally” homeless according to HUD,
generally meaning people who are unsheltered, in emergency shelter, or in homeless transitional housing. In
addition to those three categories, school districts also include children who are doubled-up with another family
to prevent becoming literally homeless, and households residing in a hotel or motel that is paid with private
funding.
Homelessness among students at public schools in Whatcom County The emerging trend in Whatcom County differs from the state as a whole (shown on the previous page). The
following graph shows that in Whatcom County there was a significant increase in homelessness among public
school students after the 2017-18 school year, followed by a decrease of 2.9% between the 2018-19 and 2019-
20 years (the most recent data available at the time of this report). Since the 2014-2015 school year, the
percentage of students who experience homelessness has increased from 2.4% to 2.9%, or stated differently,
from 24 out of every 1,000 students to 29 out of every 1,000 students.
Public school homeless statistics by district The charts below show the number of homeless students counted in each school district from 2014-15 to 2019-
20 school years. These charts are one of the best opportunities to look at homelessness as it relates to

2021 Whatcom County Annual Report on Homelessness
22 | P a g e
geography within Whatcom County because the standardized approach taken by these public-school districts is
consistent from region to region.
As noted in the graph above, homelessness among students has been growing in Whatcom County.
Disaggregated data, shown below, provides more local insight about how different regions of the county are
faring in this respect. For example, in Bellingham School District, the most populous district, homelessness has
increased by about 15% over the last five years, a rate which is about half of the county’s average (32%).
Homelessness among students doubled in both the Lynden and the Mt. Baker School Districts, and nearly tripled
in the Nooksack Valley School District. Other districts have seen periods of growth and reduction, indicating a
dynamic environment for local families, and one of geographic inconsistency from district to district.

2021 Whatcom County Annual Report on Homelessness
23 | P a g e

2021 Whatcom County Annual Report on Homelessness
24 | P a g e
Homelessness and academic achievement3
The McKinney-Vento Act requires school districts to proactively identify and enroll homeless students, even if they
lack the normally required documents for enrollment. The definition of homeless includes children and youth who
“lack a fixed, regular, and adequate nighttime residence.” Eligible students may continue attending their school of
origin (if feasible) with transportation provided by the school district upon request, even if they move outside their
school of origin’s residential zone. Students may also transfer to the local attendance area school. These rights,
including the right to immediate enrollment, extend to unaccompanied homeless youth, even if they are unable to
provide proof of guardianship.
Under the McKinney-Vento Act, states are required to distribute a certain portion of their state’s homeless
education funding to school districts through competitive subgrants. Subgrant funds facilitate the school
enrollment, attendance, and success of homeless children and youth. The level of funding for subgrants is based
on the needs of the Lead Educational Agency requesting assistance, as well as the quality of their applications.
School districts that apply for and receive McKinney-Vento subgrants may use the funds to provide tutoring and
supplemental instruction, early childhood education, transportation, school supplies, professional development on
homeless education issues for school and district staff, and other services that otherwise may not be provided by
the public-school program.
While lack of housing is a direct challenge for students, there are broader difficulties experienced by homeless
students and other students living in poverty that researchers suggest may have a greater effect on student
performance. These include:
• economic stressors
• parental job loss
• parental financial distress
• residential mobility
• school mobility
• crowding
• hunger and poor nutrition
Researchers also underscore the significance of cumulative risk, pointing out that many of the risk factors listed
above often co-occur in the lives of homeless children, making it difficult to isolate the effects of each individual
risk factor.
Despite the difficulty in separating the effects of poverty from those of homelessness, and the mixed results of
studies comparing homeless and low-income children, homeless children are a particularly vulnerable, diverse
subgroup of disadvantaged children. They face substantial challenges in achieving academic success, and the
consequences of their struggles can last a lifetime.
3 This section is excerpted from: Bowman, Dukes, and Moore. 2012. Summary of the State of Research on the Relationship Between Homelessness and Academic Achievement Among School-Aged Children and Youth. National Center for Homeless Education, Greensboro, NC.

2021 Whatcom County Annual Report on Homelessness
25 | P a g e
Appendix A: Sheltered and Unsheltered Survey Forms
Sheltered Form
NOTE: Victims of DV: do not enter name, birth month or birth day into HMIS. However, please collect this information so surveys can be
de-duplicated prior to data entry. No signature is required.
***ONE FORM PER HOUSEHOLD***
Location: Where did you stay on the night of 1/28? (choose one - applies to entire household)
If the person/household stayed
unsheltered please use the
UNSHELTERED version of this form.
Emergency Shelter/Motel Voucher Program
(program name: ______________________________________ )
Homeless Transitional Housing Program
(program name: _____________________________________ )
1 Male (M), Female (F), Transgender Male-Female (TMF), Transgender Female-Male (TFM), Gender Non-Conforming (not exclusively M or F) (D), Refused (R) 2 White (W), Black or African-American (B), Asian (A), American Indian or Alaska Native (I), Native Hawaiian or Other Pacific Islander (H), Client refused (R)
Q1. Has anyone in your household ever served in the Armed Forces of the United States?
Yes which individual(s)? Use the “Individual #” from table above: _________ No Refused
Q2. Are you currently fleeing or in danger from a domestic violence, dating violence, sexual assault, or stalking situation? (If yes, DO NOT
ENTER NAMES IN HMIS) Yes Use the “Individual #” from table above: _________ No
Q3. Has any adult in household or minor head of household been continuously staying in an emergency shelter and/or unsheltered for a
year or more? Yes No Refused
Q4. Has any adult in household or minor head of household been homeless 4 or more times in the last 3 years? Yes No
Q5. Do these times without housing, added together, amount to a year or more? Yes No
Q6. Does any adult in household or minor head of household who answered yes for Q3, Q4, or Q5 have a disability? Yes No
A. *Household Information (Please enter each HH member below. Use additional form if household has more than seven members.) Please check a HH type in the next box.
i. Where did you last live in an apartment, room or house for six months or more? City_______________________
State______________ ZIP________________
v. Disabilities
Check all that apply to each client
Ind
ivid
ua
l #
Relation to
Head of
Household
Spouse/
Partner/
Child/Etc
ii. iii. iv. Population Data
First Name Last Name
Birth Date
(or if DOB refused;
Year of Birth)
Ge
nd
er
1
Rac
e2 (
ente
r al
l th
at a
pp
ly)
Nat
ive
Am
eri
can
tri
be
Eth
nic
ity
(His
pan
ic (
H)
or
No
n-H
isp
anic
(N
))
NO
NE
AP
PLY
Ch
ron
ic S
ub
stan
ce A
bu
se
Ph
ysic
al D
isab
ility
(Per
man
ent)
De
velo
pm
en
tal D
isa
bili
ty
Me
nta
l He
alth
(Su
bst
anti
al &
Lon
g-Te
rm)
Ch
ron
ic H
eal
th C
on
dit
ion
(Per
man
entl
y D
isab
ling)
Mo
nth
Day
Year
1 Self
2
3
4
5
6
7

2021 Whatcom County Annual Report on Homelessness
26 | P a g e
Q9. Source(s) of Household Income and Benefits (check all that apply) □ Refused □ Don’t Know
Public Assistance/Benefits Employment Other
□ Temporary Assistance Needy Families (TANF) □ VA □ Part time □ None
□ SSI/SSDI □ Child Support □ Full time □ Panhandling
□ Temporary Disability (ABD) □ Medicare/Medicaid □ Farm/seasonal □ Relative/friends
□ Unemployment □ Under the table/informal
Client Release of Information
Washington State HMIS for Annual Point in Time Count
This agency participates in the Washington State Homeless Management Information System (HMIS) by collecting information, over time,
about the characteristics and service needs of men, women, and children experiencing homelessness. RCW 43.185C.180 and RCW
43.185C.030
• To provide the most effective services in moving people from homelessness to permanent housing, we need an accurate count of all
people experiencing homelessness in Washington State. In order to insure that clients are not counted twice, we need to collect four
pieces of personal information. Specifically, we collect: name, birth date, race/ethnicity. You may also choose to provide your social
security number. However, signing this form does not require you to do so. Your information will be stored in our database for 7 years
after the last date of service. If you have questions about collection of data or your rights regarding your personally identifying
information, contact the HMIS System Administrator at: (360) 725-3028.
• We use strict security policies designed to protect your privacy. Our computer system is highly secure and uses up-to-date protection
features such as data encryption, passwords, and two factor identification required for each system user. There is a small risk of a
security breach, and someone might obtain and use your information inappropriately. If you ever suspect the data in HMIS has been
misused, immediately contact the HMIS System Administrator at: (360) 725-3028.
• The data you provide may be combined with data from the Department of Social and Health Services (DSHS) and Education
Research and Data Center for the purpose of further analysis. Your name and other identifying information will not be included in any
reports or publications. Only a limited number of staff members, who have signed confidentiality agreements, will be able to see this
information. Your information will not be used to determine eligibility for DSHS programs. Washington State HMIS system
administrators have full access to all information in HMIS. This includes the Department of Commerce staff, designated HMIS system
administrators, and the software vendor.
• By signing this form, you acknowledge and allow Department of Commerce staff to obtain additional records of information from other
state agencies with which there is a data sharing agreement (DSA) on file between Commerce and the other agency. Our DSA guides
data transfer and storage security protocols. If DSAs are in place, Commerce is authorized by you to obtain, add to HMIS, and use for
evaluation purposes any other data you have provided to other Washington state agencies.
• Your decision to participate in the HMIS will not affect the quality or quantity of services you are eligible to receive from this agency,
and will not be used to deny outreach, assistance, shelter or housing. However, if you do choose to participate, services in the region
may improve if we have accurate information about homeless individuals and the services they need. Furthermore, some funders
MAY require that you consent to your information be supplied in HMIS in order for you to receive services from that funding source.
I understand the above statements and consent to the inclusion of personally identifying information in HMIS about me and any dependents
listed below, and authorize information collected to be shared with partner agencies. I understand that my personal information will not be
made public and will only be used with strict confidentiality. I understand that I may obtain a copy of my signed consent form from this Agency.
I agree to the inclusion of my household’s information for count purposes described above.
Dependent children under 18 in household, if any (please print first and last names):
Signature(s) (each adult or legally emancipated youth must sign):
Adult 1: Adult 3:
Adult 2: Adult 4

2021 Whatcom County Annual Report on Homelessness
27 | P a g e
Unsheltered Form NOTE: Victims of DV: do not enter name, birth month or birth day into HMIS. However, please collect this information so surveys can be
de-duplicated prior to data entry. No signature is required.
***ONE FORM PER HOUSEHOLD***
Location: Where did you stay on the night of 1/28? (choose one - applies to entire household)
Out of Doors (street, tent, etc) If the person/household stayed
in a shelter please use the
SHELTERED version of this
form
Vehicle (car ONLY)
Abandoned Building
RV/Boat lacking any of the following amenities:
drinking water, restroom, heat, ability to cook/bathe
1 Male (M), Female (F), Transgender Male-Female (TMF), Transgender Female-Male (TFM), Gender Non-Conforming (not exclusively M or F) (D), Refused (R) 2 White (W), Black or African-American (B), Asian (A), American Indian or Alaska Native (I), Native Hawaiian or Other Pacific Islander (H), Client refused (R)
Q7. Has anyone in your household ever served in the Armed Forces of the United States?
Yes which individual(s)? Use the “Individual #” from table above: _________ No Refused
Q8. Are you currently fleeing or in danger from a domestic violence, dating violence, sexual assault, or stalking situation? (If yes, DO NOT
ENTER NAMES IN HMIS) Yes Use the “Individual #” from table above: _________ No
Q9. Has any adult in household or minor head of household been continuously staying in an emergency shelter and/or unsheltered for a
year or more?
Yes No Refused
Q10. Has any adult in household or minor head of household been homeless 4 or more times in the last 3 years? Yes No
Q11. Do these times without housing, added together, amount to a year or more? Yes No
Q12. Does any adult in household or minor head of household who answered yes for Q3, Q4, or Q5 have a disability? Yes No
B. *Household Information (Please enter each HH member below. Use additional form if household has more than seven members.) Please check a HH type in the next box.
Household without Children ____ Household with Adults & Children_____ Households with only Children_____
Ind
ivid
ua
l #
Relation to
Head of
Household
Spouse/
Partner/
Child/Etc
ii. iii. iv. Population Data
First Name Last Name
Birth Date
(or if DOB refused;
Year of Birth)
Ge
nd
er
1
Rac
e2 (
ente
r al
l th
at a
pp
ly)
Nat
ive
Am
eri
can
tri
be
Eth
nic
ity
(His
pan
ic (
H)
or
No
n-H
isp
anic
(N
))
Mo
nth
Day
Year
1 Self
2
3
4
5
6
7