Embed Size (px)
Citation preview

A Holistic systems approach to controlling Bioassays: Lessons Learned CaSSS-Bioassay 2014 Bhavin Parekh, Ph.D. Group Leader-Bioassay Development Eli Lilly and Company Indianapolis, IN 46221

Outline
Background
Lesson Learned over the last decade
3 Case studies
Summary
Parekh, CaSSS conf., 2009 Copyright © 2009 Eli Lilly and Company

Why do need bioassays?
Biological therapeutics (proteins, vaccines, Ab, etc.) are complex and heterogeneous in composition. They can exist in multiple physical and chemical conformations.
Even though physiochemical analysis (HPLC, MS, AAA, etc.) can be extensive, it cannot measure activity (or impact of changes in activity) of bioproducts.
Bioassays need to be sensitive to structural changes and/or to product degradation that may impact biological activity, efficacy, or safety
By measuring potency using a bioassay, we can infer the structural integrity of a complex biological, thus bioassays are a measure of the quality of the therapeutic
4/16/2014

Case Study 1
Product X is a protein product
Potency assay is a cell-based assay. Ulitizes UMR-106 (osteosarcoma) cell line which expresses the receptor endogenously. Assay readout is a competitive cAMP ELISA.
Method was validated to support clinical development and post-approval
Parekh, CaSSS conf., 2009 Copyright © 2009 Eli Lilly and Company

16-Apr-14 File name/location
Method Description: Cell Induction
Intracellular cAMP released
Product X
binding
UMR-106 cell covered
with Product X receptors
= Product X
= intracellular cAMP produced in
response to Product X
Cell Lysis
cAMP detection

16-Apr-14 File name/location
Method Description: cAMP Detection
Assay Plate coated with
goat anti-rabbit antibody
Rabbit anti-cAMP antibody
binds cAMP and cAMP-AP
AP AP
AP
= cAMP
AP AP AP
Cellular cAMP and Alkaline
Phosphatase-conjugated cAMP
added to Assay Plate
= Rabbit anti-cAMP = Goat anti-rabbit
AP AP AP
CSPD/Subs
= Light
Wash
Figure 1. rhPTH(1-34) Dose Response Curve
Product X (nM)
0.001 0.01 0.1 1 10
RLU
's
0
5
10
15
20
25
rhPTH(1-34) Reference Standard
rhPTH(1-34) Unknown Sample
16-Apr-14 File name/location
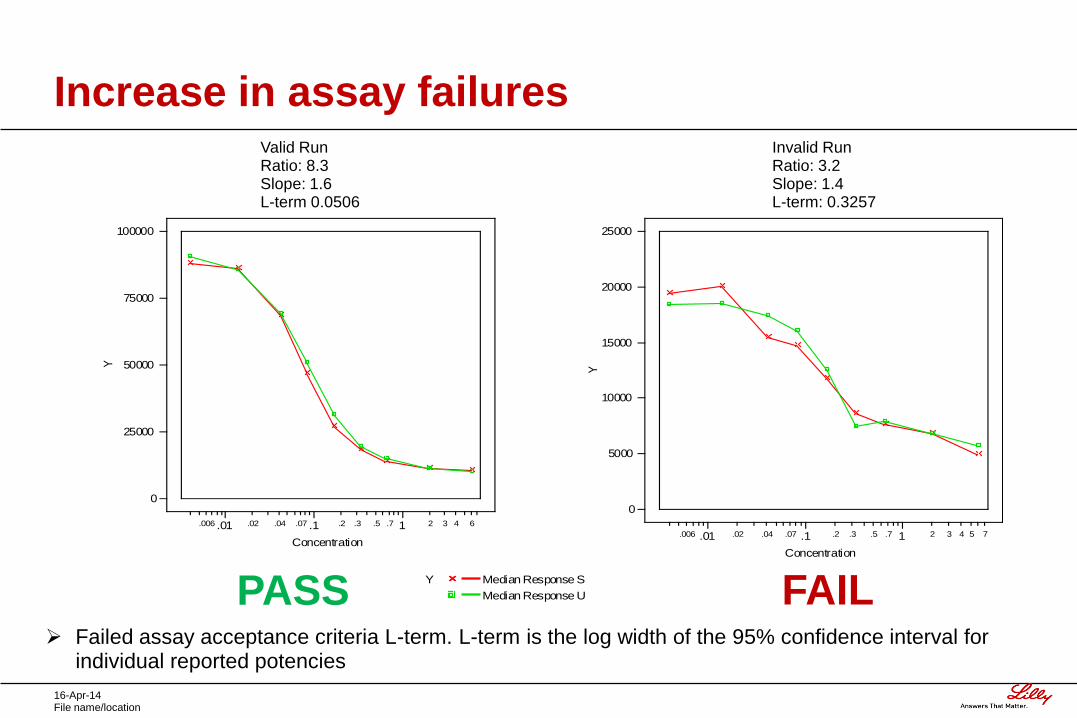
Increase in assay failures Valid Run Ratio: 8.3 Slope: 1.6 L-term 0.0506
Invalid Run Ratio: 3.2 Slope: 1.4 L-term: 0.3257
0
25000
50000
75000
100000
Y
.01 .006 .1 .07 .04 .02 1 .7 .5 .3 .2 2 3 4 6
Concentration
0
5000
10000
15000
20000
25000
Y
.01 .006 .1 .07 .04 .02 1 .7 .5 .3 .2 2 3 4 5 7
Concentration
Y Median Response S
Median Response UPASS FAIL Failed assay acceptance criteria L-term. L-term is the log width of the 95% confidence interval for
individual reported potencies

16-Apr-14 File name/location
Historical Performance: L-term Analysis

16-Apr-14 File name/location
Assay performance deteriorated
Decline in assay run critical parameters 5-fold decrease in assay response (100K to 20K)
2-fold reduction in S/N (asymptote ratio) from 6.0 to 3.0
Poor quality dose-response curves
High L-term values
Assay valid rate dropped from >90% to <25%
Created significant assay backlog and meet market supply chain demands

16-Apr-14 File name/location
Root Cause Investigation
Focused on both the analytical method and the cAMP detection (Vendor) kit
Comprehensive technical assessment 8 months in duration
Cross-functional effort (QCL, Bioassay Development, Vendor, TPO Lab)
Every aspect of the assay was assessed
Cells losing response?
Cell health/viability
Pipetting technique, sample preparation, wash steps, blocking, substrate incubation, etc, etc
Root Cause was finally Determined!!! Conjugate dilution buffer identified as primary cause

16-Apr-14 File name/location
Conjugate Buffer Diluent Improvement
0
50000
100000
150000
200000
Y
.01 .006 .1 .07 .04 .02 1 .8 .6 .4 .3 .2 2 3 4 5 7
Concentration
L-term: 0.1035 Slope: 1.7 Asymptote Ratio: 6.1 Potency: 69.80%
.
Vendor conjugate dilution buffer
Lilly conjugate dilution buffer (Mg2+ and Zn2+)
0
5000
10000
15000
20000
25000
Y
.01 .006 .1 .07 .04 .02 1 .7 .5 .3 .2 2 3 4 5 7
Concentration
Invalid Run Ratio: 3.2 Slope: 1.4 L-term: 0.3257

16-Apr-14 File name/location
Lessons Learned: Short and long term
improvements
Short-term
Implement new conjugate dilution buffer
Bioassay Development group maintain on-going communication with vendor kit vendor
Long-term
Proactively monitor assay performance and react to trends
Develop new assay based on a different technology

16-Apr-14 File name/location
Lesson Learns from Case Study 1
Reliance on Vendor-supplied kit Single sourced
Complex biological reagents
Non-GMP supplier
Look at the business model. Are kits designed for discovery/screening efforts
Does “QC tested” meet your standards
Reliability concerns
Lot to lot differences
Timely delivery of kits
Assay complexity Multiple liquid transfer and pipetting steps
Labor intensive
Prone to errors
Sensitive to analyst technique

16-Apr-14 File name/location
Long term strategy: Outcomes
Developed reporter gene assay in same parental cell line
Demonstrated comparability between cell-based ELISA vs. reporter gene assay
Validated and transferred method to testing lab
Reporter gene assay Significant improvement in assay run parameters
4-fold increase in response level
Enhanced S/N ratio
L-term values consistently below limit (NMT 0.2000)
Acceptable dose-response curves
Assay valid run rate >90%
Completed transfer of assay to TPO
ATP
cAMP G-Protein
X-Receptor Adenylate Cyclase
PKA
Activated PKA
CREB Phospho-CREB
(activated)
CRE-Sequence
(promoter)
CRE-Luciferase Construct
Luciferase mRNA
Luciferase (Protein)
Product X

Case Study 2: Drug Y Bioassay
Reporter gene assay with promoter of validated gene linked to luciferase
Gene is stimulated by a constant concentration of agonist.
Drug Y inhibits the stimulation by the gene and this can be measured in a dose-dependent manner.
Method qualified in QC lab to support early phase CT lot release and stability Accuracy <20%, Precision <10%. Linearity (R2) = >0.95
Stimulating
molecule
Drug Y
Luciferase

Testing of DS and DP lots revealed a bias in potency values
%P
ote
ncy
100
120
140
160
Bioassay Results
Avg Potency= 116%± 13%
High Bias and variability not observed with sys. Suit sample that is also testing no each plate
High Bias and variability observed with DS and DP testing (Lot and stability)
Avg Potency= 102%± 8%
DS/DP lot testing Sys. Suit. testing

Bioassay Curve Characteristics for Product Y
0
100000
200000
300000
400000
500000
600000
0.001 0.01 0.1 1 10 100 1000 10000 100000
Rela
tiv
e L
igh
t U
nit
s
Conc.
Ref Std
Drug X
5% RLU change = 14%
Potency difference
Potency = 152%
Shallow slope (<1)

Summary of Assay Improvements and learnings
Difficult to change the dynamics of the biological response , i.e. slope since it may be an inherent biological property
Instead a series of improvements to provide robustness, and reduce variability and bias.
Improvements
• Implement gravimetric preparation of samples to reduce pipetting error associated
with viscosity
• Add more robustness to the curve by adding dilution points in the linear portion
• Implement twice the cell number per well to increase overall signal strength
• Remove Phenol Red from medium to reduce quenching of luminescent signals

Reduced Bias and Variability
Avg = 116%±13% Avg = 105%±8%

Company Confidential Copyright © 2013 Eli Lilly and Company
Kamikura 2013
Case 3: Reporter gene assay- Stability of recombinant cell lines
Instability likely mediated by epigenetic gene silencing
Method qualified for early phase release and stability testing Cell passage stability assessed (>20 passages) assess during early method development
However, several years later….

Company Confidential Copyright © 2013 Eli Lilly and Company
Kamikura 2013
Developing stable reporter genes assays
•vector design (eg. bicistronic vectors to link selection to promoter activity, lentivirus) – increasing
transgene stability
• appropriate gene promoter (preferred to transcription factor binding sites) – reduced variability
• Requires baseline expression for selection –open chromatin and maintenance of response
Luciferase Neo/Kan
1.85kb reporter of choice
Ori
promoter of choice
Luciferase Neo/Kan
Vector
1 mRNA
Neo/Kan Luciferase 2 proteins

Company Confidential Copyright © 2013 Eli Lilly and Company
Kamikura 2013
Example: Bi-cistronic Vector Stability
x axis
1 10 100
0
50000
100000
150000
System Suitability graph
4-P Fit: y = (A - D)/( 1 + (x/C)^B ) + D: A B C D Rel. Pot.
Plot#1 (Reference Standard: Concentration vs Medi... 1.72e+05 6.29 14.2 2.22e+04 1
Plot#2 (System Suitability: Concentration vs Median... 1.72e+05 6.29 13.8 2.22e+04 1.03__________
Weighting: Fixed
PLA (Std. Curve: Plot#1) Degrees of Freedom: parallel = 11 free = 8 non-parallel = 3
R^2 = 0.994 F-stat = 0.296 F-prob = 0.827
Low Passage (p4)
x axis
1 10 100
10000
20000
30000
40000
50000
60000
70000
80000
System Suitability graph
4-P Fit: y = (A - D)/( 1 + (x/C)^B ) + D: A B C D Rel. Pot.
Plot#1 (Reference Standard: Concentration vs Medi... 8.46e+04 6.13 13.4 1.17e+04 1
Plot#2 (System Suitability: Concentration vs Median... 8.46e+04 6.13 13.3 1.17e+04 1__________
Weighting: Fixed
PLA (Std. Curve: Plot#1) Degrees of Freedom: parallel = 11 free = 8 non-parallel = 3
R^2 = 0.993 F-stat = 0.495 F-prob = 0.696
High Passage (p48)
Passaged 1-2x week for ~11 months Acceptable even in the absence of selection = stable genome integration
* no selection

Future technology exploration….
Parekh, CaSSS conf., 2009 Copyright © 2009 Eli Lilly and Company
Several genomic editing technologies allow generation of reporter gene at gene-specific sites
TALENS Zn Fingers Crispr-Cas9

Learnings for Case Studies 2 and 3
Parekh, CaSSS conf., 2009 Copyright © 2009 Eli Lilly and Company
Reporter gene assays Good Platform approach for many targets
Helps build expertise Leverage cross project learnings Minimal manipulation by analysts Shared instrumentation: likely to catch problems
However, take a long term view to assess control of bioassay method
Qualifications and validations are ‘snap-shots’ in time Assess method performance and capability based on long-term API/DP testing
experience. In most cases, long-term passage related stability can be controlled based on
Understanding stability of initial clones Two tiered cell banking strategy (master and working cell banks)
Tracking and trending of parameters such as curve properties, passage numbers, analysts, split schedules, FBS lots, critical reagents, etc are an important tool to assess control

Parekh, CaSSS conf., 2009 Copyright © 2009 Eli Lilly and Company
Acknowledgement Bioassay development group
Darren Kamikura
Sharon Sibley
Jeanne Helmreich
Piyush Vyas
Denise Lyons
Liming Shi
Jane Sterner
Global Quality Labs
Robert Beckmann
Liying Lin
Katie Singer
Linda Wolters