Embed Size (px)
Citation preview

asteco.com
A historic review and outlook of the UAE’s Real Estate Sector from 2008 till 2016
UAE Real Estate Report
Many changes have taken place in the UAE’s real estate market over the last few years. The country witnessed the market maturing, adjusting and reacting to internal as well as external factors.
This report looks back at the changes that have occurred in Abu Dhabi, Dubai and the Northern Emirates since 2008 and provides Asteco’s view on the prospects for 2016 and beyond.

UAE Real Estate Report - Q4 2015
2 © Asteco Property Management, 2016
Content
Editorial Note
UAE Price Comparison
Oxford Economics
Abu Dhabi Historic Review & Outlook
Dubai Historic Review & Outlook
Northern Emirates Historic Review & Outlook
Al Ain Historic Review & Outlook
03
04
05
07
15
22
26

UAE Real Estate Report - Q4 2015
Xxx
3© Asteco Property Management, 2016
Editorial Note
John Stevens, BSc MRICSManaging Director /Director, Asset Services
2015 - DUBAI, ABU DHABI & NORTHERN EMIRATESDubai’s property sales market in 2015 was challenged particularly by the strong dollar and a generally negative global economic outlook, which affected investment appetite from traditional overseas buyers, especially from Europe and Russia. The result was a steady decline in Dubai’s property values and transaction levels throughout the year for both residential and commercial sectors.
Dubai’s off-plan market suffered the most, particularly for product launches in secondary locations by third party developers, despite attractive incentives offered in terms of extended payment plans and price reductions. Even major master developers, who enjoyed some success in the first half of 2015, experienced significant drops in sales volumes in the second half of the year.
The overall negative sentiment in the Dubai market also affected sales in the Northern Emirates, which remained slow. This was especially evident in Ras Al Khaimah, which historically benefited from good levels of demand for its master-planned developments as they were considered a better value-for-money option compared with Dubai.
Regulatory issues also affected the market specifically the loan-to-value limits imposed on expatriate buyers in the market. In Dubai, this was compounded by the increase in transfer fees and, more recently, the timing for payment of these transfer fees.
Whilst reduced government spending also affected the Abu Dhabi market, the Emirate experienced stable sales prices and continued rental growth, as demand, albeit more subdued, continued to outstrip supply in specific market segments. Whilst there was limited interest for off-plan sales launches, there was still transactional activity in completed or nearly completed projects.
The continued obstacle in the Abu Dhabi market is the lack of transparent property ownership laws and regulations, which continued to impair sales especially for potential investors residing abroad; however, this will potentially be addressed with new legislation becoming effective in 2016.
2016 OUTLOOK With substantial supply planned to be handed over in Dubai throughout 2016 and 2017, both sales prices and rental rates in the city are expected to come under pressure over the coming 12 to 18 months.
Consequently, this could affect rental rates in the Northern Emirates as any prolonged declines in Dubai, particularly in rental values, typically affect Sharjah and Ajman.
In contrast, however, Abu Dhabi has a more limited amount of supply in the pipeline due for completion during 2016. As a result, although vacancy levels are likely to come under pressure, pushing rental rates down, this is expected to be to a lesser extent compared with Dubai.
MEDIUM TO LONG TERM OUTLOOKNotwithstanding the poor performance of the Dubai residential property market in 2015 and potentially further drops forecasted for 2016 as substantial supply comes online, the real estate sector in both Dubai and Abu Dhabi continues to offer attractive post tax returns to investors when compared with other global cities.
Despite the numerous property launches in Dubai over the past few years, it is likely that a substantial proportion of these projects will be curtailed due to market conditions, which will allow stock, currently under construction and due for delivery in the next 2 to 3 years, to be absorbed.
Government initiatives totalling some AED300 billion have been announced and will be spent on diversification in sectors such as education, health, energy, transportation, space, and water with the objective to build a knowledge-based economy. These efforts are likely to increase the percentage of knowledge workers into the country to 40 per cent by 2021, thereby driving demand for real estate in all emirates.
Furthermore, major government infrastructure projects are already committed, such as the Dubai World Central (DWC), Al Maktoum International Airport and Expo 2020, which will all continue to create employment opportunities and therefore drive demand for housing in the medium to long term.
Many changes have taken place in the UAE’s real estate over the last few years. The country witnessed the market maturing, adjusting and reacting to internal as well as external factors.
This report looks back at the changes that have occurred in Abu Dhabi, Dubai and the Northern Emirates since 2008 and provides Asteco’s view on the prospects for 2016 and beyond.
Despite a forecasted modest GDP growth of 3.2% for 2015 (compared with 4.6% in 2014), the year was marked by continuous challenges for the UAE property market. Low oil prices affected government spending, a strong dollar affected exports and tourism, and continued unrest in the wider Middle East region have all contributed to the UAE’s slowest private-sector growth in 5 years resulting in a slowdown in employment growth as well as job cuts in specific sectors.
UAE Real Estate Report - Q4 2015
4 © Asteco Property Management, 2016
UAE ComparisonPrice movement from 2008 to 2015
Rental Rate Evolution
Sales Price Evolution
AVERAGE 2BR APARTMENT RENTAL RATE MOVEMENT
AVERAGE APARTMENT SALES PRICE MOVEMENT
AVERAGE 4BR VILLA RENTAL RATE MOVEMENT
AVERAGE VILLA SALES PRICE MOVEMENT
AVERAGE OFFICE RENTAL RATE MOVEMENT
AVERAGE OFFICE SALES PRICE MOVEMENT
Dubai Abu Dhabi Al Ain Ajman Fujairah Sharjah New Ras Al Khaimah New Umm Al Quwain
Dubai Abu Dhabi
Dubai Abu Dhabi Al Ain
Dubai Abu Dhabi
Dubai Abu Dhabi Al Ain Sharjah
Dubai
250
200
150
100
50
0
2,500
2,000
1,500
1,000
500
0
500
400
300
200
100
0
2,000
1,500
1,000
500
0
400
300
200
100
0
2,000
1,500
1,000
500
0
Dec2008
Dec2008
Dec2008
Dec2008
Dec2008
Dec2008
Dec2009
Dec2009
Dec2009
Dec2009
Dec2009
Dec2009
Dec2010
Dec2010
Dec2010
Dec2010
Dec2010
Dec2010
Dec2011
Dec2011
Dec2011
Dec2011
Dec2011
Dec2011
Dec2012
Dec2012
Dec2012
Dec2012
Dec2012
Dec2012
Dec2013
Dec2013
Dec2013
Dec2013
Dec2013
Dec2013
Dec2014
Dec2014
Dec2014
Dec2014
Dec2014
Dec2014
Dec2015
Dec2015
Dec2015
Dec2015
Dec2015
Dec2015
AED
per
ft2
AED
000
’s pa
AED
000
’s pa
AED
per
ft2 p
a
AED
per
ft2
AED
per
ft2
UAE Real Estate Report - Q4 2015
5© Asteco Property Management, 2016
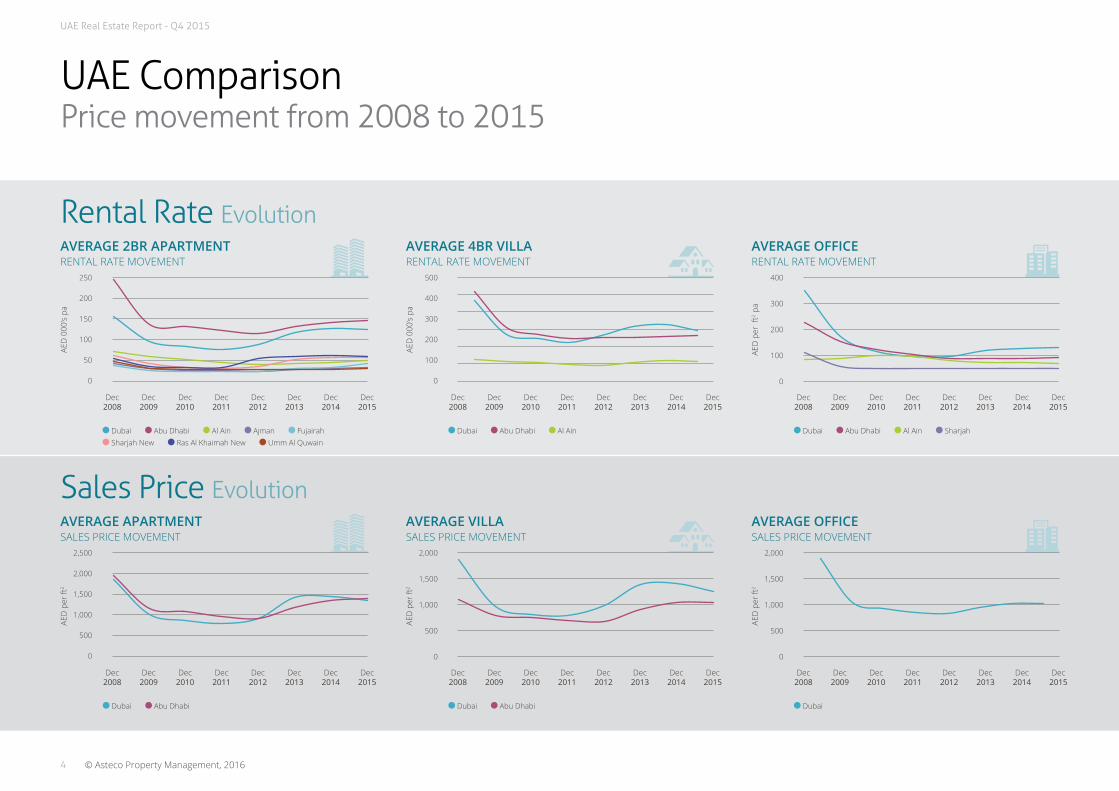
Oxford Economics
• There are further signs of weakness in the oil sector. Brent crude prices have fallen to around USD35 per barrel and we have downgraded our forecast to USD 39 per barrel for 2016 as a whole. Despite the soft outlook for prices, no change in policy was announced at OPEC’s meeting in December, which points to oil output in the UAE remaining elevated and close to the 3 million barrels per day recorded in November. We expect hydrocarbon sector growth of just 1% for both 2015 and 2016.
• The central bank, in line with others in the region, increased interest rates by 0.25% to 1.25% in December following the hike by the US Federal Reserve. The move provides support for the currency peg to the dollar, which had been under pressure due to the collapse in oil prices, weakening growth outlook and deteriorating fiscal position. Higher rates come amidst signs of already tightening liquidity in the financial system, with private sector lending and deposit growth both slowing sharply over the past year. However, although further rate hikes are expected in 2016, we think their broader impact on demand in the economy will be reasonably limited.
• Amidst oil sector weakness, a slowdown in regional trade and capital flows, tighter liquidity and moderate (by regional standards) fiscal consolidation, we think that non-oil growth will slow to 3.4% in 2016 from an estimated 3.5% in 2015. The PMI fell to 53.3 in December, the weakest recording in more than three years. But the medium-term outlook is supported somewhat by the UAE’s relatively high degree of economic diversification, Dubai’s high quality infrastructure and continued ability to attract international capital to fund a steady stream of projects, including in the run-up to the Expo 2020. Non-oil growth should average 4.5% per annum in 2017-19.
UAE: Inflation UAE: Real GDP growth
% year % year
Source: Oxford Economics Source: Oxford Economics
1998 19902000 2002 19932004 19962006 19992008 20022010 20052012 20082014 20112016 20142018 2017
F’Cast F’Cast
Middle East &North Africa
Middle East &North Africa
UAE
UAE
18 21
1518
12
15
9
12
9
6
6
3
30
-3
0 -6
Who we are - Oxford EconomicsOxford Economics was founded in 1981 as a commercial venture with Oxford University’s business college to provide economic forecasting and modeling to UK companies and financial institutions expanding abroad. Since
then, we have become one of the world’s foremost independent global advisory firms, providing reports, forecasts and analytical tools on 200 countries, 100 industrial sectors and over 3,000 cities. Our best-of-class global
economic and industry models and analytical tools give us an unparalleled ability to forecast external market trends and assess their economic, social and business impact.
Headquartered in Oxford, England, with regional centres in London, New York, and Singapore, Oxford Economics has offices across the globe in Belfast, Chicago, Dubai, Mexico City, Miami, Milan, Paarl - South Africa,
Paris, Philadelphia, San Francisco, and Washington DC. We employ over 200 full-time people, including more than 120 professional economists, industry experts and business editors—one of the largest teams of macro
economists and thought leadership specialists.
To find out more and request your free trial please contact Paul de Cintra on [email protected]
UAE Real Estate Report - Q4 2015
6 © Asteco Property Management, 2016

UAE Real Estate Report - Q4 2015
7© Asteco Property Management, 2016
Abu Dhabi
Abu DhabiHistoric Review & Outlook
Growth 2002-2008
Recession 2009-2011
Recovery & Growth 2012-2014
Stabilisation 2015
Outlook 2016
• As a consequence of rapidly growing demand coupled with an undersupplied market, rental rates and sales prices achieved unprecedented growth till the end of 2008.
• Most of Abu Dhabi’s buildings were of mid and low quality with residential and commercial properties grossly undersupplied.
• Increased demand prompted the launch of numerous development projects as well as a speculator driven boom.
• With strong economic performance, the number of newcomers to the city increased rapidly putting pressure on residential rates and priced-out a large number of residents.
• Office demand was equally strong and many companies were unable to expand due to the lack of available space.
• Strong demand and slow delivery of new units led to unprecedented levels of rental and sales price inflation.
• Rental rates and sales prices reached an historical peak for all unit types and grades.
• Several projects were launched and sold off-plan at rapidly increasing prices. By the end of 2008, following the financial crisis, the resale market for off-planned properties came to a virtual standstill.
• The global financial crisis led to a rapid correction in prices, which dropped in excess of 60% from its market peak in Q4 2008 to a market low by the end of 2011.
• With only approximately 8,000 new units entering the market over the three-year period, supply levels were still insufficient to cater to demand, which led to a slower but still substantial, rental decline compared with neighbouring Dubai. As a result, a large number of residents were priced-out, and forced to move to lower priced communities in Dubai.
• The first master-planned developments were handed over during the period, most notably Al Bandar and Al Zeina at Al Raha Beach.
• Rental rates fell by nearly 60% since the market peaked in 2008, which led to an internal tenant movement of flight-to-quality and a strong leasing market.
• As rental rates dropped and quality new supply entered the market, transaction levels in Abu Dhabi picked up, which led to a rapid take-up of new residential supply in well planned projects.
• Whilst sales were at a standstill during most of the period, demand increased slowly by end of 2011 as projects began the handover stage.
• With the amount of stock available and high interest rates, sales prices continued to decline up until Q2 2012.
• The market began to show signs of recovery with a significant increase in rental and sales rates.
• Several new prime and high-end projects were handed over during this period, including projects on Reem Island, Al Raha Beach as well as landmark projects on Saadiyat Island and Abu Dhabi Main Island.
• With quality residential now available at relatively low prices, poorer quality stock with relatively high prices had to adjust their asking rates.
• Internal tenant movement and flight-to-quality prevailed as people took advantage of the options available.
• The number of owner-occupiers gradually rose in line with the increase in finance options offered by banks.
• Transaction levels were up as job security and increased market confidence resulted in tenancy upgrades and home ownership.
• Off-plan sales also recommenced and were successful during 2013 and 2014.
• Sales prices, however, recorded a quick recovery of approximately 28% compared with their lowest point in Q2 2010.
• The office market was relatively stable with a slight decrease in lower quality offices versus a slight increase for higher quality ones.
• The decline in oil prices prompted a general slowdown in investment in 2015. However, due to limited new supply entering the market, rates were still increasing at a moderate pace.
• By end of 2015, the number of residential units reached approximately 234,000 units and office supply stood at 3.3 million sqm of GLA.
• Overall demand levels remained stable throughout the year, however, as limited new supply was completed, rates remained broadly unchanged.
• The flight-to-quality situation continued to put pressure on older and lower quality properties.
• Sales demand focused on completed rather than off-plan products, whereas in the leasing market prime and high quality residential projects were the most sought after developments in 2015; achieving close to full occupancy.
• An overall slowdown in demand is expected during the year, affecting predominantly higher-priced residential units.
• The UAE’s overall market conditions are under pressure due to low oil prices, and this will lead to a reduction in government spending. In turn this could impact on future demand as growth slows down and salary levels remain stable.
• The expatriate population (representing approximately 75% of the total population) remains one of the main demand drivers for residential property. Therefore, any plans for job cuts may impact overall demand significantly.
• If demand levels decline, rental rates and sales prices may come under pressure during the course of the year. However, with limited supply due for handover, the drop is likely to remain limited in comparison with Dubai.

UAE Real Estate Report - Q4 2015
8 © Asteco Property Management, 2016
Abu Dhabi2015 Highlights
Leasing Sales
Resi
dent
ial
high
light
s • Rental rates increased all over Abu Dhabi as prime and high quality projects recorded the highest increases. However, rental rates for mid and low quality units, which were previously lower than market rates, increased in line with market value. This was aided by the temporary removal of the rent cap.
• Villas located in Khalidiya and Bateen, which were leased at above market rates in the last few years, witnessed a significant decrease in demand and forced owners to reduce their asking price.
• The overall market sentiment directed the buyer’s appetite towards completed high quality residential units, especially during the second half of the year.
• The recorded sales volumes in the recently launched Al Merief development and Nareel Island, exclusively offered on a plot-sale basis to Emiratis, proved that there was a strong demand for villa plots in well master-planned developments.
• However, off plan sales slowed down significantly as buyers and investors preferred turnkey properties.
Offi
ce
high
light
s • The overall office rental market remained stable in 2015; however, several fitted offices in grade B buildings that had been leased out at lower than market rates increased by 5% to 7% during the second half of the year.
• Overall, demand for office space was relatively low during 2015, due to the decline in oil prices, which affected the overall investment sentiment in the UAE.
• Leasing resumed on Maryah Island following its announcement of obtaining a Free Zone status. Rental rates increased by nearly 50% to AED325 per square foot compared with pre free-zone rates.
• The office sales market remained limited in Abu Dhabi as only a few towers offered space for sale, which included Infinity Tower, Sky Tower and the recently handed over ADDAX Tower.
Mar
ket
chan
ges • Abu Dhabi Global Market (ADGM), the financial free zone on Al Maryah Island, achieved essential progress in 2015. The Financial Services Regulatory
Authority (FSRA) commenced operations with acceptance and approval of financial services license application on the 21st of October, following the publication of the Financial Services and Markets Regulations and the FSRA Rules, which established the legislative and regulatory framework for financial services for the ADGM.
• The new property law – No. 3 of 2015, aimed to improve regulations for the Real Estate Sector in Abu Dhabi was published and will take effect as of January 2016. The law pertains particularly to property registration, off plan sales regulations, joint ownership, etc. and will bring much needed clarity to the sector.
• Several new projects were launched during 2015, such as West Yas and Mayan (by Aldar) on Yas Island, Meera (by Aldar), Horizon Towers (by Tamouh), and the Kite (by Aabar), which are all located on Reem Island. In addition, Jawaher Al Saadiyat (by TDIC), Park Views and Soho (By Bloom Properties) on Saadiyat Island were also launched.
• Around 900 units in Gate Towers were released to the market with 200 units leased out to the Abu Dhabi Education Council (ADEC).
Supply completedin 2015
2,000 Apartments
100 Villas andTown houses
106,000 sq m Office space (BUA)
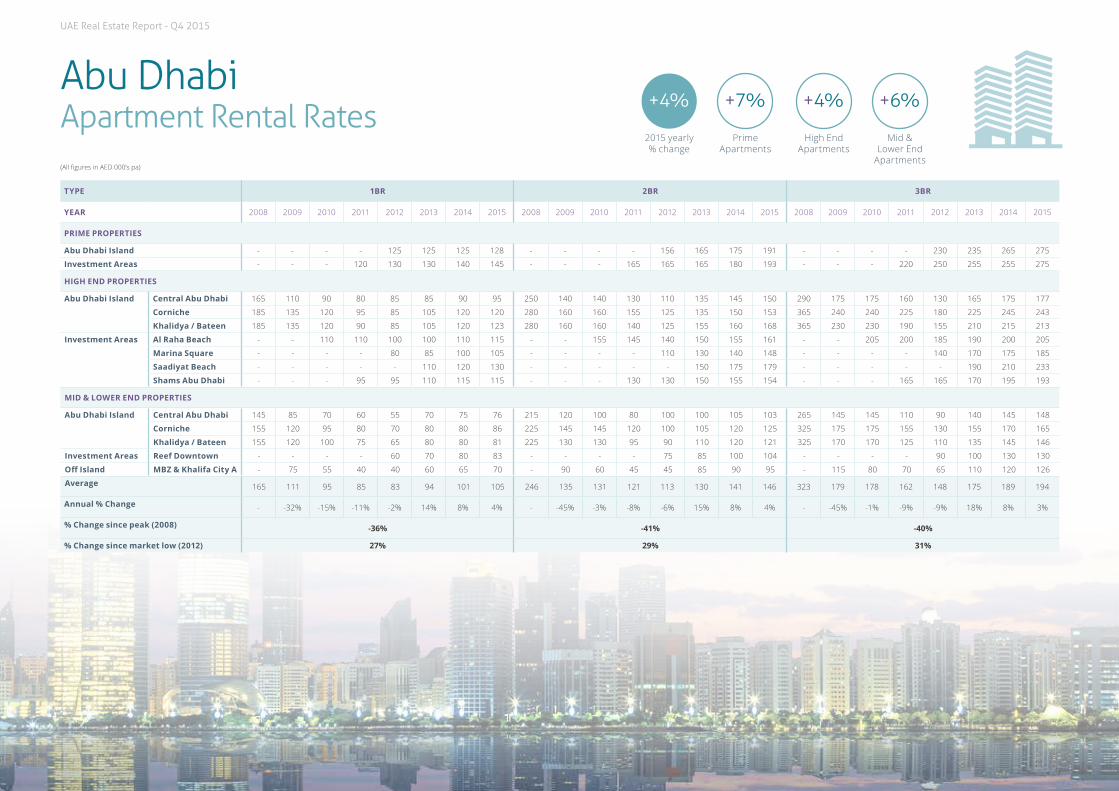
Despite a general market slowdown, 2015 was a positive year as apartment rental rates increased, on average, by 5% whereas several prime projects recorded an increase of over 10%. In comparison, apartment sales prices recorded a growth of between 3% and 4% over the year.
Selection of projects completed in 2015
RESIDENTIAL • Reem Island: Hydra Avenue, Phase 1 – 850 Units• Reem Island: Sea Side Tower – 160 Units• Baniyas: Bawabbat Al Sharq Phase2 – 567 Units• Saraya, Corniche: Creek Tower – 312
Serviced Apartment Units• Rawdhat Abu Dhabi: Building C59 – 78 Units COMMERCIAL• Reem Island: ADDAX Tower

UAE Real Estate Report - Q4 2015
Xxx
9© Asteco Property Management, 2016
Abu Dhabi2016 Outlook
Leasing Sales
Resi
dent
ial
high
light
s • Despite limited supply anticipated for completion this year, the reduction in demand levels is expected to put pressure on rental rates, especially for higher priced properties.
• In addition, landlord’s concerns over tenants vacating, could lead to better opportunities for tenants to negotiate rental rates upon renewal.
• The residential sales market is not expected to see any major drop in prices for completed properties as these are still in demand by owner-occupiers and investors.
• Sales for new launches, which slowed down in 2015, are expected to pick up once buildings are nearer completion. This could, however, occur in 2017 rather 2016.
Offi
ce
high
light
s • The office market is expected to remain stable in 2016, and Al Maryah Island will likely see more demand in the new free zone area. Take-up on some of Al Maryah’s developments that are due to be handed over imminently is expected to be high, especially if rates are more competitive than in Maryah Square.
• However, the overall demand for office space is expected to be restrained due to the continued decline in oil prices and government spending cuts, which are likely to affect jobs especially in the oil sector.
Mar
ket
chan
ges • The new property law – No. 3 of 2015, which aims to regulate the Real Estate Sector in Abu Dhabi, will be enforced as of January 2016. Part of the law
defines several important terms including, but not limited to the real estate register, real estate development projects, escrow accounts, off-plan sales, service charges and community charges. The Abu Dhabi’s Department of Municipal Affairs (DMA) will regulate the real estate sector and will essentially perform the same function as RERA in Dubai.
• The improved legal framework is expected to entice property buyers into the Abu Dhabi market, as the Emirate had previously been at a disadvantage compared with Dubai where regulations were clearer.
• Several new residential and office projects are expected to be handed over during 2016, and thus increase office vacancy rates especially with the expected low demand. Older, sub-grade buildings with insufficient parking are expected to be the most severely affected, whilst reasonably priced alternatives should be able to attract office tenants to upgrade.
Supply expectedin 2016
3,000 Apartments
850 Villas andTown houses
200,000 sq m Office space (BUA)
The overall investment sentiment impacted by the expected decrease in domestic government spending, due to the decline in oil prices is expected to continue in 2016. However, several factors are expected to have a positive effect on the real estate market, including but not limited to the establishment of the new financial free zone on Al Maryah Island and the new property law, which is expected to take effect in January 2016 and lead to an increase in confidence in the real estate sector in the longer term.
Selection of projects expected in 2016
RESIDENTIAL• Saraya, Corniche: Aabar Tower – 122 Units• Reem Island: Wave Tower – 229 Units• Reem Island: Marina Bay C2&C3 – 650 Units• Reem Island: Solaris Towers – 600 Units• Baniyas: Bawabbat Al Sharq Phase 2 – 153 Villas• Saadiyat Island – Hidd Al Saadiyat
Phase 1 – 488 Villas• Al Maryah Island: Four Seasons Private
Residences – 71 Units
COMMERCIAL • Maryah Island: Al Hilal Bank Headquarters• Corniche: ADNOC Headquarters• Airport Road: ADIB Headquarters• Reem Island: Omega Tower• Airport Road: Bloom Central Offices
& Serviced Apartments
UAE Real Estate Report - Q4 2015
Abu Dhabi Apartment Rental Rates
TYPE 1BR 2BR 3BR
YEAR 2008 2009 2010 2011 2012 2013 2014 2015 2008 2009 2010 2011 2012 2013 2014 2015 2008 2009 2010 2011 2012 2013 2014 2015
PRIME PROPERTIES
Abu Dhabi Island - - - - 125 125 125 128 - - - - 156 165 175 191 - - - - 230 235 265 275
Investment Areas - - - 120 130 130 140 145 - - - 165 165 165 180 193 - - - 220 250 255 255 275
HIGH END PROPERTIES
Abu Dhabi Island Central Abu Dhabi 165 110 90 80 85 85 90 95 250 140 140 130 110 135 145 150 290 175 175 160 130 165 175 177
Corniche 185 135 120 95 85 105 120 120 280 160 160 155 125 135 150 153 365 240 240 225 180 225 245 243
Khalidya / Bateen 185 135 120 90 85 105 120 123 280 160 160 140 125 155 160 168 365 230 230 190 155 210 215 213
Investment Areas Al Raha Beach - - 110 110 100 100 110 115 - - 155 145 140 150 155 161 - - 205 200 185 190 200 205
Marina Square - - - - 80 85 100 105 - - - - 110 130 140 148 - - - - 140 170 175 185
Saadiyat Beach - - - - - 110 120 130 - - - - - 150 175 179 - - - - - 190 210 233
Shams Abu Dhabi - - - 95 95 110 115 115 - - - 130 130 150 155 154 - - - 165 165 170 195 193
MID & LOWER END PROPERTIES
Abu Dhabi Island Central Abu Dhabi 145 85 70 60 55 70 75 76 215 120 100 80 100 100 105 103 265 145 145 110 90 140 145 148
Corniche 155 120 95 80 70 80 80 86 225 145 145 120 100 105 120 125 325 175 175 155 130 155 170 165
Khalidya / Bateen 155 120 100 75 65 80 80 81 225 130 130 95 90 110 120 121 325 170 170 125 110 135 145 146
Investment Areas Reef Downtown - - - - 60 70 80 83 - - - - 75 85 100 104 - - - - 90 100 130 130
Off Island MBZ & Khalifa City A - 75 55 40 40 60 65 70 - 90 60 45 45 85 90 95 - 115 80 70 65 110 120 126
Average 165 111 95 85 83 94 101 105 246 135 131 121 113 130 141 146 323 179 178 162 148 175 189 194
Annual % Change - -32% -15% -11% -2% 14% 8% 4% - -45% -3% -8% -6% 15% 8% 4% - -45% -1% -9% -9% 18% 8% 3%
% Change since peak (2008) -36% -41% -40%
% Change since market low (2012) 27% 29% 31%
+4% +4%+7% +6%
2015 yearly % change
High End Apartments
Prime Apartments
Mid & Lower End
Apartments(All figures in AED 000’s pa)
UAE Real Estate Report - Q4 2015
Abu Dhabi
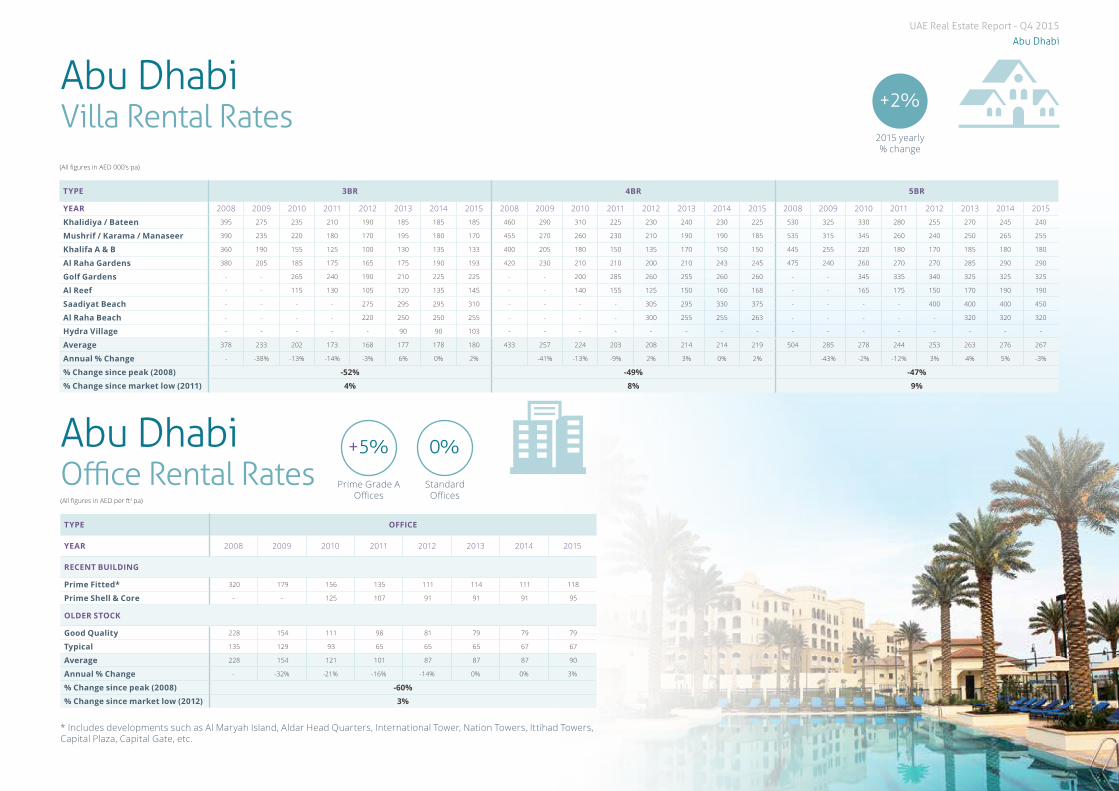
Abu Dhabi Villa Rental Rates
TYPE 3BR 4BR 5BR
YEAR 2008 2009 2010 2011 2012 2013 2014 2015 2008 2009 2010 2011 2012 2013 2014 2015 2008 2009 2010 2011 2012 2013 2014 2015
Khalidiya / Bateen 395 275 235 210 190 185 185 185 460 290 310 225 230 240 230 225 530 325 330 280 255 270 245 240
Mushrif / Karama / Manaseer 390 235 220 180 170 195 180 170 455 270 260 230 210 190 190 185 535 315 345 260 240 250 265 255
Khalifa A & B 360 190 155 125 100 130 135 133 400 205 180 150 135 170 150 150 445 255 220 180 170 185 180 180
Al Raha Gardens 380 205 185 175 165 175 190 193 420 230 210 210 200 210 243 245 475 240 260 270 270 285 290 290
Golf Gardens - - 265 240 190 210 225 225 - - 200 285 260 255 260 260 - - 345 335 340 325 325 325
Al Reef - - 115 130 105 120 135 145 - - 140 155 125 150 160 168 - - 165 175 150 170 190 190
Saadiyat Beach - - - - 275 295 295 310 - - - - 305 295 330 375 - - - - 400 400 400 450
Al Raha Beach - - - - 220 250 250 255 - - - - 300 255 255 263 - - - - - 320 320 320
Hydra Village - - - - - 90 90 103 - - - - - - - - - - - - - - - -
Average 378 233 202 173 168 177 178 180 433 257 224 203 208 214 214 219 504 285 278 244 253 263 276 267
Annual % Change - -38% -13% -14% -3% 6% 0% 2% -41% -13% -9% 2% 3% 0% 2% -43% -2% -12% 3% 4% 5% -3%
% Change since peak (2008) -52% -49% -47%
% Change since market low (2011) 4% 8% 9%
Abu Dhabi Office Rental RatesTYPE OFFICE
YEAR 2008 2009 2010 2011 2012 2013 2014 2015
RECENT BUILDING
Prime Fitted* 320 179 156 135 111 114 111 118
Prime Shell & Core - - 125 107 91 91 91 95
OLDER STOCK
Good Quality 228 154 111 98 81 79 79 79
Typical 135 129 93 65 65 65 67 67
Average 228 154 121 101 87 87 87 90
Annual % Change - -32% -21% -16% -14% 0% 0% 3%
% Change since peak (2008) -60%
% Change since market low (2012) 3%
+5% 0%
Prime Grade A Offices
Standard Offices
(All figures in AED 000’s pa)
(All figures in AED per ft2 pa)
+2%
2015 yearly % change
* Includes developments such as Al Maryah Island, Aldar Head Quarters, International Tower, Nation Towers, Ittihad Towers, Capital Plaza, Capital Gate, etc.
UAE Real Estate Report - Q4 2015
12 © Asteco Property Management, 2016
950
600
560
520
540
745
845
836
1,37
5
1,55
0
1,55
0
600
660
660
1,19
0
900
825
770
730
890
1,11
5
1,11
5
1,20
0
860
850
810
770
870
1,02
0
1,02
0
1,75
0
1,10
0
900
975
925
1,17
5
1,42
5
1,50
0
1,75
0
1,10
0
900
1,01
5
930
1,17
5
1,20
0
1,30
0
500
550
825
1,00
0
1,02
5
2.45
0
1,25
0
1,25
0
1,13
0
1,05
0
1,32
5
1,47
5
1,50
0
2,00
0
1,02
5
1,02
5
1,00
0
965
1,17
5
1,37
5
1,37
5
1,75
0
1,35
0
1,30
0
1,22
5
1,10
0
1,42
5
1,55
0
1,65
0
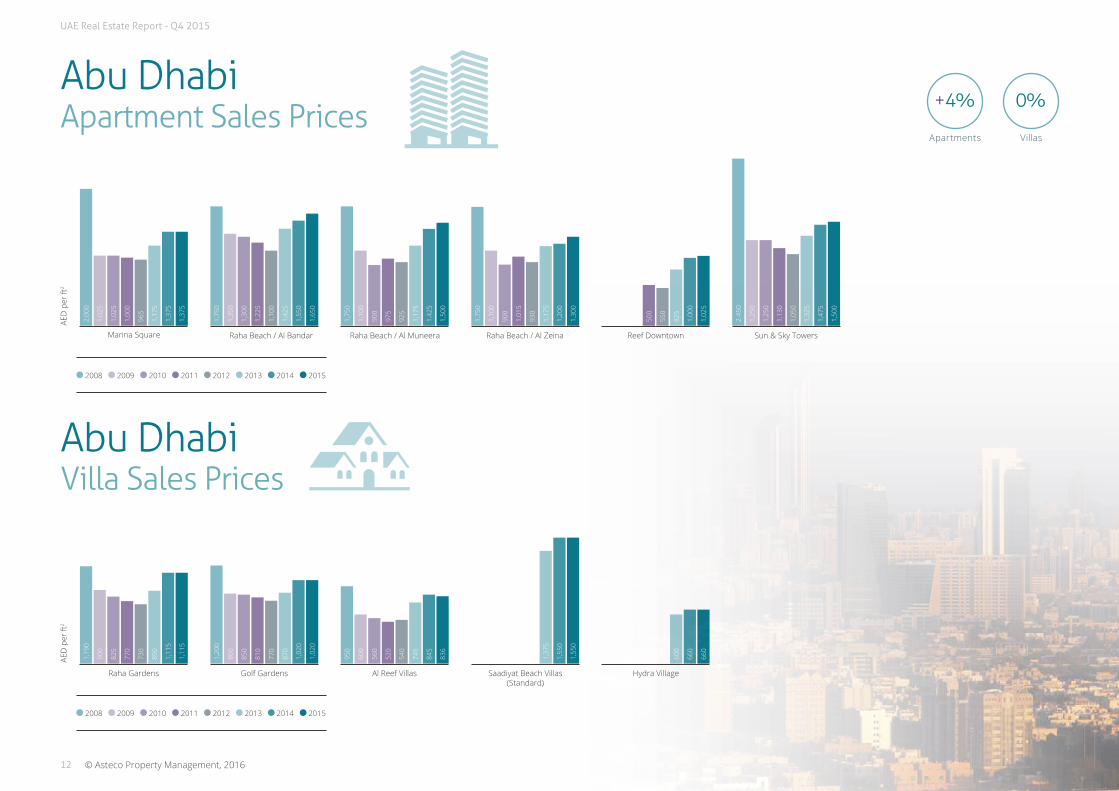
Abu Dhabi Apartment Sales Prices
Abu Dhabi Villa Sales Prices
+4% 0%
Apartments Villas
2008 2009 2010 2011 2012 2013 2014 2015
AED
per
ft2
Marina Square Raha Beach / Al Bandar Raha Beach / Al Muneera Raha Beach / Al Zeina Reef Downtown Sun & Sky Towers
AED
per
ft2
Raha Gardens Golf Gardens Al Reef Villas Saadiyat Beach Villas(Standard)
Hydra Village
2008 2009 2010 2011 2012 2013 2014 2015
UAE Real Estate Report - Q4 2015
13© Asteco Property Management, 2016
Abu Dhabi
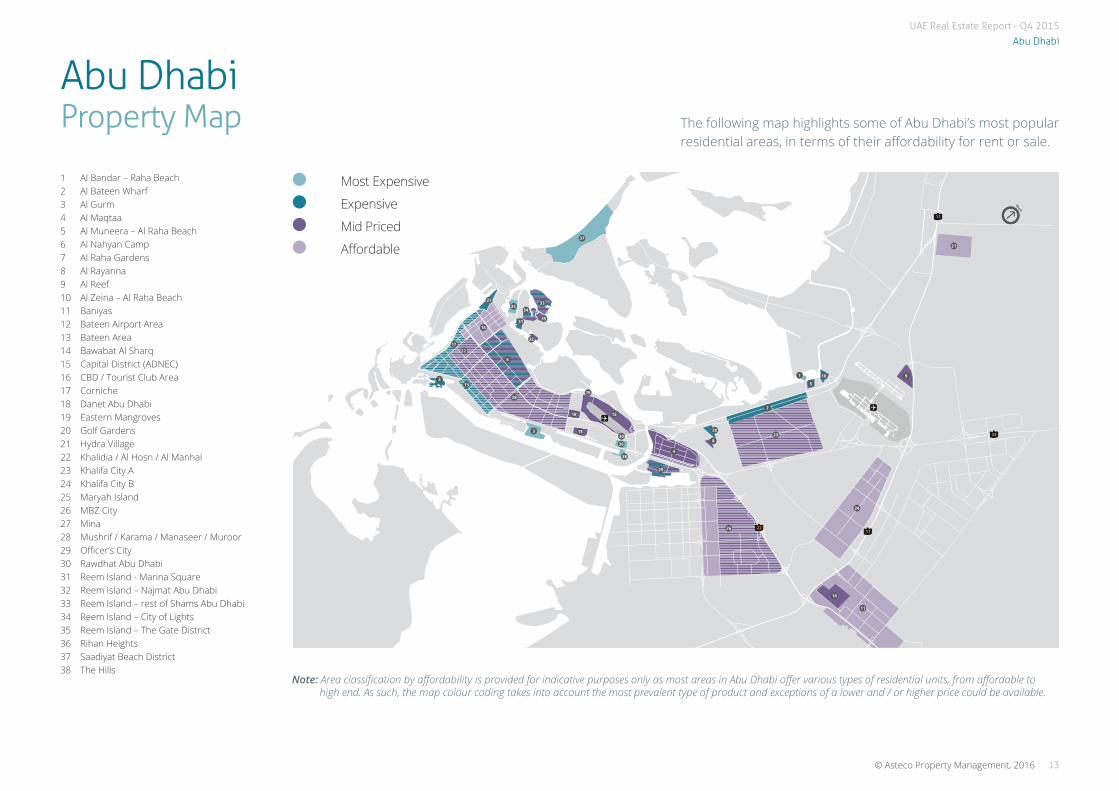
Abu Dhabi Property Map
1 Al Bandar – Raha Beach2 Al Bateen Wharf3 Al Gurm4 Al Maqtaa5 Al Muneera – Al Raha Beach6 Al Nahyan Camp7 Al Raha Gardens8 Al Rayanna9 Al Reef10 Al Zeina – Al Raha Beach11 Baniyas12 Bateen Airport Area13 Bateen Area14 Bawabat Al Sharq15 Capital District (ADNEC)16 CBD / Tourist Club Area17 Corniche 18 Danet Abu Dhabi19 Eastern Mangroves20 Golf Gardens21 Hydra Village22 Khalidia / Al Hosn / Al Manhal23 Khalifa City A24 Khalifa City B25 Maryah Island26 MBZ City27 Mina28 Mushrif / Karama / Manaseer / Muroor29 Officer’s City30 Rawdhat Abu Dhabi31 Reem Island - Marina Square32 Reem Island – Najmat Abu Dhabi33 Reem Island – rest of Shams Abu Dhabi34 Reem Island – City of Lights35 Reem Island – The Gate District36 Rihan Heights37 Saadiyat Beach District38 The Hills
The following map highlights some of Abu Dhabi’s most popular residential areas, in terms of their affordability for rent or sale.
YASISLAND
11
33
2211
14
11
17
132
22
31
25
19
33
35
34
32
37
36
38
29
15
18
28
24
6
12
4
26
2320
8
1
7
10 9
5
30
27
16
3
21
Most Expensive
Expensive
Mid Priced
Affordable
Note: Area classification by affordability is provided for indicative purposes only as most areas in Abu Dhabi offer various types of residential units, from affordable to high end. As such, the map colour coding takes into account the most prevalent type of product and exceptions of a lower and / or higher price could be available.

UAE Real Estate Report - Q4 2015
14 © Asteco Property Management, 2016

UAE Real Estate Report - Q4 2015
15© Asteco Property Management, 2016
Dubai
DubaiHistoric Review & Outlook
Growth 2002-2008
Recession 2009-2011
Recovery & Growth 2012-2013
Stabilisation and slow down 2014-2015
Outlook 2016
• Since the Dubai Government permitted the ownership of property on a freehold/leasehold basis to non-GCC nationals in 2002, the overseas interest in the local market was exceptional and resulted in the launch of numerous development projects.
• Nakheel, Dubai Properties and Emaar established themselves as the dominant master developers in the market launching a range of property projects across Dubai.
• However, the delivery of the properties in Dubai was slower than anticipated, which resulted in an undersupply causing both rental rates and sales prices to spiral out of control.
• Sales prices were further inflated due to rampant speculation in the market due to limited real estate laws being in place to curb speculation in the market.
• The financial crisis at the end of 2008 resulted in significant job losses, defaults, distressed sales and consequently declining rental rates and sales prices.
• Residential sales prices and rental rates corrected sharply in 2009 and 2010 compounded by an increased supply and a subdued demand. There was also a noticeable movement with tenants from neighbouring emirates such as Abu Dhabi and Sharjah due to the decreased rental rates in Dubai.
• Sales activity remained subdued although transaction levels slowly picked up by 2011 when the market reached its low point.
• The market began to show signs of recovery in 2012. With the Euro Crisis and Arab Spring making Dubai an attractive and ’safe’ haven to invest and live.
• Established communities and quality buildings experienced increased demand whilst emerging developments saw increased take-up in line with improving infrastructure and connectivity.
• The increase in competitive finance options offered by banks also contributed to the overall increase in activity.
• Rent rapidly increased in 2013 and restricted tenants to move within Dubai and thus resulted in an increase in relocations to the Northern Emirates in search of lower rental accommodation.
• Transaction levels increased as job security and increased market confidence created demand for tenants to upgrade, and readily available finance stimulated home ownership.
• In 2013 Dubai was awarded to host Expo 2020 and this announcement saw an increase in new project launches near the Expo site whilst the DWC Airport masterplan experienced increased demand.
• In September 2013, the Government doubled the land registration fee to 4%, and new loan-to-value rules were introduced to limit property speculation.
• The market peaked in Q2 2014 and corrected thereafter due to a combination of factors such as, the doubling of the registration fee to 4%, the reduction in LTV’s, low oil prices and the US dollar being strong.
• The correction was especially marked for residential sales prices; with rental rates remaining broadly stable as the handover of new supply was slower than anticipated.
• Due to the substantial number of launches witnessed in 2013, 2014 and 2015, concerns of an oversupply forced developers to focus predominantly on the mid and affordable housing sectors.
• To try and stimulate buyer’s interest, developers began offering incentives such as extended payment plans post completion, which potentially increased the risk of non-delivery due to insufficient funding.
• Whilst oversupply in the high and luxury segments are expected for both villas and apartments, the affordable housing segments, including staff and labour accommodation continue to be undersupplied.
• As supply is progressively delivered during 2016, rental rates are expected to reduce, which will potentially result in an increase in tenant relocations.
• Furthermore, acceleration in construction activity for completion of major infrastructure projects near Dubai World Central, such as Al Maktoum International Airport and Expo 2020, are also expected to lead to growing demand over the medium to longer term.

UAE Real Estate Report - Q4 2015
16 © Asteco Property Management, 2016
Dubai2015 Highlights
Leasing Sales
Resi
dent
ial
high
light
s Apartments
• With supply handover slower than anticipated in 2015, rental rates remained broadly stable over the year (-1% on average), although disparities amongst areas were recorded.
• Some of the few communities that benefited from year-on-year rental increases were the more affordable, but improving areas, such as Jumeirah Village, Dubai Sports City and Dubai Silicon Oasis where rates increased by 6%, 10%, 5% respectively.
• At the higher end of the market rates were down by 4% on average with Shekh Zayed Road recording the highest drop of over 10%.
Villas
• 2015 saw a substantial amount of villas being handed over in Jumeirah Park, Mudon and Arabian Ranches Phase 2, which resulted in a sharp correction as Arabian Ranches and Jumeirah Park both recorded 12% decline since Q4 2014.
• The rate of decline, however, slowed down during the last quarter of 2015 as occupancy levels improved, and some of the newly handed over communities even witnessed modest rent increases.
• Higher budget locations such as Jumeirah and Umm Suqeim also suffered, recording drops of over 10% over the year as many of the tenants left the country or had reduced housing allowances. In addition, substantial new supply in the area has been delivered, forcing property owners, specially of older villas, to become increasingly competitive on pricing.
Apartments
• 2015 saw developers offering more affordable product options after it became apparent that there was still a significant gap in this market sector.
• However, most of the ‘affordable’ options for sale appeared to be overpriced for a large majority of Dubai’s residents and, instead, many of the properties were bought by investors.
• Transaction levels were, however, relatively slow for off-plan stock, which saw some developers willing to absorb the 4% registration fee and offer, extended payment plans or guaranteed returns to stimulate demand.
Villas
• End-users, rather than investors, were the predominant buyers of villas and townhouses, with a clear preference for smaller 2, 3 and 4 bedroom units, rather than large villas.
• New communities such as Mudon and Arabian Ranches Phase 2 saw improved levels of activity, offering better-priced yet good quality alternatives to some of the more established areas, as well as specific developments with prices starting as low as AED1.6 million for 3 bedroom townhouses.
• Prime villas were less in demand, with, for example, Palm Jumeirah prices recording decline of 13% over the year.
Offi
ce
high
light
s • The first half of the year saw improved levels of demand as rental rates increased in selected areas. However, the second half of 2015 saw a relative slowdown as the majority of enquiries and deals targeted small and medium sized offices rather than larger office space.
• Preference remained for good quality and efficient single-owned buildings and some free zone areas witnessed strong demand with a resultant increase in rental rates.
• Demand for office purchases reduced with potential buyers ready to complete transactions at below asking rates. Whilst in Q3 sellers were unwilling to negotiate their asking prices, Q4 saw them more willing to do so, which resulted in a modest drop in values. However, a similar number of transactions were recorded as in Q4 2014.
• Office transactions were predominantly concentrated in areas in Jumeirah Lake Towers and Business Bay, which represented over two thirds of the market, and fewer deals in DIFC, Emaar Square and Tecom C.
Supply completedin 2015
13,500 Apartments
800 Villas andTown houses
500,000 sq m Office space (BUA)
The second quarter of 2014 saw rental rates and residential sales prices peak followed by a progressive decline in values during the course of 2015. Developers responded by offering more affordable mid-market products, which was supported by attractive extended payment plans and other incentives to stimulate transactions resulting in a mixed response from the market, particularly in Q4 2015.
Selection of projects completed in 2015
RESIDENTIAL Affordable• IMPZ: Lakeside Tower – 1,936 Units• IMPZ: Qasr Sabah – 402 Units• Jumeirah Village: +/- 795 Units
Mid-End• Dubiotech: Three Towers – 864 Units• Culture Village: Nastaran Tower – 300 Units• Business Bay: ENI Coral Tower – 145 Units
High-End• DIFC: Central Park Towers – 426 Units• Jumeirah Golf Estates: 188 Villas• Culture Village: D1 Tower – 518 Units• Dubai Marina: Dream Tower – 216 Units
COMMERCIAL
• Dubai Design District• Emirates Financial Towers• Dubai South Office Park• JLT One Tower

UAE Real Estate Report - Q4 2015
Xxx
17© Asteco Property Management, 2016
Dubai2016 Outlook Supply expected
in 2016
22,000 Apartments
7,700 Villas andTown houses
1,100,000 sq m Office space (BUA)
Substantial supply expected for delivery in 2015 was delayed and is likely to be handed over progressively during the course of 2016. This increase in supply together with a slowing demand and continued low oil prices mean that 2016 is expected to see both rental rates and sales prices come under further pressure. Nonetheless, the medium to long term outlook seems more positive as demand is likely to grow in line with the progress of key infrastructure projects currently underway, such as Dubai World Central Airport and Expo 2020 amongst others.
Selection of projects expected in 2016
RESIDENTIAL Affordable• DIP: Dubai Lagoons – 442 Units• JVC: Hanover Square – 414 Units
Mid-End• Culture Village: Niloofar Tower – 170 Units
High-End• Dubai Land: Living Legends – 500 Villas• Dubai Marina: Marina 101 – 506 Units• Acacia Heights: Hiliana Tower – 174 Units• Palm Jumeirah: Balqis Residence – 300 Units• Meydan City: Millennium Estates – 198 Villas• Meydan City: Polo Townhouses – 106 Villas
COMMERCIAL• Dubai Media City: The Edge• Sheikh Zayed Road: Lamborghini Building
Leasing Sales
Resi
dent
ial
high
light
s • Rental performance in 2016 will be highly dependent on the timely delivery of supply. Assuming the anticipated supply is handed over on time, rental rates are likely to come under pressure over the course of not only 2016, but also 2017 onwards.
• This drop in rates will be beneficial to tenants who will be able to negotiate better terms upon contract renewal.
• In addition, the reduction in rates could also assist in unlocking demand from some of the many households sharing housing accommodation who could now potentially afford their own.
• For property owners, adjustments in terms of rental expectations and payment flexibility will have to be made. And, as usual in cases of increased supply, better quality, well managed or good-value-for-money properties will be able to achieve higher occupancy levels than others.
• The trend of falling prices began in 2015 and is expected to continue during the course of 2016, albeit at a more moderate pace as rates in several developments have already declined sufficiently to encourage deals concluding.
• With several of the previously launched off-plan projects coming closer to completion, we expect a regain in interest for those properties, leading to higher transaction levels.
• As in 2015, smaller units will be preferred to larger ones, with stable transaction levels for studio and 1BR apartments as well as smaller 1BR, 2BR and 3BR townhouses and villas.
• Sales for large, premium units are likely to remain subdued during 2016 as buyers are few.
• Finally, the US Federal Reserve’s raise in interest rates in December 2015 could lead to slightly higher finance costs and thus increased lending costs for end-users.
Offi
ce
high
light
s • Most of the new supply expected to enter the market during 2016 consists of strata-owned buildings located in Dubai’s main office areas, namely Business Bay and Jumeirah Lake Towers. This could lead to a reduction in asking rates for the new buildings to encourage absorption, which would directly reflect upon existing stock in the areas – especially poorer quality.
• At the same time, with limited quality, single-owned supply entering the market and pent-up demand from larger corporates still present, this segment of the market is likely to see relative stability during 2016.
• The office sales sector is expected to face an overall slower demand, especially from investors who are likely to be deterred from investing in Dubai amidst concerns of economic slowdown.
• Most demand will originate from end-users buying for self-use, especially in Business Bay and Jumeirah Lake Towers – popular with south Asian businesses and SMEs, whereas small office space in DIFC will remain popular with private family offices.
• In terms of sales prices, Asteco expects a moderate softening only, as buyers appear resilient and are willing to hold onto their units, even if they remain empty, rather than selling at discounted rates. In some cases, sellers will also consider letting units with the hope of selling as and when the market improves.
UAE Real Estate Report - Q4 2015
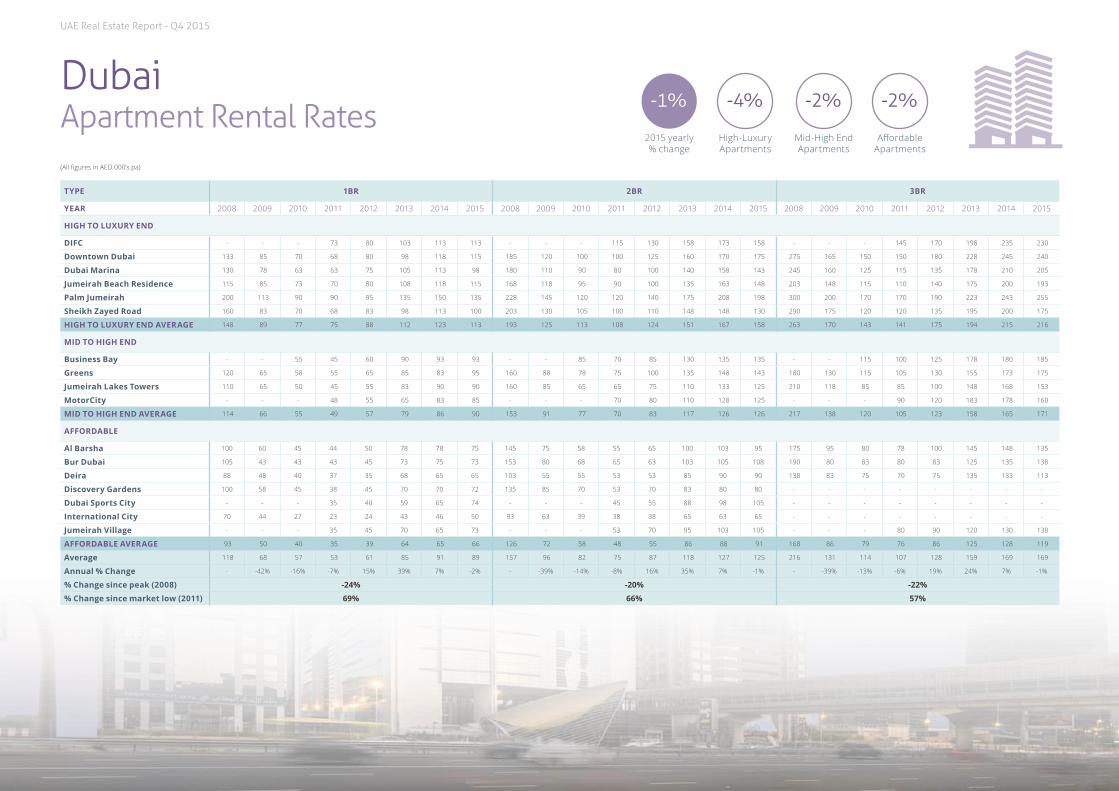
Dubai Apartment Rental Rates
-1% -2%-4% -2%
2015 yearly % change
Mid-High End Apartments
High-Luxury Apartments
Affordable Apartments
TYPE 1BR 2BR 3BR
YEAR 2008 2009 2010 2011 2012 2013 2014 2015 2008 2009 2010 2011 2012 2013 2014 2015 2008 2009 2010 2011 2012 2013 2014 2015
HIGH TO LUXURY END
DIFC - - - 73 80 103 113 113 - - - 115 130 158 173 158 - - - 145 170 198 235 230
Downtown Dubai 133 85 70 68 80 98 118 115 185 120 100 100 125 160 170 175 275 165 150 150 180 228 245 240
Dubai Marina 130 78 63 63 75 105 113 98 180 110 90 80 100 140 158 143 245 160 125 115 135 178 210 205
Jumeirah Beach Residence 115 85 73 70 80 108 118 115 168 118 95 90 100 135 163 148 203 148 115 110 140 175 200 193
Palm Jumeirah 200 113 90 90 95 135 150 135 228 145 120 120 140 175 208 198 300 200 170 170 190 223 243 255
Sheikh Zayed Road 160 83 70 68 83 98 113 100 203 130 105 100 110 148 148 130 290 175 120 120 135 195 200 175
HIGH TO LUXURY END AVERAGE 148 89 77 75 88 112 123 113 193 125 113 108 124 151 167 158 263 170 143 141 175 194 215 216
MID TO HIGH END
Business Bay - - 55 45 60 90 93 93 - - 85 70 85 130 135 135 - - 115 100 125 178 180 185
Greens 120 65 58 55 65 85 83 95 160 88 78 75 100 135 148 143 180 130 115 105 130 155 173 175
Jumeirah Lakes Towers 110 65 50 45 55 83 90 90 160 85 65 65 75 110 133 125 210 118 85 85 100 148 168 153
MotorCity - - - 48 55 65 83 85 - - - 70 80 110 128 125 - - - 90 120 183 178 160
MID TO HIGH END AVERAGE 114 66 55 49 57 79 86 90 153 91 77 70 83 117 126 126 217 138 120 105 123 158 165 171
AFFORDABLE
Al Barsha 100 60 45 44 50 78 78 75 145 75 58 55 65 100 103 95 175 95 80 78 100 145 148 135
Bur Dubai 105 43 43 43 45 73 75 73 153 80 68 65 63 103 105 108 190 80 83 80 83 125 135 138
Deira 88 48 40 37 35 68 65 65 103 55 55 53 53 85 90 90 138 83 75 70 75 135 133 113
Discovery Gardens 100 58 45 38 45 70 70 72 135 85 70 53 70 83 80 80 - - - - - - - -
Dubai Sports City - - - 35 40 59 65 74 - - - 45 55 88 98 105 - - - - - - - -
International City 70 44 27 23 24 43 46 50 93 63 39 38 38 65 63 65 - - - - - - - -
Jumeirah Village - - - 35 45 70 65 73 - - - 53 70 95 103 105 - - - 80 90 120 130 138
AFFORDABLE AVERAGE 93 50 40 35 39 64 65 66 126 72 58 48 55 86 88 91 168 86 79 76 86 125 128 119
Average 118 68 57 53 61 85 91 89 157 96 82 75 87 118 127 125 216 131 114 107 128 159 169 169
Annual % Change - -42% -16% -7% 15% 39% 7% -2% - -39% -14% -8% 16% 35% 7% -1% - -39% -13% -6% 19% 24% 7% -1%
% Change since peak (2008) -24% -20% -22%
% Change since market low (2011) 69% 66% 57%
(All figures in AED 000’s pa)
UAE Real Estate Report - Q4 2015
Dubai
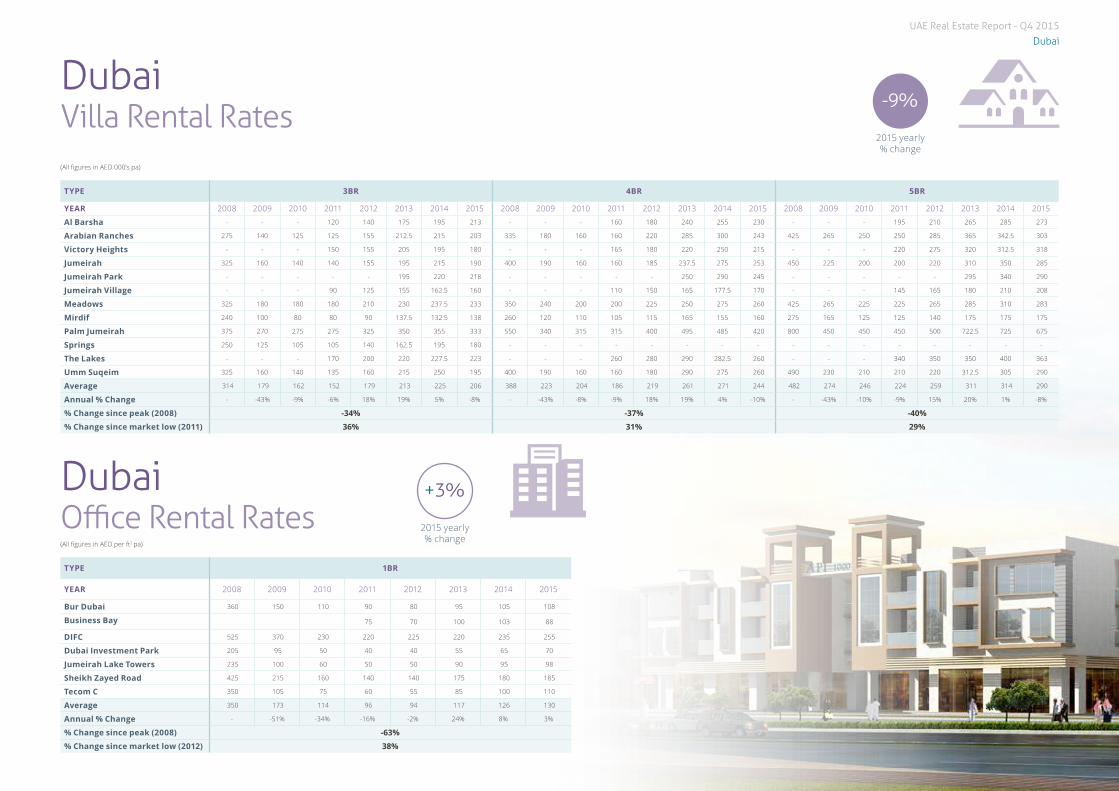
Dubai Villa Rental Rates
TYPE 3BR 4BR 5BR
YEAR 2008 2009 2010 2011 2012 2013 2014 2015 2008 2009 2010 2011 2012 2013 2014 2015 2008 2009 2010 2011 2012 2013 2014 2015
Al Barsha - - - 120 140 175 195 213 - - - 160 180 240 255 230 - - - 195 210 265 285 273
Arabian Ranches 275 140 125 125 155 212.5 215 203 335 180 160 160 220 285 300 243 425 265 250 250 285 365 342.5 303
Victory Heights - - - 150 155 205 195 180 - - - 165 180 220 250 215 - - - 220 275 320 312.5 318
Jumeirah 325 160 140 140 155 195 215 190 400 190 160 160 185 237.5 275 253 450 225 200 200 220 310 350 285
Jumeirah Park - - - - - 195 220 218 - - - - - 250 290 245 - - - - - 295 340 290
Jumeirah Village - - - 90 125 155 162.5 160 - - - 110 150 165 177.5 170 - - - 145 165 180 210 208
Meadows 325 180 180 180 210 230 237.5 233 350 240 200 200 225 250 275 260 425 265 225 225 265 285 310 283
Mirdif 240 100 80 80 90 137.5 132.5 138 260 120 110 105 115 165 155 160 275 165 125 125 140 175 175 175
Palm Jumeirah 375 270 275 275 325 350 355 333 550 340 315 315 400 495 485 420 800 450 450 450 500 722.5 725 675
Springs 250 125 105 105 140 162.5 195 180 - - - - - - - - - - - - - - - -
The Lakes - - - 170 200 220 227.5 223 - - - 260 280 290 282.5 260 - - - 340 350 350 400 363
Umm Suqeim 325 160 140 135 160 215 250 195 400 190 160 160 180 290 275 260 490 230 210 210 220 312.5 305 290
Average 314 179 162 152 179 213 225 206 388 223 204 186 219 261 271 244 482 274 246 224 259 311 314 290
Annual % Change - -43% -9% -6% 18% 19% 5% -8% - -43% -8% -9% 18% 19% 4% -10% - -43% -10% -9% 15% 20% 1% -8%
% Change since peak (2008) -34% -37% -40%
% Change since market low (2011) 36% 31% 29%
Dubai Office Rental RatesTYPE 1BR
YEAR 2008 2009 2010 2011 2012 2013 2014 2015
Bur Dubai 360 150 110 90 80 95 105 108
Business Bay 75 70 100 103 88
DIFC 525 370 230 220 225 220 235 255
Dubai Investment Park 205 95 50 40 40 55 65 70
Jumeirah Lake Towers 235 100 60 50 50 90 95 98
Sheikh Zayed Road 425 215 160 140 140 175 180 185
Tecom C 350 105 75 60 55 85 100 110
Average 350 173 114 96 94 117 126 130
Annual % Change - -51% -34% -16% -2% 24% 8% 3%
% Change since peak (2008) -63%
% Change since market low (2012) 38%
+3%
2015 yearly % change
(All figures in AED 000’s pa)
(All figures in AED per ft2 pa)
-9%
2015 yearly % change

UAE Real Estate Report - Q4 2015
20 © Asteco Property Management, 2016
Business Bay
2,05
0
2,70
0
1,00
075
070
090
01,
225
1,21
01,
300
DIFC
1,60
01,
500
1,30
01,
350
1,87
5
1,70
01,
875
Discovery Gardens
1,25
055
050
045
045
082
5
850
885
Downtown Dubai
2,70
01,
400
1,30
01,
100
1,30
02,
200
2,20
02,
325
Dubai Marina
1,80
01,
100
1,00
092
51,
050
1,90
0
1,60
01,
750
Greens
1,70
01,
050
825
775
950
1,40
0
1,36
51,
375
International City
1,05
050
042
532
535
067
5
688
710
JBR
2,00
01,
100
925
925
1,00
01,
525
1,37
01,
625
JLT
1,40
085
070
065
075
01,
200
1,15
01,
250
Jumeirah Village
1,10
060
050
047
550
087
5
938
925
Palm Jumeirah
2,80
01,
500
1,17
51,
100
1,40
02,
000
1,72
02,
000
Dubai Apartment Sales Prices
Dubai Villa Sales Prices
Dubai Office Sales Prices
-11%-8% 0%
VillasApartments Offices
AED
per
ft2
AED
per
ft2
AED
per
ft2
Arabian Ranches Business Bay
2,20
0
2,20
0
1,50
0
4,25
0
850
1,25
0
750
900
750
750
950
700
1,22
5
975
1,00
0
1,25
0
1,15
0
1,22
5
Dubai Sports City DIFC
850
1,90
0
750
1,90
0
750
1,80
0
900
1,70
0
1,12
5
1,80
0
1,15
0
1,92
5
1,25
0
1,87
5
Jumeirah Park
1,50
072
565
055
080
01,
175
1,11
01,
175
Jumeirah Village
1,10
060
050
047
555
085
0
950
975
Meadows
2,20
01,
000
850
850
1,00
01,
300
1,15
01,
350
Palm Jumeirah
2,75
01,
800
1,55
01,
500
1,80
03,
000
2,47
52,
850
Springs
1,80
085
065
065
090
01,
100
950
1,07
5
2008 2009 2010 2011 2012 2013 2014 2015
2008 2009 2010 2011 2012 2013 2014 2015 2008 2009 2010 2011 2012 2013 2014 2015
Jumeirah Lake Towers
2,00
090
065
055
055
092
5
975
1,07
5
Tecom C
2,50
01,
100
850
750
750
825
975
975

UAE Real Estate Report - Q4 2015
21© Asteco Property Management, 2016
Dubai
1 Akoya2 Al Barari3 Al Furjan4 Al Nahda5 Al Qusais6 Al Warqaa7 Arabian Ranches8 Barsha9 Bur Dubai10 Business Bay11 Culture Village12 Deira13 DIFC14 Discovery Gardens15 Downtown Dubai16 Downtown Jebel Ali17 Dubai Creek18 Dubai Hills19 Dubai Investment Park20 Dubai Land
Residential Complex21 Dubai Marina22 Dubai Silicon Oasis23 Dubai Sports City24 Dubailand25 Emirates Hills26 Green Community27 IMPZ28 International City29 JBR30 Jumeirah31 Jumeirah Golf Estates32 Jumeirah Islands33 Jumeirah Park34 Jumeirah Village35 Jumeirah Lakes Towers36 Living Legends37 Liwan38 Maritime City39 Meydan40 Mirdif41 MotorCity
42 Mudon43 Muhaisnah44 Palm Jumeirah45 Remraam46 Residential City47 Rigga Al Buteen48 Sheikh Zayed Road49 Springs / Meadows50 Studio City51 Tecom C52 The Greens53 The Lakes54 The Villa55 Town Square56 Umm Suqeim57 Uptown Mirdiff58 Victory Heights
Note: Area classification by affordability is provided for indicative purposes only as many areas in Dubai offer various types of residential units, from affordable to high end. As such, the map colour coding takes into account the most prevalent type of product and exceptions of a lower and / or higher price could be available.
Most Expensive
Expensive
Mid Priced
Affordable
611
611
311
11
11
11
11
44
44
44
311
311
311
611
611
29
21
35
3
1433
8
56
26
16
31
46
19
2358
41
50
7
45
1
42
55
36 2
18
24
34
27
2254
37
20
28
57
40
44
52
25
53
49
32
51
15
39
10
309
38
13
48 12
47
4
5
6
43
11
17
To SharjahTo Abu Dhabi
Arabian Gulf
Dubai Property Map
2008 2009 2010 2011 2012 2013 2014 2015
UAE Real Estate Report - Q4 2015
22 © Asteco Property Management, 2016
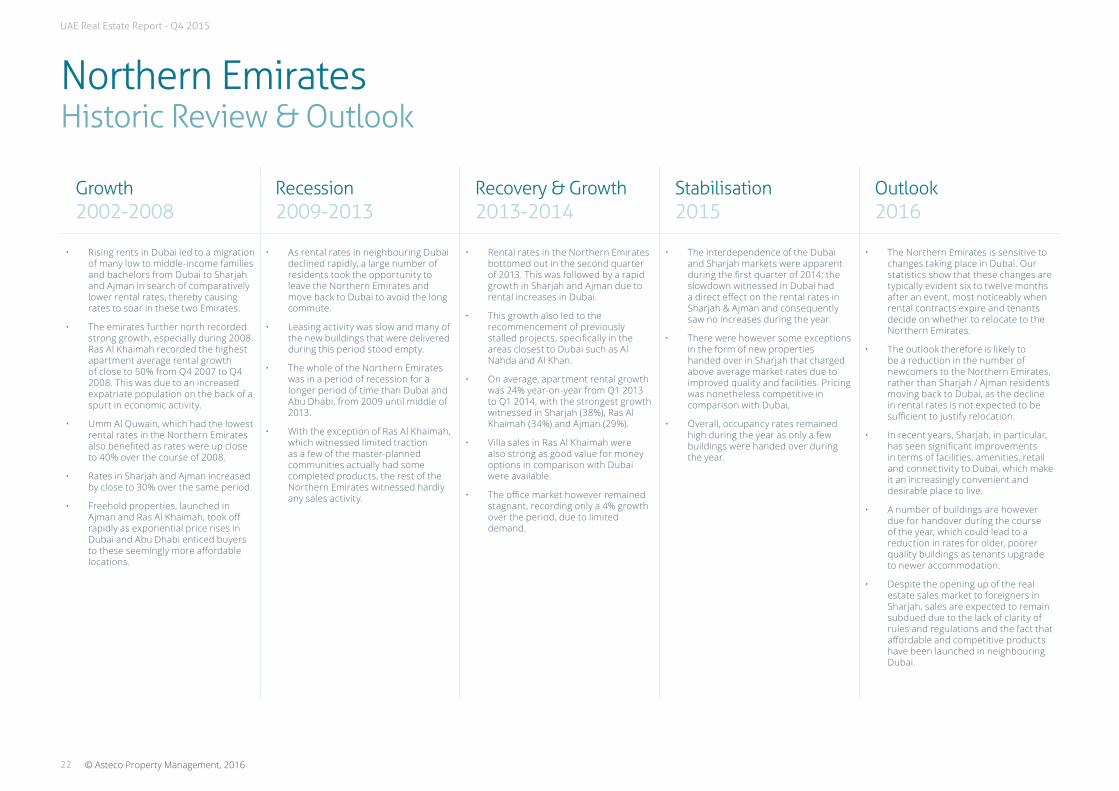
Northern EmiratesHistoric Review & Outlook
Growth 2002-2008
Recession 2009-2013
Recovery & Growth 2013-2014
Stabilisation 2015
Outlook 2016
• Rising rents in Dubai led to a migration of many low to middle-income families and bachelors from Dubai to Sharjah and Ajman in search of comparatively lower rental rates, thereby causing rates to soar in these two Emirates.
• The emirates further north recorded strong growth, especially during 2008. Ras Al Khaimah recorded the highest apartment average rental growth of close to 50% from Q4 2007 to Q4 2008. This was due to an increased expatriate population on the back of a spurt in economic activity.
• Umm Al Quwain, which had the lowest rental rates in the Northern Emirates also benefited as rates were up close to 40% over the course of 2008.
• Rates in Sharjah and Ajman increased by close to 30% over the same period.
• Freehold properties, launched in Ajman and Ras Al Khaimah, took off rapidly as exponential price rises in Dubai and Abu Dhabi enticed buyers to these seemingly more affordable locations.
• As rental rates in neighbouring Dubai declined rapidly, a large number of residents took the opportunity to leave the Northern Emirates and move back to Dubai to avoid the long commute.
• Leasing activity was slow and many of the new buildings that were delivered during this period stood empty.
• The whole of the Northern Emirates was in a period of recession for a longer period of time than Dubai and Abu Dhabi, from 2009 until middle of 2013.
• With the exception of Ras Al Khaimah, which witnessed limited traction as a few of the master-planned communities actually had some completed products, the rest of the Northern Emirates witnessed hardly any sales activity.
• Rental rates in the Northern Emirates bottomed out in the second quarter of 2013. This was followed by a rapid growth in Sharjah and Ajman due to rental increases in Dubai.
• This growth also led to the recommencement of previously stalled projects, specifically in the areas closest to Dubai such as Al Nahda and Al Khan.
• On average, apartment rental growth was 24% year-on-year from Q1 2013 to Q1 2014, with the strongest growth witnessed in Sharjah (38%), Ras Al Khaimah (34%) and Ajman (29%).
• Villa sales in Ras Al Khaimah were also strong as good value for money options in comparison with Dubai were available.
• The office market however remained stagnant, recording only a 4% growth over the period, due to limited demand.
• The interdependence of the Dubai and Sharjah markets were apparent during the first quarter of 2014; the slowdown witnessed in Dubai had a direct effect on the rental rates in Sharjah & Ajman and consequently saw no increases during the year.
• There were however some exceptions in the form of new properties handed over in Sharjah that charged above average market rates due to improved quality and facilities. Pricing was nonetheless competitive in comparison with Dubai,
• Overall, occupancy rates remained high during the year as only a few buildings were handed over during the year.
• The Northern Emirates is sensitive to changes taking place in Dubai. Our statistics show that these changes are typically evident six to twelve months after an event, most noticeably when rental contracts expire and tenants decide on whether to relocate to the Northern Emirates.
• The outlook therefore is likely to be a reduction in the number of newcomers to the Northern Emirates, rather than Sharjah / Ajman residents moving back to Dubai, as the decline in rental rates is not expected to be sufficient to justify relocation.
• In recent years, Sharjah, in particular, has seen significant improvements in terms of facilities, amenities, retail and connectivity to Dubai, which make it an increasingly convenient and desirable place to live.
• A number of buildings are however due for handover during the course of the year, which could lead to a reduction in rates for older, poorer quality buildings as tenants upgrade to newer accommodation.
• Despite the opening up of the real estate sales market to foreigners in Sharjah, sales are expected to remain subdued due to the lack of clarity of rules and regulations and the fact that affordable and competitive products have been launched in neighbouring Dubai.

UAE Real Estate Report - Q4 2015
Xxx
23© Asteco Property Management, 2016
Northern EmiratesHighlights and Outlook Selection of projects
completed in 2015
• Al Nahda: Diamond Tower - 2, 105 Units• Al Tawuun: Al Mamzar Tower - 504 Units• Al Tawuun: Residential Building - 294 units• Al Khan: Residential Building - 175 Units
Selection of projects expected in 2016
• Al Nahda: Al Rayyan Complex - 504 Units• Al Khan: Pearl Tower - 360 Units• Al Qasimiyah: CG Mall Residences - 176 Units• Al Nahda: Residential Building - 480 Units
The Northern Emirates, especially Sharjah and Ajman, have always been interdependent to Dubai. However, in recent years, the dynamics are slowly changing as constant improvements in those emirates make them increasingly attractive to residents at the lower and middle income brackets.
2015 Highlights 2016 Highlights
Resi
dent
ial
high
light
s • With the exception of Fujairah, where rental rates were up by 7% compared with the same period last year, rates in the Northern Emirates came down marginally, with Sharjah, Ajman and Ras Al Khaimah recording 2%, 5% and 1% declines, respectively.
• Interestingly however, the new supply handed over in Sharjah was taken up quickly, in some cases at even higher rates than before, due to improved quality, car parking availability, and better location, facilities and amenities. For instance, in Majaz and Al Khan, a quality 3 bedroom apartment was able to achieve AED95,000 and AED105,000 per annum, respectively, in comparison with AED85,000 a few months ago.
• The rental reduction was apparent in older buildings as landlords were forced to reduce rates to retain tenants – some of which also moved to neighbouring and more affordable Ajman.
• With the introduction of new Sharjah Ownership Laws, the sales sector witnessed increased levels of interest from investors, although transaction levels were relatively subdued due to concerns of market stability and competition from Dubai where substantial amounts of affordable supply were also launched.
• Sahara Tower 4 by Al Thuriah in Al Nahda sold 2-bedroom apartments starting from AED 765,000 with 50% of payment due after completion, whereas 2-bedroom apartments at the Al Rayyan complex were sold for less than AED 1 million.
• Rental demand is expected to be stagnant in Sharjah as a reduction in prices in neighbouring Dubai will lead to a lower than usual inflow of new residents, which may be worsened by reduced government spending and potential job cuts.
• With more than 1,000 units expected to be added to the market in Sharjah in 2016, such as CG Mall Residences, Al Rayyan Complex and a variety of buildings in Al Nahda and Al Khan areas, the overall market and specifically poorer quality developments could face a downward rental pressure.
• However, over the years, Sharjah has established itself as an increasingly attractive place to live through constant investments by the Government in terms of attractions, retail and road connectivity, which is making the emirate more competitive with Dubai.
• Similarly, Ajman saw significant improvements as the Al Zorah development progressed, where the golf course is now operational and the Oberoi Hotel is set to open by the middle of 2016.
• Residential sales for the whole of the Northern Emirates are expected to be subdued as a bleak economic outlook will affect buyer’s sentiment. Only quality projects at truly affordable prices may be able to generate some traction and if proper property ownership laws and regulations are in place.
• In Ras Al Khaimah, major property handovers in 2016 will include the Pacific Beachfront development by Select Group on Marjan Island, which features 1,440 apartments. According to the developer approximately 80% of the units have been sold out. Flamingo Villas Phase 2 at Mina Al Arab, comprising 68 units ranging in sizes between 2,008 to 2,334 sqft is also expected to handover by the end of the year.
Offi
ce
high
light
s • Office rental rates remained stable during 2015, and were still 50% lower than their highest point witnessed in 2008 despite no significant supply being delivered. Demand remained subdued as few companies actively sought to establish themselves in Sharjah.
• The Sharjah Corniche area remained the most popular for office tenants, with rates achieving a maximum rate of AED80 per square foot.
• The outlook for the office sector in 2016 will be reliant on the overall economic developments in the country and wider Middle East region. Sustained low oil prices will lead to a reduction in demand, which could impact rates in Sharjah as companies seek to reduce their overhead costs.
Mar
ket
chan
ges • Whilst in 2014 Sharjah allowed a 100-year leasehold ownership to all
nationalities for land plots in the Al Tilal development, 2015 saw the launch of various residential projects whereby foreigners were, for the first time, permitted to buy property in the emirate.
• Whilst transaction levels were initially slow due to pricing, demand for property ownership in Sharjah was thought to be strong, especially from lower and middle-income residents.
• Sharjah tourism industry is developing rapidly. Several initiatives taken in 2015, such as the expansion of Majaz waterfront and the completion of Noor Island, attracted residents to buy and rent, and is expected to appeal to more tenants on a budget who wish to relocate from Dubai and the other Emirates in the medium to long term.
UAE Real Estate Report - Q4 2015
24 © Asteco Property Management, 2016
Northern Emirates
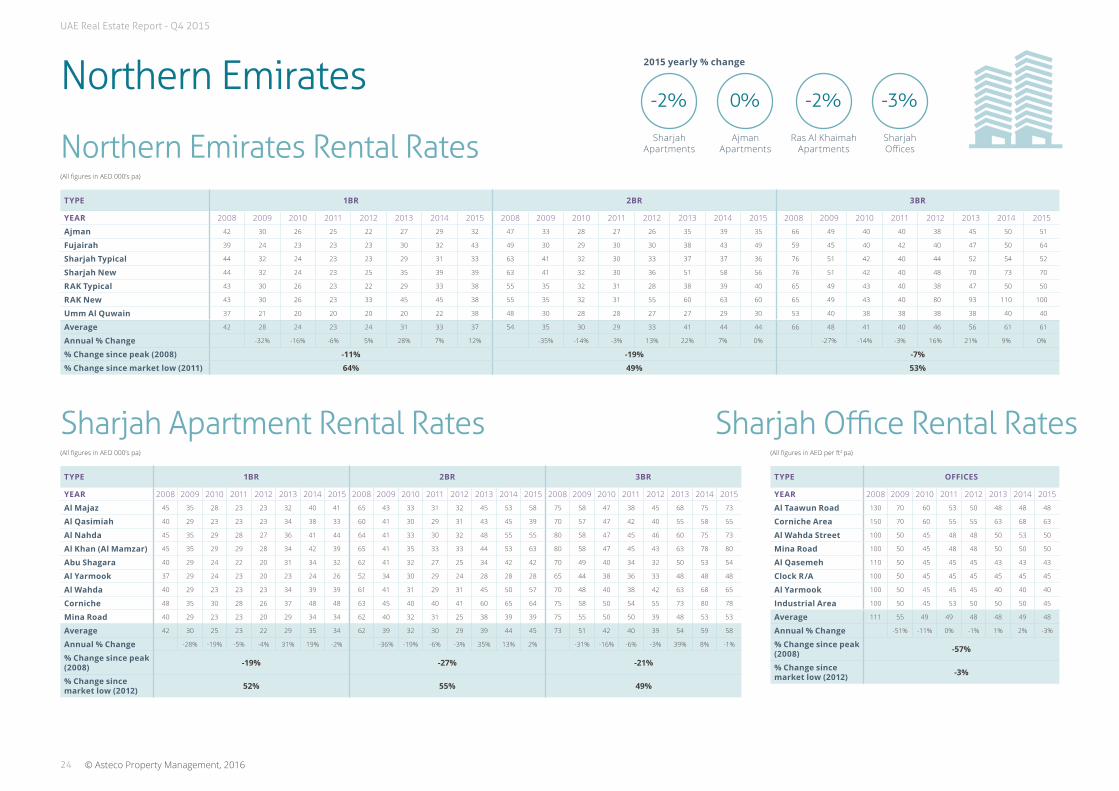
Sharjah Apartment Rental Rates Sharjah Office Rental Rates
Northern Emirates Rental Rates
-2%0% -3%
Ras Al Khaimah Apartments
Ajman Apartments
Sharjah Offices
(All figures in AED 000’s pa)
(All figures in AED 000’s pa) (All figures in AED per ft2 pa)
TYPE 1BR 2BR 3BR
YEAR 2008 2009 2010 2011 2012 2013 2014 2015 2008 2009 2010 2011 2012 2013 2014 2015 2008 2009 2010 2011 2012 2013 2014 2015
Ajman 42 30 26 25 22 27 29 32 47 33 28 27 26 35 39 35 66 49 40 40 38 45 50 51
Fujairah 39 24 23 23 23 30 32 43 49 30 29 30 30 38 43 49 59 45 40 42 40 47 50 64
Sharjah Typical 44 32 24 23 23 29 31 33 63 41 32 30 33 37 37 36 76 51 42 40 44 52 54 52
Sharjah New 44 32 24 23 25 35 39 39 63 41 32 30 36 51 58 56 76 51 42 40 48 70 73 70
RAK Typical 43 30 26 23 22 29 33 38 55 35 32 31 28 38 39 40 65 49 43 40 38 47 50 50
RAK New 43 30 26 23 33 45 45 38 55 35 32 31 55 60 63 60 65 49 43 40 80 93 110 100
Umm Al Quwain 37 21 20 20 20 20 22 38 48 30 28 28 27 27 29 30 53 40 38 38 38 38 40 40
Average 42 28 24 23 24 31 33 37 54 35 30 29 33 41 44 44 66 48 41 40 46 56 61 61
Annual % Change -32% -16% -6% 5% 28% 7% 12% -35% -14% -3% 13% 22% 7% 0% -27% -14% -3% 16% 21% 9% 0%
% Change since peak (2008) -11% -19% -7%
% Change since market low (2011) 64% 49% 53%
TYPE 1BR 2BR 3BR
YEAR 2008 2009 2010 2011 2012 2013 2014 2015 2008 2009 2010 2011 2012 2013 2014 2015 2008 2009 2010 2011 2012 2013 2014 2015
Al Majaz 45 35 28 23 23 32 40 41 65 43 33 31 32 45 53 58 75 58 47 38 45 68 75 73
Al Qasimiah 40 29 23 23 23 34 38 33 60 41 30 29 31 43 45 39 70 57 47 42 40 55 58 55
Al Nahda 45 35 29 28 27 36 41 44 64 41 33 30 32 48 55 55 80 58 47 45 46 60 75 73
Al Khan (Al Mamzar) 45 35 29 29 28 34 42 39 65 41 35 33 33 44 53 63 80 58 47 45 43 63 78 80
Abu Shagara 40 29 24 22 20 31 34 32 62 41 32 27 25 34 42 42 70 49 40 34 32 50 53 54
Al Yarmook 37 29 24 23 20 23 24 26 52 34 30 29 24 28 28 28 65 44 38 36 33 48 48 48
Al Wahda 40 29 23 23 23 34 39 39 61 41 31 29 31 45 50 57 70 48 40 38 42 63 68 65
Corniche 48 35 30 28 26 37 48 48 63 45 40 40 41 60 65 64 75 58 50 54 55 73 80 78
Mina Road 40 29 23 23 20 29 34 34 62 40 32 31 25 38 39 39 75 55 50 50 39 48 53 53
Average 42 30 25 23 22 29 35 34 62 39 32 30 29 39 44 45 73 51 42 40 39 54 59 58
Annual % Change -28% -19% -5% -4% 31% 19% -2% -36% -19% -6% -3% 35% 13% 2% -31% -16% -6% -3% 39% 8% -1%
% Change since peak (2008) -19% -27% -21%
% Change since market low (2012) 52% 55% 49%
TYPE OFFICES
YEAR 2008 2009 2010 2011 2012 2013 2014 2015
Al Taawun Road 130 70 60 53 50 48 48 48
Corniche Area 150 70 60 55 55 63 68 63
Al Wahda Street 100 50 45 48 48 50 53 50
Mina Road 100 50 45 48 48 50 50 50
Al Qasemeh 110 50 45 45 45 43 43 43
Clock R/A 100 50 45 45 45 45 45 45
Al Yarmook 100 50 45 45 45 40 40 40
Industrial Area 100 50 45 53 50 50 50 45
Average 111 55 49 49 48 48 49 48
Annual % Change -51% -11% 0% -1% 1% 2% -3%
% Change since peak (2008) -57%
% Change since market low (2012) -3%
-2%
2015 yearly % change
Sharjah Apartments
UAE Real Estate Report - Q4 2015
25© Asteco Property Management, 2016
Northern Emirates
Northern Emirates Property Map
Arabian Gulf
311
11
11
11
5
1
10
8
9
3
2
6
4
7
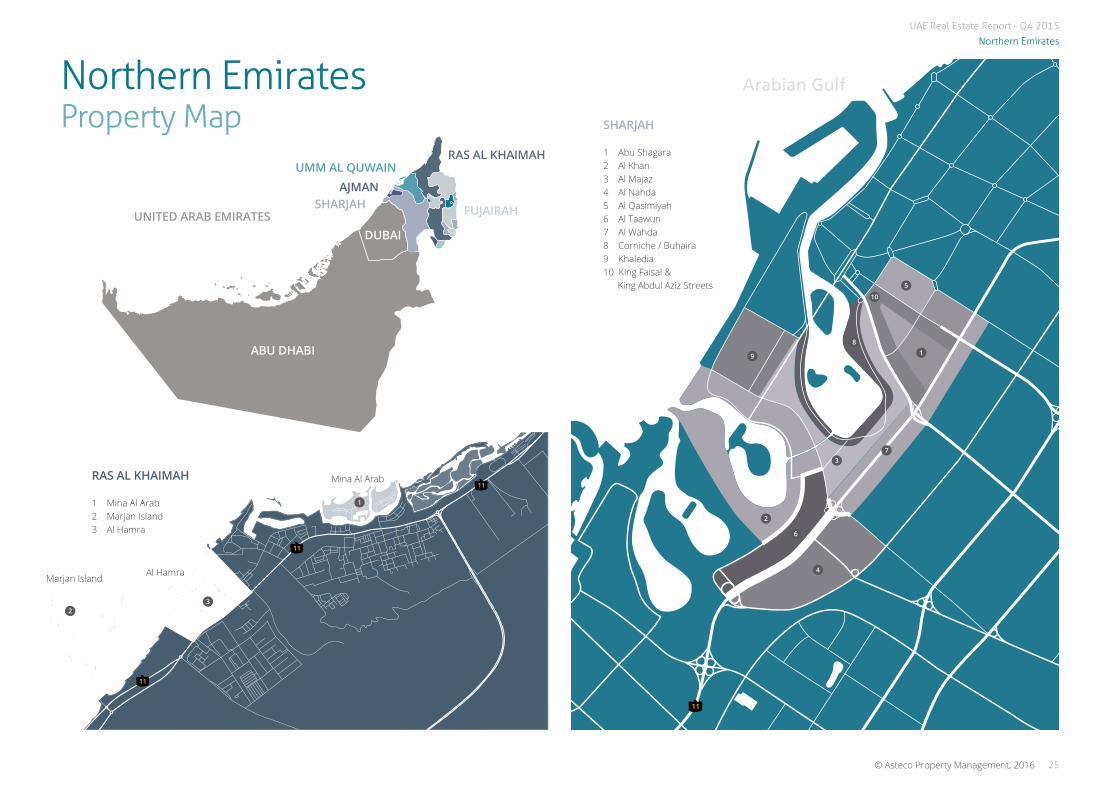
SHARJAH
1 Abu Shagara2 Al Khan3 Al Majaz4 Al Nahda5 Al Qasimiyah6 Al Taawun7 Al Wahda8 Corniche / Buhaira9 Khaledia10 King Faisal & King Abdul Aziz Streets
Mina Al Arab
Marjan Island
1
2
Al Hamra
3
RAS AL KHAIMAH
1 Mina Al Arab2 Marjan Island3 Al Hamra
ABU DHABI
DUBAI
SHARJAH FUJAIRAH
RAS AL KHAIMAHUMM AL QUWAIN
AJMAN
UNITED ARAB EMIRATES
UAE Real Estate Report - Q4 2015
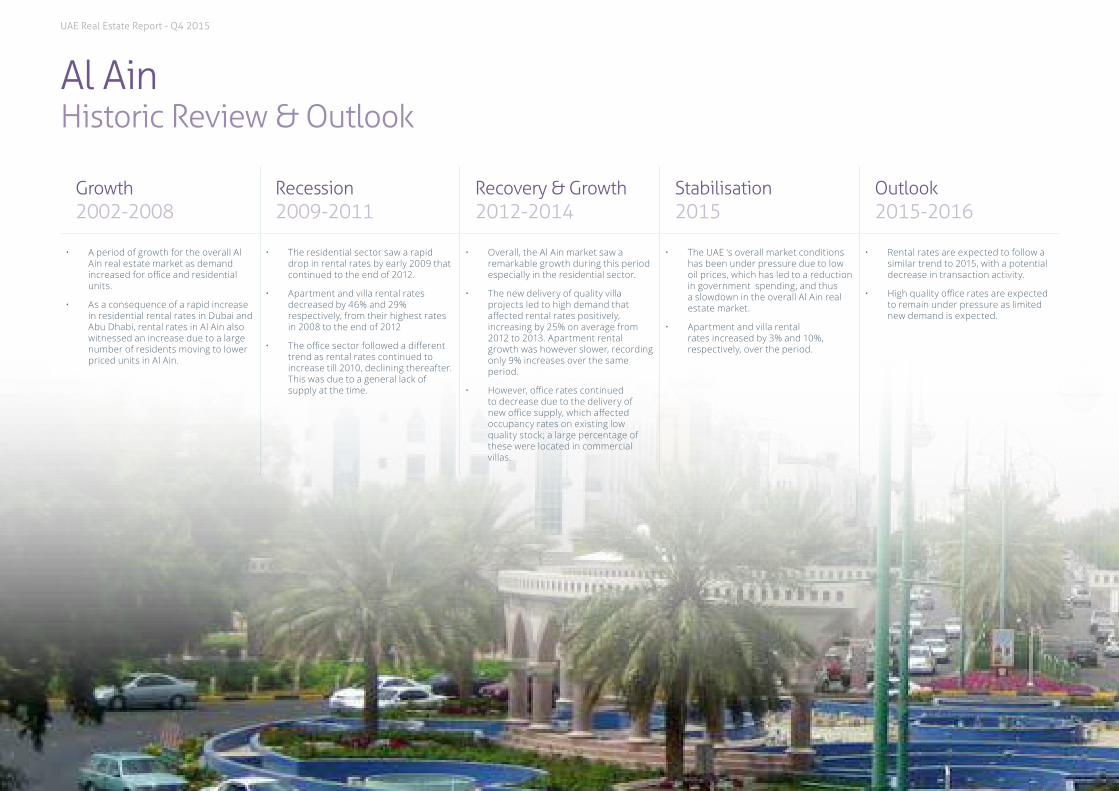
Al AinHistoric Review & Outlook
Growth 2002-2008
Recession 2009-2011
Recovery & Growth 2012-2014
Stabilisation 2015
Outlook 2015-2016
• A period of growth for the overall Al Ain real estate market as demand increased for office and residential units.
• As a consequence of a rapid increase in residential rental rates in Dubai and Abu Dhabi, rental rates in Al Ain also witnessed an increase due to a large number of residents moving to lower priced units in Al Ain.
• The residential sector saw a rapid drop in rental rates by early 2009 that continued to the end of 2012.
• Apartment and villa rental rates decreased by 46% and 29% respectively, from their highest rates in 2008 to the end of 2012
• The office sector followed a different trend as rental rates continued to increase till 2010, declining thereafter. This was due to a general lack of supply at the time.
• Overall, the Al Ain market saw a remarkable growth during this period especially in the residential sector.
• The new delivery of quality villa projects led to high demand that affected rental rates positively, increasing by 25% on average from 2012 to 2013. Apartment rental growth was however slower, recording only 9% increases over the same period.
• However, office rates continued to decrease due to the delivery of new office supply, which affected occupancy rates on existing low quality stock; a large percentage of these were located in commercial villas.
• The UAE ‘s overall market conditions has been under pressure due to low oil prices, which has led to a reduction in government spending, and thus a slowdown in the overall Al Ain real estate market.
• Apartment and villa rental rates increased by 3% and 10%, respectively, over the period.
• Rental rates are expected to follow a similar trend to 2015, with a potential decrease in transaction activity.
• High quality office rates are expected to remain under pressure as limited new demand is expected.

UAE Real Estate Report - Q4 2015
Xxx
27© Asteco Property Management, 2016
Al Ain Highlights and Outlook Selection of projects
completed in 2015RESIDENTIAL• Central Village - 60 units
COMMERCIAL• Al Ain Stadium Development: Some retail
& offices were handed over in 2015• Al Ain Ladies Club: 2,300 Sqm of retail
Selection of projects expected in 2016RESIDENTIAL• Town Centre: 9-10 buildings - 152 units• Ashara: 6 to 7 buildings - 65 units• Al Ain Stadium - 700 units
COMMERCIAL• Town Centre: 6 to 7 buildings - 104 units
The Al Ain market was overall relatively stable, however, the main changes witnessed this year was the increase in demand for apartments versus a decrease in demand for villa units. Furthermore, demand for high quality office space decreased as companies looked for low rental rate spaces.
2015 Highlights 2016 Highlights
Resi
dent
ial
high
light
s • Al Ain apartment rental rates recorded some growth during 2015 with over 6% increase for new buildings and over 4% for old buildings.
• The villa rental market declined remarkably in 2015 as old villa units decreased by 15% to 20%, whereas new villas recorded a decrease between 6% and 15% for mainly larger sized units.
• Several new small buildings were handed over in 2015, located mainly in Asharej and the Town Centre.
• Al Ain’s residential market is expected to remain similar to 2015, with a positive transaction activity especially for better quality apartment units.
• The lack of quality residential units and high villa rental rates will add more pressure to the overall villa market especially for larger sized units.
• The Asharej area will remain one of the most sought after locations in Al Ain as a number of new residential buildings are expected to be handed over in 2016.
Offi
ce
high
light
s • The office market was relatively quiet in 2015, as demand slightly decreased during the last quarter of 2015, and consequently rental rates decreased by around 6%.
• Office rates for good quality space decreased in all locations as the overall market was generally slower in 2015.
• The Al Ain market is expected to remain quiet in 2016, similar to the overall UAE market, which has been affected by the decline in oil prices in addition to the regional and global market conditions.
• Office demand is likely to remain low, and, with the delivery of new space, rates may continue to be under pressure.
Mar
ket
chan
ges • The retail market stabilised over the last three to four years, especially in
the main retail malls. However, strip retail all over Al Ain City decreased on average by 8%, and the Senaya area recorded the highest decrease in 2015, by around 10%.
• The Al Ain Ladies Club was handed over, which included around 2,300 sqm of retail.
• Rental rates are expected to remain stable in 2016, as demand for quality retail in malls will remain positive due to the lack of quality stock.
• No major new supply is expected during 2016 except for some retail on the ground floor of commercial buildings.
UAE Real Estate Report - Q4 2015
28 © Asteco Property Management, 2016
Al Ain
Villa Rental Rates
Office Rental Rates
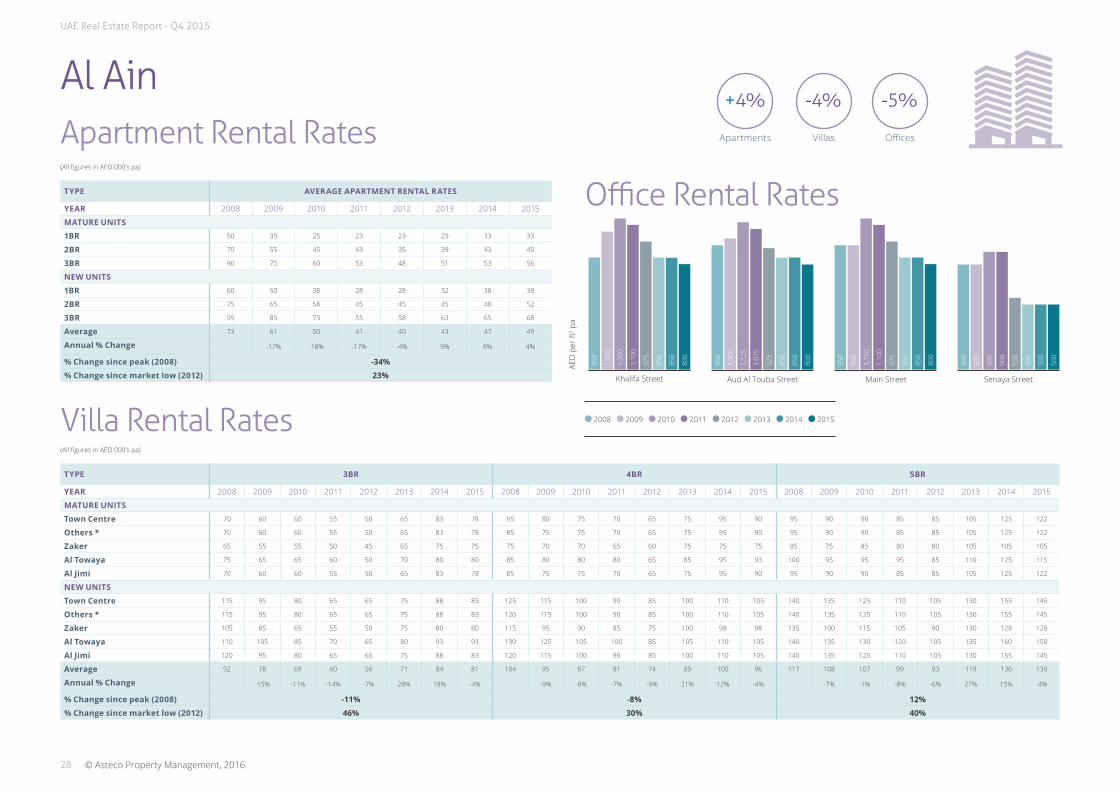
Apartment Rental Rates-4%+4% -5%
VillasApartments Offices
(All figures in AED 000’s pa)
(All figures in AED 000’s pa)
TYPE 3BR 4BR 5BR
YEAR 2008 2009 2010 2011 2012 2013 2014 2015 2008 2009 2010 2011 2012 2013 2014 2015 2008 2009 2010 2011 2012 2013 2014 2015
MATURE UNITS
Town Centre 70 60 60 55 50 65 83 78 95 80 75 70 65 75 95 90 95 90 90 85 85 105 125 122
Others * 70 60 60 55 50 65 83 78 85 75 75 70 65 75 95 90 95 90 90 85 85 105 125 122
Zaker 65 55 55 50 45 65 75 75 75 70 70 65 60 75 75 75 85 75 85 80 80 105 105 105
Al Towaya 75 65 65 60 50 70 80 80 85 80 80 80 65 85 95 93 100 95 95 95 85 110 125 115
Al Jimi 70 60 60 55 50 65 83 78 85 75 75 70 65 75 95 90 95 90 90 85 85 105 125 122
NEW UNITS
Town Centre 115 95 80 65 65 75 88 83 125 115 100 90 85 100 110 105 140 135 125 110 105 130 155 145
Others * 115 95 80 65 65 75 88 83 120 115 100 90 85 100 110 105 140 135 125 110 105 130 155 145
Zaker 105 85 65 55 50 75 80 80 115 95 90 85 75 100 98 98 135 100 115 105 90 130 128 128
Al Towaya 110 105 85 70 65 80 93 93 130 125 105 100 85 105 110 105 140 135 130 120 105 135 160 150
Al Jimi 120 95 80 65 65 75 88 83 120 115 100 90 85 100 110 105 140 135 125 110 105 130 155 145
Average 92 78 69 60 56 71 84 81 104 95 87 81 74 89 100 96 117 108 107 99 93 119 136 130
Annual % Change -15% -11% -14% -7% 28% 18% -4% -9% -8% -7% -9% 21% 12% -4% -7% -1% -8% -6% 27% 15% -4%
% Change since peak (2008) -11% -8% 12%
% Change since market low (2012) 46% 30% 40%
TYPE AVERAGE APARTMENT RENTAL RATES
YEAR 2008 2009 2010 2011 2012 2013 2014 2015
MATURE UNITS
1BR 50 35 25 23 23 29 33 33
2BR 70 55 45 43 35 39 43 45
3BR 90 75 60 53 48 51 53 56
NEW UNITS
1BR 60 50 38 28 28 32 38 38
2BR 75 65 58 45 45 45 48 52
3BR 95 85 73 55 58 63 65 68
Average 73 61 50 41 40 43 47 49
Annual % Change -17% -18% -17% -4% 9% 8% 4%
% Change since peak (2008) -34%
% Change since market low (2012) 23%
950
950
1,15
0
1,10
0
975
850
850
800
800
800
900
900
550
500
500
500
850
1,05
0
1,05
0
1,10
0
975
850
850
800
950
1,00
0
1,12
5
1,07
5
925
850
850
800
2008 2009 2010 2011 2012 2013 2014 2015
AED
per
ft2 p
a
Khalifa Street Aud Al Touba Street Main Street Senaya Street

UAE Real Estate Report - Q4 2015
29© Asteco Property Management, 2016
Al Ain
Town Centre
Al Jimi
Al Khabisi
Al Muwaiji
Al Masoudi
Zaker
Al Towaya
East Airport District
Al Foaa
Hili
Al Oattara
Al Buraimi
Al Mutaredh
Al Jahili
AlMutawa’a
Al Sarooj
Al Shuwaimah
Aflaj
Al KhrairDefence
Al Dhahir Um GhafahJebel Hafeet
NeimaAl Qisais
Al Shuaibah
Al Aqabiyya
Zoo District
Falaj Hazza’a
Asharej
Al Markhaniya
Al Dahmaa
Al Bateen
Al Maqam
Gharebah
Al Salamat District
Al Yahar South
Al Yahar North
Al AinInternational
Airport
SULTANATE OF OMAN
Khalifa Bin Zayed St.
Khalifa Bin Zayed St.
Moh
d Bi
n Kh
alifa
St
Baniyas St
Ardh
Jow
St
Emira
tes
St
Zayed Bin Sultan St.
Al Ain Property Map

UAE Real Estate Report - Q4 2015
30 © Asteco Property Management, 2016
VALUATION & ADVISORYOur professional advisory services are conducted by suitably qualified personnel all of whom have had extensive real estate experience within the Middle East and internationally.
Our valuations are carried out in accordance with the Royal Institution of Chartered Surveyors (RICS) and International Valuation Standards (IVS) and are undertaken by appropriately qualified valuers with extensive local experience.
The Professional Services Asteco conducts throughout the region include:
• Consultancy and Advisory Services• Market Research• Valuation Services
SALESAsteco has established a large regional property sales division with representatives based in the UAE, Qatar and Jordan. Our sales teams have extensive experience in the negotiation and sale of a variety of assets.
LEASINGAsteco has been instrumental in the leasing of many high-profile developments across the GCC.
ASSET MANAGEMENTAsteco provides comprehensive asset management services to all property owners, whether a single unit (IPM) or a regional mixed use portfolio. Our focus is on maximising value for our Clients.
OWNERS ASSOCIATIONAsteco has the experience, systems, procedures and manuals in place to provide streamlined comprehensive Association Management and Consultancy Services to residential, commercial and mixed use communities throughout the GCC Region.
SALES MANAGEMENTOur Sales Management services are comprehensive and encompass everything required for the successful completion and handover of units to individual unit owners.
LICENSINGOur brand, network, system and procedures are now available in territories across the MENA region. Our Licensing services currently include Real Estate Brokerage Franchising and associated support services with many of the key elements designed specifically around the franchisee, making it a truly unique and bespoke franchise opportunity.
The Middle East’s largest full service real estate consultancy company, Asteco was formed in Dubai in 1985. Over the years, Asteco has gained enormous respect for consistently delivering high quality, professional, value-added services in a transparent manner. It is also widely recognised for its involvement with many of the projects that have defined the landscape and physical infrastructure of the Emirates.
Asteco has an essential combination of local knowledge and international expertise. A deeply established brand, renowned for its application of the latest technological advances, its commitment to transparency, winning strategies and human expertise. Undisputed real estate experts, Asteco represents a significant number of the region’s top property owners, developers and investors.

UAE Real Estate Report - Q4 2015
31© Asteco Property Management, 2016
John Stevens, BSc MRICSManaging Director/Director, Asset Services+971 600 54 [email protected]
Sean McCauley, MBA BComDirector - Agency Services+971 600 54 [email protected]
Julia Knibbs, MScResearch & Consultancy Manager, UAE+971 600 54 [email protected]
James Joughin, BSc (Hons) MRICSHead of Valuations+971 600 54 [email protected]
Omar Binder, BA (Hons)Director - Licensing Services+971 600 54 [email protected]
John Allen, BSc MRICSDirector, Valuation & Advisory+971 600 54 [email protected]
Jeremy Oates, BSc FRICSGeneral Manager, Abu Dhabi+971 2 626 [email protected]
Ghada Amhaz, MBAResearch & Consultancy Manager, Abu Dhabi+971 2 626 [email protected]
Tamer Ibrahim ChaabanBranch Manager, Al Ain+971 3 [email protected]
Zahra Alvi, MScResearch Analyst+971 600 54 [email protected]

UAE Real Estate Report - Q4 2015
Xxx
DISCLAIMER: The information contained in this report has been obtained from and is based upon sources that Asteco Property Management believes to be reliable, however, no warranty or representation, expressed or implied, is made to the accuracy or completeness of the information contained herein, and same is submitted subject to errors, omissions, change of price, rental or other conditions, withdrawal without notice, and to any special listing conditions imposed by our principals. Asteco Property Management will not be held responsible for any third-party contributions. All opinions and estimates included in this report constitute Asteco Property Management’s judgment, as of the date of this report and are subject to change without notice. Figures contained in this report are derived from a basket of locations highlighted in this report and therefore represent a snapshot of the Dubai market. Due care and attention has been used in the preparation of forecast information. However, actual results may vary from forecasts and any variation may be materially positive or negative. Forecasts, by their very nature, involve risk and uncertainty because they relate to future events and circumstances which are beyond Asteco Property Management’s control. For a full in-depth study of the market, please contact Asteco Property Management’s research team. Asteco Property Management LLC. Commercial License No. 218551. Paid-up Capital AED 4,000,000. © Asteco Property Management, 2016
2008-2016 UAE Real Estate Report
UAE Real Estate Report - Q4 2015