Embed Size (px)
Citation preview

•Professor Theo Tsotsis, University of Southern California, Los Angeles, CA•Professor Vasilios Manousiouthakis, University of California, Los Angeles, CA
•Dr. Rich Ciora, Media and Process Technology Inc., Pittsburgh, PA
DE-FOA-0001235
U.S. Department of EnergyNational Energy Technology Laboratory
Office of Fossil EnergyAugust 10, 2016
A High Efficiency, Ultra-Compact Process For Pre-Combustion CO2 Capture
1

2
Presentation Outline
• Project Overview
• Technology Background
• Technical Approach/Project Scope
• Progress and Current Status of Project
• Plans for future testing/development/commercialization

3
Performance Period: 10-01-2015 – 9-31-2018
Project Budget: Total/$1,909,018; DOE Share/$1,520,546; Cost-Share/$388,472
Overall Project Objectives:1. Prove the technical feasibility of the membrane- and adsorption-enhanced water gas
shift (WGS) process.
2. Achieve the overall fossil energy performance goals of 90% CO2 capture rate with95% CO2 purity at a cost of electricity of 30% less than baseline capture approaches.
Key Project Tasks/Participants:1. Design, construct and test the lab-scale experimental MR-AR system.-----USC
2. Select and characterize appropriate membranes, adsorbents and catalysts.-----M&PT, USC
3. Develop and experimentally validate mathematical model.-----UCLA, USC
4. Experimentally test the proposed novel process in the lab-scale apparatus, and complete theinitial technical and economic feasibility study. (Budget Period 2).----- M&PT, UCLA, USC
Project Overview

4
Conventional IGCC Power Plant
Technology Background

5
Hybrid Adsorbent Membrane Reactor (HAMR)
Technology Background, cont.
The HAMR combines adsorbent, catalyst and membrane functions in the same unit. Previouslytested for methane steam reforming (MSR) and the WGS reaction.
The simultaneous in situ removal of H2 and CO2 from the reactor significantly enhances reactoryield and H2 purity. CO2 stream ready for sequestration.

6
CMS Membranes for Large-Scale Applications
Technology Background, cont.
M&PT test-unit at NCCC for hydrogen
separation
CMS membranes and modules

7
Hydrotalcite (HT) Adsorbents & Co/Mo-Based Sour-Shift Catalysts
Technology Background, cont.
Hydrotalcite Adsorbent:
The HT adsorbents shown to have a working CO2 capacity of 3-4 wt.% during thepast HAMR studies with the MSR and WGS reactions. Theoretical capacity >16wt.%.
Co/Mo-Based Sour Shift Catalyst:
A commercial Co/Mo-based sour shift catalyst has been used in our past andongoing lab-scale MR studies with simulated coal-derived and biomass-derivedsyngas. Shown to have stable performance for >1000 hr of continuous operation.

8
Advantages--Our Proposed Process vs. SOTA
Technology Background, cont.
Key Innovation:• Highly-efficient, low-temperature reactor process for the WGS reaction of coal-gasifier syngas for
pre-combustion CO2 capture, using a unique adsorption-enhanced WGS membrane reactor (MR-AR) concept.
Unique Advantages:• No syngas pretreatment required: CMS membranes proven stable in past/ongoing studies to all of
the gas contaminants associated with coal-derived syngas.
• Improved WGS Efficiency: Enhanced reactor yield and selectivity via the simultaneous removal ofH2 and CO2.
• Significantly reduced catalyst weight usage requirements: Reaction rate enhancement (over theconventional WGSR) that results from removing both products, potentially, allows one to operate atmuch lower W/FCO (Kgcat/mol.hr).
• Efficient H2 production, and superior CO2 recovery and purity: The synergy created between theMR and AR units makes simultaneously meeting the CO2 recovery/purity targets together withcarbon utilization (CO conversion) and hydrogen recovery/purity goals a potential reality.

9
Technology Background, cont.
• Prepare and characterize membranes/adsorbents and validate theirperformance at the relevant experimental conditions.
• Validate catalyst performance at the relevant pressure conditions. Verifyapplicability of global reaction kinetics.
• Complete the construction of the lab-scale MR-AR experimental systemand test the individual MR and AR subsystems.
• Develop and experimentally validate mathematical model.
Key Technical Objectives and Focus in BP1

10
Proposed MR-AR Process
Technical Approach/Project Scope
Potential use of a TSA regeneration scheme allows the recovery of CO2 at high pressures.
The MR-AR process overcomes the limitations of competitive singular, stand-alone systems, such asthe conventional WGSR, and the more advanced WGS-MR and WGS-AR technologies.

11
Resource-Loaded Schedule
Technical Approach/Project Scope, cont.

12
Milestone Log –BP1
Technical Approach/Project Scope, cont.
Title/DescriptionPlanned
Completion Date
Actual Completion Date
Verification Method
Comments (progress for achieving milestone, explanation from deviation,
etc.)
Updated PMP submitted 10/31/2015 10/29/2015 PMP document Milestone achieved
Kick-off meeting convened 12/31/2015 11/16/2015Presentation file/report
documentsMilestone achieved
Construction of the lab-scale MR-AR experimental system (designed for pressures up to 25 bar) completed
3/31/2016 3/31/2016Description and photographs
provided in the quarterly report
Milestone achieved
Preparation/characterization of the CMS membranes at the anticipated process conditions (up to 300ºC and 25 bar total pressure) completed
6/30/2016 6/30/2016Results reported in the
quarterly reportMilestone achieved
Preparation/characterization of the HT-based adsorbents at the anticipated process conditions (300-450ºC and up to 25 bar total pressure) completed. Adsorbent working capacity, adsorption/desorption kinetics determined. Global rate expression for Co/Mo-based sour shift catalysts at the anticipated process conditions (up to 300ºC and 25 bar total pressure) generated
12/31/2016 12/31/2016Results reported in the
quarterly reportMilestone achieved
MR subsystem testing and reporting of key parameters (permeance, selectivity, catalyst weight, temperature, pressures, residence time, CO conversion, effluent stream compositions, etc.) completed
3/31/2017Results reported in the
quarterly reportThis milestone is >80% achieved. To be completely achieved by 3/31/2017
AR subsystem testing and reporting of key parameters (adsorbent and catalyst weight, temperatures, pressures, residence time, desorption mode, working capacity, energy demand, effluent stream compositions, etc.) completed
3/31/2017Results reported in the
quarterly reportThis milestone is >80% achieved. To be completely achieved by 3/31/2017
Mathematical model modifications to simulate the hybrid MR-AR process and validate model using experimental MR and AR subsystem test results completed
3/31/2017Results reported in the
quarterly reportThis milestone is >90% achieved. To be completely achieved by 3/31/2017

13
Project Success Criteria –BP1
Technical Approach/Project Scope, cont.
Success Criteria for BP1 Status/Comments
Successful completion of all work proposed in Budget Period 1 (up to 12/31/2016). Achieved
Measurements of membrane permeance for H2, CH4, CO, CO2 both in the absence and presence of H2O, NH3, H2S for full-range of operating temperatures (up to 300ºC) and total pressures (10-25 bar). Target range for H2 permeance 1-1.5 m3/m2.hr.bar; Target range for H2/CO selectivity 80-100
Achieved, see Table 5 for IDs of Parts meeting the targets in H2 permeance and H2/CO selectivity
Measurement of adsorption/desorption kinetics and working capacity at relevant conditions (300°C<T<450°C, pressures up to 25 bar). Measurement of catalytic kinetics, and the development of global rate expression at relevant conditions (temperatures up to 300ºC and pressures up to 25 bar). Target for working capacity >3 wt%
Achieved for Mg-Al-CO3
LDH with a Mg:Al ratio of
3:1 (working capacity 9.61 wt% at 17.5 bar)/Measurement of catalytic kinetics continuing until 3/31/2017.
Complete fabrication of the lab-scale apparatus and testing of the individual units (MR or AR) at relevant experimental conditions. Measurements of CO conversion (%), H2
recovery (%) and purity (%), CO2 capture ratio/purity (%) and energy demand for regeneration (kJ/mol CO2). Generation of experimental data sufficient to validate the model.
Achieved/Experimental studies of AR and MR individual units continuing until 3/31/2017
Completion of simulations of the MR-AR system that indicate its ability to meet the targets for CO conversion >95%, for H2 purity >95%, for H2 recovery >90%, for CO2 purity >95%, for CO2 recovery >90%.
Achieved (see Table 26)

Materials Preparation and Characterization
Progress and Current Status of Project
14
Carbon Molecular Sieve (CMS) Membrane Preparation, Characterization Performance Assessment
Project Targets for CMS MembranesH2 permeance at ≥ 550 GPU ; H2/CO at ≥ 80 to 100
Performance of Selected CMS Membranes at 250oC
Part ID He [GPU]
N2 [GPU]
H2 [GPU]
CO2 [GPU]
H2/N2 [-]
H2/CO H2/CO2 [-]
HMR-41(10”) 482 5.7 367 5.7 145 121-126 65
HMR-44(10”) 645 4.2 722 11.3 172 143-150 64
HMR-45(10”) 366 0.85 400 3.2 471 392-410 126*
HMR-46(10”) 684 4.7 - 12.0 - -
HMR-52(10”) 556 3.8 539 14.3 148 123-129 38
HMR-39(10” 381 4.4 - - 86 72-75 -
HMR-47(10”) 846 4.5 819 4.9 179 149-156 167*
HMR-49(10”) 434 1.7 427 8.3 249 207-216 51
HMR-48(10”) 418 4.4 451 6.8 102 85-89 68
HMR-42(10”) 368 1.0 364 0.7 361 301-314 540*

Materials Preparation and Characterization
Progress and Current Status of Project, cont.
15
Carbon Molecular Sieve Membrane Preparation & CharacterizationLong-Term Stability Testing

Materials Preparation and Characterization
Progress and Current Status of Project, cont.
16
Hydrotalcite Materials Preparation and CharacterizationHigh-Pressure Adsorption Isotherm at 250oC
0 2 4 6 8 10 12 14 16 18 20 22 24 26 280
1
2
3
4
5
6
7
8
9
10
11
12
Pressure (bar)
Exce
ss s
orpt
ion
(wt%
/g)
Before correcting After correcting

Materials Preparation and Characterization
Progress and Current Status of Project, cont.
17
Co-Mo/Al2O3 Sour-Shift Catalyst CharacterizationGlobal Reaction Kinetics- Empirical Model and Comparison with Microkinetc Models
01020304050607080
0 20 40 60 80
Sim
ulat
ed C
O c
onve
rsio
n
Measured CO conversion
1
1 .
.
ex p4577.8
4.33
A[mol/(atm(a+b+c+d) · h · g)] 18957E [J/mol] 58074
a 4b -1.46c 0.13d -1.44
Root-Mean-Square Deviation (RMSD)
Direct oxidation 3.38
Associative 5.12
Formate intermediate 8.04
Empirical model 3.32

18
Design and Construction of the Lab-Scale MR-AR System.
Progress and Current Status of Project, cont.

19
Design and Construction of the Lab-Scale Experimental System
Progress and Current Status of Project, cont.
AR sub-system
MR sub-system
Residual Gas Analyzer (RGA)

20
MR Sub-System Operation Testing
Progress and Current Status of Project, cont.
MR Perfomance – Membrane HMR-52 (10”) Reactor pressure = 14.5 bar, Reactor temperature
= 250°C, H2O:CO=1.1
MR Perfomance – Membrane HMR-52 (10”) Reactor pressure = 14.5 bar, Reactor temperature = 250°C, H2O:CO=1.1
0
0.1
0.2
0.3
0.4
0.5
0.6
0.7
0.8
0 50 100 150 200
CO Con
version
Weight of catalyst / Molar flow rate of CO
Empirical model Packed‐bed reactor
0
0.2
0.4
0.6
0.8
1
1.2
0 50 100 150 200
H 2Re
covery
Weight of catalyst / Molar flow rate of CO
Empirical model
21
AR Sub-System Operation Testing
Progress and Current Status of Project, cont.
Empty Reactor Dynamics Reactor pressure = 25 bar, Oven temperature =
400°C, Flow rate=500 sccm
Blank Experiments Using only QuartzReactor pressure = 5, 10, 15, 20, 25 bar, Oven
temperature = 400°C, Flow rate=500 sccm

22
AR Sub-System Operation Testing
Progress and Current Status of Project, cont.
CO2 Breakthrough ExperimentsReactor pressure = 25 bar, Oven temperature =
400°C, Flow rate=500 sccm
CO2 Breakthrough ExperimentsReactor pressure = 5, 10, 15, 20, 25 bar, Oven
temperature = 400°C, Flow rate=500 sccm

23
AR Sub-System Operation Testing
Progress and Current Status of Project, cont.
CO2/ H2O Breakthrough ExperimentsReactor pressure = 25 bar, Oven temperature =
300°C, Total flow rate=500 sccm, Various steam concentration (0, 10, 20, 40 vol.%)
CO2/ H2S Breakthrough ExperimentsReactor pressure = 25 bar, Oven temperature =
300°C, Total flow rate=500 sccm, H2S concentration (0, 1000 ppm)

Membrane Reactor/Adsorptive Reactor Process
Combined MR + AR System
Z=0 Z=L
r=R
r=r
Reaction Zone
Permeation Zone
JH2JH2
Solid Phase
Fluid Phase
Pellet
z+Δz
z+Δz
z
2 2 2CO H O CO H
2 2 2CO H O CO H
CH4, H2, CO, CO2, H2O,H2S
Z=0 Z=L
r=R
Solid Phase
Fluid Phase
Adsorbent Pellet
zz+Δz
2 2 2
2 2
2 2 2 2
CO H O CO H
CO S CO S
CO S CO CO S
Fluid Phase
Catalysis Pellet
CH4, H2, CO, CO2, H2OH2O or N2
CH4, H2, CO, CO2, H2O,H2S
CH4, H2, CO, CO2, H2O,H2S
CH4, H2, CO, CO2, H2O,H2S
CH4=0.84475H2=2.7637
CO=1CO2=2.1528H2O=1.1
H2S=0.04695

Membrane Reactor (MR)/Adsorptive Reactor (AR) Process

26
Membrane Reactor (MR)/Adsorptive Reactor (AR) Process

MR/AR Steady State Process
WGS-MR
2
WGS-AR MR-Sep
31
45
6
7
8
Flash
10
12
11
9

MR/AR Steady State Process
x=57.64, y=10, z=10, m=1001 2 3 4 5 6
T (K) 573.15 600 591 723.15 723.15 523.15P (bar) 14 14 1 14 14 14x_inert 0.10746 0 1.39E-01 0 0 0.247362256x_h2o 0.13993 0.04 1.32E-01 1 0.5 0.014131239x_h2 0.35156 0.96 2.92E-01 0 0 0.738506505x_co 0.12721 0 1.24E-01 0 0 0x_co2 0.27385 0 3.14E-01 0 0.5 0F(mol/s) 3.79E-04 6.23E-05 0.0002924 0.000127828 0.000255656 0.00016456
7 8 9 10 11 12T (K) 523.15 523.15 523.15 523.15 330 330P (bar) 14 14 14 14 14 14x_inert 0 0.996806 0.2473623 9.51E-03 0 0x_h2o 0.018 0.0022886 0.0141312 1.77E-02 0.015 0.998x_h2 0.982 0.0009054 0.7385065 0.972799 0 0x_co 0 0 0 0 0 0x_co2 0 0 0 0 0.985 0.002F(mol/s) 0.000118948 3.58119E-05 0.0000049 0.000123848 0.000129248 0.000126408

MR/AR Steady State Process
x=115.29, y=10, z=10, m=1001 2 3 4 5 6
T (K) 573.15 600 591 723.15 723.15 523.15P (bar) 14 14 1 14 14 14x_inert 0.10746 0 0.1678438 0 0 0.303844885x_h2o 0.13993 0.04 0.1138235 1 0.5 0.008224374x_h2 0.35156 0.96 0.2707322 0 0 0.687930742x_co 0.12721 0 0.1092804 0 0 0x_co2 0.27385 0 0.3383201 0 0.5 0F(mol/s) 3.79E-04 9.29E-05 0.0002425 0.000108553 0.000217106 0.000133969
7 8 9 10 11 12T (K) 523.15 523.15 523.15 523.15 330 330P (bar) 14 14 14 14 14 14x_inert 0 0.9943722 0.3038449 0.012467 0 0x_h2o 0.01 0.0046718 0.0082244 9.93E-03 0.015 0.998x_h2 0.99 0.000956 0.6879307 0.977606 0 0x_co 0 0 0 0 0 0x_co2 0 0 0 0 0.985 0.002F(mol/s) 8.94902E-05 3.6479E-05 0.0000040 4.0479E-05 1.10E-04 1.07E-04

MR/AR Steady State Process
x=230.58, y=10, z=10, m=1001 2 3 4 5 6
T (K) 573.15 600 591 723.15 723.15 523.15P (bar) 14 14 1 14 14 14x_inert 0.10746 0 0.2155852 0 0 0.39678791x_h2o 0.13993 0.04 0.08082 1 0.5 0x_h2 0.35156 0.96 0.2460744 0 0 0.60321209x_co 0.12721 0 0.0816664 0 0 0x_co2 0.27385 0 0.3758541 0 0.5 0F(mol/s) 3.79E-04 0.0001888 1.24E-04 8.6387E-05 0.000172774 0.000102588
7 8 9 10 11 12T (K) 523.15 523.15 523.15 523.15 330 330P (bar) 14 14 14 14 14 14x_inert 0 0.999077 0.3967879 1.24E-02 0 0x_h2o 0 0 0 0 0.015 0.9973x_h2 1 0.000923 0.6032121 0.987587 0 0x_co 0 0 0 0 0 0x_co2 0 0 0 0 0.985 0.0017F(mol/s) 6.16309E-05 4.03576E-05 0.0000003 6.19309E-05 8.73E-05 8.54E-05

Membrane Reactor Multi-scale (Pellet-Reactor Scale) Model
1D Representation of control volumes in Membrane Reactor

Membrane Reactor Multi-scale (Pellet-Reactor Scale) Model
32
1D (pellet radial direction) pellet equations solved at each grid point of the discretized reactor domain (z axis).

Pellet-Scale Steady-State Model
33
Boundary Conditions:
1
1
0
0 0
0
1s
s
pj
pr
p
nr p p p pV j s k jk j j f f
k
nr p p p p p p p
r j f j fj
p rj j
p r
n
Q T for r
P
R v n x c v
h T T Q x c C v T for r r
x x
P P
Pellet-scale model equations.
Constitutive laws
Continuity Equation:
1 1
1s Rn n
p p p p pA f f v s k jk
j kc v R v
Component mass conservation:
1
1Rn
p p p p p p p pA j f f A j v s k jk
k
x c v n R v
Energy conservation:
,1 1
1s Rn n
p p p p p p p p pA j f j f v s R k k
j k
x c C v T T H R
1,
1 1
1 1s
s s
Nj j i i O
i j iN eff eff eff N effj fij ij iK iKj i pj i
j i
c c N c BPN N c PD D D Dc c RT
DGM (Dusty Gas Model):
5
2 1 1 1 1 15 5 5 5 5
112 13 14 15
1 1 1 1 1
5
1 222
5 52
211 1
1
2
3
4
5
1
1
ieff
i ieff
eff eff eff effKj j j j j
j j j j j
ieff
i ii
effeff K
j jj j
cD c c c c
Dc D c D c D c D c
cDc
DD c c
N
N
N
N
N
2 2 25 5 5
23 24 251 1 1
5
1 333 3 3 3
5 5 5 5 53
31 32 34 351 1 1 1 1
4 45
41 421
1
eff eff effj j j
j j j
ieff
i ii
effeff eff eff effK
j j j j jj j j j j
eff effj j
j
c c c
D c D c D c
cDc c c c
DD c D c c D c D c
c c
D c D c
5
1 444 4
5 5 5 54
43 451 1 1 1
5
1 555 5 5 5
5 5 5 5 55
51 52 53 541 1 1 1 1
1
1
ieff
i ii
effeff effK
j j jj j j j
ieff
i ii
effeff eff eff eff K
j j j j jj j j j j
cDc c
DD c c D c
cDc c c c
DD c D c D c D c c
11
1
1
22
2
1
33
3
1
1
1
1
s
s
s
ON eff
K fj
j
ON eff
K fj
j
ON eff
K fj
j
Bc Pc PDc RT
Bc Pc PDc RT
c BPc PDc RT
44
1
55
5
1
1
1
s
s
ON eff
iK fj
j
ON eff
K fj
j
Bc Pc PDc RT
c BPc PDc RT
x

Reactor-Scale Steady-state Model
34
MR-scale reaction zone model equations.
Bulk Gas Constitutive laws
Continuity Equation:
1 1 1
21s sRn nn
r r r r rA f f c v s k jk j
j k j mem
c v R v JR
Component mass conservation:
1
21Rn
r r r r r r r rA j f f A j c v j s k jk j
k mem
x c v n R v JR
Energy conservation:
1 4s
s sr r r p r r qp p q qn
r r r r r rSMA j j j f
r perm rjfurr
t
T h T T h T Tx c C v T A U UT T T T
dV
MR-scale reaction zone boundary conditions.
Boundary Conditions:
0
0
0
0
r rf f
inr r
in
r rf f
inr r
in
r
rj
r
v v
P Pfor z
x x
T T
T
n for z L
P
22
3 32
1 1150 1.75
r rV Vr r r r r r r r
D f v f f f f fr rV p V p
P K v K v P v vd d
Momentum Equation (Ergun Equation)
1 1
1 1s sT TN N
i j i j j ii j i i ieff eff
j jj iij f ij j i
x x x x D DP Tx J J w xP TD D w w
Stefan-Maxwell Equation

Steady-State Permeation Zone Model
35
MR-scale permeation zone model equations.
Bulk Gas Constitutive laws
Continuity Equation:
1
2snperm permf f j
j mem
c v JR
Component mass conservation:
2perm perm permj f f j
mem
x c v JR
Energy conservation:
1
1
s
s
j j
nperm perm perm perm permj f j f
j
nSM SMperm r perm r perm
jperm permj
x c C v T
A U AT T T J h hV V
MR-scale reaction zone boundary conditions.
Boundary Conditions:
0
0
0
perm permf f inperm perm
in
r rf f
in
r permin
perm
perm
v v
P Pfor z
x x
T T
Tfor z L
P
Constitutive law and other property defining equations
Gas Law:
rTOT
PcZRT
Definitions:
1 1 1
1, , , 1s s sn n n
p rj tot j i cat qua
j j j
x c c P P
Heat Flux (Fourier’s Law):
Q T
Dimensionless Groups :
,, ,p f g p p g gp
g g g
hd v d CNu Re Pr
Viscosity of Gas Mixture :
21/2 1/4
1/21
1
1,
8 1
s
s
N i j j ii i
g ijNi
i ji ijj
M Mx
M Mx
Thermal Conductivity:
1 1r r rv cat cat v qua ad v g
Thermal Conductivity of Pure Gases:
2 3i i i i iA BT C T DT
Thermal Conductivity of Gas Mixture:
21/2 1/4
1/21
1
1,
8 1
s
s
N i j j ii i
g ijNi
i ji ijj
M Mx
M Mx
Specific Heat Capacity of Pure Gases:
2 3 20, 1, 2, 3, 4, , 1000i i i i i i
TC a a t a t a t a t t

Adsorptive Reactor (AR) Model
36
1D Representation of control volumes in AR
2 2 2
2 2
2 2 2 2
CO H O CO H
CO S CO S
CO S CO CO S

Adsorptive Reactor (AR) Model
37
. , 1 1r r r r rtot gas j f j gas bed z i j gas bed j cat cat j gas bed ad ad adc v c D c R R
t
1cat ad qua
Component Mass Balances
Energy balance:
.1
1
1
1 1 1
1 1
s
s
s
n rr r r r r r r r r
gas bed cat c c gas bed ad ad ad gas bed qua qua qua tot gas j jj
nr r r r rA j j f
j
nr
gas bed j cat cat j j gasj
TC C C c Ct
c C v T
T H R
4 rw
bed ad ad ad ad wt
hH R T Td
0
0.
.
ln
0.75
10.139 0.0339 2 / 3 /
2.03
w furrw tw w w w
thick t thick t thickt thick
t
z zp
g g
rtot gasrz
tot gasg gas bed g p
pw tp
g t
U T TT dC h T Tt w d w d w
d wd
Pr Re
dh d Re expd
22
3 32
1 1150 1.75gas bed gas bedr r r r r r r r
D f v f f f f f
gas bed p gas bed p
P K v K v P v vd d
Momentum balance:

Adsorptive Reactor (AR) Model
38
Initial and boundary conditions for the AR model.
Initial Conditions: Boundary Conditions:
0
0,
rj
r rin
r rin
c
T T for t z
P P
0
0
0
0
r rf f
in
r rin
r rj j
in
r rin
r
rj
r
v v
P Pfor z
c c
T T
T
n for z L
P
Constitutive laws and other property equations.
Gas Law:
rTOT
PcZRT
Definitions:
1 1 11, , , 1
s s sn n np r
j tot j i cat ad quaj j j
x c c P P
Heat Flux (Fourier’s Law):
Q T
Dimensionless Groups :
,, ,p f g p p g gp
g g g
hd v d CNu Re Pr
Viscosity of Gas Mixture :
21/2 1/4
1/21
1
1,
8 1
s
s
N i j j ii i
g ijNi
i ji ijj
M Mx
M Mx
Thermal Conductivity:
1 1 1r r r rv cat cat v qua qua v ad qua v g
Thermal Conductivity of Pure Gases:
2 3i i i i iA BT C T DT
Thermal Conductivity of Gas Mixture:
21/2 1/4
1/21
1
1,
8 1
s
s
N i j j ii i
g ijNi
i ji ijj
M Mx
M Mx
Specific Heat Capacity of Pure Gases:
2 3 20, 1, 2, 3, 4, , 1000i i i i i i
TC a a t a t a t a t t
Specific Heat Capacity of Gas Mixture:
,,
1
1
s
s
Ni i p i
p g Ni
i ij
x M CC
x M

39
AR (Batch Adsorber/Static System) Model
2 2
2 2
2 2
20
00
, 0 ,0
CO CO T s
CO COex exCO CO
t
l CO
P P tV V
Z T P RT Z T P t RTn t n
n P t dt
The Langmuir Isotherm:
2 2
2
2
21CO CO COeq
CO CO
m b Pq
b P
mCO2 (mol/kg) b (1/bar)
2.952592 3.690865

40
Model/Experimental Validation

41
Membrane Reactor Model Experimental Validation
0
20
40
60
80
100
20 70 120 170
CO con
version %
Weight of catalyst / Molar flow rate of COEmpirical model Multi‐scale Equilibrium conversion
0
20
40
60
80
100
20 70 120 170
CO con
version %
Weight of catalyst / Molar flow rate of COEmpirical model Multi‐scale Equilibrium conversion
Conversion vs. W/FCO for MR (feed pressure 14.1 bar, reactor temperature 300⁰C, sweep ratio = 0.1).
Conversion vs. W/FCO for MR (feed pressure 14.1 bar, reactor temperature 300⁰C, sweep ratio = 0.3).

42
Membrane Reactor Parametric Study
Conversion vs. W/FCO for MR (feed pressure 39.6 bar, feed temperature 217⁰C).
Conversion vs. A/FCO for MR (feed pressure 39.6 bar, feed temperature 217⁰).
0
10
20
30
40
50
60
4 4.5 5 5.5 6 6.5 7
Con
vers
ion
%
W/F_CO (g_cat*h/mol_CO)
0
5
10
15
20
25
30
35
40
45
0 0.0001 0.0002 0.0003 0.0004 0.0005
Con
vers
ion
%
A_mem/F_CO (m^2*h/mol_CO)
NETL Case Study FeedFeed Pressure 39.6 bar, Feed Temperature 217⁰C
x_Ar=0.0047, x_CH4=0.003, x_CO=0.2873, x_CO2=0.00070, x_COS=0.0003, x_H2=0.1491, x_H2O=0.5172, x_HCl=0.0001, x_H2S=0.0040, x_N2=0.0281, x_NH3=0.0019

43
Membrane Reactor Parametric Study
NETL Case Study FeedFeed Pressure 39.6 bar, Feed Temperature 217⁰C
x_Ar=0.0047, x_CH4=0.003, x_CO=0.2873, x_CO2=0.00070, x_COS=0.0003, x_H2=0.1491, x_H2O=0.5172, x_HCl=0.0001, x_H2S=0.0040, x_N2=0.0281, x_NH3=0.0019
W/F_CO (g_cat hr/mol_CO)
A/F_CO (m^2 hr/mol_CO) Conversion % Total Catalyst (kg)
Total Membrane Surface Area
(m^2)4.32 0.000196 26.20 46845 21315.18 0.000236 35.25 56215 25576.47 0.000294 51.60 70267 31964.21 4.79E-05 15.60 45743 5204.21 9.58E-05 19.04 45743 10404.21 0.000192 26.20 45743 20814.21 0.000383 42.70 45743 41615.02 5.71E-05 20.20 54490 6205.02 0.000114 24.80 54490 12395.02 0.000228 35.25 54490 24785.02 0.000457 59.50 54490 49576.28 0.000143 35.30 68160 15506.28 0.000286 52.60 68160 31006.28 0.000571 78.00 68160 6200

44
Adsorptive Separator Model Experimental Validation
CO2 outlet concentration at the exit of the adsorber
(Experiment vs. Simulation). Temp.= 523.15 K, Pressure = 5 bar.CO2 outlet concentration at the exit of the adsorber
(Experiment vs. Simulation). Temp.= 523.15 K, Pressure = 15 bar.
CO2 outlet concentration at the exit of the adsorber
(Experiment vs. Simulation). Temp.= 523.15 K, Pressure = 25 bar.

45
AR Model Experimental Validation
Molar ratio of H2/CO at the AR outlet.
(Experiment vs. Simulation).Molar ratio of CO2/CO at the AR outlet.
(Experiment vs Simulation).
Percent CO conversion at the AR outlet.

46
Adsorption/Desorption Periodic Operation
0
0.5
1
1.5
2
2.5
0 1 2 3 4 5 6
q (m
ol/kg)
Recator Length (Cycles 1‐5)
39.6 bar
ADSORPTION/DESORPTION Cycles (q profile along the reactor from fresh to fifth cycle)

47
Adsorption Step for Fifth Cycle
Species Molar Flow Rate at the exit of the adsorber
Temp.= 523.15 K, Pressure = 39.6 bar.
AR-A Exit
F_CO_AVERAGE (mol/s)=
F_CO2_AVERAGE(mol/s)=
F_H2_AVERAGE (mol/s)=
F_H2O_AVERAGE (mol/s)=
F_INERT_AVERAGE (mol/s)=
48
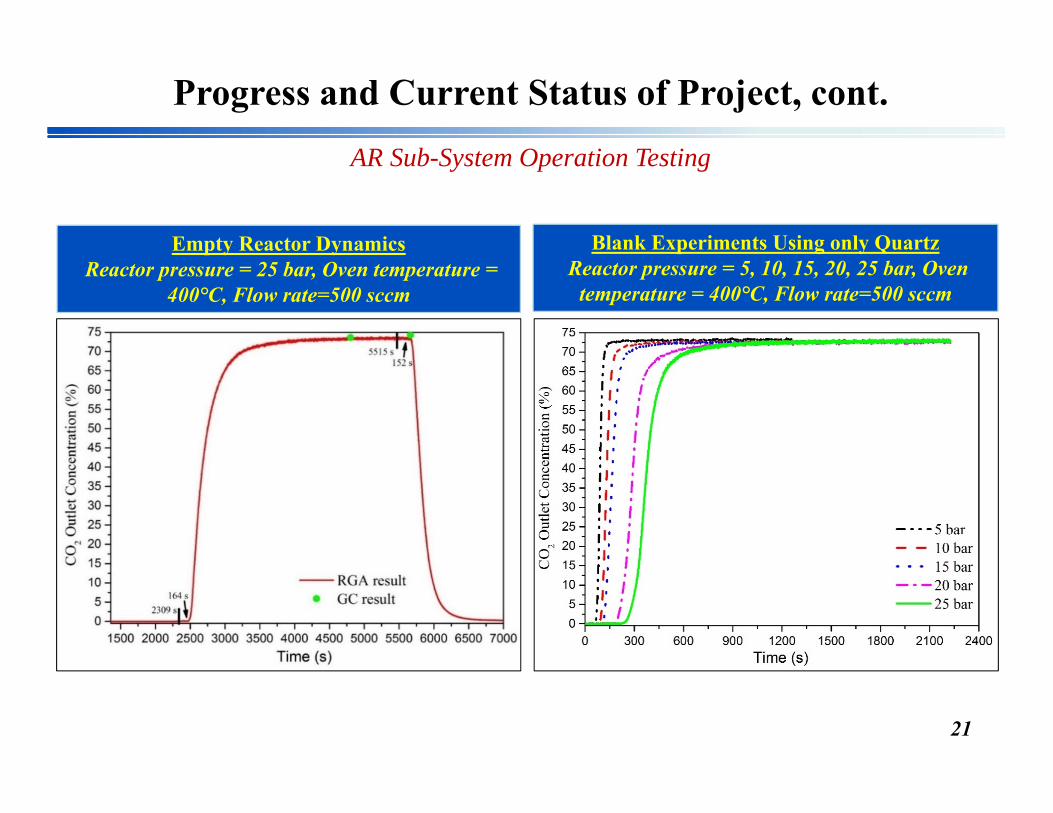
Desorption Step for Fifth Cycle
Species Molar Flow Rate at the exit of the reactor
Desorption, Temp.= 523.15 K, Pressure = 39.6 bar.
Species Mole Fractions at the exit of the reactor
Desorption, Temp.= 523.15 K, Pressure = 39.6 bar.
AR-D ExitF_AVERAGE(mol/s)=
xb_H2O_AVERAGE=
xb_CO2_AVERAGE=

49
Combined MR-AR System: Success Criteria Satisfaction
% CO Conversion % H2 Purity % H2 Recovery % CO2 Purity % CO2 Recovery
Target <95 <95 <90 <95 <90
MR-AR
Attainability
x=57.64
y=10
z=10
m=100
100 96.9 99.9 98.451 99.83
x=115.29
y=10
z=10
m=100
100 96.9 99.9 98.451 99.8
x=230.58
y=10
z=10
m=100
100 96.9 99.9 98.451 99.8
x=Wcat/FCO(g_cat*h/CO_mol) in MRy=Catalyst amount (gr) in MRz=Catalyst amount (gr) in ARm= Adsorbent amount (gr) in AR

50
NETL Shell IGCC w/o CCS (Case B1A)

51
NETL Shell IGCC w/ CCS (Case B1B)

52
Proposed Process Scheme Integration
WGS-MR
WGS-AR
FlashFlash
CGCU

53
Proposed Process Scheme
Membrane Reactor
Adsorptive Reactor
Flash
DistillationColumn
CGCU

54
Preliminary Technical-Economic Analysis for MR-AR Technology (NETL Case Study)
DesignsNet Power Production (Mwh/Ton)
CO2 Capture (%)
Shell IGCC w/o CCS - Sulfinol 4.68 0Shell IGCC w/ CCS– 2 Stage Selexol 3.69 90
Shell IGCC w/ CCS- Membrane Reactor and Adsorptive Reactor 3.91 96
% CO Conversion % H2 Purity % H2 Recovery % CO2 Purity % CO2 Recovery
Target <95 <95 <90 <95 <90
MR-ARRealization 98 *91.8 96 99.5 95
* Maximum attainable purity based on composition of utilized Syngas

55
Preliminary Technical-Economic Analysis for MR-AR Technology (NETL Case Study)
Designs Total Gross Power (MWe)
Total Compression Power (kWe)
Acid Gas Removal
(kWe)
Claus Plant Rec Comp
(kWe)
Net Power (MWe)
Shell IGCC w/o CCS - Sulfinol 737 0 620 1140 629
Shell IGCC w/ CCS– 2 Stage Selexol 673 30210 18650 2080 497
Shell IGCC w/ CCS- Membrane Reactor and Adsorptive Reactor 677 23,300 992 1674 526

56
Preliminary Technical-Economic Analysis for MR-AR Technology (NETL Case Study)
MR-AR Process (Equipment Cost)
WGS Membrane Reactor (Tube)$13,889,811.72
WGS Membrane Reactor (Membrane)$12,893,975.68
Adsorption Reactor (Tube) $15,736,899.56
Sulfinol System $46,130,000.00
Distillation Column $21,885,722.77
Flash Separator (Syngas) $416,488.67
Flash Separator (H2) $24,506.44
Flash Mem Cooler $32,567.48Ads Cooler $34,927.84
Flash Ads Cooler $146,936.36
Total Equipment Cost $111,191,836.51
NETL w/ CCS:Double Stage SelexolEquipment Cost: $162,818,000

57
Compact Process Advantages
• Simultaneous CO conversion and H2 and CO2 separation
• MR-AR Compression Work: <50% of IGCC w/ CCS compression work
• Equipment Capital Cost: <65% of IGCC w/ CCS dual-stage selexol unitequipment cost .
• Catalyst Amount: <70% of IGCC w/ CCS catalyst amount
• High Purity Hydrogen Produced

58
Summary of Technical Accomplishments To Date
• Completed the construction of the lab-scale MR-AR experimental system.
• Prepared and characterized CMS membranes at the anticipated processconditions.
• Prepared and characterized adsorbents at the anticipated processconditions, and generated global rate expressions for the catalyst.
• Began testing of the individual MR and AR subsystems.
• Developed mathematical models and began validating their ability to fitthe experimental data.

59
Budget Period 1(BP1):
Task 4.0 - Initial Testing and Modeling of the Lab-Scale Experimental System. -----USC, UCLA
Subtask 4.1 - Unit Operation Testing - Continue and complete the testing of the individual MR and AR subsystems.
Subtask 4.2 - Mathematical Model Development and Simulations - Continue and complete the development of the mathematical models and their validation with the available experimental data.
Budget Period 2 (BP2):
Task 5.0 - Integrated Testing and Modeling of the Lab-Scale Experimental System. -----M&PT, USC
Subtask 5.1 - Materials Optimization and Scale-up.
Subtask 5.2 - Integrated Testing.
Subtask 5.3 - Model Simulations and Data Analysis.
Task 6.0 - Preliminary Process Design/Optimization and Economic Evaluation. -----UCLA, M&PT, USC
Subtask 6.1 - Process Design/Optimization.
Subtask 6.2 - Sensitivity Analysis.
Plans for Future Testing/Development/Commercialization

60
Project Success Criteria –BP2
Technical Approach/Project Scope, cont.
Basis for Decision/Success Criteria
Successful completion of all work proposed in Budget Period 2.
Completion of short-term (24 hr) and long-term (>100 hr) hydrothermal/chemical stability evaluations. Membranes/adsorbents are stable towards fuel gas constituents (e.g., NH3, H2S, H2O) at the anticipated process operating conditions. Target <10% decline in performance over 100 hr of testing.
Completion of integrated testing and system operated for >500 hr at optimal process conditions.
Results of the initial technical and economic feasibility study show significant progress toward achievement of the overall fossil energy performance goals of 90% CO2 capture rate with 95% CO2 purity at a cost of electricity 30% less than baseline capture approaches
Submission of updated membrane and adsorbent state-point data tables based on the results of integrated lab-scale MR-AR testing
Submission of a Final Report

61
Milestone Log –BP2
Technical Approach/Project Scope, cont.
Title/DescriptionPlanned
Completion Date
Actual Completion
Date Verification Method
Comments (progress for achieving milestone, explanation
from deviation, etc.)
Parametric testing of the integrated, lab-scale MR-AR system and identification of optimal operating conditions for long-term testing completed
9/30/2017Results reported in the quarterly report
Short-term (24 hr for initial screening) and long-term (>100 hr) hydrothermal and chemical stability (e.g., NH3, H2S, H2O, etc.) materials evaluations at the anticipated process conditions completed
3/31/2018 Results reported in the quarterly report
Integrated system modeling and data analysis completed
3/31/2018Results reported in the quarterly report
Materials optimization with respect to membrane permeance/selectivity and adsorbent working capacity at the anticipated process conditions (up to 300ºC for membranes and 300-450ºC for adsorbents, and up to 25 bar total pressure) completed
6/30/2018Results reported in the quarterly report
Operation of the integrated lab-scale MR-AR system for at least 500 hr at the optimal operating conditions to evaluate material stability and process operability completed
6/30/2018Results reported in the quarterly report
Preliminary process design and optimization based on integrated MR-AR experimental results completed
9/30/2018Results reported in Final Report
Initial technical and economic feasibility study and sensitivity analysis completed
9/30/2018Results reported in Final Report

62
Project Risks and Mitigation Strategies
Technical Approach/Project Scope, cont.
Description of RiskProbability (low, moderate, high)
Impact (low, moderate, high)
Risk Management Mitigation and Response Strategies
Technical Risks:Adsorbent not chemically stable in presence of syngas components
Moderate High Explore the addition of a warm or cold gas clean-up step into the process design
Concerns with the adsorbent’s physical integrity under the operating conditions
Moderate ModerateReduce heating/cooling rates; improve physical strength during preparation via increased binder content. Replace TSA with PSA or hybrid TSA/PSA operation
Model does not fit experimental data
Low Low Investigate causes of poor fit. Re-evaluate intrinsic system parameters
Experimental difficulties with high-pressure reactor operation and temperature control
Moderate ModerateIdentify and fix leaks; replace malfunctioning valves and high-pressure components; adjust control hardware/software
Resource Risks:
Equipment malfunction Moderate Moderate Use back-up systems, when available. Repair malfunctioning equipment
Personnel performance issues Low Moderate Address/remedy performance issues. Replace personnel, if need arises
Delays in delivery of materials from M&PT to USC
Low Moderate Improve coordination between M&PT and USC
Budgetary issues, i.e., not enough funds to complete a certain Task
Low LowSeek DOE guidance and approval for shifting funds from less critical tasks and consolidating certain activities
Management Risks:
Poor coordination among PI’s Low HighAddress communication/coordination issues. Increase frequency of meetings and data exchange and coordination
IP ownership issues develop Low ModerateFace-to-face meetings among PIs and appropriate administrative people. Address/remedy issues and disagreements

63
Acknowledgement
The financial support of the US Department of Energy and the technical
guidance and assistance of our Project Manager Andrew Jones are
gratefully acknowledged.