Embed Size (px)
DESCRIPTION
Ultrasonic Harmonic Imaging
Citation preview
1490 IEEE TRANSACTIONS ON MEDICAL IMAGING, VOL. 21, NO. 12, DECEMBER 2002
A High-Resolution Technique for UltrasoundHarmonic Imaging Using SparseRepresentations in Gabor Frames
Oleg Michailovich*, Student Member, IEEEand Dan Adam, Senior Member, IEEE
Abstract—Over the last few decades there were dramaticimprovements in ultrasound imaging quality with the utilizationof harmonic frequencies induced by both tissue and echo-con-trast agents. The advantages of harmonic imaging cause rapidpenetration of this modality to diverse clinical uses, amongwhich myocardial perfusion determination seems to be the mostimportant application. In order to effectively employ the informa-tion, comprised in the higher harmonics of the received signals,this information should be properly extracted. A commonlyused method of harmonics separation is linear filtering. One ofits main shortcomings is the inverse relationship between thedetectability of the contrast agent and the axial resolution. In thispaper, a novel, nonlinear technique is proposed for separating theharmonic components, contained in the received radio-frequencyimages. It is demonstrated that the harmonic separation canbe efficiently performed by means of convex optimization. Itperforms the separation without affecting the image resolution.The procedure is based on the concepts of sparse signal represen-tation in overcomplete signal bases. A special type of the sparsesignal representation, that is especially suitable for the problemat hand, is explicitly described. The ability of the novel techniqueto acquire “un-masked,” second (or higher) harmonic images isdemonstrated in series of computer and phantom experiments.
Index Terms—Gabor frames, harmonic imaging, sparse repre-sentations, ultrasound.
I. INTRODUCTION
WHILE in conventional medical ultrasound only thefundamental signal frequencies are used to construct an
image, in harmonic imaging the second (or higher) harmonicsecho signals are also acquired and displayed. The employmentof harmonic information has been proven to be a powerful tool,remarkably extending the capabilities of the clinical ultrasound.
When the higher harmonics are not present in the transmittedpulse, they are mostly caused either by nonlinear propagation ofthe sound wave in the tissue or by the presence of a medium thatis capable of reflecting (or reradiating) the transmitted energy innonlinear manner, e.g., contrast agents [1]. As a consequence,
Manuscript received March 3, 2002; revised September 23, 2002. The workof O. Michailovich was supported by the Israeli Planning and Budgeting Com-mittee (VATAT) of the Council for Higher Education. The Associate Editorresponsible for coordinating the review of this paper and recommending its pub-lication was M. W. Vannier.Asterisk indicates corresponding author.
*O. Michailovich is with the Department of Bio-Medical Engineering,Technion-Israel Institute of Technology, 32000 Haifa, Israel (e-mail: [email protected]).
D. Adam is with the Department of Bio-Medical Engineering, Technion-Israel Institute of Technology, 32000 Haifa, Israel.
Digital Object Identifier 10.1109/TMI.2002.806570
several imaging modalities have been developed during the lastdecade, which are intended to acquire and process the harmonicinformation, or even to separate one kind of such informationfrom another [2]–[6].
Although the harmonic imaging was originally developed forprocessing echoes from ultrasound contrast agents, it has beenproven to be exceedingly productive to image the harmonicswithin the ultrasound echoes (mainly the second harmonics)even in the absence of contrast agents. This is commonly callednative harmonicor tissue harmonic imaging. The reason for thegeneration of harmonics by the tissue is a slight nonlinearity ofthe sound propagation, which results in gradual deformation ofthe wave shape. It was recognized that the ultrasound images,obtained in the “second harmonic” mode, have enhanced reso-lution and reduced acoustic noise [2], [7]–[10].
Unfortunately, harmonic imaging possesses a seriousproblem ofresolution-detectability tradeoff. It is an inevitableconsequence of the fact, that in most of the existing commercialscanners, the harmonic selection is performed bylinear fil-tering. An example of nonlinear harmonic separation method isthe recently proposed pulse-inversion technique for the secondharmonic enhancement [1]–[4], but even in this case the bubblemotion artifact results in retaining of a significant portion ofthe first harmonic information in the resultant signal, necessi-tating application of a linear filtering to complete the task. Inthis case, the improvement of the imaging resolution causesunavoidable deteriorations of the measurement of the higherharmonics, andvice versa. Indeed, the narrower the transmittedfrequency band is, the smaller is the spectral overlap betweenthe fundamental and harmonic frequencies and, thus, thehigher is the efficiency of the linear filtering for the harmonicseparation. Obviously, the narrowing of the frequency bandworsens the image resolution, putting limitations on imagequality. This situation is sketched in Fig. 1, demonstrating theoverlap of the fundamental and second harmonic bands. Onecan formalize the “condition for overlap” as follow. Supposethe support of the first frequency band belongs to the set
. Then it is easy to see, that the overlapof the harmonic bands takes place whenever .
The question, which the current paper is addressing, iswhether there exists a (possibly, nonlinear) technique that iscapable of separating the fundamental and harmonic frequen-cies of the received echo sequences, in which the bandwidthssignificantly overlap. Moreover, such a technique must besubjected to an additional constraint, requiring preservation ofthe spectral bandwidths of fundamental and higher harmonics
0278-0062/02$17.00 © 2002 IEEE

MICHAILOVICH AND ADAM: A HIGH-RESOLUTION TECHNIQUE FOR ULTRASOUND HARMONIC IMAGING 1491
Fig. 1. A schematic diagram of an overlap between the fundamental andsecond harmonic frequency bands.
after the separation. The advantage of such a harmonic-sepa-ration technique is self-evident: it could enhance the qualityof harmonic imaging, without the usual “tradeoff” betweenharmonic detectability and imaging resolution.
The main contribution of the current paper is the proposalof a nonlinear harmonic-separation method, which fulfills theabove requirements, and which can be efficiently implementedby means of convex optimization. The approach is taken fromthe field ofsparse signal representations[11], which was suc-cessfully applied to the problem ofblind source separation [12].The superior ability of the sparse signal representation to sepa-rate components of signals, made up of a superposition of a fewdisparate phenomena, was reported [13]. The results obtainedhere confirm the advantages of the sparse decompositions overthe traditional linear approaches.
Since the harmonic separation procedure is iterative, thecomplexity of the problem should be maximally reduced so asto minimize the computational load. Such a reduction can beachieved by means of the demodulation technique that is aninherent part of almost all current commercial imaging systems.In order to handle more efficiently the harmonic signals, aslight modification of the standard demodulation scheme isproposed here, which is explicitly explained in Section IVbelow. It will be shown that the demodulated signals can beefficiently represented usingframes, derived from the familiarGabor frame by an appropriate modulation and bandwidthadjustment (see Section V below).
The paper is organized as follows. Section II introduces the-oretical preliminaries, which are necessary to form a basis forthe following derivations. Different models of the signals underconsideration and appropriate demodulation strategies are in-troduced in Sections III and IV, respectively, where also a proofis provided that these procedures are optimal from the view-point of lossless reduction of the data size. Section V providesa brief introduction to Gabor frames, with extension of its def-inition also to the discrete case. It also describes modificationsof standard Gabor frames, which are necessary for efficient rep-resenting the harmonic signals at hand. The algorithm structureis summarized in Section VI. Section VII contains examples of
computer-based simulation results, while Section VIII providesresults from experiments done with a phantom. Section IX in-cludes discussion of the main results of the study.
II. GENERAL FORMULATION
While methods of the blind source separation consider therather more complicated problem of separating a set of linearmixtures onto a number of unknown source signals, the problemof harmonics separation may be stated as follows. The acquiredradio-frequency (RF) sequence, that generally comprises thefirst (fundamental) as well as higher harmonics, may be consid-ered as a mixture of a few sources. The slightly simplified ver-sion is when only the first and the second harmonics are allowedto exist, and the RF sequence is modeled as a sum of two sig-nals, which represent activity of the first and second harmoniccomponents respectively, plus a noise term. Note that the modeldoes not require stationarity of these components, which cannotbe expected due to the process of dispersive (frequency-depen-dent) attenuation in biological tissues [14], [15]. Now, let,
, denote a subspace of the Hilbert space of square in-tegrable functions. Also let the received signal be a sumof , , , which are the first and second har-monic components, and the noise, respectively. Also, supposethat there exists a set of functions, , , where
is a set of indices, constituting aframein the signal space(i.e., a set of, generally, linearly dependent vectors, whose spanis dense in ). Then
(2.1)
Now, let and be two subsets of , namely ,, and , where denotes the space
of square summable sequences. Then, the harmonics separationproblem can be formulated as the following optimization task,searching for:
(2.2)
In words, one needs to find the sequence and index sets, , such that the linear combination of the functions ,
, with the coefficients, respectively given bythe subsequences , , will be as close as pos-sible to the signal components, , correspondingly.When the optimal solution is found, the desired signal compo-nents are estimated as
(2.3)
The in (2.3) denotes an estimate of the appropriate value.Unfortunately, the minimization problem (2.2) cannot be
solved directly, until we are given anoracle, providing us withthe functions and . Hence, it is useful to find another(possibly sub-optimal) optimization procedure, which willpossess the following three important properties.
1) It must be solvable (that implies obtaining the solution infinite time, without requiring either infeasible additionalinformation or conditions).

1492 IEEE TRANSACTIONS ON MEDICAL IMAGING, VOL. 21, NO. 12, DECEMBER 2002
2) The solution obtained by this optimization algorithm,should be as close as possible to that of the originalproblem (2.2).
3) The computational burden of this procedure, should bereasonable, implying a potential for real-time processing.
Such a procedure does exist and its applicability has beendemonstrated in [11]–[13] for superresolution representation ofsparse signal components and for the blind source separation.Finding the sparse solution to (2.2) is a difficult, combinato-rial problem. However, under certain conditions, which were re-cently reviewed in [16], it can be considered equivalent to theconstrained optimization problem, given by
s.t. (2.4)
The problem (2.4) is commonly known asbasis pursuit(BP)—aterm, introduced in the pioneering works on this subject [11],[13]. It is a convex, norm-minimization problem, which can beefficiently solved by means of thelinear programming(LP).
Note that when noise contaminates the signal to be decom-posed, the problem (2.4) can be modified to the following un-constrained form:
(2.5)
A computationally efficient solution to (2.5), as well as the rulesfor choosing the parameter, are given below.
The optimization problem (2.5) can be efficiently employedto separate the fundamental and higher harmonics. Without anyloss of generality the formal procedure of harmonics separa-tion, given below, will deal with the problem of “first” and“second” harmonics separation, because its generalization isstraightforward.
The construction of is a crucial step, on which the suc-cess of the separation procedure depends in great degree, there-fore, it requires some explanation. First, it is signal dependent.In order to build maximally effectively, some a priori informa-tion about the signals and should be incorporated: knowl-edge of central frequency of the transducer in use and of itsfundamental bandwidth are sufficient, and this information canbe effortlessly obtained through a simple calibration procedure,preceding the processing.
III. SIGNAL MODELS
In order to design a useful frame, it is required to first de-fine a general model for the signals of interest, with as minimalnumber of assumptions as possible. Such a model can be ob-tained by describing the signals as band-limited (or bandpass)signals [17, Ch. 7], as follows. Let be a received RF signal,consisting of two components , which inthe context of the present study are interpreted as the first andsecond harmonic components of the signal. The noise term,which should be added whenever actual signals are modeled, istemporarily ignored for clarity. In most cases, these signals areband-limited (bandpass), implying the following description:
where (3.1)
Here denotes the central frequency of the transmitted ultra-sound pulse, and are the description pa-rameters. The two-sided spectra of and are peakedin the vicinity of the frequencies and , correspond-ingly. While the spectrum of the fundamental harmonic can beassumed to be enclosed within a band of width , namely
Support
(3.2)
that of the second harmonic might have its support, enclosed inan interval of rather different width.
Generally, there are two cases, which depend strongly on thetransmitted waveform and on a specific kind of the imposednonlinearity. In the first case, the bandwidth of the second har-monic component is approximately equal to that of the funda-mental harmonic, formally
Support
(3.3a)
Such a situation frequently takes place, when the nonlinearpropagation of the ultrasound wave is of concern [18]. In thesecond case, the spectrum of the second harmonics, whenreceived from disrupting contrast agents, can have even adoubled width, as compared with the fundamental band [19].In this case
Support
(3.3b)
Although the case (3.3a) is included in (3.3b), both these caseswill be treated separately throughout the paper, because theylead to two distinct algorithms, which have considerably dif-ferent complexity.
It is important to note, that basically the ultrasound pulse isproduced by a resonance system (the transducer piezoelectricelement), where its motion can be described by a second-orderdifferential equation. It implies an ultrasound pulse of an os-cillatory nature and, hence, its fundamental spectrum shouldconverge to zero in the neighborhood of . As a result,one can conclude, that . Regarding the overall signal
, one concludes that Support forthe case (3.3a) and Support for the case(3.3b). It implies, that these signals are to be digitized at the sam-pling rates and , respectively. Because thesampling rate is proportional to the bandwidth of the bandpasssignal, it is often convenient to represent it in terms of a low-passsignal, whenever the latter can be sampled at a lower samplingrate. It is performed through a cancellation of a high-frequencycomponent of the bandpass signals, known asdemodulation. Itsmodified versions, specially adapted to the harmonic separationproblem, are introduced in the next section.
IV. A UGMENTED DEMODULATION
Since the received RF sequences are real, their Fouriertransforms exhibit conjugate symmetry. It implies a possibilityto describe these signals in the Fourier domain only over thepositive semi-axis, i.e., for . Consequently, the

MICHAILOVICH AND ADAM: A HIGH-RESOLUTION TECHNIQUE FOR ULTRASOUND HARMONIC IMAGING 1493
signals and , when treated separately, can be com-pletely characterized by the complex signalsand , respectively, conditioned that is knownin advance [17, Ch. 7]. It was found to be very useful toexecute the harmonics separation procedure in the domainof low-pass signals. The reason for this is twofold. First, itleads to efficient localization of the signal spectrum, and,consequently, to optimal reduction of the problem size. Second,this representation facilitates construction of a frame (as shownin the section below), which is useful in the context of theharmonics-separation problem.
In order to express the signal in the low-pass domain, butin an equivalent form, a technique similar to the familiar demod-ulation can be used. It differs from the standard procedure by therequirement that the information, characterizingbothharmoniccomponents, must be saved in the low-pass domain without lossor aliasing. Slightly different demodulation schemes are used forthe twocases,when thebandwidthof thesecondharmonic issim-ilar to that of the fundamental component, and when it is broader.
A. Equal Harmonic Bandwidths
In this case the demodulation is performed by the followingtwo simple steps. First, is multiplied by a complex expo-nent, whose frequency is the average of and , i.e.,
. Second, the resultant (complex) signal is subjectedto a low-pass filter, whose passband is defined by the interval
. According to the assumption (3.3a), the signal,so obtained, is given (accurate up to the error introduced by thefiltering) by
(4.1)
From the context of the problem it is obvious, that the complexsignals and represent activities of the first and secondharmonic components, correspondingly. Moreover all the orig-inal information is preserved by these signals, up to the error,induced by the filtering. It should be noted that the frequencyband, spanned by the signal is smaller by a factor of two, incomparison to that of . The components of have theirfrequency support included within the intervals, given by
Support
Support (4.2)
The steps of this demodulation are depicted in Fig. 2. In Fig. 2(A)the “power spectra” of the signals and are illustrated.Note that these spectra are sketched schematically in order toclearly describe their support in the frequency domain. In orderto distinguish between them, the “spectrum” of the secondharmonic signal is drawn at lower amplitude. The signalsspectra, as obtained after the frequency shift and filtering, areshown in Fig. 2(B). Finally, one can see that the spectra ofand are supported in the interval , wherethey are positioned symmetrically around the origin. Supposingthat the applied low-pass filter has a narrow transition band, onecan sample the analog signal at the rate equal to Hz.
The sampling results in the complex sequence ,consisting of the sequences and ,
which represent as before, the first and second harmonics,respectively.1 In this case, according to the discussion above,the Fourier series of these sequences, and , withinone period (i.e., within the interval ), are peaked inthe vicinity of , respectively, and supported within theintervals
Support
Support (4.3)
It is possible now to consider the sequence to belongto the signal subspace , which is a space of -se-quences, whose Fourier series are supported within
. Analogously, one can consider the sequenceas being in the subspace , which is com-
prised of the -sequences, having its Fourier series supportedwithin .
B. Nonequal Harmonic Bandwidths
From purely theoretical point of view, the bandwidth ofthe second harmonic component depends on the waveformof the transmitted pulse and specific kind of the nonlinearity,imposed by the insonified medium. To be as general as possibleunder such circumstances, one can assume that the bandwidthof the second harmonic component can be at most twice thefundamental bandwidth. Consequently, in order to preservethis component maximally undistorted in the low-pass domain,the frequency shift (demodulation) is set to be and thesubsequent low-pass filter has its passband defined by theinterval . In this case the resultant complex signalcan be represented as
(4.4)
As in the previous case the resultant bandwidth is half the orig-inal, and the complex signals and are peaked around
and 0, respectively, and have their frequency bands sup-ported within
Support
Support (4.5)
Fig. 3 illustrates this demodulation procedure, where the contentof panels (A) and (B) are the same as those of Fig. 2.
Supposing the low-pass filter has a narrow transition band, thecomplex signal can be sampled at the rate equal to .Consequently, the sequences and havetheir Fourier series supported within
Support
Support (4.6)
Analogously to the previous case, one can define the signal sub-spaces and to which the sequences
and are supposed to belong. The nextsection addresses the construction of a frame that will be repre-sentative for the signal components included inand .
1In order to simplify the notation below, the same regular case characters willdenote both the sampled signals and the corresponding analog signals.

1494 IEEE TRANSACTIONS ON MEDICAL IMAGING, VOL. 21, NO. 12, DECEMBER 2002
Fig. 2. Demodulation for the case of equal bandwidths of the first and second harmonics. (A) “Power spectra” of the signalsf (t) andf (t). The “spectrum” off (t) has lower amplitude for convenience of visualization. Note that this sketch is merely schematic, intended to clarify the spectra supports. (B) “Power spectra”of p (t) andp (t) (after demodulation). Note the symmetry around the origin.
V. GABOR FRAMES FORHARMONIC SEPARATION
The ultrasound signals could be referred to as signals havingtransitory characteristics, specifically when their echoes containhigher harmonics of the transmitted frequency, e.g., when con-trast agent imaging is performed. In such a case, the higher har-monics, radiated from the contrast agent, exhibit a local char-acter, implying that these harmonics appear astransientsin thereceived RF lines. Thus, an optimal analysis of such a phenom-enon may be done by an expansion of the signals into basis func-tions, which have a compact support both in time and frequency.Among all possible choices of the basis functions, having a com-pact support both in time and frequency [20], Gabor functionsseem to be the most suitable in the context of the present studyfor the reasons detailed below.
A. Gabor Frames for
Gabor theory treats expanding signals as linear combinationsof elementary signals that are obtained from a single function(the window) by shifting it in time and frequency by integermultiples of a time and a frequency shift parameter (detailed dis-cussion may be found in [21]–[23]). Because in practice all the
ultrasound signals are sequences of finite duration, the Gaborframes for the space are briefly introduced below to clarifythe following frame construction.
Let be a finite-duration sequence, representing acomplex data signal. It can also be viewed as a vector in theEuclidian space . Similarly, let be a sequence,referred to below as a window. Given the window , a dis-crete Gabor frame in is generated by shifting both in“time” and “frequency” (the inverted commas are used, sincethe meaning of time and frequency is not obvious, when con-cerning the vectors in ). Let , denote thetime-shift parameter, chosen such thatis an integer multipleof . For the vectors in one can define thecircular shift
by , where , as
(5.1)
There are only significant shifts, so that the indexin (5.1) obtains values within the range
. The “frequency sampling” is characterized by a modulationparameter , where . Themodulationby of the vectors in is defined as
(5.2)

MICHAILOVICH AND ADAM: A HIGH-RESOLUTION TECHNIQUE FOR ULTRASOUND HARMONIC IMAGING 1495
Fig. 3. Demodulation for the case of nonequal bandwidths of the first and second harmonics. (A) “Power spectra” of the signalsf (t) andf (t). The “spectrum”of f (t) has lower amplitude for convenience of visualization. (B) “Power spectra” ofp (t) andp (t) (after demodulation).
Due to periodicity of the Fourier series, there are only significant shifts,
implying in (5.2). Now it is possibleto define the following collection of vectors, obtained byapplying a composition of the shift and modulation operatorsto :
(5.3)
It was explicitly investigated in [22], [23] that the collection,given by (5.3), can constitute a frame in with good “time-frequency” localization properties, on condition that
(5.4)
The vector set must span all of in order to bea frame in this space, implying that .This results in the requirement .
Let be a -by- matrix, whose columns are formed byall vectors , as given by (5.3). Now, ,one has [24]
(5.5)
where the symmetric matrix is known as aframe op-erator, and and are minimal and maximal eigenvalues of,respectively. Consequently it can be concluded that every ma-trix with column rank uniquely represents a frame, where
thecondition numberof the frame operator (which is the ratioof the frame bounds and ) defines stability of the represen-tation by the given frame [21].
The properties of the Gabor frames can be quite different, de-pending on the selection of the discrete window and the param-eters and . The selection especially useful in the context ofthe harmonics-separation is considered next.
B. Case 1: Equal Harmonic Bandwidths
We start by considering the case, when the bandwidths of thefundamental and second harmonics are approximately equal. Arelative position of the harmonic components of a discrete se-quence is shown in Fig. 2(B). For this specific case, theframe is chosen, as specified by (5.3), where the“frequency-sampling” parameter is fixed to be three, i.e.,
. Let , , denote subsets,applicable to a particular choice of a modulation phase. Conse-quently, the entire vector set can be viewed as a union of,
, namely for
(5.6)
It is important to emphasize that within each subset,, the vectors are identical up to a linear phase (i.e., cir-
cular shift).The next parameter to be chosen is the form of the discrete
window . It is defined in such a way that its
1496 IEEE TRANSACTIONS ON MEDICAL IMAGING, VOL. 21, NO. 12, DECEMBER 2002
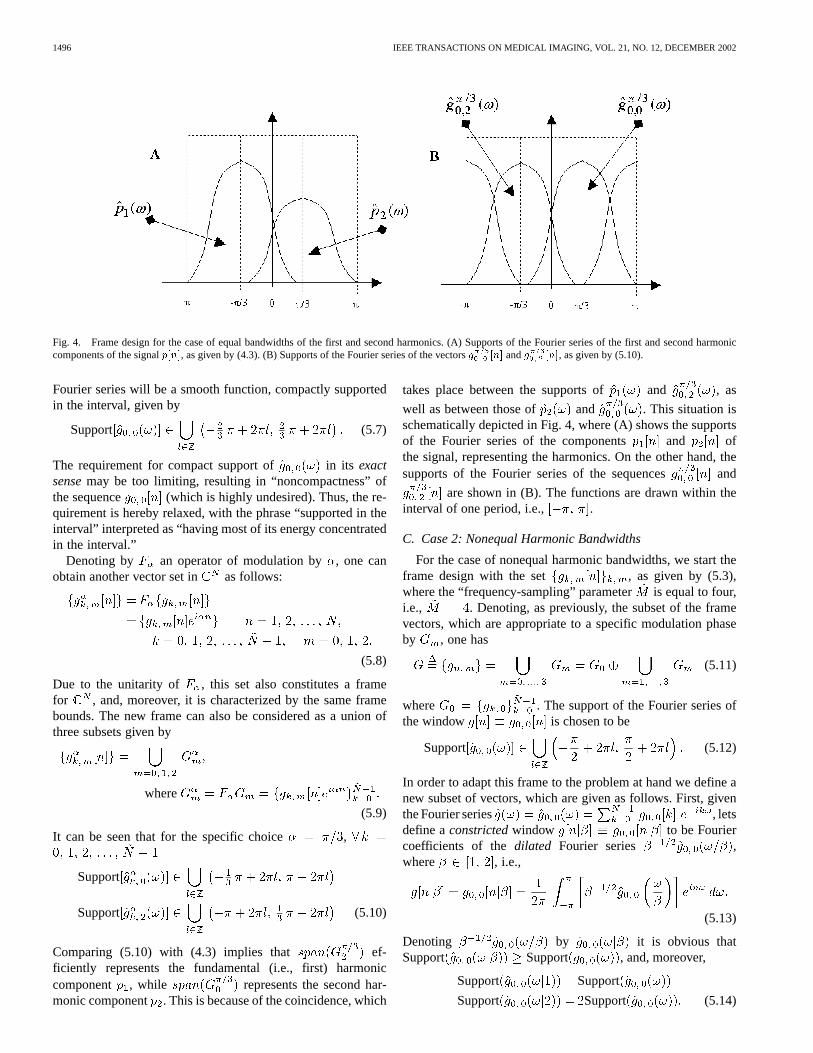
Fig. 4. Frame design for the case of equal bandwidths of the first and second harmonics. (A) Supports of the Fourier series of the first and second harmoniccomponents of the signalp[n], as given by (4.3). (B) Supports of the Fourier series of the vectorsg [n] andg [n], as given by (5.10).
Fourier series will be a smooth function, compactly supportedin the interval, given by
Support (5.7)
The requirement for compact support of in its exactsensemay be too limiting, resulting in “noncompactness” ofthe sequence (which is highly undesired). Thus, the re-quirement is hereby relaxed, with the phrase “supported in theinterval” interpreted as “having most of its energy concentratedin the interval.”
Denoting by an operator of modulation by, one canobtain another vector set in as follows:
(5.8)
Due to the unitarity of , this set also constitutes a framefor , and, moreover, it is characterized by the same framebounds. The new frame can also be considered as a union ofthree subsets given by
where
(5.9)
It can be seen that for the specific choice ,
Support
Support (5.10)
Comparing (5.10) with (4.3) implies that ef-ficiently represents the fundamental (i.e., first) harmoniccomponent , while represents the second har-monic component . This is because of the coincidence, which
takes place between the supports of and , as
well as between those of and . This situation isschematically depicted in Fig. 4, where (A) shows the supportsof the Fourier series of the components and ofthe signal, representing the harmonics. On the other hand, thesupports of the Fourier series of the sequences and
are shown in (B). The functions are drawn within theinterval of one period, i.e., .
C. Case 2: Nonequal Harmonic Bandwidths
For the case of nonequal harmonic bandwidths, we start theframe design with the set , as given by (5.3),where the “frequency-sampling” parameter is equal to four,i.e., . Denoting, as previously, the subset of the framevectors, which are appropriate to a specific modulation phaseby , one has
(5.11)
where . The support of the Fourier series ofthe window is chosen to be
Support (5.12)
In order to adapt this frame to the problem at hand we define anew subset of vectors, which are given as follows. First, giventhe Fourier series , letsdefine aconstrictedwindow to be Fouriercoefficients of thedilated Fourier series ,where , i.e.,
(5.13)
Denoting by it is obvious thatSupport Support , and, moreover,
Support Support
Support Support (5.14)

MICHAILOVICH AND ADAM: A HIGH-RESOLUTION TECHNIQUE FOR ULTRASOUND HARMONIC IMAGING 1497
Fig. 5. Frame design for the case of nonequal bandwidths of the first and second harmonics. (A) Supports of the Fourier series of the first and second harmoniccomponents of the signalp[n], as given by (4.6). (B) Supports of the Fourier series of the vectorsg [n], k = 1; 2; 3 andg [nj�], as given by (5.13). Notethat the parameter� controls the bandwidths ofg (!), and it should be set adaptively to fit optimally the support ofp (!).
Note that because of the choice (5.12) Support, , implying that the construction of
can be performed without aliasing.Finally, the frame to be used for the harmonic separation is
obtained as
where (5.15)
Comparing (5.11) with (5.15) one can see that the setdiffersfrom only by a subset, comprised of nonmodulated vectors
. Moreover the supports of their Fourier series(which are continuously controlled by) are larger or equal to,as compared with those of , but never exceedingSupport . The advantage of the frame, as given by
(5.15), is illustrated in Fig. 5. On one hand, the coincidence ofthe supports of and is obvious, implying thatthe first harmonic component can be efficiently representedin . On the other hand, appropriatelychoosing the parameter, one can achieve a coincidenceof the supports of and , implying that thesecond harmonic component can be efficiently representedin . An optimal value of might beobtained by a calibration procedure, which may be needed foreach given case.
D. Choice of a Window
The last question to be addressed is the choice of the discretewindow , . One option is theenvelopeofthe ultrasound pulse, or its symmetric counterpart, which canbe more conveniently implemented. An important result of thischoice of the window is that the “time-support” of the pulseenvelope is equal to that of the pulse itself. It means that theframe functions, derived from it, are ideally suited for the anal-ysis of transient phenomenain the received RF lines, becausetheir time scale is similar to that of the pulse duration. The pulseenvelope is usually unknown, but can be estimated in a nonpara-metric manner as shown, for example, in [25]. A different, rathersimpler way to obtain the pulse envelope might be to measureit directly before the scanning. This approach was used in the
current study, because it is simple and accurate. After the dis-crete window is defined, all the frame vectors are computed andstored as the columns of a-by- matrix , which will bereferred to as aframe matrix.
VI. SOLUTION BY CONVEX OPTIMIZATION
A more concise notation of vectors in the appropriate Eu-clidean spaces, instead of sequences with indices, will be usedbelow. Let , , and be the ac-quired RF sequence, the frame matrix [constructed according toeither (5.9) or (5.15)] and a vector of the representation coeffi-cients, respectively. being a frame of implies, that
(6.1)
Due to the linear dependence of the vectors that comprise theframe, the definition of the coefficients in (6.1) is not unique.In the context of the problem of harmonic separation, the rep-resentation of by as few frame vectors as possiblemust befound. Moreover, in most practical cases, the acquired signalsare contaminated by measurement noises. Since only analysisof a noise-free part of the signals is of interest, it is temptingto find a procedure, which can obtain the sparse representationof the original (i.e., noise-free) signals, ignoring the noise. Thistask can be performed by solving the following minimizationproblem [13]:
(6.2)
The first term of the functional (6.2) penalizes the misadjust-ment of the model (6.1), while the second term forces thesolution to be as sparse as possible. Note that the “tradeoff”parameter controls the influence of the “sparseness penalty.”More about possible choices of, and its connection to theLagrange multiplier of the equivalent constrained problem
, , where is anestimated standard deviation of the noise, can be found in[26]. Note that the noise can be either measured before thescanning or estimated from the data (see, for example [27]).However, in this study a different approach to the selectionof was undertaken. It was shown in [11] and [13], that thesolution of (6.2) is closely related to the problem ofde-noising

1498 IEEE TRANSACTIONS ON MEDICAL IMAGING, VOL. 21, NO. 12, DECEMBER 2002
by thresholding of the representation coefficients. This relationfacilitates the choice of the “tradeoff” parameterin (6.2),
which was shown to be , where is astandard deviation of the noise. Although this choice of thethreshold has been criticized as being of poor performancefor the problem of image de-noising (and more sophisticatedschemes have been proposed in [28]) we found this “universal”threshold to be quite acceptable for the problem of harmonicseparation, as confirmed by the results of the computer andphantom experiments (see the following sections).
It is interesting to note that an alternative method of findingthe representation coefficients in (6.1) might be the minimiza-tion of the Euclidian norm , where solves (6.1). Thismethod is known asmethod of frames(MOF) [11], and it pos-sesses an analytic solution of the form
(6.3)
Solution (6.3) will be used for comparison during the evaluationof the new method by computer and phantom experiments.
Finally, the minimization method should be selected. Inthe current study, the Fletcher–Reeves version [29, Ch. 1]of the conjugate gradient algorithm is employed. Note thatthis method cannot be directly applied to (6.2), because ofthe nondifferentiability of the -norm. In order to overcomethis, the -norm was replaced by its smooth approximation,
, where is sufficientlysmall.
VII. SIMULATION STUDY
The performance of the harmonics-separation algorithm wasvalidated by simulations. In order to synthesize an “input” tothe algorithm, a model of the signal formation is defined by as-suming the signal to contain two components. The first has itsenergy concentrated around the fundamental frequency, asmight be measured from a biological tissue, assuming linearwave propagation. The second has its energy lumped aroundboth fundamental and double frequency, i.e., , mimicking asignal, which might be measured from nonlinear scatterers, e.g.,contrast agents. The “harmonic-free” component can be mod-eled by the convolution of theultrasound pulsewith a functionrepresenting the reflectivity properties of the interrogated tissue.Since the statistic properties of the latter have no specific impor-tance in the case of harmonics separation, it can be modeled asan independent identically distributed (i.i.d.) random process,obeying a Gaussian distribution. The convolution model is alsoapplicable for simulating the second “nonlinear” component.Given a pressure wave, reflected (or reradiated) from a gas-filledmicrobubble, this component can be obtained by convolving itwith a function, which accounts for the nonlinear scattering ofthe interrogated tissue. Though this modeling might seem sim-plistic (indeed, all microbubbles cannot be assumed to reflectidentical pressure profile, because the later greatly depends ontheir radii), it turns out to be quite useful during simulations,allowing to investigate all the main features of the proposedalgorithm.
The choice of the reflectivity function for the nonlinear signalcomponent depends on the practical situation being described.
The problem of harmonics separation is considered here as partof the problem oftransient detection: within the time-depen-dant RF signal, the second harmonic component lasts a fractionof the duration vs. the time the first harmonic component ex-ists, and is referred to as atransient signal(or simply transient).The goal is to detect the transient, which in medical ultrasound,may be generated from contrast agent within a narrow vessel(e.g., 2–3 mm) embedded in tissue. A reflectivity function, mod-eling such a transient, is synthesized by a Gaussian i.i.d. randomprocess, where most of the signal samples are zeroed, exceptfew at the location of the “vessel.” The latter was positioned,for convenience of the analysis, at the centers of all the syn-thesized signals. The variances of both “linear” and “nonlinearreflectivity function” were chosen to be equal. All the resultantRF sequences were contaminated by a white noise, producingSNR of 17 dB.
Two different “nonlinear pulses” were simulated, by solvingthe Rayleigh–Plesset equation for a 2.5-m microbubble inwater, where the driving pressure was 2- and 1-cycle sinewaveforms, with a central frequency of 2.2 MHz [18]. Otherparameters have been chosen such that the first and secondharmonic components of these pulses possess different degreesof overlap between their spectra. Fig. 6 shows these pulsesin the time (left subplots) and the frequency (right subplots)domains. Notice that in both cases the first-to-second harmonicration is about 12 dB.
The results are described in a joint time-frequency (TF) planeby means of the short-time Fourier transform (STFT), imple-mented as described in [30, Ch. 4.2]. All the STFT are viewed ina negative colormap, with the largest amplitudes drawn in darkcolors. Since the first harmonic component was approximatelysimilar for all the methods being applied, only the second har-monic components are compared. The transient, i.e., the secondharmonic components, appear in vicinity of 4.4 MHz (i.e., twicethe fundamental frequency), at times between roughly 5 and11 s.
When analyzing the results obtained by a series of simula-tions, it was observed that the bandwidth of the second harmoniccomponent differs insignificantly from that of the fundamentalcomponent. Hence, in the current section, the demodulation,described in Section IV-A, is performed and the frame is con-structed as specified in Section V-B. The window was set to bea Gaussian function, scaled to have a frequency support, as re-quired by (5.7). Parameter was chosen to be , thus,the frame can be considered as 1.5-fold oversampled.
Comparison is made to themethod of frames(MOF) (see(3.3), [11]) and thematched harmonic filtering(MHF). Thepassband of the matching filter was adjusted to that of the secondharmonic.
After the representation coefficients have been obtained, theywere used to recover the components, depicted in Figs. 7 and8, for RF lines having different degrees of overlap between thefirst and second harmonic spectra. Note that all the sequenceswere normalized to have a unit Euclidian norm before the visu-alization. In both figures, subplot (A1) shows the second har-monic component, recovered using MHF; subplot (A2) showsthe estimate of this harmonic component, obtained by MOF; andsubplot (A3) shows the second harmonic component, obtained

MICHAILOVICH AND ADAM: A HIGH-RESOLUTION TECHNIQUE FOR ULTRASOUND HARMONIC IMAGING 1499
Fig. 6. Examples of “nonlinear” pulses, used in the computer study for simulating the response of a nonlinear medium, e.g., contrast agent. (A) and (C)Pulsesin the time domain. (B) and (D) Spectra of the pulses (normalized to have peak values of 0 dB). Note that the pulses possess different degrees of overlap betweenthe first and the second harmonic bands.
Fig. 7. Estimates of the second harmonic component of the simulated RF lines, synthesized using the example of a “nonlinear pulse,” shown in Fig. 6(A) and(B). (A1) Estimate obtained by MHF. (A2) Estimate obtained by MOF. (A3) Estimate obtained by sparse representation (BP). (B1)–(B3) Appropriate estimates inthe time-frequency plane.
by the BP, i.e., through the sparse representation. The latter ischaracterized by a significantly better reconstruction quality.The estimates are also depicted in the time-frequency plane:(B1)–(B3) show the STFT of the results. The time-frequencypatterns of the second harmonic estimates are significantly dif-
ferent, when obtained either by MHF (subplots A1, B1), MOF(subplots A2, B2), or BP (subplots A3, B3). In the first two casesnoticeable noise appears, while the latter case is noise-free andwell concentrated. Furthermore, when analyzing the detectedtransients in the time-frequency plane, one can see that the fre-

1500 IEEE TRANSACTIONS ON MEDICAL IMAGING, VOL. 21, NO. 12, DECEMBER 2002
Fig. 8. Estimates of the second harmonic component of the simulated RF lines, synthesized using the example of a “nonlinear pulse,” shown in Fig. 6 (C) and(D). (A1) Estimate obtained by MHF. (A2) Estimate obtained by MOF. (A3) Estimate obtained by sparse representation (BP). (B1)–(B3) Appropriate estimates inthe time-frequency plane.
quency bandwidth is preserved by the BP-bases method of har-monic separation.
VIII. PHANTOM EXPERIMENTS
Phantom experiments were made to study the applicability ofthe proposed algorithm to the problem of harmonic imaging ofcontrast agents. Contrast agents are used to assess perfusion oftissue or tumor, since the slow flow rate in the smallest vesselsis not detected by Doppler ultrasound. The expectation to de-tect the contrast agent within the small vessels is mainly dueto the inherent nonlinearity of the gas micro-bubbles, whichwas demonstrated to help detect the contrast agents [1]–[6],[31]–[33].
Experiments were performed on a custom-made, tissue-mim-icking phantom. The phantom was constructed of a suspen-sion of Carborundum-1000 particles in agar (Agar–Agar,HISPANGAR, Spain) solution. It was observed, that thephantoms produced in this way, reflect the acoustical energyin a manner close to that of different biological soft tissues[1], [4], [31]. The Carborundum-1000 is composed of silicacarbide particles having diameters ranging from 5 to 10mand acting as linear scatterers of ultrasound. The phantom wasobtained by rapid cooling of 1.8% of the Carborundum powdersuspension in 3.8% Agar–Agar bed. This phantom is intendedto produce the background scattering level. Two hollow latextubes with inner diameter of 2 mm were embedded into thephantom to mimic two coronary vessels. Diluted contrast agentwas made to flow through these tubes at flow velocity of about2 cm/s The distance from the transducer to the outside surface
Fig. 9. Sketch of the phantom, used in the experimental study.
of the nearest tube was approximately equal to the focal length(42 mm). The distance between the tubes was about 1 mm. Asketch of the phantom is shown in Fig. 9.
The phantom was imaged by a focused, single-element,3.5 MHz-transducer (Panametrics V383, Waltham, MA). Eachimage was obtained from a set of RF sequences, gathered by

MICHAILOVICH AND ADAM: A HIGH-RESOLUTION TECHNIQUE FOR ULTRASOUND HARMONIC IMAGING 1501
shifting the transducer in the lateral direction with an incrementof 1 mm. Each scanning resulted in 34 RF sequences. Notethat the scanning cross-section was chosen in such a way thatboth tubes are positioned within it, i.e., the scanning directionwas carefully aligned with the “coronary vessels” (tubes). Acomputer controllable transmitter–receiver (Advanced mea-surement system RAM-5000, RITEC), generating sine waveswith an adjustable number of sine periods and an adjustablefrequency, was used for driving the transducer and for acquiringthe RF lines. In order to use the transducer bandwidth duringreception as efficiently as possible for acquiring both the firstand the second harmonics, the transducer was excited at 2 MHzby a sine wave ofoneperiod. The RF lines were sampled ata rate of 25 MHz using CompuScope14100 (analog-to-digitalcard for PCI bus, GAGE Applied, Inc.) The sampling resolutionwas 14 bit. The data acquisition process was controlled throughGageScope software. All the acquired RF sequences weretruncated to the length of 1024 sample points, which provideddata from the phantom ranging from its surface to the depth ofapproximately 63 mm.
The pressure amplitude of the transducer was set by a calibra-tion procedure in such a way that before the injection of a con-trast agent, there was no detectable second harmonics. In otherwords, the pressure was chosen sufficiently small so that thenonlinear propagation effect could not be measured. Under suchconditions, if when injecting contrast agent the second harmoniccomponent is generated, it is entirely ascribed to the contrastagent. The method was tested with Optison (Molecular Biosys-tems, San Diego, CA). The Optison was diluted to a concentra-tion of 0.2 ml in 500 ml of distilled water.
The Gabor frame, used in the phantom experiment, wasconstructed, according to the description of Section V-C, fol-lowing the appropriate demodulation procedure, presented inSection IV-B. This frame was chosen, because it was observedduring preliminary analysis of the spectra of the received RFlines, that the second harmonic bandwidth is slightly broaderthan that of the fundamental harmonic. Frame design parameter
was chosen empirically (based on the observations of thesignals spectra) to be equal to 1.2.
A window function was obtained using the envelope of themeasured ultrasound pulse, as obtained in a water tank from aplanar reflector. This pulse was appropriately preprocessed sothat the resulting discrete window fulfills the conditions spec-ified by (5.12). The frame design parameterwas chosen tobe (where is the length of the demodulated RFlines), resulting in twofold oversampled Gabor frame. The in-crease of the “overcompleteness” did not result in any noticeableimprovement of the results. Thus, this choice can be viewed asoptimal, in the sense that it balances both the detection qualityand computation load. The harmonics separation algorithm wasexecuted using Matlab (The Mathworks, Inc., Natick, MA) ona standard Pentium3 computer. The total execution time (for animage as demonstrated below) was 21.2 s. The processing re-sulted in two images, corresponding to the first and the secondharmonic components of the RF image. Both images were trans-formed into the “video” format by standard I/Q demodulationprocedure, and visualized in the common 8-bit resolution. Noattenuation correction was performed and the dynamic range of
the images was not optimized and, therefore, their quality maybe potentially improved.
Two other pairs of images were produced so as to comparethe MHF and MOF algorithms. In the MHF method twomatching filters were employed, where the first one wasadjusted to transfer the first harmonic frequencies, while thesecond one transfers the second harmonic component. Notethat the matching harmonic filtering allows keeping the axialresolution as high as possible. It is of importance, since the newapproach presented here has the advantage of retaining the axialresolution, and, thus, the performance of all techniques shouldbe compared at the same resolution. The images obtained usingthe MHF and MOF algorithms were subjected to the standardI/Q demodulation, and visualized in 8-bit resolution, so thatall the images presented in this paper have the same dynamicrange.
The first harmonic images, obtained by all the algorithmstested here, are very similar, thus, only one is shown, that isobtained using MHF. This image is shown in Fig. 10(A), wherethe effect of the contrast agent is demonstrated by an increaseof brightness inside the tubes. Fig. 10(B) shows a second-har-monic image, obtained by the MHF algorithm, while Fig. 10 (C)shows this image, as obtained by the MOF. Note that in boththese cases the vessels are significantly masked by the portionof the fundamental energy that “leaks” into the second harmonicband. The second harmonic image, obtained by BP (sparse solu-tion), is viewed in Fig. 10(D), where the only visible object is thecontrast agent, flowing in the two vessels. There is hardly anymasking by background reflections or strong reflections fromthe tube-tissue interfaces.
IX. DISCUSSION ANDCONCLUSION
In this paper a novel approach is presented to the problemof separation of the harmonic components within an acquiredRF image. The proposed method differs from the conventionalapproaches, which employ linear filtration. Linear filtration,when applied to ultrasound harmonic processing, has severalshortcomings, among which is the inverse relation betweenthe transmitted bandwidth and the ability to detect the higherharmonics. In such a case, the filter designed to extract thesecond harmonics, allows significant energy related to the firstharmonics, to penetrate into the resultant signal. Since thefirst harmonic component is typically stronger in comparisonwith the second, this “leakage” tends to mask the secondharmonic component. In contrast imaging, where the higherharmonics induced by the contrast agent are measured, it isgenerally accepted that the second harmonics are masked bynative tissue harmonics produced by the nonlinear propagationof the acoustic waves. However, when using linear filtrationduring contrast agent imaging, the effect of the “leakage” ofthe fundamental component into the frequency band of thesecond harmonic component is much more destructive. Itconsiderably masks the information related to the nonlinearityof the interrogated tissue or contrast agent. Consequently, inorder to obtaintrue harmonic images, this “leakage” must besuppressed. It was reported [1], [31] that the higher harmonicsinduced by contrast agents are often larger in amplitude than

1502 IEEE TRANSACTIONS ON MEDICAL IMAGING, VOL. 21, NO. 12, DECEMBER 2002
Fig. 10. (A) First harmonic image of the phantom, as obtained by MHF. (B) Second harmonic image of the phantom, as obtained by MHF. (C) Second harmonicimage of the phantom, as obtained by MOF. (D) Second harmonic image of the phantom, as obtained by sparse decomposition (BP).
the amplitudes of the native tissue harmonics. Thus, when“leakage”-free processing is used, the obtained second har-monic image can be very useful for imaging the contrast agent.
In this paper, the separation of the harmonic components isbased conceptually on the ideas of sparse representations of sig-nals in over-complete bases, first introduced in [11], [13]. A spe-cial type of such bases, the Gabor Frames, which is particularlysuitable (after proper modifications) for the given problem, wasexplicitly described. It was shown that it is capable of separatingthe first harmonics from the second harmonics without any de-terioration of the image resolution.
The proposed algorithm was specified for two differentcases: when the bandwidth of the second harmonic componentis larger than that of the fundamental harmonic component andwhen these bandwidths are approximately equal. In both casesthe algorithm performance remains the same. Yet, for the caseof nonequal harmonic bandwidths, a higher sampling rate isrequired. Moreover, it results in using a frame, characterizedby a higher “overcompleteness.” As a result, its computationalcomplexity is considerably higher than for the case of equalbandwidths. Therefore, the latter case is preferred, wheneverthe frequency supports of the first and second harmonics areapproximately equal. It should be noted, that though expected,the broadening of the second harmonic bandwidth is frequentlyinsignificant in practice. Thus, using the harmonic separationmethod, as proposed for the case of the equal bandwidths,can result in significantly faster convergence, while hardlyworsening the resultant resolution.
The results obtained from computer simulations demonstratethe advantages of the novel approach for transient harmonic de-tection. Its performance was compared with that of the MHFand MOF algorithms. It was observed that the solutions by these
alternative methods, although preserving the axial resolution,fail when additive noise is introduced. The solution by MOF,in particular, tends to spread the energy evenly among all theframe functions. It causes the noise within the frequency band ofthe second harmonic component to be interpreted as the desiredtransient. On the other hand, the BP (i.e. sparse representation)is much more “greedy,” representing the signal with as few coef-ficients as possible. Consequently, the algorithm tends to ignorethe noise part of signal, which results in a robust estimation.
The proposed approach was additionally evaluated byphantom experiments. These results were also compared withthose produced using the MHF and MOF methods. The ex-perimental system was calibrated to have no native harmonicsin the reflected signals, so that the second harmonics, inducedby the contrast agent, appears on the background of the fun-damental harmonic component. It was shown, that when theMHF and MOF approaches are employed, the fraction of thefundamental energy, “leaking” through the second harmonicband, produces visible background reflections, which maskthe vessels. In contrast, the second-harmonic image, obtainedusing the sparse-representation approach, is fairly free of thisartifact. These results also justify the hypothesis, concerningthe first harmonic “leakage” and its role in masking the contrastagent (higher) harmonics. It is the most important result ofthe current study. It implies that the novel technique providesthe possibility to acquire ultrasound images, which representonly the nonlinear effects, without deterioration of the imageresolution. Moreover, these images are obtained as solutions ofthe sparse frame problem by convex optimization.
Numerous reports describe different types of techniques in-tended to increase the “contrast-to-native” ratio within the ac-quired second harmonic component [3]–[6]. These techniques

MICHAILOVICH AND ADAM: A HIGH-RESOLUTION TECHNIQUE FOR ULTRASOUND HARMONIC IMAGING 1503
have a common shortcoming, since they require transmittingseveral pulses. In these cases the motion artifacts are crucial, andthe continuous motion of bubbles results in continuous alter-nations of the reflectivity function. Thus, when RF sequences,generated by repeated transmits are compared, it is unknownwhether the changes are due to the nonlinearity of the contrastagent or due to the alteration of the reflecting structure. Themethod presented here does not require any change in the stan-dard hardware structure of the imaging system. It requires as aninput a standard image and splits it onto two images, one foreach harmonic component.
The structure of the Gabor Frames used here, implies easyextension to the separation of other frequency bands, e.g., thesecond and third harmonics. Moreover, if the imaging systemin use has the required spectral properties, the algorithm can beeasily modified to simultaneously separate the first, second andthird harmonic components.
ACKNOWLEDGMENT
The authors would like to thank Prof. A. Ron from the Uni-versity of Wisconsin-Madison for a helpful consultation. Theywould like also to thank all the anonymous reviewers, whoseuseful comments significantly improved the paper.
REFERENCES
[1] X. Verbeek, J. Willigers, P. Brands, L. Ledoux, and A. Hoeks, “Measure-ment of the contrast agent intrinsic and native harmonic response withsingle transducer pulse waved ultrasound system,”Ann. Biomed. Eng.,vol. 27, pp. 670–681, 1999.
[2] P. Frinking, A. Bouakaz, J. Kirkhorn, F. Ten Gate, and N. de Jong, “Ul-trasound contrast imaging: Current and new potential methods,”Ultra-sound Med. Biol., vol. 26, no. 6, pp. 965–975, 2000.
[3] D. H. Simpson, C. T. Chin, and P. Burns, “Pulse inversion Doppler: Anew method for detecting nonlinear echoes from microbubble contrastagents,”IEEE Trans. Ultrason., Ferroelect., Freq. Contr., vol. 46, pp.372–382, Mar. 1999.
[4] J. Kirkhorn, P. Frinking, N. de Jong, and H. Torp, “Three-stage approachto ultrasound contrast detection,”IEEE Trans. Ultrason., Ferroelect.,Freq. Contr., vol. 48, pp. 1013–1022, July 2001.
[5] K. E. Morgan, J. S. Allen, P. A. Dayton, J. E. Chomas, A. L. Klibanov,and K. W. Ferrara, “Experimental and theoretical evaluation of mi-crobubble behavior: Effect of transmitted phase and bubble size,”IEEETrans. Ultrason., Ferroelect., Freq. Contr., vol. 47, pp. 1494–1509,Nov. 2000.
[6] P. Frinking, E. I. Cespedes, J. Kirkhorn, and H. Torp, “A new ultra-sound contrast imaging approach based on the combination of multipleimaging pulses and a separate release burst,”IEEE Trans. Ultrason., Fer-roelect., Freq. Contr., vol. 48, pp. 643–651, May 2001.
[7] Y. Li and J. A. Zagzebski, “Computer model for harmonic ultrasoundimaging,” IEEE Trans. Ultrason., Ferroelect., Freq. Contr., vol. 47, pp.1259–1272, Sept. 2000.
[8] N. de Jong, P. Frinking, A. Bouakaz, and F. Ten Gate, “Detection pro-cedures of ultrasound contrast agents,”Ultrasonics, vol. 38, pp. 87–92,2000.
[9] T. Christopher, “Finite amplitude distortion-based inhomogeneouspulse echo ultrasound imaging,”IEEE Trans. Ultrason., Ferroelect.,Freq. Contr., vol. 44, pp. 125–139, Jan. 1997.
[10] , “Experimental investigation of finite amplitude distortion-based,second harmonic pulse echo ultrasound imaging,”IEEE Trans. Ul-trason., Ferroelect., Freq. Contr., vol. 45, pp. 158–162, Jan. 1998.
[11] S. Chen and D. Donoho, “Atomic decomposition by basis pursuit,” pre-sented at the SPIE Int. Conf. Wavelets, San Diego, CA, July 1995.
[12] M. Zibulevsky and B. A. Pearlmutter, “Blind source separation by sparsedecomposition in a signal dictionary,”Neural Computation, vol. 13, no.4, pp. 863–882, April 2001.
[13] S. Chen, “Basis Pursuit,” Ph.D. dissertation, Dept. Statistics, StanfordUniv., Stanford, CA.
[14] D. L. Liu and M. Saito, “A new method for estimating the acoustic at-tenuation coefficient of tissue from reflected ultrasonic signals,”IEEETrans. Med. Imag., vol. 8, pp. 107–110, Mar. 1989.
[15] K. A. Wear, “The effects of frequency-dependent attenuation and dis-persion on sound speed measurements: Application in human trabeculabone,” IEEE Trans. Ultrason., Ferroelect., Freq. Contr., vol. 47, pp.265–273, Jan. 2000.
[16] M. Elad and A. Bruckstein, “On sparse signal representations,” pre-sented at the IEEE ICIM, Tsaloniky, Greece, 2001.
[17] A. V. Oppenheim and R. W. Schafer,Discrete time signal pro-cessing. London, U.K.: Prentice-Hall, 1989.
[18] N. de Jong, A. Bouakaz, and F. J. Ten Gate, “Contrast harmonicimaging,”Ultrasonics, vol. 40, pp. 567–573, 2002.
[19] D. H. Simpson, P. N. Burns, and M. A. Averkiou, “Techniques for perfu-sion imaging with microbubble contrast agents,”IEEE Trans. Ultrason.,Ferroelect., Freq. Contr., vol. 48, pp. 1483–1495, Nov. 2002.
[20] C. Herley, J. Kovacevic, K. Ramchandran, and M. Vetterli, “Tiling ofthe time-frequency plane: Construction of arbitrary orthogonal basesand fast tiling algorithms,”IEEE Trans. Signal Processing, vol. 41, pp.3341–3359, Dec. 1993.
[21] I. Daubechies, “The wavelet transform, time-frequency localization andsignal analysis,”IEEE Trans. Inform. Theory, vol. 36, pp. 961–1005,Sept. 1990.
[22] J. Wexler and S. Raz, “Discrete Gabor expansions,”Signal Processing,vol. 21, pp. 207–220, 1990.
[23] I. Daubechies, H. Landau, and Z. Landau, “Gabor time-frequency lat-tices and the Wexler–Raz identity,”J. Fourier Anal. Applicat., vol. 1,no. 4, pp. 437–478, 1995.
[24] I. Gohberg and S. Goldberg,Basic Operator Theory. Boston, MA:Birkhauser, 1980.
[25] D. Adam and O. Michailovich, “Blind deconvolution of ultrasound se-quences using nonparametric local polynomial estimates of the pulse,”IEEE Trans. Biomed. Eng., vol. 42, pp. 118–131, Feb. 2002.
[26] T. F. Chan and C. K. Wong, “Total variation blind deconvolution,”IEEETrans. Image Processing, vol. 7, pp. 370–375, Mar. 1998.
[27] J. Immerkar, “Fast noise variance estimation,”Comput. Vision ImageUnderstanding, vol. 64, no. 2, pp. 300–302, 1996.
[28] P. Moulin and J. Liu, “Analysis of multiresolution image de-noisingschemes using generalized Gaussian and complexity priors,”IEEETrans. Inform. Theory, vol. 45, pp. 370–375, Apr. 1999.
[29] D. Bertsekas,Nonlinear Programming. Belmont, MA: Athena Scien-tific, 1999.
[30] S. G. Mallat,A Wavelet Tour of Signal Processing, 2nd ed. New York:Academic, 1998.
[31] X. Verbeek, L. Ledoux, J. Willigers, P. Brands, and A. Hoeks, “Exper-imental investigation of the pulse inversion technique for imaging ul-trasound contrast agents,”J. Acoust. Soc. Amer., vol. 107, no. 4, pp.2281–2290, 2000.
[32] C. Cachard, A. Bouakkaz, and G. Gimenez, “In vitro evaluation ofacoustic properties of ultrasound contrast agents: Experimental set-upand signal processing,”Ultrasonics, vol. 34, pp. 595–598, 1996.
[33] V. Uhlendorf, F.-D. Scholle, and M. Reinhardt, “Acoustic behavior ofcurrent contrast agents,”Ultrasonics, vol. 38, pp. 81–86, 2000.