Embed Size (px)
Citation preview

Supporting Information (SI)
A Heptanuclear CoII5CoIII
2 Cluster as Efficient Water
Oxidation Catalyst
Jia-Heng Xu,†,# Ling-Yu Guo,†,# Hai-Feng Su,‡,# Xiang Gao,† Xiao-Fan Wu,† Wen-Guang
Wang,*,† Chen-Ho Tung,† and Di Sun*,†
†Key Laboratory of Colloid and Interface Chemistry, Ministry of Education, School of Chemistry
and Chemical Engineering, Shandong University, Jinan, 250100, P. R. China. ‡State Key Laboratory for Physical Chemistry of Solid Surfaces and Department of Chemistry,
College of Chemistry and Chemical Engineering, Xiamen University, Xiamen, 361005, P. R.
China. #These authors contributed equally to this work.
Materials and General Methods.
All regeants are commercial availabe and used as received without any purifications.
The amount of evolved O2 dissolved in solution was measured in situ by a standard
Clark-type oxygen electrode (Hansatech Instruments). The total amount of evolved O2
was quantified by Techcomp 7890 II gas chromatography (GC) equipped with a 5 Å
molecular sieve column using argon as carrier gas and thermal conductivity detector.
FT-IR spectra were obtained with a PerkinElmer FT-IR Spectrometer Spectrum Two
in the range of 4000 – 450 cm-1. Powder X-ray diffraction (XRD) patterns were
obtained on a Rigaku D/Max 2200PC diffractometer equipped with a graphite
monochromator and Cu Kα radiation (λ = 1.5418 Å) in the range of 2o < 2θ < 50o.
Electrochemical measurements were carried out on a CHI 760e electrochemical
workstation (Shanghai Chen Hua Instrument Co., Ltd) with a conventional three
electrode arrangement. The High-Resolution Electrospray Mass Spectrometry was
performed on an Agilent (Santa Clara, CA, USA) ESI-TOF mass spectrometer (6224).
The instrument was calibrated with an Agilent tune mixture before mass analysis. The
sample was introduced by a syringe pump (KDS-100, KD Scientific, Holliston, MA, USA)
at a flow rate of 5 µL/min. The nebulizing nitrogen gas pressure was 15 psi, the capillary
voltage was 4 kV, the desolvation gas flow rate was 4 L/min, and the desolvation gas
temperature was 100 °C around the MS-inlet capillary entrance.
Photocatalytic water oxidation
The amount of evolved O2 dissolved in solution was measured in situ by a standard
Clark-type oxygen electrode (Hansatech Instruments), the electrode was calibrated
following standard procedure before measurement. In a typical experiment, each
component was mixed in 2.0 mL buffer solution, and then the solution was degassed
with argon for 30 min before measurement. The degased solution was then irradiated
by a 450 nm LED lamp and the amount of O2 evolved in solution was measured in
situ.
The total amount of evolved O2 was quantified by gas chromatography (GC)
analysis. The gas chromatography (GC) analysis was performed by Techcomp D7980
GC using argon as the carrier gas and a 5 Å molecular sieve column to separate O2,
N2 and CH4, then gases were detected with a thermal conductivity detector. In a
typical experiment, a Pyrex tube was filled with borate buffer solution (10.0 mL, 0.2
M) which contains catalyst, [Ru(bpy)3]2+, and K2S2O8. Then the tube was sealed with
a rubber plug and the junction between the tube and the rubber plug was sealed with
wax. Subsequently, the tube was flushed with argon for 60 min to remove the residual
air. After degassing, 200 µL CH4 was injected into the tube as the internal standard.
Then the tube was photolyzed with a 450 nm LED lamp. After photolysis, 200 µL of
the gas in the headspace was sampled by a Hamilton (1750 SL) gas-tight microliter
syringe and then analyzed by GC. Contamination of the headspace caused by air in
the degassed sample was nullified by measuring the N2 peak on GC.

Synthesis and characterization of 1.
The sodium azide (0.086 mmol, 5.59 mg) and N-Methyldiethanolamine (0.35 mmol,
41.23 mg) were added to a acetonitrile solution (5 mL) of Co(ClO4)2·6H2O (0.25
mmol, 91.48 mg), and stirred for 10 minutes, which caused the solution color change
to black green. The solution was stirred for another 1.5 hours, then filtered to remove
any solid. After 2 days, the dark green crystals were collected and washed with ethyl
alcohol. Yield: 52% (based on Co). Elemental analysis calculated for
C32H66N16O28Cl4Co7 (%): C 22.91, H 3.97, N 13.36; found: C 22.92, H 3.95, N 13.37.
Selected IR peak (cm-1): 3525(w), 2989(w), 2927(w), 2875(w), 2132(w), 2082 (m),
1636(w), 1459(w), 1300(w), 1067(s), 921(w), 749 (w),673(m), 622(s), 536(m), 462
(m).
.
X-ray Crystallography
Single crystal of 1 with appropriate dimensions was chosen under an optical
microscope and quickly coated with high vacuum grease (Dow Corning Corporation)
before being mounted on a glass fiber for data collections. Single-crystal X-ray
diffraction data were collected using a Bruker SMART APEX II diffractometer with a
CCD area detector (graphite monochromatic Mo Kα radiation, λ = 0.71073 Å,
ω-scans with a 0.5° step in ω). Indexing was performed using APEX2 (Difference
Vectors method).[1] Data integration and reduction were performed using Saint Plus
6.01.[2] Absorption correction was performed by multi-scan method implemented in
SADABS.[3] Space groups were determined using XPREP implemented in APEX2.[4]
Hydrogen atoms were placed in calculated positions and included as riding atoms
with isotropic displacement parameters 1.2-1.5 times Ueq of the attached C atoms. The
structure was examined using the Addsym subroutine of PLATON[5] to assure that no
additional symmetry could be applied to the models.
[1] Bruker APEX2; Bruker AXS, Inc.: Madison, WI, 2010.
[2] Bruker SAINT, Data Reduction Software; Bruker AXS, Inc.: Madison, WI, 2009.
[3] G. M. Sheldrick, SADABS, Program for Empirical Absorption Correction;
University of Gottingen: Gottingen, Germany, 2008.
[4] a) G. M. Sheldrick, SHELXL-97, Program for the Refinement of Crystal;
University of Gottingen: Gottingen, Germany, 1997. b) G. M. Sheldrick, Acta
Crystallogr.1990, A46, 467. c) G. M. Sheldrick, Acta Crystallogr. 2008, A64,
112.
[5] A. L. Spek, Implemented as the PLATON Procedure, a Multipurpose
Crystallographic Tool, Utrecht University, Utrecht, The Netherlands, 1998.
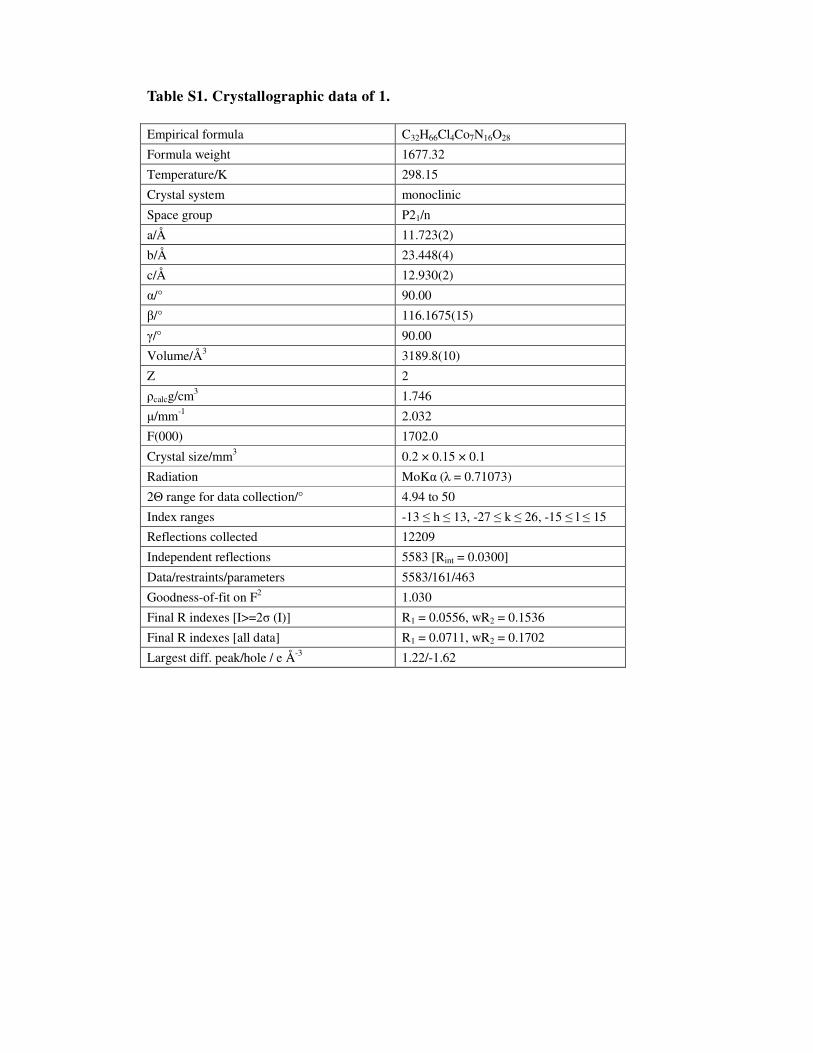
Table S1. Crystallographic data of 1.
Empirical formula C32H66Cl4Co7N16O28
Formula weight 1677.32
Temperature/K 298.15
Crystal system monoclinic
Space group P21/n
a/Å 11.723(2)
b/Å 23.448(4)
c/Å 12.930(2)
α/° 90.00
β/° 116.1675(15)
γ/° 90.00
Volume/Å3 3189.8(10)
Z 2
ρcalcg/cm3 1.746
µ/mm-1 2.032
F(000) 1702.0
Crystal size/mm3 0.2 × 0.15 × 0.1
Radiation MoKα (λ = 0.71073)
2Θ range for data collection/° 4.94 to 50
Index ranges -13 ≤ h ≤ 13, -27 ≤ k ≤ 26, -15 ≤ l ≤ 15
Reflections collected 12209
Independent reflections 5583 [Rint = 0.0300]
Data/restraints/parameters 5583/161/463
Goodness-of-fit on F2 1.030
Final R indexes [I>=2σ (I)] R1 = 0.0556, wR2 = 0.1536
Final R indexes [all data] R1 = 0.0711, wR2 = 0.1702
Largest diff. peak/hole / e Å-3 1.22/-1.62

Table S2. Selected bond lengths (Å) and angles (o).
Co1—O9 2.069 (4) Co3—O9i 2.033 (3)
Co1—O11i 1.974 (4) Co3—O9 2.033 (3)
Co1—O12i 2.254 (4) Co3—O10i 2.132 (4)
Co1—N1 2.128 (6) Co3—O10 2.132 (4)
Co1—N2 2.146 (6) Co3—O12i 2.111 (3)
Co1—N3 2.116 (6) Co3—O12 2.111 (3)
Co2—O1W 2.142 (5) Co4—O10 1.910 (4)
Co2—O9 2.069 (4) Co4—O11 1.884 (4)
Co2—O10 2.251 (4) Co4—O12 1.911 (4)
Co2—O13 1.978 (4) Co4—O13 1.887 (4)
Co2—N3 2.105 (5) Co4—N7 2.027 (5)
Co2—N6 2.146 (6) Co4—N8 2.022 (5)
O9—Co1—O12i 80.58 (13) N6—Co2—O10 108.8 (2)
O9—Co1—N1 91.67 (19) O9i—Co3—O10 94.97 (14)
O9—Co1—N2 164.3 (2) O9i—Co3—O10i 85.03 (14)
O9—Co1—N3 79.29 (18) O9—Co3—O10i 94.97 (14)
O11i—Co1—O9 98.77 (16) O9—Co3—O10 85.03 (14)
O11i—Co1—O12i 72.11 (14) O9—Co3—O12i 84.96 (14)
O11i—Co1—N1 92.3 (2) O9i—Co3—O12 84.96 (14)
O11i—Co1—N2 96.8 (2) O9i—Co3—O12i 95.04 (14)
O11i—Co1—N3 163.79 (19) O9—Co3—O12 95.04 (14)
N1—Co1—O12i 161.1 (2) N8—Co4—N7 105.3 (2)
N1—Co1—N2 85.5 (2) O12i—Co3—O10 105.24 (14)
N2—Co1—O12i 106.5 (2) O12i—Co3—O10i 74.76 (14)
N3—Co1—O12i 91.73 (18) O12—Co3—O10i 105.24 (14)
N3—Co1—N1 103.8 (2) O12—Co3—O10 74.76 (14)
N3—Co1—N2 86.4 (2) O13—Co4—N8 84.5 (2)
O1W—Co2—O10 160.83 (19) O10—Co4—O12 84.79 (15)
O1W—Co2—N6 85.7 (2) O10—Co4—N7 86.51 (18)
O9—Co2—O1W 87.53 (17) O10—Co4—N8 163.11 (19)
O9—Co2—O10 81.22 (13) O11—Co4—O10 98.10 (17)
O9—Co2—N3 79.55 (18) O11—Co4—O12 82.37 (17)
O9—Co2—N6 164.6 (2) O11—Co4—O13 179.58 (19)
O13—Co2—O1W 95.3 (2) O11—Co4—N7 84.5 (2)
O13—Co2—O9 101.73 (16) O11—Co4—N8 95.1 (2)
O13—Co2—O10 72.11 (14) O12—Co4—N7 163.06 (18)
O13—Co2—N3 161.5 (2) O12—Co4—N8 86.6 (2)
O13—Co2—N6 92.7 (2) O13—Co4—O10 82.29 (17)
N3—Co2—O1W 103.2 (2) O13—Co4—O12 97.49 (17)
N3—Co2—N6 88.5 (2)
Symmetry code: (i) −x+1, −y+1, −z+2.

Table S3. BVS calculations for the Co atoms in 1 Atom CoII CoIII
Co1 2.417 2.440
Co2 1.969 1.992
Co3 2.049 2.094
Co4 3.508 3.558
The underlined value is the one closest to the charge for which it was calculated. The oxidation
state can be taken as the integer nearest to the underlined value.
Figure S1. The IR of 1

Figure S2. The TGA of 1

Figure S3. Solid state UV-Vis spectrum of 1.
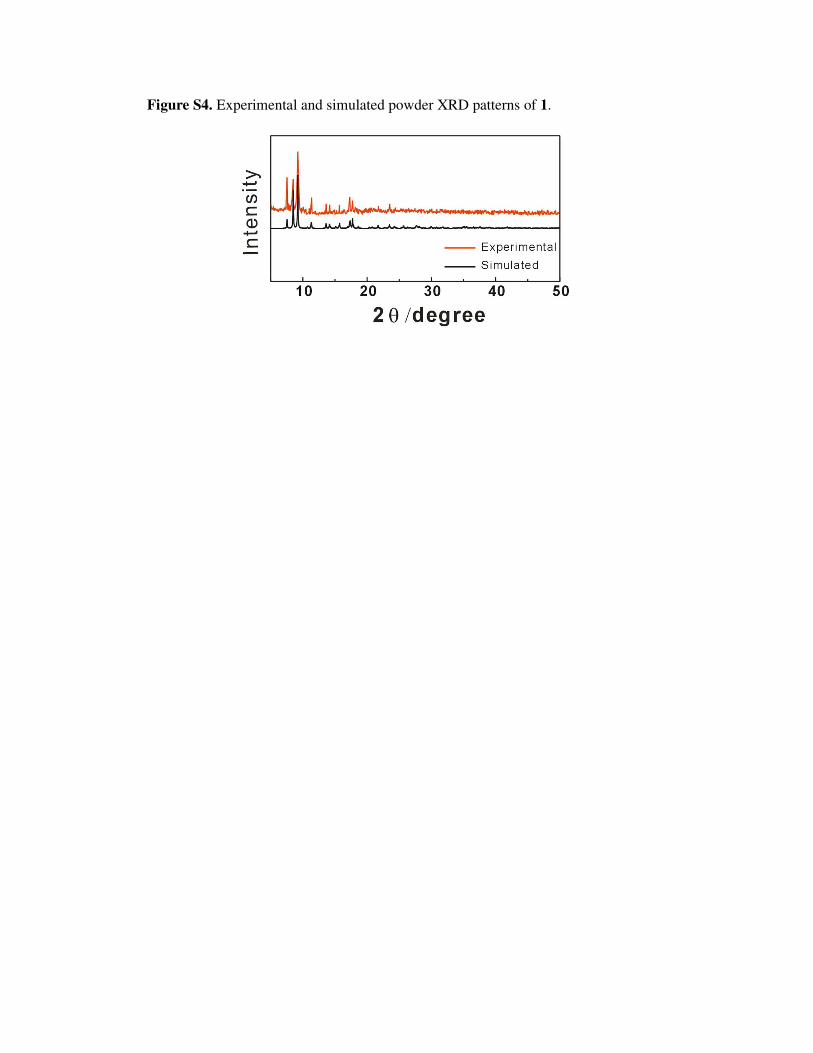
Figure S4. Experimental and simulated powder XRD patterns of 1.
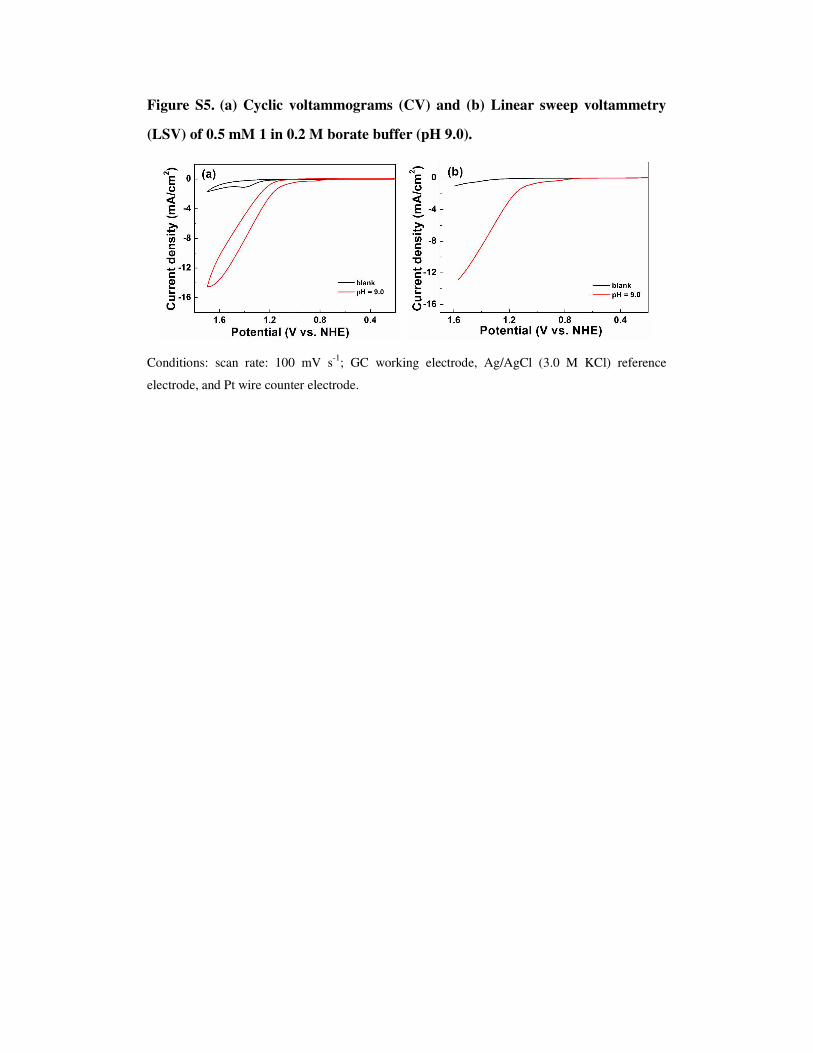
Figure S5. (a) Cyclic voltammograms (CV) and (b) Linear sweep voltammetry
(LSV) of 0.5 mM 1 in 0.2 M borate buffer (pH 9.0).
Conditions: scan rate: 100 mV s-1; GC working electrode, Ag/AgCl (3.0 M KCl) reference
electrode, and Pt wire counter electrode.
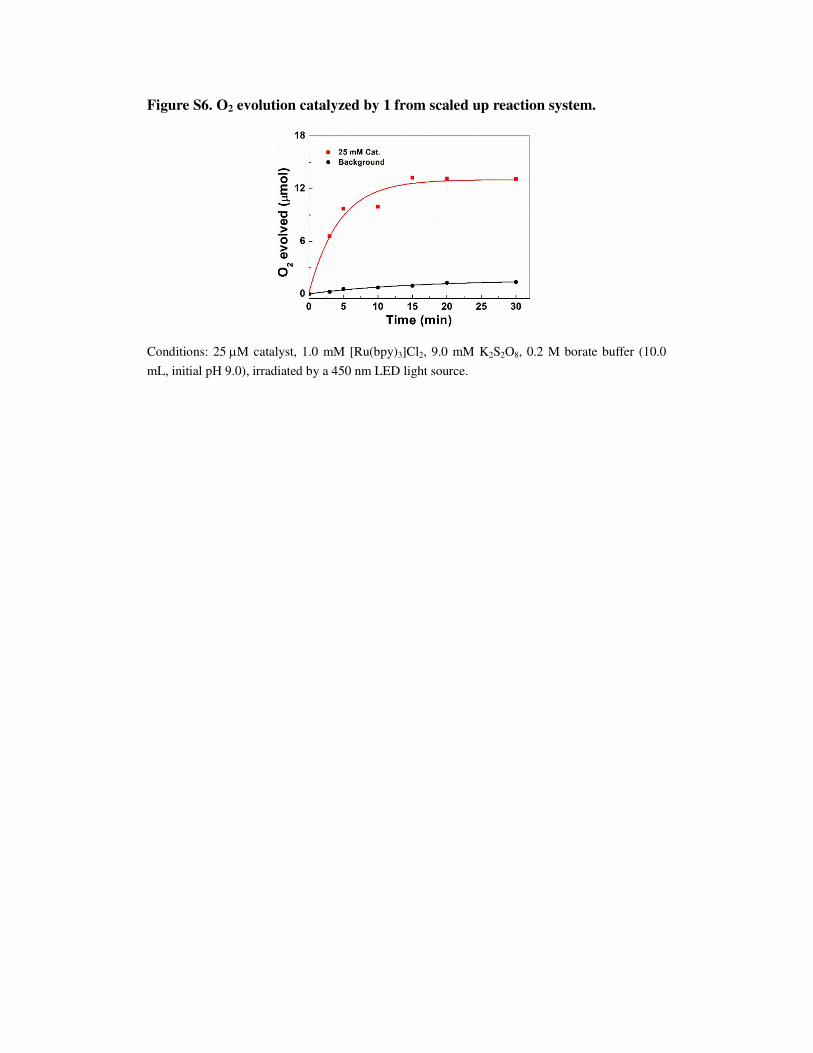
Figure S6. O2 evolution catalyzed by 1 from scaled up reaction system.
Conditions: 25 µM catalyst, 1.0 mM [Ru(bpy)3]Cl2, 9.0 mM K2S2O8, 0.2 M borate buffer (10.0
mL, initial pH 9.0), irradiated by a 450 nm LED light source.

Figure S7. O2 evolution catalyzed by 1 in the presence of EDTA.
Conditions: 1.0 mM [Ru(bpy)3]Cl2, 9 mM K2S2O8, 25 µM catalyst, 0-1 equivalent EDTA, 0.2 M
borate buffer (2.0 mL, initial pH 9.0), and irradiated by a 450 nm LED light source.