Embed Size (px)
Citation preview
A Healthier Retail and Better Industrial
Brandon HardinResearch EconomistNATIONAL ASSOCIATION OF REALTORS®
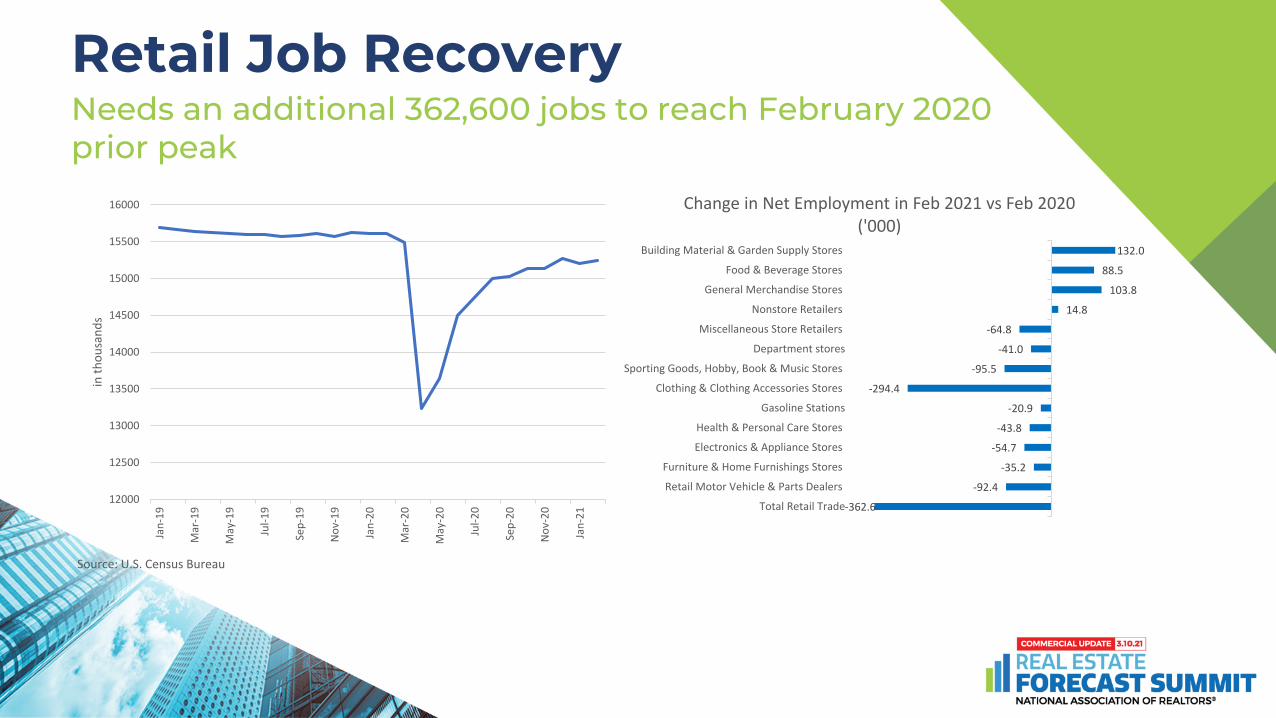
Retail Job RecoveryNeeds an additional 362,600 jobs to reach February 2020 prior peak
12000
12500
13000
13500
14000
14500
15000
15500
16000
Jan-
19
Mar
-19
May
-19
Jul-1
9
Sep-
19
Nov
-19
Jan-
20
Mar
-20
May
-20
Jul-2
0
Sep-
20
Nov
-20
Jan-
21
in th
ousa
nds
Source: U.S. Census Bureau
-362.6
-92.4
-35.2
-54.7
-43.8
-20.9
-294.4
-95.5
-41.0
-64.8
14.8
103.8
88.5
132.0
Total Retail Trade
Retail Motor Vehicle & Parts Dealers
Furniture & Home Furnishings Stores
Electronics & Appliance Stores
Health & Personal Care Stores
Gasoline Stations
Clothing & Clothing Accessories Stores
Sporting Goods, Hobby, Book & Music Stores
Department stores
Miscellaneous Store Retailers
Nonstore Retailers
General Merchandise Stores
Food & Beverage Stores
Building Material & Garden Supply Stores
Change in Net Employment in Feb 2021 vs Feb 2020 ('000)
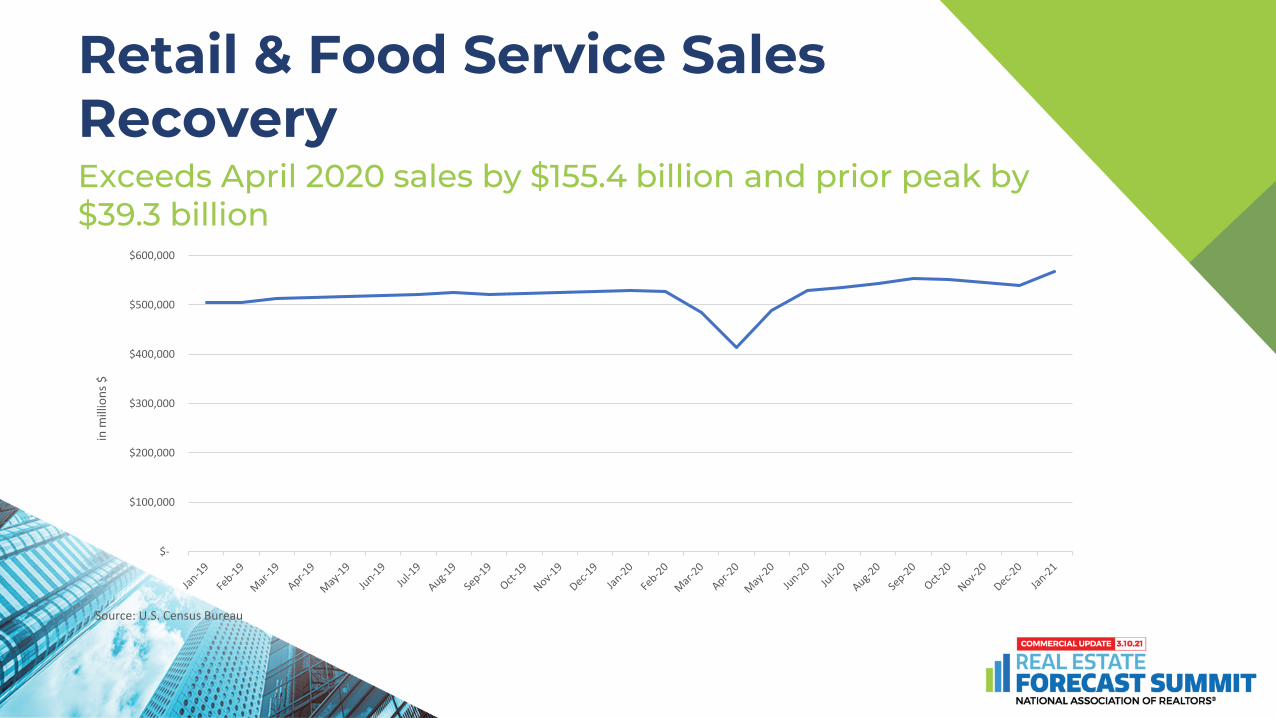
Retail & Food Service Sales RecoveryExceeds April 2020 sales by $155.4 billion and prior peak by $39.3 billion
$-
$100,000
$200,000
$300,000
$400,000
$500,000
$600,000
in m
illio
ns $
Source: U.S. Census Bureau
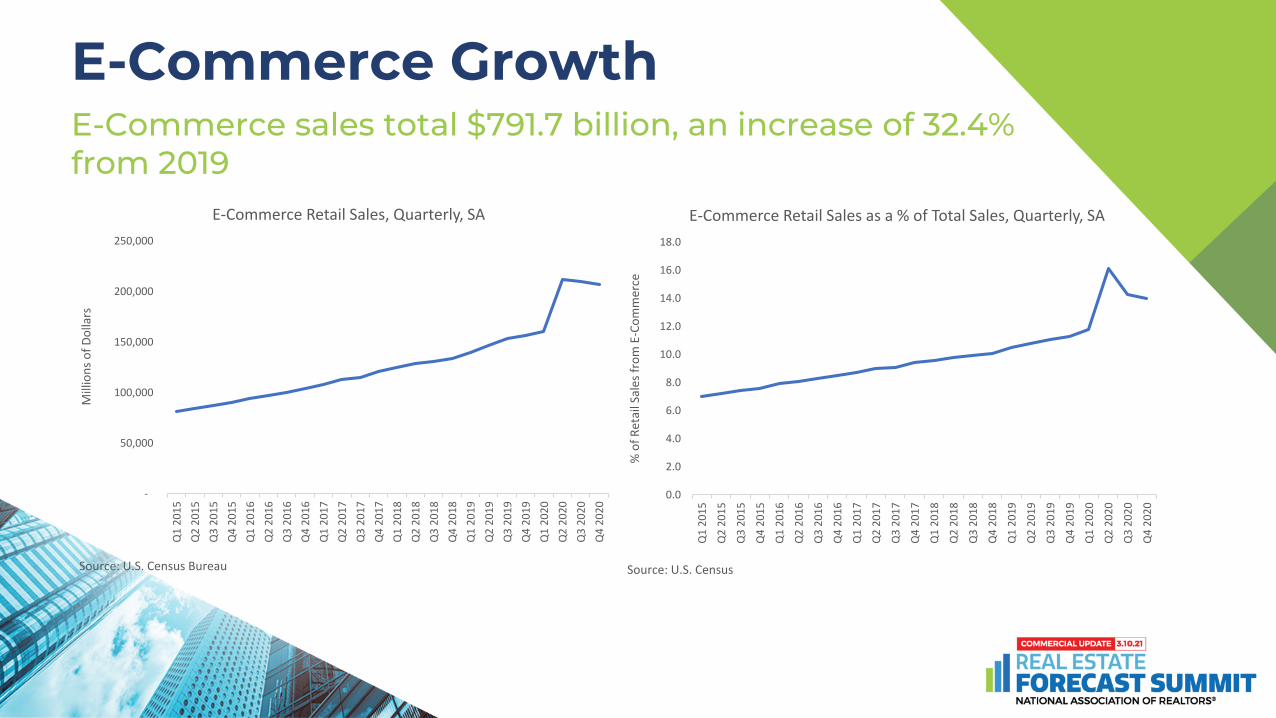
E-Commerce GrowthE-Commerce sales total $791.7 billion, an increase of 32.4% from 2019
-
50,000
100,000
150,000
200,000
250,000
Q1
2015
Q2
2015
Q3
2015
Q4
2015
Q1
2016
Q2
2016
Q3
2016
Q4
2016
Q1
2017
Q2
2017
Q3
2017
Q4
2017
Q1
2018
Q2
2018
Q3
2018
Q4
2018
Q1
2019
Q2
2019
Q3
2019
Q4
2019
Q1
2020
Q2
2020
Q3
2020
Q4
2020
Mill
ions
of D
olla
rs
Source: U.S. Census Bureau
E-Commerce Retail Sales, Quarterly, SA
0.0
2.0
4.0
6.0
8.0
10.0
12.0
14.0
16.0
18.0
Q1
2015
Q2
2015
Q3
2015
Q4
2015
Q1
2016
Q2
2016
Q3
2016
Q4
2016
Q1
2017
Q2
2017
Q3
2017
Q4
2017
Q1
2018
Q2
2018
Q3
2018
Q4
2018
Q1
2019
Q2
2019
Q3
2019
Q4
2019
Q1
2020
Q2
2020
Q3
2020
Q4
2020
% o
f Ret
ail S
ales
from
E-C
omm
erce
Source: U.S. Census
E-Commerce Retail Sales as a % of Total Sales, Quarterly, SA
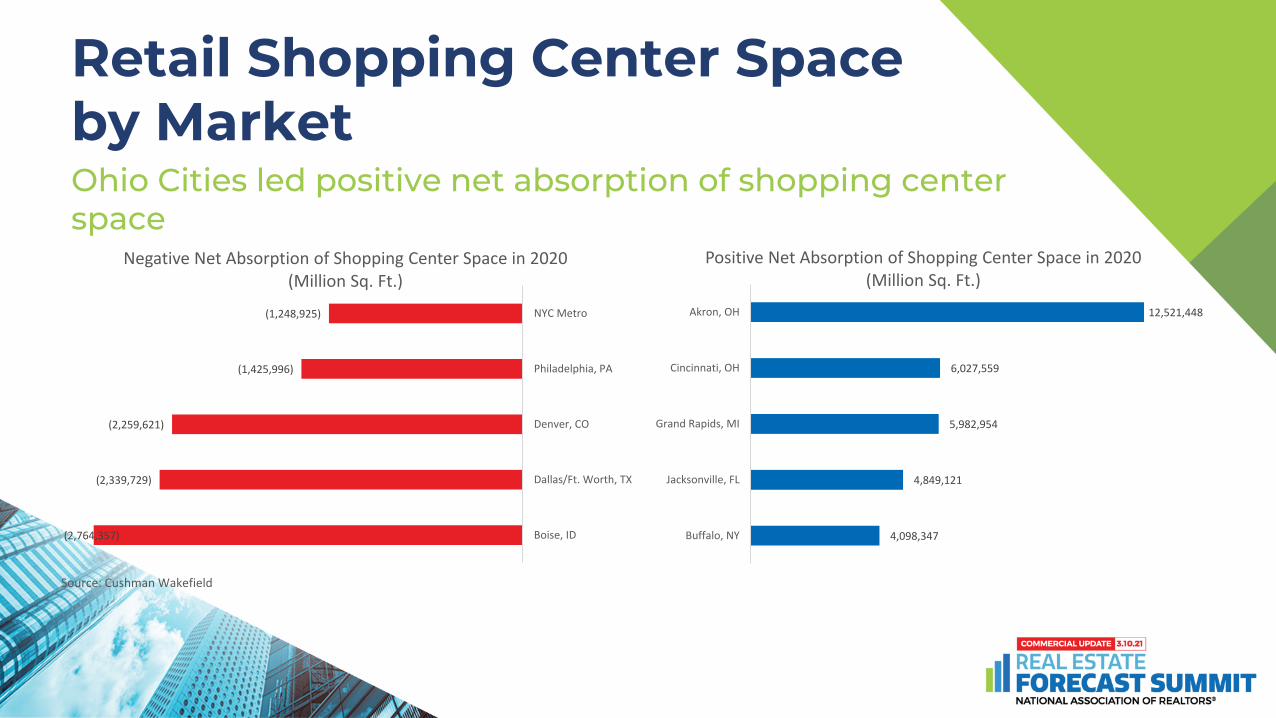
Retail Shopping Center Space by MarketOhio Cities led positive net absorption of shopping center space
(2,764,357)
(2,339,729)
(2,259,621)
(1,425,996)
(1,248,925)
Boise, ID
Dallas/Ft. Worth, TX
Denver, CO
Philadelphia, PA
NYC Metro
Source: Cushman Wakefield
Negative Net Absorption of Shopping Center Space in 2020 (Million Sq. Ft.)
4,098,347
4,849,121
5,982,954
6,027,559
12,521,448
Buffalo, NY
Jacksonville, FL
Grand Rapids, MI
Cincinnati, OH
Akron, OH
Positive Net Absorption of Shopping Center Space in 2020 (Million Sq. Ft.)
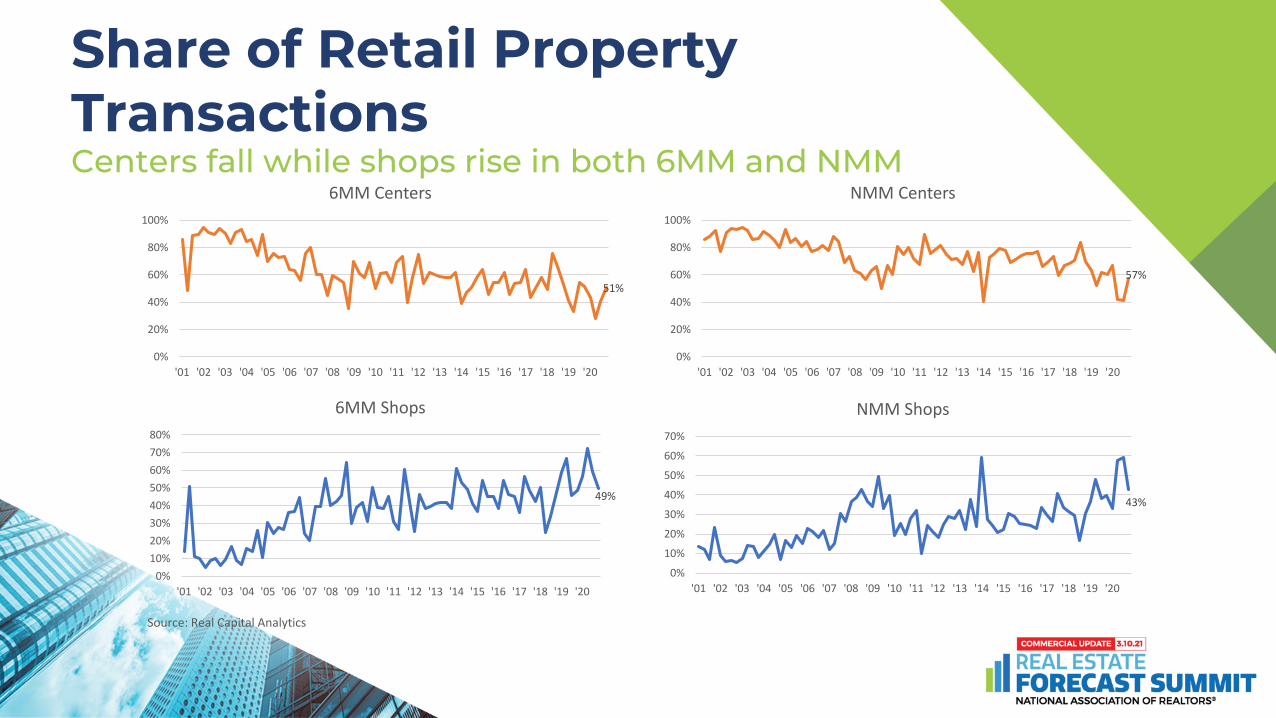
Share of Retail Property TransactionsCenters fall while shops rise in both 6MM and NMM
51%
0%
20%
40%
60%
80%
100%
'01 '02 '03 '04 '05 '06 '07 '08 '09 '10 '11 '12 '13 '14 '15 '16 '17 '18 '19 '20
6MM Centers
49%
0%10%20%30%40%50%60%70%80%
'01 '02 '03 '04 '05 '06 '07 '08 '09 '10 '11 '12 '13 '14 '15 '16 '17 '18 '19 '20
Source: Real Capital Analytics
6MM Shops
57%
0%
20%
40%
60%
80%
100%
'01 '02 '03 '04 '05 '06 '07 '08 '09 '10 '11 '12 '13 '14 '15 '16 '17 '18 '19 '20
NMM Centers
43%
0%
10%
20%
30%
40%
50%
60%
70%
'01 '02 '03 '04 '05 '06 '07 '08 '09 '10 '11 '12 '13 '14 '15 '16 '17 '18 '19 '20
NMM Shops
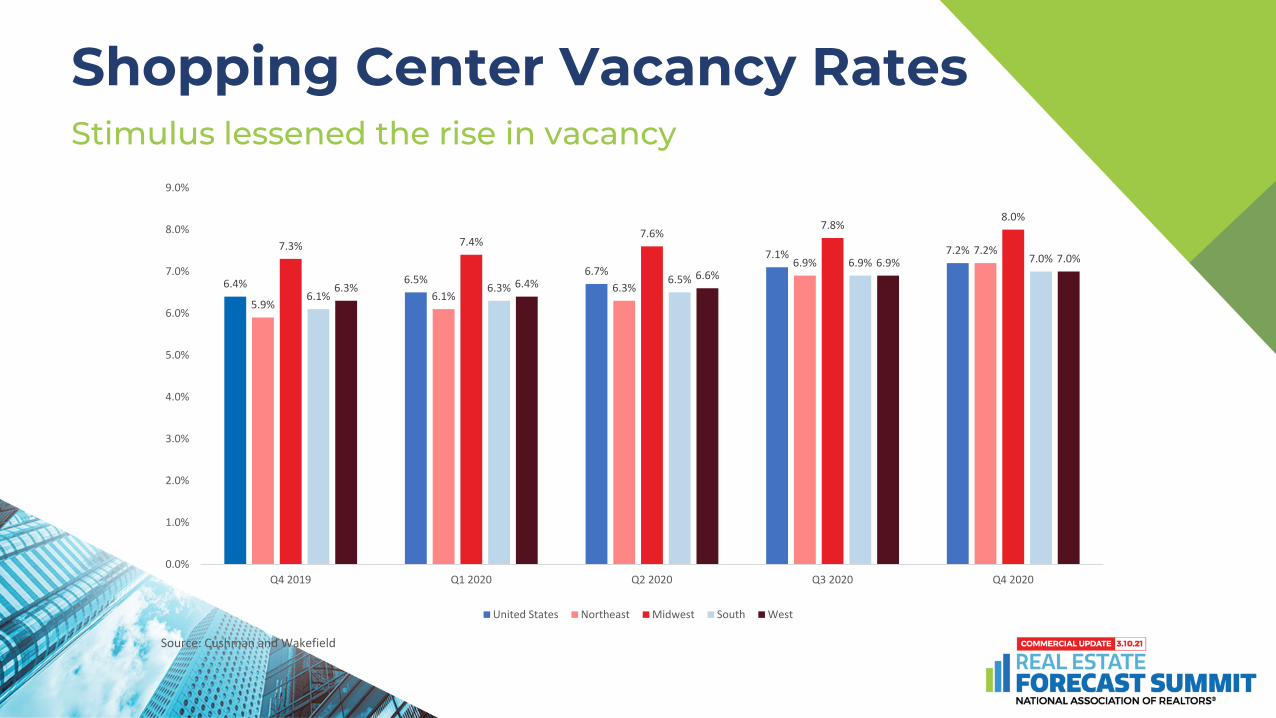
Shopping Center Vacancy RatesStimulus lessened the rise in vacancy
6.4% 6.5%6.7%
7.1% 7.2%
5.9%6.1%
6.3%
6.9%7.2%7.3% 7.4%
7.6%7.8%
8.0%
6.1%6.3%
6.5%6.9% 7.0%
6.3% 6.4%6.6%
6.9% 7.0%
0.0%
1.0%
2.0%
3.0%
4.0%
5.0%
6.0%
7.0%
8.0%
9.0%
Q4 2019 Q1 2020 Q2 2020 Q3 2020 Q4 2020
Source: Cushman and Wakefield
United States Northeast Midwest South West
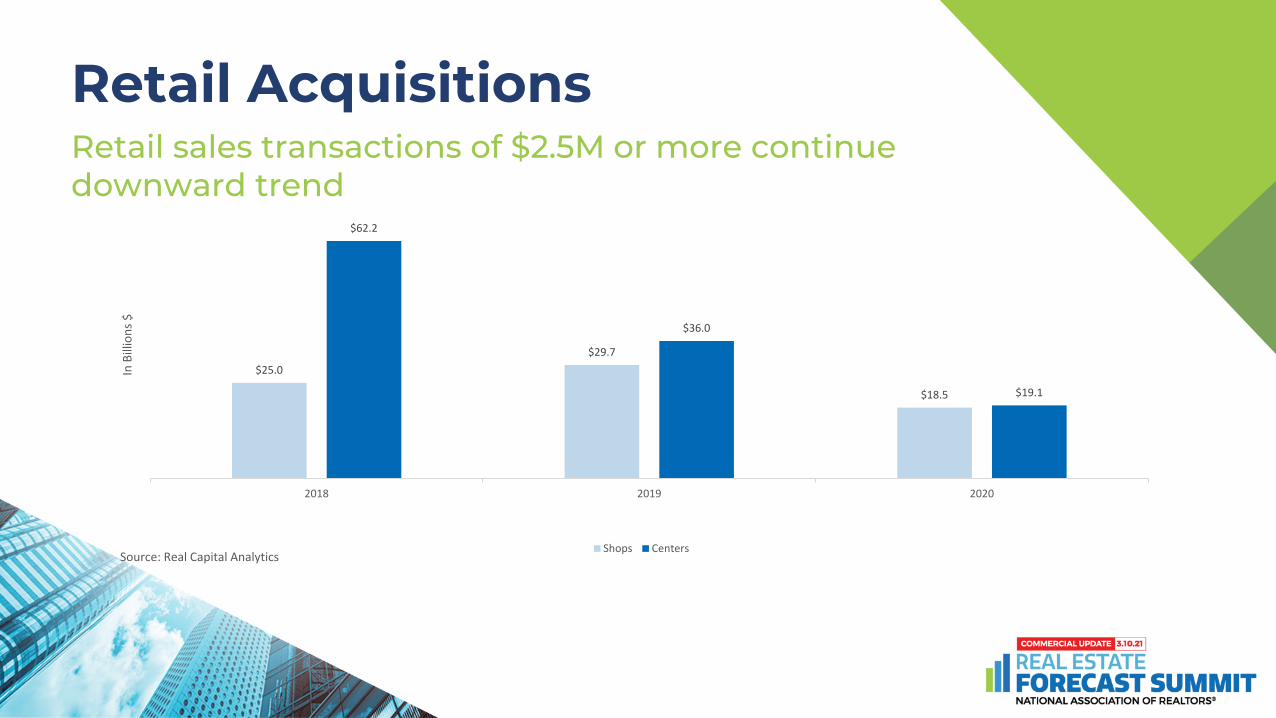
Retail Acquisitions Retail sales transactions of $2.5M or more continue downward trend
$25.0$29.7
$18.5
$62.2
$36.0
$19.1
2018 2019 2020
In B
illio
ns $
Source: Real Capital AnalyticsShops Centers
Retail Outlook Healthier retail than 2020
- Vaccinations- Retailers: Stronger financial fundamentals- More consumers shift to e-commerce- Downtown retail/food improvement in second half of
2021- Opportunities in repurposing existing assets
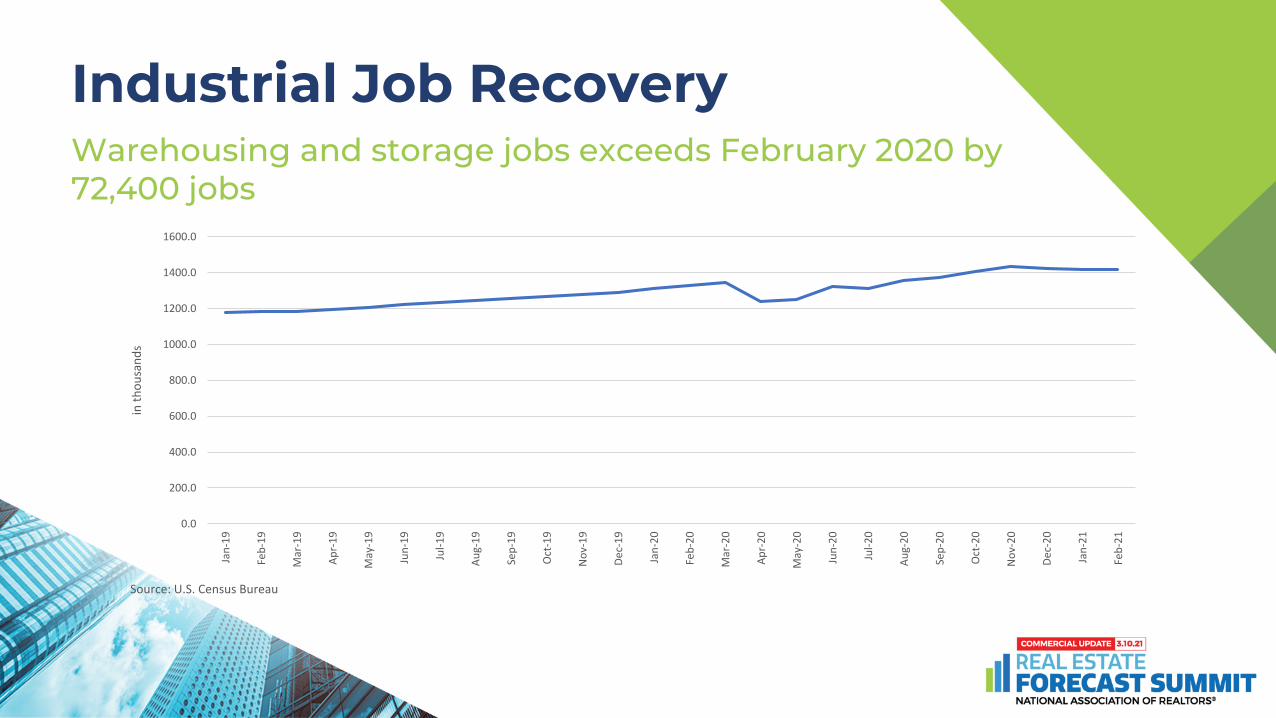
Industrial Job RecoveryWarehousing and storage jobs exceeds February 2020 by 72,400 jobs
0.0
200.0
400.0
600.0
800.0
1000.0
1200.0
1400.0
1600.0Ja
n-19
Feb-
19
Mar
-19
Apr-
19
May
-19
Jun-
19
Jul-1
9
Aug-
19
Sep-
19
Oct
-19
Nov
-19
Dec-
19
Jan-
20
Feb-
20
Mar
-20
Apr-
20
May
-20
Jun-
20
Jul-2
0
Aug-
20
Sep-
20
Oct
-20
Nov
-20
Dec-
20
Jan-
21
Feb-
21
in th
ousa
nds
Source: U.S. Census Bureau
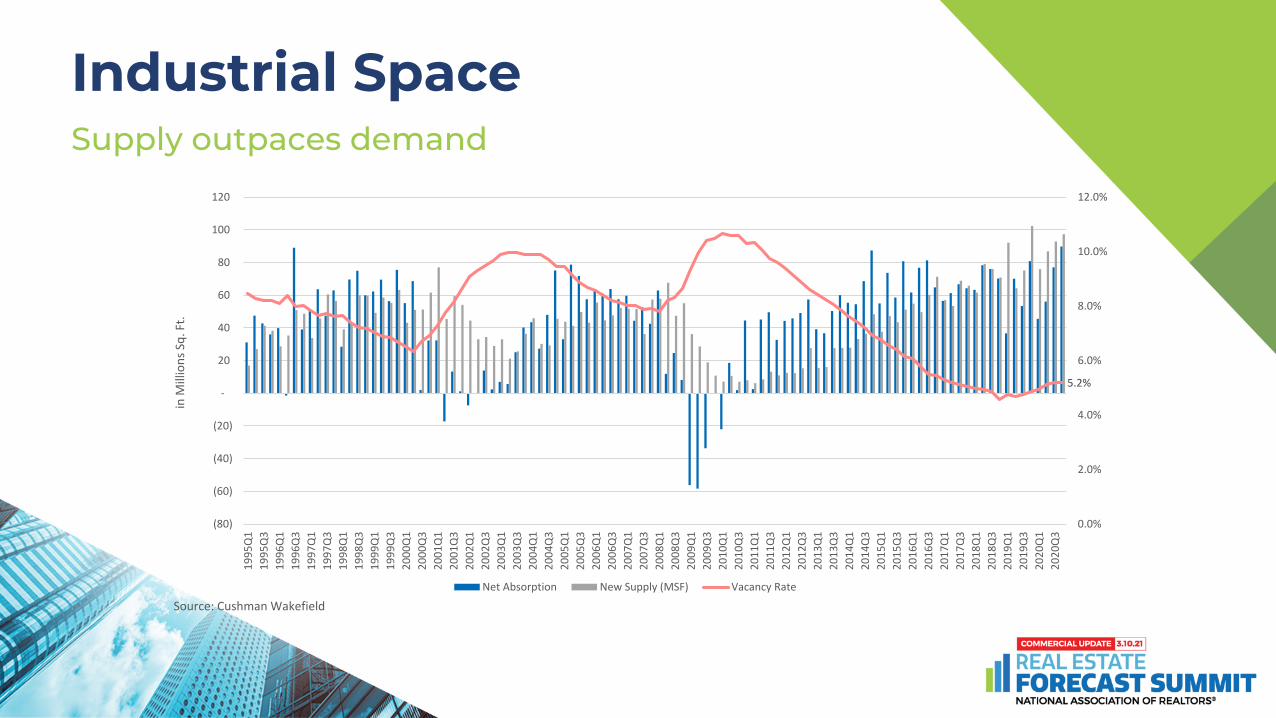
Industrial SpaceSupply outpaces demand
5.2%
0.0%
2.0%
4.0%
6.0%
8.0%
10.0%
12.0%
(80)
(60)
(40)
(20)
-
20
40
60
80
100
120
1995
Q1
1995
Q3
1996
Q1
1996
Q3
1997
Q1
1997
Q3
1998
Q1
1998
Q3
1999
Q1
1999
Q3
2000
Q1
2000
Q3
2001
Q1
2001
Q3
2002
Q1
2002
Q3
2003
Q1
2003
Q3
2004
Q1
2004
Q3
2005
Q1
2005
Q3
2006
Q1
2006
Q3
2007
Q1
2007
Q3
2008
Q1
2008
Q3
2009
Q1
2009
Q3
2010
Q1
2010
Q3
2011
Q1
2011
Q3
2012
Q1
2012
Q3
2013
Q1
2013
Q3
2014
Q1
2014
Q3
2015
Q1
2015
Q3
2016
Q1
2016
Q3
2017
Q1
2017
Q3
2018
Q1
2018
Q3
2019
Q1
2019
Q3
2020
Q1
2020
Q3
in M
illio
ns S
q. F
t.
Source: Cushman WakefieldNet Absorption New Supply (MSF) Vacancy Rate
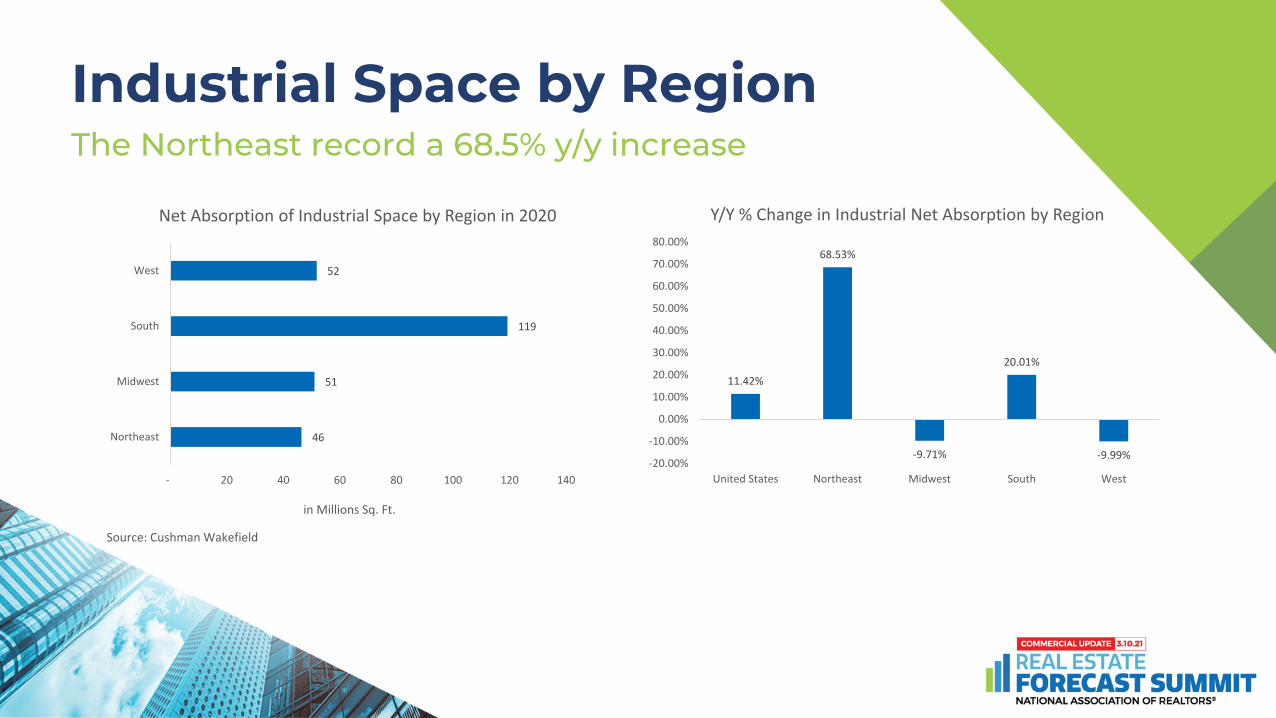
Industrial Space by RegionThe Northeast record a 68.5% y/y increase
46
51
119
52
- 20 40 60 80 100 120 140
Northeast
Midwest
South
West
Source: Cushman Wakefield
in Millions Sq. Ft.
Net Absorption of Industrial Space by Region in 2020
11.42%
68.53%
-9.71%
20.01%
-9.99%-20.00%
-10.00%
0.00%
10.00%
20.00%
30.00%
40.00%
50.00%
60.00%
70.00%
80.00%
United States Northeast Midwest South West
Y/Y % Change in Industrial Net Absorption by Region
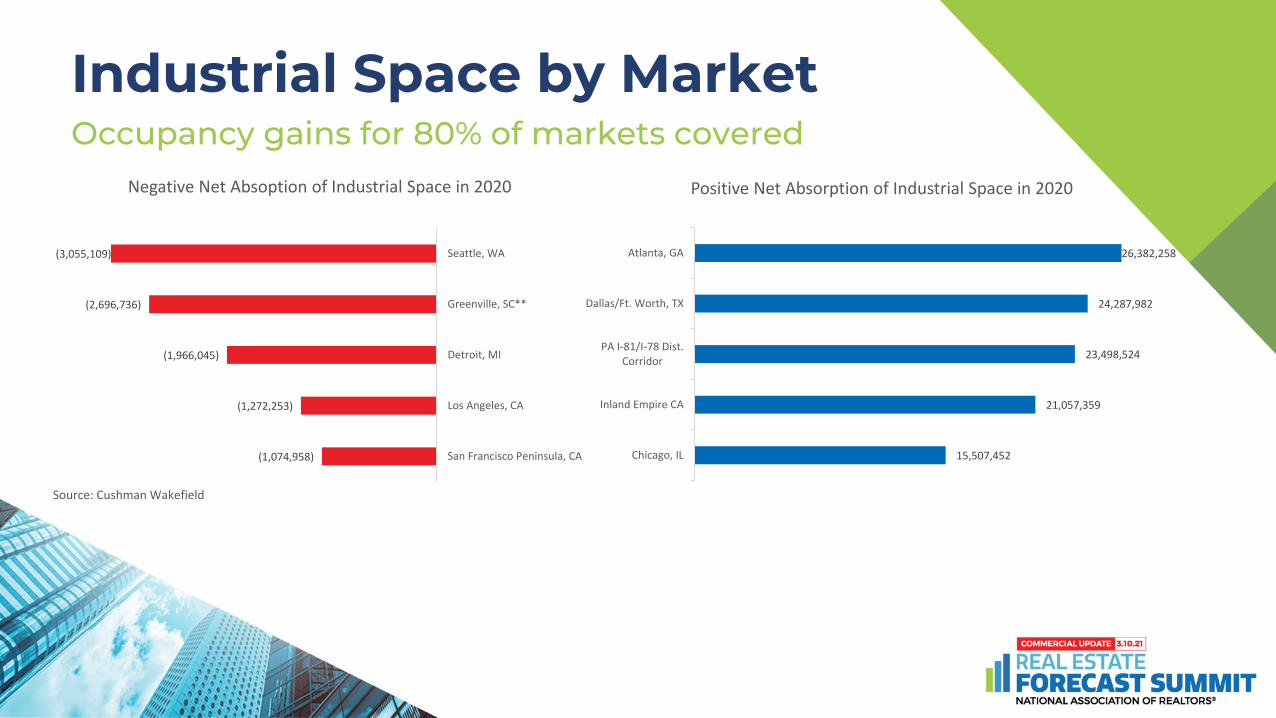
Industrial Space by MarketOccupancy gains for 80% of markets covered
(1,074,958)
(1,272,253)
(1,966,045)
(2,696,736)
(3,055,109)
San Francisco Peninsula, CA
Los Angeles, CA
Detroit, MI
Greenville, SC**
Seattle, WA
Source: Cushman Wakefield
Negative Net Absoption of Industrial Space in 2020
15,507,452
21,057,359
23,498,524
24,287,982
26,382,258
Chicago, IL
Inland Empire CA
PA I-81/I-78 Dist.Corridor
Dallas/Ft. Worth, TX
Atlanta, GA
Positive Net Absorption of Industrial Space in 2020
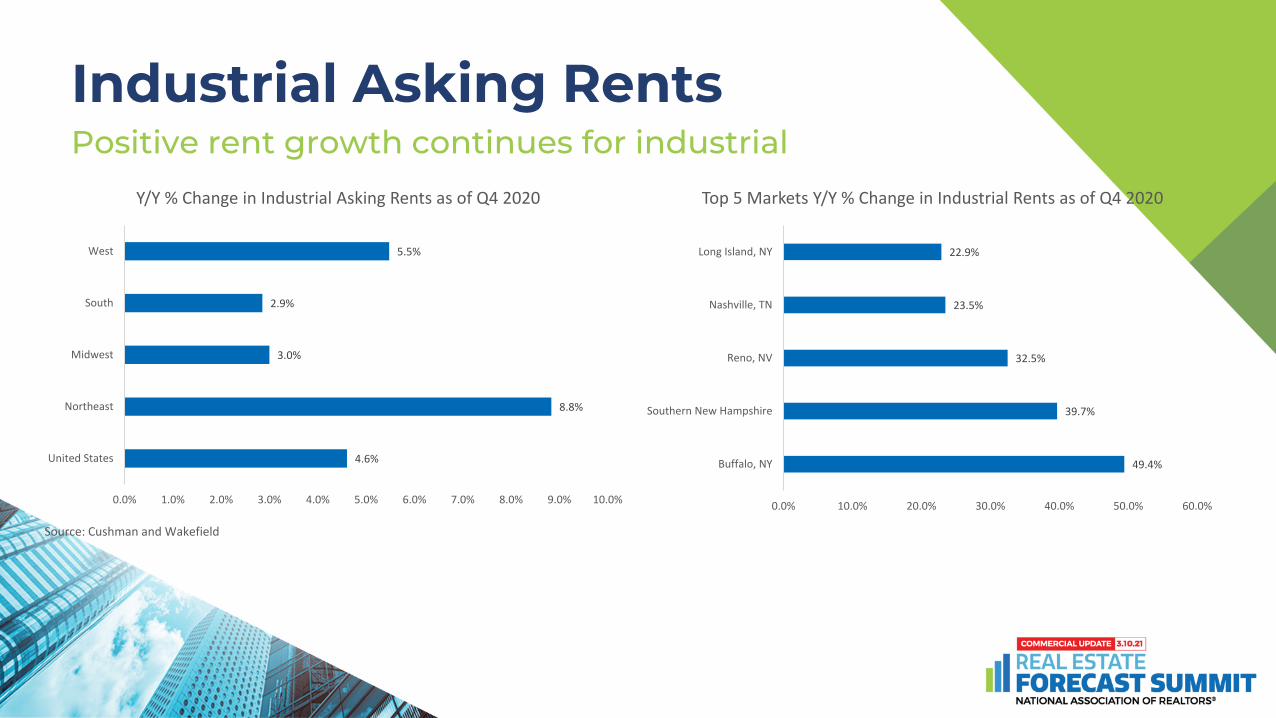
Industrial Asking RentsPositive rent growth continues for industrial
49.4%
39.7%
32.5%
23.5%
22.9%
0.0% 10.0% 20.0% 30.0% 40.0% 50.0% 60.0%
Buffalo, NY
Southern New Hampshire
Reno, NV
Nashville, TN
Long Island, NY
Top 5 Markets Y/Y % Change in Industrial Rents as of Q4 2020
4.6%
8.8%
3.0%
2.9%
5.5%
0.0% 1.0% 2.0% 3.0% 4.0% 5.0% 6.0% 7.0% 8.0% 9.0% 10.0%
United States
Northeast
Midwest
South
West
Source: Cushman and Wakefield
Y/Y % Change in Industrial Asking Rents as of Q4 2020

Industrial AcquisitionsIndustrial sales transactions of $2.5M or more still strong
$21.1 $22.8 $18.6
$77.2
$94.6
$80.1
2018 2019 2020
in B
illio
ns $
Source: Real Capital Analytics
Flex Warehouse
Industrial Outlook Better industrial
- Strong demand to continue- More supply- Rent growth- Higher vacancy