Embed Size (px)
Citation preview
A Happy Heart RateA Happy Heart RateHomeostasis comes from the Greek words for “same” and “state.” homeosta-
sis is defined as the state of optimal functioning in a living system through the steady maintenance of internal, external, and chemical conditions. Homeosta-sis is necessary for survival, and our Creator has designed our body to automat-ically resist any change to “steady state” of being. Think about it: Why do you get a high temperature when you are sick? Why do you sweat when you exer-cise? Why does your heart beat faster when you are running versus sitting? Do you consciously make these things happen?
These are all factors that would disrupt the homeostasis of our bodies, and these reactions are the body’s way of maintaining a healthy, steady state. God designed our bodies to regulate our temperature, water, salts and sugars, proteins and fats, oxygen supply, pH, and so on.
Homeostasis is regulated by either negative feedback loops or positive feedback loops. Negative feedback loops work to bring your body back to the set point (state of normal). If your body temperature rises to 101°, your body will immediately respond with a negative feedback loop (like a fever and chills/sweating) to help you return to your normal temperature, around 98°. In contrast, positive feedback loops respond to a change in homeostasis by causing further change that pushes it in the same direc-tion. Often positive feedback loops are harmful, but in cases of blood clotting or childbirth, humans rely on these processes for survival.
Extra Family Fun: Design an obstacle course in your home or yard.Have every member of the family complete the course as fast as they can. See whose heart rate changes the most and the least.
© 2020 Answers in Genesis–USA. All rights reserved. AnswersInGenesis.org
2
© 2
020
Ans
wer
s in
Gen
esis
–USA
. All
right
s re
serv
ed. A
nsw
ersI
nGen
esis
.org
Unl
ocki
ng S
cien
ce H
ands
-On
6/05
/202
0 A
Hap
py H
eart
Rat
e
Supplies { You and one family
member { A clock, stopwatch, or
smartphone/smartwatch with stopwatch
{ Optional: fitness tracker with heart monitor, digi-tal heart rate monitor, or blood pressure cuff
Activity
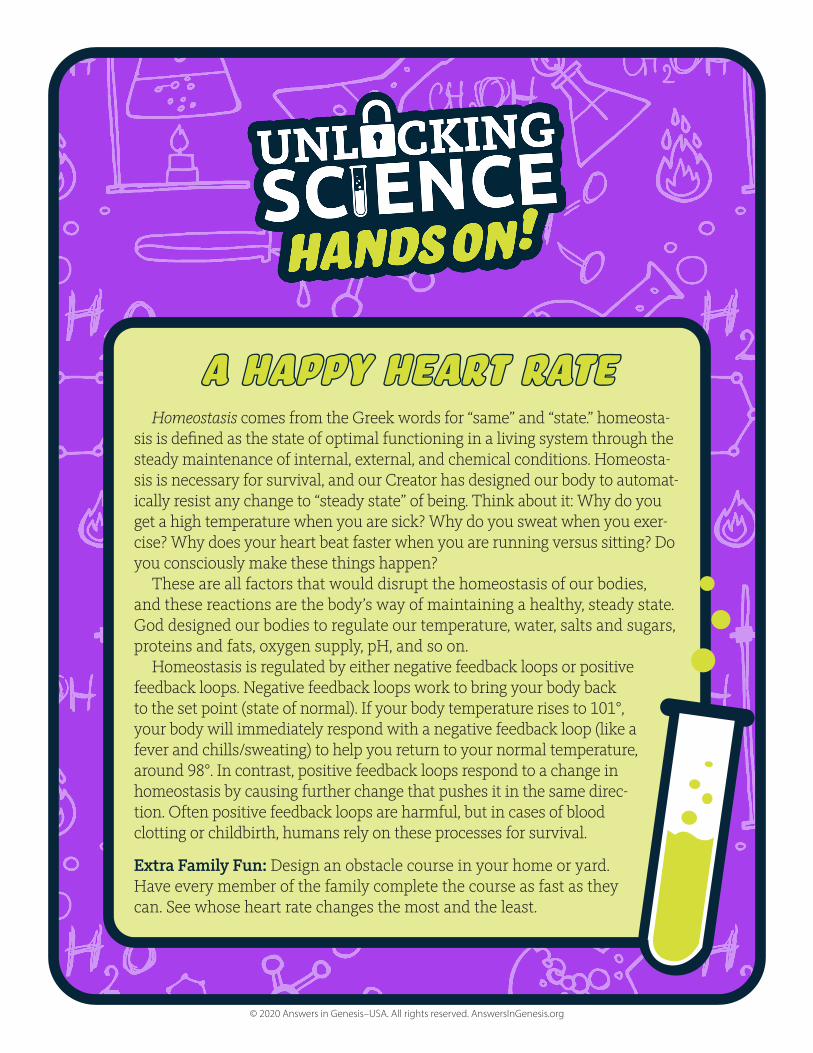
1 You will measure your heart rate by taking your pulse. There are two ways to take your pulse: radial pulse and carotid pulse. a Radial Pulse: Place the 2nd
and 3rd fingers in the groove in the wrist that lies beneath the thumb. The radial artery runs along the radius (the bone on the outside of your arm when your palm is up)and supplies oxygenated blood to your hand. It is best not to use your thumb to find the radial pulse as you can sometimes feel a pulse in someone’s thumb. See Figure 1.
b Carotid Pulse: Place the 2nd and 3rd fingers alongside your trachea and apply light pressure. The carotid arter-ies supply oxygenated blood to the brain, face, and neck, so don’t press on both of them at the same time. See Figure 2.
2 Count the number of beats in 15 seconds. Your partner will use the stopwatch to tell you when to start and stop. This will give you your resting heart rate as a starting point (a controlled variable) to compare your data. (Optional: Use a heart rate mon-itor or some device to generate the heart rate data.)
3 Multiply the number of beats in 15 seconds by 4 to calculate the beats per minute. Record the data in Table 1 under Heart Rate on the 0 minutes line.
Formula: # of beats x 4 = beats/minute4 Have your partner measure your breathing rate by
Jumping AroundJumping Around
Figure 1: Taking a radial pulse
Figure 2: Taking a carotid pulse

3
© 2
020
Ans
wer
s in
Gen
esis
–USA
. All
right
s re
serv
ed. A
nsw
ersI
nGen
esis
.org
Unl
ocki
ng S
cien
ce H
ands
-On
6/05
/202
0 A
Hap
py H
eart
Rat
e
counting the number of breaths you take in 15 seconds. Multiply this number by 4 to calculate the breaths per minute. Record this information in Table 1 under Breathing Rate on the 0 minutes line.
Formula: # of breaths x 4 = breaths/minute
5 You will now do jumping jacks for 2 minutes.* Be sure your partner is ready to tell you when to start and when to stop. After 2 minutes, measure your heart rate and breathing rate as quickly as possible by following steps 3–4. You can measure your heart rate while your partner counts your breaths. Record the values in Table 1.
6 Perform step 5 again 3 more times and record the data in Table 1.
7 After the final active recording at 8 minutes, you will rest for 1 minute and 30 seconds. Measure the variables again and record in the 9.5 line of Table 1.
8 At 12 minutes, take a final measurement and record in Table 1.
Table 1: Heart and breathing rates during activity
Time (minutes)
Heart Rate (beats/minute)
Breathing Rate (breaths/minute)
0
2
4
6
8
9.5
12
*If at any time the person exercising feels discomfort or lightheadedness, stop the experiment immediately.
Jumping Around ConTinuEd
4
© 2
020
Ans
wer
s in
Gen
esis
–USA
. All
right
s re
serv
ed. A
nsw
ersI
nGen
esis
.org
Unl
ocki
ng S
cien
ce H
ands
-On
6/05
/202
0 A
Hap
py H
eart
Rat
e
Analysis Questions and DiscussionAnalysis Questions and Discussion
1 What are the things that changed in this experiment? The amount of time that passed indicates a change in time. The heart rate and breathing rate both changed with the time. In science, we call these variables since they can change or vary in our experiment. A variable can be an object, a time, or something you are trying to measure. When a scientist designs an experiment, she tries to control all of the variables so that there are the fewest number of differences possible—these are called controlled variables. The variable that we measure is called the dependent variable—its value depends on what happens during the experiment. The vari-able that we change is called the independent variable—its value is independently assigned by the experimenter.
2 What are the independent variable (IV) and dependent variables (DV) in this experiment? An independent variable (IV) is the variable that does not change or is not affected by the dependent variable (DV). A good example of an IV is age. Your age will not change if you play video games, go to school, or ride your bike. A DV is dependent upon the IV, meaning the DV is subject to change based on the effects of the IV. The DV is the effect brought by changes to the IV which cause the change. A good example of a dependent variable is a test score. A test score is measured as the effect and can change based upon the amount of time you study, causing a change in the score. The score depends on the study time, which you can independently adjust. In this experiment, your IV is time since you could adjust the amount of time you exercised. The time exercising was independently adjusted by you as the exper-imenter. There were two dependent variables in this experiment, heart rate beats/minute and breathing rate breaths/minute. Both of these were affected by the time you spent exercising and you measured the rates. Time exercising was the effect that caused a change in heart and breathing rate.
3 What were the controlled variables in the experiment? (What stayed the same through the course of the experiment?) The controlled variables are the things that stayed constant through the experiment. You exercised in the same room with the same temperature. Your human body was still your human body from the time you started to the time you ended. You used the same technique or device to measure the rates.
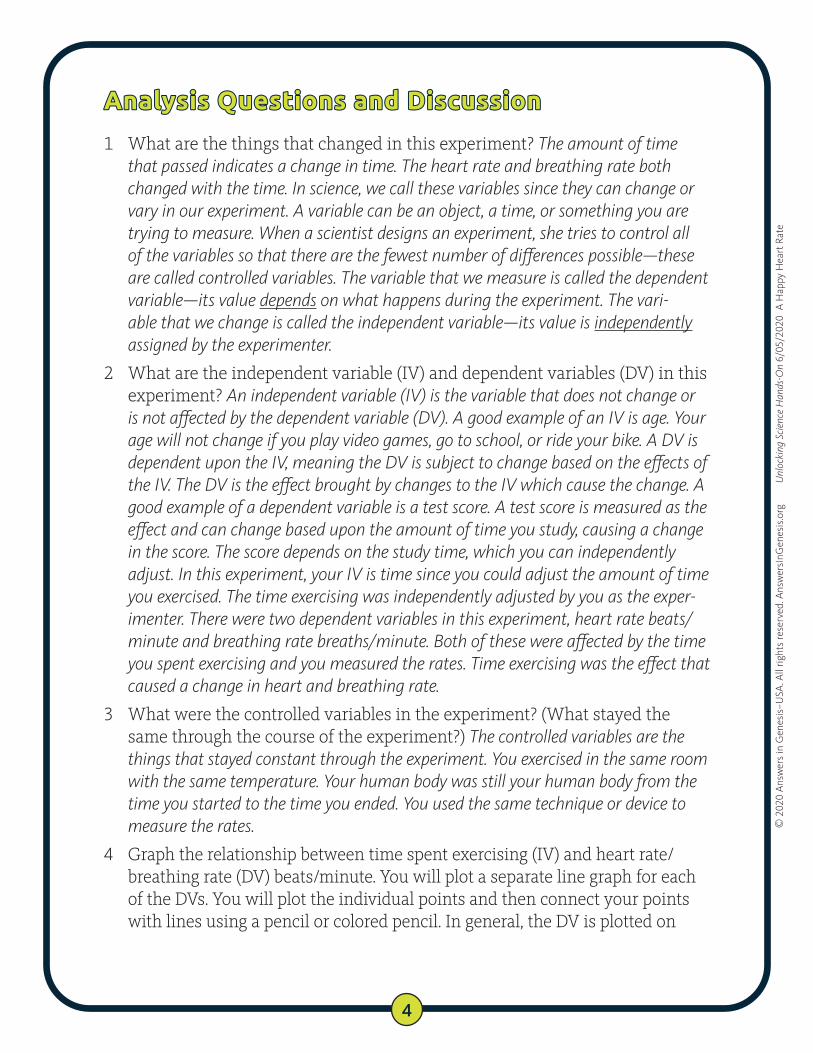
4 Graph the relationship between time spent exercising (IV) and heart rate/breathing rate (DV) beats/minute. You will plot a separate line graph for each of the DVs. You will plot the individual points and then connect your points with lines using a pencil or colored pencil. In general, the DV is plotted on
5
© 2
020
Ans
wer
s in
Gen
esis
–USA
. All
right
s re
serv
ed. A
nsw
ersI
nGen
esis
.org
Unl
ocki
ng S
cien
ce H
ands
-On
6/05
/202
0 A
Hap
py H
eart
Rat
e
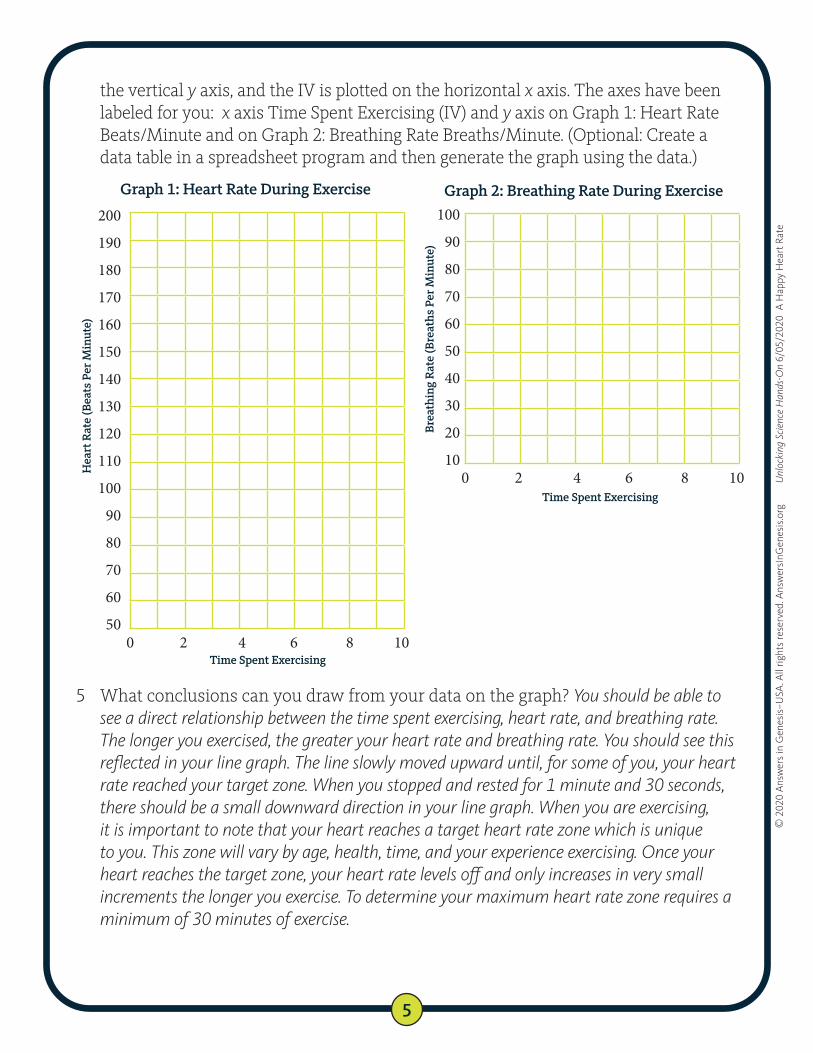
the vertical y axis, and the IV is plotted on the horizontal x axis. The axes have been labeled for you: x axis Time Spent Exercising (IV) and y axis on Graph 1: Heart Rate Beats/Minute and on Graph 2: Breathing Rate Breaths/Minute. (Optional: Create a data table in a spreadsheet program and then generate the graph using the data.)
Graph 1: Heart Rate During Exercise Graph 2: Breathing Rate During Exercise
5 What conclusions can you draw from your data on the graph? You should be able to see a direct relationship between the time spent exercising, heart rate, and breathing rate. The longer you exercised, the greater your heart rate and breathing rate. You should see this reflected in your line graph. The line slowly moved upward until, for some of you, your heart rate reached your target zone. When you stopped and rested for 1 minute and 30 seconds, there should be a small downward direction in your line graph. When you are exercising, it is important to note that your heart reaches a target heart rate zone which is unique to you. This zone will vary by age, health, time, and your experience exercising. Once your heart reaches the target zone, your heart rate levels off and only increases in very small increments the longer you exercise. To determine your maximum heart rate zone requires a minimum of 30 minutes of exercise.
Hea
rt R
ate
(Bea
ts P
er M
inut
e)
200
190
180
170
160
150
140
130
120
110
100
90
80
70
60
500 2 4 6 8 10
Time Spent Exercising
100
90
80
70
60
50
40
30
20
10
Bre
athi
ng R
ate
(Bre
aths
Per
Min
ute)
0 2 4 6 8 10Time Spent Exercising

6
© 2
020
Ans
wer
s in
Gen
esis
–USA
. All
right
s re
serv
ed. A
nsw
ersI
nGen
esis
.org
Unl
ocki
ng S
cien
ce H
ands
-On
6/05
/202
0 A
Hap
py H
eart
Rat
e
6 What are other things you could have measured to determine the external and internal effects of exercise on the human body? You could have observed the amount of perspiration at the end of each 2 minutes. The longer you exercise, the more your body heats up. As your body heats up, your body will want to maintain homeosta-sis, so it initiates a negative feedback loop called sweating. Sweating helps to cool the body down and maintain a healthy body temperature. You could also measure body temperature. Before you begin the activity, your temperature should have been fairly close to 98.6°. The longer you exercise, you may notice your temperature increasing slightly as your body heats up.
7 The heart beats 100,000 times a day and 35 million times in a lifetime. It is very humbling to realize that God controls every single beat of your physical heart. We should be very thankful that our physical heart works right every day, but what about our spiritual heart? Is it working right every day? The truth is every-one’s spiritual heart has problems every single day. Discuss with your family the spiritual heart issues that plague us in our daily lives and consider the only cure. Everyone is born with a sin problem (Romans 3:23). Our perfect and just God hates sin, and sin separates us from God. Our sins are the result of our sin problem. How do we bridge the gap between our sinful nature and a righteous God? Sin requires a sacrifice (Romans 8:3). Jesus Christ came to earth as a human (Matthew 1:25), with a physical heart beat just like you, but he was perfect. He never sinned, never lied, never disobeyed, never cheated, never stole but lived a perfect life (1 Peter 2:22). Jesus was the perfect sacrifice and died for sinners (John 3:16). The only way to heal our spiritual heart prob-lem is through a personal relationship with Jesus Christ, repenting of our sin and trust-ing in him for our salvation from the wrath of God against sin. Even after we decide to follow Christ, we will have spiritual heart problems, but now we are forgiven. And Jesus can help guide us through those spiritual heart problems as we read his holy Word, talk to him through prayer, and yield to the Holy Spirit’s work in our lives.
Trust in the Lord with all your heart, and do not lean on your own understanding. In all your ways acknowledge him, and
he will make straight your paths. Proverbs 3:5–6 (ESV)