Embed Size (px)
Citation preview

© 2021. StriveTogether, Inc. All rights reserved.
pg 1
A guide to racial and ethnicequity systemsindicators
2020/2021

© 2021. StriveTogether, Inc. All rights reserved.
pg 2
This systems indicators guide was made possible by the work of members of the 2020 StriveTogether Racial and Ethnic Equity Action team:
We’d like to thank Patricia Dao-Tran, founder & principal of Resonance Data Collective (@resonance_data), and Lisa Low (www.lisa-low.com) who collaborated with the Racial and Ethnic Equity Action Team to develop this resource.
We are also grateful to the Urban Institute for their work in the Boosting Upward Mobility Report, which was used as a foundation for the adjacent sector systems indicators.
acknowledgements
Balpreet Kaur - StriveTogether
Dr. Delia Kimbrel - ImpactTulsa
Dr. Gabriela Katz - StriveTogether
Jennifer Blatz - StriveTogether
Joe Munnich - Generation Next
Luvia Tapia - The Commit Partnership
Marissa Villa - UP Partnership
Matt Snyder - Higher Expectations for Racine County
Michael Applegate - Bright Futures Education Partnership
Rebecca Chavez-Houck - Promise Partnership of Salt Lake
Ritika Kurup - StriveTogether
Simon Tam - StriveTogether
Zach Pruitt - Northfield Promise

© 2021. StriveTogether, Inc. All rights reserved.
pg 3
Introduction ........................................................................................ pg 4-6Why systems indicators? ........................................................................................ pg 5
About this guide ....................................................................................................... pg 6
Cradle-to-career systems indicators ................................................ pg 7-12Race/ethnicity of teachers and administrators relative to student body ......... pg 9
Teacher qualifications ............................................................................................. pg 9
Culturally responsive curriculum .......................................................................... pg 9
Per-pupil funding .................................................................................................... pg 10
Internet and computer/device access and technical support ........................... pg 10
Accessible and equitable parental and community governance ...................... pg 10
School climate/discipline ....................................................................................... pg 11
Financial barriers to postsecondary enrollment ................................................. pg 11
Internship and mentorship opportunities/partnerships ................................... pg 12
Local employer adoption of “family-centered” practices .................................. pg 12
Adjacent sector systems indicators ................................................. pg 13-18Financial well-being ................................................................................................ pg 15
Housing: Affordability, instability, homelessness & environmental racism .... pg 15
Health: Health care access and utilization, neonatal/maternal health and mental health .................................................... pg 16
Food security ........................................................................................................... pg 16
Inclusive communities & neighborhoods ............................................................ pg 17
Transportation equity ............................................................................................. pg 18
Legal system ............................................................................................................ pg 18
Stories from the Network ................................................................ pg 19-54Addressing disparities at the systems level (Bright Futures) ............................. pg 20-25
Cross-referencing systems data to inform equity (ImpactTulsa) ...................... pg 26-31
Mapping data around community solutions (UP Partnership) ......................... pg 32-37
Understanding the causes behind systems-level data (Promise Partnership)............................................................ pg 38-44
Using lived experience to identify systems-level metrics (Boston Opportunity Agenda) ......................................... pg 45-52
Systems indicators tracking across the network ................................................ pg 53-54
table of contents

© 2021. StriveTogether, Inc. All rights reserved.
pg 4
introduction
The Racial and Ethnic Equity Action Team launched in March 2020, convening a diverse group of 27 network members, community partners and StriveTogether staff. The team’s charge is to work together to make tangible progress toward advancing racial and ethnic equity. Ultimately, the goal is systems transformation, a fundamental and institutionalized shift in policies, practices, resources and power structures so that Black, Indigenous, Latinx and Asian youth and families and youth and families experiencing poverty can thrive.
In January 2021, the Racial and Ethnic Equity Action Team released Guidance for Creating a New Education Model, a guide for StriveTogether Cradle to Career Network members, education institutions, partner agencies and systems that serve youth and families to create a new education model that keeps racial and ethnic equity at the center to drive lasting change to improve outcomes for children of color.
This resource complements the education model guidance by recommending systems-level indicators that unearth structural inequities within education, health, food, housing, transportation, financial, legal and other systems that impact the well-being of children, youth and families.

© 2021. StriveTogether, Inc. All rights reserved.
pg 5
The evidence-based decision making pillar within the StriveTogether Theory of Action™ emphasizes the importance of building a rich culture of data use for narrowing disparities. This guidance document is intended to support network members in identifying, collecting and reporting data related to systems and structures that contribute to or interrupt racial disparities in education and employment outcomes. This focus on interrogating indicators at the systems level acknowledges that systemic inequity perpetuates opportunity gaps and disproportionately burdens communities of color.
Indicators that measure outcomes at the individual level are most frequently used in education and the workforce. These outcomes include the achievement gap, racialized maternal and infant health disparities, the racial wealth gap and disparities in college-going and completion rates.
What we don’t see are the norms, policies and practices embedded within the institutions, organizations and systems where children and youth live, learn and grow. By singularly focusing on outcomes at the individual level, we ignore the role that complex systems and structures play in creating racialized disparities in education, health, wealth and social mobility. We enable placing blame on students, their families, race, culture or religion, rather than inequities in the system. Doing so gives rise to unfair and discriminatory narratives around Black, Indigenous, Latinx and Asian youth and their families and families experiencing poverty. It perpetuates systemic oppression.
Our goal is to support organizations to identify, collect, report and take action on systems-level indicators, defined as:
a measurement (both qualitative and quantitative) that reveals inequities in how resources, decision-making power and opportunities are distributed to inform policies and practices within institutions, organizations and programs that are interdependent and/or related.
Ultimately, when we couple individual-level indicators with systems-level indicators, we hold organizations and institutions accountable to create the conditions where all children, youth and their families can thrive no matter their race, place, education or income level.
why systems indicators?

© 2021. StriveTogether, Inc. All rights reserved.
pg 6
This guide provides recommendations on systems indicators organizations should collect, track and use to improve the well-being of children and families. The figure below explains the different pieces of the recommendations and the resources linked throughout. All indicators should be disaggregated by race, ethnicty, gender and income level when possible.
Systems indicators help to unearth structural barriers or systemic inequities that can lead to unfavorable cradle-to-career outcomes. While an indicator may be conceptually broad, we suggest several specific measures in this resource.
about this guide
1. Race/ethnicity of teachers and administrators relative to student body Measures and data
Same-race student-teacher pairings positively impact student learning and development through “active” and “passive” effects. Longitudinal studies have shown lasting impact on same-race student-teacher pairings in grades K-3 on graduation and college enrollment outcomes, particularly among Black students. While both rural and urban school districts are racially and culturally diverse, the education profession is predominantly white. The field may encourage diversity, equity and inclusion in the professionalpipeline, as well as prepare educators in culturally sustaining pedagogy and Critical Race Theory. Learn more about the research behind this indicator by clicking here.
(a) Teacher composition by race/ethnicity (%) compared to student composition by race/ethnicity (%)Data source(s): Shanker Institute (b) Same-race student-teacher ratio by race/ethnicityData source(s): local data
Click here to read more about these data.
We summarize the research behind the proposed systems indicator and how the indicator can help to hold systems accountable to better support youth and families.
Every rationale is then accompanied by a more detailed research narrative. Click on this link to learn more about a specific systems indicator.
Most systems indicators can be measured in multiple ways. This section outlines key measures of each indicator and potential data sources.
For measures that already have data publicly available, click here to go directly to the source.
This section lists additional measures and data sources. Click on this link to learn about additional measures and their data sources.

© 2021. StriveTogether, Inc. All rights reserved.
pg 7
cradle-to-career systems indicatorsI N D I C A T O R C H A R T
from A guide to racial and ethnic equity systems indicators

© 2021. StriveTogether, Inc. All rights reserved.
pg 8
Race/ethnicity of teachers and
administrators relative to student body
Accessible and equitable parental and community governance
Teacher qualifications
School climate/discipline
Internship and mentorship
opportunities/partnerships
Culturally responsive curriculum
Per-pupil funding Internet and computer/device access and technical support
1 2 3 4
5
quick link
quick link
quick link
quick link
quick link
quick link
quick link
quick link
quick link
quick link
Local employer adoption of “family-centered” practices
Financial barriers to postsecondary
enrollment
I N D I C A T O R C H A R T
Cradle-to-career racial and ethnic equity systems indicators are those related to the education and early workforce spaces. In this section, you’ll find recommendations for ten systems indicators to track to achieve equitable outcomes for youth, families and communities of color and those experiencing poverty.
cradle-to-career systems indicators

© 2021. StriveTogether, Inc. All rights reserved.
pg 9
a. Percent of qualified teachers across teacher certification, education and experience domains
Data sources: Civil Rights Data Collection; Learning Policy Institute; local school, LEA or SEA human resources, administrative and/or enrollment data
Click here to read more about these data.
a. Student perceptions of their school’s inclusion of their history, culture and racial identity
Data sources: Locally administered student-level surveys
b. Additional practice dimensionsi. Quality and extent of use of culturally responsive curriculum ii. Quality and extent of use of culturally responsive school or district policies
Data sources: Local policy and practice assessment, inventory or review
Click here to read more about these data.
1. Race/ethnicity of teachers and administrators relative to student body
2. Teacher qualifications
3. Culturally responsive curriculum
Measures and data
Measures and data
Measures and data
Same-race student-teacher pairings positively impact student learning and development through “active” and “passive” effects. Longitudinal studies have shown lasting impact on same-race student-teacher pairings in grades K-3 on graduation and college enrollment outcomes, particularly among Black students. While both rural and urban school districts are racially and culturally diverse, the education profession is predominantly white. The field may encourage diversity, equity and inclusion in the professional pipeline, as well as prepare educators in culturally sustaining pedagogy and Critical Race Theory.Learn more about the research behind this indicator by clicking here.
Teacher qualifications, such as certification level, education (including subject matter knowledge and teaching and learning pedagogy) and experience in the classroom positively influence student learning outcomes. Educators who employ effective and culturally sustaining practices and who exhibit warmth and responsiveness when engaging with students actively facilitate constructive classroom learning environments for all students.Learn more about the research behind this indicator by clicking here.
Culturally responsive curriculum and pedagogy centers the cultures, identities and experiences of students of color. A culturally responsive education seeks to foster strong, positive relationships between students, families and school staff by utilizing teaching practices and curricula that are inclusive of the diverse histories, cultures and experiences in the United States. Such an approach fosters positive youth development and empathetic social-emotional learning for all students and strengthens cultural identity among youth of color. Culturally responsive schools also help facilitate healing from the racial trauma and cultural erasure students experience at school, in the community and historically. Preparing educators in culturally responsive pedagogy and encouraging critical reflection through professional development and support can foster an inclusive and constructive school environment. Learn more about the research behind this indicator by clicking here.
a. Teacher composition by race/ethnicity (%) compared to student composition by race/ethnicity (%)
Data source: Shanker Institute b. Same-race student-teacher ratio by race/ethnicity
Data sources: Local school, LEA or SEA human resources, administrative and/or enrollment data
Click here to read more about these data.
cradle-to-career systems indicators

© 2021. StriveTogether, Inc. All rights reserved.
pg 10
Due to the longstanding practice of using local property taxes to fund public education, schools located in less wealthy communities have smaller budgets compared to affluent communities. This makes it difficult to offer up-to-date technologies and curricula, robust extracurricular activities or competitive salaries to attract experienced teachers. As a result, students of color and Black students in particular (due to a history of redlining and structural barriers to wealth accumulation) are disproportionately burdened by unequal learning conditions. Using per-pupil funding as an indicator of structural equity, education stakeholders may examine funding disparities vertically at the federal, state and local levels, as well as horizontally between schools within the same district. This kind of cross-examination helps hold policymakers and local governments accountable to ensuring equitable access to resources, qualified and well-compensated teachers, and an overall quality education. Progressive funding mechanisms employed at the federal, state and local levels, including weighted student funding, can further help alleviate funding inequities. Learn more about the research behind this indicator by clicking here.
The COVID-19 pandemic and subsequent transition to remote learning have laid bare and exacerbated the braided inequities in education and digital access. Students from less affluent backgrounds or who attend underfunded schools have experienced significant truancy. Black and Latinx youth are at greatest risk of falling behind academically due to poor remote instruction resulting from the pandemic and longstanding inequities in internet and computer access. Policymakers must close the digital access gap. In the long run, educators must also center youth-led digital content creation to ensure meaningful use to achieve digital equity.Learn more about the research behind this indicator by clicking here.
a. Per-pupil fundingData source: Office of Elementary & Secondary Education
b. Equitable weighted student funding formula Data sources: Local policy and practice assessments
c. Equity factor (degree of variance between district per-student funding to state average)
Data source: U.S. Dept of Education
a. % of households that have broadband internet subscriptions
Data source: American Community Survey
b. % of community that has access to a desktop or laptop, a smartphone, a tablet or another computer
Data source: American Community Survey
c. Residential fixed broadband deploymentData source: Federal Communications Commission
Click here to read more about these data.
4. Per-pupil funding Measures and data
Measures and data
Measures and data
5. Internet and computer/device access and technical support
6. Accessible and equitable parental and community governanceAccessible and equitable parental and community governance places students, parents and community in four critical roles: (1) co-designers; (2) partners and critical friends in the education process; (3) proactive feedback providers; and (4) gatekeepers and guardians of success. By centering student, parent and community agency and decolonizing white-normed policies and practices, schools can build inclusive school communities that foster reciprocal engagement, collective liberation and productive learning environments for all children and youth.Learn more about the research behind this indicator by clicking here.
a. Parent and family experiences, connection and relationships with school, teachers and other school staff.
Data sources: Local data collection, school climate surveys
Click here to read more about these data.
cradle-to-career systems indicators
Click here to read more about these data.

© 2021. StriveTogether, Inc. All rights reserved.
pg 11
a. School climate dimensionsi. Sense of belonging and connection to school community
Data sources: Youth Risk Behavior Survey; local school climate surveysii. Student perceptions of their school’s inclusion of their history, culture and racial identity
Data sources: Local school climate surveys iii. Bullying, harassment and discrimination
Data sources: Youth Risk Behavior Survey; local school climate surveys
b. Punitive disciplinary action (reduce)i. % of students receiving in-school or out-of-school suspensions ii. % of students experiencing school-related arrests iii. % of students experiencing mechanical vs. physical constraint and seclusion
Data source: Civil Rights Data Collection
Click here to read more about these data.
7. School climate/discipline Measures and dataUnfavorable behavior at school is an expression of underlying trauma experienced in childhood, at home, in the community, historically and racially in everyday interactions. Disciplinary action and zero-tolerance school policies can not only contribute to the complex trauma children and youth of color experience, but also exacerbate educational and social inequities. These disciplinary practices place fault and punishment on students, reduce time spent on learning and can push youth, particularly Black and Brown students, into the criminal justice system. Educators may adopt trauma-informed teaching and restorative justice practices to foster empathy and to build healthier, equitable learning environments. Learn more about the research behind this indicator by clicking here.
a. Total and average award amount of need-based aid (in comparison to merit-based and direct state appropriations)
Data sources: National Association of State Student Grant and Aid Programs; New America
b. Average amount of grant and scholarship aid and average net price for first-time, full-time degree/certificate-seeking students awarded Title IV aid
Data source: IPEDS
c. State public financial aid and/or education appropriations per full-time equivalentData source: State Higher Education Finance
Click here to read more about these data.
A multitude of college financing barriers limit access to postsecondary education for students whose backgrounds and identities are underrepresented in higher education. The higher education sector bears responsibility to reduce college financing barriers, including simplifying the financial aid application/reapplication process, correcting harmful attitudes about meritocracy that lead to stigma for financial aid applicants and recipients, and clarifying misconceptions about college affordability and costs. Rather than embracing “teach to fish” approaches that place the burden of effort on already overwhelmed students, higher education must consider an ecological approach to create a setting and system where the diverse cultural and social capital of underrepresented students is centered in the financial aid web. Expanding in-state tuition for undocumented students and Pell Grant eligibility for imprisoned individuals, improving cost transparency and increasing need-based financial aid can reduce financial barriers and improve college enrollment for underrepresented students. Learn more about the research behind this indicator by clicking here.
8. Financial barriers to postsecondary enrollment Measures and data
cradle-to-career systems indicators

© 2021. StriveTogether, Inc. All rights reserved.
pg 12
a. Same race mentor-mentee ratioData sources: Local organizations’ administrative and/or enrollment program data
b. Adoption of culturally responsive, youth development and student-centered approaches to mentoring
Data sources: Local organizations’ administrative and/or enrollment program data
Click here to read more about these data.
Young people who are underrepresented in postsecondary education experience both structural and intangible barriers to college and career exploration and professional growth as early as their high school and college years. Academic environments singularly centered around white and middle-class social-normative culture create a “pushout problem,” where underrepresented students prematurely leave their education or respective fields. Centering Critical Race Theory and youth empowerment can help educators to disrupt and eliminate “white savior” approaches in internship and mentorship programs, while “empowering youth to become critically conscious agents of social change” (Albright et al., 2017). Learn more about the research behind this indicator by clicking here.
9. Internship and mentorship opportunities/partnerships Measures and data
Additional resources for cradle-to-career systems indicators:
1. System upstream contributing indicators2. General data sources and information
a. Cost of living to median income ratio by key subgroupsData sources: MIT, Economic Policy Institute, U.S. Census
b. Paid parental, family, medical leave, vacation time, sick time, hazard pay and COVID-19 flexibility
i. Employer expenditures on health care, paid leave and other benefitsData source: Bureau of Labor Statistics
c. Medical insurancei. Employer expenditures on health care, paid leave and other benefits
Data source: Bureau of Labor Statistics
Click here to read more about these data.
Employers play an important role in the well-being of children, youth and families, particularly those from working class and underrepresented backgrounds. By adopting “family-centered” practices, employers can support parents and caretakers (1) to earn a living wage that supports their holistic health and well-being; (2) to balance work and home life through fair and flexible workplace policies; and (3) to take paid time off for illness, parental/family leave and vacation. Employer provision of on-site child care, transportation assistance, tuition reimbursement and job coaching further removes logistical and financial barriers working class parents/caretakers and parents/caretakers of color experience in the workforce. Learn more about the research behind this indicator by clicking here.
10. Local employer adoption of “family-centered” practices Measures and data
cradle-to-career systems indicators

© 2021. StriveTogether, Inc. All rights reserved.
pg 13
I N D I C A T O R C H A R T
adjacent sector systems indicators
from A guide to racial and ethnic equity systems indicators

© 2021. StriveTogether, Inc. All rights reserved.
pg 14
1 2 3 4
5
I N D I C A T O R C H A R T
Adjacent sector racial and ethnic equity systems indicators are those related to sectors beyond education that youth interact with on a daily basis. In this section, you’ll find recommendations for systems indicators in seven different sectors that are crucial for youth and families of color and those experiencing poverty to achieve equitable outcomes.
adjacent sector systems indicators
Housing: Affordability, instability,
homelessness & environmental racism
Food security
Financial well-being
Health: Health care access and utilization,
neonatal/maternal health and mental health
Inclusive communities & neighborhoods
Transportation equity
Legal system
quick link
quick link quick link
quick linkquick linkquick link
quick link

© 2021. StriveTogether, Inc. All rights reserved.
pg 15
a. Financial securityi. Household income at 20th, 50th and 80th percentiles
Data source: American Community Surveyii. Share of households with debt in collections
Data source: Urban Institue (U.S. Credit Bureau)
b. Income and social mobilityi. Household income and incarceration for children from low-income households
Data source: Opportunity Insights (Census)ii. Income segregation and intergenerational mobility across colleges
Data source: Opportunity Insights (Census)
Click here to read more about these data.
The staggering and growing income and wealth inequality in the United States can be traced to violent events and discriminatory practices in the country’s history that continue to actively and systematically suppress wealth creation for communities of color, particularly for Black and Indigenous people. The discriminatory housing and lending practices of redlining and its role in funding public education have negatively impacted education attainment and economic mobility for racial and ethnic minority groups. According to the Urban Institute, “one of the strongest predictors of economic success in adulthood is the number of years lived in poverty as a child.” Financial well-being “affords adults a modicum of control and autonomy over their lives” and “allows parents to invest [more resources] in the well-being of their children,” including for extracurricular activities and saving for postsecondary education.Learn more about the research behind this indicator by clicking here.
1. Financial well-being
a. Students experiencing instabilityi. Student school mobility
Data sources: Local SEA, LEA or school records or analysisii. Number of students who experience homelessness during the school year
Data source: National Center for Homeless Education
b. Affordable housing and eviction ratesi. Location affordability index
Data source: U.S. Department of Housing & Urban Developmentii. Percent of household income spent on rent
Data source: Eviction Labiii. Eviction rate
Data source: Eviction Lab
c. Environmental racismi. Air quality index
Data source(s): U.S. Environmental Protection Agencyii. Environmental health hazards
Data source(s): U.S. Department of Housing & Urban Development
Click here to read more about these data.
With growing income and wealth inequality, Americans across the country are also increasingly experiencing a housing affordability crisis. According to the Urban Institute, “the availability of affordable housing for households with low or moderate incomes is an important precondition for families to achieve housing stability and to be able to move out of poverty.” Secure and affordable housing offers a foundation for family stability. Experiencing housing instability or homelessness during childhood or adolescence can influence education attainment and economic mobility in the long term. Housing affordability policy is a complex issue that must address historical and structural barriers, such as the discriminatory housing and lending practices of redlining and gentrification that push out long-term residents with lower incomes, as well as economic development and environmental racism.Learn more about the research behind this indicator by clicking here.
2. Housing: Affordability, instability, homelessness & environmental racism
Measures and data
Measures and data
adjacent sector systems indicators

© 2021. StriveTogether, Inc. All rights reserved.
pg 16
a. Overall healthi. Percent of adults who rate their general health as excellent
Data source: Behavioral Risk Factor Surveillance System
b. Access to and utilization of health servicesi. Health professional shortage area ranking for primary care providers
Data source: U.S. Department of Health and Human Services
c. Neonatal/maternal healthi. Share of low-weight births
Data source: National Center for Health Statisticsii. Maternal/pregnancy-related death incidence
Data source: National Center for Health Statistics
d. Mental healthi. Proportion of youth experiencing poor mental health
Data Source: Youth Risk Behavior Surveillance Systemii. Proportion of schools with behavioral/mental health services and on-site staff
Data source: CDC and Prevention School Health Profiles
Click here to read more about these data.
According to the Urban Institute, “Healthy individuals form the foundation of strong and healthy families. Individual chronic or other serious health concerns can constrain not only that person’s time, energy, and resources, but also those of the household as a whole. Good and stable health helps people surmount life’s challenges, excel in school and on the job, and fully participate in their communities. Conversely, poor health and debilitating health conditions rob individuals of a sense of control over their lives and potentially the sense of dignity that comes from being able to fully participate in society (Wilson and Cleary, 1995).” Learn more about the research behind this indicator by clicking here.
3. Health: Health care access and utilization, neonatal/maternal health and mental health
Measures and data
a. Proportion of households experiencing food insecurity Data sources: Census, Child Protective Services
b. Proportion of eligible students participating in the School Breakfast Program
Data source: U.S. Department of Agriculture
Click here to read more about these data.
Children and youth from households experiencing food insecurity are at greater risk of experiencing developmental delays and poor physical and mental health, as well as school absenteeism. While expanding access to and appeal of food safety net programs outside of school and to older youths may help alleviate hunger, food insecurity is set upon layers of structural inequity, disproportionately affecting communities of color and less affluent households. Learn more about the research behind this indicator by clicking here.
4. Food security Measures and data
adjacent sector systems indicators

© 2021. StriveTogether, Inc. All rights reserved.
pg 17
a. Share of the voting-eligible population who are registered to vote and share who turn out to vote
Data source: Census
b. Ratio of the share of local elected officials of a racial or ethnic group to the share of residents of the same racial or ethnic group
Data sources: American Community Survey; local elections data
c. Neighborhood exposure index, or share of a person’s neighbors who are people of other races and ethnicities
Data source: American Community Survey
d. Proportion of community residents who are immigrantsData source: National Equity Atlas
Click here to read more about these data.
According to the Urban Institute, “The place people live is also the place where their children experience critical stages of socioemotional and physical development, where social ties form, and where people access resources and life opportunities. Feelings of belonging in one’s community and social circles, being able to feel safe and trust one’s neighbors, and having equitable access to local resources are all key aspects of a safe and inclusive community. Limited levels of both economic inclusion and racial diversity curtail families’ choices about where to live, block access to neighborhoods with better opportunities, and create areas of concentrated poverty and distress. Segregation also perpetuates exclusion and prevents people of different classes, races, and ethnicities from building the social ties that foster mutual respect, dignity, and belonging. ... A local government that is attentive to the needs of all of its citizens and a citizenry deeply engaged in community-wide decision making are hallmarks of a community that supports its residents’ upward mobility. ... Having local elected officials whose demographic characteristics (i.e., gender, race, ethnicity, and/or sexual orientation) broadly reflect those of their constituents (descriptive representation among local officials) correlates with greater feelings of political influence and engagement among otherwise underrepresented demographic groups.” Learn more about the research behind this indicator by clicking here.
5. Inclusive communities & neighborhoods Measures and data
adjacent sector systems indicators

© 2021. StriveTogether, Inc. All rights reserved.
pg 18
a. Overall connectivity, access and affordabilityi. Affordable housing within walking distance from public transportationii. Transit connectivity index
Data source: Center for Neighborhood Technology
b. Economic opportunityi. Percent of workers who commute by walking and by bikingii. Trips made to work by mass transitiii. Average travel time to work
Data sources: Center for Neighborhood Technology; American Community Survey
c. Educational opportunityi. Average travel time to schoolii. Availability of public transportation subsidies for students
Data sources: Local SEA, LEA or school records or analysis
Click here to read more about these data.
According to the Center for Social Inclusion, “Accessible, affordable transportation is critical to the lives we live. Residents of communities of color and poor White communities, whether rural or urban, must travel to obtain better jobs, secure educational opportunities and get quality health care. Too often competing interests result in transportation policies that unintentionally leave low-income Americans stranded. To achieve equity in transportation policy, we need to craft and catalyze strategies that help rural and urban communities of color get the investments needed to spur mobility in every sense of the word.” Learn more about the research behind this indicator by clicking here.
6. Transportation equity Measures and data
adjacent sector systems indicators
a. Exposure to crimei. Rates of reported violent crime and property crime
Data source: Federal Bureau of Investigationii. Proportion of children with a parent or guardian who has served time in jail
Data source: Health Resources and Services Administration
b. Rate of juvenile justice arrestsData source: Federal Bureau of Investigation
Click here to read more about these data.
According to the Urban Institute, “Exposure to trauma, crime, and overly punitive policing are all strong predictors of mobility. Experiencing trauma can have significant negative consequences that persist long after the trauma has ended.”Learn more about the research behind this indicator by clicking here.
7. Legal system Measures and data

© 2021. StriveTogether, Inc. All rights reserved.
Examples of work tied to systems indicators exist throughout the Cradle to Career Network. In this section, you’ll find five stories about network members that engaged in systems level work to achieve equitable outcomes for youth, families and communities of color and those experiencing poverty.
This work includes: Using the lens of lived experience to identify better metrics Explicitly naming racial and ethnic equity as a priority in outcomes work Creating cross-sector data partnerships that lead to targeted approaches Understanding the context behind systems-level data Identifying community-centered solutions to address disparities
storiesfrom the network

addressing disparities on the systems level
from A guide to racial and ethnic equity systems indicators
Bright Futures | Monterey County, Calif.
S T O R I E S F R O M T H E N E T W O R K

© 2021. StriveTogether, Inc. All rights reserved.
pg 21
addressing disparities on the systems levelS T O R I E S F R O M T H E N E T W O R K
Story sections
Shift toward addressing systemic racism | link
The strategies | link
Challenges | link
Conclusion | link
These indicators are featured or discussed in this story:
Per-pupil funding
Race/ethnicity of teachers and administrators relative to student body
Teacher qualifications
Bright Futures Education Partnership adopted new systems indicators to allow for greater “breadth and depth” to their work as they focus on addressing systemic racial and ethnic inequities.
Internet and computer/device access and technical support
School climate/discipline

© 2021. StriveTogether, Inc. All rights reserved.
pg 22addressing disparities on the systems level — Bright Futures
shift toward addressing systemic racism
In Monterey County, California — a county that spans 24 school districts in the state with the largest Latinx population in the country — Bright Futures Education Partnership models a strong data approach to racial equity work. They’ve recently adopted seven systems-level indicators, on top of 21 indicators they were already tracking across the cradle-to-career spectrum.
The seven indicators — school funding, same-race teacher, bilingual teacher, teacher credentials, teacher experience, school discipline and the digital gap — focus specifically on identifying systemic racism. The adoption of new indicators, while rooted in Bright Futures’ established commitment to data and equity, signals a shift to a more “explicit focus on systemic racial and ethnic equity,” according to Data and Research Partnership Manager Michael Applegate.
“We had some degree of a systems orientation previously, but our projects were focused on one outcome area, rather than systems impacting all or most of the cradle-to-career spectrum,” Applegate said of earlier methods that emphasized smaller-scale systems. The new approach, on the other hand, seeks to avoid blaming individual students as the source of achievement differences and looks instead at how systems themselves perpetuate disparities.
“Working toward justice is an important goal all by itself, and we won’t achieve our
countywide education outcome goals without addressing systemic gaps in opportunity,” he added, describing Monterey County’s demographics as 87% students of color — the second highest percentage in the state. The county is also tied with having the highest percentage of students learning English in California.
Applegate credited his participation in StriveTogether’s Racial and Ethnic Equity Planning and Action teams as an experience that helped him develop strategies for supporting the partnership’s shift toward systemic racial equity. As Bright Futures delved deeper into the work, Applegate used data to help build the case for why racial and ethnic equity — compared to other forms of equity like gender or economic equity — was so important.
In the summer of 2019, Bright Futures’ partnership also completed a racial equity questionnaire. Results from the questionnaire, disaggregated by race and role, pushed this work forward. One major outcome was the formation of the organization’s racial equity task force, which was created to reflect on the questionnaire, propose recommendations to the overall partnership and ultimately oversee the implementation of those recommendations. The questionnaire was an invaluable tool that “supported deeper conversations and actions toward racial equity,” Applegate said.

© 2021. StriveTogether, Inc. All rights reserved.
pg 23
The process to build out Bright Futures’ systemic racial equity approach was still very much in progress at the time of our interview in December 2020. The work of the previous year and a half included task force planning, establishing group agreements, training sessions on diversity, inclusion and systemic racism, and selecting systemic racism indicators. At the end of 2020, the task force was underway with the calculation of recently adopted indicators. Work supporting racial and ethnic equity through the local teacher pathway had also begun.
Applegate named communication as an important aspect of adopting the indicators. Communication, for him, means making national data on educational disparities meaningful in the partnership’s community. For example, Bright Futures has worked to translate a national number — the $23 billion annual funding gap between majority white school districts and districts that are majority people of color — into a number that is now part of their “local story”: the more than $100 million annual funding gap in Monterey County specifically.
“Our first priority is working toward more easily understood systemic metrics we can communicate. Once the community can clearly see the local need — like with the funding gap — we’re better able to convene people and get deeper into the nuances of the data.”
– Michael Applegate
Mobilizing data such as this local funding number was a huge asset toward getting buy-in from partners, but it wasn’t the only means to do so. Bright Futures also supported
the strategies
early champions in the community and their efforts with research: One of the researchers, education research expert Linda Darling-Hammond, happens to be the president of the California State Board of Education. In various writings, she described some of “the biggest systemic issues” as same-race teacher, teacher qualification disparities, school funding and discipline disparities. Locally, an early champion of the work was the then-dean at the College of Education at California State University (CSU) Monterey Bay — Bright Futures’s anchor association — who agreed to be held accountable for some of the systemic indicators. It helped, Applegate said, that some of the early adopters didn’t need to be convinced and were “already doing systemic equity work.”
Applegate also invests time in sharing the work, making presentations to partner organizations, adjacent sector organizations and foundations on the importance of systemic racism indicators. In these presentations, drawing “a strong connection from history to the local present situation” has been key. He gave an example of discussing the connections between redlining, home ownership and inheritance, and current local school funding disparities in Monterey County.
He also emphasized the impact of the current historical moment on their work. “Of course, communities of color have been experiencing violence and advocating for change for a long time,” he said. “But the recent national attention to this violence and the protests around Black Lives Matter definitely generated more momentum in our community.”
addressing disparities on the systems level — Bright Futures

© 2021. StriveTogether, Inc. All rights reserved.
pg 24
Staff size One of the challenges Bright Futures is facing is the size of their backbone staff. Currently, their size makes it challenging to effectively do systems improvement work in each of their outcome areas, while also working to change systems that span the cradle-to-career spectrum like school funding or teacher credentials.
“We’re split between those two ways of working on both smaller and larger systems,” Applegate said, viewing both as critical parts of the work to challenge systemic inequities.
Multiple data sets and complex calculations Applegate shared the technical aspects of collecting data, much of which is publicly available in California “if you know how to get it.” In California, each teacher is assigned a unique identifier for the year — an entry that includes their race, gender, education, experience and credentials — which Bright Futures uses to match to the demographics of their classroom. This process doesn’t require data-sharing agreements. Instead, “it requires linking multiple big data sets together and understanding the data points they have in common.”
Because Applegate is an employee of CSU Monterey Bay — the partner organization responsible for a large portion of the local teacher pathway — he’s also able to access some of the teacher pathway-related data there. The college has agreed to look at the percentage of students of color in their program and their persistence in the program as well as testing and credentials data, all of which will be disaggregated by race as well as the ability to speak multiple languages, where possible. The college also plans to support research efforts on the relationship between classroom management techniques — some of which they teach — and discipline disparities.
Currently, Bright Futures is moving into the next level of calculations. They’ve hired an analyst with a background in accounting to help them understand the data — both school
challenges
funding numbers and classroom-level teacher qualifications data. “We’ll be able to see by the racial makeup of the classroom if students of color are less likely to have a fully credentialed teacher or a teacher with less teaching experience,” Applegate said.
“That’s thousands of lines of data and a fairly complex calculation. That’s part of what adopting an indicator means: that we’re moving into really trying to understand that particular piece of the system — and racial and ethnic disparities — more deeply.”
– Michael Applegate
They’ve already started working on this, Applegate said, supporting the College of Education to increase the percentage of teachers of color who are fully credentialed.
Working with partners At the time of our interview, Bright Futures was putting together a project involving a group of CSU Monterey Bay professors willing to participate in local action research projects. The partnership plans to “test several solutions, many that we will ultimately implement,” Applegate said. Professors will conduct research and co-design solutions with students and teachers, testing whether or not the solutions work.
Partners in the Bright Futures partnership — including community colleges Hartnell and Monterey Peninsula College in addition to CSU Monterey Bay — support a 2+2 program, which allows students to complete their first two years at one of the community colleges and their last two years at CSU Monterey Bay. Prospective teachers can earn their credentials within four years if they choose to teach at the elementary level or take an additional year if they want to teach at a higher level, meaning they don’t have to enroll in a traditional master’s program to earn their teaching credentials.
These college and university partners, according to Applegate, already have concrete examples of “equity built into the program.” Monterey County is bigger than the state
addressing disparities on the systems level — Bright Futures

© 2021. StriveTogether, Inc. All rights reserved.
pg 25
of Delaware; the establishment of remote campuses brought degree programs into rural agricultural communities, helping to eliminate transportation issues, for example. Child care is also readily available at these sites for students who are parents.
conclusion
Although supporting the collective shift of the partnership toward addressing systemic racism took time and planning from many individuals and organizations — especially those involved in the racial equity task force — Applegate acknowledges that Bright Futures is still in many ways just beginning their work, having recently adopted the systemic indicators. However, he noted that they have a strong commitment from their partners. This collective commitment to the work, he said, will move them toward “greater breadth and depth.”
addressing disparities on the systems level — Bright Futures

cross-referencing systems data to inform equity work
from A guide to racial and ethnic equity systems indicators
ImpactTulsa | Tulsa, Okla.
S T O R I E S F R O M T H E N E T W O R K

© 2021. StriveTogether, Inc. All rights reserved.
pg 27
Story sections
Creating statistically informed models | link
The strategies | link
Collecting data | link
Results | link
Conclusion | link
These indicators are featured or discussed in this story:
Race/ethnicity of teachers and administrators relative to student body
Teacher qualifications
Internet and computer/device access and technical support
cross-referencing systems data to inform equity workS T O R I E S F R O M T H E N E T W O R K
Inclusive communities and neighborhoods
Health
Transportation equity
Legal system
Housing
ImpactTulsa is using systems indicators to reveal disparities and develop a systems-focused, racial equity-based data strategy.

© 2021. StriveTogether, Inc. All rights reserved.
pg 28
creating statistically-informed models
In 2018, Tulsa Public Schools approached ImpactTulsa for help with understanding how factors outside of school impact student success. Tulsa Public Schools wanted to look at data specifically — a request that would evolve into ImpactTulsa’s now robust systems-focused, racial equity-based data strategy.
“I knew that neighborhoods and housing are components of child well-being and, unfortunately, systemic inequity, especially for communities of color,” ImpactTulsa Director of Research and Analysis Dr. Delia Kimbrel said, describing the origins of the joint project between Tulsa Public Schools and ImpactTulsa. Kimbrel worked in housing and neighborhood sectors prior to her current role and built research and data processes and systems for these sectors.
Once partnered with Tulsa Public Schools, ImpactTulsa formed a collaborative group of cross-sector partners that became known as the Child Equity Partner Group, who then decided on which systemic indicators to track. These indicators reflect neighborhood socioeconomic status, public health, public safety, access and transportation, all of which, Kimbrel said, “help us see what influences the environmental conditions of communities” and the “differential investments, policies, practices and decision making that has often been made on the basis of race.” From there, the organization uses the data to make connections to student success outcomes.
The Child Equity Partner Group formed in 2018, and in 2019, ImpactTulsa deployed six strategy action teams. In these teams, cross-sector partners work with Child Equity Index data, identify and test strategies and use the index to inform the implementation of both universal and targeted approaches.
Data models and findings from the Child Equity Index sparked discussions within the organization on systemic inequity — conversations that elevated the importance of systems indicators and ultimately jumpstarted their racial equity-based data approach. Today, the Child Equity Index is one of several data projects that reflect the organization’s goal “to develop a strategic data framework for centering racial equity in data collection and reporting processes.” This is a process, Kimbrel said, that “involves ensuring that data and outcomes are keenly disaggregated and captured through an intersectional lens.”
“But disaggregation is just the start. For us, a true racial equity-based data approach also involves prioritizing data collection at the institutional, systemic and structural levels and avoids solely relying on individual-level data for explaining disparities.”
– Dr. Delia Kimbrel
cross-referencing systems data to inform equity — ImpactTulsa

© 2021. StriveTogether, Inc. All rights reserved.
pg 29
the strategies
Formally adopting systems indicators at ImpactTulsa has been a gradual process overall — “we’re chipping away at the list,” Kimbrel said. While the Child Equity Index project was the impetus for tracking adjacent-sector indicators, there wasn’t an equivalent for education indicators, so adoption there has been slower. ImpactTulsa is currently tracking teacher and administrator race/ethnicity, teacher qualifications and internet and computer access.
Collaborative initiatives are one way the organization expands their range of tracked indicators. A few new initiatives centering on youth and community engagement will require new tracking mandates related to parental and community governance, while a couple of forthcoming college and career initiatives will necessitate a more comprehensive tracking of internship opportunities and postsecondary enrollment and completion. ImpactTulsa is also trying to find ways to incorporate school and per-pupil funding into their Child Equity Index data modeling.
Kimbrel noted the organization’s participation in StriveTogether’s Racial and Ethnic Equity Planning and Action teams as a positive influence in helping them develop
a more comprehensive data strategy. While ImpactTulsa is still in progress with institutionalizing their formal strategy, the organization is currently tracking many of the indicators put forth by StriveTogether’s Racial and Ethnic Equity Action team.
“I would also say that our adoption and prioritization of collecting systems indicators data developed out of need and necessity,” Kimbrel said, referring to the organization’s work on addressing the digital divide in their community.
Using the Child Equity Index data, the Tulsa Planning Office developed Child Equity Index and geographic information system maps, which revealed geographic disparities in internet access — concentrations of residents without connectivity. This information was used twofold: presented to school district partners to inform remote learning strategies in response to COVID-19 and used to inform the launch of the City of Tulsa’s Internet Access Taskforce, where ImpactTulsa serves as a convening and research partner.
cross-referencing systems data to inform equity — ImpactTulsa

© 2021. StriveTogether, Inc. All rights reserved.
pg 30
results
The blossoming of the organization’s research strategy has resulted in statistically-informed data analytic models used to narrow disparities and address systemic inequities. These models help the organization better understand opportunity gaps that exist in their community. The following are a few examples:
An attendance analysis and predictive model for understanding the demographic, academic, geographic and socioeconomic status factors of attendance and chronic absenteeism;
Partner effectiveness analytic models for understanding the effects of partner programs and interventions on student success outcomes and the progress of interventions on different demographic groups;
The Child Equity Index Neighborhood Model that measures the relationship between student and neighborhood factors on academic outcomes, using more than 40 indicators; and
Racial Equity Data Frameworks for centering racial and ethnic equity in data collection and reporting processes, ensuring that data and outcomes are disaggregated by race and systems-level data collection is prioritized over individual-level data.
In discussing the details of these projects, Kimbrel brings it back to the importance of a systems perspective:
“When we see racial disparities across individual- or people-level outcomes, we must ask, ‘What might that suggest about the system?’ So our approach should truly center racial equity if we truly aim to transform systems.”
– Dr. Delia Kimbrel
collecting data
In terms of the technical aspects of data collection and data agreements, the organization relies heavily on publicly available data from the census. Census data and the American Community Survey were “huge” sources for the Child Equity Index and ImpactTulsa’s work on the digital divide, Kimbrel said. The state website also provided publicly available data on teacher and district diversity in the county.
She also acknowledged the importance of relationship building with adjacent and cross-sector partners, as well as with school district partners. “We have a great relationship with the City of Tulsa, Tulsa Planning Office and Tulsa County Health Department. A lot of this data, especially for the adjacent sectors, is publicly available; you just have to work with the right departments in requesting it.”
With school district partners, comprehensive data-sharing agreements and memorandums
of understanding are essential. Kimbrel said that some school districts may not collect or have data readily available, “so it definitely takes working with them and sometimes even supporting them with getting this data.”
ImpactTulsa also has a memorandum of understanding with the Oklahoma State Board of Education.
What’s helpful is that many of the school districts participate in ImpactTulsa’s collaborative and strategic convenings as well, which makes data access and requests easier: everyone’s on the same page, actively working toward a common goal.
“It helps that the districts see us as helping extend capacity and provide data analysis support that would otherwise be limited.”
– Dr. Delia Kimbrel
cross-referencing systems data to inform equity — ImpactTulsa

© 2021. StriveTogether, Inc. All rights reserved.
pg 31
conclusion
While ImpactTulsa has developed the resources and know-how for finding and accessing data — or creating the necessary partnerships and memorandums of understanding — a few key areas stand out as places that need growth. College, career and postsecondary data access, Kimbrel said, is one of them. Another growth area is getting on a regular schedule for collecting data. “COVID-19 has definitely altered our schedule,” Kimbrel said of how the pandemic shifted priorities.
She said that because the work on many of the indicators is just developing, they need a system for regularly examining the outcomes
from the data, creating collaborative strategies to address them and linking the information back to their overall racial equity strategy.
ImpactTulsa is also looking to the national organization for support in this work: trainings on how to capture this data with school districts, how to have data conversations with partners and how to develop strategic initiatives as a result of the collected data and new information, for example.
“The end goal cannot be just collecting this data. It has to be, ‘And what we will do about it?’”
– Dr. Delia Kimbrel
cross-referencing systems data to inform equity — ImpactTulsa

© 2021. StriveTogether, Inc. All rights reserved.
pg 32
mapping data around community solutions
from A guide to racial and ethnic equity systems indicators
UP Partnership | Bexar County, Texas
S T O R I E S F R O M T H E N E T W O R K

© 2021. StriveTogether, Inc. All rights reserved.
pg 33
These indicators are featured or discussed in this story:
Per-pupil funding
Food security
Health
mapping data around community solutionsS T O R I E S F R O M T H E N E T W O R K
Story sections
Fiscal mapping | link
The strategies | link
Challenges | link
Community representation and ballot initiative | link
Continuing the work| link
Conclusion | link
UP Partnership is using systems indicators to create community-centered recommendations that address equity gaps for area youth.
Housing and homelessnessLegal system

© 2021. StriveTogether, Inc. All rights reserved.
pg 34
If you’re a parent, practitioner or researcher and live in Bexar County, Texas, you can explore the amount and types of funding identified for young people in your community through UP Partnership’s recently developed fiscal map.
Available online, the fiscal map is an effort to study San Antonio’s priorities for young people and offers a data-driven way to engage with the community. The research — which looks specifically at funding sources for youth programs and services, rather than for public education — breaks down data not only by funding level, but also into six categories based on the type of youth outcome they are meant to achieve, such as “safe and stable,” “healthy” and “academically prepared.”
Short for “unlocking potential,” UP Partnership decided to create a fiscal map alongside another research project in which team members mapped youth programs and services in the community. The service map consolidates information from more than 80 nonprofit agencies and 500 programs and is also available online as a data resource.
fiscal mapping
mapping data around community solutions — UP Partnership
Senior Director of Investment and Sustainability Kimberly Sama said gaps in services and resources led to a focus on funding streams. “Knowing that it’s not enough,” she said, referring to the availability of resources, “how do we think about the fiscal flow of dollars into San Antonio for youth outcomes, and are they really being used effectively and toward their end goal?”
The fiscal map is only a stepping stone for UP Partnership, whose goal is “ensuring every young person is ready for their future.”
UP Partnership is in progress with the work of their Strategic Funding Alignment Task Force. Using the fiscal map as a resource, task force members develop practical, community-centered recommendations to address gaps and barriers for San Antonio youth. While UP Partnership “ultimately [wants] to grow dollars for students,” according to Executive Director Ryan Lugalia-Hollon, a short-term goal is to send recommendations to relevant groups and organizations who will, in turn, implement solutions.

© 2021. StriveTogether, Inc. All rights reserved.
pg 35
the strategies
The task force convened for its first meeting in August 2020. Funders and practitioners, as well as community and youth representatives, gathered on Zoom, creating an intergenerational space. The move to include young people in the task force is intentional and reflective of the organization’s overall commitment to youth, whom Sama called their “end audience.” Two young people are on each of the alignment task force’s three smaller working groups and bring their perspectives to the larger conversation.
As young as 13 and often high school age, they apply and are selected for project-based teams through Our Tomorrow, one of UP Partnership’s four collaborative action networks, which cultivates youth ownership in community solutions and creates opportunities for youth-led initiatives. In projects such as this one, young people receive training in policy advocacy and development. Sama said that the organization regularly references the ladder of youth engagement as a model for how to authentically engage with and avoid tokenizing youth. Making sure that they receive stipends is one way. Sharing data with them is another.
Using a youth-oriented lens like this helps UP Partnership not only engage the people they seek to support, but also work with youth-serving organizations more effectively. Prior to the task force, strategic funding alignment began in 2019, when UP Partnership started a relationship with the Children’s Funding Project. A five-month design process ensued before the team began combing through state and federal funding sources to identify budgets. Team members connected with state and federal employees to better understand specific data.
UP Partnership also reached out to local funders they had relationships with, five of which “actually sent us their budgets and the coding directly,” said Sama. The coding, which refers to the way the data was categorized,
mapping data around community solutions — UP Partnership
allowed funders to be part of the process themselves.
Relationships are crucial to this project and to UP Partnership’s ethos in general. Sama described coffee meetings, lunches and trainings — including a 15-month-long academy that emphasized experiential learning — as important spaces for building connection and trust.
“If I don’t feel trust, I can’t share my data,” she said, describing a common perspective. During our interview, Sama’s Zoom background read “Relationships are the work,” the tagline of Excel Beyond the Bell, one of UP Partnership’s collaborative action networks. This background serves as a conversation starter with partners on the importance of relationships in collective impact work.
Strategies of relationship building and engaging youth are rooted in a strong organizational culture. Lugalia-Hollon, who has a restorative justice background, described UP Partnership’s culture as the meeting point between “rigid accountability” and “deep commitment to relationship,” which is a “constant, very live and appropriate tension for us.”
Sama said that Lugalia-Hollon’s leadership approach models how the team should center community members in their work. She also emphasized the importance of creating a culture of learning:
“A lot of times what’ll happen is: if your data is not proving effectiveness, then you’re at risk, but then you lose all the learning. Cutting funding to someone, you lose all the questions you would really want to dive into around how you could really turn the needle.”
– Kimberly Sama
Sama circled back to relationship building, which she called “interpersonal, but also organizational and intraorganizational.”

© 2021. StriveTogether, Inc. All rights reserved.
pg 36mapping data around community solutions — UP Partnership
For UP Partnership, the project of strategic alignment funding is a four-meeting process. Each meeting corresponds to one of four phases — identify, quantify, recommend and prioritize, a framework from the Children’s Funding Project. Because these meetings occurred after the onset of the COVID-19 pandemic, virtual relationship building has been a challenge.
Sama discussed how the three-hour-long Zoom meetings, despite their productivity and homework between sessions, lacked opportunities for informal conversations before and after meetings — moments where members commune with each other, and where ideas may develop more organically.
Another challenge is the fact that funders don’t geocode their race and ethnicity data, making resource-mapping difficult. “Racial equity is a geographical problem,” Lugalia-Hollon said.
He described the milestones that led up to this moment: In 2017, the board made a formal commitment to equity for the first time. In January 2020, UP Partnership’s multi-year strategic plan centered racial equity for the first time.
“Now the next chapter of the work is making that mean something and holding institutions’ feet to the fire.”
– Ryan Lugalia-Hollon
challenges

© 2021. StriveTogether, Inc. All rights reserved.
pg 37
UP Partnership has noticed a change in the tenor of conversations around youth and funding. It’s easier to talk about challenges in the community. Practitioners are more willing to do homework. Participating stakeholders have signed on to an Equitable Recovery Pledge; more and different voices are at the table. A recently released landscape report details the progress of their work.
Funders, who are more willing to share data, are looking forward to seeing the data that comes from this project. In working with funders, UP Partnership has gained more credibility within the funding community.
On an immediately practical level, the timing of UP Partnership’s research helped support the ballot initiative Pre-K 4 SA in the 2020 November election. Voters renewed a tax that
community representation and ballot initative
will continue to provide $38 million in pre-k funding. UP Partnership’s research was one of multiple evaluations showing, according to the Children’s Funding Project, “that students who attend a Pre-K 4 SA Program, particularly students who are economically disadvantaged or with limited English proficiency, end the year ahead of their peers in math and language.”
Lugalia-Hollon also called the Alignment Task Force itself an “example of a new engagement strategy that’s really successful.” He’s celebrating success but is always ready to reflect and move forward. “It’s back to that sequencing question,” he explained. “Knowing what the next move is and what people’s roles are.”
mapping data around community solutions — UP Partnership
At the time of our interview, the Alignment Task Force had yet to convene for its last meeting, when they would finalize the list of recommendations for improving funding alignment and appoint “messengers” to carry the recommendations out to those who would implement.
Data gathered before the pandemic provides context for what happened after the start of COVID-19. The project has since been refined with the impacts of the pandemic in mind.
continuing the work
“What we know is that the inequities that COVID-19 raised were already the inequities that were there. These are not new inequities. There’s a light that’s shining on them differently.”
- Kimberly Sama
Staff at UP Partnership continue to ask themselves questions raised by the pandemic and explore different ways to engage with partners and the community. Lugalia-Hollon described how engagement, as it’s practiced now, is “either symbolic, or you’re all in on this strategy.” “What are the other options or lanes we could create for that?” he asked.
As UP Partnership moves toward their goal of generating more public revenue dedicated to children and youth nationwide — and to promote this goal nationally — Lugalia-Hollon remembers why people come to the table in the first place: “Everybody has a natural
conclusionsystems thinker inside of them they don’t often get to exercise.”
He added, “We give them a space to do that. I think that’s as true, if not truer, than ever now.”

network stories
understanding the causes behindsystems-level data
from A guide to racial and ethnic equity systems indicators
Promise Partnership | Salt Lake region, Utah
S T O R I E S F R O M T H E N E T W O R K

© 2021. StriveTogether, Inc. All rights reserved.
pg 39
understanding the causes behindsystems-level dataS T O R I E S F R O M T H E N E T W O R K
Story sections
Using liberatory design | link
Liberatory Design and fellowship | link
The strategies | link
Other examples | link
Challenging the status quo | link
Importance of community voice | link
Collaborative action networks | link
Conclusion | link
Promise Partnership at the United Way of Salt Lake is using a liberatory design approach to add context to the stories behind systems-level data.
These indicators are featured or discussed in this story:
Financial barriers to postsecondary enrollment
Inclusive communities & neighborhoods

© 2021. StriveTogether, Inc. All rights reserved.
pg 40
“I don’t think we were trying to measure the system itself, but we started to ask questions about what conditions in a school make it successful,” said Terpstra, referring to aspects like school culture, leadership and teacher efficacy.
A few reflective questions led them to the Liberatory Design model, now used in many of Promise Partnership’s initiatives, including within the partnership itself. This approach not only prioritizes the community and the experiences of those most impacted but also complements the partnership’s focus on systems indicators — which helps accelerate progress toward equitable results.
using liberatory design
For Promise Partnership at United Way of Salt Lake, the work of the past 10 years has resulted in a robust structure to capture outcomes data. Successes to celebrate include strong data agreements with partners and detailed data collection.
But in the last few years, Promise Partnership realized that although the gathered data “tells us a lot,” according to Amy Terpstra, vice president of collective partnerships, what was missing was context. Promise Partnership made it their new goal to learn the stories behind the data.
understanding the causes behind systems-level data — Promise Partnership
© 2021. StriveTogether, Inc. All rights reserved.
pg 41
liberatory design and fellowship
the strategies
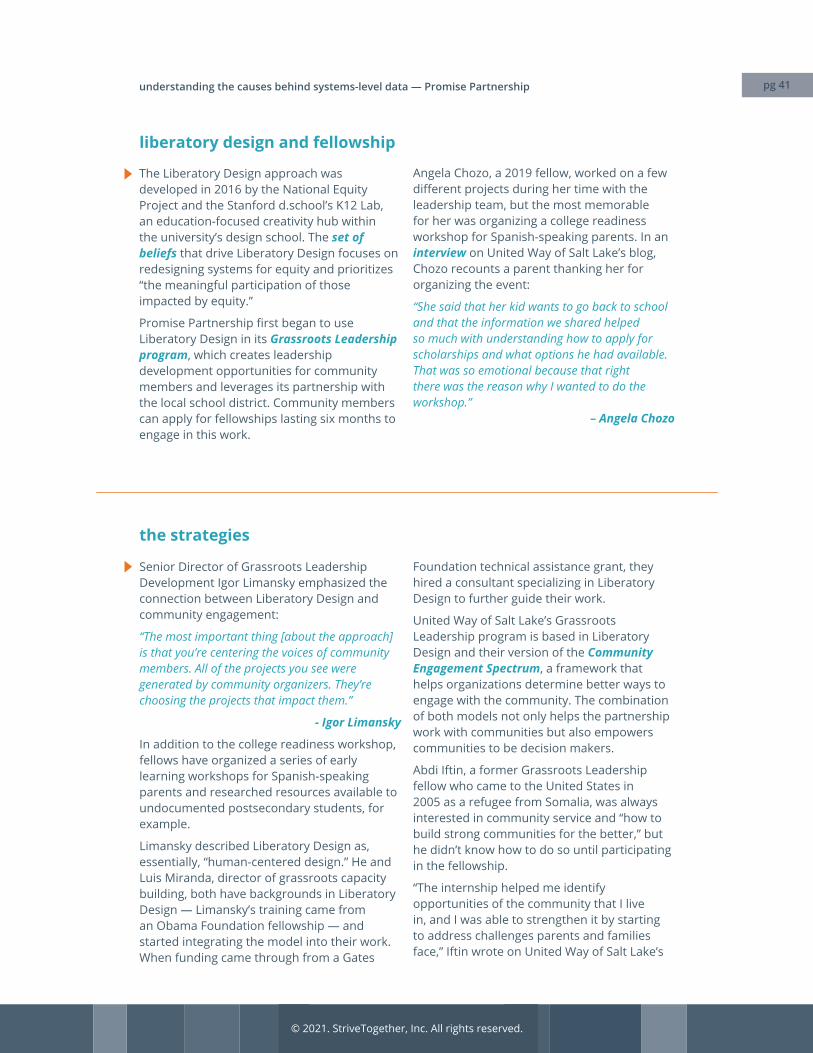
The Liberatory Design approach was developed in 2016 by the National Equity Project and the Stanford d.school’s K12 Lab, an education-focused creativity hub within the university’s design school. The set of beliefs that drive Liberatory Design focuses on redesigning systems for equity and prioritizes “the meaningful participation of those impacted by equity.”
Promise Partnership first began to use Liberatory Design in its Grassroots Leadership program, which creates leadership development opportunities for community members and leverages its partnership with the local school district. Community members can apply for fellowships lasting six months to engage in this work.
Angela Chozo, a 2019 fellow, worked on a few different projects during her time with the leadership team, but the most memorable for her was organizing a college readiness workshop for Spanish-speaking parents. In an interview on United Way of Salt Lake’s blog, Chozo recounts a parent thanking her for organizing the event:
“She said that her kid wants to go back to school and that the information we shared helped so much with understanding how to apply for scholarships and what options he had available. That was so emotional because that right there was the reason why I wanted to do the workshop.”
– Angela Chozo
Senior Director of Grassroots Leadership Development Igor Limansky emphasized the connection between Liberatory Design and community engagement:
“The most important thing [about the approach] is that you’re centering the voices of community members. All of the projects you see were generated by community organizers. They’re choosing the projects that impact them.”
- Igor Limansky
In addition to the college readiness workshop, fellows have organized a series of early learning workshops for Spanish-speaking parents and researched resources available to undocumented postsecondary students, for example.
Limansky described Liberatory Design as, essentially, “human-centered design.” He and Luis Miranda, director of grassroots capacity building, both have backgrounds in Liberatory Design — Limansky’s training came from an Obama Foundation fellowship — and started integrating the model into their work. When funding came through from a Gates
Foundation technical assistance grant, they hired a consultant specializing in Liberatory Design to further guide their work.
United Way of Salt Lake’s Grassroots Leadership program is based in Liberatory Design and their version of the Community Engagement Spectrum, a framework that helps organizations determine better ways to engage with the community. The combination of both models not only helps the partnership work with communities but also empowers communities to be decision makers.
Abdi Iftin, a former Grassroots Leadership fellow who came to the United States in 2005 as a refugee from Somalia, was always interested in community service and “how to build strong communities for the better,” but he didn’t know how to do so until participating in the fellowship.
“The internship helped me identify opportunities of the community that I live in, and I was able to strengthen it by starting to address challenges parents and families face,” Iftin wrote on United Way of Salt Lake’s
understanding the causes behind systems-level data — Promise Partnership

© 2021. StriveTogether, Inc. All rights reserved.
pg 42
blog. “We were able to build bridges within the communities the United Way of Salt Lake serves and overcome the language barriers that exist between United Way and the communities around us.”
other examples
Liberatory Design is used specifically in projects that involve community feedback, Limansky said. For example, the model has helped them develop ways to more effectively recruit and work with community members for research projects, such as making sure to properly compensate community members sharing their knowledge and experiences. The model is also implemented in United Way of Salt Lake’s community research participation webpage, which has been designed to clearly communicate with community members and make information on research opportunities accessible.
Another use of Liberatory Design in the Grassroots Leadership program was when United Way of Salt Lake created archetypes — avoiding stereotypes — of community members to evaluate a school’s modes of communication.
The team ran each of the archetypes through the school’s modes of communication and analyzed user experience, keeping in mind the local population of migrants and refugees who don’t speak English.
“We know once we create a user journey, we’ve got to be aware that if a school’s main mode of communication is a letter in English, the moment it goes to a user that doesn’t actually have the ability to read the letter in English, we know that mode of communication hits a wall,” Limansky said.
After using this model within the Grassroots Leadership program, United Way of Salt Lake secured funding to implement it elsewhere, including within the organization itself.
“It’s generally very difficult to see that you need to change your own system,” Terpstra said, acknowledging both the challenge and importance of this work. “Liberatory Design helps surface a view of systems from the perspective of those experiencing the weight [of systems], leading to new insights about how to change them.”
– Amy Terpstra
Limansky added, “Questions about employee raises, affinity groups or anything that’s policy — in that case, the people most impacted are going to be staff. So if the board is going to be making decisions, [the staff] should have a voice and, hopefully, a vote.”
understanding the causes behind systems-level data — Promise Partnership

© 2021. StriveTogether, Inc. All rights reserved.
pg 43understanding the causes behind systems-level data — Promise Partnership
challenging the status quo
Because the work of changing long-standing mental models — both conscious and subconscious — is baked into Liberatory Design itself, using it as a design model is not without its challenges. Some mental models may not value community voices, for example, or consider the experiences of those most impacted. The United Way of Salt Lake tests some measures internally before releasing them to the public.
This work also requires strong relationships that simultaneously challenge the status quo and build trust, both within the organization and within systems of board directors, executives and other partners.
“[You need to] cultivate a relationship that’s great and healthy and then, importantly, push them to create differently.”
- Amy Terpstra
One way United Way of Salt Lake does this is by identifying key leaders that the organization already has good relationships with. This ensures that vulnerability is part of growing the Liberatory Design model in external projects.
Limansky also discussed the importance of having enough people in their own leadership with strong external relationships, who can, in turn, champion racial equity. “There’s been a continual effort to figure out how to have better conversations [with
community leaders],” Limansky said. “Like any organization, we have different personalities and different perspectives, and we have to make sure we respect each other in those conversations.”
With equity at the center of these conversations, the team at United Way of Salt Lake invites partners and collaborators to reflect on their mental models. The team has introduced the Dismantling Racism framework by Tema Okun to staff, board members and community members and acknowledges that this type of learning is an ongoing journey.
Relationship building is also essential within the communities themselves.
“Our intention was always to make sure we’re hiring people who are from the communities we’re working with,” Limansky said, describing how United Way of Salt Lake makes sure to pay organizers — some of whom are refugees — a living wage to continue the organizing work they were already doing. He also described meetings where the organization showed up to listen and provide expertise as needed, as well as food-filled potlucks held for community members before the COVID-19 pandemic.
“A coconut flan can go a long way,” Limansky said, reminiscing about building relationships in pre-pandemic times.

© 2021. StriveTogether, Inc. All rights reserved.
pg 44understanding the causes behind systems-level data — Promise Partnership
importance of community voiceSince the Grassroots Fellowship’s inception and the use of Liberatory Design began, United Way of Salt Lake has taken themselves and their community on a journey of equity and community engagement, growing into the model along the way.
“United Way was able to help me by giving me the tools, the skills,” said Iftin. “It became very comfortable for me and my community because I was the one who grew up there, and they were excited to see [a member of their own community as] the one that’s actually doing the work.”
At the time of Iftin’s 2019 blog post, he was looking forward to graduating from Salt Lake Community College the following month. The first-generation college student hoped to earn a degree in social work or psychology from the University of Utah. Even while moving on, he emphasized the importance of a program
where “people like me have the opportunity to build up communities from within and allow voices to be heard that often are not.”
The need to engage community voices seemed more obviously present at the start of the COVID-19 pandemic in 2020.
The Grassroots Leadership team developed a plan to conduct interviews with minority-owned small businesses, with the goal of assessing the effects of the pandemic on their operations. When the results came in, the team found much more than struggling businesses: feedback from small business owners showed an interconnected web of issues related to children’s school performance, including health and financial issues.
The business report findings highlighted the interconnectedness of the community and disparities that existed long before COVID-19.
collaborative action networks
conclusion
For United Way of Salt Lake, listening to what the community says it needs and ensuring that their lived experiences reach systems leaders continues to be a work in progress. Relatedly, the use of Liberatory Design, like other community engagement models, is an ongoing process — one that requires commitment to continued learning and improvement.
Because United Way of Salt Lake uses Liberatory Design primarily as an organizing
tool, providing qualitative data to collaborative action networks and administrators hasn’t been a focus. But they continue to work to that end.
“The ability to bring those two together is hard. The question for us is: after we gather this information, how are we going to get [collaborative action networks] to listen to the research?”
- Igor Limansky
For now, they’ve adjusted their model within the fellowship so that during the first two months of the fellowship, projects will be initiated by the collaborative action network. In the remaining four months, organizing fellows will initiate projects.
Limansky hopes this approach will “build better relationships between those making
the decisions and those being impacted by the decisions.” The work of systems change, he acknowledges, continues to evolve: “We as United Way of Salt Lake have relationships and levers that we can pull, but there needs to be more of a conversation upfront about how that happens. That’s what we’re growing into.”

pg 45
© 2021. StriveTogether, Inc. All rights reserved.
using lived experience to identifysystems-level metrics
from A guide to racial and ethnic equity systems indicators
Boston Opportunity Agenda | Boston, Mass.
S T O R I E S F R O M T H E N E T W O R K

pg 46
© 2021. StriveTogether, Inc. All rights reserved.
using lived experience to identifysystems-level metricsS T O R I E S F R O M T H E N E T W O R K
Boston Opportunity Agenda (Boston, Mass.) recognized the importance of family and community engagement in identifying systems-level metrics that indicate successes in early childhood outcomes.
These indicators are featured or discussed in this story:
Accessible and equitable parental and community governance
Story sections
Forming a family engagement committee | link
The strategies |link
Collaboration | link
Challenges | link
Successes | link
Building relationships | link
Examples | link
Conclusion | link

pg 47
© 2021. StriveTogether, Inc. All rights reserved.
Family engagement work wasn’t always as innovative as it is now for the Boston Opportunity Agenda, who, since the inception of its Birth to Eight Family Engagement Committee in late 2015, has developed four principles to assess family engagement. These principles, along with a newly co-created definition of family engagement, are part of an ongoing pilot project to center families’ voices and gather initial project data in Boston.
The nature of nonprofit work in Boston, which Boston Opportunity Agenda parent Danubia Camargos Silva describes as “the nonprofit mecca,” didn’t make this work easy. “There’s a nonprofit for everything and in every corner of the city, but we were all very siloed,” she said, referring to the often disconnected work being done in Boston. She explained that organizations wanted to do different things, and it was unclear what they were all trying to accomplish.
During the initial formation of the Birth to Eight network, the local community of nonprofits, policymakers, researchers and caregivers engaged in early childhood work gathered to develop a shared vision and set of metrics to measure the impact of the collective’s work. All involved highlighted the importance of engaging families in deep and meaningful ways. Out of this conversation, the Family Engagement Committee was formed.
forming a family engagement committee
In early meetings, Boston Opportunity Agenda Executive Director Kristin McSwain posed questions that helped evolve their work in family engagement: How do we know we’re successful in early childhood? What is the impact of quality family engagement practices? What does research tell us about outcomes for kids where families are deeply engaged? This discussion led to deeper questions, such as: Are these the right metrics? Is this how we measure success — that we’ll know children are meeting early childhood outcomes?
Camargos Silva’s own entry into family engagement work sheds light on some of its issues. “When I came into this work, I was just so angry,” she said. It was common sense to her — but not to nonprofit leaders — that “if people don’t have food, they won’t read a book.”
Camargos Silva described the norms of family engagement work that, for example, only measured the number of engaged families or children, which she called “the old data we can get anywhere.” More often than not, these norms failed to consider families’ lived experiences and disbelieved parents and guardians as the experts of their children.
“It looks good over here,” she said about a status quo rooted in expertise in the field but lacking in authentic community voices. “But it doesn’t feel good down here.”
using lived experience to identify systems-level metrics — Boston Opportunity Agenda

pg 48
© 2021. StriveTogether, Inc. All rights reserved.
using lived experience to identify systems-level metrics — Boston Opportunity Agenda
the strategies
With the goal of developing better metrics, the Family Engagement Committee identified four principles of family engagement: relationship quality between families and service providers, empowering families, parenting efficacy and family in decision-making roles. Then, in the summer of 2018, the committee surveyed organizations about their family engagement practices, how they defined family engagement itself and to vet the four principles.
Twenty organizations responded, building consensus around the four principles. After receiving this feedback, Boston Opportunity Agenda felt less tied to the idea of metrics and shifted focus to the principles instead — the pillars the organization believed essential to equitable and inclusive family engagement practices. They also decided to create a family engagement “toolkit.” A work inprogress, the goal is to be able to share the toolkit with other organizations to help them evaluate and improve their family engagement practices, informed by data and feedback from the families they work with.
The tenor of Family Engagement Committee meetings is necessarily collaborative. This was especially true when the committee decided to create a definition of family engagement after learning that most organizations don’t have one of their own.
“The interesting dynamic is that Kristin just trusts the people doing the work, that they’ll move the work forward,” said Boston Opportunity Agenda Senior Manager of Research Fernanda Campbell, who’s also part of the Family Engagement Committee. “So when I came with my data mindset and said, ‘Well, why don’t we just research, see what definitions are there and find one,’ Danubia and [other caregivers] pushed back: ‘It needs to be co-created. It needs to be all of us in the room.’”
This community-centered dynamic is present in the committee in other ways: members prioritize listening, including language that resonates with others and incorporating feedback. They also seek to get new people involved over time.

pg 49
© 2021. StriveTogether, Inc. All rights reserved.
collaboration
The structure of Boston Opportunity Agenda and the way it operates are themselves effective strategies for improving family engagement. Campbell described how the five committees, including the Family Engagement committee, work as smaller groups — sometimes in subcommittees — and come together every three or four months to share updates and discuss how their work “fits into the broader conversation.”
At these larger meetings, called Birth to Eight Convenings, Boston Opportunity Agenda brings in outside research to contextualize the way meeting attendees engage with families. A standout example for Camargos Silva was research from Tufts University on the damages of deficit thinking, which sees the worst in others and makes assumptions with limited understanding. In deficit thinking, a mother pictured “in a cluttered household, with pizza everywhere, dirty, chemicals, the child in the crib” is assumed to be unfit, Camargos Silva
described, while an asset mindset acknowledges the textbooks signaling that the mother is probably a student, as well as the food on the table and the safe and happy child.
While convening attendees are predominantly staff from Boston Opportunity Agenda partners, families and parent/guardian leaders are also invited. It’s a “warm atmosphere,” said Campbell, where all are encouraged to ask questions. An icebreaker begins every convening, and before the COVID-19 pandemic, attendees connected over breakfast.
Similarly, the Family Engagement Committee members are from different paths, backgrounds and organizations. Campbell started as a data fellow and transitioned to working in family engagement; in her own words, she’s there “to keep things connecting to data.” Many of the members are volunteers, including caregivers and those who work full time at other organizations. Caregivers like Camargos Silva have the space to lead the work as experts.
using lived experience to identify systems-level metrics — Boston Opportunity Agenda

pg 50
© 2021. StriveTogether, Inc. All rights reserved.
challenges
What Campbell calls “the best way we’ve identified to bring people from different organizations together” — collective impact — is also a challenge. All committee members except for McSwain and Campbell are volunteers from other organizations.
“In collective impact, even though people are passionate, sometimes they can’t prioritize, so things move slowly,” Campbell said, mentioning monetary compensation as a related issue. Staff from participating organizations come to the table in their role as employees, and parent/guardian volunteers may or may not be compensated depending on their path to the work. Boston Opportunity Agenda is working to ensure all caregivers are compensated for their expertise and time, but it is an ongoing challenge. Right now, Campbell said about parent/guardian volunteers, “it’s really about their core beliefs in the work.”
Another area of growth is the challenge of mindsets. Camargos Silva questions the mindset that families experiencing poverty “need us.” She cites perspectives of those who are “wealthy, well-versed, who have degrees,” but who don’t see families’ assets
nor understand that families want skills and opportunities, not stuff.
She recalled once when she asked: “Could the reason we haven’t made a lot of progress be that we don’t want to work ourselves out — for example, provide the people with everything they need so then we no longer have jobs?”
“That was like a bomb,” said Camargos Silva, who professed that she usually drops bombs at meetings. She described bombs as “thought-provoking statements rooted in my lived experiences and from working directly with the communities.”
Camargos Silva is frustrated at the politics of working with partners — the feeling that you can’t challenge problematic or unhelpful mind-sets and instead must respect partners’ work regardless of whether or not they’re actually helping families.
She said that’s why it’s important to get caregivers involved at the beginning of the process. “It’s a new muscle to exercise, but in the end the results are that much stronger,” she said, circling back to the importance of family engagement.
successesBesides families leading the work and those with positional power trusting and supporting family leadership, Boston Opportunity Agenda and the Family Engagement Committee have celebrated other successes, both internal and external.
An external success has been the strengthened ability of organizations across the city to collaborate with each other. Funders facilitate this work by launching collaboration-based grants, like in a recent example with a Children’s Hospital grant. Boston Opportunity Agenda itself received a grant from StriveTogether in early fall 2020, securing funding that would continue to support family engagement work specifically. “This wouldn’t have happened if the committee wasn’t active and engaged,” Campbell said.
Camargos Silva used the metaphor of clothing to describe collaboration:
“You have a hat, I have a shirt, you have a pair of pants and you have a pair of shoes. If all of us come together, we can dress a whole child.”
– Danubia Camargos Silva
A success that’s even closer to home is the creation of the Family Engagement Committee itself. As the citywide initiative Thrive in 5 came to close in late 2015/early 2016 — where Carmargos Silva was also a parent/guardian partner — leaders in early childhood across Boston came together to reflect on “what we learned, what we want to do from now on, who should be at the table,” said Campbell. She noted how McSwain listened, rather than imposing immediate solutions. It was out of
using lived experience to identify systems-level metrics — Boston Opportunity Agenda

pg 51
© 2021. StriveTogether, Inc. All rights reserved.
this posture of deep listening and reflection that family engagement was identified as a need and the Family Engagement Committee was born.
building relationships
examples
Currently, 15 organizations are signed up to pilot measures developed by the Family Engagement Committee: North Shore Early Childhood Center, Families First, ABCD, Crispus Acticus, Inquilinos Boricua, South Boston Neighborhood House, Boston Chinatown, Families Assessment, Bolden Street, Family Aid Boston, Children Legal Aid, Family Nurturing Center, the Jeremiah Program, Dorchester Family Engagement Network and the Dorchester Boys and Girls Club. Fellows from Families First, in particular, are modeling how to implement surveys in a way that builds relationships and leaves families feeling trusted, rather than judged.
Besides a launch event in September 2020 that announced the pilot project, the committee is looking for ways to promote their work
to other organizations — a process that’s become trickier during the pandemic. They hope to build their social media presence, maximize their website and otherwise build a sustainable communication plan.
The family engagement toolkit is part of their work but has only been discussed internally thus far. Before releasing the toolkit publicly, the committee has other priorities: piloting the measures and streamlining the use of a data collection platform. They want to make sure the why and how of the toolkit are strong first.
But it all comes back to building trust — with other organizations, and of course, with families. Camargos Silva described how the committee’s approach communicates to families, “I’ve heard you, and what you’re telling me is informing our next moves.”
An example is a recent change on the project’s timeline. After one-on-one interviews with several organizations in November, Camargos Silva identified the need to have the tools translated into seven languages. Partners were frustrated that non-English speaking families are usually left out of projects because materials are usually available in English, sometimes in Spanish.
“If we want to get things right, we need to change how things are done. Why wait to translate materials after piloting them in English? We are, again and again, not including
the voices of minorities,” Camargos Silva said. The team immediately agreed to take yet another two steps back to get price estimates and a timeline for translation services. After reviewing the options, the team agreed it was the right thing to do, despite the delay in timeline.
using lived experience to identify systems-level metrics — Boston Opportunity Agenda

pg 52
© 2021. StriveTogether, Inc. All rights reserved.
pg 52
As they build relationships, the work continues. In May 2021, the committee will look at the data gathered and conduct a mid-year review of the pilot to assess and adopt any improvements. They’ve scheduled check-ins to reflect along the way on what the data tells them and how to better support families who are sharing feedback. They’re working with United Way to enter screening data. Campbell is improving her data visualization skills.
conclusion
using lived experience to identify systems-level metrics — Boston Opportunity Agenda
“Before we weren’t allowed to share our personal experiences; we were little robots working for an organization. I’m seeing more and more of people … bringing that human nature back into the room,” Camargos Silva said about the welcome change in decision-making spaces.

pg 53
© 2021. StriveTogether, Inc. All rights reserved.
A P P E N D I X
systems indicators tracking across the network

pg 54
© 2021. StriveTogether, Inc. All rights reserved.
While the adoption of systems indicators at the Network level is relatively new, several network members have been independently collecting various systems indicators in their communities for some time. Many others pivoted to collecting systems-level data in 2020 as the pandemic made outcomes data difficult to track. Additionally, focus on systemic inequities became pivotal in addressing needs created by the health and economic crises and racial unrest across the nation.The link below captures systems indicators some network members are collecting data on. Since StriveTogether has not formally collected this data from all partnerships within the Network yet, this list is not exhaustive. The 2021 Civic Infrastructure Assessment will offer an opportunity for the full Network to report the indicators they are collecting and using.If you are interested in learning more about the work a partnership is doing on a specific indicator, contact them via the StriveTogether Partner Portal!
Click here to see what other partnerships are tracking.
A P P E N D I X
systems indicators tracking across the network

© 2021. StriveTogether, Inc. All rights reserved.
pg 55
125 East Ninth Street Second Floor Cincinnati, OH 45202
513.929.1150 StriveTogether.org
332 South Michigan Avenue Ninth Floor Chicago, IL 60604
StriveTogether is a national movement with a clear purpose: help every child succeed in school and in life from cradle to career, regardless of race, ethnicity, zip code or circumstance. In partnership with nearly 70 communities across the country, StriveTogether provides resources, best practices and processes to give every child every chance for success. The StriveTogether Cradle to Career Network reaches more than 11 million students, including more than 7 million children of color, and has partners in 29 states and Washington, D.C.