Embed Size (px)
Citation preview

'·
A GUIDE TO MATHCAD 5.0
FOR WINDOWS
by
Celal N. Kostem
~ITZ ENGINEERil\TG ORATORY LIBRARY
Department of Civil Engineering
Lehigh lJniversity
Bethlehem, Pennsylvania
October, 1994
Fritz Engineering Laboratory Report No. 400.53

A Guide to Mathcad s~o For Windows
A GUIDE TO MATHCAD 5.0 FOR WINDOWS
1. ENTRY AND EDITING
When MATHCAD is activated you will see a large blank area and a File Name, if it is already assigned, at the top. Below this line you will fmd a list of alphabetical menu items. This has the look of LOTUS 1-2-3. Below this menu you will fmd a series of icons for frequently used commands.
1.1 Left Icon Bars On the left side of the screen you will see a vertical bar with numerous menu "items." Some of the icons may make sense, such as an equal sign or the square root sign, whereas, another one near the top looks strange":=" but has a very important use, and meaning, in MATHCAD. If you look at the top of this column, you will fmd the number one. If you move the cursor over number one, and click the mouse, number two will appear. All the icons below this number will be different from the previous menu's icons. If the mouse is clicked again, another number will appear. The number of icons is fewer.
If the mouse is clicked a couple of times in the icon boxes new figures will appear: a, f3, y, o, etc. , p, a, 't, cj>, etc., This shows one of the important attributes of MATHCAD. It is possible to enter Greek letters as variable names, in the text, etc. Actually the paragraph you are reading is created by MATHCAD, and the Greek letters are inserted through the use of the left icon boxes.
1.2 Electronic Books If you click the top box on the vertical icon column once again, instead of '6' you will see 'EB'. EB stands for Electronic Book. Some of the books come "bundled" with the software, whereas many others have to be purchased. separately. TOC' below the EB mark stands for Table of Contents. Below the TOC you can see the "Index." Additional icons stand for "go to the next section," "go to the next page," etc
1.3 Enterin& And Editin& Equations Suppose we wish to enter the following equation:
3 a:=--
4+ 52
The keystrokes for the above equations are: (1) Type a (2) Type :, or move the cursor using mouse to the first icon on the left icon-column.
click the mouse Celal N. Kostem PAGE:1

A Guide to Mathcad 5.0 For Windows (J) Type:; . (4) Type the division sign, i.e., I (5) Type 4 (6) Type addition sign, i.e.,+ (7) Type 5 (8) Type caret sign, i.e., " (9) Type 2
Some observations: (1) As opposed to an = .... type entry, we entered:, which is displayed as:=. This
symbolic representation means "a defined as .... " It is one of the most frequently used Mathcad symbols.
(2) After the division sign we entered 4 and +. One would have assumed that the expression should have looked as shown below:
3 2 a:=-+5
4
The above would have been the case if we had hit the space bar after 4. When in doubt, as in the case of FORTRAN programming, make use of parenthesis. The original equation can also be entered as:
a _ 3 The parentheses are redundant, but we have the correct .- (4 +52) entry!
(3) If we wish to see the numerical value of a, we need to type a=
a = 0 .I 0344827 5862069
In Mathcad the equal sign is an instruction to compute the expression, and display the value using the default format
1.4 An Example Suppose we wish to enter the following expression.
x- 3·a2
The keystrokes involved to generate the ab~ve expression are: (1) Type the nominator as we have done before. (2) Before proceeding to the -4+ ... of the denominator, we need to identify that the
division sign will be below the full nominator expression. Use the up-arrow key. A box will surround the nominator, after a few up-arrow entries.
Celal N. Kostem PAGE:2

A Guide to Mathcad 5.0 For Windows
(3) Type the division sign. (4) Type -4+ (5) Move the cursor using the mouse to the square root icon on the left icon
column. Click the mouse. The square root sign will appear. (6) Type y+l (7) Using the up-arrow key envelope the expression with the square root sign (8) Type+ sign (9) Go to the fourth icon column on the left. Using the cursor click the mouse
on the Greek letter 1t. The expression is completed.
1.5 Some Comments on the EXJ)ression Entered Although the expression is entered we can not compute anything! As seen below:
1- J.a2 =
-4+j0 +X
The variables x and y are shown in reverse video. These were not defined prior to the establishment of the equation. The same might be true for a. However,
earlier in the document the numerical value of a was defined. Thus, whether we mean it or not, the last value will be used. We did not get a reverse video for 1t. Since 1t is a reserved name with a numerical value, the expression will use this pre-set value.
Another handicap, which is quite critical, is as follows: If the numerical resultant of this expression is to be used later in the worksheet, we need to copy the expression. This is tedious chore! Thus, ideally, we should have set the expression to a variable name, as shown below:
a :=3. X :=2. y = 1.
1t =3.141592653589793
The value of 1t is shown here for information purposes.
z = -44.97970566358201
The same expression is re-written. The variable a is replaced by b.
b =5
Celal N. Kostem PAGE:3

A Guide to Mathcad 5.0 For Windows
As seen above b is displayed in reverse video, indicating that it is NOT DEANED! It is defined slightly below the equation. Thus, the basic rule of thumb is: Whatever is to be used in any given formulae must be defined ABOVE or LEFf of the expression. Since b is defined, if we copy the above expression:
z·------ z = -131.3407405376595
-4+~+lt
No error messages!
1.6 Sticky Operators Sticky Operators: The division, power, and radical are "sticky" in Mathcad. This means that after you type one of these operators, everything you type next will be a part of the denominator, exponent, or radical until you explicitly move the cursor with the space bar, the up-arrow key, or by clicking the mouse. Assume we wish to enter the following expression:
3 1 •+b ~1 X +--·X - 'ljX+ 1 + 1 3+ b
The keystrokes required are: (1) Type x"3 (2) Press space bar (3) Type *x"a+b ( 4) Press space bar (5) Enter the radical sign
(6) Type X+l (7) Press the space bar (8) Type +1
If the above expression is typed in without the space bar, we will have the following:
Celal N. Kostem
You can see the huge difference between the two formulae.
PAGE:4

A Guide to Mathcad 5.0 For Windows
2. TEXT ENTRY, SPELL-CHECKER, REGIONS, EDITING TOOLS
This document is prepared using MA THCAD. As can be seen, in addition to the mathematical expressions, one can enter textual material as well. This permits the documentation of the accompanying computations. Actually, during the past half a dozen years a number of undergraduate students developed their "term projects" on primitive versions of MA THCAD. A number of graduate reports, e.g., theses and dissertations' appendices, were developed by MATHCAD.
In order to enter textual material one needs to type ", which indicates that the following entries will be a text~ not subject to any computations! It used to be quite common for the text material to contain all kinds of spelling errors when one used the earlier versions of MA THCAD. The current version, i.e., 5.0 for WINDOWS, contains a decent spell-checker, which can be activated by using the pull-down menus (TEXT, CHECK SPELLING).
With what is covered so far, it can be seen that we will have regions that contain mathematical expressions or text material. It is possible to identify these two regions on a given document simply through the use of "pull-down" boxes. A third type of entity which will be covered later is the GRAPHICS, or simply PLOT REGIONS.
As compared to other "worksheet software," e.g., TK!.SOLVER or EUREKA, MA THCAD is an extremely useful tool in mixing these different regions on the worksheet Thus, MA THCAD can, and should, be considered as a very potent tool, as compared to its so-called competitors.
2.1 Editine Tools In order to have a better feel for the editing tools, one needs to grasp the difference amongst the different CURSOR TYPES. If the cursor is a CROSS-HAIR it is used to distinguish between the equation, plot, or text regions. It also has advanced features which are beyond the scope of this tutorial. 1
If the cursor is a VERTICAL BAR, it is referred to as the "INSERTION POINT." It is the most potent tool in editing equations or the text. If the cursor is a BOX, or selection box, it is somehow similar to the vertical bar inits usage, but it is specifically used for inserting or deleting operators, numbers, and variable names. This tool can only be selected in math or graphics regions.
2.2 Insertion Point This tool appears as a vertical bar (blue and thick in math regions red and thin in text regions). It can be used as follows in editing equations. Assume the name of the variable was supposed to be accel, instead of accet:
Celal N. Kostem PAGE:S

A Guide to Mathcad 5.0 For Windows
accet • = 32.2
accel • = 32.2
To correct this mistake we need to move the vertical bar to the immediate right hand side of the character to be corrected, i.e., t. By backspace key the "t" can be removed and "1" can be typed. The cursor can be moved out of this equation region via the mouse.
This operator can also be used to insert an operator. Assume that the equation we wish to enter is:
2.3 Selection Box
Whereas, without sufficient care(!), the expression entered is:
Obviously, this simple expression can be erased, and the correct expression can be entered. Or, through the use ~f the insertion operator: (a) we can move the vertical bar between the "a" and "b", and enter"/" sign, and (b) we can move the vertical bar just to "c" and using the mouse and the left icon bar, the square root sign can be entered.
This tool is a rectangle with a notched comer. It can be used to defme, i.e., enclose, a single variable name, the numerator of a fraction, or an entire graphics region. It is also used with the "clipboard" in the execution of CUT, COPY commands of the EDIT menu. For other multitudes of use of this option, one needs to practice and refer to the Manual. Within the scope of this extremely abbreviated guide, it is not possible to cover all the editing options available. Please refer to the Manual!!!
2.4 Alimin& Reauons Through casual, or careless, use one can have a number of equations entered closely spaced. Although they might have been aligned, vertically or horizontally, in the entry process they were not! One can use ALIGN REGIONS, UNDER THE EDIT COMMAND:
b a+-
c
fB-h If we wish the above three expressions to be on the same line, as shown below, the regions must be identified via cross-hair cursor, and the pertinent EDIT commands must be issued.
b a+- f.
c "Jd+e
c
Celal N. Kostem
fB-h fB-h
PAGE:6

A Guide to Mathcad 5.0 For Windows
Before issuing the above EDIT, ALIGN REGIONS commands, the expressions must be included in a rectangle with dashed lines. This is accomplished via the proper use of the cross-hair cursor.
The vertical alignment is quite similar:
d c--
e
d c--
e
2.5 Insertion of Blank Lines The user quickly recognizes that too many expressions and text are typed too close. Insertion of blank lines would enhance the readability. If that is the case, one must put the cross-hair cursor where extra blank lines are to be inserted. Using EDIT, INS/DEL BLANK LINES command, as many blank lines as needed can be inserted. Conversely, if large blank spaces are to be eliminated, then similar commands can be used.
2.6 Text Remons One of the strongest attributes of Mathcad is being able to have the textual information with the mathematical expressions and plots. In order to create a "text region" one needs to type a double quote sign, or simply use ~e menu and issue EDIT CREATE TEXT REGION Commands. The location of textual entry does not have to be the left margin, as shown below:
a+ b + 5..fe The text can start after the equation, and can have the indentation d as shown in this example.
One of the most helpful aspects of the current version of Mathcad is the spell-checker, which was not available in the earlier versions. Obviously the spell-checker will only check the text regions.
Celal N. Kostem PAGE:7

A Guide to Mathcad 5.0 For Windows 2. 7 Chan&Jne of Text Font, Size. Style. and Position This document is generated by using Times Roman, 12 point font It is identified as the "Default Text" The software has numerous other fonts. It should be noted that if the default font is changed carelessly, then the change will apply to the full document! The user must identify a block by clicking on the text via mouse, and moving the mouse, i.e., dragging. The text will be highlighted, i.e., the reverse video. One can change the text style and font by going up to the menu displayed at the third line of the screen.
Celal N. Kostem PAGE:8

A Guide to Mathcad 5.0 For Windows
3. COMPUTATIONAL FEATURES
A few examples are presented herein to demonstrate the entering equations, formatting results, etc. All entries are also given to show the keystrokes.
3.1 Operators and Fonnattine a:=l.l1
"a:=l.11" b : = 1.23456789 "b:= 1.23456789"
c :=a+ b "c:=a+b" c = 2.34456789 "c="
In the above operations the use of := defines the values and operations. When an equal sign is entered the computation is performed. Although the full numerical value of "c" is not displayed, Mathcad has a default setting of Fn.3, if we use FORTRAN notation, to display real values.
If we want to change the format used in the display of "c," we need to activate MATH NUMERICAL FORMAT command:
c = 2.34456789
First the number whose format will be changed must be identified. By using the cursor a rectangle with dashed lines can be formed around the c= ..... By using the pull down menu we can issue MATH NUMERIC FORMAT commands. The precision can be changed from "3" to "10". It can also be seen that the significant decimal places can not be more than 15 digits. This is the built-in accuracy of Mathcad.
3.2 Definition of Variables
f = 11.
Another definition:
gh = g+ h
gh=110
h =60
As seen, f is shown in reverse video. It is undefined. Thus, computation can not be
1 performed.
dd =21
Again, the operation can not be performed. The operation to be performed is defined before th.~ definition of the variable "h". It can be corrected as below:
Variable "g" and "h" defined prior to the expression.
Celal N. Kostem PAGE:9

A Guide to Mathcad 5.0 For Windows
Another danger is the possibility of a variable defined previously in the worksheet:
new= 206.68913578
All of the variables were defined previously. If the above summation is done intentionally, then the result is correct. However, it is quite common that in any given worksheet, especially long ones, the user may forget to initialize the new value of a given variable. The software picks up the most recently defmed value!
3.3 Predefined Variables and System Constants
There are predefmed variables the user should not override: 1t = 3.141592653589793
e = 2. 718281828459045
00 = 1·1cf07
% =0.01
TOL =0.001 Used in iterative numerical computations.
ORIGIN=O In subscripted variables, i.e., vectors and matrices, the subscript of the first term!
By using the above defmitions we can perform computations:
4- = 5.859874482048838
3.4 Complex Numbers
a:=- 25 b :=fa b =Si
As seen, above the system automatically switches to complex numbers. "i" denotes the square root of -1.
Another example would be:
X:= 5 + 3i xy :=x·y xy = 16 +30i
z:=J; z = 5 +3i
Celal N. Kostem PAGE:10

A Guide to Mathcad 5.0 For Windows
3.5 Entry of Complicated Ewressions (a) Expressions with radical sign and fractions:
a:=3.2 b:=-5.5 Keystrokes: x, : , radical sign, (a+b), /,(a-b), ", 2, space-bar twice,*, a, space bar, 3,*,b
x=-16.5 +0.311831263591966i
(b) Trigonometric Expression:
Y :=cos(2·~) Keystrokes: y, :, cos,{, 2, *, CTRL-P, /, 2,)
y = -D.S
(c) Case Sensitivity: In the above expression the value of "y" is defined.
I=
y :=y
Y=-Q.S or
Y is shown in reverse video. This shows a critical attribute of Mathcad. Upper and lower case letters stand for two different values!
y = -{).5
(d) Multiply Embedded Expressions:
b :=0.1
Keystrokes: z, :, atan, {, In, I, b, ". 3, space bar, space bar, space bar, }, ), /, tan, (, b, )
z := atan(In( lb3l)) tan( b)
z =-14.22270301 107701
(e) Fractional Algebraic Expressions:
a:=-1 b:=2
y:=---1 a
1+--a
I+b
Celal N. Kostem
Keystrokes: y, :, a,". a, space bar, I, 1, +, a,",-, b, space bar,/, 1, +,a,/, b
PAGE:11

A Guide to Mathcad .5.0 For Windows
4. DIMENSIONAL ARRAYS
To define an array one must define the indices. Please note that by default Mathcad uses the first index as zero. This can be changed by redefming the origin.
i =0 .. 5
A = 2· i +I I 3
The notation used for "i" has a special meaning. After entering zero, one can enter either a semicolon or use the left icon bar. In this example the number 5 is then entered. i:=0 .. 5 indicates that the values of i will be 0, 1, 2, 3, 4, 5.
To generate the A-sub-i expression, after entering "A" either enter left square bracket then i, or simply use the left icon menu column.
A I
To generate the tables shown on the left, enter "i=" and A-sub-i=. The tables will be automatically generated.
Another example in the use of the range variables is:
~ y -j -j! j = 0 .. II X :=0.I25
J y. 'I
I
O.I25 , 0.0078I25
3.255208333333333·10-4
1.017252604166667·10-S
2.543131510416667·10- 7
5.298190646701389·10- 9
9.46105472625248·10-ll
1.47828980097695· to- 12
2.053180279134653· w- 14
0
0
Celal N. Kostem PAGE:12

A Guide to Mathcad 5.0 For Windows
As can seen above, the length of the boxed tables is different due to the power of base-10 multipliers.
A new operator can be introduced: Summation of the terms, which requires Capital sigma operator:
sum:=Lyj
J
sum= 1.133148453066826
The summation term is available on the third icon column on the left Summations need not be carried for the full range. By using the summation icon on the 1st column on the left:
9
newsum := ~ y ~j
j=3
newsum = 3.359530668260572·10-4
Another operation that can be demonstrated is the cross product of the generated y-terms. This is denoted by the capital1t symbol available on the 2nd column of the left icons:
3
prod:= n yj
j = I prod= 3.17891•10 --'7
4.1 Creatin& a Vector or a Matrix
It is highly advisable that variable names should be assigned to any created array. This permits the use of the same array later in the worksheet by simply referring to the assigned name.
Celal N. Kostem
On the left hand after entering A:=, we can go to the 2nd left hand icon column, and issue the matrix command. A dialog box will appear. It is necessary to enter the number of rows and ~olumns, in this case it is 3 by 3. This would result in the array shown. All the solid rectangular signs are the "placeholders" for the numbers to be entered. Since at this time nothing has been entered, it will give the error message as shown.
PAGE:13

A Guide to Mathcad 5.0 For Windows
The numbers can be entered one term at a time. To go from one element to another the TAB key needs to be pressed. The sequence of entry is column-by-column.
C=(~ ~ ~1) 5 6 6
Each term of the above matrices can be "queried" one by one, if so desired:
It should be remembered that the subscripts of the first term are 0,0. The first subscript corresponds to the row number, and the second to the column number.
The terms of the array can be individually changed, as shown:
c = 111 0,0 c = 1994 2,2
111 2 11
C= 3 6 7
5 6 1.994•103
Mathcad contains numerous matrix operations. Below is a partial list: (A, B are matrices, U and V are vectors, z is a scalar and n is an integer)
Scalar Multiplication A*z
Dot Product U*V
Matrix Multiplication A*B
Scalar Division Nz
Matrix Addition A+B
Celal N. Kostem PAGE:14

A Guide to Mathcad 5.0 For Windows
Scalar Addition
Negative of a Matrix
Power of a Matrix
Determinant of a Matrix
Transposition of a Matrix
Cross Product of Two Vectors
Inverse of a Matrix
To create an n by n Identity Matrix
Extract the Eigenvalues of a Matrix, the result will be returned in a vector
Extract the Normalized Eigenvector of a Matrix z is the eigenvalue, the eigenvector corresponding to this eigenvalue is sought
4.2 Determinants and Matrix Inversion
detA := IAI
detA =-39.99999999999999
C :=AB
A+z
-A
A''n
IAI
A''T [Use CTRL 1]
UxV [Use CTRL 8]
A''-1
identity(n)
eigenvals(A)
eigenvec(M,z)
0 0 .. Note the roundoff error.
C= 1.776356839400251·10-15 0
0 0
Celal N. Kostem PAGE:15

A Guide to Mathcad 5.0 For Windows
In the MS-DOS Version 3.1 of Mathcad it was possible to "fool" the system and invert a singular matrix. The same example can be tried again(???).
A ~ (~ : :) determ := IAI determ =0
-4.503599627370498•10H 9.007199254740992•1015 -4.503599627370496•1015
~ = 9.007199254740996•1015 -1.801439850948198•1016 9.007199254740991·1015
-4.503599627370498·1 o15 9.007199254 7 40992·1 o15 -4.503599627370496·1 o15
C =AB (0 0 0)
C=-40-4
0 0 0
Matrix C is supposed to be an identity matrix. Watch out!
4.3 Solution of Simultaneous Linear Aleebraic Equations Via Matrix Inversion
Assume we have the system [A]{X}={B }. If [A] and {B} are known, fmd the solution, i.e., {X}.
X=(~)
For the sake of argument, A-inverse can be checked, as well as the determinant of the coefficient matrix.
~.0862068965517~4 --o.051724137931 034
K 1 = .120689655172414 0.327586206896552
.068965517241379 0.241379310344828
deatA := IAI detA =-39.99999999999999
0.327586206896552 )
0.258620689655172
0.137931034482759
4.4 Creation of Matrices With Limited Mathcad Prouammine
Example-1: We wish to set the origin to 1, instead of the default value of zero. Diagonal terms will be 2, and off-diagonal terms will be 1.
Celal N. Kostem PAGE:16

A Guide to Mathcad 5.0 For Windows
ORIGIN=O
I = I..N
I:= 1.. N
2
2 1
J := 1 .. N
~.I :=2
A= 1 2 1
2
2
ORIGIN:= 1
~.I:= 1
N :=5
Example-2: Generate a 5x5 Hilbertian matrix, where the terms are defined via a(i,j)= 1/(i+j-1)
N :=5
I:= 1.. N J := 1.. N 1 ~.I:= I+ J- 1.
0.5 0.333333333333 0.25 0.2
0.5 0.333333333333 0.25 0.2 0.166666666667
A= 0.333333333333 0.25 0.2 0.166666666667 0.142857142857
0.25 0.2 0.166666666667 0.142857142857 0.125
0.2 0.166666666667 0.142857142857 0.125 0.111111111111
COMMENTS: 1. Computation of detenninants and inverses of matrices is performed using LU decomposition with Crout's partial pivoting .
. , 1
2. Matrix commands can not handle arrays having more than 100 elements. Arrays can be created using AUGMENT or STACK functions, or they can be directly read from a disk ftle. For these operations please refer to the Manual. The effective size of the largest array that can be generated is "memory-dependent" Usually arrays of at least 1,000,000 can be generated. The upper bound of the size or the arrays, regardless of the size of the memory, is 8,000,000.
Celal N. Kostem PAGE:17

A Guide to Mathcad 5.0 For Windows
4.5 Eiunvalues and Eiunvectors
ORIGIN:= I
(
11 1 3 ) A:= I 9 7
5 5 29 B :=eigenvals(A)
(
IO.I461062542779I)
B = 31.41118648734998
7.442707258372113
B-vector contains the eigenvalues of Matrix-A. To compute the eigenvectors eigenvec function must be used:
(
-0.94605884475801 ) VI = 0.269838433I89294
0.1793317658II545 (
0.153090591499551 ) ( O.I03529826099603) V2 = 0.300842317467048 V3 = -0.973923202136062
0.941306098363 0.20I879IOI069983
4.6 Solution of Linear and Nonlinear Simultaneous Equations Usine "FIND" Command
One of the most powerful built in functions of Mathcad is the "Find" procedure. It uses Levenberg-Marquardt method, which is a quasi-Newton-Raphson approach. In the definition of the problem specific protocol must be followed. Initial guesses must be given for the roots!
Guess values: X :=0 y :=0 z :=0
Given
X- 3·Y + 2-Z=l
-X + 2· Y- Z=- 1
In the defmition of the problem the word "Given" must be entered. In entering the equal signs it is ESSENTIAL THAT they must be entered as CRTL and= sign pressed simultaneously.
Celal N. Kostem
(
0.75) Find( X, Y ,Z) = -0.25
:-0.25
PAGE:18

A Guide to Mathcad 5.0 For Windows
If the equations to be solved are nonlinear, transcendental, etc. the Find function can still be used. If there is no solution, the system will give an appropriate warning message. If the accuracy is to be improved, then TOL should be set to a value smaller than 0.001.
The same approach can be used to find the point of intersection between a circle and a hyperbola. Initial values are selected such that the roots will converge in the first quadrant
Initial Guesses:
Given
TOL :=0.00001
X:= 1
y := 1
X2+l•625
x2 l -- -•10 16 16
. ( 19.81161275615895) Fmd(x,y) = 15.24795068197691
4.7 "ROOT" Function Although this method has very little to do with the matrices, it is a companion tool to the "FIND" function. It is used to find the root of one nonlinear equation. Assume we wish to find the root of "x"'3-e"'x" at the vicinity of 3.
The initial guess: TOL :=0.0000000001
X :=3
xroot :=root(>f- ex,x) xroot = 1.857183860218969
Another Example: Find the frrst positive root of the given function. First we need to have a graph of the function to have a crude estimate of the root, i.e., the initial guess. Plotting of functions will be covered in detail in the third tutorial. For illustration purposes we can plot the expression.
x:=O,O.l..6 y(x) :=(3·sin(x)i- x2
Celal N. Kostem PAGE:19

A Guide to Mathcad 5.0 For Windows 30
20
10
y(x)
0
0
/\ lj \
I
) 1\
\ '
\ \
2 3 4
X
It looks as if we may have a positive root in the vicinity of 2.5. Thus, we'll use 2.5 as the initial guess.
x : = 2.5 xroot : = root(y( x), x) xroot = 2.483822711095106
Check the accuracy by computing the residual:
Res= 2.131628207280301•10-14
OK!
Cetal N. Kostem
Res : = y( xroot)
PAGE:20
6

A Guide to Mathcad 5.0 For Windows
5. DEFINITE INTEGRALS
Although Mathcad can perfonn limited, very limited for that matter, symbolic computations, its real power is in numerical computations. The symbolic portion of Mathcad is imported from MAPLEV. As compared to the power of MAPLEV, Mathcad is a relatively modest software.
To define a defmite integral sign, one needs to use the icon column on the left of the screen. Assume the function to be integrated is given below:
f(x) =i + 2·x2- H).x+ I
J.IO
I = 0
f(x)dx
I = 2.676666666666667 •I 03
Some sample integrations are given below:
TOL = I·I0-10
a:= I
I g(z) :=-
z
II = r g(z)dz
b :=2
II =0.693I47I80559945
A more "sophisticated" expression, which is not easy to attempt by pencil and paper, would be:
12 •= r b(x)dx
5.1 Multiple Definite Intemls
., 1 lt
a ·-.--2
b :=x
I2 = -o. 790089424084085
Assume the following highly complicated function:
f(x,y,z) :=sin(X+Y+Z)·cos(x-y)2
TOL =O.OOI
Celal N. Kostem PAGE:21

A Guide to Mathcad .S.O For Windows
2 x 2·x
Jlt
I'~ 0 L L f(x,y.z) dz dydx
I = -2.23790766764954•1 0 """"9
Note that the definite integration employs a quadrature, and until a convergence is attained, the number crunching continues!
f(x) :=ex
I:= Jo f(x) dx - 10
I =0.999954600113471
If the tolerance is improved: TOL :=0.00001
I:= Jo f(x) dx -10
I = 0. 999954600070244
TOL : = 0.0000000001
I:=J0
f(x)dx -10
I= 0.999954600070244
There is no difference between the two integrations!
A simpler triple definite integral can be attempted as below, with different TOL values.
TOL :=0.01
f(x,y,z) :=x·y·z
I ·. -- lo3 los loll J1
J1
J1
f(x,y,z)dzdydx
TOL : = 0.000001
I ·.--1o3 lo5 loll J1
Jl J1
f(x,y,z)dzdydx
I= 3.403125·103
I = 3.403125·103
There is no change in the accuracy of the answer!
Celal N. Kostem PAGE:22

A Guide to Mathcad 5,0 For Windows
5.3 Numerical Differentiation The value of the derivative at a given location is approximated by Mathcad. This is again an iterative process.
-6 TOL = 1·10 TOL :=0.01
The derivative of the function will be computed at x=O.
X :=0
d1 :=~f(x) dx
Change the TOL:
TOL : = O.C>O<X>O 1
d2 :=~f(x) dx
d1 = 0.999999999999999
d2 = 0.999999999999999
No improvement! However, in the older version of Mathcad (MS-DOS-ba.sed Version 3.1) there used to be a major difference!
Celal N. Kostem PAGE:23

A Guide to Mathcad 5.0 For Windows
6. NONLINEAR EQUATIONS AND PLO'ITING WITH MA meAD
Although at the frrst glance plotting and nonlinear equations have little to do with each other, a plot of a nonlinear function is a good tool for the initial estimate of the root in solving the nonlinear equations. Thus, they are linked herein for that sole purpose only.
If the plot of a function over a range is needed, both the range and the function need to be defined:
X =· 5,-4.9 .. 5
f(x) :=x3- IO·X+ 2
In the above notation for "x," the implication is that "x" is to be computed from -5 to +5 with 0.1 increments. The difference between the first entry, i.e., -5, and the second entry, i.e., -4.9, defines the constant incrementation.
80 il
64
I 48
I 32 v f( X)
16
/ v ......_____
~ I 0
I ......,
/ "--... /
-· I , "'3
I ..L I
1/
-3.9 ~.6 o.s 1.6 27 3.8 4.9
The initial guesses will be: -3, 0, and +3.
Celal N. Kostem PAGE:24
6

A Guide to Mathcad 5.0 For Windows
xl : =- 3
x1rt: = root(f(x1), xl)
x2 :=0
x2rt := root(f(x2),x2)
x3 :=3
x3rt : = root(f(x3), x3)
x1rt = -3.25789701302467
x2rt = 0.20080975615044
x3rt = 3.057087211097701
As always, it is prudent to check the residuals, i.e., resl::::f(xlrt)=?
Resl :=f(x1rt)
Res2 : = f( x2rt)
Res3 :=f(x3rt)
Res1 = 1.040802999341395·10-10
Res2 = 3.187624608713691·10""""9
Res3 = -8.199530441288516· 10 -'7
Example: Intersection of circle and a parabola.
X:=- 10,- 9 .. 10 Circle:
y1(x) :=~100-i
10 v I--
8 v 9
I .... v 7
6
y1(x) - s y2(x)
4
3
2
I I I
I
1/
......... \.
...............
r···· ... ···· ...
--~
,
.... ....
..·····
···- ... 2
X
4
(OK)
(OK)
(OK, but can be improved by a smaller TOL.
Parabola:
y2(x) := O.l·x2
~ f\
\/ ,/ \
,i/ \ ' ' \
i
l ...........
\ 6 8 10
Celal N. Kostem PAGE:25

A Guide to Mathcad 5.0 For Windows
It seems as if the roots are in the vicinity of ( -8,6) and ( +8,6).
The flrst set of roots:
x:=-8 y:=6
Given
2 y-0.1-x•O
a = Find(x,y)
Second set of roots:
X :=8
Given
2 y-0.1-x•O
y :=6
a :=Find(x,y)
Celal N. Kostem
(-7.861513777574233)
a= 6.180339887498948
( 7.861513777574233)
a= 6.180339887498949
PAGE:26
A Guide to Mathcad 5.0 For Windows
7. PLO'ITING
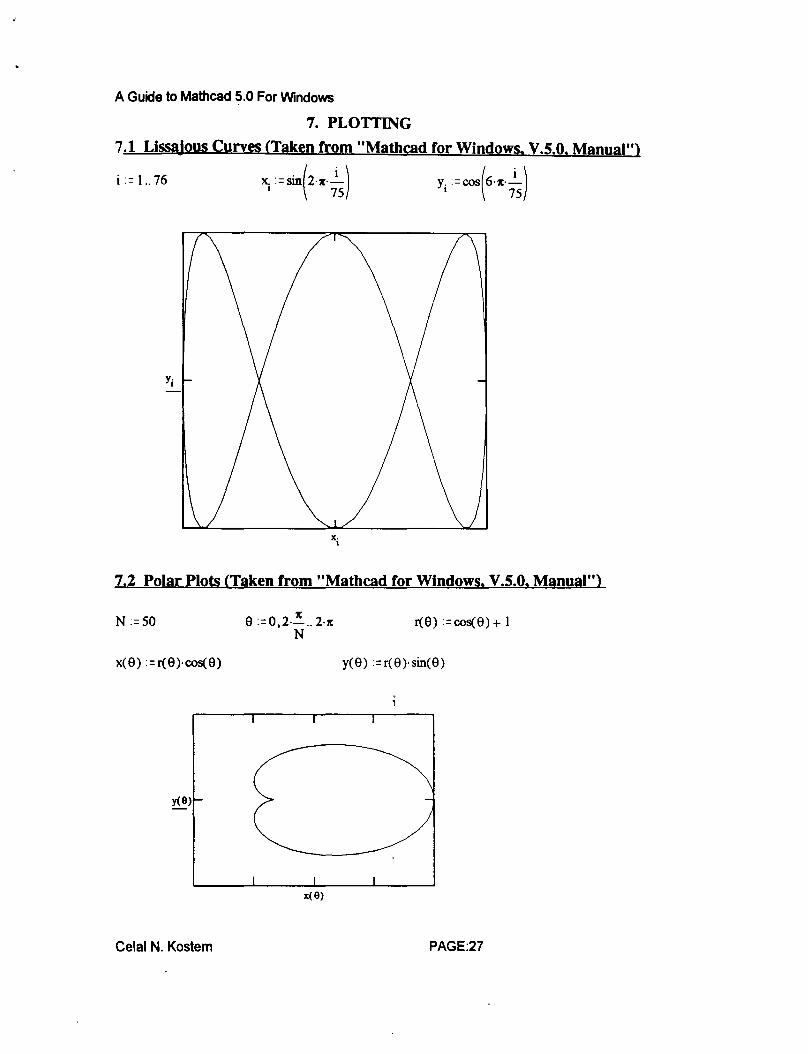
7.1 Lissajous Curves <Taken from "Mathcad for Windows. V.S.O. Manual")
i:=l..76
X· I
7.2 Polar Plots (Taken from "Mathcad for Windows. V.S.O. Manual")
N :=50 lt e :=0,2·- .. 2-11: r(9) = cos(9) + 1 N
x(9) := r(9)-cos(9) y(9) :=r(9}sin(9)
y(9)
x(9)
Celal N. Kostem PAGE:27
A Guide to Mathcad 5.0 For Windows
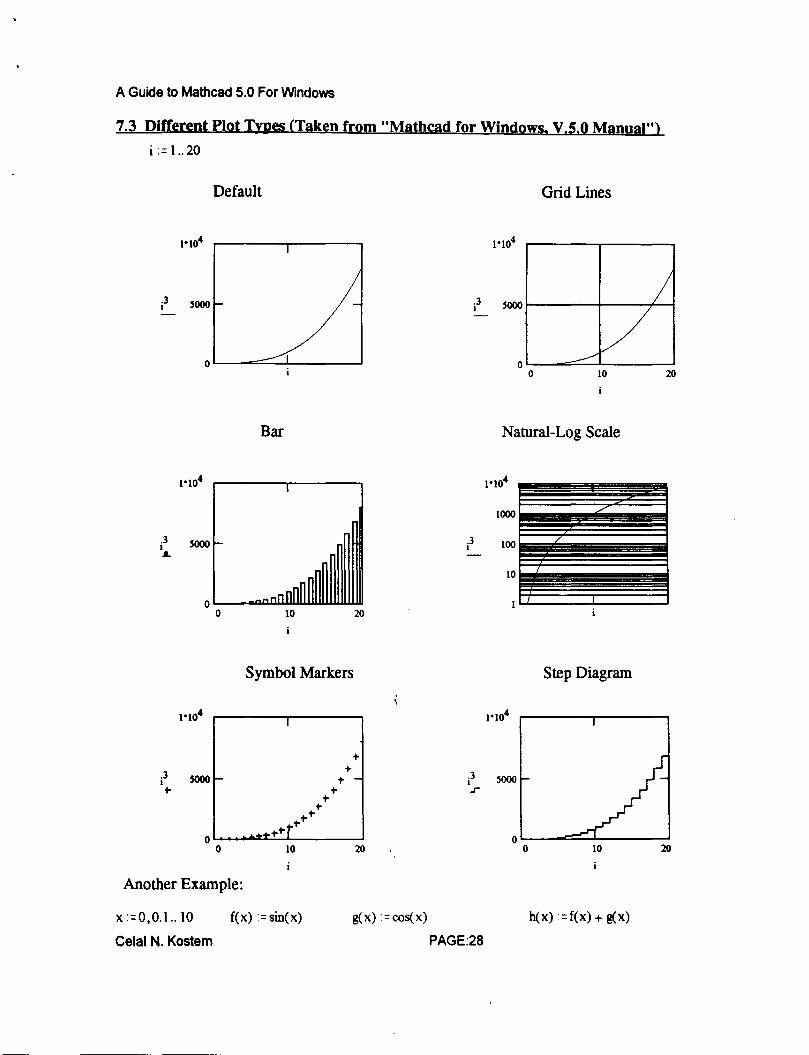
7.3 Different Plot T.mes (Taken from "Mathcad for Windows. V.S.O Manual") i := 1.. 20
.3 I
.3 I ...
Default
Bar
.3 I
.3 I
Symbol Markers
.3 I +
Another Example:
I
x :=0,0.1..10 f(x) :=sin(x)
Celal N. Kostem
+ .3 I .r
g( x) =cos( x)
PAGE:28
Grid Lines
Natural-Log Scale
-- ---- --- --.=-~ ==----==== 1000 --------
Step Diagram
h(x) =f(x) + g(x)

A Guide to Mathcad 5.0 For Windows
2,------------------------.------------------------~
f( x)
g(x) 0
b(x)
I /
/ /
..... \
' \ \ \ \ \ \ I I I \ \ \ I \ I \ \ \
·.. \ ··.. \ .·
··-···\····· \ I
\ / '-..__.../
I I
I I
I I
I
//- ..... , I \
I \
... -····/··· .. \ . I
I I
I I
I I
I I
I I
I
\ \ \ \ I I I I \ I I I \ \ I \ \
·.. \
·······\--·· \
' '
~~------------------------~-------------------------J 0 10
7.4 Surface Plots (Taken from "Mathcad for Windows. V.S.O Manual")
ORIGIN :=0 N :=20
X. :=- 1.5 + 0.15·i I
M .. :=f(x.,y.) I,J I J
M
Celal N. Kostem
i :=O .. N
y. :=-1.5 + 0.15·j J
j =O .. N
f(x,y) = sin(i + y2)
PAGE:29

A Guide to Mathcad 5.0 For Windows
Shaded Patches
M
Contour Plot
M
Celal N. Kostem
Gray Scale with Hidden Lines
M
PAGE:30