Embed Size (px)
Citation preview

A guide for managing the resource model of the copper
block-cave at Palabora Mining Company
Johannes Jacobus Bezuidenhout
A Project Report submitted to the Faculty of Engineering and the Built
Environment, University of the Witwatersrand, Johannesburg, in partial
fulfilment of the requirements for the degree of Master of Science in
Engineering.
Phalaborwa, 24 May 2018

1
DECLARATION
I, Johannes Jacobus Bezuidenhout, declare that this Project Report is my
unaided work. No other person’s work has been used without due
acknowledgement in the main text of the Project Report. The information
used in the Project Report has been obtained while employed by Palabora
Mining Company. It is submitted in partial fulfilment of the requirements
for the degree of Master of Science at the University of the Witwatersrand,
Johannesburg. It has not been submitted before for any degree or
examination at any other university.
_______________________________
(Signature of Candidate)
________day of ___________________20____in__________________

2
ABSTRACT:
The renowned PMC’s copper open pit operation transitioned from surface
copper operations to an underground operation in 2002. An exploration
shaft from within the open pit, having an exploration tunnel below the open
pit bottom served ideally for downward resource exploration drilling.
Palabora Underground Mining Project was a first to cave in very
competent lithology rock types which utilised the crinkle cut method at its
undercut level. Unfortunately, the inadequate underground exploration
drilling limited the resource classification and confidence levels, having
inadequate drilling to represent the vast footprint block cave area.
Consequently, the head grade and the modelled grade required annual
revisions. The head grade and modelled grades diverted from each other
more than once, despite all the numerous studies with minor and
significant model improvements. The block model refinements included
adjustments made to the block sizes, draw column alignments with blocks
and additions such as the dolerite dilution representation within blocks.
The resource model revision pointed firstly to the grade change between
the mill grades and predicted modelled grade, and secondly to the
identified geometric change and rectification thereof. Significant technical
studies refined the resource model to satisfactory levels of confidence.
However, the elusive cave behaviour encouraged more studies and
refinements as new information became available over time. The copper
open pit’s north wall failure occurred in 2004, and this failure material
contributed to significant resource losses. The importance of the many
approaches and models which predicted or assumed the possible block
cave’s life after the failure characterises the PMC block cave uniquely.
Some of the significant studies over time, encapsulated in this project
report sketch a realistic timeline of the copper block cave at Palabora
Mining Company. The initial resource losses became somewhat
redeemed during the 2015 study where some of the copper gains were
within the failure’s glacial flow, and not from the likely toppling effect which
injected some additional years to the life of mine.

3
Dedicated to:
Janco, Luan, & Caleb Bezuidenhout

4
ACKNOWLEDGEMENTS
The excellent guidance and very patient support from the supervisors, Prof
Dick Minnitt and Prof Thomas Stacey are gratefully acknowledged.
Grateful acknowledgement is extended to Dr Tony Diering for his technical
support and assistance. It was a great experience to have worked in close
relationship with such excellent professionals.
The long hours of research and writing were much more comfortable with
the encouragement, friendship, and input from colleagues and peers at
PMC. Sam Ngidi is especially acknowledged, for his guidance,
leadership, and support throughout 2017. Lastly, a word of gratitude to
Angelique Kriel for her support during this project.
The opportunity and permission to use portions of material contained in
this Project Report are gratefully acknowledged. The opinions expressed
are those of the author and may not necessarily represent the policies of
the companies mentioned. While recognising the valuable contributions of
the preceding people, the author alone is responsible for any errors,
omissions, and ambiguities remaining in this project report.

5
CONTENTS PAGE
DECLARATION 1
ABSTRACT: 2
ACKNOWLEDGEMENTS 4
LIST OF FIGURES 8
LIST OF TABLES 11
NOMENCLATURE 12
1 INTRODUCTION 14
Overview 14 1.1
Purpose of the study 14 1.2
Research background 16 1.3
Problem statement 20 1.4
Research objectives 21 1.5
Summary of section 1 and structure of the report 22 1.6
2 LITERATURE REVIEW 23
Introduction 23 2.1
Block caving principles 24 2.2
Conceptual and numerical modelling, with empirical predictions 29 2.3
Material flow and the modelling thereof 33 2.4
The impact of poor fragmentation on cave management 36 2.5
Early physical model studies and computer software 38 2.6
Palabora Mine, a unique block cave mine 39 2.7
Crown pillar failure of the PMC open pit in 2004 40 2.8
The influence of major fault zones at Palabora Mine 41 2.9
Back analysis of the Palabora Mine’s caving behaviour in 2008 43 2.10
Micro-seismic analysis between the block cave and the pit slopes 45 2.11
Fracture banding in caving mines 47 2.12
The PMC open pit slope failure and its impact on the resources 48 2.13
Toppling theory at Palabora Mine and the dilution envelope 53 2.14
Conclusion 55 2.15
3 PMC HISTORY AND THE MINERALISATION OF PMC 56
Introduction 56 3.1
Lithology densities and empirical stability relationship 57 3.2
Mineralisation 59 3.3
Mineral resources and reserves background 59 3.4
Mining method 60 3.5
Underground loading and crushing 61 3.6
Underground sampling in Lift 1 at PMC 61 3.7
6
Geological results and exploration drilling at PMC 63 3.8
Plant and head grade sampling description 64 3.9
Conclusion 67 3.10
4 CREATING A TIMELINE FOR THE PMC RESERVE STUDIES 67
Introduction 67 4.1
Resource grade studies and reports on PMC’s block cave mine. 68 4.2
The basis of initial SRK studies in 2002 and Howson in 2003 68 4.3
Analysing and updating Palabora’s geological databases 70 4.4
Identified software limitations (2003) and required upgrades 71 4.5
Critical early revision of Lift 1’s resource model 73 4.6
Initial grade shortfall indicators 74 4.7
Conclusion 75 4.8
5 NEW MILLENNIUM SOFTWARE AND SYSTEM CHALLENGES 76
Introduction 76 5.1
Converting Datamine folders and models 76 5.2
The 2004 resource model revision 77 5.3
Transformation of coordinate systems 77 5.4
Misaligned draw points and draw columns 78 5.5
A summary of the different created models 79 5.6
Draw point production figures 88 5.7
Conclusion 91 5.8
6 THE GRADE RECONCILIATION STUDY (2004-2005) 91
Introduction 91 6.1
Mill production Cu grades versus mucked Cu grades from the model 91 6.2
Grades through time 92 6.3
Reserve estimations and reserve classification (2004-2005) 95 6.4
Reasons for lower than expected copper grades 99 6.5
Summary for the grade discrepancy 99 6.6
Hypotheses concerning the FS copper estimation 100 6.7
Hypotheses not concerning the FS copper estimation 104 6.8
Conclusion 105 6.9
7 THE RE-ESTIMATION OF COPPER GRADES 106
Introduction 106 7.1
Analysis of length versus grade 106 7.2
Distribution analysis 107 7.3
The 2005 ordinary kriging without grade zoning 110 7.4
Re-estimation using multiple indicator methods 110 7.5
Comparison of estimates 111 7.6
Conclusion 115 7.7

7
8 PMC HEAD GRADE AUDIT JULY 2010-2011 118
Introduction 118 8.1
Methodology used 119 8.2
Geological evidence supporting the drop in head grade 121 8.3
The resource estimation 124 8.4
Mining audit 130 8.5
Findings on the plant head grade sampling 138 8.6
Conclusion 139 8.7
9 REVIVING THE 2015 RESOURCE MODEL 140
Introduction 140 9.1
The resource copper grade investigation 141 9.2
Modelling of the failure zone and the estimated glory-hole position 142 9.3
The concept of failure study 144 9.4
The glacier flow concept 149 9.5
Conclusion 153 9.6
10 CONCLUSION 154
11 RECOMMENDATION 157
12 REFERENCES 158

8
LIST OF FIGURES
Figure 1: Phalaborwa locality plan 17
Figure 2: Palabora igneous complex 18
Figure 3: Palabora Mine undercut design for Lift 1 24
Figure 4: Block caving stages and principles 26
Figure 5: Drawbell establishment 28
Figure 6: Advanced undercut establishment section 28
Figure 7: Representation of the cave draw ellipsoid 29
Figure 8: PFC3D
sublevel caving and the REBOP block caving simulations 30
Figure 9: Conceptual model of caving 31
Figure 10: Main behavioural regions of a propagating cave 32
Figure 11: Palabora carbonatite stress-strain response tests 33
Figure 12: Different components of the slice file 35
Figure 13: Typical flow mechanisms in a block cave 35
Figure 14: PMC Lift 1 fragmentation composition 36
Figure 15: PMC Lift 1 percentage rock types 37
Figure 16: PMC Lift 1 fragmentation analysis 2006 37
Figure 17: The crown pillar between the open pit and cave 40
Figure 18: A numerical simulation of the cave breakthrough at PMC 41
Figure 19: Major fault zones at PMC 42
Figure 20: Mica fault in 3D 43
Figure 21: The Palabora pit failure mechanism reproduced by the SRM-UJRM 44
Figure 22: Development of the pit slope-failure mechanism over production time 44
Figure 23: Historical mining record at the Palabora block cave mine 45
Figure 24: Micro-seismic events recorded at PMC 46
Figure 25: Reserve losses indicated as remnant shoulders 50
Figure 26: Evolution of the north wall failure (north-west view) 53
Figure 27: Toppling effect at Palabora Mine 54
Figure 28: PMC’s Lift 1 hydraulic radius shown in red 58
Figure 29: Palabora block cave mining layout 60
Figure 30: PMC samplers bag a 20 kg grab-sample in a draw point 62
Figure 31: Average tonnes between the last five samples 63
Figure 32: West – East profile showing relative positions of drill-hole types 64
Figure 33: A Multotec sampler used for sampling the head grade at PMC 66
Figure 34: Flow sheet of the underground stream with sample cutters 66
Figure 35 - Summary of the resource model revision 74
Figure 36: Footprint design indicating draw points 79
Figure 37: The FS grade model and Cu grade values 80
Figure 38: The FS dolerite model and resulting copper grades at – 800 m elevation. 81

9
Figure 39: The dolerite dilution of the FS copper grades 82
Figure 40: Mapped dolerite dykes versus the NDM tin envelopes 83
Figure 41: The dolerite diluted copper grades in the DBM model 85
Figure 42: Copper percentage x 100 grades from the DCM at level –795m 86
Figure 43: Copper percentage x 100 grades from the DCM at level –745m 86
Figure 44: Copper percentage x 100 grades from the DCM at level –695m 86
Figure 45: Variation in dolerite and copper grades with elevation for all draw columns 87
Figure 46: Production figures in kilotons from the start of caving until 12 January 2004 88
Figure 47: 1 Kilotonne LHD operator lashing inputs from 13 to 30 January 2004 89
Figure 48: Model-estimated dolerite and copper grades for the dolerite trail period 90
Figure 49: Smoothed ROM vs estimated copper grades through time 93
Figure 50: Smoothed ROM vs estimated dolerite grades through time 94
Figure 51: Smoothed ROM vs estimated undiluted copper grades through time 95
Figure 52: A 3-D image of the block caving reserve volume 97
Figure 53: The mineralisation is of a very coarse nature 101
Figure 54: Density versus copper % in samples below -200 m elevation 103
Figure 55: Composite length vs average copper %, for all composites below -200 m 107
Figure 56: Log-probability cumulative frequency of Cu in 9 m comps below -200 m 108
Figure 57: Log-probability cumulative frequency of Cu in 9 m comps below -200 m 108
Figure 58: Log-probability cumulative frequency of Cu in 9 m comps below -200 m 109
Figure 59: Change in variogram range with indicator threshold 111
Figure 60: Comparison of various grade estimations by level 112
Figure 61: Daily production ROM vs estimated copper grades 113
Figure 62: Daily production ROM vs estimated copper grades 5-day average 114
Figure 63: Mill / Model ratio for copper % grades using 5-day averages 114
Figure 64: Mill / Model ratio for “Undiluted copper” grades using 5-day averages 115
Figure 65: Comparison of production copper grades with predicted FS grades 116
Figure 66: Comparison of production copper and mill grades using the MISK model 117
Figure 67: Grade comparison between PCBC and the geological block model 119
Figure 68: Level slicing of drill-hole data and copper percentage 123
Figure 69: North-South section showing drill-holes at PMC 126
Figure 70: North-South section of the underground production level - draw height 127
Figure 71: Level slicing of drill-hole data 128
Figure 72: Percentage difference between the head grade and PCBC grade 132
Figure 73: Head grade and PCBC grade comparison 132
Figure 74: Percentage oversize (>2 m) tonnes for the run of mine 134
Figure 75: The fragmentation and grade as experienced by PMC production 134
Figure 76: Tonnes mined per crosscut versus the dolerite percentage 136
Figure 77: Tonnes drawn per crosscut versus grade per crosscut 137

10
Figure 78: The cyclone overflow quality-control standard & head grade per month 139
Figure 79: Quarterly indicative modelled grades from PCBC 141
Figure 80: Successive views of the open pit failure 143
Figure 81: The top of the cave and demarcated glory-hole position 143
Figure 82: Top of cave superimposed over the draw points 144
Figure 83: Views of the failure area floor 144
Figure 84: Concept of failure zones 145
Figure 85: The before and after failure zone evaluated 145
Figure 86: Straight-line depletion graph for Lift 1 146
Figure 87: The failure volume modelled within PCBC 147
Figure 88: Reshaping the Lift 1 cave profile from indicated parameter adjustments 147
Figure 89: The modelled Cu grade versus the reported grade 148
Figure 90: Deficiencies determined from the PCBC run and study 149
Figure 91: Glacier formation dynamics 150
Figure 92: Inclined draw cones 151
Figure 93: Adjustment of the draw cone positions at the top of the cave 151
Figure 94: Concept model of modelled draw cones and variable cave back 152
Figure 95: PCBC modelled and forecasted grades 152

11
LIST OF TABLES
Table 1: Effect of dilution and ore loss on mine economics - Source: (Steffen & Kuiper,
2011) 48
Table 2: Mineable tonnes status per year 51
Table 3: Rock Strengths - Source: (PMC, 2007) 57
Table 4: Rock mass and caved rock properties - Source: (Severin & Eberhardt, 2012) 57
Table 5: Raw data received from the mine - Source: (Snowden, 2010) 125
Table 6: PCBC input parameters - Source: (Snowden, 2010) 133

12
NOMENCLATURE
AM Autogenous Mill
BCF Block Cave Fragmentation
BCB Banded carbonatite
CFZ Central Fault Zone
Cu Copper
CP Competent Person
CPR Competent Person’s Report
3DEC A three-dimensional numerical modelling code
DBM Draw block Model
DCM Draw column Model
DFN Discrete Fracture Network
FS Feasibility Study
FLAC3D Fast Lagrangian Analysis of Continua - Modelling software code using flags by specific algorithms
GEMCOM Geology mine Software package (GEMS) by GEOVIA Incorporated & Dassault Systèmes
GEOVIA Dassault Systèmes Geovia Inc.
HIZ Height of Interaction Zone
HOD Height of Draw
HP UNIX Hewlett Packard Unix operating system based on UNIX System V
ICS International Caving Study
IRMR Intact Rock Mass Rating
ITASCA Itasca Consulting Group International
JORC Australian Joint Ore Reserves Committee
JSE Johannesburg Stock Exchange
km kilometre
KNP Kruger National Park
LHD Load Haul Dumper
Lift 1 Lift one – First lift mine below the open pit (noun)
Lift 2 Lift two – Second lift mine below the first lift mine (noun)
LOM Life Of Mine
LO Longitude of Origin
mm Millimetre
MineCad Mining Computer-aided draughting software
MIK Multiple Indicator Kriging
MISK Multiple Indicator Simple Kriging
MIOK Multiple Indicator Ordinary Kriging
MPa Megapascal
MRMR Mining Rock Mass Rating

13
NNWSO North-northwest Structural Orientation
OK Ordinary Kriging
PC Personal Computer
PCBC Geovia Personal Computer Block-Cave software supplied by Dassault Systèmes
PFC3D Particle Flow Code - 3 Dimensional
PMC Palabora Mining Company Pty. (Ltd).
PUMP Palabora Underground Mining Project
QAQC Quality Assurance, Quality Control
REBOP Rapid Emulator Based on PFC3D
ROM Run of Mine
S.A. South Africa
SAMREC South African Code for the reporting of exploration results, Mineral Resources and Mineral Reserves
SRK Consultancy company
SRM Synthetic Rock Mass
Snowden Snowden Mining Industry Consultants
SWFZ Southwest Fault Zone
TCB Transgressive carbonatite
Tpd Tonnes per day
Tpa Tonnes per annum
TDR Time Domain Reflectometry
UCS Unconfirmed Compressive Strength
UJRM Ubiquitous Joint Rock Mass
14
1 INTRODUCTION
Overview 1.1
This section gives an overview of the purpose of the study, the
background and geological setting, and justification of the project report.
This section lays the foundation for what one can expect in the report,
what will be determined, investigated, not attempted, and what the project
report would analyse and ultimately achieve.
Purpose of the study 1.2
The project report serves as personal gaining knowledge of block cave
mining in general and at Palabora Mining Company (Pty) Limited, (PMC).
The PCBC (Personal Computer Block-cave software) resource model
grade indicated a slightly higher-grade value than the head grade until
June 2005. From June 2005 until June 2008, the PCBC and the head-
grade followed each other within reasonable limits. After June 2008, the
PCBC grade indicated higher values than the head-grade, which resulted
from periodic resource reviews and the actual mined draw points over
time. The higher resource grade value resulted from inadequate drilling
information since the FS and caused an overestimation of the resource
grades. Within the Palabora block cave, the material flow remained
unknown, since Lift 1 only had ‘Time Domain Reflectometry’ (TDR) cables
for cave monitoring devices. When the head grade and the sampling
grade separated, required investigations attempted to solve the reasons
for such occurrences. PMC did not expect the grades to separate and the
lack of drilling information contributed to the elusiveness of the block cave
and its grade behaviour. Little knowledge existed on the change in PCBC
grade or head-grade and especially the inverse of these two grades
regarding high and low-grade occurrences. PMC resorted to the best
current known facts at the time and attempted resolutions in the form of

15
amendments within the PCBC flow parameters and resource cave-back
specifications to equalise the modelled grade and head-grade.
The purpose of the study is to determine whether the copper resources at
PMC’s block cave is managed adequately, despite the elusive grade
behaviour noticed over time. The project report will review past grade
behaviours from previous reports and studies at Palabora Mine. This
study will furthermore investigate possible trends in the model’s grade
behaviour and discuss the more recent hypothesis of a glacier slide at the
slope failure.
The study aims to seek insight into the lower planned grade and
unexpected higher sampled grades at the mature stage of the block cave
mine nearing its end of life. The previous modelling of the resources, the
block sizes, block spacing, kriging from drill samples, and grab sampling
methods received in-depth audits and endured detailed studies.
However, the study will not aim to re-invent the sampling methodology or
repeat the work already done on the resource model. Significant studies
and information are available on these findings and justify such
adjustments made over the cave’s first lift (Lift 1) historical timeline since
production started. Alternatively, the project report will review the
historical trends and possible errors occurring, interpret previous reports
and identify any significant constraints experienced. Apart from all the
previously conducted studies, this project report will elaborate on
additional conducted work during the expected life of mine ending phase,
or rather the ending of the Lift 1 block cave.
This project report examines the significant historical grade differences
between reporting ores at draw points, while the resource model estimates
indicated critical anomalies. The project report summarises previous
applicable studies conducted between 2003 and 2012, at the complicated
copper block cave mine of PMC. The study will examine additional work

16
done during 2015, where another grade anomaly occurred in a challenging
economic setting.
This project report would merge old and new knowledge of PMC regarding
the management of its resource grades and grade predictions. The PMC
copper resource model endured several refined alterations from the
elusive behaviour within the unknown block cave environment. This
project report forms an ongoing study as more information becomes
systematically available over time. The project report will ultimately be a
forward-looking summary for the second lift’s (Lift 2) block cave mine. It is
likely that similar trends between Lift 1 and Lift 2 may occur and PMC may
need to respond pro-actively to anomalies between the actual ore grades
and the resource grade. This report summarises historical work, studies,
events, and findings in a compact guide, especially available for PMC.
Research background 1.3
Palabora Mining Company (PMC) is located approximately 500 km from
Johannesburg, in the Limpopo province. The mine is in operation since
1966, and most employees reside in the town of Phalaborwa and
surrounding villages, Namakgale, Lulekani, Makushane and,
Mashishimale. All of these villages form part of and fall within the broader
Bha-Phalaborwa municipality. PMC historically mined 30 000 tonnes per
day and produced 62 000 tonnes of copper metal per annum. Continuous
improvements and modifications resulted in production rates to increase to
82 000 tonnes per day and 135 000 tonnes of copper product. The open
pit operations ceased in April 2002, during which the development of the
underground block cave mine was progressing (Snowden, 2010). In
Figure 1 below, the mine borders the Kruger National Park (KNP), and
hosts various wildlife animals, who can freely roam between the
operational areas and the KNP.

17
Figure 1: Phalaborwa locality plan
Source: (PMC, 2016)
Geological setting 1.3.1
Within the Phalaborwa area, an underlain Archaean granite occurs
containing remnants of profoundly altered sedimentary, basic rock, and
schistose rock of the “Basement Complex”. Twenty kilometres west of the
copper deposit, a younger porphyritic granite intrusion occurs which is
known as the Palabora Granite massif. The Palabora Alkali Complex is
intrusive into the Archaean granite, and the alkali phase consists of
numerous “plug like” intrusions of syenite. Occurring pyroxenite consists
of pale green diopside and varying amounts of phlogopite, biotite, and
apatite surrounded by a rim of felspathic pyroxenite, but remain separated
from the enveloping Archaean granite via an irregular fenite zone. Two
subsidiary pipes; serpentine-phlogopite-pegmatoid and the copper-bearing
deposit known as the Loolekop orebody occur nearer to the centre of the
major pipe (Kuschke & Tonking, 1971).
Historical records and studies indicate that an active alkaline volcano
dating back 2047 million years formed the kidney-shaped Palabora
igneous complex. The dimension of the complex is 6.5 km from north to
south and 3.2 km from east to west (Snowden, 2010).
The elliptically shaped orebody is vertical, and elongated in an east-west
direction, with physical dimensions of 650 m x 300 m. Three central fault

18
zones are running through the ore body in E-W, NW-SE and N-S
orientations. It is a composite intrusion with the age sequence from
foskorite, banded carbonatite, and transgressive carbonatite, which all
intruded in a concentric inter-banded structure. Karoo age dolerite dykes
cut through the orebody in an SW-NE direction, illustrated in Figure 2
(Snowden, 2010).
Figure 2: Palabora igneous complex
Source: (Snowden, 2010)

19
Within the core of the complex, a vertical composite intrusion known as
the Loolekop pipe formed in a concentric arrangement of foskorite around
it and with a core of banded carbonatite. The complex consists mainly of
phlogopite and apatite rich pyroxenite (Snowden, 2010).
Historically PMC experienced a substantial lower head grade from the
planned resource model grade (Howson, 2003). Howson (2003) listed
several reasons for the grade shortfall and produced a required sampling
campaign in 2003. One fundamental problem listed was too little drilling
information for the Lift 1 block cave, resulting in a resource model with low
confidence and errors. A more practical solution presented within
Dassault Systemés GEOVIA software, which provided geological
modelling, mining engineering, and survey application packages. This
software formerly known as GEMCOM used to be an international geology
platform in the mining industry. Howson (2004) proposed to have the
PMC’s geological data, resource and reserve models revised. Howson’s
proposal entailed the importing of existing models and data from Datamine
into GEMCOM software (Howson, 2004a).
Apart from the initial adoption of the GEMCOM software by PMC, Dr Tony
Diering contributed his programming skills to assist in writing software
algorithms for PCBC. PCBC was a standard industrial block cave
scheduling system, which motivated draw compliance and scheduling
improvements at PMC. Howson (2004) also recommended an intensive
sampling program to ensure the correlation between results and estimates
maintain their current position. The PCBC results indicated similar
overestimated resource model results, like the previous model’s indication,
even after the introduction of the new software. At the time, the current
sampling methods identified by Howson (2004) could also improve the
grade management going forward. Several studies conducted at PMC
and abroad by many consultants reviewed the anomalies found over the
LOM, of which some discussions follow in this project report.

20
The reconciliation of the resource block model changed from very low-
grade values in failure material to actual sampling values from the open pit
bottom benches. The analysis and revision of the failed material with
actual bench samples resulted in a practical dilemma to get the data
imported into GEMCOM (Howson, 2006). The revised results were not
acceptable yet, and alternative approaches to the mixing parameters in
PCBC required further analysis. This analysis and investigation produced
acceptable errors but required additional refinement. However, the
resource of the block cave remained a dilemma for PMC but became
manageable with more data over time (Howson, 2006).
Problem statement 1.4
The Lift 1 block cave of PMC had very little drilling data available to ensure
confidence in the resource model. The modelled resource grade and the
head grade separated during 2015 while the cave consequently yielded a
higher sampled ore grade, and a contrary expected lower resource model
grade. PMC expected a lower grade from the resource model’s indicative
LOM, while cave mining was nearing the end of its life. This separation in
grades required further analysis since the actual sampled grade reflected
higher than the expected values (Howson, 2006).
The continuous revision of the resource grade model, conducted through
continual additional information becoming available over time, should
indicate the importance of understanding and correct interpretation of the
PMC block cave’s grade.
The required analysis and understanding of the unexpectedly higher head
grade became significant in the currently depressed copper market. The
situation influenced the progress of the Lift 2 project to deepen the PMC
block cave mine. This unexpected higher head grade meant that a couple
of years of life would add more production to the anticipated “2015” end of
Lift 1 production. It remains uncertain on when the cave’s grade will finally
drop below the economic viability of mining the Lift 1 ore. Thus it was

21
critical to demonstrate confidence in the improved head grade for financial
reasons as this could decrease the “copper gap” period the mine
expected. The “copper gap” is the time between a stoppage in copper
production while the Lift 2 block cave remained in the development
blasting phase without current possible copper production. The copper
mining operations mined copper during the simultaneous development
expansion of the future Lift 2 mine. The resource model indicates the
projected LOM and when the drop in copper grades beyond the economic
pay limit would indicate a stop in production. Hence, the reviewing of the
resource model remained critical to PMC’s planned production, and the
sustainability of the mine’s vision to produce copper beyond 2030.
Accurate information would play a significant role in the mining of Lift 2
since the refinement of the Lift 1’s resource model would ultimately affect
Lift 2 situated directly below Lift 1.
The study will seek to prove whether the Lift 1 resource model of PMC’s
copper block cave followed an adequate management and control strategy
to counter the variation between the head grade and resource grade over
its life.
Research objectives 1.5
The annual revision of the resource model and each previous study
refined the resource model to a certain degree only. An optimal
developed resource model or final resource model was not practically
achievable, but lessons learned from this study will be beneficial to the
sustainability of the mine beyond 2030. The study aims to build
shareholder confidence from work conducted by the technical teams.
The project report focusses on the anomalies and historical variations in
grade at PMC’s copper block cave operation. The report considers
previous investigations into grade variations, appropriate adjustments and
recommendations concerning the resource model and resource grade.
22
The study will analyse and investigate any significant PCBC parameter
adjustments required to correlate the yielding sampled ore grade versus
the lower predicted resource model grade PMC experienced. These
parameters include the average annual volume of surface ingress material
into the Lift 1 block cave. This study will investigate essential omitted
factors which previously compromised the “fully comprehensive” Howson
(2006) resource model, and identify future improvements from the findings
obtained.
The study will investigate the following questions:
What were the leading historical indicators for the grade shortfall at PMC’s
block cave mine?
Which constraints did the software and dolerite modelling impose on
resource model at PMC’s block cave mine?
What was the correlating grade variations and contributing factors during
the LOM?
What influenced the head grade to sustain beyond the predicted LOM of
Lift 1?
Summary of section 1 and structure of the report 1.6
By mining the PMC block cave to the optimal grade through strict planning
and an efficient draw control strategy, produced copper head grades
entirely different from what the mine expected over time. PMC annually
reviews the resource grade model producing an optimal plan for draw
point copper grades to match the annual budget plan. A particular review
was required in 2015 to optimise the draw compliance for the expected
last months of the first Lift’s life, nearing its end of production capacity.
PMC consistently consulted with Dr Tony Diering, having expert
knowledge on the PMC block cave and PCBC software. This project
report will cover some of the analysis and practical application of Diering’s
2015 findings and PMC visit.

23
Structure of the Project Report
This section has justified the research work and defined the problem
statement. Section 1 provides a background of the report and includes the
objectives of the report.
Section 2 provides literature for block caving mining terminology and
principles and reviews papers written for Palabora’s block cave mine.
Section 3 discusses the physical and geological tenure of Palabora Mine.
Section 4 discusses the timeline of the conducted studies for Palabora
Mine’s resources between 2002 and 2003.
Section 5 describes the data retrieval process from old computer systems
and the transferral of this data into more recent and reliable systems.
Section 6 discusses the grade reconciliation study conducted between
2004 and 2005.
Section 7 focuses on the required re-estimation of the copper grades
during 2005.
Section 8 reviews the 2010 PMC head grade audit as was conducted by
the SRK consultancy group.
Section 9 discusses the grade diversion and resource model in 2015 and
describes different approaches taken on the north wall failure. The
sustaining head-grade indicated higher-grade values than what the
resource model reflected.
2 LITERATURE REVIEW
Introduction 2.1
The literature review provides an overview of relevant block caving
aspects, which are relevant to the PMC copper block cave having a slope
failure in the pit overlying the caving operation. This section will discuss
block cave mining principles and will give a good general indication of
terminology used in block caving, enabling the reader to understand the
block caving complexity from a novice perspective. This section also
includes a review of other papers written especially for PMC and
applicable mines despite PMC’s uniqueness.

24
Block caving principles 2.2
This section of block caving principles is aimed at readers not familiar with
block caving, block caving terminology, and elaborates in more detail on
the topic.
The extraction level refers to the production level, where ore from draw
points is withdrawn and feeds from the undercut level vertically above it.
The crinkle cut design was a world first in undercutting and implemented
at Palabora’s Lift 1 block cave (Moss et al., 2006). In Figure 3
below, the illustration indicates the crinkle cut design for the undercut level
at Palabora Mine from a side view perspective.
Figure 3: Palabora Mine undercut design for Lift 1
Source: after (Calder et al., 2000)
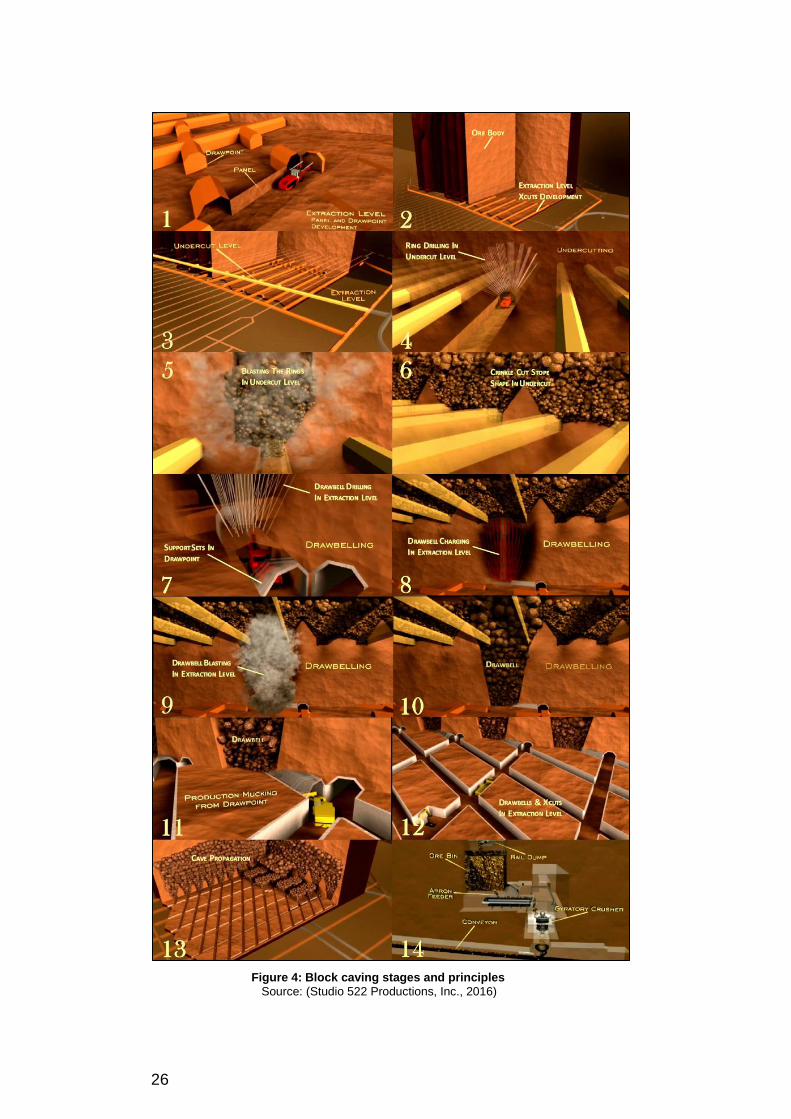
In Figure 4, fourteen collage diagrams indicate block-caving development
stages and portray details regarding the extraction level, undercut level,
draw bells, cave propagation, and the crown pillar.
The collage diagram 1 (Figure 4), shows a drill rig drilling the development
face at the extraction level. Collage diagram 2 indicates how development
crosscuts are penetrating the orebody from the one side of the vertical ore

25
body, to the other side, ultimately linked by perimeter tunnels.
Approximately fifteen to eighteen metres above the extraction level as per
diagram 3, the undercut level development comprises of two adjacent
crosscuts for each extraction level crosscut. In collage diagram 4, 5 and
6, the undercut is ring blasted to form the continuous collapsing zone. The
undercut corresponds to the caving initiation through the continuous
creation of a broken rock zone at the base of the block cave. The
undercut generates instability through gravity and stress allowances,
acting in the rock mass, which sustains the next stage of cave propagation
(Fernandez et al., 2010). Continuous mucking of the swell formed by the
collapsed material is part of the undercutting process. The undercut is
staggered to create panels in a sawtooth shape. This shape of the
undercut is a precise scheduled blasting process and used to manage
underground stress levels via the leading and lagging panels.
In the collage diagram, 7 – 10, the draw-bell drilling in the extraction level,
the charging of holes with explosives and blasting thereof forms a bell-
shaped cavity. The draw bell bleeds rock from the undercut level into the
draw points of the extraction level through gravity, where ore mucking by
load and haul machines muck material as per diagram 11 and 12.
Diagram 13 indicates the “footprint” of the establishing extraction level with
various draw bells and draw points following behind the development of
the tunnels, while the cave propagates upwards from undercutting. During
the undercutting and development phases, continuous mucking and
hauling of the swell, known as production to the underground crushers
takes place. The crushed size ore, tips onto conveyor belts to reach the
surface. The conveyor belts at some mines tip ore in bulk silos near the
shafts, where hoisting via skips in the shafts takes the material to the
surface (Studio 522 Productions, Inc., 2016).
26
Figure 4: Block caving stages and principles
Source: (Studio 522 Productions, Inc., 2016)

27
The block cave-optimisation paper by Steward et al. (2010) discussed the
optimal position of the footprint in a block, the draw-bell establishment,
and caving parameters (Steward et al., 2010). Some of these parameters
include production rate, cut-off grades, and the extraction level position.
The extraction level layouts found commonly in block-cave mines are the
El Teniente (straight through), the Henderson (Z-shaped), or Herringbone
shapes. The illustrations in Figure 5 show the latter Herringbone shaped
extraction level design (Chitombo, 2010). This illustration indicates a plan
view of the extraction level, draw point spacing with a superimposed
undercut level and a typical draw bell establishment, with applicable
sections A-A’ and B-B’ through it. PMC implemented both the
Herringbone extraction level shape and the crinkle-cut shape for
undercutting within Lift 1, as per the illustration’s section A-A’ below.

28
Figure 5: Drawbell establishment
Source: (Steward et al., 2010)
Figure 6 indicates the Ridgeway Deeps project with its advanced
undercutting strategy layout, having a spaced draw bell dimension of 30 m
x 18 m, and 18 m between the extraction and undercut level (Dunstan &
Popa, 2012). The PMC Lift 1 block cave has similar dimensions, and the
same cave layout, which Ridgeway Deeps project adopted after PMC.
Figure 6: Advanced undercut establishment section
Source: (Dunstan & Popa, 2012)
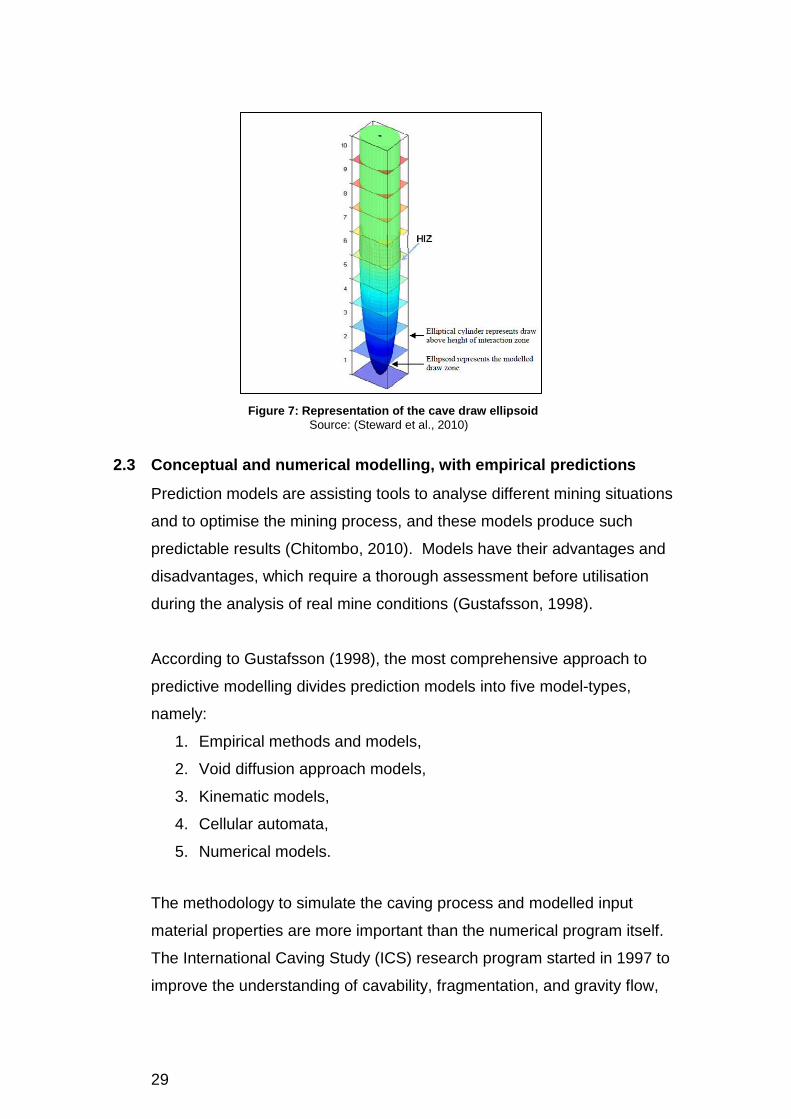
The height of interaction zone (HIZ) of each draw bell indicated in Figure 7
represents the shape of the individual draw zones and incremental
sections of ore recovery above it.
29
Figure 7: Representation of the cave draw ellipsoid
Source: (Steward et al., 2010)
Conceptual and numerical modelling, with empirical predictions 2.3
Prediction models are assisting tools to analyse different mining situations
and to optimise the mining process, and these models produce such
predictable results (Chitombo, 2010). Models have their advantages and
disadvantages, which require a thorough assessment before utilisation
during the analysis of real mine conditions (Gustafsson, 1998).
According to Gustafsson (1998), the most comprehensive approach to
predictive modelling divides prediction models into five model-types,
namely:
1. Empirical methods and models,
2. Void diffusion approach models,
3. Kinematic models,
4. Cellular automata,
5. Numerical models.
The methodology to simulate the caving process and modelled input
material properties are more important than the numerical program itself.
The International Caving Study (ICS) research program started in 1997 to
improve the understanding of cavability, fragmentation, and gravity flow,
30
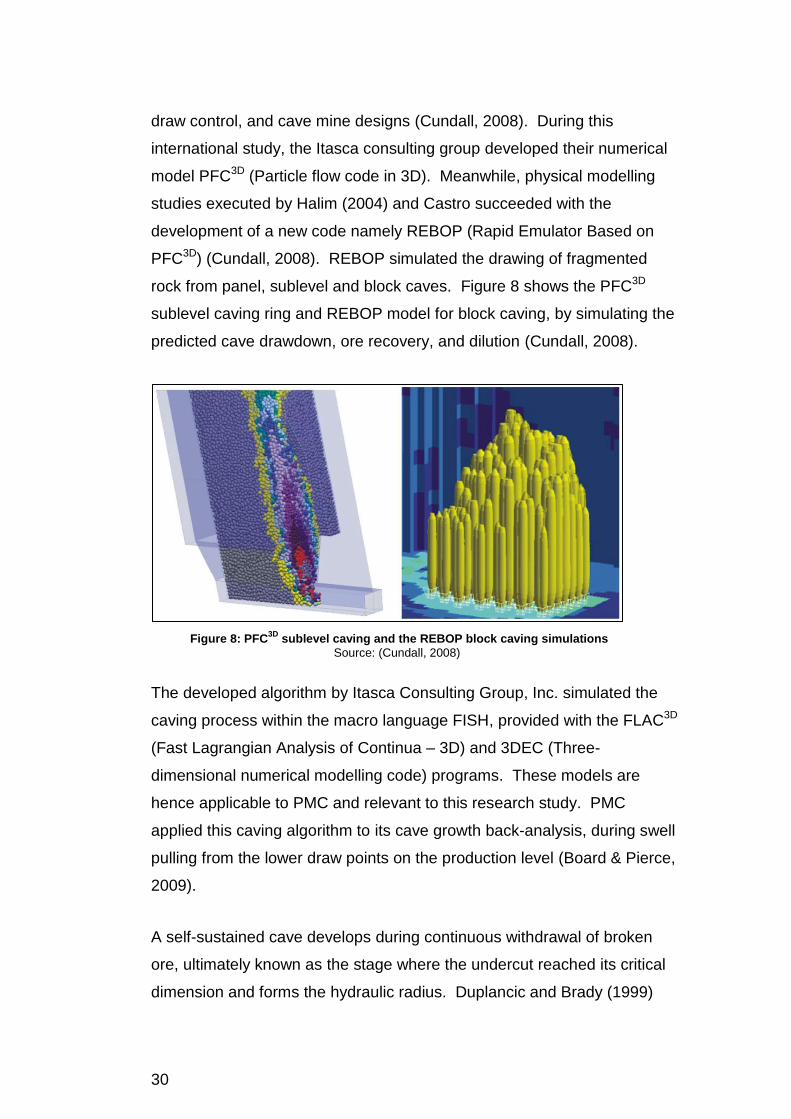
draw control, and cave mine designs (Cundall, 2008). During this
international study, the Itasca consulting group developed their numerical
model PFC3D (Particle flow code in 3D). Meanwhile, physical modelling
studies executed by Halim (2004) and Castro succeeded with the
development of a new code namely REBOP (Rapid Emulator Based on
PFC3D) (Cundall, 2008). REBOP simulated the drawing of fragmented
rock from panel, sublevel and block caves. Figure 8 shows the PFC3D
sublevel caving ring and REBOP model for block caving, by simulating the
predicted cave drawdown, ore recovery, and dilution (Cundall, 2008).
Figure 8: PFC3D
sublevel caving and the REBOP block caving simulations
Source: (Cundall, 2008)
The developed algorithm by Itasca Consulting Group, Inc. simulated the
caving process within the macro language FISH, provided with the FLAC3D
(Fast Lagrangian Analysis of Continua – 3D) and 3DEC (Three-
dimensional numerical modelling code) programs. These models are
hence applicable to PMC and relevant to this research study. PMC
applied this caving algorithm to its cave growth back-analysis, during swell
pulling from the lower draw points on the production level (Board & Pierce,
2009).
A self-sustained cave develops during continuous withdrawal of broken
ore, ultimately known as the stage where the undercut reached its critical
dimension and forms the hydraulic radius. Duplancic and Brady (1999)

31
described a conceptual model of the developing cave, having four central
behavioural regions, as Figure 9 indicates.
Figure 9: Conceptual model of caving Source: (Duplancic & Brady, 1999)
The pseudo-continuous domain defines the host rock mass around the
caving region which behaves elastically. Duplancic & Brady (1999)
reported that the rock mass properties and behaviour are likely to be
undisturbed. The seismogenic zone is a micro-seismic discontinuity zone,
having newly initiated fractures. The yielded zone is a fractured zone
where some or all-cohesive rock strengths lose all its support relative to
the overlying rock mass. The caved zone or mobilised zone comprises of
detached rock blocks from the rock mass. The detached rock blocks
move towards the draw points due to drawing or mucking of ore
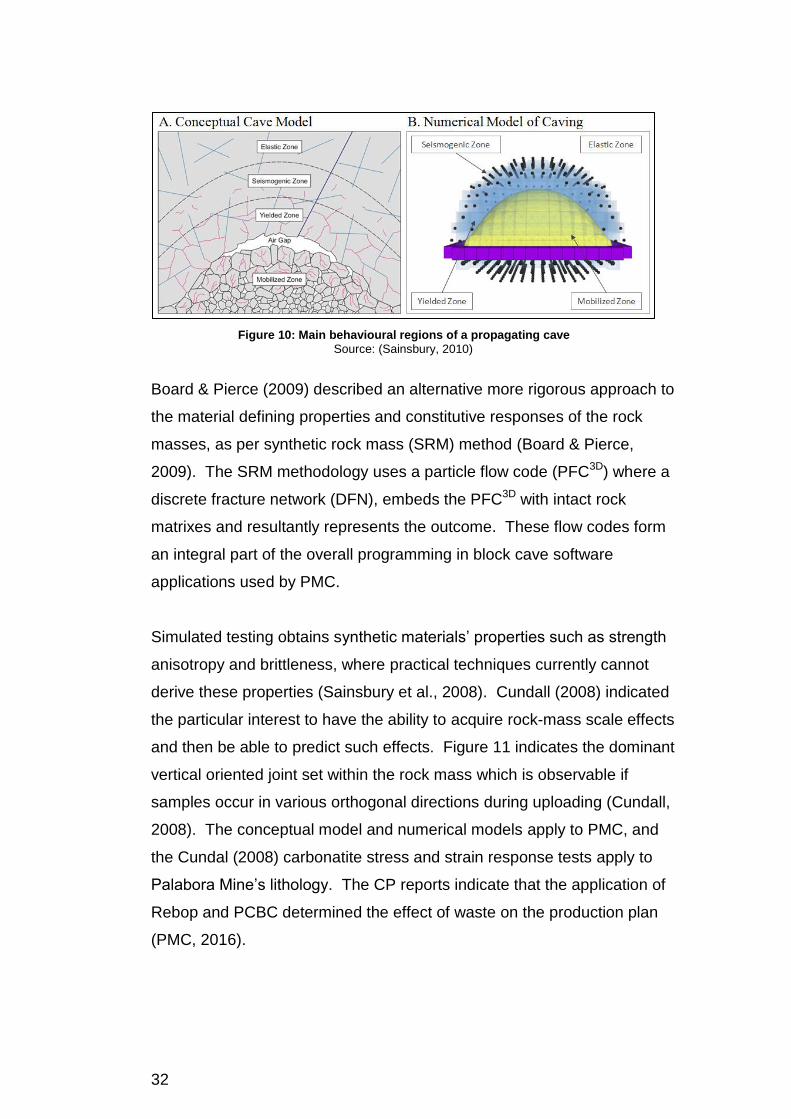
(Duplancic & Brady, 1999). Figure 10 illustrates the conceptual cave
model and numerical model of caving with specific zones applicable to
PMC’s block caving process.
32
Figure 10: Main behavioural regions of a propagating cave
Source: (Sainsbury, 2010)
Board & Pierce (2009) described an alternative more rigorous approach to
the material defining properties and constitutive responses of the rock
masses, as per synthetic rock mass (SRM) method (Board & Pierce,
2009). The SRM methodology uses a particle flow code (PFC3D) where a
discrete fracture network (DFN), embeds the PFC3D with intact rock
matrixes and resultantly represents the outcome. These flow codes form
an integral part of the overall programming in block cave software
applications used by PMC.
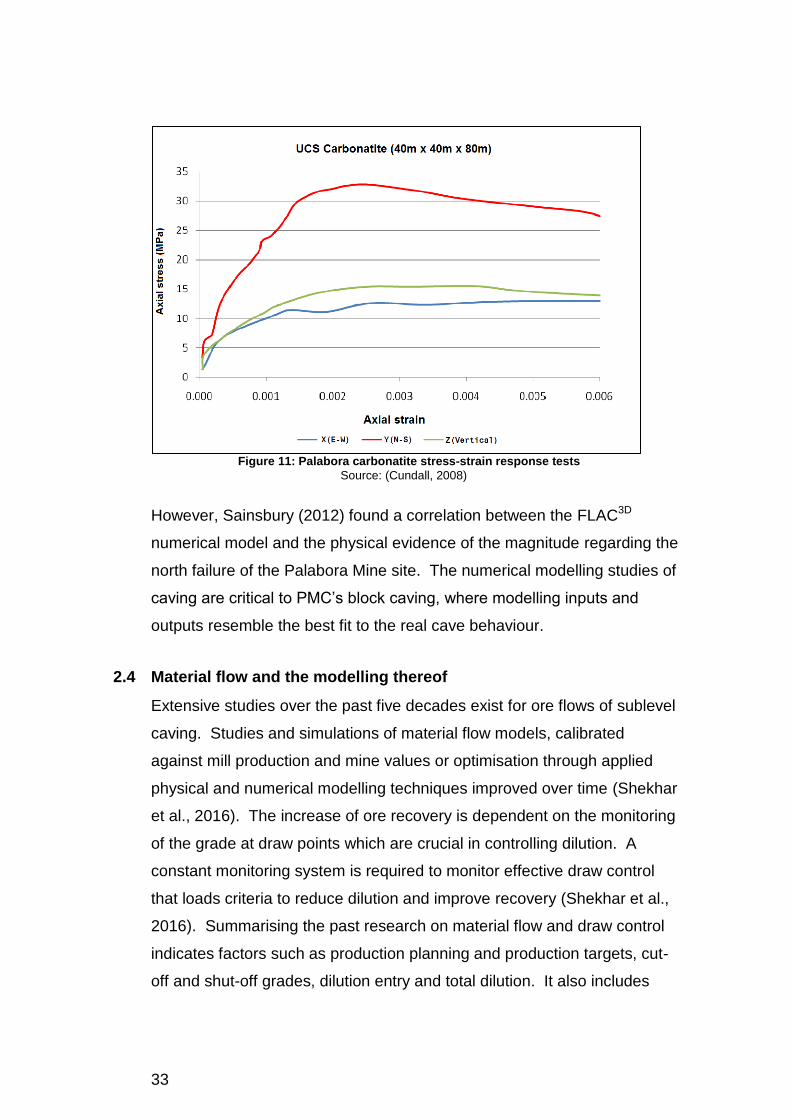
Simulated testing obtains synthetic materials’ properties such as strength
anisotropy and brittleness, where practical techniques currently cannot
derive these properties (Sainsbury et al., 2008). Cundall (2008) indicated
the particular interest to have the ability to acquire rock-mass scale effects
and then be able to predict such effects. Figure 11 indicates the dominant
vertical oriented joint set within the rock mass which is observable if
samples occur in various orthogonal directions during uploading (Cundall,
2008). The conceptual model and numerical models apply to PMC, and
the Cundal (2008) carbonatite stress and strain response tests apply to
Palabora Mine’s lithology. The CP reports indicate that the application of
Rebop and PCBC determined the effect of waste on the production plan
(PMC, 2016).
33
Figure 11: Palabora carbonatite stress-strain response tests
Source: (Cundall, 2008)
However, Sainsbury (2012) found a correlation between the FLAC3D
numerical model and the physical evidence of the magnitude regarding the
north failure of the Palabora Mine site. The numerical modelling studies of
caving are critical to PMC’s block caving, where modelling inputs and
outputs resemble the best fit to the real cave behaviour.
Material flow and the modelling thereof 2.4
Extensive studies over the past five decades exist for ore flows of sublevel
caving. Studies and simulations of material flow models, calibrated
against mill production and mine values or optimisation through applied
physical and numerical modelling techniques improved over time (Shekhar
et al., 2016). The increase of ore recovery is dependent on the monitoring
of the grade at draw points which are crucial in controlling dilution. A
constant monitoring system is required to monitor effective draw control
that loads criteria to reduce dilution and improve recovery (Shekhar et al.,
2016). Summarising the past research on material flow and draw control
indicates factors such as production planning and production targets, cut-
off and shut-off grades, dilution entry and total dilution. It also includes

34
mine design and ring design, mine layouts, ore geology and geometry, the
performance of proximate draw points, and the nature of material flow
(Shekhar et al., 2016). This research knowledge contributes to the
material flow and drawing compliance at PMC.
Diering (2000) described details of the PCBC program and those
components of the modelled process of block caving. The origin of the
software development happened in 1998 at Premier Diamond Mine in
South Africa. Diering (2010), Robertson, and Kirsten worked in close
cooperation with Laubscher (2000) during the development of the software
(Diering, 2010). PCBC does not model material in a geotechnical or
geomechanical way but applies empirical rules to mix material, improving
grade predictions, and enhancing effective long and short range planning
and design strategies. Components of the process include a sufficient
description of the geometric and grade characteristics of the geological
environment. Constructed PCBC block models comprise of grades,
density, rock codes, and percentage of fines, fracture frequency rating,
and draw point locations (Diering, 2010).
A slice file represents the draw column above the draw point before any
initial extraction commences. This slice file is calculated by the software
from a draw cone’s perimeters while it constructs a draw point “reserve”
(Diering, 2010). Each column can comprise of a number of slices, and the
vertical dimension of each slice corresponds to the block model. Different
assigned categorical components identify the slices such as shared or
unique, coarse or fine and ore or dilution (Diering, 2010). The different
components of the slice file shown in Figure 12 define the computed tons
for each slice.

35
Figure 12: Different components of the slice file
Source: (Diering, 2010)
Diering (2007) described in detail the various flow mechanisms such as
vertical mixing, horizontal mixing, toppling, rilling, erosion, compaction,
major surface movements and inclined flow along a contact. The details
of these flow mechanisms are beyond the scope of this study. Various
flow mechanisms shown in Figure 13, indicates the terminology used and
occurrence of mixing variables found in block caving.
Figure 13: Typical flow mechanisms in a block cave
Source: (Diering, 2007)
At PMC, the various parameters captured in PCBC, include the external
source of waste dilution, which formulates the draw control plan. The
PCBC software accounts these factors to establish the required draw rates
and draw zones for each production shift. The PCBC tool is an integral
part of the resource management at PMC and applies to this project study.
36
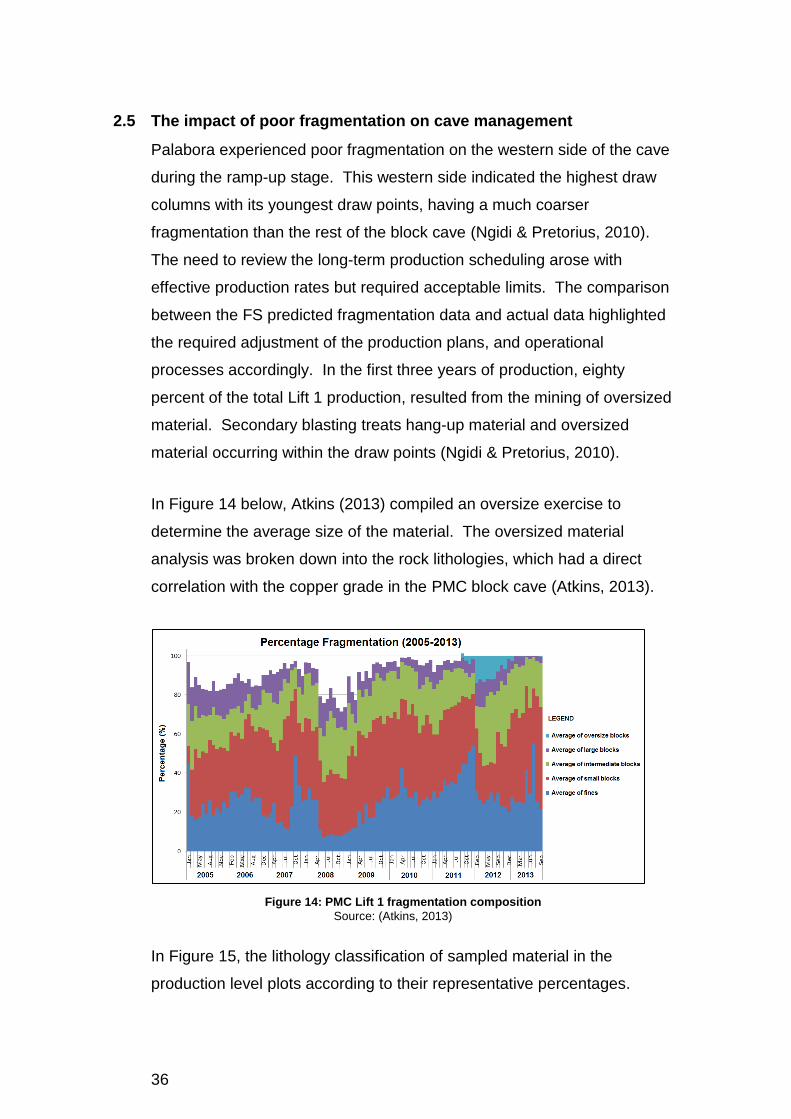
The impact of poor fragmentation on cave management 2.5
Palabora experienced poor fragmentation on the western side of the cave
during the ramp-up stage. This western side indicated the highest draw
columns with its youngest draw points, having a much coarser
fragmentation than the rest of the block cave (Ngidi & Pretorius, 2010).
The need to review the long-term production scheduling arose with
effective production rates but required acceptable limits. The comparison
between the FS predicted fragmentation data and actual data highlighted
the required adjustment of the production plans, and operational
processes accordingly. In the first three years of production, eighty
percent of the total Lift 1 production, resulted from the mining of oversized
material. Secondary blasting treats hang-up material and oversized
material occurring within the draw points (Ngidi & Pretorius, 2010).
In Figure 14 below, Atkins (2013) compiled an oversize exercise to
determine the average size of the material. The oversized material
analysis was broken down into the rock lithologies, which had a direct
correlation with the copper grade in the PMC block cave (Atkins, 2013).
Figure 14: PMC Lift 1 fragmentation composition
Source: (Atkins, 2013)
In Figure 15, the lithology classification of sampled material in the
production level plots according to their representative percentages.

37
Figure 15: PMC Lift 1 percentage rock types
Source: (Atkins, 2013)
When Atkins (2013) plotted the representative fragmentation data in the
cave, the geographical display in Figure 16 below indicates the
fragmented distribution within the Lift 1 footprint.
Figure 16: PMC Lift 1 fragmentation analysis 2006
Source: (Atkins, 2013)

38
Massive fragmentation can cause draw points to hang up, and large
boulders consequently influence the draw control and flow of material.
The loading and pulling of ore in the draw points affect ore recovery,
hence draw control optimisation maximises the ore recovery (Shekhar et
al., 2016).
These studies contributed to the draw control strategy of PMC, which
aimed to delay the dilution entry and opted for draw optimisation. The
optimised draw stretched from the poorly fragmented western section of
the production level (Shekhar et al., 2016).
Early physical model studies and computer software 2.6
Extensively used studies on gravity flow mechanisms use physical models
to determine draw control strategies. Draw rates affect the intermixing of
ore and waste, which requires drawing control strategies to optimise the
operation (De La Comisión et al., 2012). This knowledge supplements the
PCBC software mixing variables and draw rates of PMC, with specific
reference to the Diering (2015) ore and waste mixing parameter review.
The ellipsoid theory by Kvapil (1992) and renowned studies conducted via
physical models, sand models, and draw spacing studies by Heslop
(1983), led to Laubscher’s research (Halim, 2004). Halim (2004) recorded
that the REBOP (Rapid Emulator Based on PFC3D) model by Carlson et
al. (2004) resulted in response to the associated difficulties from run times
in particle flow codes. Carlson et al. (2004) modelled REBOP in the form
of encoded algorithms. The significance of this research contributed
towards a better understanding of the block cave mine at PMC. The
Carlson et al. (2004) research form a part of high-level background
programming in the existing software used at PMC (Halim, 2004).
Brummer et al. (2006) reviewed the adoption of the 3DEC numerical
models to predicted the impact of underground mining on an open pit
slope at PMC in 2006 (Xu et al., 2006). The research by Brummer et al.

39
(2006) covers extensive modelling for slope failures in various ways. The
simulations and calculations cover aspects such as slope failure
predictions in using the numerical model. The Brummer et al. (2006)
paper additionally cover slicing, mining, filling simulations, landslide
simulations and prediction of landslides. These simulations are primarily
utilised when mines transition from open pit mining to underground mining
(Xu et al., 2006). This knowledge applies to the later approaches PMC
followed since the slope failure review and during the revision of the
geological resource model.
Palabora Mine, a unique block cave mine 2.7
There is an abundance of literature and studies for block cave mines
which deals extensively with the segregation of grades and the expected
behaviour of fragmented rock and flow patterns.
Du Plessis & Martin (1991) assessed the deformation behaviour of the pit
wall and used the explicit finite difference code “FLAC” during the
modelling of the PMC open pit. Their model’s results had difficulty in
making any final predictions (Ahmed, 2009). Their research work could
not predict that a slope failure was to occur at Palabora, but notably, this
work emphasises the uniqueness of each mine (Ahmed, 2009).
Laubscher (1994) focussed in on block caving methods, and he wrote a
revised paper seven years later. The Laubscher (1994) paper became the
most widely used reference for cave mine designs (Chitombo, 2010).
Laubscher (2000) elaborated extensively in the international caving study
manual on block caving, but most mines are unique and treated
individually for having different caving probabilities. Due to the
uniqueness, a component of elusive behaviour in every cave exists which
require caves to be continuously monitored and measured to form
reasonable conclusions (Snowden, 2010). Apart from all the written
reports and conducted studies, the PMC block cave and resource grade
has predominantly been a conundrum for experts.
40
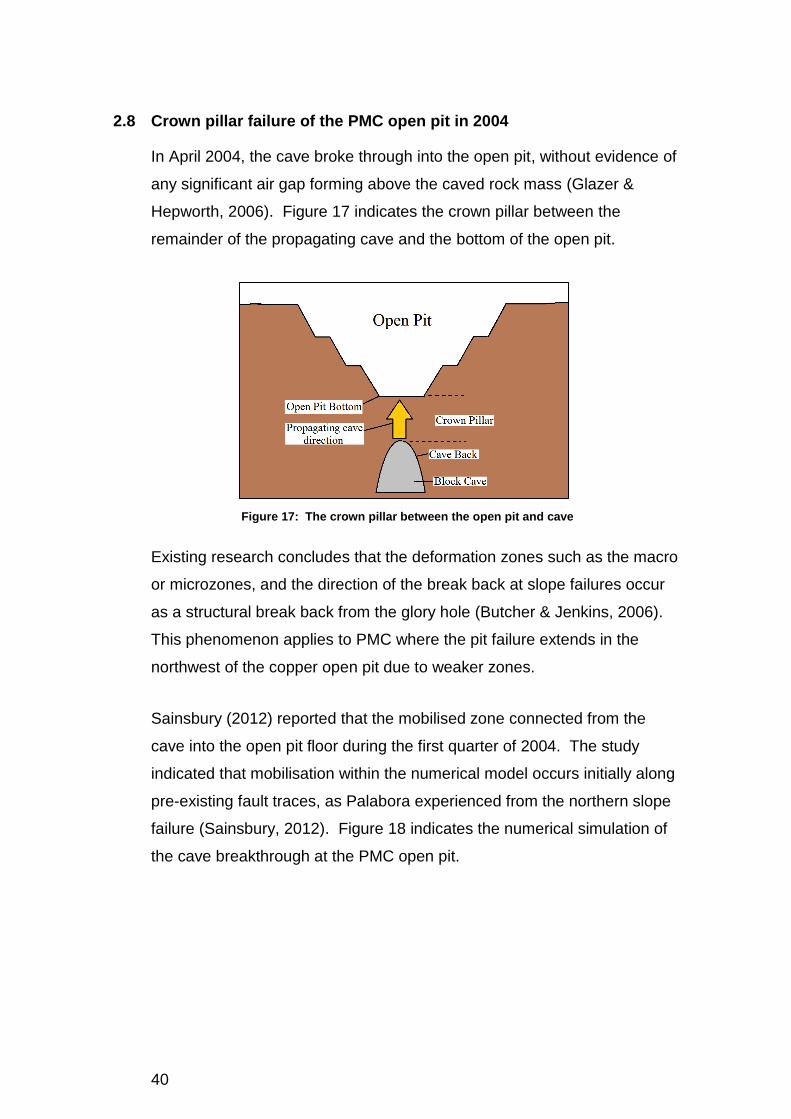
Crown pillar failure of the PMC open pit in 2004 2.8
In April 2004, the cave broke through into the open pit, without evidence of
any significant air gap forming above the caved rock mass (Glazer &
Hepworth, 2006). Figure 17 indicates the crown pillar between the
remainder of the propagating cave and the bottom of the open pit.
Figure 17: The crown pillar between the open pit and cave
Existing research concludes that the deformation zones such as the macro
or microzones, and the direction of the break back at slope failures occur
as a structural break back from the glory hole (Butcher & Jenkins, 2006).
This phenomenon applies to PMC where the pit failure extends in the
northwest of the copper open pit due to weaker zones.
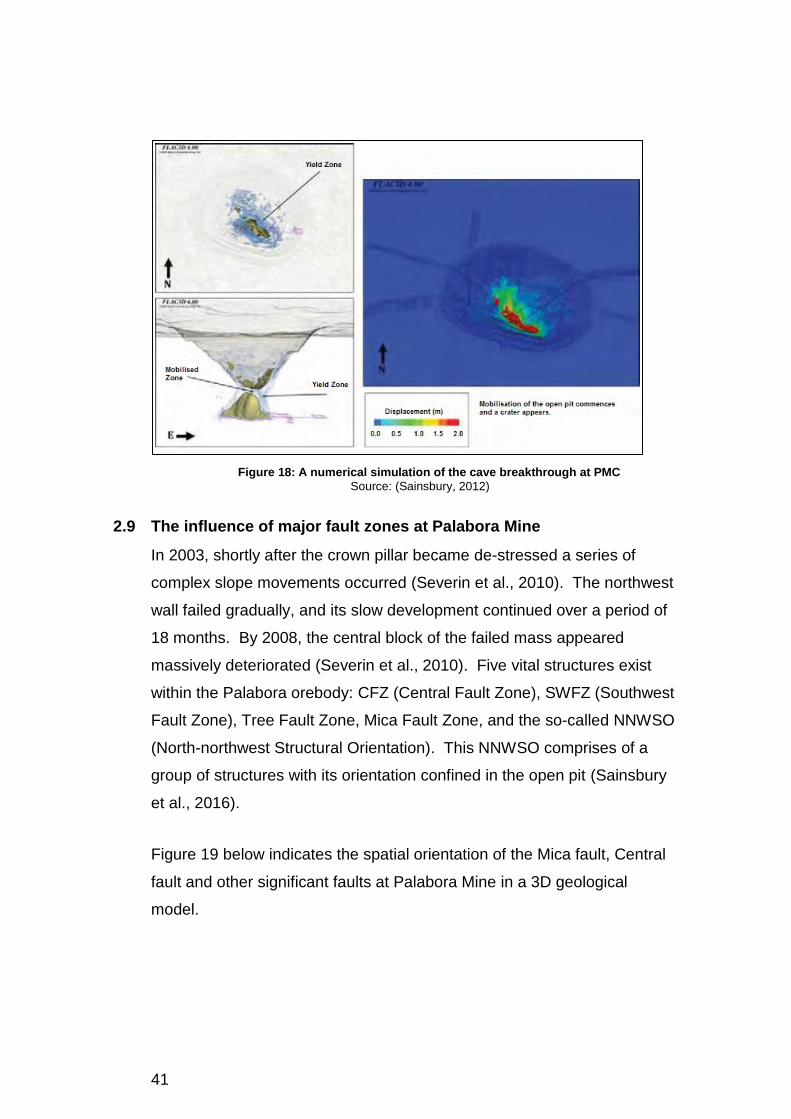
Sainsbury (2012) reported that the mobilised zone connected from the
cave into the open pit floor during the first quarter of 2004. The study
indicated that mobilisation within the numerical model occurs initially along
pre-existing fault traces, as Palabora experienced from the northern slope
failure (Sainsbury, 2012). Figure 18 indicates the numerical simulation of
the cave breakthrough at the PMC open pit.
41
Figure 18: A numerical simulation of the cave breakthrough at PMC
Source: (Sainsbury, 2012)
The influence of major fault zones at Palabora Mine 2.9
In 2003, shortly after the crown pillar became de-stressed a series of
complex slope movements occurred (Severin et al., 2010). The northwest
wall failed gradually, and its slow development continued over a period of
18 months. By 2008, the central block of the failed mass appeared
massively deteriorated (Severin et al., 2010). Five vital structures exist
within the Palabora orebody: CFZ (Central Fault Zone), SWFZ (Southwest
Fault Zone), Tree Fault Zone, Mica Fault Zone, and the so-called NNWSO
(North-northwest Structural Orientation). This NNWSO comprises of a
group of structures with its orientation confined in the open pit (Sainsbury
et al., 2016).
Figure 19 below indicates the spatial orientation of the Mica fault, Central
fault and other significant faults at Palabora Mine in a 3D geological
model.

42
Figure 19: Major fault zones at PMC
Source: (Severin et al., 2010)
Severin & Eberhardt (2012) indicated that horizontal stresses could rotate
and concentrate around the pit bottom and toe of the slope, which led to
higher stresses. The possibility of a concentrating effect of major
geological features existed especially around faults on shear stresses
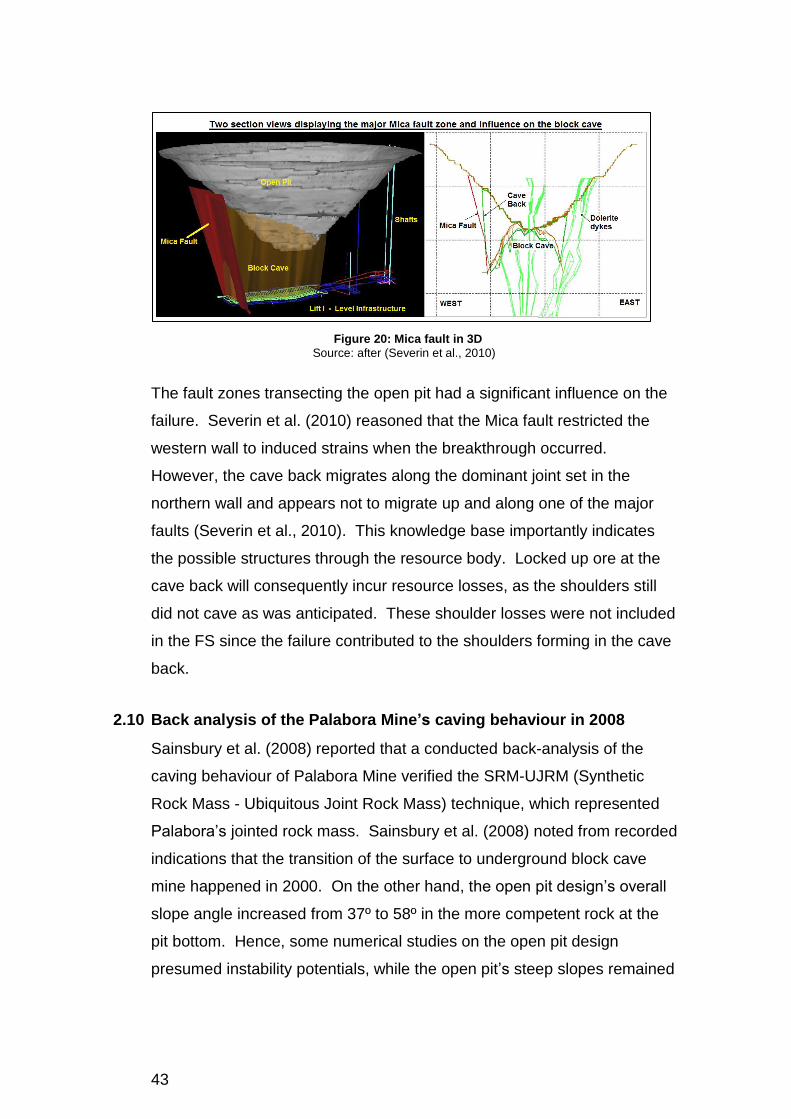
within the northern pit wall (Severin & Eberhardt, 2012). The anticipated
cave back position in Figure 20 illustrates the ore reserve dilution-
envelope where the shoulders stabilised and remained intact. The
assumed intact shoulders uphold due to the continuous influx of surface
material (Diering, 2015).
The 3D illustration of the Mica fault in Figure 20 at Palabora Mine indicates
the spatial relationship between the underground operations and the open
pit.
43
Figure 20: Mica fault in 3D
Source: after (Severin et al., 2010)
The fault zones transecting the open pit had a significant influence on the
failure. Severin et al. (2010) reasoned that the Mica fault restricted the
western wall to induced strains when the breakthrough occurred.
However, the cave back migrates along the dominant joint set in the
northern wall and appears not to migrate up and along one of the major
faults (Severin et al., 2010). This knowledge base importantly indicates
the possible structures through the resource body. Locked up ore at the
cave back will consequently incur resource losses, as the shoulders still
did not cave as was anticipated. These shoulder losses were not included
in the FS since the failure contributed to the shoulders forming in the cave
back.
Back analysis of the Palabora Mine’s caving behaviour in 2008 2.10
Sainsbury et al. (2008) reported that a conducted back-analysis of the
caving behaviour of Palabora Mine verified the SRM-UJRM (Synthetic
Rock Mass - Ubiquitous Joint Rock Mass) technique, which represented
Palabora’s jointed rock mass. Sainsbury et al. (2008) noted from recorded
indications that the transition of the surface to underground block cave
mine happened in 2000. On the other hand, the open pit design’s overall
slope angle increased from 37º to 58º in the more competent rock at the
pit bottom. Hence, some numerical studies on the open pit design
presumed instability potentials, while the open pit’s steep slopes remained

44
intact throughout decommissioning of the pit operations (Ahmed et al.,
2014). Sainsbury et al. (2008) indicated that the open pit failure led to
potential sterilisation and dilution of the ore reserve. Figure 21 below
indicates the reproduced pit slope-failure mechanism in the numerical
model, which compared well with the onsite observations (Sainsbury et al.,
2008).
Figure 21: The Palabora pit failure mechanism reproduced by the SRM-UJRM
Source: (Sainsbury et al., 2008)
Sainsbury et al. (2008) indicated that production increased from the
western section of the mine, causing a rapid vertical advance of the yield
zone. Sainsbury et al. (2008) also found that the breakthrough of the cave
volume mobilised sub-vertical joints in the pit slope above the yield zone.
Figure 22 indicates the development of the pit slope-failure mechanism
over time.
Figure 22: Development of the pit slope-failure mechanism over production time
Source: (Sainsbury et al., 2008)

45
The paper by Brummer et al. (2006) described the numerical 3DEC
models developed by Itasca Consulting Canada Incorporated for the
Palabora open pit walls and floor in 2006. The study investigated
mechanisms of slope deformation, failure of the pit walls, and sought
clarity on the future long-term pit wall instability. The 3DEC models
indicated the possibility of the north wall failure and that its stability
depended on the actual direct caving control (Brummer et al., 2006).
Sainsbury (2012) reported that used criteria for assessing the cave
behavioural regions from a caving and subsidence outline are valid at the
Palabora Mine site. Figure 23 illustrates the production drawn from a
simulated model and respectively the drawn height progression.
Figure 23: Historical mining record at the Palabora block cave mine
Source: (Sainsbury, 2012)
The accuracies of these studies play an important role when the input
parameters of the influx of surface material into the block cave affect the
overall resource model of PMC.
Micro-seismic analysis between the block cave and the pit slopes 2.11
Studies by Glazer & Hepworth (2006) indicated that the micro-seismic
activity followed the approximate undercut progression pattern and
became evident in the back-analysis of the Palabora Mine. This study
indicated that the dominant fracturing mechanism induced in the cave
volume resulted from shearing (Glazer & Hepworth, 2006). The loss of

46
cohesion below the north wall triggered the final failure of the open pit
volume, resulting in high damage indicated by the clustered index. The
clustered index is a damage parameter, which combines source locations
and useful event sizes that characterise the degree of clustering and
interaction between fractures acting as sources of micro-seismic events
(Reyes-Montes et al., 2010). Figure 24 shows an isometric perspective of
micro-seismic events recorded at PMC.
Figure 24: Micro-seismic events recorded at PMC
Source: (Reyes-Montes et al., 2010)
Ultimately, the evolution of seismic damage and behaviour observed at the
lower open pit resultantly interprets as a precursor to the potential induced
seismicity at the slope failure level (Reyes-Montes et al., 2010).
With seismic data analysis studies, reliable and successful monitoring of
the caving process assists with caving draw compliance. At Palabora, the
seismic activity rates dropped with production stoppages of several
consecutive days between 2002 and 2008 (Glazer & Townsend, 2010).
For these short periods of stoppage, where no material pulling from the
cave occurred, the cave expansion stopped since the cave had no place

47
for the caving material. Palabora was always pulling at a lower rate than
the natural cave progression rate, indicating a minimal or no expansion
void at the top of the cave (Glazer & Townsend, 2010).
These studies and knowledge base is equally important for the resource
reporting, and additionally, similar mine modelling can be improved with
sufficient subsidence, fragmentation and failure predictions, potentially
affecting the resource grades.
Fracture banding in caving mines 2.12
The Cumming-Potvin et al. (2016) paper describes alternative criteria
which question the Duplancic & Brady (1999) model. This paper indicates
that the Duplancic & Brady (1999) conceptual model did not resemble the
anticipated conceptual caving. Previously the Duplancic & Brady (1999)
model has been widely accepted by the mining industry (Cumming-Potvin
et al., 2016).
In the latest discovery, a series of fractures develop parallel to but ahead
of the cave front and the cave periphery. By investigating the direction of
movement and lack of damage to the asperities along the fractures,
authors judged these fractures to be extensional (Cumming-Potvin et al.,
2016). Alternatively, the cave progressed in what seemed to be several
leaps to successive parallel fractures. A resultant discontinuous damage
profile ahead of the cave back develops in contradiction with previous
interpretations of continuous damage profiles (Cumming-Potvin et al.,
2016). This parallel fracturing which occurs ahead of the cave back is
known as fracture banding. Cumming-Potvin et al. (2016) indicated that
several authors found that the tensile fractures manifested in what
appears to be a series of discontinuities parallel to the cave front. This
indication explains that these observations already existed in previous
studies (Cumming-Potvin et al., 2016).

48
The phenomenon of fracture banding by indication occurs in real cave
mines, and field observations are essential to support fracture banding.
However, Cumming-Potvin et al. (2016) indicated that fracture banding in
the cave evolution needs more recognition as an essential mechanism of
cave propagation. Importantly additional research needs to determine the
condition under which fracture banding occurs. The significance of fracture
banding in caving mines still has to be determined. Cave design and cave
management could determine leading indicators for the importance, and
role fracture banding plays in cave propagation (Cumming-Potvin et al.,
2016).
This study applies to PMC where the cave back and the slope failure
outlines show indicative signs of possible fracture banding. Fracture
banding possibly affected the outline of the PMC cave back as per
Diering’s (2015) indicated resource model.
The PMC open pit slope failure and its impact on the resources 2.13
Across the industry, whether in sublevel caving operations or block caving,
dilution and recovery issues existed because of the constant mixing of ore
and caved material (Shekhar et al., 2016). Table 1 indicates the effect of
dilution and ore loss in mine economics, affecting the mine profits and
return on investment. Dilution has a particular amplified effect, which
requires adequate control (Shekhar et al., 2016).
Table 1: Effect of dilution and ore loss on mine economics - Source: (Steffen & Kuiper, 2011)
Hustrulid (2001) indicated that: Elbronds (1994) indicated that:
A 5% decrease in ore grade would result in a 15% loss in profits
A mine's Net Present Value (NPV) is halved if either of the following scenarios occur:
* Ore losses become 20% higher than expected, or
* Ore grade becomes 10% lower than expected (e.g. via dilution)
A 5% increase in ore grade yields a greater improvement to profit than reducing mining costs by 5%
The above scenarios could increase production costs by 75%

49
Ngidi and Pretorius (2008) reported that after the cave propagated through
the crown pillar into the open pit bottom, the toe supporting the pit walls
lost its footing. The pit walls unravelled at the weaker lithology contacts
and fault lines, which caused the north pit wall to slide into the pit bottom
(Ngidi & Pretorius, 2008). Ngidi and Pretorius (2010) estimated that 150
million tonnes of waste from the slope failure of the open copper pit failed
into the block cave of PMC. Ngidi and Pretorius (2010) calculated
resultant losses of up to 30% from the original ore reserve. This project
report identified that Ngidi & Pretorius (2008) were on the money as per
say when they correctly mentioned the sliding of the failure to the pit
bottom. Unfortunately, Ngidi & Pretorius (2008) focussed in large on the
reserve losses and not on the sliding effect of the failure while Diering
(2015) re-identified the sliding through tests in 2015. Ngidi and Pretorius
(2010) reported that critical grade variations at PMC called for continuous
reserve reconciliations which became inevitable. The Ngidi & Pretorius
studies influenced the importance of annual flyover surveys of the open
pit. With flyover data, calculations of waste influx material flowing into the
block cave from the failure enable more accurate future predictions of the
minable resource. These studies bear valuable information and contribute
to the resource management at PMC.
Additional losses form at the shoulders of the cave and remain
problematic to the cave unless pre-conditioning via drilling from the
surface becomes possible. Figure 25 indicates probable losses of reserve
areas at the cave’s top.

50
Figure 25: Reserve losses indicated as remnant shoulders
Source: (PMC, 2007)
Studies over time created a cave mine database for empirical analysis and
characterisation of caving-induced surface subsidence. The populated
database formed from more than a hundred cave mining operations,
including ceased mines and operational mines across the world (Woo et
al., 2013). PMC incurred a 30% ore reserve loss from an 86 to 88-degree
caving angle and slope failure which primarily contributes to the dilemma
the company faced (Woo et al., 2013). This research by Woo et al. (2013)
supplements the Ngidi & Pretorius (2010) report which states that the low-
grade ingress material posed an adverse effect on the LOM of the block
cave.
According to the article “Block Caving: Mining Specialisation ” which
Walker (2014) wrote, Professor Yves Potvin highlighted in 2011 that
several block-caving risks existed. One main risk is the sterilisation of a
significant quantity of broken ore, requiring draw control management
(Walker, 2014). Rio Tinto indicated that the failure resulted in less future
copper revenue, since possible additional costs to move facilities away
from the failure’s path may be inevitable. The failure significantly affected
the resource picture, and the reserve loss was nearly 30%. The slope
failure resulted in lower confidence in PMC’s ability to predict behaviour
(Calder, 2006). Table 2 below indicates the status of Lift 1 mineable
tonnes and losses as per the specified reports.

51
Table 2: Mineable tonnes status per year
In 2010, Snowden (2010) indicated only 75 Mt available as feasible tonnes
to be mined. Notably, in 2011, the indicated remaining tonnes was 49 Mt
and caving was expected to end at the end of 2015 (Snowden, 2010).
However, Diering (2015) reconciled the failure’s material with applicable
grades after four years of mining since the 2011 CP report. Diering (2015)
indicated a similar remaining total mineable tons in 2015 as was predicted
to be the remaining total back in 2011. From the table above, there is a
clear indication that the initial calculations reported a massive loss in
reserves, while only much later the failure material added a couple of more
years to the LOM beyond 2015.
Walker (2014) referred to the author of the monograph namely, Dr Tony
Diering, the vice president of Geovia’s caving business unit. Walker
(2014) reported from Diering’s indication that ore reserve estimations are
more complicated due to “peculiarities” of block cave mining. These
“peculiarities” include complications such as mining geometry, material
fragmentation, material flow, or dilution from various sources (Walker,
2014).
Diering’s follow-up PMC visit in 2015, resulted from continuous work in
progress and a different grade diversion experience (Diering, 2015). This
Year (end)
Estimated
Resources Mt
(CP Reports)
CPR
Grade
% Cu
Cave
Management
Reported Mined
tons (Mt)
Estimated
Balance of
Resources
Cumulative
Residual Tons
(Estimated -
mined)
Variance
(Mt)
Competent Person Report &
other reportsComments
Pre-2000 245 0.69 244 244 FS Report & Calder (2006) The Pre FS indicated 245 Mt
2000 228 0.69 0 243 220 -23 Reserve Statements Marginal Ore on surface removed UG total, Calder (2006) mentioned 220 Mt
2001 225 0.69 0 228 220 -8 Reserve Statements Annual Reconciliation
2002 216 0.69 3 225 217 -8 Reserve Statements Additional 3 Mt mined from UG Reserve in the open pit
2003 216 0.69 7 213 210 -3 Reserve Statements Additional Ramp scavenging in open pit depletes UG Reserve
2004 201 0.65 9 209 202 -8 Howson (2006) SLC Workshop The Northern slope failure occurred
2005 138 0.65 10 138 121 -17 2009 CPR 54 Mt written off (+- 30%) from 185 Mt
2006 120 0.63 11 120 110 -10 2009 CPR Howson(2006) revised resource model
2007 104 0.62 12 104 98 -6 2009 CPR Annual Reconciliation
2008 91 0.62 12 91 86 -5 2009 CPR Annual Reconciliation
2009 75 0.61 12 75 74 -1 2009 CPR Annual Reconciliation
2010 62 0.60 11 62 63 1 2010 CPR Annual Reconciliation
2011 49 0.57 11 49 52 3 2011 CPR Annual Reconciliation
2012 35 0.54 9 35 43 7 2012 CPR Annual Reconciliation
2013 26 0.57 10 26 33 7 Cave Management Records Annual Reconciliation
2014 15 0.57 12 15 21 7 Cave Management Records Annual Reconciliation
2015 40 0.55 10 40 11 -29 2016 CPR Reconciliation of Failure material added +-29 Mt , Diering(2015)

52
acknowledged work applies to the management of the PMC copper
resource model.
The SRK Consulting (2011) audit report for PMC indicated that the north
wall collapse of the pit sidewall incurred a 130 Mt of waste material
deposited on top of the Lift 1 reserve. This waste is expected to filter into
and through to reporting draw points situated on the extraction level of Lift
1 (SRK Consulting, 2011). SRK Consulting (2011) forecasted that mining
would become uneconomic by 2015 despite the uncertainty to quantify the
waste with a positive number. Hence the original 254 Mt deposit reduced
to a merely 117 Mt as a result of the 2004 failure. The overlying waste will
undoubtedly result in waste ingress at an earlier stage than initially
planned, and SRK expected these results to show in 2010 (SRK
Consulting, 2011).

53
Figure 26 shows the evolution of the north wall failure when looking north-
west.
Figure 26: Evolution of the north wall failure (north-west view)
Source: (Sainsbury et al., 2016)
Toppling theory at Palabora Mine and the dilution envelope 2.14
The copper block cave of PMC came near to its end of life as was
predicted to end in 2015 (SRK Consulting, 2011). During the expected
final period for Lift 1’s LOM, additional studies on the copper resource and
draw control refinement were required. Importantly PMC had to keep the
mine producing for as long as possible. The complicated toppling failures
of rocks slopes result from combinations of continuous and discontinuous
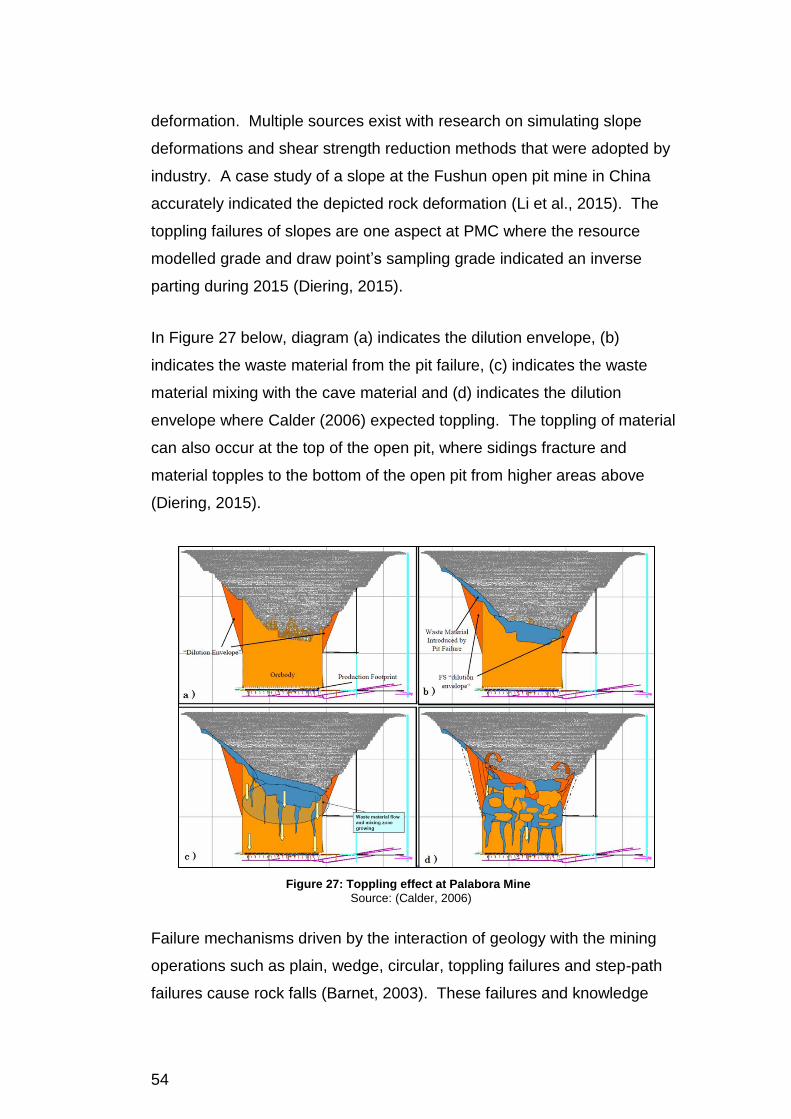
54
deformation. Multiple sources exist with research on simulating slope
deformations and shear strength reduction methods that were adopted by
industry. A case study of a slope at the Fushun open pit mine in China
accurately indicated the depicted rock deformation (Li et al., 2015). The
toppling failures of slopes are one aspect at PMC where the resource
modelled grade and draw point’s sampling grade indicated an inverse
parting during 2015 (Diering, 2015).
In Figure 27 below, diagram (a) indicates the dilution envelope, (b)
indicates the waste material from the pit failure, (c) indicates the waste
material mixing with the cave material and (d) indicates the dilution
envelope where Calder (2006) expected toppling. The toppling of material
can also occur at the top of the open pit, where sidings fracture and
material topples to the bottom of the open pit from higher areas above
(Diering, 2015).
Figure 27: Toppling effect at Palabora Mine
Source: (Calder, 2006)
Failure mechanisms driven by the interaction of geology with the mining
operations such as plain, wedge, circular, toppling failures and step-path
failures cause rock falls (Barnet, 2003). These failures and knowledge
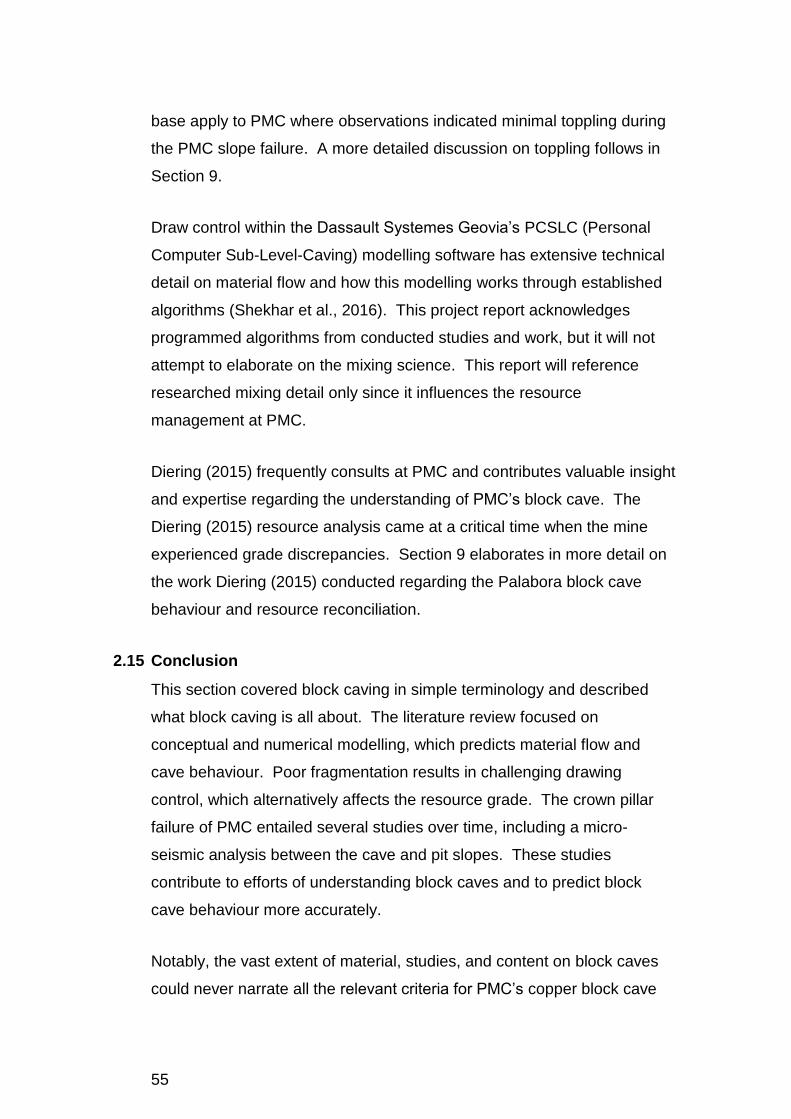
55
base apply to PMC where observations indicated minimal toppling during
the PMC slope failure. A more detailed discussion on toppling follows in
Section 9.
Draw control within the Dassault Systemes Geovia’s PCSLC (Personal
Computer Sub-Level-Caving) modelling software has extensive technical
detail on material flow and how this modelling works through established
algorithms (Shekhar et al., 2016). This project report acknowledges
programmed algorithms from conducted studies and work, but it will not
attempt to elaborate on the mixing science. This report will reference
researched mixing detail only since it influences the resource
management at PMC.
Diering (2015) frequently consults at PMC and contributes valuable insight
and expertise regarding the understanding of PMC’s block cave. The
Diering (2015) resource analysis came at a critical time when the mine
experienced grade discrepancies. Section 9 elaborates in more detail on
the work Diering (2015) conducted regarding the Palabora block cave
behaviour and resource reconciliation.
Conclusion 2.15
This section covered block caving in simple terminology and described
what block caving is all about. The literature review focused on
conceptual and numerical modelling, which predicts material flow and
cave behaviour. Poor fragmentation results in challenging drawing
control, which alternatively affects the resource grade. The crown pillar
failure of PMC entailed several studies over time, including a micro-
seismic analysis between the cave and pit slopes. These studies
contribute to efforts of understanding block caves and to predict block
cave behaviour more accurately.
Notably, the vast extent of material, studies, and content on block caves
could never narrate all the relevant criteria for PMC’s copper block cave

56
behaviour. Thus, the need for further research exists in the specific case
of PMC’s block cave, having higher than expected grades at its end of life,
despite the inflow of external material from the slope failure.
The required additional research could include fracture banding in caving
mines, and possibly determine the role it played during the LOM and the
effect it had on the resource grade.
3 PMC HISTORY AND THE MINERALISATION OF PMC
Introduction 3.1
Kuschke & Tonkin (1971) reported that Carl Mauch was the first European
to record copper occurring at Loolekop during 1868 and 1871. The first
mining around Loolekop was for phosphates in 1930 and vermiculite in
1936. Kuschke & Tonkin (1971) also reported that Mr C.H. Cleveland, a
pioneer prospector of the area noted large books of “rotten mica”
exfoliated during a grass fire, and consequently discovered the
vermiculite. “The late Dr Hans Merensky played an active part in the
prospecting for phosphates and vermiculite during and following the
Second World War.” (Kuschke & Tonking, 1971). Prospecting for copper
dates back to 1952 when the logical Unit of the Atomic Energy Board
discovered uranothorianite in the carbonatite from Loolekop. However,
the prospecting programme established that the concentration of
radioactive minerals had no economic significance, but the copper
rendered the deposit to be of value (Kuschke & Tonking, 1971). The
drilling programme confirmed over 300 million tons of ore amenable to
opencast extraction via an open pit size of 1 500 m x 900 m, with a final
depth of 370 m at a finished pit slope of 45º (Kuschke & Tonking, 1971).
Shaft sinking started in October 1960, and development blasting of 1 610
m on the 122-metre-level commenced during June 1961 to March 1962.
Bulk sampled rock from this development ran 100 tonnes per day into a
pilot plant. The results formed a reliable basis to plan full-scale mining,

57
milling, concentrating, and smelting operations, on a scale previously
unknown in South Africa (Kuschke & Tonking, 1971).
Lithology densities and empirical stability relationship 3.2
The carbonatite uniaxial strength is about 120 MPa with variations
between 90 MPa and 160 MPa, depending on the mineralogy. The
dolerite is a stronger brittle rock with a uniaxial strength of 320 MPa.
Dolerites adjacent to the primary faults are locally weathered and less
secure, its reduced strength is approximately 80 MPa (Ngidi & Pretorius,
2010). Table 3 and Table 4 below indicate the rock strengths, rock mass
and caved-rock properties of the Palabora Mine deposit. Table 3 indicates
that the rock strengths are very competent rock and whether the ore body
would propagate, posed as an initial uncertainty but modelling tests
indicated the cavability of PMC’s cave (Moss et al., 2006).
Table 3: Rock Strengths - Source: (PMC, 2007)
Table 4: Rock mass and caved rock properties - Source: (Severin & Eberhardt, 2012)
The FS predicted caving to initiate when the undercut area reached an
area of 140 m x 140 m. Despite the lack of knowledge and substantial
uncertainty regarding the unpredicted caving possibility, the overall
footprint dimensions were sufficient to counter the uncertainty (Moss et al.,
2006).
Density CohesionFriction
Angle
Bulk
Modulus
Shear
ModulusTension
(kg/m³) (MPa) (deg) (GPa) (GPa) (kPa)
2700 2.9 45 1.79 1.32 100
2300 0.0 30 0.42 0.19 100
2500 1.0 35 0.85 0.59 0Faulted Rock
Model
Units
Rockmass
Caved Material
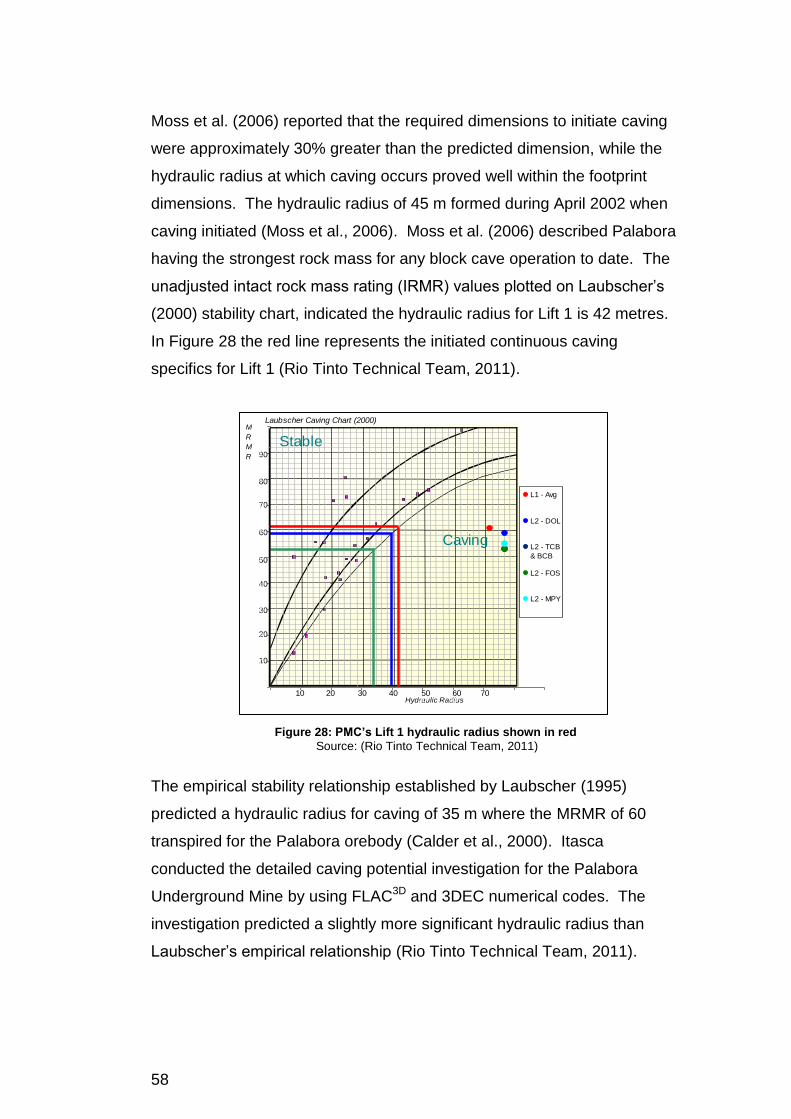
58
Moss et al. (2006) reported that the required dimensions to initiate caving
were approximately 30% greater than the predicted dimension, while the
hydraulic radius at which caving occurs proved well within the footprint
dimensions. The hydraulic radius of 45 m formed during April 2002 when
caving initiated (Moss et al., 2006). Moss et al. (2006) described Palabora
having the strongest rock mass for any block cave operation to date. The
unadjusted intact rock mass rating (IRMR) values plotted on Laubscher’s
(2000) stability chart, indicated the hydraulic radius for Lift 1 is 42 metres.
In Figure 28 the red line represents the initiated continuous caving
specifics for Lift 1 (Rio Tinto Technical Team, 2011).
Figure 28: PMC’s Lift 1 hydraulic radius shown in red
Source: (Rio Tinto Technical Team, 2011)
The empirical stability relationship established by Laubscher (1995)
predicted a hydraulic radius for caving of 35 m where the MRMR of 60
transpired for the Palabora orebody (Calder et al., 2000). Itasca
conducted the detailed caving potential investigation for the Palabora
Underground Mine by using FLAC3D and 3DEC numerical codes. The
investigation predicted a slightly more significant hydraulic radius than
Laubscher’s empirical relationship (Rio Tinto Technical Team, 2011).
10
20
30
40
50
60
70
80
90
10 20 30 40 50 60 70
Stable
Hydraulic Radius
M
R
M
R
Caving
Laubscher Caving Chart (2000)
0
10
20
30
40
50
60
70
80
90
100
0 10 20 30 40 50 60 70 80 90
L1 - Avg
L2 - DOL
L2 - TCB
& BCB
L2 - FOS
L2 - MPY

59
Mineralisation 3.3
The Phalaborwa complex covers an area of about 1950 hectares, which
consist mainly of phlogopite and apatite rich pyroxenite. Pyroxenites
incurred successive intrusions by a series of more differentiated rocks,
such as foskorite, olivine, magnetite, apatite, phlogopite rock, and a
central intrusion of sövite (transgressive carbonatite) (Snowden, 2010).
This sövite intrusion shows an intimate relationship with the foskorite and
covers about 50 hectares at the surface. The intrusion is composed of
calcite and magnetite having minor quantities of dolomite, apatite,
chalcopyrite, bornite and various silicates. The carbonatite is the mined
copper-bearing rocks with magnetite, and minute amounts of platinum and
gold as by-products (Snowden, 2010).
Mineral resources and reserves background 3.4
Rio Tinto South Africa (RTSA) and Palabora developed the mineral
resource model for the Palabora underground mine. The SUMP suite
programme, based on traditional 3-dimensional block modelling
approaches is a multi-matrix model. The estimation of grades performed
by a kriging estimator estimated the grades and other parameters of the
blocks (Calder et al., 2000). The delineated footprint’s boundary of the
vertical draw columns and the mineable resource caving angles ranged
between 82º and 88º. These supplied delimiters by RTSA defined the
Palabora block cave mine. The initial feasibility results and evaluation
forecasted minable reserves of 244.6 M tonnes, with a 0.69% copper
grade, producing 1.6 M tonnes of copper (Calder et al., 2000). The initial
calculation of the Palabora LOM resulted in approximately 20 years of
block cave mining.
For Palabora Mine to fulfil the requirements and readmission to the official
listed Johannesburg Stock Exchange (JSE), the May 2010 competent
persons’ (CP) report complied with the JORC code (Snowden, 2010). The
2010 CP report indicated the total remaining proved mineral reserves was
60
75.33 million tonnes of ore at 0.61% copper content. Palabora Mine
indicated a LOM of approximately six years of future caving since 2010.
During 2010, several options to extend the LOM beyond 2016, became an
active investigation (Snowden, 2010).
Mining method 3.5
The current mining method entailed a mechanised block cave, which
exploits the ore below the final open pit area. The block cave comprises
of an undercut and production level, of which the undercut is the
uppermost level sitting at 1183 m below surface. This level is about 460 m
below the last worked pit bottom on the surface (Snowden, 2010). At a
merely 18 m below the undercut level, the production level comprises of
draw points and other production infrastructures such as four underground
crushers and the conveyor infrastructure to hoist material vertically to the
surface (Snowden, 2010). Figure 29 shows an isometric perspective of
the Palabora block-cave mine layout.
Figure 29: Palabora block cave mining layout
Source: after (Ngidi & Pretorius, 2010)

61
A diesel-powered fleet of twenty LHD (load and haul dumper) machines
with a 12-tonne payload are utilised to muck material from the draw points
into the jaw crushers, located at the northern periphery of the cave. The
average one-way hauling length is about 175 m, where the crushers
discharge crushed material into the sacrificial conveyors (Snowden, 2010).
The sacrificial conveyors feed onto a single horizontal section inclined
conveyor (conveyor 5), which handles 1 800 tonnes per hour. Conveyor 5
delivers the material into the two 6 000 tonne production shaft silos. The
ore is ultimately hoisted to the surface using four 32 tonne payload skips
driven by a Koepé winder, where one skip counterweights the other
(Snowden, 2010).
Two main shafts are in operation, a 10 m diameter service shaft and a 7.4
m production shaft, both sunk to a final depth of 1 280 m below the
surface collar. The service shaft serves for men or material conveyancing
and is the primary ventilation intake infrastructure. The maximum hoisting
capacity of the production shaft’s skips can load about 33 000 tonnes per
day, and it serves as a supplementary ventilation intake (Snowden, 2010).
Underground loading and crushing 3.6
A Modular dispatch system monitors and directs the LHD loading activities
for the underground fleet from a central underground dispatch room. A
generated production schedule from a cave management database then
links to the LHD communication devices and directs the LHD fleet
underground to specific draw points and crusher tips. The four jaw
crushers ensure that fragmentation of material is suitable for loading onto
the conveyor belts where the crushed ore is less than 220 millimetres in
respective sizes (Snowden, 2010).
Underground sampling in Lift 1 at PMC 3.7
In the assessment of the underground sampling procedure followed at
PMC Howson (2006) and Snowden (2010) questioned the representative
shortfall of the sample sizes. Where 30 000 tonnes per day is mucked
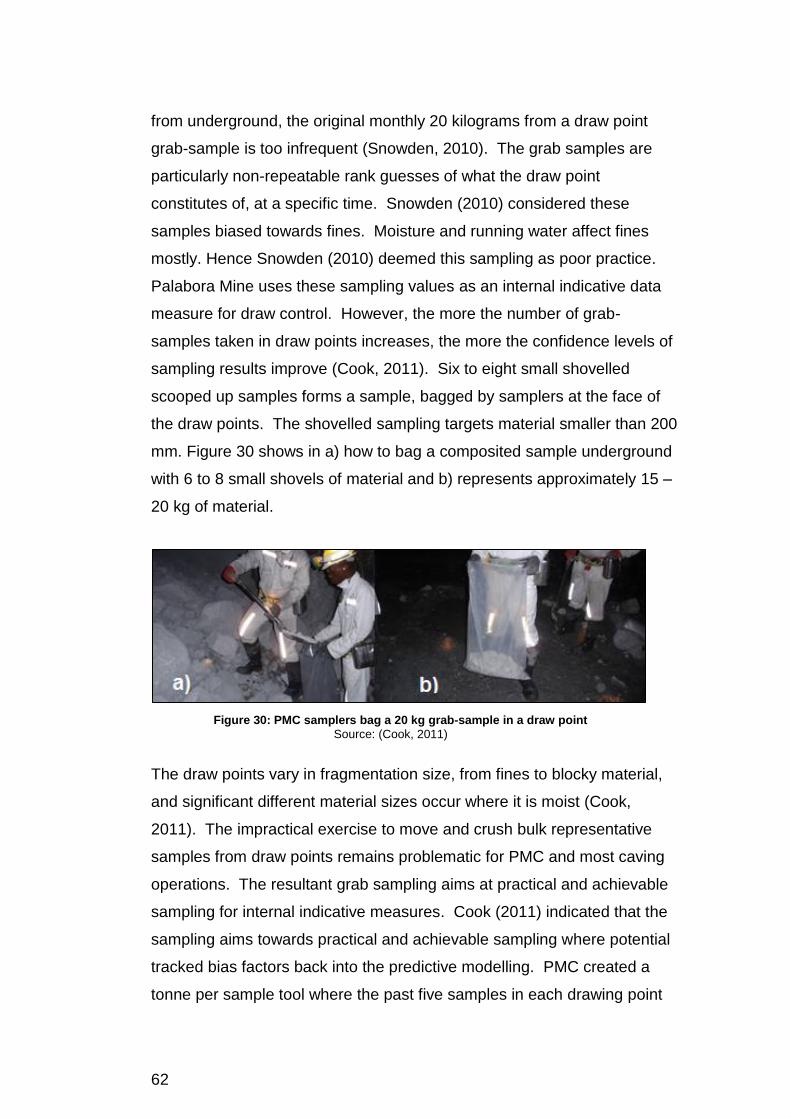
62
from underground, the original monthly 20 kilograms from a draw point
grab-sample is too infrequent (Snowden, 2010). The grab samples are
particularly non-repeatable rank guesses of what the draw point
constitutes of, at a specific time. Snowden (2010) considered these
samples biased towards fines. Moisture and running water affect fines
mostly. Hence Snowden (2010) deemed this sampling as poor practice.
Palabora Mine uses these sampling values as an internal indicative data
measure for draw control. However, the more the number of grab-
samples taken in draw points increases, the more the confidence levels of
sampling results improve (Cook, 2011). Six to eight small shovelled
scooped up samples forms a sample, bagged by samplers at the face of
the draw points. The shovelled sampling targets material smaller than 200
mm. Figure 30 shows in a) how to bag a composited sample underground
with 6 to 8 small shovels of material and b) represents approximately 15 –
20 kg of material.
Figure 30: PMC samplers bag a 20 kg grab-sample in a draw point
Source: (Cook, 2011)
The draw points vary in fragmentation size, from fines to blocky material,
and significant different material sizes occur where it is moist (Cook,
2011). The impractical exercise to move and crush bulk representative
samples from draw points remains problematic for PMC and most caving
operations. The resultant grab sampling aims at practical and achievable
sampling for internal indicative measures. Cook (2011) indicated that the
sampling aims towards practical and achievable sampling where potential
tracked bias factors back into the predictive modelling. PMC created a
tonne per sample tool where the past five samples in each drawing point

63
enable tracking of the sample coverage over the entire footprint as per
indicated hot and cold map in Figure 31. Figure 31 additionally indicates
the average tonnes between the last five samples taken across the
footprint and highlights those draw points requiring urgent sampling in red
or warmer colours (Cook, 2011).
Figure 31: Average tonnes between the last five samples
Source: (Cook, 2011)
Geological results and exploration drilling at PMC 3.8
Initial drilling commenced from the open pit, and an exploration shaft sunk
from bench 28, allowed for deeper drilling via the exploration level. The
exploration level tunnel allowed for drilling into the orebody. From the Lift
1 production level, downward drilling into a possible Lift 2-mine
commenced as per indicated magenta drill holes in Figure 32 below
(Calder, 2006). The blue lines are holes drilled from the surface in the
area mainly covering the open pit, the red lines are holes drilled from the
indicated red exploration level, and the holes drilled from the production
level in Lift 1 shows in magenta.

64
Figure 32: West – East profile showing relative positions of drill-hole types
Source: (Calder, 2006)
Exploration drilling at the Loolekop hill where the deposit outcropped
occurred approximately during 1964 to 1976 to explore the open pit
volume (PMC, 2016). Drill holes from the exploration level approximately -
492 m elevation drilled horizontally and downwards occurred during 1991
and 1993. The drilling of Lift 2 exploration holes from the Lift 1 level
underground occurred during 2007 and 2013 (PMC, 2016).
Plant and head grade sampling description 3.9
The plant comprises two autogenous mills (AM) and a separate stream for
secondary crushing processes. Dolomite, which affects the floatation
process, is not forming part of the immediate throughput but tapped off in
an approximate proportion of 5 - 10 percent. The tapped-off material
according to Snowden (2010) was immaterial to the overall mass balance,
which does not incur many copper losses since reprocessing of this
material forms part of the processing over time (Snowden, 2010).
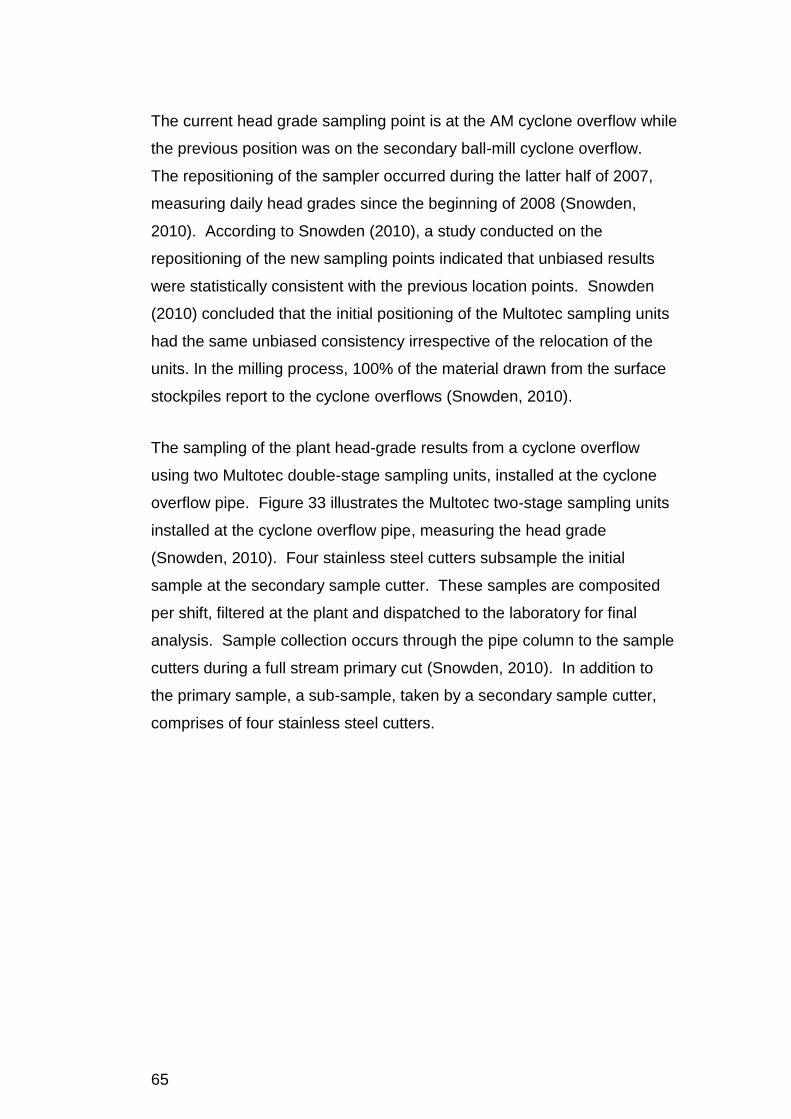
65
The current head grade sampling point is at the AM cyclone overflow while
the previous position was on the secondary ball-mill cyclone overflow.
The repositioning of the sampler occurred during the latter half of 2007,
measuring daily head grades since the beginning of 2008 (Snowden,
2010). According to Snowden (2010), a study conducted on the
repositioning of the new sampling points indicated that unbiased results
were statistically consistent with the previous location points. Snowden
(2010) concluded that the initial positioning of the Multotec sampling units
had the same unbiased consistency irrespective of the relocation of the
units. In the milling process, 100% of the material drawn from the surface
stockpiles report to the cyclone overflows (Snowden, 2010).
The sampling of the plant head-grade results from a cyclone overflow
using two Multotec double-stage sampling units, installed at the cyclone
overflow pipe. Figure 33 illustrates the Multotec two-stage sampling units
installed at the cyclone overflow pipe, measuring the head grade
(Snowden, 2010). Four stainless steel cutters subsample the initial
sample at the secondary sample cutter. These samples are composited
per shift, filtered at the plant and dispatched to the laboratory for final
analysis. Sample collection occurs through the pipe column to the sample
cutters during a full stream primary cut (Snowden, 2010). In addition to
the primary sample, a sub-sample, taken by a secondary sample cutter,
comprises of four stainless steel cutters.
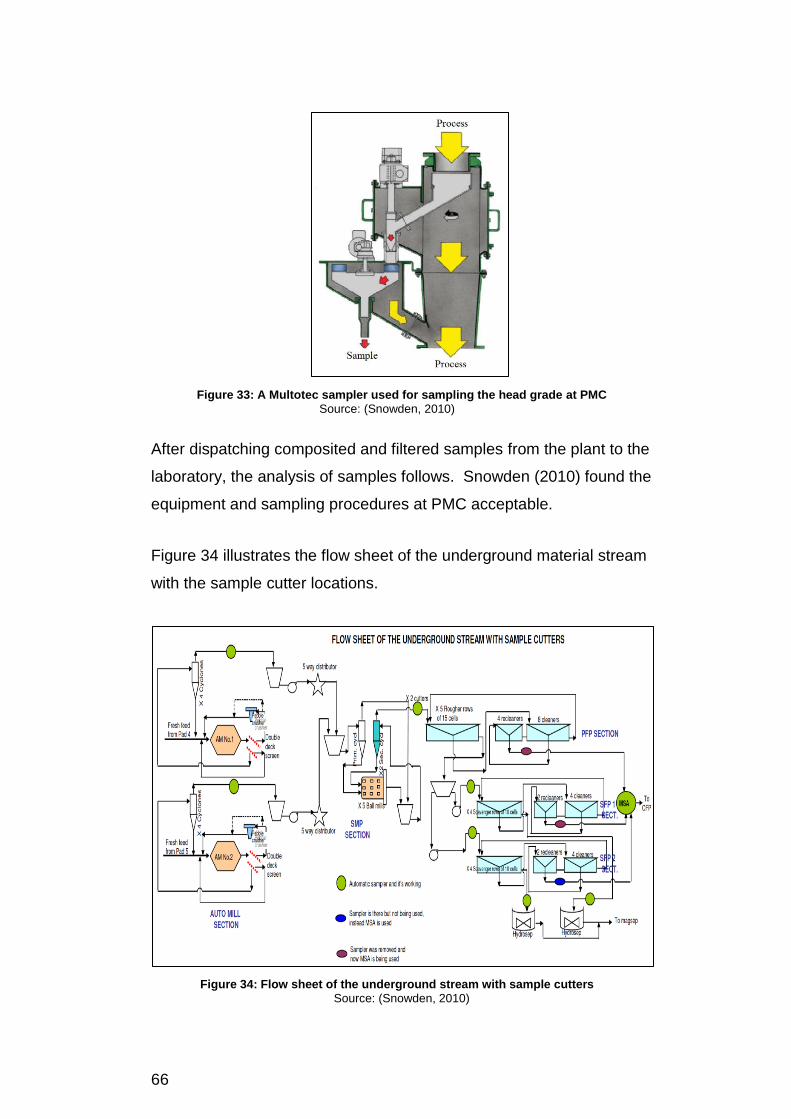
66
Figure 33: A Multotec sampler used for sampling the head grade at PMC
Source: (Snowden, 2010)
After dispatching composited and filtered samples from the plant to the
laboratory, the analysis of samples follows. Snowden (2010) found the
equipment and sampling procedures at PMC acceptable.
Figure 34 illustrates the flow sheet of the underground material stream
with the sample cutter locations.
Figure 34: Flow sheet of the underground stream with sample cutters
Source: (Snowden, 2010)

67
Current assaying of individual samples involves an acid decomposition
followed by atomic absorption spectrophotometry for copper and acid
decomposition followed by inductively coupled plasma spectrometry for
iron (PMC, 2016). The composite samples analysis for Cu entailed two
methods; Cu-AA62a and ME-O62. The PMC laboratory follows atomic
absorption procedures (PMC, 2016).
Conclusion 3.10
In section 3, the number of drill holes for the FS study of Lift 1 was not
adequate to be representative of the cave and resource model. This
shortcoming attributed to the lower confidence in grade from the modelled
resource. PMC worked with the available information and consistently
found discrepancies between the head-grade and the modelled grade of
the resource. Continuous refinement and adjustments to the parameters
within PCBC followed as more information became available through time.
PMC started on the back foot with the Lift 1 resource calculations in that
Lift 1 had inadequate drilling information. Both the methodology to model
the resource and the sampling bias from poor representative sample sizes
featured throughout the LOM. Consequently, PMC remained in an
inevitable position to ensure that resource revisions occurred annually.
However, the actual sampling results which remained not acceptable to
good sampling practices, representation and biased provided valuable
information to understand the block cave behaviour despite its indicative
measure.
4 CREATING A TIMELINE FOR THE PMC RESERVE STUDIES
Introduction 4.1
This section looks back in recorded historical reports of previous onsite
studies, forming part of methods to refine and improve the resource grade
of Lift 1’s block cave. The section will cover the conducted studies
between 2002 and 2006. The section also reviews the significant

68
challenges recorded over time regarding the status quo of the resource
model for PMC’s first block cave.
Resource grade studies and reports on PMC’s block cave mine. 4.2
Historical written reports for PMC, covered in this section will provide a
summarised understanding of previous grade anomalies between the
head-grade and reserve model grade.
Reports dating from 2003 by Howson (2003) identified requirements for
the ore grade scrutiny and revision. Later in 2010, an audit and report
conducted by Snowden Consultants made recommendations for the PMC
block model and resource classifications (Snowden, 2010). This research
will discuss critical details, and anomalies found, but will not attempt to
expand the current knowledge base thereof.
The basis of initial SRK studies in 2002 and Howson in 2003 4.3
The elliptically shaped, and vertically dipping copper deposit of the PMC
mine comprises of a low-grade ore body where the open pit mine started
with production in 1956 (Glazer & Hepworth, 2006). The PMC copper
open pit’s last production blast occurred in April month during 2002. From
the approximately 903 million tonnes of ore mined from the open pit, PMC
produced about 4.8 million tonnes of refined copper. A total number of 2.1
million tonnes of ore and waste removed from the surface mining open pit
operation, the surface mining operation initiated possibilities to transition
underground by establishing a block cave mining operation below the
open pit. The transitioning to an underground operation indicated a
possible injection to the PMC’s life of mine (Glazer & Hepworth, 2006).
PMC started with the shaft sinking and development project of the
underground mine in 1995 while the actual caving initiation process
happened somewhere in April 2002. About eight months after the caving
started, the crown pillar between the upward propagating block cave and
the bottom of the open pit excavation presumably holed into one another.

69
The estimated crown pillar failure occurred approximately by the end of
2002 (Glazer & Hepworth, 2006). Late in 2002 after the block cave started
with production, the consulting company SRK reviewed the operation
since PMC produced low copper production grades (Howson, 2006). The
SRK report recommended additional required sampling of the orebody,
and SRK believed that the resource model was overestimating the in-situ
copper grades. Howson (2003), the principal consultant and geologist of
the technical services team from the Rio Tinto company investigated this
first resource grade anomalies which PMC experienced. Rio Tinto tasked
Howson (2003) to undertake additional studies at PMC which started in
December 2003 and onwards via the scheduled visits to the mine site.
During the studies of Howson (2003), an identified compliance
shortcoming at PMC required urgent attention as Howson (2006)
described and detailed it in his 2006 report. Howson (2006) described the
objective of the study in the documented report to support PMC with the
declaration of its copper resources and reserves while meeting the
Australasian “JORC” code compliance standards. These extensive
studies developing the reserve classification led to the deployment of a
technical tasked team from PMC’s largest shareholder company - Rio
Tinto (Howson, 2006).
Howson (2003) reported that a starting point for the required work evolved
from two other previous PMC reports namely the “Palabora Underground
Mining Project” (PUMP) and the Feasibility Study (FS). The first
“Feasibility Report – March 1994, Volume 2 – Ore Reserves” report,
needed substantial reviewing before it was at an acceptable standard.
The other report, “Feasibility Report – January 1996” included the
classification of “Mineable Reserves” which was accepted by PMC as the
basis for developing the block cave mine. These two available reports,
with its information and the interpretation thereof at the time, were
presumably satisfactory at first. However, an objective arose to
demonstrate that the occurring dolerite in the run of mine (ROM) ore was
70
controllable to maintain a satisfactory ROM copper grade (Howson, 2006).
The technical team decided to conduct a reconciliation study to compare
production grades with those grades estimated in the model. The findings
from their study gained momentum where conclusions indicated
exceeding biased copper grade estimations in the FS resource model in
the early stages of the production’s actual grades (Howson, 2006).
Further deepening the PMC economic crisis was to re-capitalise the Lift 1
project, because the project ran over schedule and created a capital
shortage. Hence Howson (2004b) indicated in April 2004 that PMC might
expect to be re-capitalised towards the third quarter of 2004. Howson
(2004b) also indicated the need to continue with the resource
reconciliation work, and where PMC ensured ongoing comparisons,
between the predicted resource-model grades and the actual production
grades. PMC also needed to re-develop a LOM production schedule,
including ore fragmentation predictions which will take place during
scheduling, since it would assist to forecast future equipment requirements
(Howson, 2004b). Howson (2004b) also indicated that the available
geotechnical information required a full review and verification. This
review should include the collation thereof into a database to assemble the
geotechnical model (Howson, 2004b).
Analysing and updating Palabora’s geological databases 4.4
Following the 2002 SRK report, Rio Tinto tasked their technical team to
conduct further analysis of the ROM and resource grade comparisons
(Howson, 2003). Howson (2003), analysed the geological data, in an
attempt to understand why the copper grade to that date was substantially
lower than the planned head grade. Howson (2003) visited PMC during 8-
17 December 2003 and worked with the PMC’s technical team on site to
initialise the grade discrepancy investigation. On the 19th of December
2003, Howson summarised their findings in a written memo labelled as
“Project GBG046”. In summary, Howson (2003) indicated that the
geological model showed an increase in dolerite content at the undercut

71
level but upwards the content remained the same. Howson (2003) also
stated that the production data revealed higher frequencies of pulling at
lower-grade draw bells than at higher-grade draw bells. Furthermore, the
remaining grade shortfall concludes to over pulling of dolerite draw bells
and an overestimation of the reserve grade in the blocks mined. Howson
strongly proposed the implementation of new software, hardware and
systems to utilise the current equipment on site (Howson, 2003).
Identified software limitations (2003) and required upgrades 4.5
The software and hardware in use during the original feasibility study
analysis were very outdated according to Howson, and thus
recommended new systems that will improve PMC’s analysis and reports
on grade control (Howson, 2003).
The resource model and associated data from the old (circa 1995) Hewlett
Packard (HP) “UNIX” computer operating system, required a transferral to
modern computer equipment and software for improved processing and
reconciliation (Howson, 2006).
The early study criticised the initial “Datamine” database system, which
dated back to the mid-nineteen-nineties as was driven by old computers.
Anne-Marie van den Heever from PMC assisted in exporting the resource
block model’s files from Datamine into Microsoft Access, better known as
the “Access Block Model” (ABM) (Howson, 2003). This new ABM further
enabled additional processing, and quality checking (Howson, 2003).
Howson’s associate Dave Frost-Barnes produced the new “Dolerite
Model” (NDM) and installed it into the “Access Block Model Database”
during the middle of 2003 (Howson, 2003). The model produced an
updated dolerite dilution and copper grades model (Howson, 2003). When
Howson (2003) and the team compared this model versus the 1995 FS
model, more dolerite than initial predictions showed, with indications of a
corresponding decrease in copper grade at the undercut level. However,
72
this new model’s results were similar to the 1995 expectation, which was
higher above the undercut level (Howson, 2003).
Valuable and irreplaceable information was at risk if the old HP system
failed. The old Datamine database comprised of drilling, assay, logging,
structural, zone modelling, and block-models (Howson, 2006). The
dolerite solid modelling, faults and all drill-hole data, strings and
wireframes as described in the FS grade zones, were safely transferred
and retrieved from the Datamine systems (Howson, 2006). Howson
(2006) and the team structured a well-documented summary of all the
transferred files, as is discussed in section 5. The exercise involved
timeous efforts to ensure that no or very little data was lost or omitted
during the transfer process.
Reconciliation also involved the revision of the FS resource model format,
into a new model format namely the “Draw Block Model” (DBM). Dolerite
dykes from more recent underground mapping in the vicinity and updated
block dolerite values with extended dimensions formed part of the
reconciliation (Howson, 2006).
The Howson (2003) report indicated that a successful transfer of the NDM
data into GEMCOM software realised on the 15th of December 2003, in
the United Kingdom town Bristol. This model’s transfer enabled the PCBC
program to produce block cave scheduling results, undertaken by Dr Tony
Diering who assisted with all the background parameter programming
within PCBC (Howson, 2003).
The analysis of contoured production data between May and November
2003, such as tonnes drawn per draw bell per month for the footprint area
comprised of superimposing these on plans of the grades at the undercut
level. The resultant indication was greater pull volumes of lower grade
material in the west of the cave than those volumes of higher grades found
in the east (Howson, 2003).
73
Additional plans evolved to transfer the NDM data into the Block-Caving-
Scheduling-system. This block cave scheduling-system, introduced and
produced by the consultant Robin Kear, attempted to compare the new
dolerite effects with those used in the FS. Howson (2003) reported that
the study of Kear showed that the MineCAD-based mining model data
needed a revision. Howson (2003) noted Kear’s argument that the model
presumably originated from the copper open pit data, which has not been
in use for several years (Howson, 2003).
Howson (2003) additionally highlighted that where the draw column and
dilution envelope designs misaligned from old MineCAD designs, such
required a re-design, as a result of changes since the FS. Howson (2003)
recommended that PMC should not attempt to make further progress with
this scheduling system, but instead follow the use of the GEMCOM’s
PCBC software for block cave scheduling. The recommendation to utilise
PCBC came as an industry standard for block cave scheduling, which was
already in use by several other operations, especially the Rio Tinto mines
(Howson, 2003).
Critical early revision of Lift 1’s resource model 4.6
A revision of the resource model concluded that the 20 x 40 x 60 metres
block sizes within the model to be unsatisfactory for reconciling the
progress of the block cave production and for scheduling in PCBC.
Howson (2003) suggested revising the block sizes with 20 x 20 x 20-metre
block sizes.
The resource required further revision to report lashed or loaded tonnages
extracted from each drawing point with readily assigned grades from the
DCM on a daily basis. Thus, daily grade estimates of grades from the
model became comparable with actual production grades, enabling further
investigation regarding the veracity of the models (Howson, 2006).

74
Figure 35 indicates the summarised revision process of the resource
model.
Palabora Underground Copper
Resource Model Revision
Feasibility
Study (FS)
Model
Draw-Block
Model
(DBM)
Draw-Column
Model (DCM)
Estimate
Dolerite Updates Lashing Tonnages
Grades etc.
Regular model,
OK with Gemcom
& MineCAD.
Large smoothed
blocks, good for
feasibility, but
mis-matched with
draw-columns.
Regular model,
OK with Gemcom
& MineCAD.
Small blocks, less
Smoothed, aligned
with draw-columns.
Good for Planning.
Non-regular model,
not for Gemcom
& MineCAD.
Blocks matched with
draw-columns. Easy
to process in database.
Good for Planning.
Figure 35 - Summary of the resource model revision
Source: (Howson, 2006)
The prematurely created 1995 FS resource model, emerged before the
economic and practical area of the block cave’s footprint was determined.
This first resource model caused a mismatch of the FS model grid and that
of the draw points. The created “Draw Block-Model” (DBM) from the
reconciliation process, coincided with the draw point intervals as was
required (Howson, 2006).
Initial grade shortfall indicators 4.7
Possible reasons for the shortfall in grade, from the initial analysis and
underground visit of Howson and the team during December 2003 found:
More dolerite at the undercut level and a shorter distance above it
than was initially expected,
Ore has been pulled at higher rates in the western areas of moderate
grade than from the higher eastern areas,
Excessive draw quantities from dolerite yielding draw points which
were mainly free flowing and not reported accurately,

75
Partially blocked draw points by large boulders of carbonatite
comprising of both carbonatite and dolerite, resultantly had dolerite in
smaller fragments running past the more massive carbonatite
boulders holding dolerites back.
Although no specific evidence existed, the original grade model may have
overestimated the grade (Howson, 2003).
The best test to the shortfall in grade would be through a comprehensive
sampling campaign at the production level, resulting in constant
disruptions to production (Howson, 2003). However, this recommendation
to conduct further sampling of the in-situ rock entailed a highly undesirable
procedure according to PMC. PMC decided to conduct a reconciliation
study instead of drilling, which aimed to compare production grades with
those estimated in the model (Howson, 2006).
Conclusion 4.8
In this section, it seems that the fixing of one concern led to several other
arising challenges. Systematically the best practice possibilities enabled
avenues to improve the resource model, but it was not immediately
possible. Notably, two main drivers contributed to the specific revision of
the PMC block cave’s resource model. The first driver was the grade
change between the mill grades and predicted modelled grade, and the
second driver was the identified geometric change and rectification
thereof. Section 5 elaborates more on the geometric details under point
5.6.2. An additional concern evolved when the introduction of PCBC also
indicated that the resource grade reflected higher-grade values than those
recorded from actual mining. Howson (2006) indicated that the
interpolation of the applied PCBC algorithm required refined adjustments.
Howson (2006) explained that the conducted and executed tests from
using different kriging methods sought ways to establish the correct
interpolation thereof. Howson (2006) managed to identify the initial grade
shortfall areas, which addressed the draw compliance.

76
5 NEW MILLENNIUM SOFTWARE AND SYSTEM CHALLENGES
Introduction 5.1
The revision of Palabora’s underground copper geology and resources
data project successfully retrieved and transferred FS data from the HP
UNIX Datamine system to a personal computer (PC). This section covers
a brief description of the process that followed to ensure best possible
accuracies while maintaining the data’s credibility (Howson, 2006).
Converting Datamine folders and models 5.2
A preceding February 2004 report covered the in-depth descriptive details
of folders and files retrieved and copied across to a more reliable, faster
and better PC. Howson (2006) indicated that the extracted files and
folders had the same names as the old Datamine databases, which
included:
Block models, with all the FS block model data,
Dolerite, with solid modelling or perimeters describing the FS
dolerite dyke envelopes as interpreted from previous drill holes,
Faults, with solid modelling or perimeters describing the FS faults as
interpreted from drill holes,
Holes, which included all drill hole data,
Strings, with solid modelling or perimeters describing the FS grade
zones as interpreted from drill holes,
Wire Frames, with solid modelling describing the FS grade zones as
interpreted from drill holes.
Upon investigation, the above details in the preceding 2004 report became
an annexure in the March 2006 report. After the files transfer, the study
indicated that the exported CSV files and direct data importation into
Microsoft (MS) Excel or MS Access were successful (Howson, 2006). The
exporting process indicated several challenges in handling the data
between files. Datamine exports output records with a maximum length of

77
240 characters only. Any Datamine table exceeding 30 fields risked a
truncation of the output records in MS Access. Therefore, if more than 30
fields existed, the output of fields occurred in concatenated groups of 20
each in the Access database (Howson, 2006).
The 2004 resource model revision 5.3
Howson (2004c) reported that the revision of the resource model started
during January and February 2004. This work was complementary to
work previously conducted as per section 4.6 above. Howson (2004c) and
the technical team made certain assumptions from the data in the model
to process information. The technical team assumed dolerite had a
tonnage factor value of 0.325 m³ per tonne, and consequently assigned
zero values for all applicable grades. The average tonnage factor
calculated at 0.329 m³ per tonne for all rock between 800 and 720 m
below mean sea level, in the footprint area of the cave (Howson, 2004c).
Howson (2004c) indicated that the cross-sectional draw column area
assumingly ranged in the size of 17 m x 17 m covering a 289 m² area.
Thus, a downwards distance of rock movement in a draw column for 1000
tonnes drawn, resultantly descends vertically by 1.14 metres at each
drawing point. Howson (2004c) assumed the base of the caving was
towards the floor of the production level, which was 18 m (Howson,
2004c). The delimiters above were perimeters for Howson’s calculations
within the resource review.
Transformation of coordinate systems 5.4
Howson (2004c) found two sets of coordinates in use during the feasibility
study of Lift 1. These comprised of the initial geographical coordinates in
the geological modelling and differed from the mine planning Longitude of
Origin (LO) coordinate system. The geographical coordinates increased
east on the X-axis and north on its Y-axis. The LO system increases its X
to the south and the Y to the west and requires a conversion of
coordinates to match the locality and geological models. The known term

78
for this conversion of coordinate systems is the transformation of
coordinates. With the introduction of the GEMCOM software to PMC,
GEMCOM generated the third set of coordinates, which are the reversed
LO system coordinates. The z values in elevation between the data sets
remained the same throughout the process of data synchronisation as was
imported (Howson, 2004a).
The applied transformation process of the required co-ordinate
conversions for Datamine’s Geo-models implicates a rectification formulae
as is shown below:
LOX = 26 000 – GeoY GeoX = 0 – 11 000 – LOY,
LOY = 0 – 11 000 – GeoX GeoY = 26 000 – LOX.
Note that the omitted constant of 2 630 000 in the LOX value is for
simplicity reasons at PMC.
A third ‘GEMCOM’ system evolved and resulted in accordance with the
following transformation formulae:
GemcomX = GeoX + 11 000 GeoX = GemcomX – 11 000,
GemcomY = GeoY – 26 000 GeoY = GemcomY + 26 000,
GemcomX = 0 – LOY, LOX = 0 – GemcomY,
GemcomY = 0 – LOX, LOY = 0 – GemcomX.
The reports of Howson (2006) and the team’s documents described
detailed processes and steps followed in the entire amendment process.
Misaligned draw points and draw columns 5.5
Howson (2004b) highlighted the volume of significance before describing
the geological information. In Figure 36 the production level in grey and
draw points in blue defines the footprint outline.

79
Figure 36: Footprint design indicating draw points
Source: (Howson, 2004b)
A summary of the different created models 5.6
This section and the list below discusses the different created models
briefly, and elaborates in more detail how they serially improved the
previously created model:
The FS Model
The FS Grade Model
The FS Dolerite Model and Dolerite Dilution
The New Dolerite Model (NDM), 2003
The Draw Block Model (DBM)
The Draw Column Model (DCM)
The FS model 5.6.1
In March 1994, the FS report Volume 2 and titled “Ore Reserves”
describes the geology and geological modelling (Howson, 2004c). The FS
model represented the block cave as a regular block model comprised of
blocks with a 40 m East-West by 20 m North-South, and a 60 m vertical
size. This model reflected the emplacement sequence of intrusive rocks in
two parts namely: “Non-dolerite grade model” and “dolerite model”
(Howson, 2004c). The separation of these two main parts in the FS model
resultantly came as a requirement to update each part independently.
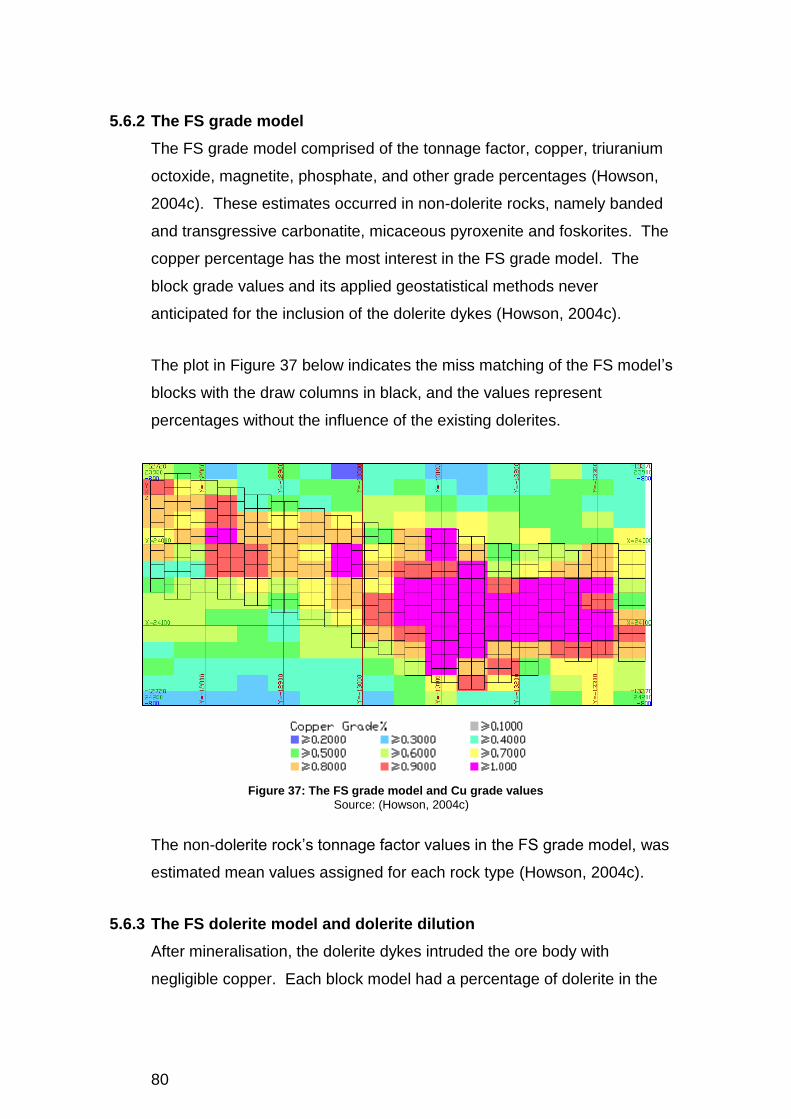
80
The FS grade model 5.6.2
The FS grade model comprised of the tonnage factor, copper, triuranium
octoxide, magnetite, phosphate, and other grade percentages (Howson,
2004c). These estimates occurred in non-dolerite rocks, namely banded
and transgressive carbonatite, micaceous pyroxenite and foskorites. The
copper percentage has the most interest in the FS grade model. The
block grade values and its applied geostatistical methods never
anticipated for the inclusion of the dolerite dykes (Howson, 2004c).
The plot in Figure 37 below indicates the miss matching of the FS model’s
blocks with the draw columns in black, and the values represent
percentages without the influence of the existing dolerites.
Figure 37: The FS grade model and Cu grade values
Source: (Howson, 2004c)
The non-dolerite rock’s tonnage factor values in the FS grade model, was
estimated mean values assigned for each rock type (Howson, 2004c).
The FS dolerite model and dolerite dilution 5.6.3
After mineralisation, the dolerite dykes intruded the ore body with
negligible copper. Each block model had a percentage of dolerite in the

81
dolerite model. During the FS, Datamine software modelled the dykes as
perimeters on successive levels. By determining the proportion of each
block lying within a dyke’s perimeter produce an assigned percentage of
dolerite by volume allocated to each block (Howson, 2004c). Through the
determining of “dolerite-diluted” copper grade (Gdd) values, enabled grade
predictions made from the block model. According to the Howson (2004c)
report the applied formulae to calculate the mass-weighted mean, while
assuming that the copper grade of dolerite is zero is: Gdd = Gc x (100 –
Dol) / (Td + 100 – Dol).
The average tonnage factor of 0.325 seemed to be a constant since there
was minimal variation in the dolerite. The adjustments to the FS model
resulted in the FS dolerite model as is shown in Figure 38.
Figure 38: The FS dolerite model and resulting copper grades at – 800 m elevation.
Source: (Howson, 2004c)
The blocks indicated as white areas had copper grades of less than 0.1%
Cu and were essentially dolerite. The newly calculated grades in the FS
dolerite model indicated in Figure 38 compares reasonably well with those
in Figure 37 for higher than 0,7 % Cu (Howson, 2004c).

82
The “New Dolerite Model” (NDM), 2003 5.6.4
During a software training exercise with the GEMCOM system in 2001, the
modelling of dykes via a “solid-modelling” technique created TIN
envelopes. A small number of 3D triangulated network of dolerites and
non-dolerite rock contacts in drill holes formed envelopes by manual
interpretation. This construction formed dolerite dykes in form and
volume, where proportions of each block within dyke envelopes
determined the dolerite percentage assigned to its volume (Howson,
2004c). This NDM was more representative than its former Datamine-
based FS model. However, the mapping conducted in the Eastern end of
the footprint area indicated inaccuracies in the “New Dolerite Model”.
Howson (2004c) modified this area precisely as the rest of the footprint,
still had to be developed. Figure 39 below illustrates the dolerite dilution of
the FS copper grades at – 800 m elevation (Howson, 2004c).
Figure 39: The dolerite dilution of the FS copper grades
Source: (Howson, 2004c)
Howson (2004c) reported that an M.Sc. student Joerg Neff completed the
mapping model, but there was no full updated version conducted due to
personnel movements. In the plotted Figure 40 below, a comparison
shows the undercut level with mapped dolerite dyke contacts in blue dots

83
corresponded partially with the green intersections of the NDM TIN
dolerite envelopes (Howson, 2004c).
Figure 40: Mapped dolerite dykes versus the NDM tin envelopes
Source: (Howson, 2004c)
The above comparison indicated inaccuracies in all the dykes, and some
dykes like the far left dyke showed narrowing or irregular stringers, which
are complicated to present in the model. The dolerite dilutes the grades
sampled from ROM ore, and for comparison, the FS model grades
required the same dilution by the modelled dolerite (Howson, 2004c). In
all simplicity, most updated geological information is a requirement in any
current applied model. Howson (2004) stated that the created dolerite
model achieved only a partial completion up to the -720 m elevation in the
GEMCOM system. This partial model was according to the mapping and
thoroughly revised. The revision enabled the assignment of the dolerite
percentage value per block from these envelopes and Howson (2004a)
titled this model as the “Draw Block Model”.
The “Draw Block Model” (DBM) 5.6.5
The FS block model configuration indicated it was not ideal for comparison
with production figures (Howson, 2004c). In facilitation of the
reconciliation, a revised model was required from the FS model data,

84
having blocks coinciding with the draw point intervals, namely the “Draw
Block Model” (Howson, 2006). To determine the dolerite quantities within
each large block, Howson (2006) involved the smoothing of information.
The second stage of smoothing was required to determine the dolerite in
the draw columns from the miss-matched blocks (Howson, 2004c).
Similar to the updating from mapping data, the block configuration
changes involved coinciding blocks in the model with the draw columns’
positions. This change formed part of the geographical change PMC’s
model required.
The DBM parameters and configuration entailed the following:
X (Easting) Y (Northing) Z (Elevation)
Number of blocks 44 35 36
Block sizes 17 m 8.5 m 10 m
Gemcom Min Coordinates 12646 -24195 - 840
Gemcom Max Coordinates 13394 -23897.5 - 480
The copper and all other grade updates followed by intersecting each
DBM block with its appropriate FS model block. Consequently, this
enabled the determined grades in the DBM blocks through the application
of the weighted mass means of grades in the intersecting volumes. This
calculation itself involved the smoothing of the FS grades (Howson,
2004c). However, Howson (2004c) stated that the latter smoothing
process would replicate the smoothing of draw column grades determined
from the FS model’s blocks at an insignificant level. In Figure 41 below,
the plot indicates the dolerite diluted copper grades in the DBM at -800 m
with more significant improvements noticeable than the plot in Figure 39.

85
Figure 41: The dolerite diluted copper grades in the DBM model
Source: (Howson, 2004c)
The comparison of the DBM model plot, with relation to the other plots,
illustrated the draw columns coinciding with two model blocks, including
the position and grade influence the main dykes had. Therefore, the
second stage of smoothing was not required, and the reduction of the
block size caused a further lateral and vertical smoothing reduction in the
first stage’s dolerite determination (Howson, 2004c).
The “Draw Column Model” (DCM) 5.6.6
The DCM followed from the DBM by a simple combination of values in
pairs of adjacent blocks, which fell within the same draw column (Howson,
2006). The resultant array of blocks in plan-view, plot blocks at an offset
to the North-South columns. The DCM in the database provided grades
for reconciliation purposes. The offset North-South columns rendered the
DCM inappropriate for use in mine planning programs, where the DBM
was more suitable for such use (Howson, 2006).
When comparing Figure 42, Figure 43, and Figure 44, the DCM indicated
a variation of copper and dolerite grades with depth.

86
Figure 42: Copper percentage x 100 grades from the DCM at level –795m
Source: (Howson, 2004c)
Figure 43: Copper percentage x 100 grades from the DCM at level –745m
Source: (Howson, 2004c)
Figure 44: Copper percentage x 100 grades from the DCM at level –695m
Source: (Howson, 2004c)

87
An investigation of the above plots resulted in an additionally created
graph as per Figure 45 which indicates the variation in the dolerite and
copper grades with their respective elevations for all draw columns.
Figure 45: Variation in dolerite and copper grades with elevation for all draw columns
Source: (Howson, 2004c)
Although the undercut base is at about -800 m and the bottom of the open
pit above lies at about -300 m, Howson (2004c) advised in his report that
the interpretation of the graph above was problematic. It may appear that
an expected grade at the start of production was well represented and
indicated by the “Copper % X 10” trace just above the -800 m elevation.
This interpretation of the graph was however not correct since the
historical reports indicated that more mining of material occurred at the
centre of the block cave (Howson, 2004a). At the centre, the grade was
usually higher in the earlier years, and that mining reports should have
indicated significantly higher grades mined. In later years, Howson
(2004c) expected a decrease in grade, when more ore drawing from the
periphery during production would follow.

88
Draw point production figures 5.7
The captured Excel production records from each of the 324 block-caving
draw points and the number of LHD buckets counted per shift for each
drawing point was on the PMC network. Howson (2003) and the team
indicated that from their understanding during the early production phase,
LHD operators reported their numbers from memory recollection after
shifts until mid-December 2003. A new dispatch system resolved the
inaccuracies from such memory recall process (Howson, 2006).
The LHD bucket factor to convert buckets into tonnage in 2003 rose from
the initial 8.6 tonnes per bucket to 9.7 tonnes in 2004. During the study
conducted from 13 to 30 January 2004, the backdated number of kilotons
drawn from each drawing point from the start of caving was 9300 kt more
until 12 January 2004 (Howson, 2004c). The updated and plotted
production figures for the PMC cave shown below in Figure 46 is as per
colour-coded ranges between 10 kilotons.
Figure 46: Production figures in kilotons from the start of caving until 12 January 2004
Source: (Howson, 2004c)
In a review of the above plot, with the previous DBM dolerite diluted
copper grades, it is apparent that the highest tonnes produced were from
areas with high dolerite. This indication indicated that more production
from higher dolerite areas substantially accounted for the low grades
achieved in 2003 (Howson, 2004c).

89
An additional plot from a trail of tonnes drawn with specific results between
13 and 30 January 2004 shown in Figure 47 below indicated some
detected inaccuracies per kiloton. These numbers are not from the
dispatch system but came from the operators’ handwritten lashed sheets
(Howson, 2004c).
Figure 47: 1 Kilotonne LHD operator lashing inputs from 13 to 30 January 2004
Source: (Howson, 2004c)
The former inputs from the trial study are to be very accurate in excess
bearing dolerite crosscuts, due to dolerite control during the indicated trail
(Howson, 2004c). A noticeable inaccuracy such as 1.2 kt reported from
the wrong draw point on the west side of the mine reflected in the third
column from the left which was concerning. An average calculated
tonnage factor for all rock in every draw column between the - 800 and –
720 m elevation was 0.328 mᶟ/t (Howson, 2004c). Each draw column has
an area of 17 m x 17 m, and hence a metre of the column contained on
average 878.56 tonnes. Thus, a thousand tonnes drawn from a draw
point represented 1.14 m of the draw column height as an average figure
(Howson, 2004c).
It was concurrently and theoretically possible to determine how far up in
meter units each draw column of the original in-situ rock the quantity
reports from. The comparison between the given quantity taken from a

90
draw point and the previously known tonnages lashed at the same draw
point was analysed (Howson, 2004c).
The referred exercise above took a variable base elevation of 18 m above
the draw point floor and calculated the elevation of the original in-situ rock
for each draw column. The conducted exercise followed for the dates
between 13 January start of shift up until 30 January end of the shift. The
results produced a defined volume in each column, from which an
extracted grade value reported from the block model (Howson, 2004c).
The tonnages drawn from 13 to 30 January 2004 indicated that the mass
weighed mean grades for the total mined volume was 12.5% dolerite by
volume based on the DBM. The copper grade resulted in 0.78% for the
same period of mining (Howson, 2004c). Daily tonnes drawn during this
trial period did not vary significantly with a mean of 20.1 kt while the
minimum and maximum values calculated to be between 17.1 kt and 22.7
kt respectively (Howson, 2004c). The determined grades for these
specific tonnages and resultantly from the DBM as per the graph in
Figure 48 below indicated a relative constant copper production grade.
Figure 48: Model-estimated dolerite and copper grades for the dolerite trail period
Source: (Howson, 2004c)
91
Conclusion 5.8
During the resource model grade and head grade investigation, Howson
(2004c) indicated that the computer systems in use by PMC posed a
stability risk regarding data losses. If the old PC encountered any system
or hardware issues, the available data could be irrecoverable. Alternative
acquired systems ensured that data transfers realised with exceptional
care, and maintained their accuracies and integrity. The transformation of
coordinate systems, and different created models for dolerite, grades, and
draw blocks formed part of the conversion. The data conversion exercise
was successful according to Howson (2004c).
6 THE GRADE RECONCILIATION STUDY (2004-2005)
Introduction 6.1
This section analysed the reconciliation study, conducted by the technical
teams and Howson (2006). The grade reconciliation study aimed to
determine how well the production grades corresponded with the extracted
grades from the resource model. A good correspondence would conclude
an adequate representation of the material that was minable in future.
Ultimately, such representation will indicate reliable predictors for future
production from the resource and reserve estimates (Howson, 2006).
Mill production Cu grades versus mucked Cu grades from the model 6.2
Graphs indicated the comparison between production tonnages and grade
figures, from supplied PMC concentrator monthly spreadsheets. The
mining section supplied figures for mucked tonnes from each drawing
point per day. These draw point positions determined the location of the
grade in the model in the horizontal plane (Howson, 2006). The total
tonnes mucked from each drawing point determined the material located
in the vertical direction. In the early stage of the block cave, the
presumably drawn material situated above the draw point in its 17 m x 17
m draw column will arrive and report at the draw point in an orderly
sequence during drawing (Howson, 2006).
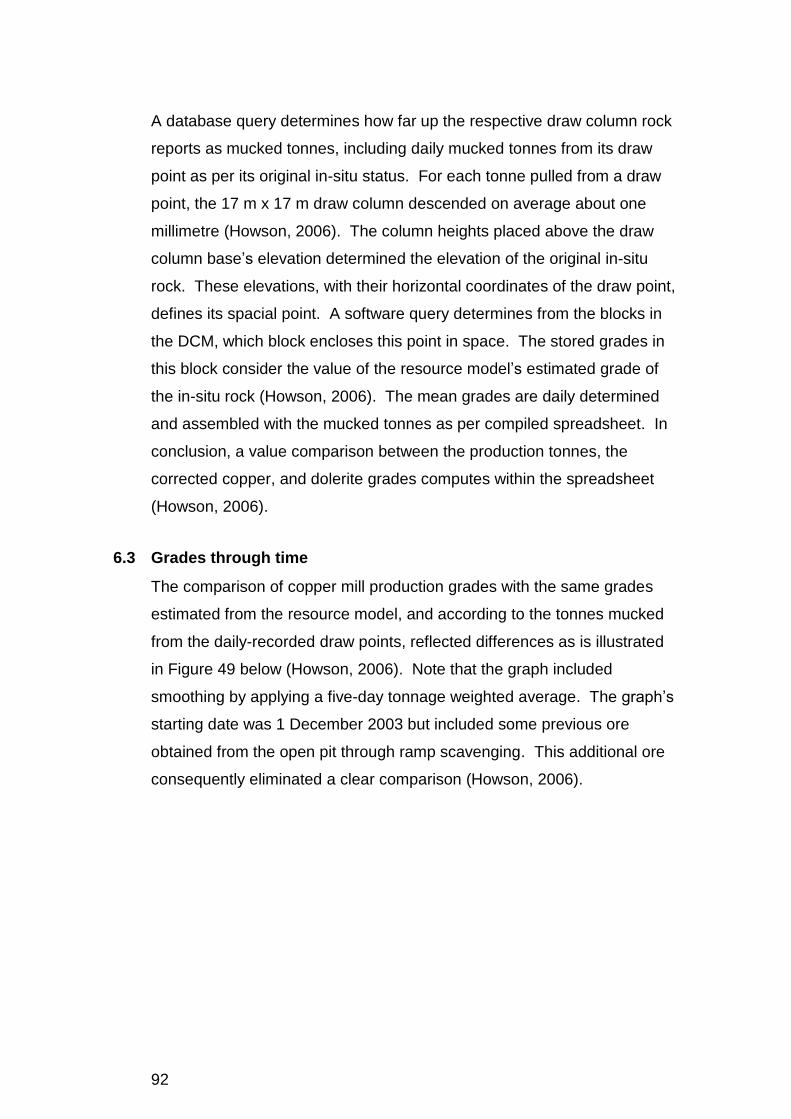
92
A database query determines how far up the respective draw column rock
reports as mucked tonnes, including daily mucked tonnes from its draw
point as per its original in-situ status. For each tonne pulled from a draw
point, the 17 m x 17 m draw column descended on average about one
millimetre (Howson, 2006). The column heights placed above the draw
column base’s elevation determined the elevation of the original in-situ
rock. These elevations, with their horizontal coordinates of the draw point,
defines its spacial point. A software query determines from the blocks in
the DCM, which block encloses this point in space. The stored grades in
this block consider the value of the resource model’s estimated grade of
the in-situ rock (Howson, 2006). The mean grades are daily determined
and assembled with the mucked tonnes as per compiled spreadsheet. In
conclusion, a value comparison between the production tonnes, the
corrected copper, and dolerite grades computes within the spreadsheet
(Howson, 2006).
Grades through time 6.3
The comparison of copper mill production grades with the same grades
estimated from the resource model, and according to the tonnes mucked
from the daily-recorded draw points, reflected differences as is illustrated
in Figure 49 below (Howson, 2006). Note that the graph included
smoothing by applying a five-day tonnage weighted average. The graph’s
starting date was 1 December 2003 but included some previous ore
obtained from the open pit through ramp scavenging. This additional ore
consequently eliminated a clear comparison (Howson, 2006).

93
Figure 49: Smoothed ROM vs estimated copper grades through time
Source: (Howson, 2006)
In the above comparison, the mucked copper percentage from the model
indicated a higher copper percentage grade than the mill production
copper percentage. The strong cyclicity in ROM grade shows an amplified
representation in the mill production and Howson (2006) ascribed this to
bias in the mill feed assays while the mucked copper grade seemed
overestimated. Similar to the produced graph above, an additional
constructed graph followed for dolerite grade percentages, based on silica
grade percentages (Howson, 2006). Note that the milled production
dolerite percentage only started in January 2004. At the time, routine
analysis for silica in the mill feed started, enabling the determination of
dolerite in the mill feed as per illustrated graph in Figure 50 below
(Howson, 2006).

94
Figure 50: Smoothed ROM vs estimated dolerite grades through time
Source: (Howson, 2006)
In Figure 49, from the middle of 2004, it was apparent that the copper mill
production grades were significantly less than the corresponding grades,
as was estimated from the FS resource model. In Figure 50, the mill
production dolerite grade- estimates from silica grades were more than the
corresponding grade estimates from the dolerite model (Howson, 2006).
From the above, Howson (2006) indicated a copper grade shortfall and
suggested additional testing to establish whether it resulted from dolerite
dilution as was expected. In Figure 51 below, the compared copper
grades with the influence of dolerite removed reflected that the mill
production undiluted Cu percentage was much lower than the mucked
model having undiluted Cu percentages. The aforementioned compared
grades, which Howson (2006) termed “un-diluted copper grades”,
represented the copper grade of non-dolerite rock for both the mill and the
FS model.
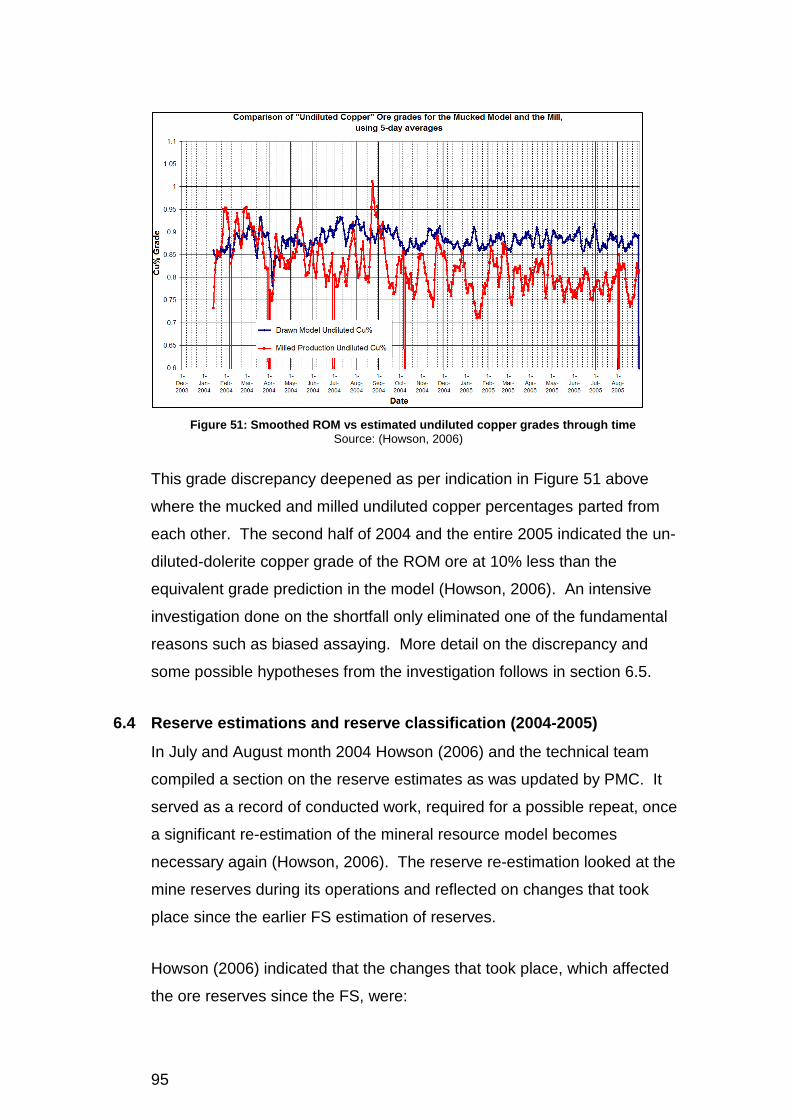
95
Figure 51: Smoothed ROM vs estimated undiluted copper grades through time
Source: (Howson, 2006)
This grade discrepancy deepened as per indication in Figure 51 above
where the mucked and milled undiluted copper percentages parted from
each other. The second half of 2004 and the entire 2005 indicated the un-
diluted-dolerite copper grade of the ROM ore at 10% less than the
equivalent grade prediction in the model (Howson, 2006). An intensive
investigation done on the shortfall only eliminated one of the fundamental
reasons such as biased assaying. More detail on the discrepancy and
some possible hypotheses from the investigation follows in section 6.5.
Reserve estimations and reserve classification (2004-2005) 6.4
In July and August month 2004 Howson (2006) and the technical team
compiled a section on the reserve estimates as was updated by PMC. It
served as a record of conducted work, required for a possible repeat, once
a significant re-estimation of the mineral resource model becomes
necessary again (Howson, 2006). The reserve re-estimation looked at the
mine reserves during its operations and reflected on changes that took
place since the earlier FS estimation of reserves.
Howson (2006) indicated that the changes that took place, which affected
the ore reserves since the FS, were:

96
The deepening of the open pit beyond the planned FS depth and ramp
scavenging,
The resource model revision with the re-interpretation of dolerite from
underground mapping,
The draw bell layout revision, and loss of row “W” at the western end
of the footprint, the addition of “A1” and changing the initially planned
number of draw bells from 172 to 166,
The ore depletion from the block cave production until the end of
2003,
Depletion from the block cave production since January 2004.
Reserve volumes 6.4.1
In Figure 52 below, the 3-D image illustrates the volumes modelled during
the FS, to determine the block cave reserves. The illustration indicates
the volume in green for the planned final bench perimeters of the open pit,
not forming part of the block-cave reserves (Howson, 2006).
Figure 52 illustrates the block cave reserve as summarised blocks from
one to thirteen. The planned 172 draw bells shown in yellow are from
block number one. Block number two comprises of the undercut, which is
a sub-horizontal 4 m high layer in purple and just visible above the draw
bells. The draw columns in deep blue above the undercut are the number
three to number eight blocks (Howson, 2006). The turquoise nested
volumes which surrounds the draw columns shows a truncation above by
the open pit benches and forms part of blocks nine to thirteen (Howson,
2006).
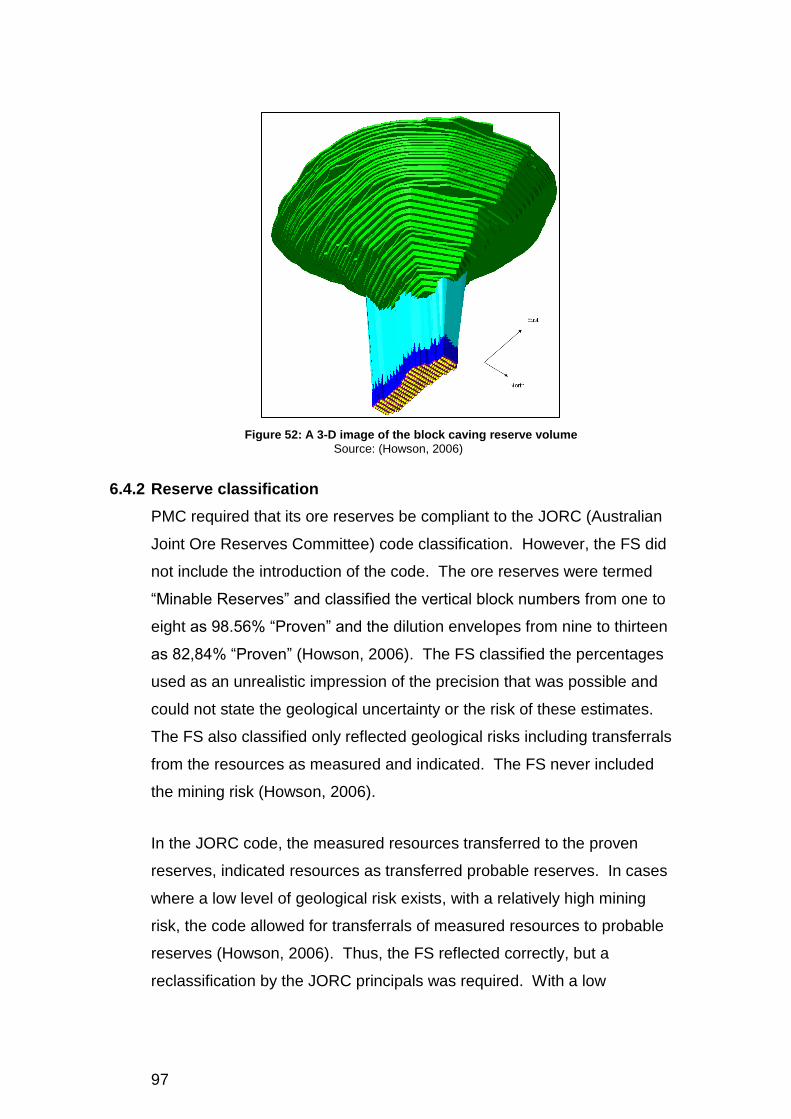
97
Figure 52: A 3-D image of the block caving reserve volume
Source: (Howson, 2006)
Reserve classification 6.4.2
PMC required that its ore reserves be compliant to the JORC (Australian
Joint Ore Reserves Committee) code classification. However, the FS did
not include the introduction of the code. The ore reserves were termed
“Minable Reserves” and classified the vertical block numbers from one to
eight as 98.56% “Proven” and the dilution envelopes from nine to thirteen
as 82,84% “Proven” (Howson, 2006). The FS classified the percentages
used as an unrealistic impression of the precision that was possible and
could not state the geological uncertainty or the risk of these estimates.
The FS also classified only reflected geological risks including transferrals
from the resources as measured and indicated. The FS never included
the mining risk (Howson, 2006).
In the JORC code, the measured resources transferred to the proven
reserves, indicated resources as transferred probable reserves. In cases
where a low level of geological risk exists, with a relatively high mining
risk, the code allowed for transferrals of measured resources to probable
reserves (Howson, 2006). Thus, the FS reflected correctly, but a
reclassification by the JORC principals was required. With a low
98
geological risk in the FS, the material in these blocks reflected almost an
entire classification within the “proven” category. The acceptable
reconciliation results indicated confidence in the estimation of this material
with consistency in the “measured resources” classification (Howson,
2006). The given mine plan included drawing of all the draw points,
beyond their vertical extent, and it was thus very likely that virtually all
material above the draw points will eventually report to the draw points.
Adverse “chimneying” effects could delay some material and dilute or
replace material from the surrounding dilution envelopes in a negligent
manner. Hence, the mining risk remained low (Howson, 2006).
The dilution envelopes of blocks nine to thirteen needed reclassification to
report as probable reserves. An overall level of geological risk at the FS
for this material was higher than for the vertical blocks. In considering the
geological risk alone, this material still needed their classification as
measured resources and required a transfer to proven reserves (Howson,
2006). The resource estimation as a whole implies some reduction in the
geological risk from the acceptable reconciliation results. However, a
significant mining risk exists in the extraction of the dilution envelopes. An
expectancy existed from the plan that material will travel towards the draw
points. During rock slope failures, these vertical blocks’ material flow
subjects to a series of design caving angles (Howson, 2006). On the other
hand, failures of the material may not happen as per planned predictions,
and may not arrive at the draw points at all. In some areas, the material
may fail at much lower predicted design angles. Failures can result in
much lower grade material or as waste from the periphery of the open pit
moving towards the draw points, ahead of the dilution envelope material
(Howson, 2006). Lower grade material could preclude the extraction of
higher-grade material to follow. Howson (2006) hence indicated that the
uncertainty in the way that the dilution envelopes will fail implied a
significant mining risk, which required a reclassification to be probable and
not proven reserves. Only with greater certainty on the models of failure,

99
upgrading of some of the reserves to proven reserves was possible
(Howson, 2006).
The JORC code required resources to have “reasonable prospects for
eventual economic extraction”. At the Palabora Mine block cave, any
mineralised material, which lies outside the existing reserve envelope,
may have such prospects; else, they would be within the reserves. Any
additional resources to the reserves were concurrently not reported
(Howson, 2006).
Reasons for lower than expected copper grades 6.5
During 2004 and 2005, the measured production grades at the mill were
lower than the estimated FS grades. The “Grade Reconciliation Study”
indicated that the mill feed contained about 10% less copper that may be
predicted from the FS model and as per the DBM’s indication (Howson,
2006). Further clarity was required since very little evidence was
conclusive. However, Howson (2006) indicated that discussions and
investigations transpired through their work. Notably, possible reasons for
the discrepancy such as bias in the mill feed assays and appropriate
corrections to calculations improved the discrepancy to a certain degree
(Howson, 2006).
Summary for the grade discrepancy 6.6
Howson (2006) stated that there was no specific reason which contributed
to the grade discrepancy Palabora experienced. However, several
reasons which were rather significant in combination contributed to the
grade discrepancy. The phasing of the FS caused a severe inadvertent
problem in the use of the mineral resource model, and Hoswon (2006)
considered the overriding reason for the discrepancy in the following ways:
During phase 3 of the FS, a massive planned footprint area led to the
drilling, modelling, and geological reviews from that assumption. The

100
phase 3 mine plan’s rejection followed by a reduction in the draw
points (Howson, 2006).
During phase 4, no further geological involvement occurred as the
phase 3 model assumingly would suffice. The much smaller planned
footprint focussed only on the higher-grade core of the deposit
(Howson, 2006).
The coarse variability of the deposit and local inaccuracies became
much more significant via the adjustment to a smaller and more
particular volume (Howson, 2006).
The substantial reduction in the level of drilling indicated much of the
phase 3 drilling resided outside the footprint. With the relative low
horizontal grade continuity, the formerly excluded drilling was
ineffective, to control the estimation of the minable grade (Howson,
2006).
Hypotheses concerning the FS copper estimation 6.7
The probability existed that the FS model overestimated the copper grade
globally or locally. This overestimation concerned the volume mined
during 2004 and 2005, which lies between the elevations -790 m, and -590
m within the footprint area. Howson (2006) noted at this stage that
overestimation does not necessarily apply to the entire model. The
following hypotheses explain the possibilities in short.
Drilling data density hypothesis 6.7.1
Drilling data densities indicated that the drill hole sampling of the smaller
phase 4 footprint mining volume was inadequate in number and included
the core diameter of holes. The drill-hole size is relatively small in the
coarse nature of the mineralisation, leading to no small estimation
variance (Howson, 2006). In Figure 53 below, the indexing finger points at
Palabora’s carbonatite copper mineralisation found at an oversized
boulder in a draw point. The pale groundmass is carbonate, and the
darker grey patches are magnetite. The copper mineral is bornite and
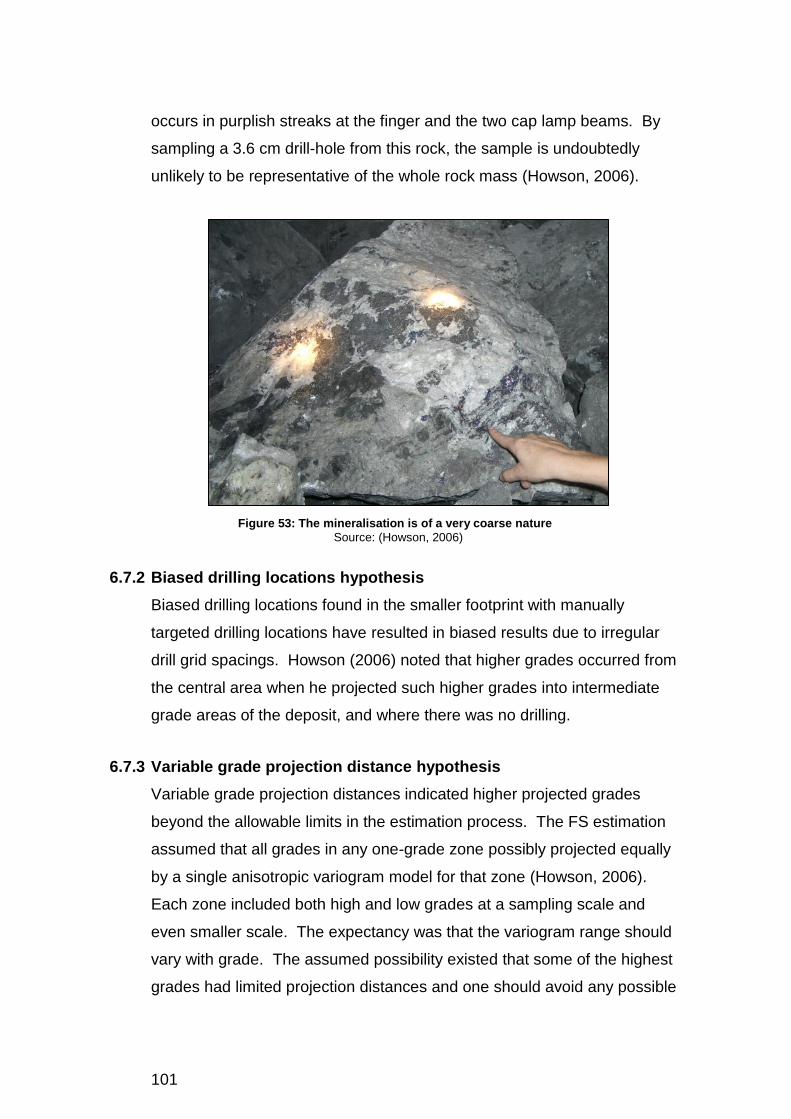
101
occurs in purplish streaks at the finger and the two cap lamp beams. By
sampling a 3.6 cm drill-hole from this rock, the sample is undoubtedly
unlikely to be representative of the whole rock mass (Howson, 2006).
Figure 53: The mineralisation is of a very coarse nature
Source: (Howson, 2006)
Biased drilling locations hypothesis 6.7.2
Biased drilling locations found in the smaller footprint with manually
targeted drilling locations have resulted in biased results due to irregular
drill grid spacings. Howson (2006) noted that higher grades occurred from
the central area when he projected such higher grades into intermediate
grade areas of the deposit, and where there was no drilling.
Variable grade projection distance hypothesis 6.7.3
Variable grade projection distances indicated higher projected grades
beyond the allowable limits in the estimation process. The FS estimation
assumed that all grades in any one-grade zone possibly projected equally
by a single anisotropic variogram model for that zone (Howson, 2006).
Each zone included both high and low grades at a sampling scale and
even smaller scale. The expectancy was that the variogram range should
vary with grade. The assumed possibility existed that some of the highest
grades had limited projection distances and one should avoid any possible

102
projection and instead consider it as pure nugget mineralisation (Howson,
2006). The FS did not address that the estimation took variable ranges of
high and low grades into account, and where the highest grades could
only be projected a short distance if at all (Howson, 2006).
Grade zoning interpretation hypothesis 6.7.4
Grade zoning areas never identified risks inherent in construction via
grade zones with limited data. It is not clear what the proportion of the
discrepancy was due to grade zoning. A re-calculation of the resource
model without the grade zoning may eliminate such undesirable effects,
but it would remain subjective to the issue (Howson, 2006).
Non-consideration of density in grade estimation hypothesis 6.7.5
Howson (2006) noted that the density in grade estimation excluded the
grade and density relationships during the estimation. On the other hand,
variable density means that samples have different support regarding the
sample mass. Despite the applied kriging to the grades, expressed as the
mass of copper per unit mass of rock, the assumption was that all samples
had equal support. However, the density still had a negative relationship
with the biased copper grade estimation. In Figure 54 below, the scatter
plot indicates the relationship between the density and copper grade, but
without a clear correlation.
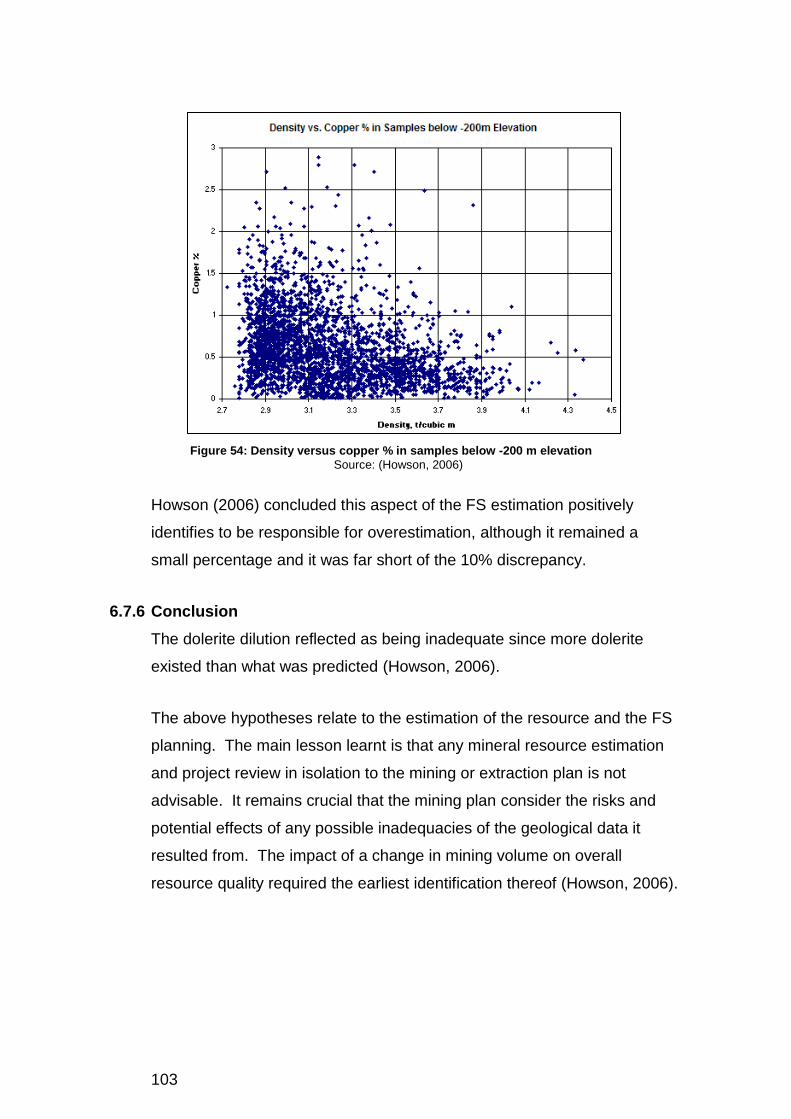
103
Figure 54: Density versus copper % in samples below -200 m elevation
Source: (Howson, 2006)
Howson (2006) concluded this aspect of the FS estimation positively
identifies to be responsible for overestimation, although it remained a
small percentage and it was far short of the 10% discrepancy.
Conclusion 6.7.6
The dolerite dilution reflected as being inadequate since more dolerite
existed than what was predicted (Howson, 2006).
The above hypotheses relate to the estimation of the resource and the FS
planning. The main lesson learnt is that any mineral resource estimation
and project review in isolation to the mining or extraction plan is not
advisable. It remains crucial that the mining plan consider the risks and
potential effects of any possible inadequacies of the geological data it
resulted from. The impact of a change in mining volume on overall
resource quality required the earliest identification thereof (Howson, 2006).
104
Hypotheses not concerning the FS copper estimation 6.8
Dolerite dilution hypothesis 6.8.1
The copper grade was lower since dolerite was present in the Mill feed in
higher proportions than planned in the FS. Howson (2006) reasoned that
the dolerite proportion in the FS model was under-estimated, or dolerites
preferentially gravitated towards the draw points. The higher than
expected dolerite levels had a minor influence on the copper grade and
was not accounting for most of the discrepancy (Howson, 2006).
Surface dilution Hypothesis 6.8.2
Early dilution from the open pit collapse reported at the draw points where
low-grade material from the open pit walls, migrated downwards through
the broken rock in the block cave to reduce the grade. The fast-moving
fine-grained surface material appeared in more massive proportions than
expected at the draw points. At the time of the investigation, there was no
clear evidence from geologists to conclude this hypothesis yet (Howson,
2006).
Preferential secondary fragmentation of low-grade hypothesis 6.8.3
As secondary fragmentation occurred in the cave column, lower grade
material being less hard, crush easier than the stronger higher-grade rock.
Thus, the lower grade material in smaller particle sizes descended faster
to report at the draw points much sooner. As there was no evidence on
this yet, a recommendation by Howson (2006) followed to investigate
more into this expectancy.
Variable bucket factor hypothesis 6.8.4
Tonnages drawn from draw points by LHD loaded buckets, varied in factor
especially in higher than average at lower-grade draw points, and lower
than average in higher-grade draw points. Where bucket factors varied
between eight and eleven tonnes per bucket, the bucket factor seemed

105
unlikely to be more than a minor contributor to the discrepancy (Howson,
2006).
Incorrect in-situ height hypothesis 6.8.5
The estimates of the FS model assumed a rate of descent of broken rock,
which was constant for each tonne pulled across the 17 m x 34 m area
attributed to each draw bell. The previous tonnes pulled from a draw bell
determined how far up were the ore’s in-situ location. When less than the
full draw bell area descended, then the exact in-situ location was much
higher up, causing a decline in grade which led to the discrepancy
(Howson, 2006).
Draw control hypothesis 6.8.6
The dispatch system did not work adequately, in that lower-grade material
was preferentially mined relative to the recorded data. It seemed that this
material was more accessible to obtain, and resulted in “good” production
rates from lower-grade draw points. At the time Howson (2006) indicated
that this hypothesis seemed unlikely.
Conclusion 6.9
The grade reconciliation study involved several hypothesis studies, which
investigated improvements of the resource model. The reserve estimates
served as a framework during any required repeat or re-estimation. Since
the FS most of the changes affecting the ore reserves formed part of the
grade reconciliation and is accounted for during the Howson (2006)
investigation. The correct resource classification by the JORC principals
had to be implemented correctly and reviewed. The drilling data had
unrepresentative errors due to the fragmentation and spatial distribution of
mineralisation. Little correlation existed between the density and copper
grades, and ultimately this contributed to overestimations in Cu grades.

106
7 THE RE-ESTIMATION OF COPPER GRADES
Introduction 7.1
In December 2005, a decision followed to re-estimate the copper grade
model, from existing data in an attempt to explore and address some
reasons for the discrepancy. The previous section discussed some
details, which leads up to this section. The development of a model for
block caving simulation which would resultantly produce more accurate
copper grades, i.e. more closely correspond with grades obtained by
mining remained the primary objective (Howson, 2006). The required
model could then replace the FS model as the basis for reserve reporting
and scheduling up to the end of the mine’s life. For consistency and
compatibility with previous work, the same model grid as for the DBM was
used (Howson, 2006). A similar required procedure as per the FS had to
address the un-diluted copper grade, ignoring the dolerite dykes. The
applied existing dolerite model would dilute the copper grades in turn. The
use of two groups of holes for the estimation included the surface drill
holes labelled “LK” for “Loolekop” and “U” holes for underground (Howson,
2006). The block model dimensions of 17 m, 8.5 m, and 20 m, were
approximately the simple multiples of two, one, and two times the
composite length. Howson (2006) noted that this length is convenient for
kriging discretisation.
Analysis of length versus grade 7.2
Figure 55 below shows a scatter plot of composite length vs copper
percentage for all composites below -200 m and indicates a general
decline in grade with increasing length.
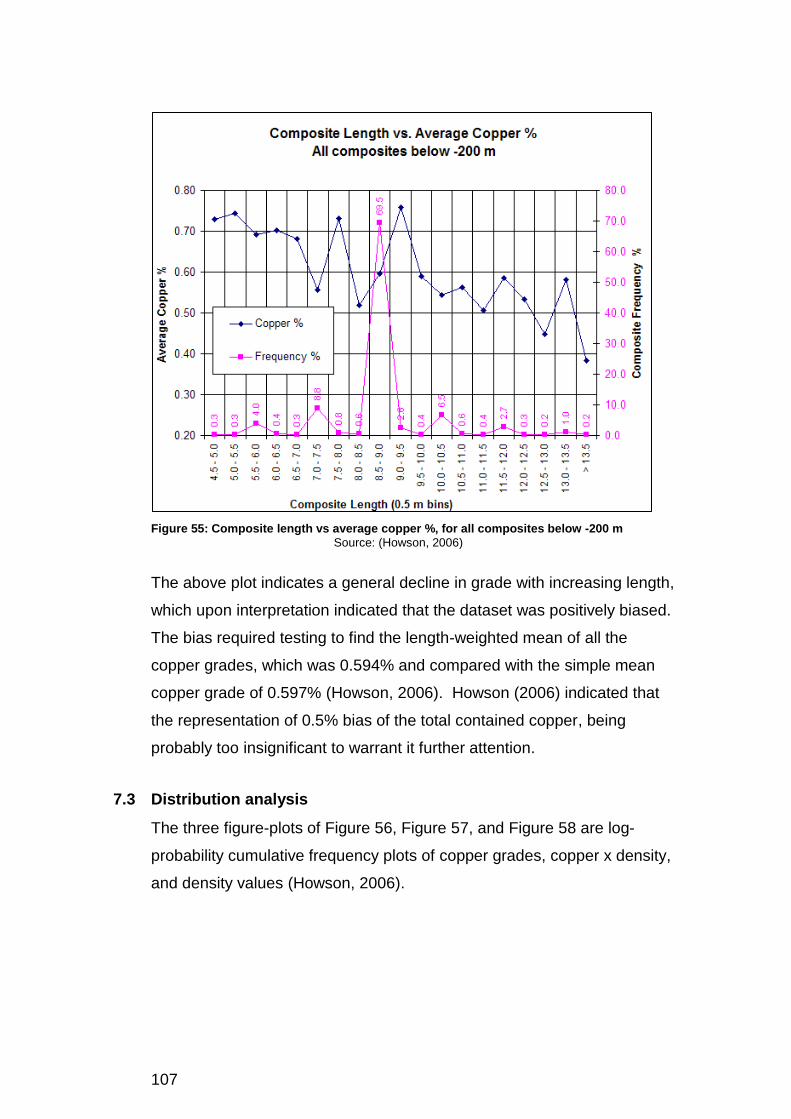
107
Figure 55: Composite length vs average copper %, for all composites below -200 m
Source: (Howson, 2006)
The above plot indicates a general decline in grade with increasing length,
which upon interpretation indicated that the dataset was positively biased.
The bias required testing to find the length-weighted mean of all the
copper grades, which was 0.594% and compared with the simple mean
copper grade of 0.597% (Howson, 2006). Howson (2006) indicated that
the representation of 0.5% bias of the total contained copper, being
probably too insignificant to warrant it further attention.
Distribution analysis 7.3
The three figure-plots of Figure 56, Figure 57, and Figure 58 are log-
probability cumulative frequency plots of copper grades, copper x density,
and density values (Howson, 2006).

108
Figure 56: Log-probability cumulative frequency of Cu in 9 m comps below -200 m
Source: (Howson, 2006)
Figure 57: Log-probability cumulative frequency of Cu in 9 m comps below -200 m
Source: (Howson, 2006)

109
Figure 58: Log-probability cumulative frequency of Cu in 9 m comps below -200 m
Source: (Howson, 2006)
Howson (2006) used the log-probability cumulative frequency plots to
analyse the component populations in the dataset. In general, a
population of values that has a normal or lognormal distribution plot
generally in a straight line (Howson, 2006). The changes in line direction
indicated more than one population and reflected possible phases of
mineralisation. All three plots have curves and tend to suggest that mixed
population plots from the dataset (Howson, 2006). Two main populations
of copper grades appeared with a break at 0.2% to 0.4% copper. The
occurrence may be due to the remobilisation identified and was indistinct
since the two populations would be requiring sampling at a much shorter
interval than the 9 m. There was hence no suggestion that straightforward
kriging of copper metal accumulation in a single domain would be
inappropriate (Howson, 2006).

110
The 2005 ordinary kriging without grade zoning 7.4
The 2005 ordinary kriging (OK) model did not use grade zoning, to
produce a straightforward model. The model estimated copper, as metal
accumulation values, which calculated copper times density. This
calculated estimation enjoyed preference above the grades. Howson
(2006) firstly computed the separately estimated density, before applying it
to produce a copper percentage model from the metal accumulation
model.
The 2005 OK model gave very similar results in comparison with the FS
copper grade model. Lower copper grades by about 1% in the volume
reflected for volumes already mined and suggested that the grade zoning
and grade-density reasons for the discrepancy were of minor significance.
What the model did not address was issues such as data density, biased
locations, or variable grade projection distances (Howson, 2006).
Re-estimation using multiple indicator methods 7.5
Within the first quarter of 2006, two applied variants of the Multiple
Indicator Kriging (MIK) technique derived the Cu density which was copper
multiplied by the density. In obtaining the copper grade estimates, the Cu
density estimates required division by density as estimated previously
without any need to apply MIK to density (Howson, 2006). Two variants of
MIK were applicable namely: Multiple Indicator Ordinary Kriging (MIOK)
and Multiple Indicator Simple Kriging (MISK). As a result, two commonly
applied variants of kriging within the multiple indicator frameworks of MIK,
MIOK, and MISK followed. MIK is a form of estimation in which different
grade level estimates calculate independently. Indicators estimated for
each model block were proportions of the block above a series of
threshold values, preselected to give adequate coverage to the distribution
of grades in the deposit (Howson, 2006).
The series of proportions, in turn, formed a cumulative frequency
distribution curve for grades within the block. The cumulative frequency

111
determines the overall combined grade for the block, constituting of the
block estimate for this kriging method (Howson, 2006). In MIK, kriging of
the series of indicators are independent, and indicators for each threshold
can have their separate geostatistical parameters. Through this method,
the accommodation of variation in variogram range was previously
identified (Howson, 2006).
The graph of Figure 59 illustrates the change in variogram range with Cu
density grades. The graph shows Cu density threshold values on the
horizontal axis and variogram range on the vertical axis. The traces for
the three-variogram axes are separately coloured.
Figure 59: Change in variogram range with indicator threshold
Source: (Howson, 2006)
Comparison of estimates 7.6
Footprint copper grade estimates by elevation 7.6.1
The division of the output data from the geostatistical software ‘Isatis’,
included Cu density values with the previously estimated density values to
derive copper percentage grades. Howson (2006) compared these
copper grades with adjustments in the models for dolerite dilution. The
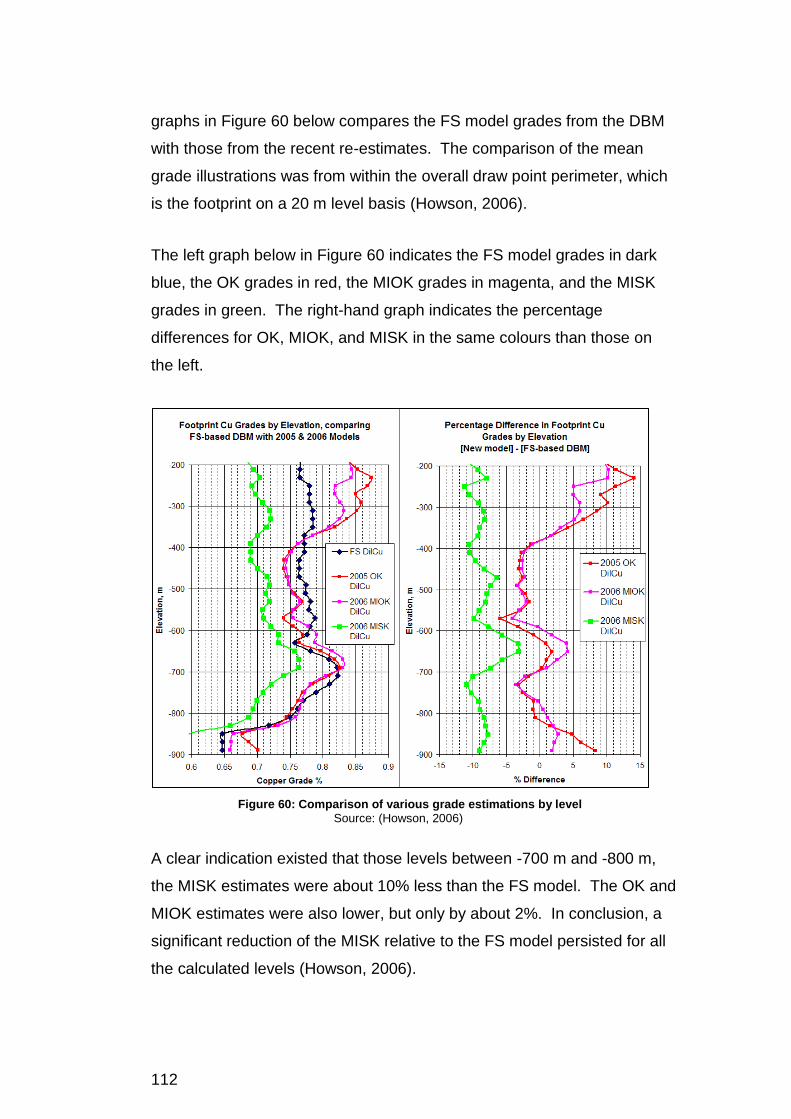
112
graphs in Figure 60 below compares the FS model grades from the DBM
with those from the recent re-estimates. The comparison of the mean
grade illustrations was from within the overall draw point perimeter, which
is the footprint on a 20 m level basis (Howson, 2006).
The left graph below in Figure 60 indicates the FS model grades in dark
blue, the OK grades in red, the MIOK grades in magenta, and the MISK
grades in green. The right-hand graph indicates the percentage
differences for OK, MIOK, and MISK in the same colours than those on
the left.
Figure 60: Comparison of various grade estimations by level
Source: (Howson, 2006)
A clear indication existed that those levels between -700 m and -800 m,
the MISK estimates were about 10% less than the FS model. The OK and
MIOK estimates were also lower, but only by about 2%. In conclusion, a
significant reduction of the MISK relative to the FS model persisted for all
the calculated levels (Howson, 2006).
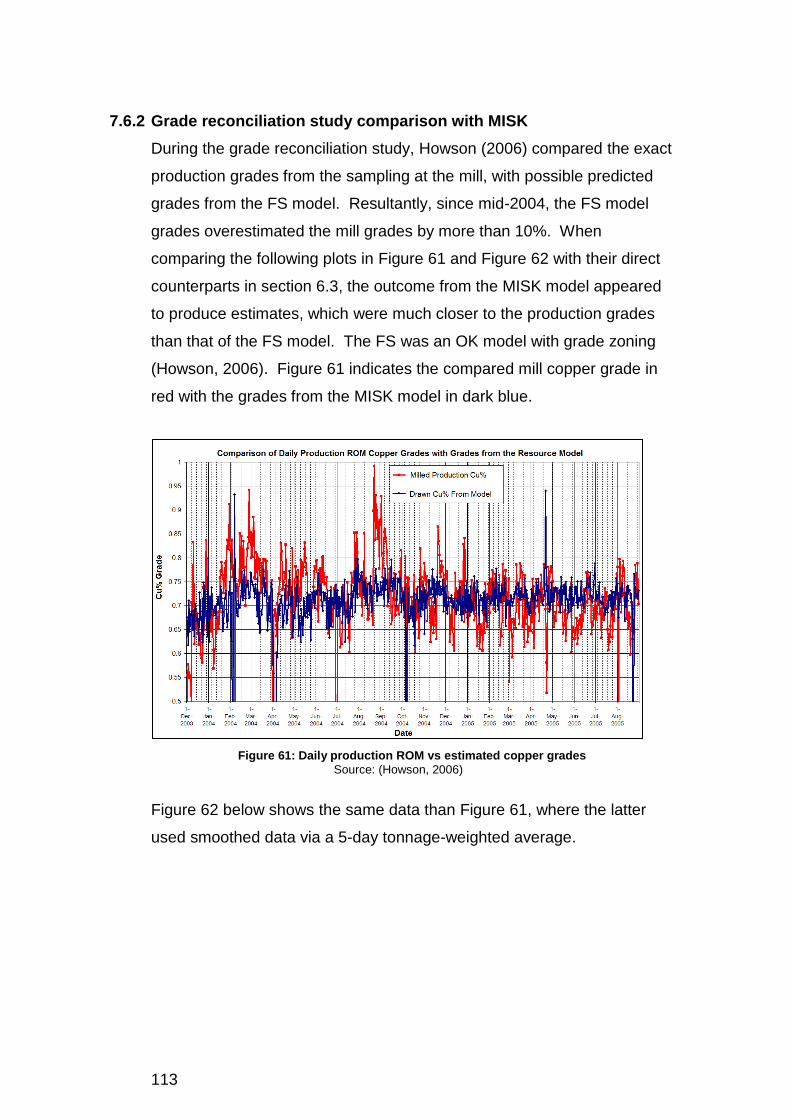
113
Grade reconciliation study comparison with MISK 7.6.2
During the grade reconciliation study, Howson (2006) compared the exact
production grades from the sampling at the mill, with possible predicted
grades from the FS model. Resultantly, since mid-2004, the FS model
grades overestimated the mill grades by more than 10%. When
comparing the following plots in Figure 61 and Figure 62 with their direct
counterparts in section 6.3, the outcome from the MISK model appeared
to produce estimates, which were much closer to the production grades
than that of the FS model. The FS was an OK model with grade zoning
(Howson, 2006). Figure 61 indicates the compared mill copper grade in
red with the grades from the MISK model in dark blue.
Figure 61: Daily production ROM vs estimated copper grades
Source: (Howson, 2006)
Figure 62 below shows the same data than Figure 61, where the latter
used smoothed data via a 5-day tonnage-weighted average.
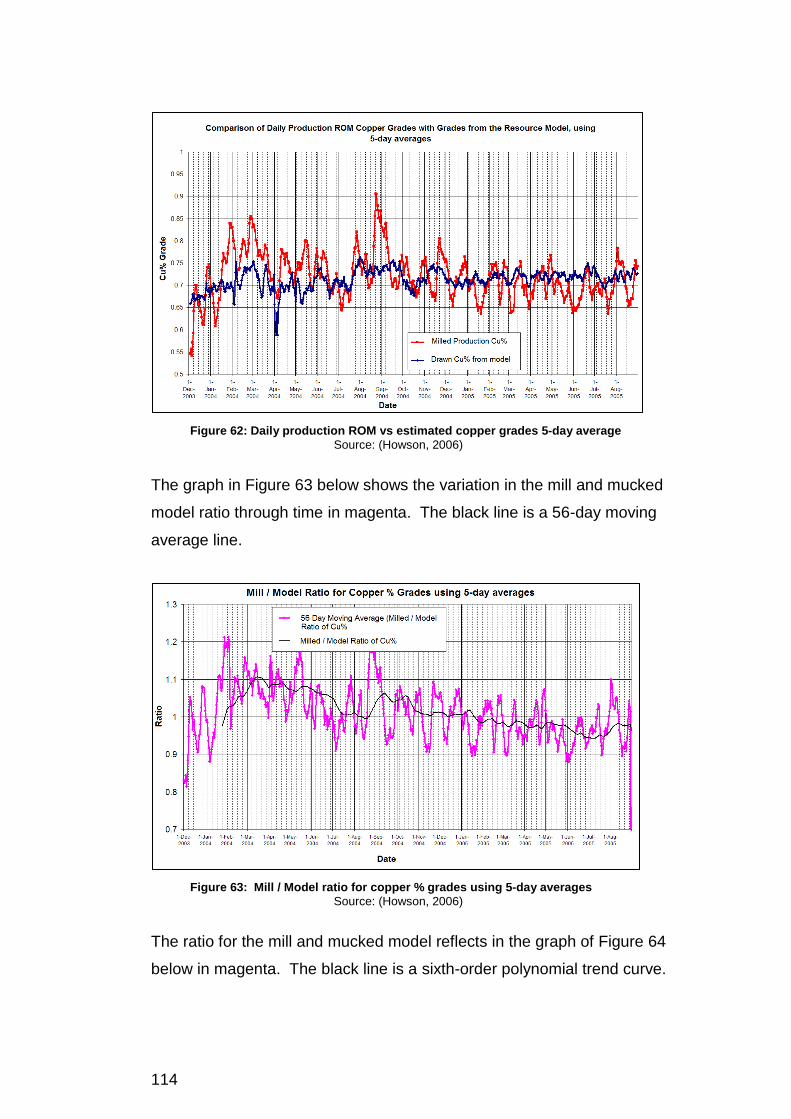
114
Figure 62: Daily production ROM vs estimated copper grades 5-day average
Source: (Howson, 2006)
The graph in Figure 63 below shows the variation in the mill and mucked
model ratio through time in magenta. The black line is a 56-day moving
average line.
Figure 63: Mill / Model ratio for copper % grades using 5-day averages
Source: (Howson, 2006)
The ratio for the mill and mucked model reflects in the graph of Figure 64
below in magenta. The black line is a sixth-order polynomial trend curve.

115
Figure 64: Mill / Model ratio for “Undiluted copper” grades using 5-day averages
Source: (Howson, 2006)
Conclusion 7.7
From the comparison of estimates, it was clear that the MISK model
appeared to have produced estimates that were much closer to the
production grades than either the FS model or the recently calculated OK
and MIOK models (Howson, 2006).
Where only sparse data existed, OK and MIOK used techniques namely
the “Lagrangian Multiplier” to extend the influence of point data such as
composites beyond the variogram prescription. Within the Palabora
footprint, the data was sparse, and a minor bias in the drilling occurred
towards higher-grade locations (Howson, 2006). The effect magnifies by
the widespread influence effect of OK to produce a model that appears
positively biased by about 10% within the current mined volume.
However, this applied to the FS, 2005 OK, and the MIOK models. Thus
where sparse data existed, the shortfall in influence was made up by using
the mean value of the deposit.
The graphs in Figure 65 compare production copper grades with
corresponding grades predicted by the FS model from January 2003 to the
end of August 2005.
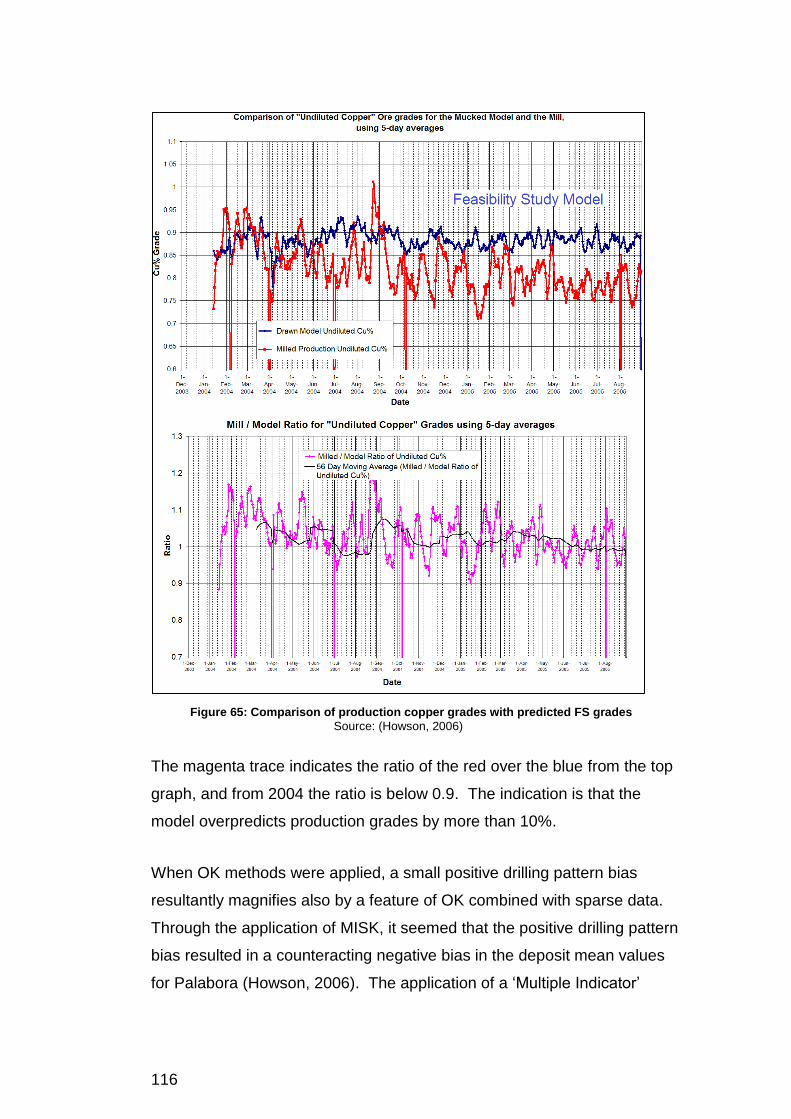
116
Figure 65: Comparison of production copper grades with predicted FS grades
Source: (Howson, 2006)
The magenta trace indicates the ratio of the red over the blue from the top
graph, and from 2004 the ratio is below 0.9. The indication is that the
model overpredicts production grades by more than 10%.
When OK methods were applied, a small positive drilling pattern bias
resultantly magnifies also by a feature of OK combined with sparse data.
Through the application of MISK, it seemed that the positive drilling pattern
bias resulted in a counteracting negative bias in the deposit mean values
for Palabora (Howson, 2006). The application of a ‘Multiple Indicator’
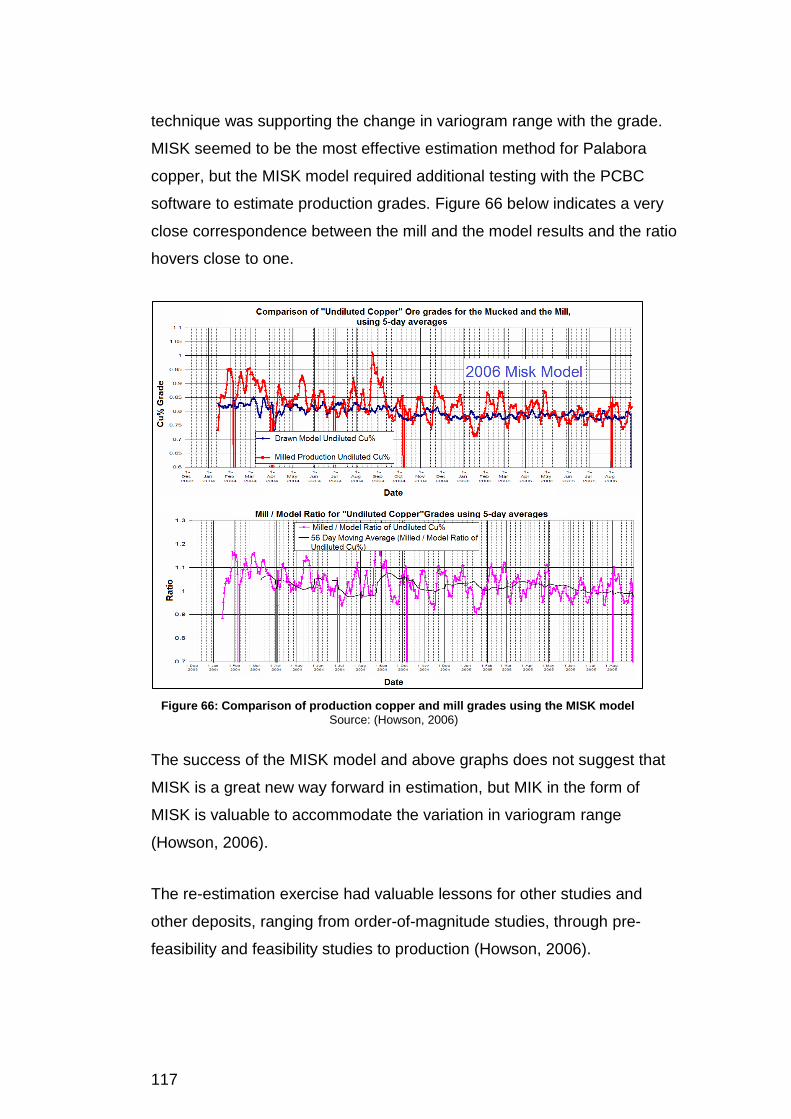
117
technique was supporting the change in variogram range with the grade.
MISK seemed to be the most effective estimation method for Palabora
copper, but the MISK model required additional testing with the PCBC
software to estimate production grades. Figure 66 below indicates a very
close correspondence between the mill and the model results and the ratio
hovers close to one.
Figure 66: Comparison of production copper and mill grades using the MISK model
Source: (Howson, 2006)
The success of the MISK model and above graphs does not suggest that
MISK is a great new way forward in estimation, but MIK in the form of
MISK is valuable to accommodate the variation in variogram range
(Howson, 2006).
The re-estimation exercise had valuable lessons for other studies and
other deposits, ranging from order-of-magnitude studies, through pre-
feasibility and feasibility studies to production (Howson, 2006).

118
8 PMC HEAD GRADE AUDIT JULY 2010-2011
Introduction 8.1
In 2010, PMC invited Snowden Mining Industry Consultants (Snowden) to
investigate a new discrepancy between the measured copper head grade
from the plant and the grade estimated by the resource model. The grade
discrepancy has manifested itself during the past several years, and
results ranged from 10% to 12%, which led to the required block model re-
estimation in 2006 (Snowden, 2010). During 2010, this discrepancy
continued to influence the mine with effective draw compliance in the
grade and maximising the LOM of the block cave (Snowden, 2010).
The application of a variety of algorithms simulates the mixing of material,
taking place as LHD machines extract material from the draw points.
PCBC accepts the actual draw tonnes from respective draw points and
reconciles it against the actual production results (Snowden, 2010). A
comparison between the PCBC grade and the geological block model as
per Figure 67, indicates the PCBC figures are lower than the in-situ block
model grade.

119
Figure 67: Grade comparison between PCBC and the geological block model
Source: (Snowden, 2010)
The actual sampled grade began to diverge in 2008, and the 2010
sampling indicated a discrepancy of between 4% and 8% (Snowden,
2010).
Methodology used 8.2
Snowden (2010) followed a methodical approach, which tested the
resources, mining, and plant operation evidence for or against the tested
hypothesis. The following subsections describe the details assessed
during the investigation process.
Geological investigations 8.2.1
Snowden (2010) focussed their geological investigations on the resource
estimates and supporting data. Factors which Snowden (2010)
considered to contribute to the discrepancy between the head grade and
PCBC grade included the resource estimation and geological
interpretation. Snowden (2010) reasoned that evidence of poor quality or
poorly distributed data would indicate a poorly estimated resource block.

120
A poorly estimated resource block model will result in differences between
the recovered grades and the predicted PCBC grades (Snowden, 2010).
Other sub-factors are affecting the resource estimation, including data
distribution and quality and quality of estimates and grade continuity.
The geological interpretation investigated evidence for a change in
geological composition, seemingly erroneously omitted in the initial
interpretation or no recognition thereof. Snowden (2010) tested whether
any geological interpretive evidence supported the drop in head grade.
The geological evidence for the head grade to be lower or such geological
interpretation are sub-factors affecting the geological interpretation
(Snowden, 2010).
Mining investigations 8.2.2
Snowden’s (2010) mining investigation considered possible causes for the
overall variance between the PCBC production grade and the head grade.
These causes included critical areas of the mining operation. According to
Snowden (2010), the variance in head grade could exist from an incorrect
setup, calibration, or use of the PCBC model. Snowden (2010) reviewed
the production schedule from PCBC and compared it to the production
profile. Areas which Snowden (2010) covered in their study follow in the
paragraphs below.
Snowden (2010) reviewed the block cave design parameters such as draw
cone dimensions, and draw point spacing to determine the suitable
spacing thereof. Snowden (2010) noted that the incorrect design
parameters based on overestimated fragmentation commonly resulted in
narrower draw zones. These narrower draw zones advanced faster
through the ore profile, resulting in lower grade ore material mined sooner
than expected. Furthermore, a higher percentage of external dilution
drawn into the draw point efficiently lowered the mining grade which
Snowden (2010) had to review.
121
Internal and external dilution affecting the head grade to be lower was
included in the Snowden (2010) investigation, to identify the existence of
possible poor draw control. Material loaded not conforming to the mining
plan, and incorrect tonnes resulted in increased dilution where waste
material drawn into the cave happened sooner than anticipated. Snowden
(2010) therefore investigated whether the draw control practice was of an
acceptable standard across the block cave as is discussed in more detail
in section 8.5.2. Snowden (2010) commented that the current draw
control could improve in especially Sector 4 for draw points having longer
tramming distances, but overall it seems reasonable.
Plant Investigation 8.2.3
Snowden (2010) focussed on the sampling of the head grade and the
laboratory analysis of such samples used for the head grade directive.
Measurements of total tonnes mined and head grade calculations fell
under the magnifying glass of Snowden (2010) during the plant
investigation. Every single entity during investigation and assessment
included evaluation of each potential for having miss-calculations or
measurement errors that might have influenced the head grade to drop
(Snowden, 2010).
Geological evidence supporting the drop in head grade 8.3
Snowden (2010) reasoned that the draw point sampling was a good
indicator as to whether the drop in head grade observed from April to June
2008 was authentic. Samples taken from draw points by the geological
department at monthly intervals entailed five sub-samples over the draw
face with a shovel in a best practical manner (Snowden, 2010). If the
fragmentation was coarse, hand samples were possible but left more
substantial portions behind that could not be hand loaded. In Snowden’s
(2010) opinion, this sampling procedure was not adequate or
representative of the draw points, and the results were only good for
indicative measures. Either a more extensive sample per draw point was
required, or more massive rocks chipped into equal-sized particles would
122
reduce the bias towards fines (Snowden, 2010). The frequency of monthly
sampling intervals was too infrequent to provide a representative
assessment but remained a known problem to the geological department.
The bias in the sampling was consistently higher than the head grade as
per Snowden’s (2010) investigation, which required further investigation.
A possibility existed that sulphides collected preferably in less coarse
material, and therefore preferential sampling, which excluded certain
material types, could be reasons for the higher head grade. Dolerite
diluted the ore and did not contain grade. Hence Snowden (2010)
expected a reduction in the head grade where it occurred. Snowden
(2010) concluded from the data that observations on dolerite content and
copper content were not matching and the likely cause was bias in the
current sampling methodology. Snowden (2010) indicated that if no error
in the head grade sampling and analytical process existed, the drop in
head grade during April 2008 to June 2008 was likely to be authentic.
Spatial distribution of lithology and geological interpretation 8.3.1
Snowden (2010) indicated that the provided block model contained only
the dolerite percentage. Therefore, the geology of the block model
omitted available detailed geology not provided to Howson (2006) to allow
for further investigation in 2006. The lack of a detailed geological model
informed Snowden (2010) to use the drill-hole file to investigate the
different rock types and their distribution. Through the completion of a
slicing exercise on the drill-hole data, it was possible to observe any
lithological ratio changes between the primary lithological units (Snowden,
2010).
Snowden (2010) used the slicing tools within the software to slice a portion
of the model between elevations and retrieve data applicable to the sliced
portion only. These slices represent the model in vertical sliced portions
as is indicated by Figure 68’s elevation axis.
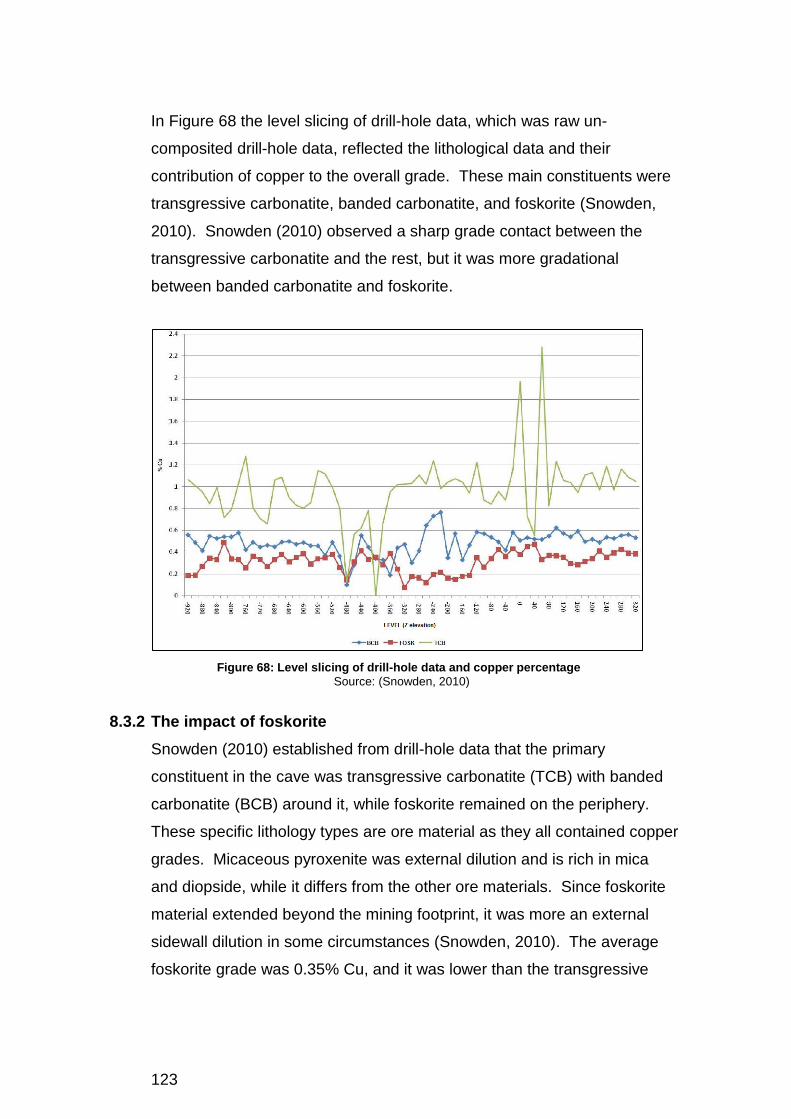
123
In Figure 68 the level slicing of drill-hole data, which was raw un-
composited drill-hole data, reflected the lithological data and their
contribution of copper to the overall grade. These main constituents were
transgressive carbonatite, banded carbonatite, and foskorite (Snowden,
2010). Snowden (2010) observed a sharp grade contact between the
transgressive carbonatite and the rest, but it was more gradational
between banded carbonatite and foskorite.
Figure 68: Level slicing of drill-hole data and copper percentage
Source: (Snowden, 2010)
The impact of foskorite 8.3.2
Snowden (2010) established from drill-hole data that the primary
constituent in the cave was transgressive carbonatite (TCB) with banded
carbonatite (BCB) around it, while foskorite remained on the periphery.
These specific lithology types are ore material as they all contained copper
grades. Micaceous pyroxenite was external dilution and is rich in mica
and diopside, while it differs from the other ore materials. Since foskorite
material extended beyond the mining footprint, it was more an external
sidewall dilution in some circumstances (Snowden, 2010). The average
foskorite grade was 0.35% Cu, and it was lower than the transgressive

124
carbonatite or banded carbonatite. Snowden (2010) investigated the
possibility whether an increased amount of foskorite ingress into the draw
cones, from the sidewalls or externally, caused the reduction in head
grade. Snowden (2010) additionally considered a higher expected
quantity of foskorite present in the draw points and investigated data
observations recorded by the on-mine geological team.
The findings indicated that no BCB was present while observing a
relatively large percentage of foskorite. The lack of observed BCB
indicated a possible misclassification between BCB and TCB in the broken
ore underground. Snowden (2010) noticed that the crosscuts, where the
expected higher grades should occur, had higher quantities of foskorite.
Snowden (2010) also noted a contradiction between raw drill-hole data
and data from the GEMCOM model and concluded that the 2006
GEMCOM geological data did not represent the drill-hole data. Should the
observations be correct, then, substantial evidence would present that
higher than expected low-grade foskorite quantities reported to draw
points, affecting the head grade negatively (Snowden, 2010).
Findings on geological interpretation 8.3.3
Snowden (2010) concluded that the geological interpretation contributed to
the variance in grade. Snowden (2010) found omitted lithological units
and information in the current block model except for dolerite.
Furthermore, the erroneous exclusion of relationships between TCB, BCB
and foskorite from the resource estimate occurred. Snowden (2010)
recommended a re-estimation, which included all relevant lithological
units. Snowden (2010) observed higher than expected quantities of
foskorite in the draw points and it resulted from the incorrect interpretation
of the geological model or external dilution.
The resource estimation 8.4
The resource estimation review sought for any cause, which may have
contributed to the variance in head grade and the PCBC grade. The

125
following aspects such as the quality of the data, the quality of the
estimation and grade continuity finalised the investigation Snowden (2010)
conducted. PMC provided a ‘rekriged09’ GEMCOM block model, with
historical drill-hole data from the open pit and from the underground
exploration drive to Snowden (2010) for their investigation. Table 5 below
lists the raw data files received from the mine.
Table 5: Raw data received from the mine - Source: (Snowden, 2010)
The open pit contained a significant amount of drilling carried out during its
operations where only a small amount of data was available between the
exploration drive and the open pit (Snowden, 2010). Figure 69 presents
this shortfall of drilling data, where only a couple of drill holes existed
between the open pit bottom and the exploration drive.
Data quality and laboratory QAQC 8.4.1
Most of the captured drilling data and work backdate to pre-1996, making
the quality control processes applied to collect data challenging to verify.
Snowden (2010) however noted that the QAQC procedures for the second
lift were appropriate. Figure 69 indicates the surface holes in red and the
underground exploration holes in blue.

126
Figure 69: North-South section showing drill-holes at PMC
Source: (Snowden, 2010)
Also, Figure 70 indicates the distribution of the drill data and the scheduled
position of the drawing height on the production level using PCBC plots
shown below in comparison. The third quarter draw height for 2008 is red,
green for 2009 and blue indicates the drawing height for 2010. Snowden
(2010) indicated that the height difference between the height of draw
(HOD) and the pit bottom ranged between 100 m and 200 m.
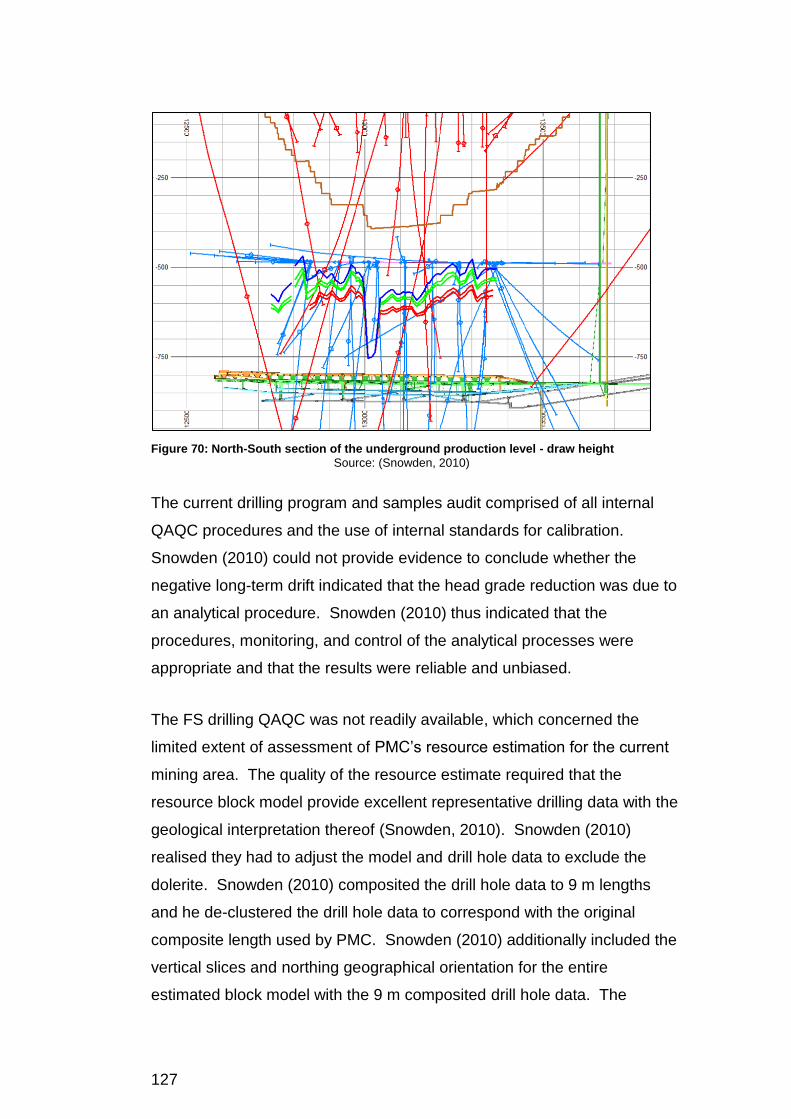
127
Figure 70: North-South section of the underground production level - draw height
Source: (Snowden, 2010)
The current drilling program and samples audit comprised of all internal
QAQC procedures and the use of internal standards for calibration.
Snowden (2010) could not provide evidence to conclude whether the
negative long-term drift indicated that the head grade reduction was due to
an analytical procedure. Snowden (2010) thus indicated that the
procedures, monitoring, and control of the analytical processes were
appropriate and that the results were reliable and unbiased.
The FS drilling QAQC was not readily available, which concerned the
limited extent of assessment of PMC’s resource estimation for the current
mining area. The quality of the resource estimate required that the
resource block model provide excellent representative drilling data with the
geological interpretation thereof (Snowden, 2010). Snowden (2010)
realised they had to adjust the model and drill hole data to exclude the
dolerite. Snowden (2010) composited the drill hole data to 9 m lengths
and he de-clustered the drill hole data to correspond with the original
composite length used by PMC. Snowden (2010) additionally included the
vertical slices and northing geographical orientation for the entire
estimated block model with the 9 m composited drill hole data. The
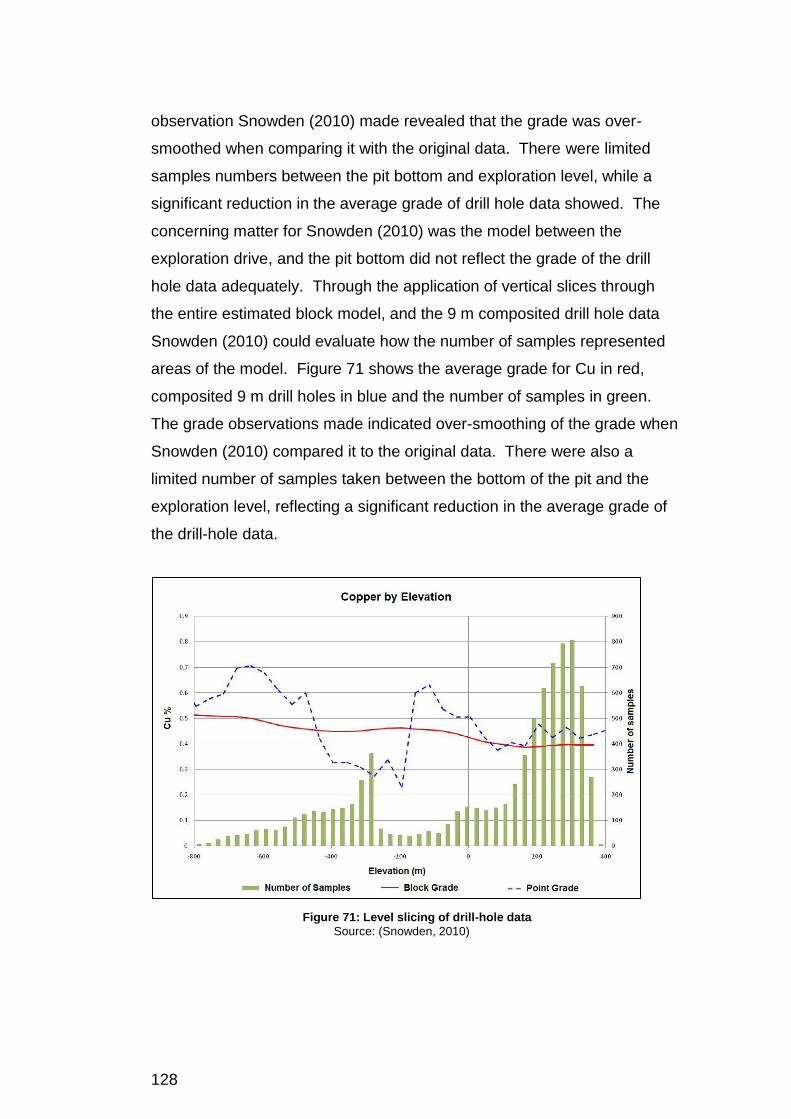
128
observation Snowden (2010) made revealed that the grade was over-
smoothed when comparing it with the original data. There were limited
samples numbers between the pit bottom and exploration level, while a
significant reduction in the average grade of drill hole data showed. The
concerning matter for Snowden (2010) was the model between the
exploration drive, and the pit bottom did not reflect the grade of the drill
hole data adequately. Through the application of vertical slices through
the entire estimated block model, and the 9 m composited drill hole data
Snowden (2010) could evaluate how the number of samples represented
areas of the model. Figure 71 shows the average grade for Cu in red,
composited 9 m drill holes in blue and the number of samples in green.
The grade observations made indicated over-smoothing of the grade when
Snowden (2010) compared it to the original data. There were also a
limited number of samples taken between the bottom of the pit and the
exploration level, reflecting a significant reduction in the average grade of
the drill-hole data.
Figure 71: Level slicing of drill-hole data
Source: (Snowden, 2010)

129
When Snowden (2010) sliced the data in an easting orientation, the
peripheral grades to the north and south reflected a grade overestimation.
The over-smoothing of the data was problematic and would result in an
overestimation of low grades but an underestimation of higher grades.
Snowden (2010) indicated that the insufficient available data prevented to
quantify the impact of the smoothing on the overall grade of the orebody.
Overall, the quantity of data within the mining footprint was inadequate,
and an unexpected variation in grade estimation could occur as a result.
Howson (2006) supported the same concern, in that he mentioned the
inadequate drilling and sampling of the mined volume (Snowden, 2010).
The block model estimates and drill hole assay grades showed an
excellent visual correlation through the investigation from Snowden
(2010). Smoothing via the estimation process was prominent where
higher estimated grades indicated lower than the composited assay
grades and conversely lower estimated grades were higher than the lower
composited grades. It remained difficult for Snowden (2010) to quantify
the smoothed expectancy with the limited available data. Similarly, PMC
and Rio Tinto reported grade discrepancy problems historically. Grade
discrepancies experienced in 2004 and 2005 resulted from a combination
of factors but mainly from estimation techniques. The inadvertent phasing
of the FS seemingly contributed as the overriding reason for the
discrepancy. Snowden (2010) indicated that the implied classification of
the PMC resource at the measured level was not justifiable and that the
resource classifications required a full review.
Although Snowden (2010) used the preferred 9 m composites in his
analysis, the composites changed to 10m in 2013 (PMC, 2016). During
2012 a comparison between composite lengths of 3 m and 9 m indicated
that composites of 9 m had a larger smoothing effect where the swath
plots plotted against the X, Y and Z-axis (Snowden, 2010).

130
Grade continuity analysis 8.4.2
By understanding the grade continuity, the spatial analysis of the data
required an overview. Snowden (2010) removed data containing zeros in
the “% Cu” field, after investigating the drill-hole data. The continuity
analysis illustrated that there were a 100º strike direction and vertical dip
continuity in grade and that there was no evidence that the copper was
bottoming out (Snowden, 2010).
Findings on the resource estimation 8.4.3
Snowden (2010) stated that reservations about the resource estimates
were the main contributor to the grade variance. The quantity and quality
of data were inadequate within the mining blocks and was not verifiable,
especially where limited sample data affected the quality of the estimate.
Snowden (2010) found the resource classification to be optimistic despite
good grade continuity observations. Estimations extrapolated outside the
data area and grades for the contamination within the draw were biased
from what Snowden (2010) observed.
SRK Consulting (2011) reported that the resource estimate resulted from
drilling within the open pit and exploration level approximately 850 m
below the surface. The affected caving area between the exploration level
and the final open pit was impoverished in drilling information (SRK
Consulting, 2011). The caved zone’s grade estimation resulted from
relatively wide spaced and distant information. The methodology for
estimation was Multiple Indicator Simple Kriging for PMC’s block cave.
SRK Consulting (2011) also reported that the lack of segregation of drill-
hole samples in the estimates affected the calculation and modelling of
experimental semi-variograms.
Mining audit 8.5
The PMC mine planning process involved the combined current geological
block model without draw point positions and production requirements in
meeting the plan. The PCBC software ensured that no double accounting

131
of material occurred for intersecting cones (Snowden, 2010). To simulate
the actual extraction of material mixing during material loading operations
was a complicated calculation. Hence, a variety of mixing algorithms
within the calculations of the software applied to the simulation (Snowden,
2010). Snowden (2010) noted that PCBC functioned as a reconciliation
tool when applying the ‘playback’ function, as was applied by PMC.
The period 2004 to 2008 revealed a very close trend for tonnes and grade
when Snowden (2010) compared it to the actual production head grade
results. However, the grade diverged in 2008, and the current sampling
indicated a discrepancy of between 4% and 8%. Snowden (2010) initially
compared PCBC outputs from the in-situ geological block model by using
the height of draw (HOD) as the basis for determining extracted material.
Snowden (2010) concluded that there were no gross set-up errors in
PCBC and affirmed that the grades in the geological model were
representative of the PCBC output grades (Snowden, 2010). During the
Snowden (2010) investigation, it was not appropriate to benchmark the
PMC block-cave against other block-caves because of the level of
analysis. Snowden (2010) chose to compare the PCBC ‘playback’ outputs
with the head feed over time. Although Snowden (2010) realised that a
correlation in the outputs did not prove the correctness of the PCBC
parameters, it would demonstrate an achieved level of calibration. The
PCBC outputs with the actual head grade feed results indicated a realistic
comparison. However, Snowden (2010) could not prove the calibration of
PCBC since there was no real grade or geological markers within the ore
body that was usable for such comparison. Studying Figure 72, the period
2004 to 2008 indicated a higher head grade between 0% and 2% from the
expected grade, while the period after that was between -4% and -6%
lower (Snowden, 2010).
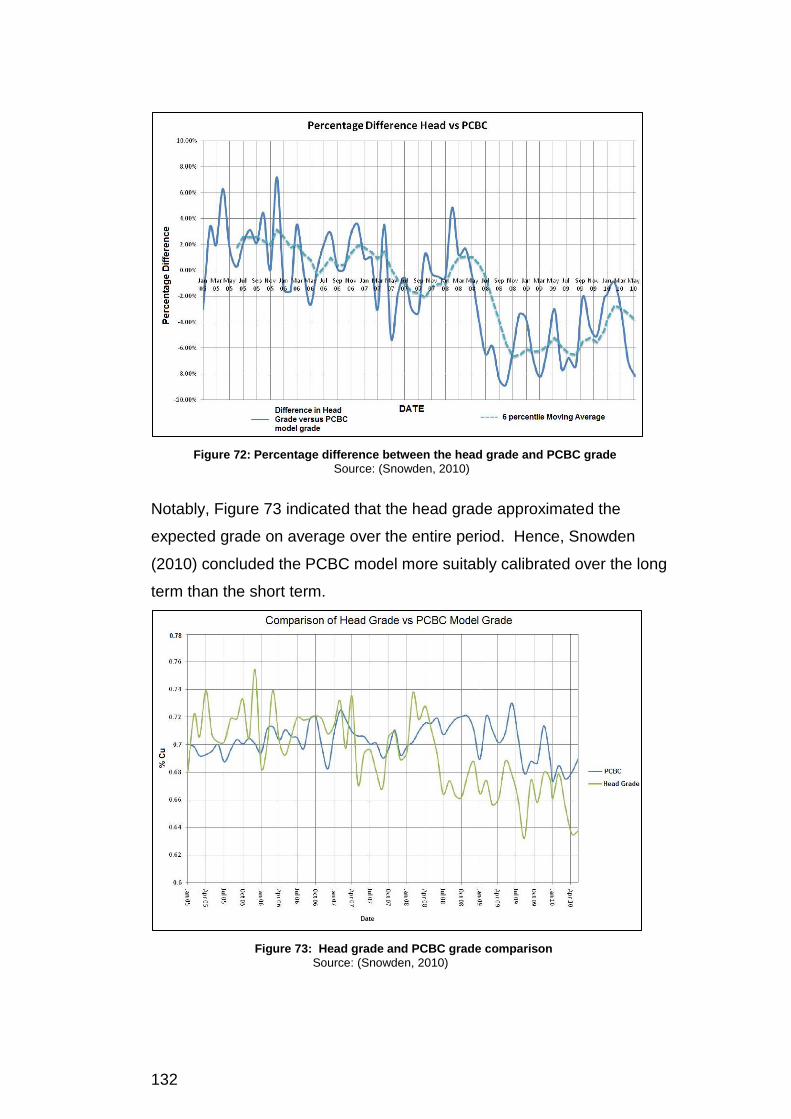
132
Figure 72: Percentage difference between the head grade and PCBC grade
Source: (Snowden, 2010)
Notably, Figure 73 indicated that the head grade approximated the
expected grade on average over the entire period. Hence, Snowden
(2010) concluded the PCBC model more suitably calibrated over the long
term than the short term.
Figure 73: Head grade and PCBC grade comparison
Source: (Snowden, 2010)

133
Snowden (2010) noted the software supplier’s intimate involvement in
setting up PCBC with appropriate input parameters, which became more
applicable where section 9 discuss additional conducted work done by
Diering (2015). The input parameters remain subjective as these inputs
are difficult to measure accurately (Snowden, 2010). When Snowden
(2010) compared the PCBC output with the inputs from the in-situ
geological block model, the height of draw (HOD) formed the basis for
determining the material extracted. Table 6 below reflects the input
parameters Snowden (2010) used.
Table 6: PCBC input parameters - Source: (Snowden, 2010)
Fragmentation and dilution 8.5.1
Snowden (2010) indicated during the feasibility study a fragmentation
estimation program was developed to predict rock size distribution from
the block cave. The program, namely: Block Cave Fragmentation (BCF)
predicted fragmentation between 80% and 42%. Ngidi & Pretorius (2010)
embarked on a paper titled: “An assessment of the impact of poor
fragmentation on cave management”, and they found that the number of
oversize rocks (>2 m) ranged between 58% and 14%. Figure 74 indicates
that an overestimation of the coarseness of the fragmentation occurred.
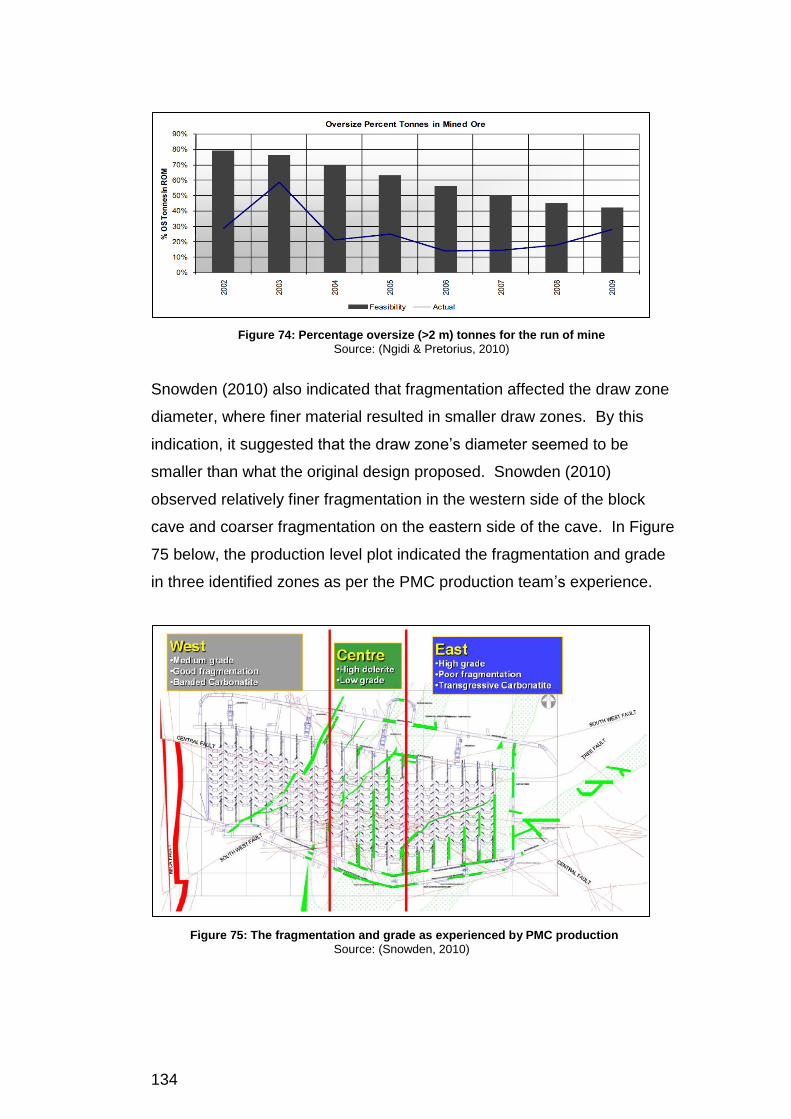
134
Figure 74: Percentage oversize (>2 m) tonnes for the run of mine
Source: (Ngidi & Pretorius, 2010)
Snowden (2010) also indicated that fragmentation affected the draw zone
diameter, where finer material resulted in smaller draw zones. By this
indication, it suggested that the draw zone’s diameter seemed to be
smaller than what the original design proposed. Snowden (2010)
observed relatively finer fragmentation in the western side of the block
cave and coarser fragmentation on the eastern side of the cave. In Figure
75 below, the production level plot indicated the fragmentation and grade
in three identified zones as per the PMC production team’s experience.
Figure 75: The fragmentation and grade as experienced by PMC production
Source: (Snowden, 2010)

135
Snowden (2010) reviewed the fragmentation, which indicated an
underestimation in fragmentation across the block cave especially on the
western side of the cave. The underestimation could result in smaller
planned draw zone diameters with an excess broad draw point spacing
design (Snowden, 2010). Underestimating the fragmentation could also
result in the decrease in grade which Snowden (2010) observed. This
decrease in grade required an assessment testing whether ore material
above the current mining draw height mined, indeed mines faster than
planned. If the above underestimation was correct, the expectation was
an orebody grade above the current mining horizon that was significantly
lower than the current mining zone. Hence, Snowden (2010) sliced the
orebody up into 40 m slices from the production level underground, up to
the open pit bottom. Snowden’s (2010) finding indicated that the current
draw elevation was at approximately -600 m and had a grade of 0.77%.
Snowden (2010) concluded that no evidence was found to support the
probability of having smaller planned draw zones.
The PMC block cave experienced both internal and external dilution.
Internally, dolerite dykes intruded across the orebody, with reasonably
well-defined positions in the block model. External dilution considered by
Snowden (2010) comprised mainly of material situated above the block
cave. Snowden (2010) further indicated that the dilution resulted from the
2004 sidewall failure within the pit, where lower grade material occurred
around the mining footprint. Snowden (2010) expected this external
dilution to increase as waste material filtered through the draw cones into
the drawing points.
A consistent draw rate across the entire block cave footprint would ensure
that waste material or dilution did not prematurely enter the caving ore
material, by sterilising parts of the orebody or reduced grades. Snowden
(2010) noted the current PMC philosophy being the drawing of higher
draw cones quicker on the west and east of the block cave and ensuring
minimised sterilisation of draw cones through toppling. Snowden (2010)

136
considered the internal dolerite dilution to be well controlled and in Figure
76 below; little evidence existed to indicate that preferential loading was
taking place.
Figure 76: Tonnes mined per crosscut versus the dolerite percentage
Source: (Snowden, 2010)
Snowden (2010) indicated that higher than expected low-grade foskorite
material occurred in the head feed ranging between 20% and 40%.
Although the origin of this material was unknown, it was likely to be part of
the poorly modelled orebody, or it resulted from external dilution.
Draw control 8.5.2
In an attempt to assess the PMC draw control management, Snowden
(2010) addressed a couple of aspects namely; initial draw control practice
pre-2005, draw control by sector, draw control by draw point number and
preferential draw for high-grade areas. Snowden (2010) raised concerns
regarding the poor draw control management during the initial years of the
block cave, which resulted in more erratic draw horizons or HOD across
the present cave.
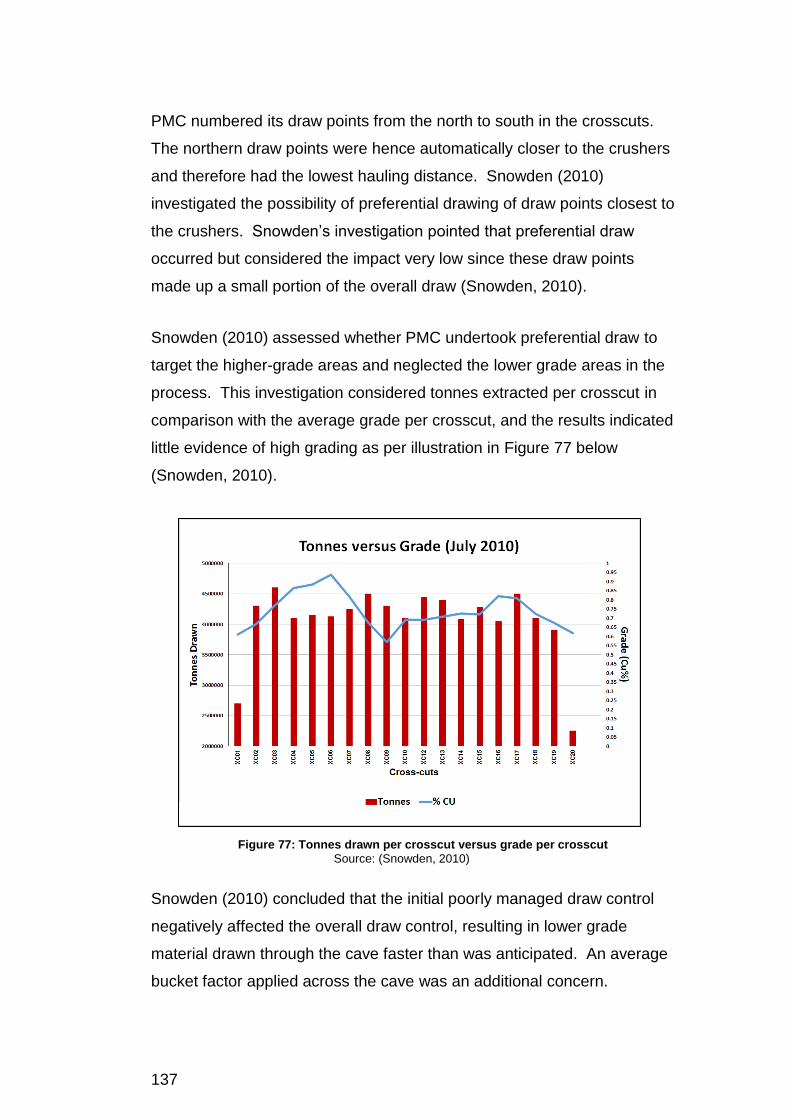
137
PMC numbered its draw points from the north to south in the crosscuts.
The northern draw points were hence automatically closer to the crushers
and therefore had the lowest hauling distance. Snowden (2010)
investigated the possibility of preferential drawing of draw points closest to
the crushers. Snowden’s investigation pointed that preferential draw
occurred but considered the impact very low since these draw points
made up a small portion of the overall draw (Snowden, 2010).
Snowden (2010) assessed whether PMC undertook preferential draw to
target the higher-grade areas and neglected the lower grade areas in the
process. This investigation considered tonnes extracted per crosscut in
comparison with the average grade per crosscut, and the results indicated
little evidence of high grading as per illustration in Figure 77 below
(Snowden, 2010).
Figure 77: Tonnes drawn per crosscut versus grade per crosscut
Source: (Snowden, 2010)
Snowden (2010) concluded that the initial poorly managed draw control
negatively affected the overall draw control, resulting in lower grade
material drawn through the cave faster than was anticipated. An average
bucket factor applied across the cave was an additional concern.
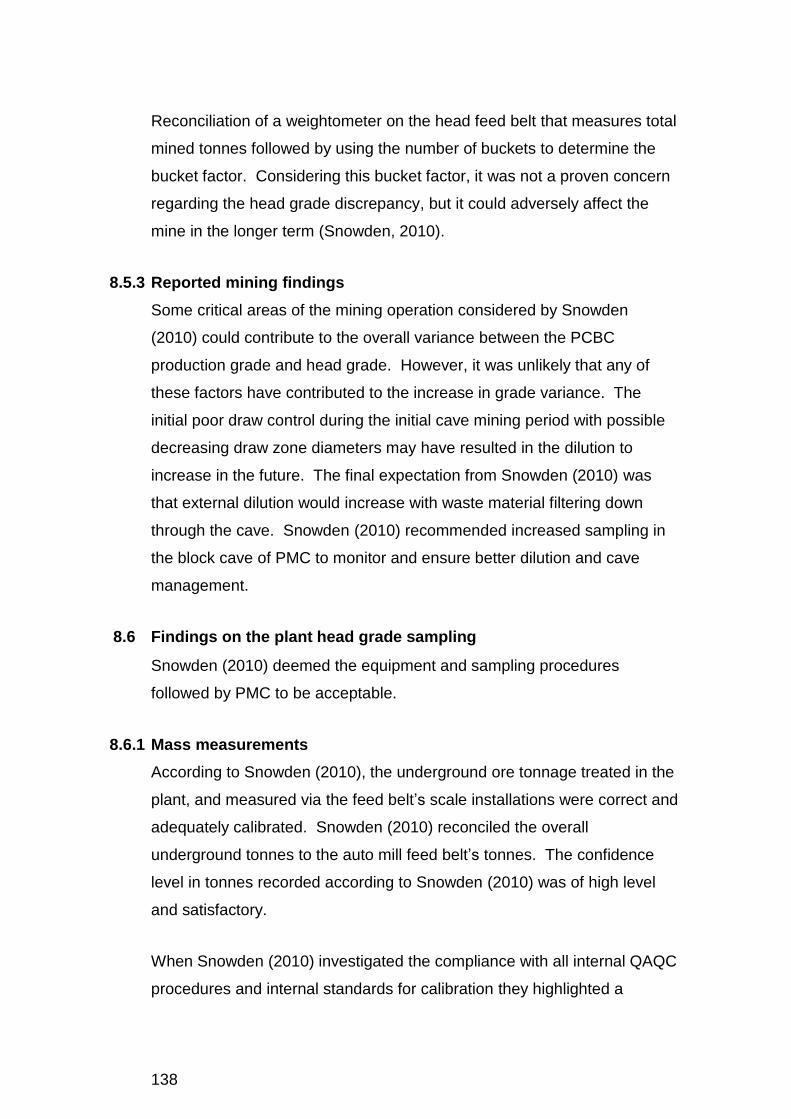
138
Reconciliation of a weightometer on the head feed belt that measures total
mined tonnes followed by using the number of buckets to determine the
bucket factor. Considering this bucket factor, it was not a proven concern
regarding the head grade discrepancy, but it could adversely affect the
mine in the longer term (Snowden, 2010).
Reported mining findings 8.5.3
Some critical areas of the mining operation considered by Snowden
(2010) could contribute to the overall variance between the PCBC
production grade and head grade. However, it was unlikely that any of
these factors have contributed to the increase in grade variance. The
initial poor draw control during the initial cave mining period with possible
decreasing draw zone diameters may have resulted in the dilution to
increase in the future. The final expectation from Snowden (2010) was
that external dilution would increase with waste material filtering down
through the cave. Snowden (2010) recommended increased sampling in
the block cave of PMC to monitor and ensure better dilution and cave
management.
Findings on the plant head grade sampling 8.6
Snowden (2010) deemed the equipment and sampling procedures
followed by PMC to be acceptable.
Mass measurements 8.6.1
According to Snowden (2010), the underground ore tonnage treated in the
plant, and measured via the feed belt’s scale installations were correct and
adequately calibrated. Snowden (2010) reconciled the overall
underground tonnes to the auto mill feed belt’s tonnes. The confidence
level in tonnes recorded according to Snowden (2010) was of high level
and satisfactory.
When Snowden (2010) investigated the compliance with all internal QAQC
procedures and internal standards for calibration they highlighted a
139
concern regarding the long-term negative drift which remained evident.
However, if the head grade reduction were due to analytical procedures,
the standard would provide evidence to make such a conclusion. In
Figure 78 below, the standard drift depicted by the green line on the graph
represents the cumulative difference of the standard, and the certified
value of the standard (Snowden, 2010).
Figure 78: The cyclone overflow quality-control standard & head grade per month
Source: (Snowden, 2010)
Snowden (2010) indicated that the procedures, monitoring and control of
the analytical processes investigated, was appropriate and the results
were reliable and unbiased.
Conclusion 8.7
Snowden (2010) concluded that the issues relating to the resource model
were most likely the critical factors for the variance between the head
grade and the PCBC output grade. The possibility existed that the current
fragmentation issues may have exacerbated this discrepancy.
The limited sample data coverage and unavailability of QAQC data
compromised the underlying data used in the resource estimation.
140
Snowden (2010) considered the estimation smoothed, but alternatively
resulted in an overestimation of lower grade areas and an underestimation
of high-grade areas. Contributing to the limited information it resultantly
created a lower confidence classification of the resource model. Since the
block model excluded the lithology units except for dolerite, higher than
expected quantities of foskorite observed may have influenced the
external dilution interpretation of the geological model.
This project report wishes to emphasise the specifical term used by
Snowden (2010) in section 8.5.1. Snowden (2010) referred to “toppling”
and this term according to this project report never received the attention it
required. Seemingly, the slope failure’s grade impact and actual effect
were not adequately tested or correctly interpreted. This critical failure
grade which affects the PMC block cave lacked adequate detail in the
previous resource reviews. This project report addresses the failure’s
grade in more detail in the next section.
9 REVIVING THE 2015 RESOURCE MODEL
Introduction 9.1
During 2015, PMC experienced another grade diversion between the head
grade and the modelled PCBC grade. The head grade yielded way above
the model, while the model indicated that the cave’s underground grade
was drastically depleting. Figure 79 shows old forecasts for 2015 with a
drastic depletion of the grade below 0.5% Cu from 2015 onwards (Diering,
2015).

141
Figure 79: Quarterly indicative modelled grades from PCBC
Source: (Diering, 2015)
PMC’s technical team consulted Dr Tony Diering to investigate this
unanticipated scenario, in an attempt to understand what caused this
grade behaviour and its interpretation thereof. The grade behaviour
affected the draw control strategy and required a severe revision to
anticipate the behaviour of the cave’s grade by any means. The
conundrum Palabora faced with higher than expected grades at the
ending of Lift 1 was not expected. PMC needed to understand whether
the achieved grades were short-lived or not. The higher head grade could
be short-lived, and if true, the mine would ultimately face a copper-
recession or copper-gap. The reason being is that PMC’s Lift 2 mine
progressed still in its development phase and was nowhere near any
copper production yet. This section describes how PMC dealt with this
grade divergence and covered the investigation and outcome.
The resource copper grade investigation 9.2
Diering (2013) described in detail key factors affecting the calculation of a
mineable ore reserve and its computation, such as dilution sources, flow
mechanisms, mine economics, excavation geometry, mining sequence,
and residual material situations. Diering has more than 25 years of block
caving experience (Diering, 2013). The resource model investigation in

142
2014 and 2015, created new insight into the elusive block cave behaviour
of PMC’s Lift 1 block cave.
Initial work on the 2015 resource model included the basis for modelling
investigation. PMC revised the failure material, which flowed into the
block cave from the surface (Diering, 2015). The failure material in the
resource model had minimum copper values assigned to it, and the
geology department investigated these assigned grades. In sections 2.12
there were indications of reserve losses from the failure, and Ngidi &
Pretorius (2010) mentioned that the failure was practically waste material.
Hans-Dieter Paetzold, the 2015 geology specialist at PMC, used old open
pit blast-hole data and supplemented the underground exploration drilling
with these open pit information. In the process, a “de-clustering”
technique combined the blast-hole and exploration data usage (Diering,
2015). The remodelling of the resource with this additional information
allowed for better estimates of the upper cave portions, and failing
material. The estimated metal content in the open pit failure zone was
better estimated, with the modelling done for lithology, density and copper
(Diering, 2015). The resource model before these additions had
practically included more waste from the failure material. However,
quantifying the current size of the failure zone, its interpretation, and
influence would allow for the highest confidence levels possible.
Modelling of the failure zone and the estimated glory-hole position 9.3
The available annual Fly-Lidar surveys over the pit enabled the modelling
of geometrical changes in failure over time. Wireframes created from the
survey points enabled a failure area calculation of the annual displaced
material and differences between successive years (Diering, 2015).
Figure 80 shows the progressive views of the open pit failure used for
calculating the failure volumes.

143
Figure 80: Successive views of the open pit failure
Source: after (Diering, 2015)
A theoretical but practical extrapolated construction of the failure base in
the open pit enabled the calculation of each flyover’s failure capacity.
Although the real failure bottom or such surface extent of it was still
unknown and covered with failure material, the joining of the original pit
bottom and failure’s top extent served as a logical but practical modelled
floor (Diering, 2015). Diering (2015) outlined the cave’s breakthrough and
estimated demarcation from the failure material’s shape and behaviour in
the bottom of the open pit. Figure 81 illustrates the top of the cave, where
the breakthrough was visible and demarcated in magenta (middle) and
flooded with a blue outline (right).
Figure 81: The top of the cave and demarcated glory-hole position
Source: after (Diering, 2015)
The estimated position of the top of the cave served as investigation
regarding the influence it had on the draw points below it in the cave at the
production level. By superimposing the outline on top of the cave, the
affected draw points became identifiable, as Figure 82 indicates.

144
Figure 82: Top of cave superimposed over the draw points
Source: after (Diering, 2015)
The first attempted surface area of the failure floor resulted in an area
which was not large enough, which Diering (2015) adjusted to extend from
the failing crest to the glory hole. Figure 83 indicates the blue string lines,
forming the applicable failure floor area, and where the floor and model
were superimposed, the shortfall in floor surface area was visible.
However, the far right picture in Figure 83 indicates the corrected purple
string line floor, covering the entire applicable failure area. It is important
to note that the higher grade material in the failure zone is at the base of
the failure (closest to the glory hole) (Diering, 2015).
Figure 83: Views of the failure area floor
Source: after (Diering, 2015)
The concept of failure study 9.4
During the 2015 investigation, a different possible concept identified by
Diering (2015) and the PMC Technical team resulted in PMC having more

145
than one failure concept. The toppling concept showed that the 2015
grade situation and resultant grade representative dummy runs in PCBC,
still matched insufficiently. The concept of failure zones led the team to
demarcate the failure zone in the hope to identify better grade zones
(Diering, 2015). The failure zone comprised of higher Cu grades at the
base and lower Cu grades at the crest of the open pit. Diering (2015)
divided the failure zone into different failure zones, ranging from top to
bottom over the failure surface area (Diering, 2015). Figure 84 below
indicates how this investigation studied different grade zones applicable to
the specific failure material.
Figure 84: Concept of failure zones
Source: after (Diering, 2015)
The modelled progress shown in Figure 85 indicates the application of
failure zone material to fail into the cave with a more northern overhang for
its draw zone ellipsoids. The failure material before failure is coloured
magenta in the picture a) where the volume shows in b) and the assigned
grades with different colours is in c).
Figure 85: The before and after failure zone evaluated
Source: after (Diering, 2015)

146
Where the failure ultimately enters the cave or fails into the cave, the
modelling represented such as per indicated right-hand picture d) above.
The calculation of the swell resulted from the volume before, multiplied
with the swell to equal the expected volume after (Diering, 2015). The
calculated swell factor in the failure zone needed to compare with the total
mined-to-date volumes. The calculated before and after volumes from the
failure zone had to conserve both the tonnes and metal content (Diering,
2015). Diering (2015) evaluated the modelled failure, ran it in PCBC, and
tested results against the current mined and remaining tonnes. The
progressing model steadily took shape, and the investigation progressed
to find a possible solution.
The evaluation of the construction indicated that with 165 Mt in the cave
zone, 151 Mt of broken material was additional from the failure. The new
total available tonnes of 316 Mt with 127 Mt mined over the LOM indicated
189 Mt remaining within the cave (Diering, 2015). By calculating the
model in a straight-line depletion model, the results revealed that
approximately 500 000 tonnes of Cu remained in the cave (Diering, 2015).
The graph in Figure 86 indicates the straight-line results to deplete
the entire cave, where mining would deplete the total Cu content to zero.
Figure 86: Straight-line depletion graph for Lift 1
Source: (Diering, 2015)

147
The straight-line model’s metal content compared with the content and
same volume within PCBC. The exclusion of blocks above the shoulders
as per Figure 87 a) and representation of modelled failure in b) from c)
indicates the progress of the investigation (Diering, 2015). Diering (2015)
suggested that a very sudden reduction in the current grades at the time
would be unlikely as there was still a significant amount of copper in the
broken rock mass.
Figure 87: The failure volume modelled within PCBC
Source: (Diering, 2015)
The final process included the addition of the failure model to the overall
resource model, where the constructed sliced blocks of the overall “new”
cave model dummy run with the updated production history. The
illustration in Figure 88 indicates the superimposed former cave profile and
the amended final cave profile.
Figure 88: Reshaping the Lift 1 cave profile from indicated parameter adjustments
Source: (Diering, 2015)
Former profile
Amended profile

148
The progress of the investigation was tested, and modelled in CA3D,
where the Cu grade graphs produced for several PCBC runs, required
more scrutiny (Diering, 2015). Figure 89 illustrates that the head grade
and modelled grade improved, in that they correlated better in the mid-
years of production, but they still deviated unacceptably in the later years
of the LOM (Diering, 2015).
Figure 89: The modelled Cu grade versus the reported grade
Source: (Diering, 2015)
The toppling mechanism and parameter in the PCBC program were set to
erode or “shave” the failure surface, which was not evident as per
indication in Figure 90.

149
Figure 90: Deficiencies determined from the PCBC run and study
Source: (Diering, 2015)
Diering (2015) furthermore indicated that the subsidence zone appeared in
the wrong place, with specific reference to the red arrows in Figure 90
above. The 2014 failure illustrated minimal movement in the cyan oval
outline, and the cave back on the north side appeared poorly (yellow
outline) (Diering, 2015). Shortcomings existed in this model, but the
model produced valuable additional learnings.
The glacier flow concept 9.5
Diering (2015) reasoned from the shortcomings of the concept of failure
study that a glacial flow concept for the failure area could have occurred.
From previous glacier-forming conducted studies, snow deposits in the
accumulation zone at high altitudes. As the snow transforms into “Névé”
and becomes increasingly dense through time, air pores disappear to form
ice. With more snow depositing at the hilltops, the upper layers become
heavy, and gravity pulls the upper layers downward, to lower altitude
areas (Pauly, 2014). Figure 91 shows the flow direction of a glacier,
where it slides downwards on a mountain slope.
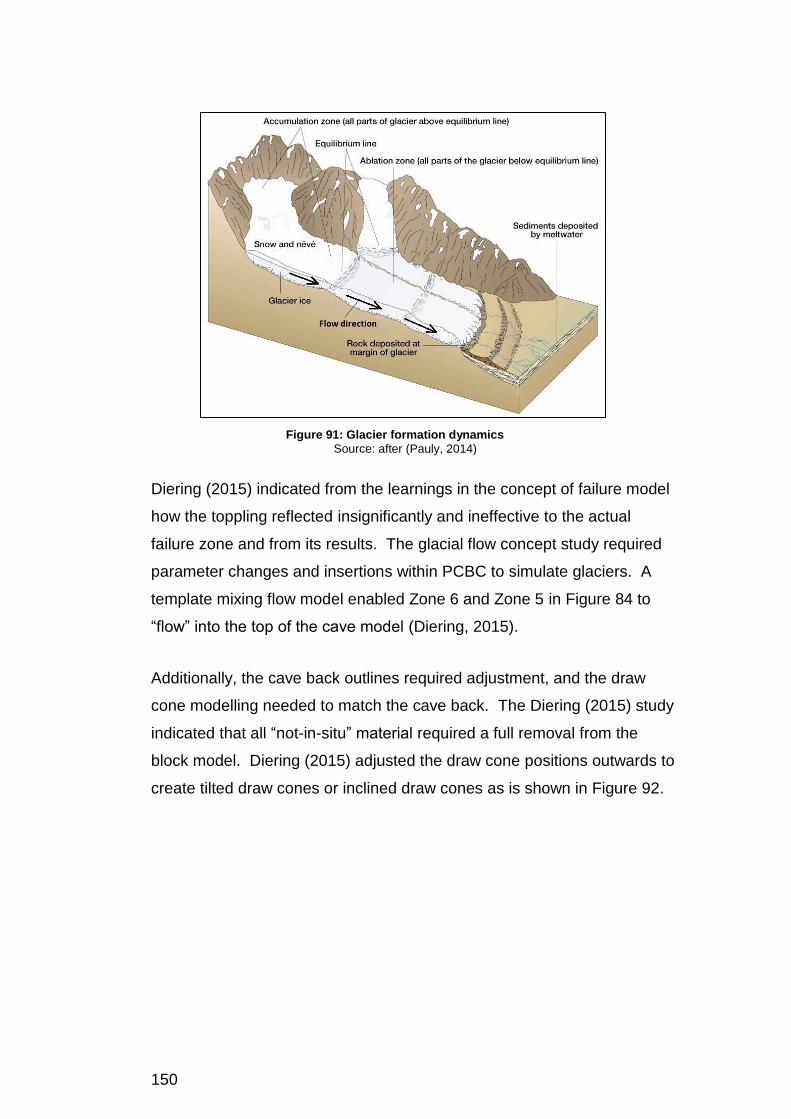
150
Figure 91: Glacier formation dynamics
Source: after (Pauly, 2014)
Diering (2015) indicated from the learnings in the concept of failure model
how the toppling reflected insignificantly and ineffective to the actual
failure zone and from its results. The glacial flow concept study required
parameter changes and insertions within PCBC to simulate glaciers. A
template mixing flow model enabled Zone 6 and Zone 5 in Figure 84 to
“flow” into the top of the cave model (Diering, 2015).
Additionally, the cave back outlines required adjustment, and the draw
cone modelling needed to match the cave back. The Diering (2015) study
indicated that all “not-in-situ” material required a full removal from the
block model. Diering (2015) adjusted the draw cone positions outwards to
create tilted draw cones or inclined draw cones as is shown in Figure 92.
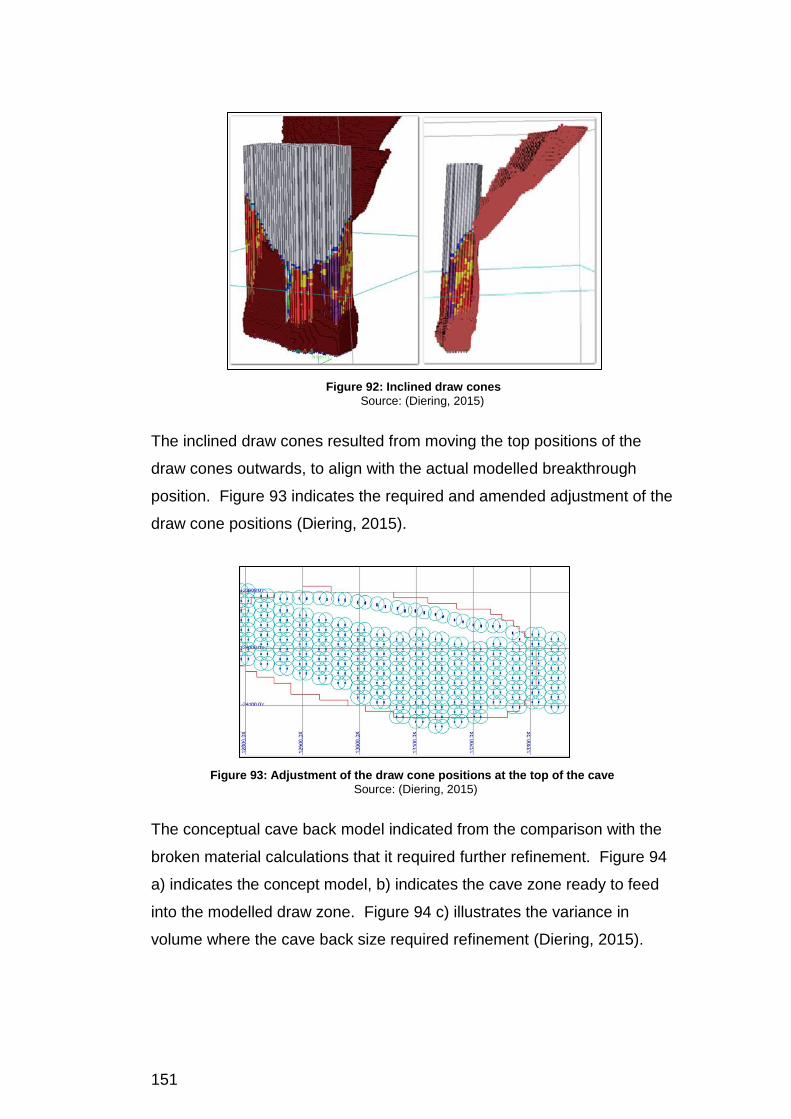
151
Figure 92: Inclined draw cones
Source: (Diering, 2015)
The inclined draw cones resulted from moving the top positions of the
draw cones outwards, to align with the actual modelled breakthrough
position. Figure 93 indicates the required and amended adjustment of the
draw cone positions (Diering, 2015).
Figure 93: Adjustment of the draw cone positions at the top of the cave
Source: (Diering, 2015)
The conceptual cave back model indicated from the comparison with the
broken material calculations that it required further refinement. Figure 94
a) indicates the concept model, b) indicates the cave zone ready to feed
into the modelled draw zone. Figure 94 c) illustrates the variance in
volume where the cave back size required refinement (Diering, 2015).
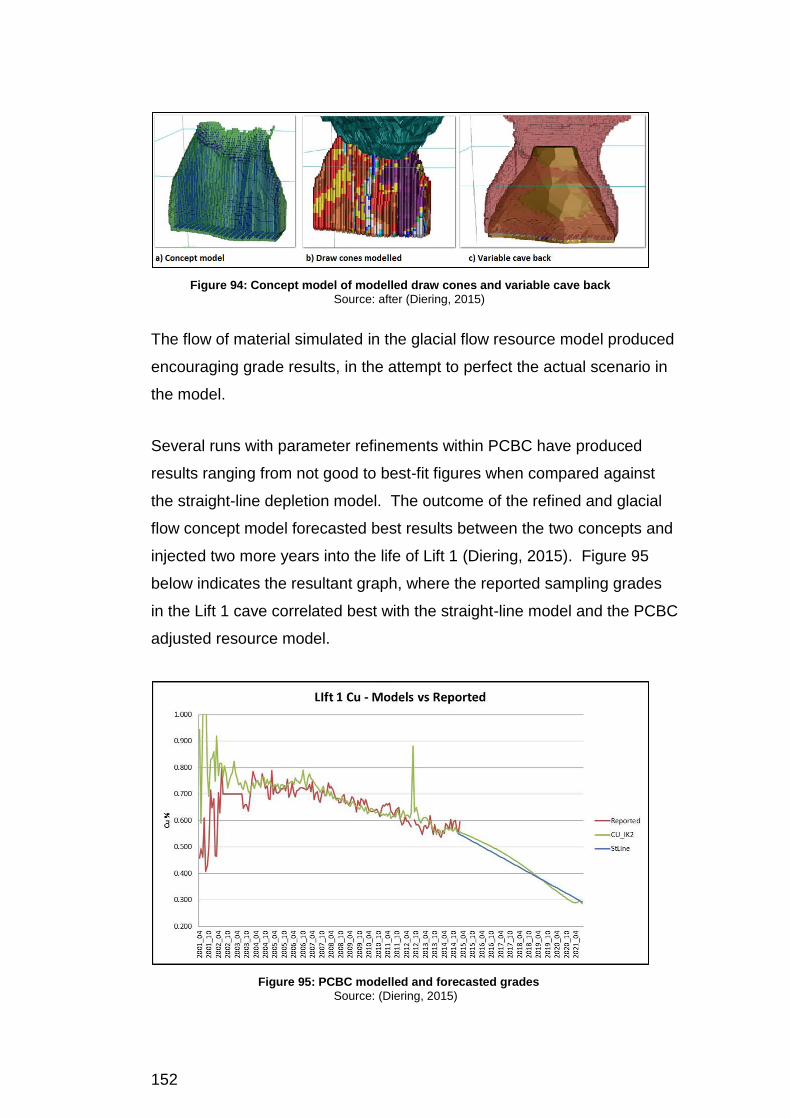
152
Figure 94: Concept model of modelled draw cones and variable cave back
Source: after (Diering, 2015)
The flow of material simulated in the glacial flow resource model produced
encouraging grade results, in the attempt to perfect the actual scenario in
the model.
Several runs with parameter refinements within PCBC have produced
results ranging from not good to best-fit figures when compared against
the straight-line depletion model. The outcome of the refined and glacial
flow concept model forecasted best results between the two concepts and
injected two more years into the life of Lift 1 (Diering, 2015). Figure 95
below indicates the resultant graph, where the reported sampling grades
in the Lift 1 cave correlated best with the straight-line model and the PCBC
adjusted resource model.
Figure 95: PCBC modelled and forecasted grades
Source: (Diering, 2015)

153
Conclusion 9.6
The crown pillar broke through in 2004 whereby the weak zones in the
open pit lost its footing and started a slope failure. This external material
bled into the current cave, and the previous block model did not include
external sources (Marshall, 2012). The Diering (2015) study identified
several additional factors that were not forming part of the resource model,
which revealed an unexpected sustaining resource grade at the time.
Higher unexpected actual grades from sampling values in the cave versus
the predicted planned lower grades from PCBC required an investigation
of the cave behaviour. The technical team of PMC had to review the
status of the block cave and discovered new information to refine the
resource model with modifying parameters. The parameters included the
refinement of the inclination of the draw cones, the area of block model
coverage, blast-hole, and drilling data from the open pit and an estimated
failure floor to calculate the failure volume (Diering, 2015).
With the influx of the failure zone material into the block cave, which
reported at the production level, the resource model’s investigation and
reconciliation followed. The reconciliation followed two conceptual
studies. The first conceptual study has indicated that if flow and toppling
parameters were only applicable, the results were not meeting the actual
and expected situation for Lift 1. Ultimately, the inclusion of the actual
bench mapping and drill assay blast information into the resource model
improved the model.
The second concept of a glacial flow perspective, followed only after the
first concept revealed unsatisfactory variances. The previous and
erroneously omitted failure’s grade values, previously modelled as having
lower grade material, resulted in the indicative head grade and model
grade departing from one another. The departing grades fundamentally
led to lower predicted grades in the resource model, which featured from
the PCBC data.

154
The failure zone’s bottom surface, which is still undefinable, can be
controversial but estimated and calculated into a best “practical floor”.
This practical floor currently defines the calculated failure material volumes
and open pit valuation data and geology assigned to it. The Diering
(2015) investigation added at least two more years to the original expected
LOM for Lift 1. This injection reduced the copper-gap in a tough economic
time and where Lift 2 is still in its development phase. Further refinements
to the 2015 resource model are possible with further investigation.
10 CONCLUSION
Palabora Mining Company started copper prospecting in 1952. Initially,
Palabora was an open pit mine, which transitioned to underground block
cave mining around 2002. The Palabora Underground Mining Project
developed a world first cave mine in competent rock and used the crinkle
cut design in its undercut level for caving. Despite the sampling and
drilling from the exploration tunnel below the open pit, inadequate drilling
for the underground resource existed. This drilling shortfall contributed to
many grade diversions between the head grade and model grades during
the life of mine.
Many resource studies covering the life of mine had to seek information to
verify and adjust the resource model where it was applicable. The early
mining and draw control was poorly managed and had manual input
sheets. The LHD operators completed the shift mucking from their
recollection after shifts. The underground draw control upgraded to an
electronic tag reading system, where the system registered machines at
draw points electronically in a database. This database is more accurate
than a manual system while no system errors occur. These systems are
not flawless, but provide reliable results in the draw control. This
fundamental shortcoming contributed to the initial drawing inaccuracies,
which affected the resource of Palabora Mine.
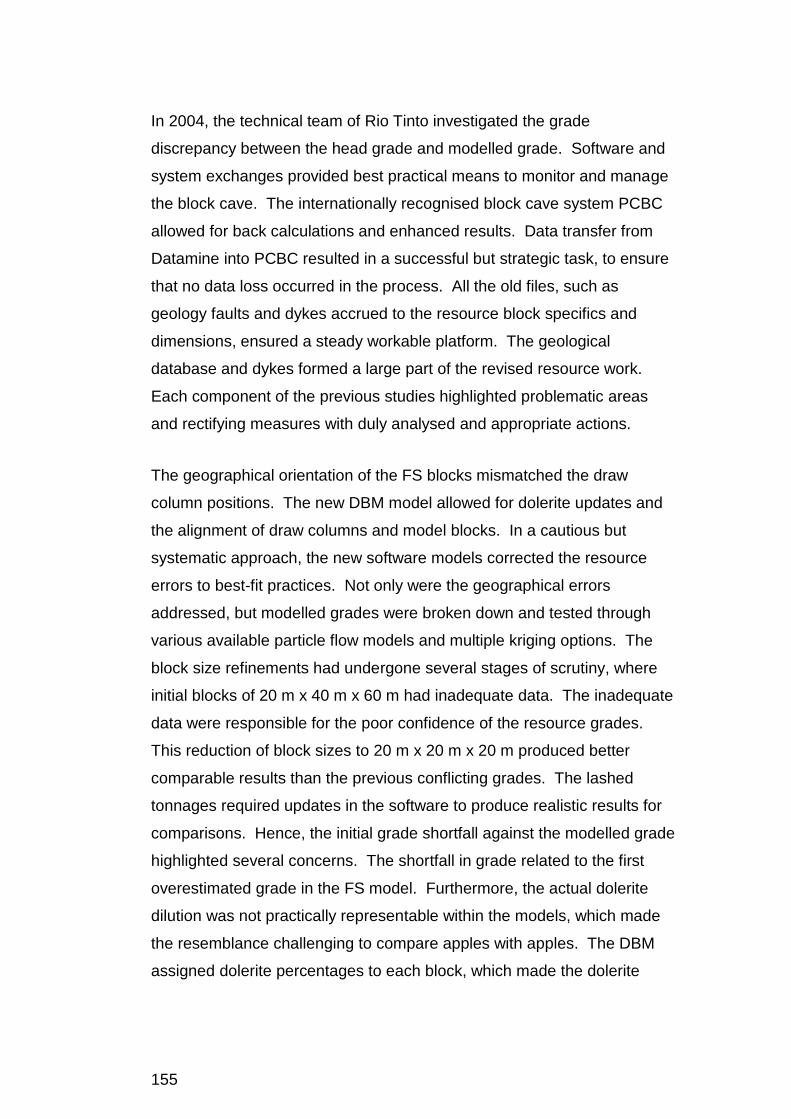
155
In 2004, the technical team of Rio Tinto investigated the grade
discrepancy between the head grade and modelled grade. Software and
system exchanges provided best practical means to monitor and manage
the block cave. The internationally recognised block cave system PCBC
allowed for back calculations and enhanced results. Data transfer from
Datamine into PCBC resulted in a successful but strategic task, to ensure
that no data loss occurred in the process. All the old files, such as
geology faults and dykes accrued to the resource block specifics and
dimensions, ensured a steady workable platform. The geological
database and dykes formed a large part of the revised resource work.
Each component of the previous studies highlighted problematic areas
and rectifying measures with duly analysed and appropriate actions.
The geographical orientation of the FS blocks mismatched the draw
column positions. The new DBM model allowed for dolerite updates and
the alignment of draw columns and model blocks. In a cautious but
systematic approach, the new software models corrected the resource
errors to best-fit practices. Not only were the geographical errors
addressed, but modelled grades were broken down and tested through
various available particle flow models and multiple kriging options. The
block size refinements had undergone several stages of scrutiny, where
initial blocks of 20 m x 40 m x 60 m had inadequate data. The inadequate
data were responsible for the poor confidence of the resource grades.
This reduction of block sizes to 20 m x 20 m x 20 m produced better
comparable results than the previous conflicting grades. The lashed
tonnages required updates in the software to produce realistic results for
comparisons. Hence, the initial grade shortfall against the modelled grade
highlighted several concerns. The shortfall in grade related to the first
overestimated grade in the FS model. Furthermore, the actual dolerite
dilution was not practically representable within the models, which made
the resemblance challenging to compare apples with apples. The DBM
assigned dolerite percentages to each block, which made the dolerite
156
dilution effect more practical with reasonable resource grades and
improved draw control reporting.
The underground sampling size remained inadequate to be representative
of the total mucked and lashed tonnes and proved to be biased towards
fines. However, the conducted sampling within the production area
allowed for draw control and internal referencing, which proved
alternatively to be an excellent leading indicator. The Lift 1 Palabora block
cave dealt with almost every possible confrontation, of which the most
significant flaw in the mine appeared to be the sparse drilling coverage to
establish a confident Lift 1 resource model.
Minor identified contributing factors such as variable bucket factors or
significant factors with many hypotheses arose over Palabora’s block
cave, and the mine’s end was even more uncertain. A massive blow to
the block cave occurred as a slope failure at the open pit above the block
cave. The failure’s waste material contributed to excessive losses in
reserves. The model grade and the head grade contrasting trends
continued after 2005, despite various corrections and improvements to the
model. Where the head grade departed from the PCBC grade, Snowden
(2010) could not calibrate the PCBC values without adequate smart
markers. Palabora Mine anticipated revising its Lift 1 resource annually
due to the poor drilling coverage. The revisions incorporated studies over
time made by several individuals and companies who incorporated new
evidence as information became available over time.
The head grade trended slightly below the modelled grade, whereas in
June 2008 and around 2015 the modelled grade dipped below the head
grade. Thus, an inverse of grade anomalies occurred together with
correlating grade behaviours during the LOM of Lift 1.
During the 2015 study, the head grade sustained its position above the
modelled grade, and a need to investigate the grade behaviour was

157
critical. The investigation led by Dr Diering followed different concepts of
failure studies. The studies revealed that toppling has erroneously
misinterpreted the failure zone. The failure zone slid downwards to the
bottom of the open pit, and Diering (2015) included the actual values from
the open pit mining to the resource model. Previously the failure zone
material, which bled into the block cave, had very low copper grade
values. With the additional values and glacial flow parameters adjusted
within PCBC, the refined resource model indicated results that are more
acceptable and was more practical with regards to the interaction of the
cave and the failure. The adjustment within the resource allowed
Palabora Mine to extend the LOM of Lift 1 with two additional years. This
injection of more copper life came at a very welcoming time for Palabora
Mine, where the new Lift 2 mine was still in its development phase.
PMC anticipated extending its copper production beyond 2030. Over the
years, the Palabora Mine succeeded with limited knowledge to adequately
maintain, manage, and control its copper resources as an ongoing study.
11 RECOMMENDATION
Identified frozen material at the pit base not moving or indicating to report
into the current cave could be refined in the model. Some of the expected
higher-grade estimates locked up on this bottom surface lie dormant since
the failure happened. The pit failure zone and the perceived failed floor
could receive more strict attention, and its model can improve as new
information becomes available.
The cave back can be refined more accurately where modelling comprises
of the updated height of draw indications and the surface indication of the
northern propagation direction. The block model can improve via
alternative interpretations in PCBC to refine the grades between the LOM
estimate and actual head grade. Additional studies conducted will play a
critical role at the end of the Lift 2’s LOM when Lift 1 and the surface
material reports into the second block cave of PMC. The Lift 2

158
environment should consist of adequate smart markers, which will produce
tangible results for the flow of material and where the Lift 2 resource would
eliminate the shortfalls of the Lift 1 cave.
Mines such as the Grasberg block cave, Finsch Mine, Andina Mine, and
Venetia Mine have similar interactions between the open pit and block
cave operations. There is currently little-written knowledge on the
economic effects of failures and external material exercises on the grades
within these block caves. Ultimately, more information on how several
mines deal with their slope failures and how the influence of failures affect
their resource grades will be beneficial for future studies. The lessons
learned will form excellent topics for future students doing research.
This project report also mentioned the phenomenon of fracture banding in
caving mines, which requires further studies and investigation. The
additional investigations can contribute towards the effect fracture banding
had on the slope failure, cave management, and resource grade. Fracture
banding could assist in refining the cave back and the block cave model
optimally regarding its resource management and grades.
This project report hence invites other candidates in the field to extend the
knowledge base of this report, where more resource work after 2015 at
PMC may focus on the future Lift 2 operations.
12 REFERENCES
Ahmed, H.M., 2009. Influence of block cave mining on pit slope deformation mechanisms. Vancouver: The University of British Columbia The University of British Columbia.
Ahmed, H.M., Eberhardt, E. & Dunbar, W.S., 2014. Interaction between block caving and rock slope deformation kinematics. Mining Technology, 123(3), pp.3-13.
Atkins, R., 2013. Lift 1 Fragmentation Study. [Power Point slide show] Phalaborwa: Rio Tinto.
Barnet, W.P., 2003. Geological control on slope failure mechanisms in the open pit at Venetia Mine. South African Journal of Geology, 106(2-3), pp.149-164.
Board, M. & Pierce, M.E., 2009. A Review of Recent Experience in Modelling of Caving. In Proceedings of the International Workshop on Numerical Modeling for Underground Mine Excavation Design. Atlanta, USA, 2009. NIOSH.
159
Brummer, R.K., Li, H., Moss, A. & Casten, T., 2006. The transition from open pit to underground mining: an unusual slope failure mechanism at Palabora. In In Proceedings of International Symposium on Stability of Rock Slopes in Open Pit Mining and Civil Engineering., 2006. The South African Institute of Mining and Metallurgy.
Butcher, R.J. & Jenkins, P.A., 2006. Subsidence Effects Associated With the Block and Sub Level Caving of Massive Orebodies. In 2nd International Seminar: Strategic versus tactical approaches in mining. Perth, 2006. Australian Centre for Geomechanics.
Calder, K., 2006. Rio Tinto Copper Projects Block Cave Design Workshop. [Online] Salt Lake City: Rio Tinto Technical Services.
Calder, K., Townsend, P. & Russell, F., 2000. Palabora Underground Mine Project. In Proceedings of the MassMin 2000 Conference. Brisbane, 2000. The Australian Institute of Mining and Metallurgy.
Carlson, G., Tyler, D., DeWolfe, C. & Lorig, L., 2004. Understanding gravity flow for mix and dilution modelling at Henderson Mine. In Karzulovic, A. & Alvaro, M., eds. Proceedings MassMin 2004. Santiago, 2004. Instituto de Ingenieros de Chile.
Chitombo, G.P., 2010. Cave mining: 16 years after Laubscher's 1994 paper 'Cave mining - state of the art'. Mining Technology - Australian Centre for Geomechanics, 119(No 3), pp.132-141.
Cook, A., 2011. Draw Point Sampling Observations - Palabora. Phalaborwa: PMC internal Memo.
Cumming-Potvin, D., Wesseloo, J., Jacobsz, S.W. & Kearsley, E., 2016. Fracture banding in caving mines. The Journal of the Southern African Institute of Mining and Metallurgy, 116(August), pp.753-761.
Cundall, P., 2008. Recent Advances in Numerical Modelling for Large-Scale Mining Projects. Minneapolis: Australian Centre for Geomechanics Newsletter.
Dassault Systemes, 2013. Leading Block Cave Planning and Scheduling Solution. [Online] Available at: http://www.3ds.com\Geovia\PCBC [Accessed 26 June 2015].
De La Comisión, M., Massa, J.V., Pierce, M. & Tavantzis, A.T., 2012. Study of the gravity flow mechanisms at Goldex by means of a physical model. Thesis. Santiago de Chile: University of Chile.
Diering, T., 2007. Template Mixing An Alternative Depletion Engine for Block Cave Scheduling. In Proceedings APCOM. Santiago, 2007. APCOM.
Diering, T., 2010. PC-BC: A Block Cave Design and Draw Control System. In Chitombo, G., ed. MassMin 2000 Proceedings. Brisbane, Australia, 2010. The Australasian Institute of Mining and Metallurgy.
Diering, T., 2013. Reserve Estimation for Block Cave Mines Using Geovia PCBC. White Paper. Vancouver: Dassault Systemes Geovia / PCBC.
Diering, T., 2015. Palabora Lift 1 PCBC update. [Powerpoint presentation].
Du Plessis, L. & Martin, D.C., 1991. Numerical Modelling Studies for Design of High Rock Slopes at Palabora Copper Mine. In 7th ISRM Congress. International Society for Rock Mechanics., 1991.
Dunstan, G. & Popa, L., 2012. Innovative Cave Establishment Practices at Ridgeway Deeps. In MassMin 2012. Salsbury, 2012.
Duplancic, P. & Brady, B.H., 1999. Characterisation of caving mechanisms by analysis of seismicity and rock stress. In Vouille, G., Berest, P. & Balkema, L.E., eds. Proceedings of the 9th ISRM Congress on Rock Mechanics. Paris, 1999.
Fernandez, F., Evans, P. & Gelson, R., 2010. Design and implementation of a damage assessment system at Argyle Diamond's block cave project. In Potvin, Y., ed. Caving
160
2010: Second International Symposium on Block and Sublevel Caving. Perth, 2010. Australian Centre for Geomechanics.
Glazer, S.N. & Hepworth, N., 2006. Crown pillar failure mechanism - case study based on seismic data from Palabora Mine. Mining Technology, 115(No 2), pp.75-84.
Glazer, S.N. & Townsend, P.A., 2010. Initial and east cave breakthrough events at Palabora Mining Company. In Potvin, Y., ed. Caving 2010, Proceedings of the Second International Symposium on Block and Sublevel Caving. Perth, Australia, 2010. Australian Centre for Geomechanics.
Gustafsson, P., 1998. ISSN 1402-1544 Waste rock content variations during gravity flow in sublevel caving, Analysis of full-scale experiments and numerical simulations. Doctoral Thesis. Sweden: Lulea Tekniska Universitet Lulea Tekniska Universitet.
Halim, A.E., 2004. 3D large-scale physical modelling for studying interactive drawing and draw point spacing in Block Caving Mines. In Julius Kruttschnitt Mineral Research Centre International Student Conference. Queensland, 2004. University of Queensland.
Heslop, T.G., 1983. The application of interactive draw theory to draw control practice in large chrysotile asbestos mine. In Mining and Metallurgical Operations in Zimbabwe. Harare, Zimbabwe, 1983.
Howson, M., 2003. Update and Analysis of Palabora's Geological Databases. Bristol, UK: Rio Tinto Technology Technical Services.
Howson, M., 2003. Update and Analysis of Palabora's Geological Databases. Bristol, UK: Rio Tinto Technology Technical Services.
Howson, M., 2004a. Proposal to PMC to Revise the Geological Data and Resource / Reserve models. Bristol, UK: Rio Tinto Technology Technical Services.
Howson, M., 2004b. Resources, Reserves and Geotechnical Data at Palabora Underground. Bristol, UK: Rio Tinto Technical Services.
Howson, M., 2004c. Revision of Palabora Underground Copper and Geology and Resources Data 2004. Bristol, UK: Rio Tinto Technical Services.
Howson, M., 2006. Revision of Palabora underground copper resources and reserves 2004 to 2005. Bristol, UK: Rio Tinto Technical Services.
Kuschke, O.H. & Tonking, M.J.H., 1971. Geology and Mining operations at Palabora Mining Company Limited, Phalaborwa, NE Transvaal. Journal of the South African Institute of Mining and Metallurgy, 1, pp.12-23.
Kvapil, R., 1992. Sublevel Caving. Littleton, Colorado: SME Mining Engineering Handbook.
Laubscher, D.H., 1994. Cave mining - state of the art. The South African Institute of Mining and Metallurgy, 94(10), pp.279-293.
Laubscher, D.H., 2000. A Practical Manual on Block Caving. In Block Caving Manual. Queensland: The University of Queensland. pp.1-30.
Li, Z. et al., 2015. A case study integrating numerical simulation and GB-InSAR monitoring to analyse flexural toppling of an anti-dip slope in Fushun open pit. Engineering Geology, 197, pp.20-32.
Marshall, K., 2012. Cave Induced Surface Subsidence. Phalaborwa: PMC.
Moss, A., Diachenko, S. & Townsend, P., 2006. Interaction between the block cave and the pit slopes at Palabora Mine. The Journal of The South African Institute of Mining and Metallurgy, 106(7), pp.479 - 484.
Ngidi, S.N. & Pretorius, D.D., 2008. Cave management ensuring optimal life of mine at Palabora. In MassMin 2008: In Proceedings of the 5th International Conference and Exhibition on Mass Mining. Luleå, Sweden, 2008. Luleå University of Technology Press.

161
Ngidi, S.N. & Pretorius, D.D., 2010. Impact of poor fragmentation on cave management. In Potvin, Y., ed. Second International Symposium on Block and Sublevel Caving. Perth, 2010. Australian Centre For Geomechanics.
Pauly, M., 2014. Canadian Cryospheric Information Network - Glacier Formation. [Online] Available at: https://ccin.ca/home/ccw/glaciers/formation [Accessed 24 December 2017].
PMC, 2007. Lift I modelling. [Online] Phalaborwa: PMC Geology Department.
PMC, 2016. Annual report for mineralised inventory, mineral resources and ore reserves. Competent persons report. Phalaborwa: Palabora Mining Company PMC.
Reyes-Montes, J.M. et al., 2010. Microseismic tools for the analysis of the interaction between open pit and underground developments. In Potvin, Y., ed. Caving 2010, Proceedings of the Second International Symposium on Block and Sublevel Caving. Perth, 2010. Australian Centre for Geomechanics.
Richards, D., 2004. Slope Failure Dilution Modelling Notes, December 2004. Phalaborwa: Gemcom Africa (Pty) Ltd.
Rio Tinto Technical Team, 2011. Lift II Order of Magnitude Study - Concept document Section 13 Orebody knowledge. Phalaborwa: Rio Tinto.
Sainsbury, B., 2010. Sensitivities in the numerical assessment of cave propagation. In Proceedings 2nd International Symposium on Block and Sublevel Caving., 2010. Itasca Australia Pty Ltd and The University of New South Wales.
Sainsbury, B., 2012. Phd. A model for cave propagation and subsidence assessment in jointed rock masses. New South Wales: University of New South Wales.
Sainsbury, B., Pierce, M.E. & Mas Ivars, D., 2008. Analysis of Caving Behaviour Using a Synthetic Rock Mass - Ubiquitous Joint Rock Mass Modelling Technique. In Potvin, Y., Carter, J., Dyskin, A. & Jeffrey, R., eds. Proceedings of the 1st Southern Hemisphere International Rock Mechanics Symposium. Perth, Australia, 2008. Australian Centre for Geomechanics.
Sainsbury, D.P. et al., 2016. Caving-induced Subsidence Behaviour of Lift 1 at the Palabora Block Cave Mine. In Seventh International Conference & Exhibition On Mass Mining. Sydney, 2016. MassMin 2016.
Severin, J.M. & Eberhardt, E., 2012. Influence of stress path during the transition from open pit to block cave Mine: A Palabora example., 2012. MassMin2012.
Severin, J.M., Eberhardt, E. & Woo, K.S., 2010. Influence of major fault zones on 3D ground deformations caused by open pit block cave interactions. In Potvin, Y., ed. Caving 2010, Proceedings of the Second International Symposium on Block and Sublevel Caving. Perth, 2010. Australian Centre for Geomechanics.
Shekhar, G., Gustafson, A. & Schunnesson, H., 2016. Draw Control Strategy and Resource Efficiency in Sublevel Caving. Research Report. Sweden: Lulea University of Technology.
Snowden, 2010. Palabora Mining Company Limited: Head Grade Audit. Johannesburg: Snowden Johannesburg Office.
SRK Consulting, 2011. Rio Tinto Corporate Assurance Internal Audit : PMC. Audit report. Phalaborwa: Rio Tinto.
Steffen, S. & Kuiper, P., 2011. Maximising ore recovery and the implication for cave monitoring and management practices - Application of the smart marker system in block and Sub-Level mines. [Online] Available at: http://elexonmining.com/wp-content/uploads/Maximising-ore-recovery.pdf [Accessed 27 November 2017].
Steward, C.A., Allman, A. & Hall, B.E., 2010. Block cave optimisation - a value-driven approach. In Potvin, Y., ed. Second International Symposium on Block and Sublevel Caving. Perth, Australia, 2010. Australian Centre for Geomechanics.

162
Studio 522 Productions, Inc., 2016. Freeport McMoran - Grasberg Mineral District. [Video screen shots] Available at: http://studio522.com/freeport_grasberg/ [Accessed 26 November 2017].
Walker, S., 2014. Engineering and Mining Journal. [Online] Available at: http://www.e-mj.com/features/4259-block-caving-mining-specialization.html#.WlTVm66WZhE [Accessed 03 January 2017].
Woo, K.-S., Eberhardt, E., Elmo, D. & Stead, D., 2013. Empirical investigation and characterisation of surface subsidence related to block cave mining. International Journal of Rock Mechanics & Mining Sciences, 61, pp.31-42.
Xu, N., Zhang, Y. & Mei, G., 2006. A numerical modelling method for predicting pit slope deformation and failure caused by underground mining under an open-pit. Beijing, China, 2006. Montreal Canada: International Society for Rock Mechanics 2015.