Embed Size (px)
Citation preview

a guaranteed income for the 21st century May 2021
Authored by:
Naomi Zewde | Kyle Strickland | Kelly Capatosto Ari Glogower | Darrick Hamilton
Naomi Zewde is an Assistant Professor in the Graduate School of Public Health and Health Policy at the City University of New York, [email protected]. Ari Glogower is an Associate Professor of Law at the Moritz College of Law at The Ohio State University, [email protected]. Kelly Capatosto is Senior Data and Policy Specialist at the Kirwan Institute for the Study of Race and Ethnicity at The Ohio State University, [email protected]. Kyle Strickland is Deputy Director of the Race and Democracy Program at the Roosevelt Institute and Senior Legal Analyst at the Kirwan Institute, [email protected]. Darrick Hamilton is a university professor, the Henry Cohen Professor of Economics and Urban Policy, and the founding Director of the Institute on Race and Political Economy at The New School, [email protected]. The authors began work on this paper while Dr. Hamilton was Executive Director of the Kirwan Institute. Funding for this paper was provided by the Economic Security Project. Views expressed represent those of the authors alone.
about the authors
ii

iii
Executive Summary
Our Guaranteed Income Proposal
Projected Economic Impacts
Introduction
Our Guaranteed Income Proposal
Economic Vulnerability
Unequal Effects of Current Tax and Fiscal Policies
Decline of Progressive Taxation
Racial and Gender Effects
Guaranteed Income and Justice Movements: A People’s History of Guaranteed Income
Dr. King and the Poor People’s Campaign
The Black Panther Party’s Ten-Point Platform
Women’s Rights Movements
Contemporary Movements
Economic Support Programs and Proposals
Guaranteed Income
Universal Basic Income (UBI)
Negative Income Tax
Earned Income Tax Credit
Our Guaranteed Income Proposal
Economic Impacts: Simulations
Individual and Household Effects
Group Demographic Effects
Effects on Household Poverty
Effects on Median Income
Additional Considerations
Program Cost
Periodic Refund Payment
Labor Incentives
Effects of Tax Filing Status
Conclusion
Appendix
References
TABLE OF CONTENTS1
1
2
3
3
5
9
9
10
12
12
13
13
14
15
15
16
16
17
19
20
20
21
22
26
27
27
27
28
28
30
31
33

iv
The past year has brought unimaginable changes to the American political, social, and economic landscape. Due to the Trump Administration’s inaction, misaction, and neglect, more than half a million people have died in the United States of COVID-19, and tens of thousands of cases continue to be reported each day. The police killings and abuse of Black Americans launched what may be the largest social movement in U.S. history, as millions of people took to the streets to demand racial justice, a demand that has yet to be met. We voted out a president and Senate majority that has deliberately used race and racism to divide us and saw an attempted coup at the U.S. Capitol. In the midst of all this devastation, many of us have continued to work, imagine, dream, organize and build toward a more just and equitable society. This groundbreaking policy proposal, grounded in notions of morality, justice, and equity, is a call to action, a demand for our government to use its most powerful fiscal tool —the U.S. tax code—to abolish poverty and work toward racial justice.
While this policy was being developed, our nation was struggling under the twin crises of the coronavirus health pandemic and economic recession. In response, our government sent Americans nearly $850 billion through three rounds of stimulus checks. For the first time these checks were provided to people with no earned income, meaning that they were able to reach some people with the most need. These were essential in helping Americans survive during this economic downturn, jump-started the economy from the bottom-up, and actually reduced poverty during one of the deepest recessions in modern history.
Building on this success, the American Rescue Plan included another stimulus check, and even more importantly, expanded the Child Tax Credit in several important ways. First, there is no wage-earning requirement for parents to receive the full benefit of the credit, meaning that children will not suffer because their parents are overcrowded into low-wage work or excluded from the labor market altogether. Second, starting in July 2021 checks will start going out as monthly payments, providing parents much needed economic stability. Finally, the amount of the credit has been increased. Functioning as a guaranteed income and anticipated to reduce child poverty by 40 percent for the one year it is enacted, this is nothing short of monumental.
While the extension of the Child Tax Credit is historic, necessary, and important, it is nonetheless insufficient. Our goal here cannot be to simply reduce poverty, but instead must be to abolish absolute poverty as we know it. Our responses over the past year have made crystal clear the truth that we have the power and resources to act to ensure economic stability for everyone. Every moment of inaction is a moment in which we actively choose poverty for way too many people struggling to make ends meet.
As the coronavirus pandemic raged through our communities, tired tropes of lazy welfare recipients living off the government didn’t hold up in the face of food bank and diaper bank lines that stretched for miles in middle-class neighborhoods. Fears about doing too much when the problem was so massive fell flat. Now, as the need is once again less visible, when the food bank lines are in historically excluded and marginalized communities rather than middle-class suburbs, we must not allow those racist and gendered narratives to be brought back. We must continue to demand that our government work to support all of us.
Poverty is a policy choice. It is time we choose differently. We need a lasting federal program that provides a guaranteed income for all Americans. This is the policy to get us there. And we must organize to build power and bend the political will to achieve it.
Dorian WarrenCo-Chair, Economic Security Project, and Co-President, Community Change
foreword
1
The most important objective of the United States government should be the well-being of its people. Yet, for decades our economy has trended toward growing income and wealth disparity and stagnating wages. The health and economic crisis resulting from the COVID-19 pandemic has left many more American families struggling to make ends meet, particularly in Black and Brown communities. In both its physical and economic toll, COVID-19 has vividly exposed and amplified the human costs of our deeply unequal economy.
We propose that the federal government use its most powerful fiscal tool, the U.S. tax code, to guarantee income and promote economic security for all families, especially communities of color who have been marginalized by our current economic system. A substantial overhaul and extension of the Earned Income Tax Credit (EITC), including the elimination of wage earning requirements to qualify, would serve as a vehicle to eliminate poverty, build economic equity and lift more families to the middle class. Our proposal to implement a progressive tax code to fund a guaranteed income for families who earn low incomes would essentially eliminate poverty, as designated by federal poverty-level determinations, in America.
Current tax and fiscal policies fall short of fostering economic inclusion and social equity. Instead, many features of our tax code, such as reductions in corporate tax rates and taxing personal capital gains at lower rates than wage income, privilege those with existing wealth, who are disproportionately White, rather than creating pathways of economic mobility for impoverished and lower income families. A tax code that guarantees income could reverse these regressive trends in the tax system and work to close the racial income gap.
The concept of guaranteed income itself is not new. It has a legacy in Black economic thought, civil rights, and women’s rights movements. Today, a resurgence of grassroots and collective efforts is rekindling these historic platforms around racial, gender, and economic justice. Consistent with these values, a new tax code that guarantees income could prevent generations of Americans from living in poverty or economic precarity, build economic equity for Black and Brown communities most hit by the pandemic and historically left out of shared economic gains, and lift more families into the middle class.
We present a proposal to guarantee income that reimagines the tax code to adequately address economic disparity and vulnerability, particularly along racial lines. We describe the evolution and social movements around guaranteed income, and the empirical implications of our proposal with regards to its effects on poverty, racial equity, and promoting economic well-being more broadly.
Our Guaranteed Income Proposal
Our proposal eliminates wage earning requirements and dramatically extends the negative income tax feature of the EITC to guarantee income, eliminate poverty, and lift more families to the middle class. Under these terms, a maximum refund would equal the poverty level for households earning $0, with a sliding scale from that point until phasing out at approximately the national median household income, at $50,000 or $70,000, respectively. Every individual adult is qualified to receive annual monetary support of up to $12,500, regardless of their household composition or filing status. Families with children will also receive an additional grant for every child. This program would provide a substantial level of economic support to Americans who need it most:
The program eliminates poverty: every individual is guaranteed an income above the federally-defined poverty line.
EXECUTIVE SUMMARY
2
Every individual adult is qualified to receive annual monetary support of up to $12,500, regardless of their household composition or filing status.
Every household will also receive an additional support of up to $4,500 per child.
The support would be provided in monthly installments.
A defining innovation is that the program removes the wage-earning requirement to qualify.
The proposal is designed to supplement, not replace, the existing social safety net. It would lift all households—both wage-earning and non-wage-earning—out of poverty and lift millions more to the middle class.
Projected Economic Impacts
Among the nearly 14 million U.S. households in poverty (pre-pandemic), all would be lifted above the poverty line after implementing our guaranteed income program, virtually eliminating poverty in this country.
Among the over 25 million households just above poverty (working poor), most would be elevated to above two times the poverty line.
Of the 7.3 million White households in poverty (representing approximately 8 percent of White households), the guaranteed income policy would lift each household out of poverty. Most (5.7 million, 78 percent) would be bumped up the next poverty category, between 100 and 200 percent of poverty, while the remaining 1.6 million would reach more than 200 percent of poverty (see Table 2 on page 24).
Among Black households at baseline, a far greater share are currently below the poverty line, approximately 18 percent, or 3.6 million households. Each of these households would be lifted out of poverty, with most (2.96 million) between 100 and 200 percent of poverty.
Among Latinx households, of whom approximately 17 percent are in poverty at baseline, all 2.35 million would be lifted above the poverty line, primarily by moving to the next category up.
For each racial group, virtually all households at or above 300 percent of the Federal Poverty Level (FPL) remain in their baseline category.
The median household income in 2019 was just over $59,000 and would rise by $5,700.
The Black and Latinx median household income, approximately $39,000 and $43,000, respectively, was substantially lower than the White household median of $68,000. With the implementation of our guaranteed income program, the White median household income would rise by just over $1,000, while Black and Latinx households would realize an increase of approximately $15,000 at the median. This would substantially close the racial income gap and trend the U.S. toward racial equity.
Among the more than one-quarter of single-parent households with children (3.7 million households) in 2019 who are below the poverty level, each household would be brought out of poverty. White median income for single-parent households would increase by approximately $8,000 and Black and Latinx single-parent households would each see an increase in median income of approximately $12,000.

3
The most important objective of the United States government should be the well-being of the American people. Yet growing income inequality, stagnating wages, and an unprecedented health and economic crisis has left American families struggling to make ends meet. Our nation’s safety net was inadequate to address periodic occurrences of job loss, financial strain, or any emergency that many families faced long before the pandemic. Millions of Americans were already living paycheck to paycheck without a lack of liquid resources that can be quickly converted into cash to deal with even a modest financial shock. COVID-19 has exposed long-standing racial and economic inequities that have been left unaddressed. To address widespread and structural economic despair, the federal government should use its most powerful fiscal tool, the U.S. tax code, to forge a moral and just 21st century economy rooted in our shared prosperity.
This report outlines our proposal for a substantial overhaul and extension of the negative income tax feature of the existing (EITC) to guarantee income, eliminate poverty, and lift more families to the middle class. Our revised (new) tax code would guarantee income to all families by removing the wage-earning requirement to qualify for EITC and extending the “phase out” portion far enough to support the income of many more Americans. Grounded in the values of economic inclusion, civic engagement, and social equity, this reformed tax code would be one that prevents generations of Americans from living in poverty or economic precarity. This proposed guaranteed income program delivered through the tax code surmounts the Federal Poverty Level (FPL) for all families.
Our Guaranteed Income Proposal
Our proposal eliminates wage-earning requirements and dramatically extends the negative income tax feature of the EITC to guarantee income, eliminate poverty, and lift more families to the middle class.1 Under these terms, a maximum refund would equal the poverty level for households earning $0, with a sliding scale from that point until phasing out at approximately the national median household income, at $50,000 or $70,000 depending on the household filing status and number of adults. Families with children will also receive an additional grant (refundable tax credit) for every child.
Key Programmatic and Design Features:
The program eliminates poverty: every individual is guaranteed an income above the federally-defined poverty line.
Every individual adult is qualified to receive annual monetary support of up to $12,500, regardless of their household composition or filing status.
Every household will also receive an additional support of up to $4,500 per child.
The support would be provided in monthly installments.2
introduction
1 After this report was finalized Congress enacted the American Rescue Plan Act, which provided economic support to assist families through a variety of measures, including direct cash payment and expansions to unemployment benefits, the child tax credit, and the earned income tax credit, among other provisions. The program described in this report would build upon these measures to embed a minimum level of economic support as a structural feature of the tax system.
2 Recipients will automatically receive the grant in monthly installment payments, unless they opt to receive a lump-sum grant when they file taxes. The support phases out gradually for households with an adjusted gross income above $10,000 (for single-adult households) or $15,000 (for two-adult households). The support phases out entirely for households with an adjusted gross income of $50,000 (for single-adult households) or $70,000 (for two-adult households).

4
A defining innovation is that the program removes the wage-earning requirement to qualify.
The proposal is designed to supplement, not replace, the existing social safety net. It would lift all households—both wage-earning and non-wage-earning—out of poverty and lift millions more to the middle class.

5
In one of the world’s wealthiest and most prosperous nations, poverty in the United States remains perniciously high. In 2018, more than 38 million Americans were living below the official poverty line, nearly 12 percent of the population (U.S. Census Bureau, 2019). Of that number, approximately 15.7 million were White (poverty rate of 8.5 percent), 8.9 million were Black (20.8 percent), 10.5 million were Latinx (17.6 percent), and 2 million were Asian (10 percent). The poverty rate for children under age 18 was 16.2 percent, representing nearly 12 million children in poverty (U.S. Census Bureau, 2018).
A guaranteed income program that raises incomes above the poverty line and lifts more families into the middle class is critical because the economic despair also extends well beyond the 38 million Americans living below the official poverty line. The FPL does not capture the millions of individuals with low incomes who are living slightly above the official poverty line but still face hardship and are a job loss, illness, or emergency away from falling into poverty. For example, the Supplemental Poverty Measure (SPM) takes into account other differences to measure costs of living, such as after-tax income and out-of-pocket expenses like childcare and medical costs. With those other factors taken into account, the rate of those in poverty rises to 13.1 percent, or 42.8 million people (U.S. Census Bureau, 2019).
Even these numbers do not account for the full picture. A 2018 study by the Institute for Policy Studies and the Poor People’s Campaign provides a more holistic view of low-wealth individuals and the despair of poverty in this country (Institute for Policy Studies, 2018). The study measured the number of people living at up to twice the SPM and found that around 140 million Americans were poor or low income (Institute for Policy Studies, 2018). Of that number, 24 million are Black, 38 million are Latinx, 8 million are Asian, 2 million Indigenous, and 66 million are White (U.S. Census Bureau, 2019). This level of inequality is a policy choice that we have the resources and tools to alleviate.
Over 50 years ago, President Lyndon B. Johnson declared a “war on poverty” to address the devastating effects of poverty and the impact on those in poverty. At that time, there were nearly 35 million Americans living in poverty (Institute for Policy Studies, 2018). But over the years, we have seen policy turn away from a war on poverty and from anti-poverty programs. Our policy priorities instead emphasize deregulation and place the market at the forefront of the solution of our problems and minimize the role that government can play with regards to social welfare. Much of this approach is racialized – the system is fueled by narratives of who deserves economic disadvantages and who does not (Hamilton, 2019).
Those living in poverty are often characterized as “undeserving” of government support (Hamilton, 2019). These narratives suggest that government interventions will only incentivize unproductive behavior (Hamilton, 2019). So instead of using the government to support social welfare, the government is used to punish bad behavior and those in poverty. Joe Soss, Richard Fording, and Sanford Schram’s (2011) aptly titled book, Disciplining the Poor, introduced the terms neoliberal paternalism and poverty governance, which describe the public ethos to managing the seemingly bad behavior and work ethic of the poor, and, further how this frame is highly racialized with caricatures of Black and Brown people as the undeserving face of poverty.
Rather than investing in poverty alleviation, we have witnessed devastating cuts to our social safety net over the years. Even today, in the midst of a pandemic, there are those that call for cuts to critical programs like food assistance, Temporary Assistance for Needy Families (TANF), Medicaid, and other programs that are vital for the economic security of American families.
Economic vulnerability
6
Punitive welfare reform design and cuts to anti-poverty programs have resulted in the decline of government programs that provide benefits to people without any earnings, which has led to those falling further into deep or extreme poverty (Rice, 2002). This change has also meant that the system has shifted toward a primarily work-based social safety net. A large amount of the assistance of our social insurance programs goes toward the working poor. Low wages also mean that having a job in of itself is not always enough to keep one out of poverty. Further, burdensome regulations and requirements of social welfare programs act as barriers to access and support for families.
We know that anti-poverty programs can work, but we need to expand them, not make cuts. In fact, the EITC is one of the government’s largest anti-poverty programs and benefits nearly 26 million households each year. In 2018, the EITC lifted nearly 5.6 million people out of poverty (CBPP, 2019). Combined with the Child Tax Credit, the EITC lifts millions more families with children out of poverty. But far too many families are still left behind, especially those without income. The Tax Policy Center estimates that 16.8 million adults and children were in households that receive less than the full EITC because their earnings are too low to qualify for the maximum credit (TPC, 2019).
With millions unemployed, this moment has highlighted the shortcomings of a safety net that is primarily dependent on wage earning. A guaranteed income program would be at the foundation of a larger social safety net and would complement other social welfare programs in order to lift millions more into the middle class.
Systemic racism, disinvestment, and structural barriers that exploit and extract from communities—rather than individual failures or personal deficits—compound and perpetuate poverty. We envision a society that promotes economic rights and where all people have agency, dignity, and security in their lives. This vision requires investing in people and communities.
This widespread vulnerability exists in a context of a concentration of wealth where the top 0.1 percent of U.S. households own as much of the nation’s wealth as the bottom 90 percent, and the bottom half of all households own only 1 percent of our nation’s wealth (Saez & Zucman, 2014). Fiscal policy needs to counterbalance this wildly uneven distribution of economic insecurity, and tax reform with a guaranteed income offers some redress to this imbalance. The racial dimension of economic insecurity is perhaps best illustrated by the dramatic racial wealth gap which exceeds $150,000 – the typical Black family has a mere 10 cents for every dollar held by the typical White family. It is noteworthy that this disparity is an unjust inheritance that began with chattel slavery, when Black people were quite literally capital assets for a White landowning plantation class, and it is not the product of differences in education, financial literacy, or any race-based behaviors or attitudes (Hamilton, 2019).3
Even when accounting for positive factors impacting upward mobility, such as increased educational attainment, Black and Latinx families still possess less wealth than White families. These wealth disparities leave Black and Latinx households even more vulnerable to economic shocks. Twenty-three percent of Black college-educated households and 20 percent of Latinx college-educated households would not be able to afford their bills after an unexpected $400 emergency expense. These levels increase to 59 percent and 51 percent, respectively, for non-college educated Black and Latinx households (Federal Reserve Board, 2020; Solomon & Hamilton, 2020).
Since the onset of the coronavirus pandemic, economic conditions have worsened dramatically. In March 2020, the month COVID-19 was declared a national emergency, nearly one-fifth of adults experienced either a job loss or a reduction in working hours (Federal Reserve Board, 2020). Individuals who earn low incomes reported
3 Today, the typical White family has 10 times the wealth of the typical Black family and seven times the wealth of the typical Latinx family (Solomon & Hamilton, 2020).

7
even higher rates of income reduction, with nearly 40 percent of people with a household income below $40,000 reporting a job loss in March (Federal Reserve Board, 2020). As of the October 2020 employment report, the unemployment rate stood at nearly 7 percent – a level that is much higher than the pre-pandemic rate of 3.7 percent in January 2020 (Bureau of Labor Statistics, 2020). Just as Black and Latinx communities are disproportionately suffering from the health impacts of the pandemic, they are also hit hardest when it comes to economic devastation. The national unemployment rate for Black adults is 10.8 percent, 8.8 percent for Latinx adults, and 7.6 percent for Asian adults, compared to 6 percent for White adults (Bureau of Labor Statistics, 2020).
In order to stem the economic calamity of the pandemic, Congress passed the Coronavirus Aid, Relief, and Economic Security (CARES) Act in March 2020, a $2.2. trillion economic emergency stimulus package which included a one-time guaranteed income payment of $1,200 to most adults (U.S. Department of Treasury, 2020). The CARES Act also temporarily expanded unemployment benefits to include gig workers, who, with the fissuring of work, have become an increasing portion of our workforce; along with a $600 universal increase for recipients of unemployment compensation. These key provisions, even despite their shortcomings, illustrate our government’s potential to address poverty rates and growing economic insecurity.
As Congress deliberates future interventions of COVID-19 relief, we should be wary of policies aiming to return to pre-COVID-19 rates of poverty and economic insecurity. Millions of Americans were struggling well before the pandemic hit. Instead, we should recognize the government’s capabilities of rapidly responding to and protecting against economic hardships with guaranteed income supports and carry this understanding with us far after the threat of COVID-19 ends.
Essential Workers
Black and Latinx workers account for a disproportionate share of the essential workers. An examination of six essential sectors of the economy show that Black workers make up roughly one in six of all frontline-industry workers, despite representing nearly 12 percent of the entire workforce (Gould & Wilson, 2020, citing Rho, Brown, & Fremstad). The essential workforce comprises many frontline positions that provide fewer stable sources of income due to reliance on tips and in-person duties such as retail, grocery, service, and home health jobs. Despite the added risk of exposure to the COVID-19 virus, many of these jobs also have lower wages and less access to quality benefits (Rho, Brown, & Fremstad, 2020; Hamilton et. al., 2021.
These economic vulnerabilities iteratively relate with credit and banking access. Individuals that are unemployed and earn lower wages are substantially less likely to have access to prime credit. Likewise, loss of income and lack of financial wealth increases the vulnerability to high-cost, exploitive and predatory credit products (Baradaran, 2014; Wolff, 2015). These
debt traps end up absorbing higher and higher shares of income toward debt financing at higher interest rates for borrowers who are in the lowest income categories. A tax code that progressively guarantees incomes would implicitly counter these debt traps, and instead promote a fairer economy that supports upward mobility.
Using the tax code to guarantee income and lift families toward the middle class would help redress an economy that concentrates Black and Latinx individuals in lower income brackets. Even at similar incomes to White families, however, Black and Latinx families are more likely to report an adverse credit outcome (Federal Reserve Board, 2020). In many instances, Black and Latinx families reported denial of credit applications at higher rates to White counterparts in lower income brackets (Federal Reserve Board, 2020). As a result of this inequitable denial of prime credit, these families are therefore more likely to be forced into unfavorable or even predatory terms to make ends meet.

8
“Banking For All”
In March 2020, Senator Sherrod Brown (D-OH) introduced the “Banking for All Act,” which would allow Americans to set up a free bank account, called a “Fed Account.” These accounts, which would be managed by the Federal Reserve, would be readily available for individuals to use to receive money, make payments, and withdraw cash (Banking for All Act, 2020). The Fed Accounts would have no account fees or minimum balance requirements, which are often barriers that keep many Americans with low income from using traditional banking.
Fed Accounts would be accessible at U.S. post offices throughout the country. Since many post offices exist in areas not currently served by banks, postal banking would help reach more individuals and communities who do not have access to a nearby bank (Baradaran, 2017). In 2017, more than 8 million U.S. households were unbanked (FDIC, 2017). An additional 24 million
U.S. households were underbanked in 2017, meaning those households use financial services outside the banking system, such as check cashing or payday loans, despite having a checking or savings account (FDIC, 2017). Black and Latinx individuals make up a disproportionate share of the unbanked and underbanked. To illustrate, while only 3 percent of White adults did not have a bank account in 2019, this number was much higher for Black (14 percent) and Latinx (10 percent) adults (Federal Reserve Board, 2020). Postal banking would put a floor on financial product availability and support the millions of unbanked and underbanked individuals who financially have to rely on predatory check cashing institutions and payday lenders (Hamilton, 2017). Account holders would be able to more regularly access money and obtain financial services like automatic bill pay and mobile banking, all at their local post offices.

9
unequal effects of current tax and fiscal policiesCurrent tax and fiscal policies fall far short of fostering economic inclusion, social equity, and civic engagement to all households. To the contrary, many of the most important structural features of our tax code privilege those with existing wealth, instead of creating new pathways for wealth-building opportunities for lower- and middle-income families.
Decline of Progressive Taxation
Under a progressive tax system, taxpayers with greater ability to pay contribute proportionally more of their income. In recent decades, however, federal taxes have become less progressive. Many important structural features of the current tax system now disproportionately benefit the wealthiest taxpayers. For example, rules such as capital income preference, which taxes certain forms of investment income at lower rates than labor income; and the realization rule, which allows investors to defer taxes until they sell their investments, deliver large tax benefits and avoidance opportunities to the highest earners (Glogower, 2016; Marr et al., 2019). Researchers at the Tax Policy Center estimate that the top 1 percent of earners alone capture more than 60 percent of the benefit from the lower rate at which capital income is taxed (Berger & Toder, 2019).
In prior periods of tax reform, the wealthy benefited from large tax cuts under the administrations of Presidents Ronald Reagan and George W. Bush. Recent tax changes have piled new tax benefits on the wealthy, and further undermined the progressivity of the tax system. The 2017 tax legislation (often referred to as the Trump Tax Plan) cut the tax rates on corporations and high-income taxpayers, doubled the estate tax exemption amount, introduced a new deduction for income earned through “pass-through businesses,” and opened up new tax planning opportunities for sophisticated taxpayers (Gamage & Kamin, 2019). The Tax Policy Center estimated at the time that taxpayers in the bottom income quintile would receive an average tax cut of $60 (0.4 percent of their after-tax income) from the changes in the 2017 legislation, while the top 1 percent of earners would receive an average tax cut of $51,000 (3.4 percent of their after-tax income) (Tax Policy Center Staff, 2017).
Even recent tax reforms designed to provide economic relief from the coronavirus and economic shutdowns delivered the greatest benefits to the wealthiest taxpayers. The CARES Act included windfall provisions for big businesses—in the form of loss and interest expense deductions—that have been described as “shoveling money to rich people.” (Drucker, 2020; Wallace, 2020).
These changes have accelerated the decline of the progressive tax system. Economists Emmanuel Saez and Gabriel Zucman find that the cumulative decline in the three critical elements of the progressive tax system—the individual income tax, the corporate tax, and the estate tax—have brought the overall tax system closer to a “flat tax” where taxpayers with lower income now pay tax at comparable rates to the highest income taxpayers (Saez & Zucman, 2019a; Saez & Zucman, 2019b).4 Further, progressive aspects of the federal tax code are often offset by regressive state and local taxes (Huang & Taylor, 2019). These regressive rules, including flat consumption taxes from which individuals and families with lower incomes pay a larger share of their income, further compound racial disparities in after-tax income and wealth.
4 For other analysis finding that the tax system is still progressive based on other measures of progressivity, see Gale (2019). Under all conventional estimates, however, the progressivity of the overall tax system has significantly declined in recent decades.

10
Racial and Gender Effects
The federal tax code is ostensibly race neutral and determines tax liabilities based on factors such as total income, sources of income, and savings (Huang & Taylor, 2019). At the same time, structural and outright bias affects many race-neutral areas of law, including tax law (Kendi, 2019).
To be sure, some federal tax provisions, such as the EITC and the Child Tax Credit (CTC), do reduce some racial disparities by raising the after-tax incomes of families employed in low-paying jobs (Huang and Taylor, 2019). Many other critical features of the tax system, however, disproportionately benefit White Americans. For example, White households not only earn higher incomes than Black and Latinx households, but a greater amount of their wealth is generated from non-labor assets, such as mutual funds and stocks, that are treated favorably in the tax code in the form of lower tax rates (Hamilton et al., 2020). Each year, the federal government spends over $630 billion on asset-building tax programs like savings, retirement accounts, and homeownership – support that helps build wealth for largely wealthy and disproportionately White households (Nieves et al., 2020).
Although there are no regular official estimates of the current code’s impacts by race (Huang & Taylor, 2019; Bearer-Friend, 2019), racial disparities are often perpetuated through the administration of the tax code. For instance, there are racially disparate likelihoods of audit and enforcement decisions, private debt collection, and access to filing assistance (Huang & Taylor, 2019). These realities mean that our tax policies have dramatically different effects for households based on race.
The Trump administration tax cuts, which passed Congress without a single vote from the Democratic Party, is a partisan game-changer that will accelerate inequality and racial economic disparities in, according to Hamilton and Linden (2018), at least four ways. First, the benefits accrue disproportionately to households with high incomes, who are overwhelmingly White and underwhelmingly Black. And this regressive skew gets worse over time. The Tax Policy Center estimates that by 2027, fully 83 percent of the tax cuts will flow to the top 1 percent, while the bottom 60 percent of earners will, on average, actually experience tax increases compared to before the law was passed (Tax Policy Center Staff, 2017).
Second, the tax cuts privilege existing wealth holders, rather than providing avenues to create new wealth, and Black, Indigenous, and Latinx households have far lower levels of wealth from which to benefit. For example, a centerpiece of the law is its large reductions in corporate tax rates down from 35 percent to 21 percent. Corporations are already using these windfall tax savings to repurchase shares of their own stock. This $1.3 trillion windfall over the next decade will largely benefit existing shareholders who are overwhelmingly White. The top 20 percent of Americans own 92 percent of all shareholder wealth; a group that is not very inclusive of Black, Indigenous, and Latinx communities.
Third, by limiting the state and local tax (SALT) deduction, the law may incentivize some states and localities to rely more heavily on fees and fines as sources of revenue, which, because of their economic and political vulnerability, would be likely to disproportionately fall upon Black people and Black communities, which in turn will increase their debt and strip their wealth. Not only are fees and fines more regressive sources of income, but they also extend the reach of a broken criminal justice system that causes enormous economic and civic damage within Black and Latinx communities. When confronted with an expensive legal system, Black, Indigenous, and Latinx people have far less income or wealth necessary to face legal challenges.
Finally, the enormous revenue loss, to the tune of nearly $2 trillion over the decade, coupled with the limitation on the state and local tax deduction, will undermine the public sector, which will impose additional burdens on Black

11
and Latinx workers and communities. The sad irony of this costly tax cut in a political context that overemphasizes “austerity” is its accelerated impact on the demise of an already underfunded public sector that provides vital services and employment, which has disproportionately hurt Black and Latinx communities.
Impacts of Homeownership, Household Structure, and Filing Status
For over 60 years, the tax code has provided benefits to support homeownership through the mortgage interest deduction (MID). However, because families with lower incomes are less likely to own a home, or to use an itemized deduction, the ability to claim the MID has historically been restricted to tax filers with higher incomes – stratifying the benefit along racial and gender lines. (Brown, 2018; Tax Alliance for Economic Mobility, 2019; Kleinman et al., 2019).
The tax code also interacts with the historic racial discrimination and segregation in the housing market, including the legacy of redlining and neighborhood disinvestment. The majority of Black Americans live in heterogeneous or predominantly Black neighborhoods, which, due to the aforementioned discriminatory housing policies, have lower home values compared to White-majority neighborhoods (Brown, 2018). The asymmetry, referred to as the “appreciation gap,” illustrates how White families are more likely to generate untaxed income from the sale of their home compared to Black families (Brown, 2018). On the other hand, homeowners who
sell their homes at a loss receive no comparable benefit of a deduction against their taxable income, which disproportionately impacts Black homeowners who are more likely to experience this reduction in property values (Brown, 2018).
Our joint tax filing system splits income between two spouses, which enhances benefits for married couples with a primary or sole earner compared to other household structures (Kleinman et al., 2019). The joint filing option partially reflects an outdated and stereotyped family model of a male breadwinner and stay-at-home mother – a family structure that fails to represent the realities of many families. Considering the interrelated roles of race and gender on household income, one study found that married Black households with two incomes are more likely to have similar earnings between spouses compared to White families (Brown, 1997). This racial difference in pay parity widens inequities, since married couples who earn roughly equal amounts are less likely to benefit from the joint filing status (Brown, 1997; U.S. Department of the Treasury, 2015).

12
guaranteed income and justice movements: a people’s history of guaranteed incomeOur proposed guaranteed income program is a timely intervention and can redress contemporary issues of widespread economic vulnerability and inequality that have only been exacerbated by the coronavirus pandemic. However, the concept of guaranteed income itself is not new. It has a legacy rooted in prior movements for economic justice, including in Black economic thought and in the civil rights and women’s rights movements.
Dr. King and the Poor People’s Campaign
Rev. Dr. Martin Luther King, Jr. played a key role in advancing economic policy reform – a piece of his legacy that is sometimes overlooked. In his final book, Where Do We Go From Here: Chaos or Community?, Dr. King wrote about the need for a complete abolition of poverty (King, 1967). Dr. King believed that there was simply no justification for widespread poverty in the wealthiest nation on earth. He criticized the government for its modest response to address the issue of poverty as “piecemeal” (King, 1967).
Dr. King’s advocacy efforts on eradicating poverty culminated in organizing the Poor People’s Campaign (PPC) (Weissman, 2013). Dr. King and the PPC believed that all individuals deserved a living wage tied to the median of society—instead of tied to the floor of the lowest income levels—as a fundamental human right. The campaign sought to make the needs of America’s poor visible to political leaders and focused on organizing a national march on Washington, DC to push Congress toward passing an “Economic Bill of Rights” with five tenets ensuring the right to:
A meaningful job at a living wage
A secure and adequate income for all
Access to land
Access to capital
Play a truly significant role in our government
Dr. King and the PPC envisioned a program of publicly provided economic rights, including the right to guaranteed income. A guaranteed income would directly root out poverty, whereas prior government interventions to address poverty were too indirect and insubstantial to alleviate widespread economic insecurity (Weissman, 2013).
“I am now convinced that the simplest approach will prove to be the most effective – the solution to poverty is to abolish it directly by a now widely discussed measure: the guaranteed income.”
—Rev. Dr. Martin Luther King, Jr.

13
The Black Panther Party’s Ten-Point Platform
In addition to the segments of the civil rights movement known for their pacifist approaches to achieve racial justice, entities known more for militant approaches to combat racial oppression—such as armed self-defense to combat police brutality—also advocated for guaranteed income. The Black Panther Party worked directly to eradicate poverty in Black communities through various social programs such as the opening of healthcare clinics and serving free breakfast to students (Zewde, 2020). Also, the Black Panthers advanced the values of economic liberation through their Ten-Point Program (Newton & Seale, 1966). The Ten-Point Program encompassed a wide range of demands to secure the liberation of Black people. The right to guaranteed employment or income was adopted as the second point of the platform. This call for the federal provision of guaranteed income was grounded in the acknowledgment that unchecked capitalism and political power are fueled by policies that exploit Black and Brown communities by design—a principle that has seen a recent resurgence into mainstream progressive thought, as described below in the discussion of contemporary movements (Zewde, 2020).
Women’s Rights Movements
The women’s rights movements have also played a substantial role in the fight for guaranteed income. Their advocacy was intended to provide economic redress to a history of sexist policies and, more broadly, structures of patriarchy which have produced gender inequalities, particularly in labor markets and asset accumulation. On average, women own only 32 cents on the dollar compared with men (Reich & McCulloch, 2017). These gender inequities result in part from a history of social economic policies which have been built upon an outdated model of a sole, male breadwinner as well as social patterns and historical patterns of gendered bias toward male ownership and inheritance receipt.
Even federal policies which sought to advance economic well-being, such as the New Deal and GI Bill, for example, often excluded women, who were not able to access these benefits due to homeownership requirements. Single women and Black and Latinx individuals, in particular, were denied the opportunity to own property and secure loans and were restricted in their ability to earn advanced degrees while male—and particularly White male—homeowners were able to benefit from these provisions (Kijakazi & McCulloch, 2018; National Women’s Law Center, 2019). Additionally, certain types of labor, such as agricultural work and household care, which have disproportionately been performed by Black and Latinx women, have also been excluded by these and other federal economic support programs (Hamilton & Strickland, 2020; Katznelson, 2014).
The National Welfare Rights Organization (NWRO) worked to advance racial, gender, and economic justice between 1966 and 1975 and was a prominent leader in advocating for a guaranteed standard of living as a human right (Bhattacharya, 2019). The NWRO was led primarily by Black mothers who combatted racist narratives and gendered stereotypes that impacted government interventions with regards to financial security for women and families. For example, a 1972 article by Johnnie Tillmon, the first chair of the NWRO and a working mother, challenged these narratives and spoke about the economic dilemmas imposed upon women as heads of households: to work tireless hours beneath a living wage, be dependent on a spouse or partner, or endure racist stereotypes as a welfare recipient (Tillmon, 1972). Of course, these categories were (and are) not mutually exclusive, and families had to grapple with simultaneous trade-offs while none of these “options” afforded them a viable ladder out of poverty.
14
Contemporary Movements
Today, a resurgence of grassroots and collective efforts is rekindling these historic platforms around racial justice, with calls for an equitable economy grounded in human rights and dignity for all. A contemporary version of the Poor People’s Campaign is following Dr. King’s legacy, 50 years later.5 Led by Rev. Dr. William Barber II and Rev. Dr. Liz Theoharis, a guaranteed annual income is one of the many demands offered to heal our economic system and address poverty and inequality. As described by Rev. Dr. Barber, the movement is grounded in the notion that an economic justice frame is necessary to produce a “moral economy”: an economy that works so that everyone has access to the goods and services that are necessary to live a life of dignity (Hamilton, 2020).
In 2016, the Movement for Black Lives revived the second tenet of the Black Panthers Ten-Point platform as a demand for “guaranteed minimum livable income for all Black people, with clearly articulated corporate regulations” (The Undercommons, 2017). The Movement for Black Lives is a coalition of Black-led organizations and hundreds of allied organizations building Black power and collective liberation (Movement for Black Lives, 2020). Ahead of the 2020 election, they called for a guaranteed income as part of a larger visionary policy agenda for economic and racial justice. The Movement for Black Lives has also called for a progressive restructuring of local, state, and federal tax codes to eradicate racial disparities by sustainably redistributing wealth (Movement for Black Lives, 2020). Specifically, they have proposed raising marginal tax rates for high earners, removing income caps on payroll taxes that fund unemployment insurance and social security, raising corporate income taxes (particularly on large corporations), and ending tax deferrals for foreign income of multinational corporations. (Movement for Black Lives, 2020).
The Black Futures Lab also recently listed “making taxes fair and invest[ing] in economic mobility” as a focal point of economic priorities within their 2020 Black Agenda (Black to the Future Action Fund, 2020). The Black Agenda also proposed an expansion to the EITC to support workers with low wages and help “offset payroll and income taxes for low- and moderate-income workers” (Black to the Future Action Fund, 2020).
5 See Poor People’s Campaign, https://www.poorpeoplescampaign.org/

15
economic support programs and proposalsOur guaranteed income proposal builds off of these efforts and is situated within a larger framework of economic support programs. We can look to the history of these programs to better understand the design considerations behind current-day proposals.
Guaranteed Income
Thomas Paine, in his 1797 pamphlet, Agrarian Justice, advocated for a guaranteed economic support program, through a universal grant to each adult when they turned 21 funded by a tax on land inheritances. In addition, the program would provide annual income supports to adults over the age of 50; in many ways analogous to social security. Paine justified these payments as an economic right, rather than as a means of providing charity or increasing welfare (Paine, 1797; Glogower & Wallace, 2018; Hamilton et. al., 2020).
In a similar vein, in the 1990s, Professors Bruce Ackerman and Anne Alstott proposed a “stakeholder grant” of $80,000 to each citizen reaching 21 years of age (Ackerman & Alstott, 1999). This one-time transfer would not depend on the beneficiaries’ earnings. The estimated $255 billion cost per year (in 1990s dollars) would be funded by a two percent wealth tax. Ackerman and Alstott similarly justified this transfer as a way to ensure equality of economic opportunity and civic participation, rather than simply as a measure to alleviate poverty (Glogower & Wallace, 2018).
Another iteration of the concept of a stakeholder society and Thomas Paine’s conception of a birthright that seeds resources toward economic security is baby bonds, or more accurately baby trusts (Hamilton, 2018; Hamilton et. al., 2020). This iteration, conceived by a coauthor of this study, Darrick Hamilton, is keenly targeted at addressing wealth inequality, as such, the one-time payment when the child reaches adulthood would be restricted in use toward some asset-enhancing activity, such as a down payment on a home, finance to start a business, finance for higher education, or rollover toward retirement savings. Another distinction in this iteration for these universal federally managed accounts, is that the accounts would be progressively endowed based on the child recipient’s family financial position. The projected costs of baby bonds range from $60 to $100 billion per year; and a coauthor of this paper, Naomi Zewde, estimates that had a baby bonds been put in place during the mid-1990s (benefiting 18 to 25-year-olds today) – the wealth gap between White and Black households would have closed by a factor of over 11, from 15.9x to 1.4x (Zewde, 2019; Hamilton et. al., 2020).
In recent years, several cities across the nation have also proposed and implemented guaranteed income pilot models, recognizing income and wealth inequality as an economic rights issue (Economic Security Project, 2020). In Stockton, California, Mayor Michael Tubbs and the Economic Security Project joined together to launch the Stockton Economic Empowerment Demonstration (SEED), the nation’s first mayor-led guaranteed income demonstration (Stockton Demonstration, 2019). Since February 2019, SEED has been giving 125 Stockton residents an unconditional, guaranteed income of $500 per month (Stockton Demonstration, 2019). SEED’s pilot program recently ended on schedule, and early results show that the program is working as promised. It has provided critical resources and a constant stream of income for people to cover basic needs. Building upon the success of SEED, mayors from all across America have come together to launch “Mayors for a Guaranteed Income,” a network of advocates seeking to pilot similar programs and calling for guaranteed income at the local, state, and federal level (Mayors for a Guaranteed Income, 2020).6

16
Universal Basic Income (UBI)
Professors Miranda Perry Fleischer and Daniel Hemel recently proposed a universal basic cash transfer of $6,000 per person each year for all citizens and legal residents, including children (Fleischer & Hemel, 2019). They estimate that the total cost of this program would be approximately $1.878 trillion per year, which could be funded through a combination of reductions to other transfer programs and tax increases.
In the 2020 Democratic presidential primary, then-candidate Andrew Yang proposed a larger basic income transfer program. The support for UBI spans the political spectrum from Andy Stern, former president of Service Employees International Union (SEIU) on the left, who has expressed concern around a job crisis stemming from “accelerated technology” to American Enterprise Institute’s (AEI) Charles Murray on the right, who advocates for UBI to replace what he calls the “entire bureaucratic apparatus of government social workers” (our emphasis added).
Yang’s “Freedom Dividend” would provide $12,000 per year to every adult citizen. (Yang 2020, 2020). This program would cost an estimated $2.8 trillion per year (Pomerleau, 2019). Yang suggested that the Freedom Dividend could be funded through a combination of spending cuts, tax increases, and new taxes (a flat consumption tax on what would be deemed luxury consumable goods), and expected economic growth from the program, which could in turn generate additional tax revenue. The Yang proposal imposed a choice for taxpayers between receiving the basic income or certain other existing social support benefits.
In addition to requiring reductions to other safety net programs, this form of a UBI program presents additional possible concerns. Offering everyone in the economy the exact same amount dilutes the purchasing power of those at the low end of the income distribution (as compared to a more targeted program), and, it may enhance wealth disparity given that consumers with higher incomes would better be able to save or invest their additional disposable incomes, while consumers with lower incomes are more likely to consume the additional disposable income. This issue could potentially be mitigated if the grant were financed through a substantial increase in progressive federal income taxes disproportionately borne by taxpayers with higher incomes.
Negative Income Tax
A negative income tax (NIT) typically provides a transfer amount ensuring a basic level of economic support through the tax system, which phases out for beneficiaries with higher earnings. The phase-out results in an implicit tax on income earned in the phase-out range, which can also be understood as a partial funding source for the transfer. NIT proposals all share this basic feature, but vary in their level of support, method of implementation, phase-out schedule, and interaction with other transfer programs.
Policymakers and scholars from varied ideological perspectives have advocated for negative income tax proposals and related reforms. In the early 1960s, Nobel laureate neoclassical economist Milton Friedman proposed a negative income tax with a similarly small transfer amount designed to alleviate extreme poverty, through a $600 deduction level which phased out at a 50 percent rate for each dollar of income earned by the beneficiary,
6 Recently, more than 150 economists signed onto a joint letter from the Economic Security Project and The Justice Collaborative calling on Congress to provide “regular, lasting direct stimulus payments” to American families (Economic Security Project, 2020). These cash payments would be automatically triggered when certain economic indicators are met, which would provide for quick and immediate support for families in need without having to wait for Congress to pass another piece of legislation.

17
for a maximum subsidy for an individual of $300, which certainly would not be sufficient to cover subsistence (Friedman, 1962). Friedman generally opposed a broad social safety net and envisioned this system as an “efficient means” of offering minimal redistribution through cash support, which would be bundled with eliminating other in-kind government transfers and programs (Glogower & Wallace, 2018).
In 1969, President Nixon introduced his “Family Assistance Plan” soon after taking office, which was influenced in part by Friedman’s proposal. This program would have provided a “low income allowance” roughly based on the poverty levels for different households, which would phase out gradually at a rate of 50 percent for beneficiaries with income above the poverty level (Moynihan, 1973).
President Nixon’s program would have provided a benefit of $500 per year for each of the first two family members, and $300 for each additional member, for a maximum benefit of $1,600 for a family of four. This amount was equal to approximately 43 percent of the federal poverty threshold at the time (SSA, 2019) and would be equivalent to an inflation-adjusted transfer of approximately $11,000 today. The House of Representatives passed a modified version of the bill in 1970, but the plan failed to pass in the Senate (The Family Assistance Plan, 1972).
In the 1960s, futurist Robert Theobald also proposed a universal cash transfer program which similarly phased out with a taxpayer’s earnings (Theobald, 1963; Theobald, 1967). Theobald proposed a “Basic Economic Security” program providing a maximum subsidy of $3,200 for a family of four (approximately equal to the FPL at the time), which phased out at a rapid rate of 90 percent of beneficiaries’ earned income. Theobald’s ideological motivations for his proposal differed from Friedman’s. Theobald justified his transfer program as a necessary measure to preserve human freedom and dignity in the face of economic changes and insecurity. Echoing Paine, Theobald also understood economic security as a fundamental right (Glogower & Wallace, 2018).
More recently, Representative Rashida Tlaib (D-MI) proposed a comparable variant of a negative income tax program, designed to provide a limited transfer to low-income beneficiaries, which similarly phases out with the beneficiaries’ income. Tlaib’s proposed “BOOST Act” would provide a maximum grant of up to $3,000 for individuals and $6,000 for families, payable monthly and structured as a refundable credit which phases out with the beneficiary’s income. The transfer would phase out entirely for single filers earning $50,000 and families earning $100,000 (BOOST Act, 2019). Filers with no income are also eligible for the credit. Analysts estimate that the BOOST Act could cost approximately $380 billion per year (ITEP, 2019).
Earned Income Tax Credit
Nixon’s Family Assistance Plan eventually evolved into the EITC. The EITC is a refundable tax credit designed to supplement the earnings of workers with lower incomes, excluding non-wage earners. The amount of the credit varies with the recipient’s filing status, income level, and number of dependent children. For 2020, a family with three or more children can receive a maximum EITC credit of $6,660.
The EITC phases in at the lowest income levels. A taxpayer with no earned income will not receive any benefit, and the amount of the credit will increase with the taxpayer’s income within the phase-in range. The EITC also phases out at higher income levels. Both the phase-in and phase-out ranges depend upon the taxpayer’s filing status and number of dependent children. For example, in 2020, the credit phases out entirely for a family with more than two children and income of $56,844, or for a head of household with more than two children and income of $50,594. The Joint Committee on Taxation estimates that (on a static basis) the EITC cost approximately $70 billion in 2019 (JCT, 2019).

18
The EITC only benefits wage earners and provides only a limited degree of economic support to taxpayers with lower income, with a design intended to incentivize participation in the workforce by beneficiaries with low incomes (CBPP, 2019; Eissa & Liebman, 1996). Eissa and Hoynes (2006) find that the EITC does not significantly reduce the hours worked by earners within the phase-out range, notwithstanding the higher implicit tax rates on this income resulting from the phase-out.
The EITC provides a larger benefit to families with dependent children, and for this reason has a significant impact in lifting families with children out of poverty (CBPP, 2019). The larger benefit for workers with dependent children also enables these recipients to participate in the workforce by defraying additional costs such as childcare (Eissa & Hoynes, 2006). Finally, studies have found that the EITC has helped to advance racial equity, by benefiting economically disadvantaged groups, as compared to a baseline of the current tax system absent the EITC (CBPP, 2019; Huang & Taylor, 2019).
Despite these advantages, the EITC does not operate as a comprehensive economic support program. Individuals with no children receive a much smaller credit. For 2020, a taxpayer with no qualifying children receives a maximum credit of only $538. Individuals who do not (and possibly cannot) earn wages do not receive any benefit, and earners with very low incomes within the phase-in range receive a reduced benefit. Finally, even the maximum allowable benefit under the EITC may be sufficient to lift wage earning families out of extreme poverty but does not provide economic support above this minimal level.
Proposed Reforms to the EITC
In recent years, scholars and policymakers have proposed reforms that build upon the basic structure of the EITC, to increase both the amount of the transfer and its availability to a broader range of beneficiaries. In 2018, then-Senator Kamala Harris proposed the LIFT the Middle Class Act, which would provide refundable tax credit of up to $6,000 for married couples and $3,000 for single filers (Harris, 2018).
This proposal would loosen but not eliminate the EITC’s wage earning requirement. Recipients would still need to earn a minimum threshold of income in order to receive the maximum benefit, although the amount of income necessary to maximize the benefit would be significantly lower than under the current EITC. Under the LIFT Act proposal, an individual filer would be required to earn $3,000 to receive the maximum benefit, while joint filers would be required
to earn $6,000. The benefit would phase out at income levels of $30,000 to $100,000, depending on the household size and filing status. The Tax Policy Center estimated that the LIFT Act would cost roughly $300 billion per year (TPC, 2019).
Reforms to the EITC would be welcomed as millions of Americans are still living in poverty today. But only expanding the EITC without affording people other economic and social protections is not enough. Even if expanding the EITC lifts people out of poverty, for many households, such a model alone would barely push them above the poverty line. Our goal should be the well-being and security of all Americans, not to simply get Americans to a threshold amount above poverty. Whereas EITC benefits are limited to wage earning Americans, our guaranteed income program would apply to non-wage earning and wage earning individuals alike.

19
Our guaranteed income program dramatically expands the structure of the EITC to guarantee income, eliminate poverty, and lift more families into the middle class. Under these terms, a maximum refund lifts a household earning $0 up to the level of the poverty line, with a gradual phase-down beginning for households with income above $10,000 or $15,000 (for single-adult households and two-adult households, respectively), until phasing out at approximately the national median household income, at $50,000 or $70,000, respectively. Every individual adult is qualified to receive annual monetary support of up to $12,500, regardless of their household composition or filing status. Families with children will also receive an additional grant for every child.
This program would provide a substantial level of economic support to Americans who need it most:
The program eliminates poverty: every individual is guaranteed an income above the federally-defined poverty line.
Every household will also receive an additional support of up to $4,500 per child.
The support would be provided in monthly installments unless the taxpayer opts for a lump sum grant when they file taxes for the year.
The program does not require individuals to earn income in order to qualify.
The support phases out entirely for households with an adjusted gross income of $50,000 (for single- adult households) or $70,000 (for two-adult households). This structure would benefit both wage-earning and non-wage-earning households living in poverty and lift more families to the middle class.
Designed to supplement, not replace, the existing social safety net.
We estimate that the total cost of our program would be approximately $876 billion per year. This dramatic transformation of our fiscal system would require new sources of revenue, additional borrowing, or trade-offs with other government funding priorities. At the same time, this program would cost significantly less than other basic programs proposed by policymakers and academics because of its targeted nature with an income phase out at the median. Moreover, by targeting the poorest households, we may further induce multiplicative economic effects as the lowest-earning households are likely to utilize this cash for immediate consumption. Indeed, the poorest households will almost certainly spend a significant proportion of the guaranteed income funds in order to meet immediate basic needs.
This program is designed to supplement and bolster the existing social safety net and should not be thought of as a replacement for other in-kind government support programs. While many of our existing social supports help to address specific essential needs, unconditional cash grants provide families with the opportunity to take care of urgent needs or emergencies of any kind, or to invest in their careers or their families. This maintenance of other social safety net programs helps to ensure that our program enables individual progress and wealth building, and bolsters support for those in need and who have historically been excluded from economic opportunity.
A guaranteed income alone does not offer a complete solution to the challenges of economic insecurity, and it certainly cannot independently ensure racial, gender, and economic justice. There are many structural barriers that remain in place. However, a guaranteed income program—combined with an expanded social safety net—can help stabilize families and lead to more resilient communities in the wake of increasing economic vulnerability.
our guaranteed income proposal

20
We estimate proposed refund values, and their simulated financial impacts, using nationally representative data from the Survey of Consumer Finances (SCF). The SCF is produced triennially by the Federal Reserve Bank of the United States and is designed to be nationally representative of household income and wealth, across the distribution. We use the summary extract data, which are micro-data with observations at the household level, produced by the Federal Reserve Bank with higher-order variables like total household income calculated and pre-verified by the Bank.
We use the most updated available data from the Federal Reserve, the 2019 SCF, to model these policy impacts. However, it is worth keeping in mind that the economy underwent substantial shifts in the year 2020. Our estimates reflect the policy’s impact in a baseline year but will change as the economy changes; this is an advantageous feature of the guaranteed income policy design. As the economy falls prey to any number of ills, including market bubbles like the most recent recession of 2008, or the economic shutdown necessitated by the public health crisis of 2020, a guaranteed income policy tied to poverty prevention kicks into higher gear, being allocated to a greater number of households and at a higher grant value than would otherwise be the case. In other words, this policy is structurally countercyclical, balancing out the effects of exogenous business cycle ebbs and flows on household finances.
We allocate the full refund value to adults with a household income below $10,000 in a single-adult household and below $15,000 in a two-adult household. The maximum refund value is $12,500 for single-adults or $25,000 for married or cohabitating-adult households. For households with income above the maximum-refund threshold, the value of the refund declines linearly to zero, at a rate of 31.9 percent for single-adult households and 46.4 percent for two-adult households, to fully phase out at $50,000 and $70,000 of income, respectively. The child refund is allocated similarly, with the full child grant of $4,500 for households with income below $10,000 for households with one adult or $15,000 in households with two adults. Child refund values then decline linearly at a rate of 11.25 percent and 8.18 percent, respectively, in one- and two-adult households, to fully phase out at the same respective $50,000 and $70,000 income levels.
Individual and Household Effects
We start with illustrative examples of individual household earnings with and without the refund before assessing population-level impacts. The examples illustrate the terms of our exemplary guaranteed income program in practice, reflecting in each a population mean for households within a $500 band on the income level presented. We begin by looking at refund amounts to adults, as adults’ and children’s allocations occur independently of one another. A single adult earning $8,000 in income would receive a refund of $12,500. In total, that individual would have $20,500 in income and refund combined, enough to move the household out of poverty (relative to the poverty guideline of $12,490 in 2019) and into the middle class. A two-person household with the same level of income earns far less on a per-adult basis and would thus require a greater refund to be lifted out of poverty. The married or cohabitating two-adult household earning the same $8,000 in income would be eligible for a $25,000 guaranteed income, which is double the guaranteed income amount for the single household.7 This way, we avoid penalizing marriage or adult domestic partnership.
economic impacts: simulations
7 Households with adults who are cohabitating but unmarried may file their taxes separately and thus be treated as single persons in practice for refund calculations. Because our data report income for the full household, we use household total income to calculate refund eligibility. The design of this guaranteed income program explicitly avoids penalizing marriage, and as a result, the empirical impact of this distinction is small. As described above, assuming each files separately, the total program size increases but remains under $1 trillion.
21
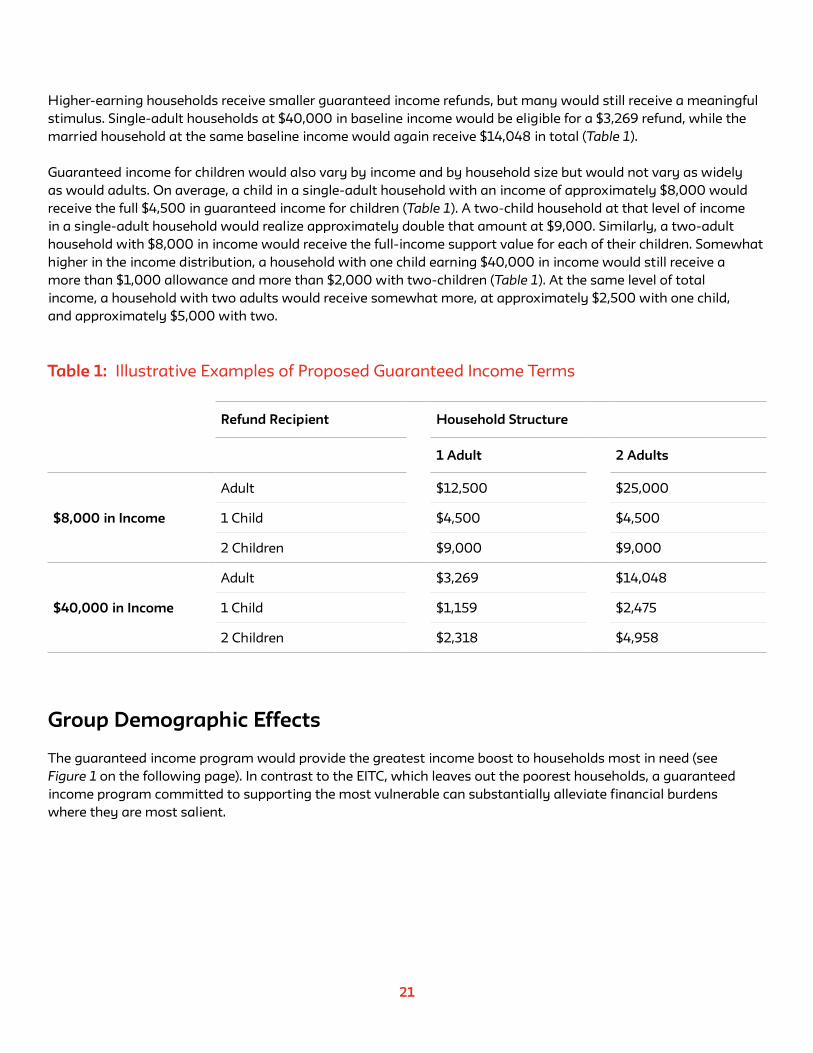
Higher-earning households receive smaller guaranteed income refunds, but many would still receive a meaningful stimulus. Single-adult households at $40,000 in baseline income would be eligible for a $3,269 refund, while the married household at the same baseline income would again receive $14,048 in total (Table 1).
Guaranteed income for children would also vary by income and by household size but would not vary as widely as would adults. On average, a child in a single-adult household with an income of approximately $8,000 would receive the full $4,500 in guaranteed income for children (Table 1). A two-child household at that level of income in a single-adult household would realize approximately double that amount at $9,000. Similarly, a two-adult household with $8,000 in income would receive the full-income support value for each of their children. Somewhat higher in the income distribution, a household with one child earning $40,000 in income would still receive a more than $1,000 allowance and more than $2,000 with two-children (Table 1). At the same level of total income, a household with two adults would receive somewhat more, at approximately $2,500 with one child, and approximately $5,000 with two.
Refund Recipient Household Structure
1 Adult 2 Adults
$8,000 in Income
Adult $12,500 $25,000
1 Child $4,500 $4,500
2 Children $9,000 $9,000
$40,000 in Income
Adult $3,269 $14,048
1 Child $1,159 $2,475
2 Children $2,318 $4,958
Table 1: Illustrative Examples of Proposed Guaranteed Income Terms
Group Demographic Effects
The guaranteed income program would provide the greatest income boost to households most in need (see Figure 1 on the following page). In contrast to the EITC, which leaves out the poorest households, a guaranteed income program committed to supporting the most vulnerable can substantially alleviate financial burdens where they are most salient.

22
Effects on Household Poverty
The guaranteed income program would raise every U.S. household above the FPL (see Figure 2 on the following page). In 2019, approximately 10.5 percent of U.S. households had incomes below the official FPL.8 While the FPL is criticized for setting the threshold too low, over one in ten U.S. households cannot meet it, even in the absence of a recession. Nevertheless, a guaranteed income program designed to prevent the agreed-upon official threshold of poverty can provide a meaningful solution—that is an end—to the problem of poverty for 100 percent of households, using this official statistic.
The share of households who are near poor, between 100 percent and 200 percent of the FPL, declines by nearly half from 20 percent to 12 percent of households with a guaranteed income. We see the largest net increases between 200 percent and 300 percent of the FPL, which picks up 12 percentage points of the population. In other words, the refund would boost impoverished households above the poverty level and lift those households on the edge of poverty further into the middle class. Table 1 (on the preceding page) details households’ movement along the poverty scale. As shown in Table 1, the guaranteed income refund would lift every one of the nearly 14 million U.S. households out of poverty. Among the 25 million just above poverty, most (82 percent) would be bumped up
Figure 1: Mean Guaranteed Income by Income Quantiles
$5,000
$10,000
$15,000
$20,000
$0
743
,00
0
Note: Figure 1 illustrates the downward slope of guaranteed income values and baseline income increases. The x-axis displays 20 quantiles of baseline household income, identified by mean income within the quantile.
$25,000
22
3,0
00
162
,00
0
133
,00
0
115
,00
0
101,
00
0
90
,00
0
83
,00
0
72,0
00
64
,00
0
57,
00
0
55
,00
0
47,
00
0
42
,00
0
36
,00
0
36
,00
0
29
,00
0
23
,00
0
18,0
00
10,0
00
Gu
ara
nte
ed In
com
e Su
pp
ort
Va
lue
Quantiles of Income, in Thousands
8 https://www.census.gov/library/publications/2020/demo/p60-270.html

23
to above two times the poverty line. Given the progressive phase-out, households with incomes at or above three times the poverty guideline would realize no change in their poverty status.
Figure 2: Poverty Status with Guaranteed Income Refund
20%
40%
60%
80%
100%
0%
Baseline With NIT
12%
28%
29%
31%
11%
20%
16%
31%
22%
Poor
1 to 200
2 to 300
3 to 500
5 to Max
Woman-headed households with children make up approximately 10 percent of all U.S. households and 22 percent of U.S. households with children, and represent a group substantially vulnerable economically. Today, more than one in four live in poverty. Using a guaranteed income tied to the poverty line, all single-mother households in the U.S., and the children living in these households, would be lifted above the poverty line (see Figure 3 below).
Figure 3: Poverty Status with Guaranteed Income: Single Mothers
20%
40%
60%
80%
100%
0%
Baseline With NIT
43%
36%
15%
6%
28%
19%
34%
6%
13%
Poor
1 to 200
2 to 300
3 to 500
5 to Max

24
Black, non-White Latinx, Indigenous, and other households of color experience a disproportionate share of poverty at baseline and thus realize the greatest poverty alleviation with our guaranteed income program (see Table 2 below). Importantly, the guaranteed income policy substantially reduces poverty across each racial group, eliminating poverty for all groups. Of the 7.3 million White households in poverty (representing approximately 8 percent of White households), the guaranteed income policy would lift each household out of poverty. Seventy-eight percent (5.7 million households) would be bumped up to the next poverty category, between 100 percent and 200 percent of poverty, while another 22 percent (1.6 million households) would reach more than 200 percent of poverty (Table 2).
Among Black households at baseline, a far greater share are below the poverty line, approximately 18 percent, or 3.6 million households. Among those households, all would be lifted out of poverty, with 82 percent of the Black households in poverty at baseline (2.96 million households) landing between 100 and 200 percent of poverty with the guaranteed income (see Table 3 on the following page). Similarly, among Latinx households, of whom approximately 17 percent are in poverty at baseline, virtually all would be lifted above the poverty line, primarily by moving to the next category up. For each racial group, virtually all households at or above 300 percent of the FPL remain in their baseline income category.
With Guaranteed Income
Baseline Poor 100-200 200-300 300+
Poor 13.84 11.02 (79.6%) 2.82 (20.4%)
100-200 25.33 4.65 (18.4%) 20.68 (81.6%)
200-300 20.64 11.95 (57.9%) 8.69 (42.1%)
300+ 68.83 68.83 (100%)
Table 2: Millions of Households by Poverty Category, Baseline, and with Guaranteed Income
Note: Data source Survey of Consumer Finances, 2019. Row percentage listed in parentheses. For example, of the 13.84 million households in poverty at baseline, none remain in poverty with the guaranteed income. 11.02 million (79.6 percent of the baseline) move up to between 100 and 200 percent of the FPL, while the remaining 2.82 million (representing 20.4 percent of households in poverty at baseline) move up to between 200 percent and 300 percent of the FPL.

25
Table 3: Millions of Households by Poverty Category and Race of Household Head, at Baseline and with Guaranteed Income
With Guaranteed Income
Baseline Poor 100-200 200-300 300+
White
Poor 7.30 5.70 (78.1%) 1.60 (21.9%)
100-200 14.50 2.37 (16.4%) 12.13 (83.6%)
200-300 13.00 7.20 (55.4%) 5.80 (44.6%)
300+ 52.67 52.67 (100%)
Black
Poor 3.60 2.96 (82.3%) 0.64 (17.7%)
100-200 5.12 1.26 (24.6%) 3.86 (75.4%)
200-300 3.93 2.60 (66.3%) 1.33 (33.7%)
300+ 7.49 7.49 (100%)
Note: Table 3 shows movement of households after guaranteed Income. For example, of the 7.3 million White households in poverty at baseline, none remain in poverty; 5.7 million move up to between 100 percent and 200 percent of the FPL, representing 78.1 percent of White households who were in poverty at baseline. The remaining 21.9 percent move up to between 200 percent and 300 percent of the FPL (1.6 million). One hundred percent of households at or above 300 percent of the FPL at baseline remain in their baseline category. Data are drawn from the 2016 Survey of Consumer Finances.
Latinx
Poor 2.35 1.94 (82.4%) 0.41 (17.6%)
100-200 4.51 0.84 (18.7%) 3.67 (81.3%)
200-300 2.49 1.49 (59.8%) 1.00 (40.2%)
300+ 4.71 4.71 (100%)

26
Effects on Median Income
Median household income in the United States for 2019 was just over $59,000 using data from the 2019 Survey of Consumer Finances (Figure 4). With the guaranteed income policy, median income would rise by approximately $5,000. Black household income at the median was far smaller than that of the population overall, at only $38,688 in 2019, which is close to the Latinx median ($42,761), but substantially lower than White households’ median income of approximately $68,000 (Figure 4). Correspondingly under the guaranteed income program, Black and Latinx households would realize an increase in median income of more than $10,000. In other words, half of all Black and Latinx U.S. households would be eligible for a guaranteed income grant of more than $10,000 under our poverty-alleviation-driven design. The median household income of White households overall would also rise, by just over $1,000 according to the income distribution of 2019, but by more in the recessionary economic environment of 2020. While our data were not able to adequately examine median income statistics among Asian, Pacific Islander, Indigenous, or other racial and ethnic group households, still, the increase of over $5,000 at the population-level median reflects broadly equitable increases in income for the most vulnerable among all households across racial and ethnic lines.
Figure 4: Racial Disparities in Median Income with Progressive Refund Program
$20,000
$40,000
$60,000
$80,000
$0
Total Population White NH
Baseline Income Guaranteed Income Subsidy
Black/African American Latinx
$59,051$68,214
$38,688 $42,761
$50,906
$58,833
$69,337$64,742

27
Program Cost
We estimate that our program would cost approximately $876 billion per year.9 Our program would cost less than other basic income programs proposed by academics and policymakers in recent years. As described above, our guaranteed income program includes a phase-out for higher-income earners, which minimizes overall program costs and targets the economic support to the beneficiaries who need it most. The program also reduces costs by providing a smaller grant for children. Candidate Andrew Yang’s broader universal basic income proposal—which provides a $12,000 grant and does not include a phase-out—would cost an estimated $2.8 trillion per year, or more than three times the cost of our guaranteed income program. Professors Fleischer and Hemel’s proposal—which provides a smaller grant of $6,000 to both adults and children with no phase-out—would cost an estimated $1.8 trillion per year, or approximately twice the cost of our program (Fleischer & Hemel, 2019).
Periodic Refund Payment
Meeting the policy objective of delivering ongoing income needed to meet ongoing basic household needs necessitates ongoing delivery of the guaranteed income payments, our plan is that the government would deliver the payment via monthly installments. More frequent disbursement of benefits allows families to cover unexpected costs and to receive a steady source of income.
Advanced payments would be calculated on the basis of the prior year’s return, similarly to the calculation for income-based federal subsidy of private health insurance under the Affordable Care Act. Three measures would protect against potential debts incurred by households whose income for the year subsequently turns out to be higher than anticipated. Importantly, six in 10 households below the median earn wage or salary income. Employers currently provide contemporaneous salary data to the IRS through withholding, which would be used to adjust the guaranteed income allotments during the year if the taxpayer’s income changes significantly. Secondly, households would be encouraged to notify the IRS when their income changes substantially. Finally, the policy would come with safe harbor provisions that facilitate repayment of any grossly overestimated allotment over a period of time that would not exert undue financial pressure on recipient households.
A recipient may opt out of the monthly payments, and instead receive a lump sum payment upon subsequently filing their tax return for the year, when their total income for the year is known with certainty. In this case, the program could also provide a modest interest payment to compensate the recipient for deferring the receipt of their grant.
With these structures in place, the IRS would use the periodic repayment structure to ensure that individuals could receive the guaranteed income refund via direct deposit or through an electronic account established by the Treasury for unbanked individuals.
additional considerations
9 This estimate does not take into account potential positive economic effects from mitigating inequality, expanding economic opportunity for lower-income taxpayers, and minimizing their exposure to personal or public economic shocks (Boushey, 2019). Also, the estimate does not include possible economic effects of taxes or government borrowing to fund the program. A range of economists agree that concerns with deficit spending are overblown or exaggerated, at least at current interest rate levels. Economist Stephanie Kelton’s book, The Deficit Myth, explores how concerns over government spending are often rooted in myths about deficits and what the government can or cannot afford (Kelton, 2020). Kelton is an advocate of “Modern Monetary Theory” (MMT), which calls for government spending to create its own tax base – arguing that the government does not need to budget like a household and should not be concerned with finding “pay-fors” to finance large government programs.

28
Labor Incentives
Empirical studies on the effects of the EITC phase-out on labor incentives can help anticipate the possible effects of a similar phase-out in a guaranteed income program. As described above, empirical research finds that the EITC phase-out does not significantly reduce the hours worked by taxpayers already participating in the labor market (Eissa & Hoynes, 2006). One reason for this might be relative inelasticity of labor supply along the intensive (hours worked) margin, particularly within the income range of EITC beneficiaries. In other cases, workers are simply unable to choose the number of hours they work.
Even if the phase-out of the grant in our proposal did have some limited effect on labor incentives, all workers with income in the phase-out range will still receive an additional benefit, beyond what they would receive in the absence of our program. As a result, the phase-out is only comparable to an implicit tax with regards to its possible incentive effects, even though our program will still provide an additional net benefit to every recipient.
Our guaranteed income program will also benefit individuals not formally engaged in the labor force, and therefore face no phase-out or potential labor disincentive. Furthermore, providing basic economic support can also increase labor market participation and productivity for many beneficiaries, by insulating them from economic shocks which can hinder labor market participation.
The goal of the guaranteed income program is to promote economic inclusion and security. A recent study of Finland’s basic income experiment found that economic support programs may be most effective in advancing these goals. The study found that Finland’s basic income experiment conducted in 2017-2018 significantly improved the beneficiaries’ level of well-being and economic security but had more limited effects in encouraging labor market participation (Kangas et al., 2020).
Effects of Tax Filing Status
Our guaranteed income program, like most other basic income proposals, provides an equivalent benefit for every adult, without regard to household composition or filing status. For example, two single, unmarried individuals with no other income would each receive a benefit of $12,500 while two married individuals with no other income who file a joint tax return would receive a benefit of $25,000. This feature is necessary to ensure that every individual qualifies for the benefit, regardless of their marital or tax filing status.
The phase-out schedule, on the other hand, is determined based on the total household AGI of the tax filing unit. Using household AGI ensures that the adjustments can be easily implemented through the current tax system, without the need for additional calculations of each individual’s attributable income. This feature, however, could result in an additional “marriage bonus,” if the phase-out level is simply doubled for a married couple filing jointly. Married couples undoubtedly enjoy some economy of scale, as opposed to single individuals or single heads of households. At the same time, phasing out the grant for both individual and married couples at the same income level would provide a significant disadvantage to married couples, who could then receive a larger grant by remaining unmarried.
The challenges of marriage penalties and bonuses are endemic to the income tax rules that treat households as taxpaying units and follow a progressive rate schedule, and these problems cannot be completely avoided in a

29
basic income program either. Even a “universal basic income” program with no phase-outs would still encounter challenges in fairly treating all household types, just as it would not avoid potential effects on labor incentives, as described above. This is because a universal basic income program funded through explicit tax increases on all households—or a subset thereof—would face similar challenges in fairly treating all household filing types when introducing these tax increases. Our proposal, which allows for a larger—but less than double—phase-out schedule for married couples represents the sort of compromise in mitigating marriage penalties and bonuses that is followed in other tax rules.
If desired, policymakers could also adjust the design of our program to more accurately tailor the phase-out levels to taxpayer’s different household circumstances. For example, the phase-out range could vary with the taxpayer’s household status and with the number of children in the household, as in the case of the EITC.

30
By facilitating a more just and equitable tax code, we can ensure that everyone is provided with the resources needed to protect against poverty and despair, and provide economic security and social mobility. A guaranteed income program would lift households out of poverty and provide pathways toward the middle class for millions more. This intervention, combined with other economic supports, will generate a more resilient social safety net—including a tax code that is economically inclusive and socially equitable—and will better prepare us to withstand the next pandemic, climate-related disaster, or economic shock.
conclusion

31
AGI vs. SCF
We analyze the effects of our guaranteed income program for groups of American households using data from the Survey of Consumer Finances. The SCF provides detailed demographic information on racial and gender compositions across the income distribution. The most accessible SCF data are its summary extracts, which we use here. The measure of household income reported in this data set does not account for the adjustments that would determine a household’s taxable income. Yet, in our proposal, eligibility and size of the income support would be determined by a measure of taxable income—the taxpayer’s AGI—as it is under similar economic support programs implemented through the tax system. Using a measure of taxable income such as AGI is necessary for an economic support program delivered through the tax system and avoids the need for duplicative and administratively costly measurement of taxpayer’s income under multiple methods.
AGI and household income reported in our SCF data are highly similar, especially for the households with low incomes that our program targets, but they do not perfectly correlate. The two data points measure income in different ways and collect the data through different processes. The SCF randomly samples U.S. households and collects data on assets, income, and liabilities, along with other demographic and financial information, in order to understand how income is distributed nationwide. AGI, in contrast, measures taxpayer’s income for tax purposes, using the particular rules for inclusions, exclusions, and deductions provided by the tax rules. For example, retirement contributions and contributions to a health savings account would not be considered taxable income and would be deducted before calculating AGI. By contrast, the SCF definition of household income would consider these as expenses and would not deduct these contributions from the calculation of income.
The two measures also vary based on the unit of observation, the “tax unit” versus a “household”, the sample size, and the “motivations people face in providing the data” (Johnson & Moore, 2008). For example, an elderly parent living with an adult child may form one household in that they share living expenses but may constitute two separate tax units if they work and file separately. For this reason, tax units tend to be smaller than households. The SCF would report their combined income, which could make them appear ineligible, but based on their taxable income, each could, in fact, be eligible.
We do not expect these discrepancies between the two measures to significantly alter our basic findings. The categories of income that comprise the SCF measure generally correspond to those measured as part of the taxpayer’s AGI. As a result, IRS researchers have found that the two data sources “compare quite favorably,” particularly for the categories of income most commonly reported by lower and middle-income taxpayers, with an overall variance of only 6 percent between SCF and tax income data (Johnson & Moore, 2008).
Finally, the SCF data also accounts for households with three or more adults, while the tax system only allows for single and two-adult filings. To estimate the economic effects of our program for households in the SCF data with three or more adults, we adopt a simplifying convention: households with three or more adults receive up to $30,000 total for those households with income up to $30,000, declining at a rate of 50 percent above $30,000 to fully phase out at $80,000 in total household income across all adults. Because this category only represents a small proportion of total households, the choice of how to estimate the grant amounts for these households will not significantly affect the overall program cost. Under an alternative assumption that every non-married adult (with two or more adults in the household) file separately, that divides household income in a way that maximizes the refund value, our guaranteed income program cost still remains under $1 trillion. Ultimately households’ tax
appendix

filing status and composition of tax units, available in IRS data, will determine the exact distribution of guaranteed income allocations.
The methodological challenges in estimating the effects of tax policies upon particular demographic groups could be avoided if the tax system explicitly collected more demographic data on taxpayers and if those data were made easily accessible to researchers. For example, Professor Jeremy Bearer-Friend offers a critique on “color blindness” in the process of collecting tax information and proposes collecting data on the taxpayer’s race and ethnicity as part of tax filings (Bearer-Friend, 2019).
32

33
referencesAckerman, B., & Alstott, A. (1999). The stakeholder society. New Haven, CT: Yale University Press.
Assistance for American Families and Workers. (n.d.). U.S. Department of the Treasury. Retrieved April 30, 2021, from https://home.treasury.gov/policy-issues/coronavirus/assistance-for-American-families-and-workers
Banking for All Act, S.3571, 116th Cong. (2020). Retrieved from https://www.congress.gov/bill/116th-congress/senate-bill/3571/text
Baradaran, M. (2014). It’s Time for Postal Banking, 127 Harv. L. Rev. F. 165-175.
Baradaran, M. (2017). The Color of Money: Black Banks and the Racial Wealth Gap. Harvard University Press.
Bearer-Friend, J. (2019). Should the IRS Know Your Race? The Challenge of Colorblind Tax Data, 73 Tax Law Review.
Bhattacharya, J. (2019). Exploring guaranteed income through a racial and gender justice lens. Roosevelt Institute. New York, NY. Retrieved from https://rooseveltinstitute.org/publications/exploring-guaranteed-income-through-a-racial-and-gender-justice-lens/
Bhutta, N., Bricker, J., Chang, A. C., Dettling, L. J., Goodman, S., Hsu, J. W., Moore, K., Reber, S., Volz, A. & Windle, R. (2020). Changes in US family finances from 2016 to 2019: evidence from the survey of consumer finances. Federal Reserve Bulletin, 106(5). https://www.federalreserve.gov/publications/files/scf20.pdf
Black to the Future Action Fund (2020). Black agenda 2020. Black Future’s Lab. Retrieved from https://black2thefuture.org/wp-content/uploads/2020/02/BlackAgenda2020.pdf
BOOST Act, H. R. 3590, 116th Cong. (2019). https://www.congress.gov/116/bills/hr3590/BILLS-116hr3590ih.pdf
Boushey, H. (2019). Unbound: How Inequality Constricts Our Economy and What We Can Do About It. Harvard University Press.
Brown, D. A. (2018). Homeownership in Black and White: The Role of Tax Policy in Increasing Housing Inequity. U. Mem. L. Rev., 49, 205.
Brown, D. A. (1997). Race, class, and gender essentialism in tax literature: the joint return. Wash. & Lee L. Rev., 54, 1469.
Civilian unemployment rate. (2020). Bureau of Labor Statistics. Retrieved April 30, 2021, from https://www.bls.gov/charts/employment-situation/civilian-unemployment-rate.htm#
Drucker, J. (2020). The Tax-Break Bonanza Inside the Economic Rescue Package. New York Times. Retrieved from https://www.nytimes.com/2020/04/24/business/tax-breaks-wealthy-virus.html#:~:text=As%20part%20of%20the%20economic,to%20interviews%20and%20government%20estimates
Economic Security Project, (2020). Guaranteed income. Economic Security Project. Retrieved from https://www.economicsecurityproject.org/guaranteedincome/
Economic Security Project, (2020). Open letter from economists on automatic triggers for cash stimulus payments. Economic Security Project. Retrieved from https://www.economicsecurityproject.org/wp-content/uploads/2020/07/emp_economists_letter.pdf
Eissa, N., Hoynes, H. (2006). Behavioral Responses to Taxes: Lessons from the EITC and Labor Supply In 20 Tax Policy and the Economy 73-110.
Eissa, N., Liebman, J.B. (1996). Labor Supply Response to the Earned Income Tax Credit. Quarterly Journal of Economics 111: 605-637.

Federal Reserve Board. (2020). Report on the economic well-being of U.S. households in 2019, featuring supplemental data from April 2020. Washington, DC. Retrieved from https://www.federalreserve.gov/publications/files/2019-report-economic-well-being-us-households-202005.pdf
Federal Deposit Insurance Corporation (2017). 2017 FDIC national survey of unbanked and underbanked households. Washington, DC. Retrieved from https://www.fdic.gov/householdsurvey/
Fleischer, M.P., Hemel, D.J. (2019). The Architecture of a Basic Income. U. Chi. L. Rev.
Friedman, M. (1962). Capitalism and Freedom. University of Chicago Press.
Gale, W.G. (2019). Saez and Zucman say that everything you thought you knew about tax policy is wrong. Brookings. Retrieved from https://www.brookings.edu/blog/up-front/2019/10/23/saez-and-zucman-say-that-everything-you-thought-you-knew-about-tax-policy-is-wrong/
Gamage, D., Kamin, D. (2019). The Games They Will Play: Tax Games, Roadblocks, and Glitches Under the 2017 Tax Legislation. 103 MINN. L. REV. 1439-1521.
Glogower, A. (2016). Taxing Capital Appreciation. 70 TAX L. REV. 111-176.
Glogower, A. Wallace, C. (2018). Shades of Basic Income. In Sharing the Gains of the Global Economy: Proceedings of the New York University 70th Annual Conference on Labor.
Gould, E., Wilson, V. (2020). Black workers face two of the most lethal preexisting conditions for coronavirus – racism and economic inequality. Economic Policy Institute. Washington, DC. Retrieved from https://www.epi.org/publication/black-workers-covid/
Hamilton, D. (2018). How ‘Baby Bonds’ Could Close the Racial Wealth Gap. Ted Talk. Retrieved from https://www.ted.com/talks/darrick_hamilton_how_baby_bonds_could_help_close_the_wealth_gap
Hamilton, D. (2019). Neoliberalism and race. Democracy Journal, 53. Retrieved from https://democracyjournal.org/magazine/53/neoliberalism-and-race/
Hamilton, D. (2020). The Moral Burden on Economists: Darrick Hamilton’s 2017 NEA Presidential Address. The Review of Black Political Economy, 47(4), 331-342.
Hamilton, D., Biu, O., Famighetti, C., Green, A., Strickland, K., Wilcox, D. (2021). Building an Equitable Recovery: The Role of Race, Labor Markets, and Education. Institute on Race and Political Economy, the New School. Retrieved from https://www.newschool.edu/institute-race-political-economy/Building_An_Equitable_Recovery_Hamilton_et_al_2021.pdf
Hamilton, D., Linden, M. (2018). Hidden Rules of Race are Embedded in the New Tax Law. Roosevelt Institute: Retrieved from https://rooseveltinstitute.org/publications/hidden-rules-of-race-are-embedded-in-the-new-tax-law/
Hamilton, D., Nieves, E., Markoff, S., Newville, D. (2020). A Birthright to Opportunity: Equitably Designing Baby Bonds to Promote Economic and Racial Justice. Prosperity Now and The Kirwan Institute for the Study of Race and Ethnicity. Retrieved from https://prosperitynow.org/resources/birthright-capital-equitably-designing-baby-bonds-promote-economic-and-racial-justice
Hamilton, D., Strickland, K. (2020). Workers need a bold vision to bring about a more equitable society. The Guardian. Retrieved from https://www.theguardian.com/commentisfree/2020/jan/27/workers-need-a-bold-vision-to-bring-about-a-more-equitable-society
Harris, K.D. (2018). Harris Proposes Bold Relief for Families Amid Rising Costs of Living. Retrieved from https://budgetandpolicy.org/schmudget/in_the_media/senator-kamala-d-harris-proposes-bold-relief-for-families-amid-rising-costs-of-living/
Hoynes, H., Rothstein, J. (2019). Universal Basic Income in the United States and Advanced Countries, Annual Review of Economics, 11: 929-58.
34

Huang, C., Taylor, R. (2019). How the Federal Tax Code Can Better Advance Racial Equity: 2017 Tax Law Took Step Backward. Center on Budget and Policy Priorities. Retrieved from https://www.cbpp.org/research/federal-tax/how-the-federal-tax-code-can-better-advance-racial-equity
Institute for Policy Studies and the Poor People’s Campaign (2018). The souls of poor folk. Karios Center. New York, NY. Retrieved from https://kairoscenter.org/wp-content/uploads/2019/01/PPC-Audit-Full-410835a.pdf
Institute on Taxation and Economic Policy. (2019). Boost Act. Retrieved from https://itep.org/boost-act/
Johnson, B., Moore, K. (2008). Consider the Source: Differences in Estimates of Income and Wealth From Survey and Tax Data. In Compendium of Federal Estate Tax and Personal Wealth Studies, 2: 875-897.
Kangas, O., Jauhiainen, S., Simanainen, M., Ylikännö, M. (2020). Suomen perustulokokeilun arviointi (Evaluation of the Finnish Basic Income Experiment). Retrieved from https://julkaisut.valtioneuvosto.fi/handle/10024/162219
Katznelson, I. (2014). Fear Itself: The New Deal and the Origins of Our Time. W.W. Norton.
Kelton, S. (2020). The Deficit Myth: Modern Monetary Theory and the Birth of the People’s Economy. Public Affairs.
Kendi, I. (2019). How To Be an Antiracist. Penguin Random House.
Kijakazi, K., McCulloch, H. (2018). Building women’s wealth is key to economic security. Slate. Retrieved from https://slate.com/human-interest/2018/05/gender-inequality-closing-the-wealth-gap-is-critical-to-future-financial-security.html
King, M.L. (1967). Where Do We Go From Here: Chaos or Community? Penguin Random House.
Kleinman, A.J., Matsui, A.K., Mitchell, E. (2019). The faulty foundations of the tax code: Gender and racial bias in our tax laws. National Women’s Law Center. Retrieved from https://nwlc-ciw49tixgw5lbab.stackpathdns.com/wp-content/uploads/2019/11/NWLC-The-Faulty-Foundations-of-the-Tax-Code-Accessible-FINAL.pdf
Marr, C., Jacoby, S., Bryant, K. (2019) Substantial Income of Wealthy Households Escapes Annual Taxation Or Enjoys Special Tax Breaks: Reform Is Needed. Center on Budget and Policy Priorities. Retrieved from https://www.cbpp.org/research/federal-tax/substantial-income-of-wealthy-households-escapes-annual-taxation-or-enjoys
Mayors for a Guaranteed Income, (2020). Statement of principles. Mayors for a Guaranteed Income. Retrieved from https://www.mayorsforagi.org/statement-of-principles
Movement for Black Lives. (2020). “A Progressive Restructuring of All Tax Codes at the Local, State, and Federal Levels to Ensure a Radical and Sustainable Redistribution of Wealth” accessed at https://m4bl.org/policy-platforms/economic-justice/
Moynihan, D.P. (1973). The Politics of a Guaranteed Income: The Nixon Administration and the Family Assistance Plan.
National Women’s Law Center (2019). Tax justice is gender justice: Advancing gender and racial equity by harnessing the power of the U.S. tax code. Retrieved from https://nwlc-ciw49tixgw5lbab.stackpathdns.com/wp-content/uploads/2019/11/NWLC-Tax-Executive-Summary-Accessible.pdf
Newton, Seale. (1966). Ten-Point Party Platform. PBS. https://www.pbs.org/hueypnewton/actions/actions_platform.html
Nieves, E., Ain, J., Newville, D., (2020). From upside-down to right-side up: Turning the tax code into an engine for economic and racial equality. Prosperity Now. Washington, DC. Retrieved from https://prosperitynow.org/sites/default/files/resources/RSU_2020_Full_Report-7.13.2020.pdf
Paine, T. (1797). Agrarian Justice. Reprinted in The Collected Writings of Thomas Paine, 1830.
Policy Basics: The Earned Income Tax Credit. (2019). Center on Budget and Policy Priorities. https://www.cbpp.org/research/federal-tax/the-earned-income-tax-credit
35

Pomerleau, K. (2019). Does Andrew Yang’s “Freedom Dividend” Add Up?. Tax Foundation. Retrieved from https://taxfoundation.org/andrew-yang-value-added-tax-universal-basic-income/
Reich, R., & Mcculloch, H. (2017, August 29). Wealth, not just wages, is the way to measure women’s equality. Los Angeles Times. https://www.latimes.com/opinion/op-ed/la-oe-reich-mcculloch-womens-wealth-gap-20170825-story.html
Rho, H., Brown, H., Fremstad, S. (2020). A basic demographic profile of workers in frontline industries. Center for Economic and Policy Research. Washington, DC. Retrieved from https://cepr.net/a-basic-demographic-profile-of-workers-in-frontline-industries/
Rice, J. (2002). Poverty, welfare, and patriarchy: how macro-level changes in social policy can help low-income women. Journal of Social Issues. Washington, DC. Retrieved from https://spssi.onlinelibrary.wiley.com/doi/abs/10.1111/0022-4537.00218
Saez, E., Zucman, G. (2014). Wealth inequality in the United States since 1913: Evidence from capitalized income tax data. National Bureau of Economic Research. Retrieved from https://www.nber.org/papers/w20625
Saez, E., Zucman, G. (2019a). Progressive Wealth Taxation, BPEA Conference Drafts. Retrieved from https://www.brookings.edu/wp-content/uploads/2020/10/Saez-Zuchman-final-draft.pdf
Saez, E., Zucman, G. (2019b). The Triumph of Injustice: How the Rich Dodge Taxes and How to Make Them Pay. W.W. Norton.
Social Security Administration. (2019). Weighted Average Poverty Thresholds for Nonfarm Families, By Size: 1959-2018. Retrieved from https://www.ssa.gov/policy/docs/statcomps/supplement/2019/3e.html#table3.e8
Solomon, D., Hamilton, D. (2020). The Coronavirus pandemic and the racial wealth gap. Center for American Progress, Washington, DC. Retrieved from https://www.americanprogress.org/issues/race/news/2020/03/19/481962/coronavirus-pandemic-racial-wealth-gap/
Soss, J., Fording, R.C., Schram, S. (2011). Disciplining the Poor: Neoliberal Paternalism and the Persistent Power of Race, University of Chicago Press.
Staff of the Joint Committee on Taxation. (2019). Estimates of Federal Tax Expenditures for Fiscal Years 2019-2023.
Stockton Demonstration. (2019). Our vision for SEED: A discussion paper. Retrieved from https://static1.squarespace.com/static/6039d612b17d055cac14070f/t/605029ab52a6b53e3dd38cf8/1615866284641/10+-+SEED+Discussion+Paper.pdf
Tax Alliance for Economic Mobility. (January, 2019). Housing and homeownership tax expenditures. Retrieved from https://www.taxallianceforeconomicmobility.org/wp-content/uploads/2019/01/Tax_Alliance_Housing_and_Homeownership_Principles_2019-FINAL.pdf
Tax Policy Center Staff. (2017). Distributional Analysis of the Conference Agreement for the Tax Cuts and Jobs Act. Retrieved from https://www.taxpolicycenter.org/sites/default/files/publication/150816/2001641_distributional_analysis_of_the_conference_agreement_for_the_tax_cuts_and_jobs_act_0.pdf
Tax Policy Center. (2019). Revenue Impact of Senator Kamala Harris’ LIFT (Livable Incomes for Families Today) the Middle Class Act as Introduced in the Senate, FY and CY 2019-2038. Retrieved from https://www.taxpolicycenter.org/model-estimates/senator-harris-lift-middle-class-act-november-2018/revenue-impact-senator-kamala
Theobald, R. (1963). Free Men and Free Markets. CN Porter.
Theobald, R. (1967). Background to the Guaranteed-Income Concept. In The Guaranteed Income: Next Step in Socioeconomic Evolution. Anchor Books Doubleday.
Tillmon, J. (1972). Welfare is a women’s issue. Ms. Magazine. Accessed on the Global Resistance Resource Library. Vancouver Rape Relief and Women’s Shelter. Vancouver, BC. Retrieved from https://msmagazine.com/2021/03/25/welfare-is-a-womens-issue-ms-magazine-spring-1972/
36

37
The Undercommons. (2017). No racial justice without basic income. Boston Review. Cambridge, MA. Retrieved from http://bostonreview.net/class-inequality-race/undercommons-no-racial-justice-without-basic-income
Toder, E. and Berger D. (2019) “Distributional Effects of Individual Income Tax Expenditures After the 2017 Tax Cuts and Jobs Act” (Tax Policy Center, 2019). https://www.taxpolicycenter.org/publications/distributional-effects-individual-income-tax-expenditures-after-2017-tax-cuts-and-jobs
United States Census Bureau. (2020). Income and Poverty in the United States: 2019. https://www.census.gov/content/dam/Census/library/publications/2020/demo/p60-270.pdf
U.S. Department of Treasury. (2020). CARES act. https://home.treasury.gov/policy-issues/coronavirus/about-the-cares-act
U.S. Department of the Treasury (2015). The Income Tax Treatment of Married Couples. Office of Tax Analysis. Retrieved from https://home.treasury.gov/system/files/131/Two-Earner-Penalty-and-Marginal-Tax-Rates.pdf
Weissman, J. (August 8, 2013). Martin Luther King’s Economic Dream: A Guaranteed Income for All Americans. The Atlantic. Washington, DC. Retrieved from https://www.theatlantic.com/business/archive/2013/08/martin-luther-kings-economic-dream-a-guaranteed-income-for-all-americans/279147/
Wolff, S. (2015). The state of lending in America & its impact on U.S. households: The cumulative costs of predatory practices. Center for Responsible Lending, Durham, NC. Retrieved from https://www.responsiblelending.org/sites/default/files/uploads/13-cumulative-impact.pdf
Yang 2020. (2020). The Freedom Dividend, Defined. Retrieved from https://www.yang2020.com/what-is-freedom-dividend-faq/ Building Our Opportunities to Survive and Thrive Act of 2019, H.R. 3590, 116th Congress.
Zewde, N. (2019). Universal Baby Bonds Reduce Black-White Wealth Inequality, Progressively Raise Net Worth of all Young Adults. Center on Poverty and Social Policy at Columbia University. Retrieved from https://static1.squarespace.com/static/5743308460b5e922a25a6dc7/t/5c4339f67ba7fc4a9add58f9/1547909624486/Zewde-Baby-Bonds-WP-10-30-18.pdf
Zewde, N. (Feb 2, 2020). How the Black Panthers Party Paved the Way for New Progressivism. Roosevelt Institute. Retrieved from https://rooseveltinstitute.org/black-panthers-paved-way-for-new-progressivism/