Embed Size (px)
Citation preview

U.S. Government work not protected by U.S. copyright 4B2-1
A GRAPH-BASED APPROACH TO NOMINAL TERMINAL ROUTING Shannon Zelinski, NASA Ames Research Center, Moffett Field, CA
Abstract
As the air transportation system moves toward trajectory-based operations, there is a greater need for route modeling, especially in the terminal airspace where traffic flows twist and turn and many do not follow any currently published route. This paper presents a graph-based algorithmic method for defining nominal terminal routing from historical flight tracks. First historical traffic is used to generate a directed graph. Then Djikstra’s shortest path algorithm is used to identify the shortest yet most commonly used paths through the graph. There were many different nominal routes between different engine types due to the distinct differences in engine performance characteristics. A comparison of graph-based shortest path routes to two other methods (manual and k-means) showed how the method could rapidly produce similar distinct dominant terminal area flows. Finding shortest paths from all links of a sufficient weight, rather than just source nodes, identified more route options depicting standard path control techniques in addition to the dominant route. This method may be used to rapidly prototype route models to assess trajectory-based terminal area concepts.
Introduction There are many concepts being developed to
address capacity and safety challenges in high density terminal airspace. Several of these require nominal arrival and departure paths to be defined to/from runways to take advantage of a more predictable trajectory based environment. The Terminal-Tactical Separation Assured Flight Environment [1] concept uses nominal terminal routing to approximate horizontal flight intent and aid it's conflict detection algorithms. Automation concepts utilizing precision schedulers [2, 3] use terminal arrival routes defined all the way to the runway to precisely schedule arrivals to not only the runway, but to upstream merge points. Several concepts provide visual controller aids relative to terminal arrival routes to facilitate merging and spacing [4, 5].
A number of simulation environments have been developed to assess these and similar trajectory-based terminal area concepts. These range from time-based queuing [6-8], to trajectory-based fast-time [9,10], to human-in-the-loop [11] simulation environments. All of these simulation environments require models of existing real-world or researcher-designed routes to accurately assess concepts. Many of today's published routes do not contain details between the meter fixes and runways. Because aircraft generally follow the same nominal paths or flows, historical track data can be used to design research models of arrival and departure trajectories. Route design methods are needed to identify not only distinct nominal terminal area arrival and departure flows while ignoring outliers, but standard path control techniques controllers use to manage the traffic. Ideally, these methods should also require low manual effort to allow the assessment scope to expand as the concept requires.
Terminal route models have been developed largely manually [12], sometimes with the aid of trajectory visualization and design software [13-15]. But this is still a lengthy process that has limited concept assessment scope. For example, most Trajectory Analysis and Modeling Environment [10] assessments have been scoped to Houston Intercontinental and most terminal area Multi Aircraft Control System [11] assessments have been scoped to Los Angeles International.
Leiden and Atkins [16] presented two algorithmic trajectory bundling methods to define nominal terminal area routing: a ridge detection method and a k-means method. The ridge detection method could easily identify route segments of high density but there were gaps between segments where no ridge could be detected. The k-means method could identify fully connected routes without any gaps but its heuristic search approach required it to run many times with different seeds before converging to a global minima and the number of desired routes was required as an input. Leiden and Atkins addressed these difficulties by clustering hierarchically to achieve quicker convergence, and by

4B2-2
using the number of ridges found with the ridge detection method to estimate the number of desired routes. However, this method does not filter outliers, thus many of the subtleties of terminal area routing may be lost due to blending dominant flows with those that are distinct yet less dominant.
This paper presents another algorithmic method for defining nominal terminal routing using graph representations of historical flight tracks. Unlike the k-means method, this graph-based method is deterministic and self defines the number of nominal routes identified. When the graph is searched for dominant flows, outliers are ignored, which avoids blending multiple distinct flows. This method is used to identify not only the nominal routes, but commonly used path control techniques such as path stretches and shortcuts, making it well suited to aid prototyping of terminal area route models for concept assessment.
Method Previous work defined route structure
representing en-route traffic patterns by clustering individual flight trajectory intersections into nodes and then defining links between nodes [17]. Unique properties of terminal airspace, such as frequent turns and higher degree of precision required, made it difficult to directly apply the en-route technique to the terminal area. This section describes a node-link graph routing method designed specifically for terminal area traffic.
Determining Flight Runway Assignment Before generating nominal routes, flight track
data were filtered to arrivals or departures of a single airport runway and engine type. This was done because paths to different runways are often segregated some distance from the runway thresholds, and performance variation often precludes using the same path for different engine types. The flight track data included aircraft type used to determine engine type, but it did not contain accurate runway assignment information. Therefore, arrival and departure runway assignments were determined by runway relative position and course of tracks just prior to arrival or after departure.
Figure 1 shows the metrics used to assign arrival and departure runways. Each track point was rotated to a coordinate system with origin at the runway threshold and the positive x-axis oriented along the runway. The black dot in Figure 1 represents the runway threshold and the thick black arrow points along the runway. The dashed black lines represent the x- and y-axes with origin at the runway threshold. The large orange dot represents the track point position where x and y are the track point coordinates relative to the runway. The track point course relative to the runway is labeled as ω. For arrivals, the track point course is calculated relative to the previous track point. Departure track point course is calculated relative to the next track point.
Figure 1. Runway Assignment Metrics
The track point must be within the gray shaded area to meet the criteria for a given runway assignment. For arrivals, this region is a rectangle defined by ymin, ymax, xmin, and xmax shown in Figure 1. In addition, abs(ω) must be less than a given ωmax not shown in the Figure. The last three track points prior to crossing the runway threshold must meet these criteria to be assigned the arrival runway. If a flight met the criteria for more than one runway, as was often the case with closely spaced parallel runways, the runway that produced the smallest abs(y) for the last track point was assigned.
Departure runway assignment was more complicated due to common sharp turns just after departure. For departures, the gray rectangle’s y dimension must be larger than for arrivals to accommodate these turns. Also, the rectangle corners closest to the runway threshold are cut off by defining a θmax relative to xmin. Assuming xmin is a

4B2-3
likely minimum wheels-off point, even sharp turning departures are not likely to enter theses cut off corners. Finally, it was assumed that tracks with abs(y) more than a given yω were turning and their course should be in a similar direction requiring that y and ω have the same sign. Only the first departure track must meet these criteria to be assigned the departure runway. As with arrival assignments, if more than one runway met the criteria, the runway producing the smallest abs(y) was assigned.
Table 1 shows the criteria values used to assign arrival (Arr) and departure (Dep) runways. Values for x and y are in nmi and values for ω and θ are in degrees. Arr x and y values are based on runway assignment criteria used by Robinson and Kamgarpour [18]. Arr ωmax and all Dep values were determined based on trial and error such that reasonable runway assignment results could be achieved at different airports using the same values.
Table 1. Runway Assignment Criteria
xmin xmax ymin ymax ωmax θmax yω
Arr -10 0 -.25 .25 10
Dep .75 4 -.5 .5 60 45 .1
Reasonable runway assignments were verified visually for at least one randomly chosen day for each airport. Figure 2 shows an example visual verification for Los Angeles International (LAX) arrivals to 24R and 25L and departures from 24L and 25R on February 4, 2010. The three vectors prior to crossing the arrival runway threshold are shown for arrivals and the first vector after departure is shown for departures. This method does not account for missed approaches, nor will it assign all flights to a runway. For the example shown in Figure 2, 13% of arrivals and 3% of departures were unassigned. Because the purpose of these assignments is to identify nominal routes, unassigned flights only serve to filter possible outliers.
Figure 2. Runway Assignment Verification
Generating the Node-Link Graphs For each runway assignment made, the runway
threshold point was added to the end of arrival trajectories or to the beginning of departure trajectories. The sequence of all departure tracks was reversed so that they could be processed like arrivals.
Each flight trajectory was then simplified using the Douglas-Peucker algorithm [19] with a distance dimension of 0.5 nmi in x-y space. This tended to leave vertices at turning points with straight-line segments in between. An agglomerative method was used to cluster vertices of all the simplified flight trajectories of the same engine type assigned to the same runway. Even though departure trajectories were reversed, they were clustered separately from arrivals.
Initial vertex clusters were generated by defining a 0.2 nmi resolution x-y density map of the vertices. Each cluster position was given by the average position of it's vertices and cluster weight was given by the number of vertices. Then, in order of decreasing weight, each cluster was merged with all other clusters within a distance threshold of 1.5 nmi. This step iterated until all clusters were separated by at least the threshold distance.
The resulting clusters were used as nodes to generate a directed graph. Each adjacent pair of vertices along a simplified flight trajectory that belonged to different nodes contributed to a link between those nodes. Link weight was given by the number of unique flights contributing to the link. For any set of flight track data to a single airport runway, there should be multiple source nodes identifying where flights entered the terminal airspace, and a single sink node identifying the runway threshold.

4B2-4
A nominal route from each source node to the runway sink node was found using Dijkstra's algorithm [20]. Each link was assigned a cost equal to its Euclidean distance in x-y space (d) divided by its weight (w). The shortest path found using this cost definition tended to minimize the total path distance while maximizing the weights of chosen links. In order to control relative emphasis placed on minimizing path length or maximizing weight, the cost function became J=da/wb, where a and b were used to weight d and w. The shortest path graph links were reweighted according to the number of flights whose path from a source to sink traveled the link.
Figure 3 shows the shortest path graph results for 14,316 Los Angeles International Airport (LAX) 24R jet arrivals taken from 52 24-hour traffic samples between February 4 and May 6, 2010. The cost function weights, a and b, were both set to 1. Darker thicker blue lines represent higher weight links. Nodes are shown as orange dots. The graph overlays gray dashed lines representing original simplified flight tracks used to create the graph. The shortest path graph has a tree structure where branches of the tree merge and increase in weight until all paths lead to a single sink.
Figure 3. Shortest Path Graph
Filtering the Shortest Path Graphs The shortest path graph still had many low
weight paths that needed filtering. This was partially caused by some truncated flight track data generating
source nodes well into terminal airspace. Leaves of the tree were pruned to a desired minimum link weight wmin. In addition, all leaves closer than a desired minimum Euclidean distance from the runway dmin were pruned. Figure 4 shows the shortest path graph from Figure 1 filtered using wmin = 100 and dmin = 30 nmi. Note that the only difference between Figure 3 and 4 is that many nodes and low weight links have been removed in Figure 4 so that only the most dominant routes remain.
Figure 4. Filtered Shortest Path Graph
Refining the Shortest Path Graphs Finally, the filtered shortest path graph was
refined to a minimal set of nodes and links to represent nominal routes. This included creating nodes at intersections, consolidating links that partially overlapped, and removing unnecessary nodes along straight paths. In between each step, the shortest path from all source nodes to sink, and shortest path graph filtering was repeated. Figure 5 illustrates the refinement steps on a portion of the filtered shortest path graph from Figure 4.
Figure 5A shows the original filtered shortest path graph. Because links, (6,5) and (7,1) intersect, a new node is created at the intersection labeled 9 in Figure 5B. The new shortest path from node 6 to 1 now travels straight from node 9 to 1 rather than going through 5, so link (9,5) is removed. Link (5,1) remains in Figure 5B because node 5 served as a source node for more than wmin = 100 flights.
The next step, from Figure 5B to 5C, locates and merges all nodes with their closest neighboring link

4B2-5
within 0.5 nmi. Nodes 5, 6, and 8 all merge with their closest neighboring link. This consolidates partially overlapping links and more appropriately positions merge points.
Finally, between Figure 5C and 5D, unnecessary nodes along fairly straight paths are removed. Unnecessary nodes were identified using the Douglas-Peucker algorithm with a distance dimension of 0.5 nmi in x-y space, as was used to simplify original flight trajectories. Nodes 5, 2, and 3 are removed because they deviate less than 0.5 nmi from a straight line between nodes 4 and 1. Similarly, node 9 is removed because it deviates less than 0.5 nmi from a straight line between nodes 7 and 1.
Figure 5. Graph Refinement
Results Nominal routes in Southern California
TRACON (SCT) were generated using the graph-based method. The data analyzed consisted of 52 24-hour Center/TRACON Automation System [21] recordings of TRACON flight plan and track data between February 4 and May 6, 2010. Flights were assigned to runways with no distinction made
between instrument and visual operations. Observations were made between arrival and departure routes for different engine types. Engine types were analyzed separately because performance variation often precludes using the same path for different engine types. The graph-based routes were also compared with routes generated manually [12], and with routes generated using the k-means method [16].
Route Comparison by Engine Type For the 52 days of SCT track data analyzed, the
most frequently assigned runways were LAX 24R and 25L for arrivals, and 24L and 25R for departures. LAX flights mainly consist of jets and turboprops. One of LAX’s smaller satellite airports Orange County (SNA) 19R, was the most assigned SCT arrival and departure runway for pistons. Together, these runways represent all 3 engine types, arrivals and departures, and large and small airports for graph-based route analysis. Table 2 shows an engine type break down of numbers of flights mapped to each of these LAX and SNA runways over the 52 days of track data.
Table 2. Number of Flights by Engine Type
Runway Jet Turbo Piston
Arr
ival
LAX 24R 14,316 1,728 11
LAX 25L 13,653 1,269 12
SNA 19R 4,460 323 317
Dep
artu
re LAX 24L 12,068 1,446 5
LAX 25R 14,493 883 7
SNA 19R 7,208 543 1,582
Figures 6 and 7 show LAX graph-based arrival and departure routes, respectively. Boxes at the upper right of each Figure magnify routes near the runways shown in orange. Only jet and turboprop routes are shown because there were too few piston flights to generate routes.

4B2-6
Figure 6. LAX Arrival Routes by Engine Type
Figure 7. LAX Departure Routes by Engine Type
There are significant differences between jet and turboprop routes. Turboprops tend to use more direct routes somewhat segregated from jets. Departure and arrival routes appear to be well segregated as well, crossing more orthogonally closer to the runway.
Figure 8 shows SNA 19R graph-based arrival and departure routes together with magnified runway area in the lower left. Because of the lower volume of flights, SNA routes were generated for a minimum link weight of wmin = 25 versus wmin = 100 for LAX. Contrary to LAX, jet and turboprop routes appear very similar for both arrivals and departures. It is the
piston routes that are segregated from the rest. For the most part, arrival and departure routes are segregated. However, there are a few segments where arrivals and departures follow the same path, presumably within different altitude ranges. Most noticeably, one piston departure route turns North to follow the same path as the only major piston arrival route generated.
Figure 8. SNA Arrival and Departure Routes by Engine Type
In general, departure routes tend to display less clean branching that occur much closer to the airport than arrival routes. This is because, other than to avoid arrival routes, departure fanning to their various destinations requires less precision than arrivals merging to a single runway.
Route Comparison by Method The graph-based routes from Figures 6-8 were
compared to results from two other route generation methods, manual and k-means.
The manual routes [12] were developed for use in high-fidelity human-in-the-loop simulations of LAX. They included arrival and departure procedures (including altitude restrictions) between en-route transition waypoints in center airspace and runway

4B2-7
thresholds for six SCT airports including LAX and SNA. Three stages of terminal routes were considered, en-route transitions, common routes, and runway transitions. Published STARs (Standard Terminal Arrival Routes) and SIDs (Standard Instrument Departures) and four days of track data were analyzed to manually build runway transitions between the end of STARs or the beginning of SIDs and runway thresholds where none existed, and to modify STARs and SIDs where the dominant flow pattern appeared to deviate. In addition, routes were created where dominant flows did not follow any published STARs or SIDs, and any unused STARs and SIDs were deleted.
The k-means routes [16] were developed for use in medium-fidelity fast-time simulations of congested multiple-airport terminal areas, also know as metroplexes. Three-dimensional routes were developed for several metroplex terminal areas including SCT. A separate ridge method was used to determine the desired k number of routes to represent a given set of trajectories. Then each trajectory was sampled to have the same number of waypoints. The average Euclidian distance of trajectory waypoints from their counterpart waypoints along candidate routes served as the distance function for k-means clustering. A final processing step merged the resulting individual routes to a connected network, with a method similar to the step depicted from Figure 5B to 5C, to ensure that all network points were either merge/diverge points or more than a distance threshold from any other network segment. K-means routes were generated for a single day’s worth of either arrivals or departures to/from a single airport.
Figures 9, 10, 11, and 12 compare manual, graph-based, and k-means routes for LAX arrivals, LAX departure, SNA arrivals, and SNA departures, respectively. K-means routes prior to the merging step are shown because the 3 nmi distance threshold distorted the result far more than the 0.5 nmi threshold used for the graph-based routes. Only manual and graph-based route waypoints are shown because they represent turn and merge points, and published fix locations in the case of manual routes. Whereas k-means waypoint locations were the result of sampling the trajectories every 8 to 12 nmi.
All three methods display similar en-route transitions and common routes with differences mainly in routes that were filtered due to an absence of critical traffic volume.
Figure 9. LAX Arrival Routes by Method
Figure 10. LAX Departure Routes by Method

4B2-8
Figure 11. SNA Arrival Routes by Method
Figure 12. SNA Departure Routes by Method
More noticeable differences are observed for runway transitions, especially in LAX. The resolution of k-means routes is too large to accurately represent more detailed flight path behavior closer to the runways. Therefore, Figures 9-12 show k-means routes up to the last point before the runways. The final segment would connect directly to some mid point over the airport. The insufficient resolution is most apparent in Figure 9 where arrivals from the West appear to bypass their base turn onto the final approach. In addition, inappropriate choice of k can cause blending of distinct flows to create a flow where none exists. This can be seen best in SNA arrivals. Figure 13 shows a close-up of Figure 11 including flight tracks in gray.
Figure 13. K-Means Blending Example
Both manual and graph-based routes show arrivals from the North-North-West taking two distinct routes to the runway. The k-means route shown is a blending of these two routes where there is no observable flow pattern from track data. Leiden and Atkins solved this problem with hierarchical clustering and demonstrate it on New York TRACON [16] where runway transitions diverging from a single common route are both large enough flows. However, as seen in Figure 8, the Northern runway transition is primarily used by pistons. There may be four times as many jets and turboprops on the other transition route, prompting the k-means method to ignore the diversion and treat it as a single route. This nuance may have a larger impact on both a scheduling concept assessment as the k-means route is more than three nmi shorter than in reality, and a conflict detection concept assessment as the k-means is displaced more than three nmi.
The manual and graph-based LAX arrival routes in Figure 9 are quite similar close to the runway, turning onto final approach in similar locations. However, LAX departure routes in Figure 10 are quite different close to the runway. Manual routes show a departure loop from each runway that flights may take to gain altitude over the runways and head North East. The two-dimensional graph-based routes bypass the loop to shorten the path and head North East directly from the runway. The runways are in West flow configuration, so the direct North East departure routes would not be flyable. The k-means North East departure route actually captures the looping behavior in lower resolution because the departure start point shown is to the West of the runways. This suggests that the graph-based method should be adapted to three-dimensions.

4B2-9
Even without the loop departures, the manual method produced more LAX departure runway transition paths than either of the algorithmic methods. These included published and new runway transitions along with common bypasses to the same common route. The graph-based method produces route networks with a tree structure such that there may be many en-route transition paths merging into fewer common routes, merging in to even fewer runway transition paths. This tends to produce more en-route transition paths and fewer runway transition paths than the manual method.
The k-means method groups entire trajectories together, not just the en-route or runway transitions or common routes. Even with higher resolution, the strongest clusters would minimize great distances between en-route transitions rather than the smaller distances between runway transitions. Distinct runway transition would only be captured if all the flights using the same en-route transition also used the same runway transition.
Other than dimensionality, the graph-based routes differ from the other two methods in that they represent specific engine types. As seen in the previous section, nominal flight paths between the different engine types can differ significantly to segregate slower from faster aircraft until they are very close to the runway. Many of the manual routes that graph-based captured and k-means did not are LAX turboprop or SNA piston routes. This would be a simple matter for most route generation methods to fix by adding engine type, runway and arrival/departure as trajectory filtering parameters.
Increasing Route Options The defining characteristic of graph-based
method is its selection of a single dominant distinct traffic flow path. The strength of this method is that it filters less common paths such as vectored path stretches and shortcuts. On the other hand, in busy TRACONS, the dominant path may include some nominal delay. Also, if multiple runway transitions exist from a single common route, the method will select only the shortest path as defined by its cost function. The segregation of routes by engine type may appear to defy this structure when different engine types use similar common routes but very different runway transitions. But this still will not
capture multiple route options available to a single flight.
One way to develop more route options is to vary the exponents a and b in the shortest path cost function J=da/wb. However, this only captures a variation of routes where path distance is at odds with weight, i.e. where longer routes are more commonly used and shorter routes are less commonly used. This is more often the case for arrivals than departures. Therefore departure routes tend to change very little as a and b are varied.
Figure 14 shows arrival routes for a range of a and b. For constant b = 1.0, a was varied between 0.0 and 1.0 in increments of 0.1. Also, for constant a = 1.0, b was varied between 0.1 and 1.0 in increments of 0.1. Results for b=0.0 are not shown because the routes are unrealistic and obstruct the other routes.
Figure 14. Effects of Varying Cost Function
Dark blue lines represent the original a=b=1.0 routes. All additional routes are shown in a lighter blue. Reducing a did not have an effect on LAX 24R routes. Therefore, all lighter blue routes shown represent less commonly used shorter routes when b was reduced. For contrast, Chicago O’Hare (ORD) 09R arrival routes are shown on the right of Figure 14. Here, path stretching is so common that the a=b route from the North that then curves West appears to be a path stretch. Two longer and even more common path stretch routes labeled as a<b curve out farther West. Two a>b routes bypass the path stretch and merge with another stream from the East.
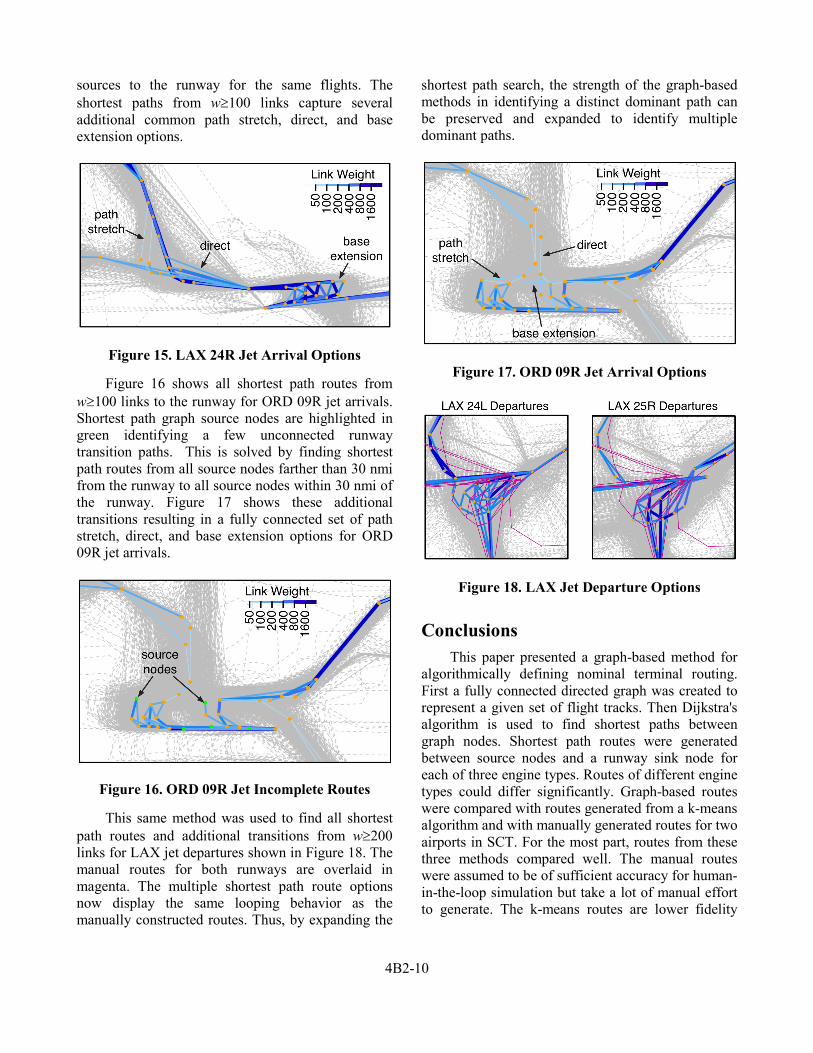
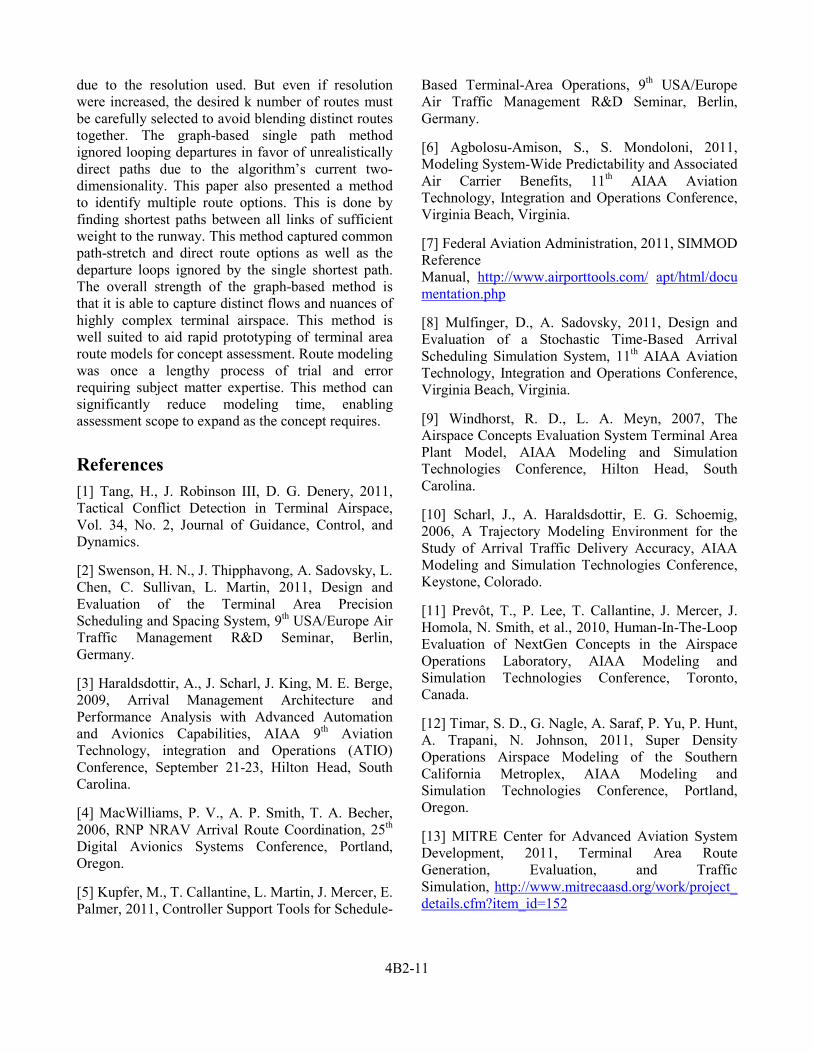
Another way to develop more route options is to expand the shortest path search beyond source to sink pairs. Figure 15 shows LAX 24R jet arrival shortest paths to the runway from all original graph links representing at least 100 flights (w≥100). Compare this to Figure 3, which shows shortest paths from all
4B2-10
sources to the runway for the same flights. The shortest paths from w≥100 links capture several additional common path stretch, direct, and base extension options.
Figure 15. LAX 24R Jet Arrival Options
Figure 16 shows all shortest path routes from w≥100 links to the runway for ORD 09R jet arrivals. Shortest path graph source nodes are highlighted in green identifying a few unconnected runway transition paths. This is solved by finding shortest path routes from all source nodes farther than 30 nmi from the runway to all source nodes within 30 nmi of the runway. Figure 17 shows these additional transitions resulting in a fully connected set of path stretch, direct, and base extension options for ORD 09R jet arrivals.
Figure 16. ORD 09R Jet Incomplete Routes
This same method was used to find all shortest path routes and additional transitions from w≥200 links for LAX jet departures shown in Figure 18. The manual routes for both runways are overlaid in magenta. The multiple shortest path route options now display the same looping behavior as the manually constructed routes. Thus, by expanding the
shortest path search, the strength of the graph-based methods in identifying a distinct dominant path can be preserved and expanded to identify multiple dominant paths.
Figure 17. ORD 09R Jet Arrival Options
Figure 18. LAX Jet Departure Options
Conclusions This paper presented a graph-based method for
algorithmically defining nominal terminal routing. First a fully connected directed graph was created to represent a given set of flight tracks. Then Dijkstra's algorithm is used to find shortest paths between graph nodes. Shortest path routes were generated between source nodes and a runway sink node for each of three engine types. Routes of different engine types could differ significantly. Graph-based routes were compared with routes generated from a k-means algorithm and with manually generated routes for two airports in SCT. For the most part, routes from these three methods compared well. The manual routes were assumed to be of sufficient accuracy for human-in-the-loop simulation but take a lot of manual effort to generate. The k-means routes are lower fidelity
4B2-11
due to the resolution used. But even if resolution were increased, the desired k number of routes must be carefully selected to avoid blending distinct routes together. The graph-based single path method ignored looping departures in favor of unrealistically direct paths due to the algorithm’s current two-dimensionality. This paper also presented a method to identify multiple route options. This is done by finding shortest paths between all links of sufficient weight to the runway. This method captured common path-stretch and direct route options as well as the departure loops ignored by the single shortest path. The overall strength of the graph-based method is that it is able to capture distinct flows and nuances of highly complex terminal airspace. This method is well suited to aid rapid prototyping of terminal area route models for concept assessment. Route modeling was once a lengthy process of trial and error requiring subject matter expertise. This method can significantly reduce modeling time, enabling assessment scope to expand as the concept requires.
References [1] Tang, H., J. Robinson III, D. G. Denery, 2011, Tactical Conflict Detection in Terminal Airspace, Vol. 34, No. 2, Journal of Guidance, Control, and Dynamics.
[2] Swenson, H. N., J. Thipphavong, A. Sadovsky, L. Chen, C. Sullivan, L. Martin, 2011, Design and Evaluation of the Terminal Area Precision Scheduling and Spacing System, 9th USA/Europe Air Traffic Management R&D Seminar, Berlin, Germany.
[3] Haraldsdottir, A., J. Scharl, J. King, M. E. Berge, 2009, Arrival Management Architecture and Performance Analysis with Advanced Automation and Avionics Capabilities, AIAA 9th Aviation Technology, integration and Operations (ATIO) Conference, September 21-23, Hilton Head, South Carolina.
[4] MacWilliams, P. V., A. P. Smith, T. A. Becher, 2006, RNP NRAV Arrival Route Coordination, 25th Digital Avionics Systems Conference, Portland, Oregon.
[5] Kupfer, M., T. Callantine, L. Martin, J. Mercer, E. Palmer, 2011, Controller Support Tools for Schedule-
Based Terminal-Area Operations, 9th USA/Europe Air Traffic Management R&D Seminar, Berlin, Germany.
[6] Agbolosu-Amison, S., S. Mondoloni, 2011, Modeling System-Wide Predictability and Associated Air Carrier Benefits, 11th AIAA Aviation Technology, Integration and Operations Conference, Virginia Beach, Virginia.
[7] Federal Aviation Administration, 2011, SIMMOD Reference Manual, http://www.airporttools.com/
[8] Mulfinger, D., A. Sadovsky, 2011, Design and Evaluation of a Stochastic Time-Based Arrival Scheduling Simulation System, 11th AIAA Aviation Technology, Integration and Operations Conference, Virginia Beach, Virginia.
apt/html/documentation.php
[9] Windhorst, R. D., L. A. Meyn, 2007, The Airspace Concepts Evaluation System Terminal Area Plant Model, AIAA Modeling and Simulation Technologies Conference, Hilton Head, South Carolina.
[10] Scharl, J., A. Haraldsdottir, E. G. Schoemig, 2006, A Trajectory Modeling Environment for the Study of Arrival Traffic Delivery Accuracy, AIAA Modeling and Simulation Technologies Conference, Keystone, Colorado.
[11] Prevôt, T., P. Lee, T. Callantine, J. Mercer, J. Homola, N. Smith, et al., 2010, Human-In-The-Loop Evaluation of NextGen Concepts in the Airspace Operations Laboratory, AIAA Modeling and Simulation Technologies Conference, Toronto, Canada.
[12] Timar, S. D., G. Nagle, A. Saraf, P. Yu, P. Hunt, A. Trapani, N. Johnson, 2011, Super Density Operations Airspace Modeling of the Southern California Metroplex, AIAA Modeling and Simulation Technologies Conference, Portland, Oregon.
[13] MITRE Center for Advanced Aviation System Development, 2011, Terminal Area Route Generation, Evaluation, and Traffic Simulation, http://www.mitrecaasd.org/work/project_details.cfm?item_id=152

4B2-12
[14] CSSI, Inc., 2011, Terminal Area Route Generation, Evaluation and Traffic Simulation Software Brochure, http://targets.cssiinc.com/external/downloads/documents/TARGETS-Brochure.pdf
[15] Callantine, T., 2008, An Integrated Tool for NextGen Concept Design, Fast-Time Simulation, and Analysis, AIAA Modeling and Simulation Technologies Conference, Honolulu, Hawaii.
[16] Leiden, K., S. Atkins, 2011, Trajectory Clustering for Metroplex Operations. 11th AIAA Aviation Technology, Integration and Operations Conference, Virginia Beach, Virginia.
[17] Zelinski, S., M. Jastrzebski, 2012, Defining Dynamic Route Structure for Airspace Configuration, Vol. 226, No. 9, Proceedings of the Institution of Mechanical Engineers, Part G, Journal of Aerospace Engineering, pp. 1161-1170.
[18] Robinson III, J.E., M. Kamgarpour, 2010, Benefits of Continuous Descent Operations in High-Density Terminal Airspace Under Scheduling Constraints, 10th AIAA Aviation Technology, Integration and Operations Conference, Fort Worth, Texas.
[19] Douglas, D. H. and T. K. Peuker, 1973, Algorithms for the Reduction of the Number of Points Required to Represent a Digitized Line or It’s Caricature, Vol. 10, No. 2, Cartographica: The International Journal for Geographic Information and Geovisualization, pp. 112-122.
[20] Cormen, T. H., C. E. Leiserson, R. L. Rivest, C. Stein, 2001, Section 24.3: Dijkstra’s algorithm, Introduction to Algorithms (Second Edition), MIT Press and McGraw-Hill, pp. 595-601.
[21] De Los Santos, V., 2008, Research Foundations Main, NASA Ames Aviation Systems Division, NASA Ames Research Center, http://www.aviationsystemsdivision.arc.nasa.gov/ research/foundations/index.shtml
Email Addresses [email protected]
31st Digital Avionics Systems Conference
October 14-18, 2012