Embed Size (px)
Citation preview

A Global Value Chains Approach to
Food, Healthy Diets, and Childhood Obesity*
Gary Gereffi Director, Center on Globalization, Governance & Competitiveness
Department of Sociology
Michelle Christian Department of Sociology
Duke University
Durham, NC / USA
WHO Early-Stage Expert Meeting Trade and Healthy Diets
Developing policy coherence at national and international levels
to promote healthy diets and prevent childhood obesity
November 12 and 13, 2007-10-16 Executive Institute, Desautels Faculty of Management
McGill University, Montreal, Canada *The authors gratefully acknowledge the valuable research assistance they received in preparing this paper from Joonkoo Lee, Kim Rogers, Yisel Valdes, and Aileen Zhang.

1
Table of Contents
I. Abstract 2
II. Introduction 3
III. Background 5
• Trends in Childhood Obesity 5 • Need for Multilevel Analysis of Childhood Obesity 6 • Building a Global Value Chain Framework 9
IV. Conclusion 18
V. Appendix A: Company Case Examples of Conducting GVC Analysis 24 for Childhood Obesity
• McDonald’s 27 • Yum! Brands (KFC) 30 • Kraft 35 • Nestlé 38 • PepsiCo 40
VI. Appendix B: Country Case Examples of Conducting GVC Analysis 44 for Childhood Obesity
• China 44 • Mexico 48
VII. References 54

2
I. Abstract
A challenge associated with the nutrition transition in developing countries (i.e.,
simultaneous presence of over-nutrition and under-nutrition, both being most prevalent in the
poorest population segments) is the integration of their markets into the global economy.
This integration determined rapid and strong changes in the production and trade of agricultural
goods in the developing countries as well as growing foreign direct investments in food
processing and retailing, and the expansion of food advertisements with obvious implications for
dietary patterns and the risk of obesity. For instance, changes in the production and trade of
agricultural goods can easily explain the recent increase in the consumption of vegetable oils
seen in most developing countries while changes in both foreign direct investments and global
food marketing have certainly facilitated the consumption of highly-processed, energy-dense,
nutrient-poor foods. This paper will examine issues related to local and global trade and
governance issues in global and local chains in this context. It will provide a new
understanding of how local and global trade and governance interact, highlighting power and
inequality in global chains but also identifying scope for local action for more coherence
between health and trade in food and diets.
3
II. INTRODUCTION
Today childhood obesity is widely recognized as a major global health problem in both
developed and developing countries. The slow build-up of childhood obesity awareness over the
last twenty-plus years reached an accelerated pace beginning in the early 2000s as witnessed
through the confluence of increased conferences, NGO initiatives, and public awareness. This
awareness is coupled with the alarming data that shows the drastic rise of childhood obesity rates
in developed countries since the 1960s and the growing childhood obesity rates in developing
countries since the 1980s. Along with this build-up, a consensus is emerging that the study of
childhood obesity should cease focusing on a sole medical interventionist model or single levels
of analysis. Building upon Glass and McAtee’s1 call for an integration of the natural, behavioral,
and social sciences to study childhood obesity, we address how a global value chains (GVC)
approach is a useful analytic framework to conduct multilevel research. Researchers who use a
GVC paradigm to study childhood obesity would identify how some of the main international
and corporate factors related to changing food production, technology, and development
strategies are linked to consumption patterns around the world. These consumption patterns may
allude to unhealthy diets and the risk factors associated with the increased prevalence of
childhood obesity.
We outline in this paper our case for using a GVC approach to study childhood obesity.
First, we review the evidence regarding the increased prevalence of childhood obesity in
developed and developing countries. Second, we use Glass and McAtee’s article as a foundation
to conceptualize the multiple determinants of childhood obesity that are positioned on varying
levels of analysis (global, macro, meso, micro, and ‘underwater’). With their framework, we
begin to piece together how a GVC analysis can be an effective model to capture specific

4
interactions and linkages that connect the levels. Particular attention is given to the United States
to demonstrate how a multilevel analysis may be visualized. The United States case highlights a
variety of determinants linked to two broad variables: a deleterious change in food consumption
patterns (e.g., an increase in fast foods, processed foods, soft drinks, and snacks), driven by
powerful corporate marketing campaigns oriented to youth; and a shift to a more sedentary
lifestyle. Breaking down the determinants and levels of the U.S. provides a case example to
compare developing countries to. Moreover, it highlights the strength of lead firms (e.g., food
and beverage manufacturers and fast-food chains) in shaping local consumption patterns. These
lead firms then become a key factor in connecting local food production and technological
changes in the United States to an overall global shift. Third, we diagram the key analytic terms
and segments of a GVC framework. A series of global processes, such as international trade,
foreign direct investment, and the diffusion of Western cultural norms, are examined in terms of
their impact on changing consumption patterns in developing societies and their connection to a
GVC approach.
Lastly, in appendix A and B we highlight preliminary data gathered on five corporations
and two developing countries to show how a GVC framework can be a useful tool for studying
rising childhood obesity rates in developing countries. Multinational corporations (MNCs) are
lead firms in the food GVC, and we look at the global brands, sales, and corporate social
responsibility initiatives of several MNCs (Yum! Brands, McDonald’s, Kraft, Nestle, and
PepsiCo) to highlight their ability to affect change at multiple levels of the global system and
particularly in the societal level with the examples of China and Mexico. The new research
agenda suggested by the GVC framework implies an interactive model of global and local food
value chains, whereby the most significant effect of trade, foreign direct investment, and the
5
diffusion of a “Western lifestyle” are mediated through imitative or adaptive behavior by
producers and consumers in developing country food systems.
III. BACKGROUND
Trends in Childhood Obesity
In 2005, the International Obesity Taskforce (IOTF) submitted their Briefing Paper on
the trends in childhood obesity in Europe to the European Union’s Platform on Diet, Physical
Activity and Health.2 In Figure 1, using available data from longitudinal surveys they show how
childhood overweight and obesity is seen to be accelerating rapidly for children (5-11) in key
countries like the United States, England, and Poland, with most countries showing an overall
increase trend. In the United States from 1970 to the late 1990s the number jumped from 15
percent to almost 30 percent while in England in the 1970s the number was roughly 7 percent but
jumped to over 25 percent since the 2000s. IOTF researchers estimated for the World Health
Organization (WHO) that one in five children in Europe is overweight and that an additional
400,000 children each year will become overweight.
Although Europe is showing increasing trends toward childhood obesity the United
States has consistently been the high reference point for developed countries. In Figure 2,
Anderson and Butcher highlight their calculations based on data from the National Health and
Nutrition Examination Surveys (NHANES) from 1971-2002.3 From 1971-74 over five percent
of children (12-19) were considered obese, whereas from 1980 and 1988-94 the share of obese
children practically doubled. By 2002, almost 15 percent of American children were designated
as obese with children (12-19) slightly leading children (6-11) at over 20 percent.
Unlike data from Europe and the United States, prevalence figures overtime in
developing countries is harder to come by, nevertheless, the consensus is that childhood obesity

6
is on the rise. The Oxford Health Alliance created a fact sheet on childhood obesity calling it a
“worldwide phenomenon.”4 Some of the figures they highlighted based on recent studies show
that Brazil, China, Mexico, and Thailand are just a few case examples of increasing childhood
obesity rates. They quote WHO figures that note the trend of obesity for children (5-12) rose
from 12.2 percent to 15.6 percent in just two years in Thailand. For Brazil, citing a study by
Wang and colleagues, they note how childhood obesity has seen a dramatic turn in Brazil from
1971 and 1997 with an increase from 4.1 percent to 13.9 percent. Popkin and Larsen argue that
the burden of nutritional problems is shifting from energy imbalance deficiency to excess among
older children and adolescents in developing countries, specifically Brazil and China. These
trends bring to our attention a trajectory of increased childhood obesity as a global phenomenon
no longer solely connected to the West. As we highlight further in our country case sections of
China and Mexico and with the GVC paradigm, the determinants of childhood obesity in
developing countries are connected to local cultural environmental factors, but also a broader
trend toward lifestyle change, connecting the diffusion of a “Western lifestyle” that is connected
to local dynamics in both unique and similar forms.
Need for Multilevel Analysis of Childhood Obesity
In order to understand how a global value chain framework that incorporates large
structural phenomena such as global processes can be connected to micro health related
outcomes like childhood obesity, we follow Glass and McAtee’s attempt to integrate the natural
and the social sciences. Glass and McAtee advocate that classic medical interventionist models
“have yet to demonstrate the expected efficacy of behavioral interventions to modify health
outcomes”5 (p1650) and that they ignore the larger social context that mitigates behavioral change.
For the researchers, there is a need to capture the role of social structure in how it interplays in

7
placing individuals or groups in a higher likelihood of partaking in “risky” behavior. Individual
behavior choices are a part of a social context that places “constraints,” “inducements,” and
“pressures” upon their environment and their ability to operate independent agency.
Glass and McAtee propose a three-dimensional “stream of causation” model of nested
hierarchies that moves away from a linear causal thinking toward a complex contextualism to
understand health outcomes. The “above water” segment of their model consists of four
hierarchical levels: global, macro, meso, and micro. These levels, which highlight different
social factors, induce and constrain health-related behaviors for all individuals. However, the
measurement process of determining how these factors “cause” childhood obesity is complex
because it challenges the typical counterfactural model of observational and intervention public
health studies. Glass and McAtee argue that
instead of arguing over what factors qualify as causes of disease, the focus should be on identifying potentially powerful levers of behavior change at the population level, regardless of whether those factors are causal in the traditional sense…[we should focus on] the social conditions of life that regulate behavioral risk, but do not strictly qualify as causal because their independent influences are weak, nonspecific, subject to temporal variation, and contingent on a series of probabilistic, intermediate processes.6(p1658)
The authors propose the concept of a “risk regulator” as a broad group of variables that capture
key parts of the social structure that influences behavior patterns. Risk regulators shape the
specific factors that may cause disease and index the “structured contingencies” of dimensions
which are external to individuals and also contingent due to context variation.
The framework Glass and McAtee proposes sketches the foundation of how a global
value chain approach assists us in understanding how global, macro, and mezzo level
determinants influence the risk of behavior characteristics that mitigate childhood obesity rates.

8
Before we connect the model to a global value chain approach, we can broadly map out how
Glass and McAtee’s multilevel analysis can be applied to the determinants of childhood obesity
in social science literature. In Figure 3, we highlight six levels at the vertical angle (global,
societal, institutional, group, and individual) and four broad factor categories on the horizontal
angle (demographic/ecological, economic/technological, regulatory/policy, and
cultural/symbolic). In each factor category we highlight specific variables that can
simultaneously be positioned on multiple levels. For example, under the first box
“demographic/ecological” we have three variables, “SES indicators,” “household structure” and
“built environment.” SES indicators are attributed both at the individual and group levels while
household structure can affect the individual, group, and societal levels; and lastly, built
environments affect the societal, institutional, group, and individual levels. All of these variables
correspond in unique ways to the different levels and researchers can choose to focus on multiple
levels or how the different levels are interconnected.
Within a GVC approach, our focus would be on how economic/technological and
regulatory/policy variables can affect predominately the global, societal, and institutional levels.
As we will discuss further in the next section, the factors of “food technology” change, “MNC
food production,” and “MNC advertising” can be viewed as risk regulators that impact food
consumption patterns for children at global, societal, and institutional levels and the group level
for advertising. The variables under the regulatory/policy box “international” bodies, “national
and local governments” and “schools and the local environment” provide the structured
contingencies that economic/technological variables are embedded in. With a GVC analysis we
have a framework that positions how these variables interact at the multiple levels of analysis
particularly at the global – local connections.

9
Most childhood obesity researchers make the connections to the above variables by
focusing on how they contribute to the “energy in” “energy out” phenomenon. Energy in relates
to the reasons why children consume specific foods, and energy out relates to their behavior
patterns of exhibiting an active or sedentary lifestyle. In Figure 47 we highlight determinants
using the literature on childhood obesity in the United States and model how they fit into the
energy in and out patterns along macro, meso, and micro levels. This example of the main social
determinants of the U.S. case points to how several levels are in action in modifying the behavior
and consumption patterns of children that may lead to childhood obesity. The top three
determinants, “corporate food culture,” “marketing to youth,” and “unhealthy diets” can all be
connected to the role of lead multinational food corporations in the United States. Their reach
and power expand to the influence they have over children and parents in providing “instant
food” options that cater to a modern culture, busy life, and youth perceptions. These MNCs are
the drivers of the global expansion of fast-food technology, processed food production, and
modern cultural norms to developing countries. The interactions they spark with the local food
economies are witnessed by the changing speed with which local food producers, manufacturers,
and retailers are supplying for global and local markets and how they are adopting multinational
businesses strategies and tailoring them to domestic needs.
Building a Global Value Chain Framework
We can use the basis of these determinants for the United States case in congruence with
Glass and McAtee’s model as a stage to advocate how a GVC paradigm can link together global
processes that are experienced through economic, political, and cultural broad factors at global,
societal, and institutional levels. Global processes can create and bolster the risk regulators and
the structural contingencies that may help us better understand the global rise of childhood

10
obesity. Although a GVC analysis is traditionally used to understand the mode of economic
globalization through industry lead firm inter-country linkages, the overall framework is a
helpful tool to analyze which actors are assisting in changing food consumption patterns and
food technological and development shifts in developing countries. These changes are radically
influencing the lifestyle choices, behavioral practices, and living standards of individuals in
countries going through a developmental transition which all can affect obesity rates.
Within the literature on childhood obesity there is a growing trend toward looking at how
the forces of globalization are changing food systems around the world, and hence the
consumption patterns that may lead to childhood obesity. Kennedy8 notes how food systems are
changing as a result of availability, diversity, and agricultural and production shifts. Most of
these studies discuss these shifts under a broad rubric of “globalization” that includes the
processes of urbanization, the rise in incomes, changes in agricultural supplies, changes in prices,
and western technological adoption. In these studies, the rise of urbanization around the globe is
attributed to uneven global trade and tariff regimes, export dumping, and agricultural subsides in
developed economies.9 10 Whereas the rise of SES in developing countries, due to economic
development, shifts the burden of childhood obesity from groups with higher SES to groups with
lower as a country’s GNP increases.11 Furthermore, how globalization is changing agriculture is
characterized by the switch to the use of agrochemicals and hybrid plants; the use of genetically
modified foods; the use of food processing designed for uniformity and a long shelf-life; and the
increase of imports of oilseeds and vegetable oils with new forms of caloric sweeteners.12 13
These forces are leading to price reductions in wheat, rice, and maize which are bolstered by
subsidies in developed countries. Moreover, milk and beef prices have also declined.

11
A GVC analysis14 puts the segments of the broad “globalization” story into a specific
framework to understand the actors (predominantly lead firms) and the mechanisms in place that
transmit global forms and solidify global relationships. These dynamics allow us to understand
the “consequences” of globalization as highlighted above. The global value chain incorporates
and analyzes the full range of activities corporations partake in to bring a product from its initial
conception to its end destination to the consumer. Their activities are spread over wide
geographic spaces. Since the second half of the twentieth century the global economy is
described as exhibiting increased fragmentation and increased dispersion. Firms are now
frequently breaking down the traditional vertically integrated business model and procuring parts
and services for a particular product from a growing net of producers, suppliers, and
manufacturers. This network reaches a global scale with predominately Western-based
multinationals sourcing production to countries around the world who often offer a weak
regulatory environment and inexpensive labor costs. GVC research consists of learning the
details of jobs, technologies, standards, regulations, products, processes, and markets in specific
industries and places.
The GVC model calls particular attention to specific analytic tools that dictate how the
chain is conceptualized and analyzed. First, we identify the actors in global industries, and how
their roles are changing. These actors are the lead firms of the industry and the firms who are
part of the supply chain. Second, we identify the linkages between GVC activities which are the
processes which connect firms to each other, within firms, and the wider networks that they are a
part of. Third, after identifying the firms and the linkages, we can identify the “governance”
practices that dictate how the chain operates and who controls the diffusion of technology,
standards, and codification within the chain. Traditionally, value chains were characterized as

12
either “producer driven” or “buyer driven.” A producer driven chain represents a more vertically
integrated relationship within the chain that connects the firms together in a tightly woven
relationship, whereas a buyer driven chain is characterized by independent firms having
relationships with key lead firms, mainly global buyers, who often dictate the standards for
suppliers to follow. More recently, a more complex typology of governance practices has arisen
where five different GVC governance patterns were identified: markets, modular, relational,
captive, and hierarchy.15 This five-part typology recognizes that there are new network forms of
organization within global value chains that alludes to some form of "explicit coordination"
beyond simple market transactions but which fall short of vertical integration. Lastly, the
coordination, power, and linkages of the global value chain would not be complete without an
analysis of the governments, unions, trade associations, NGOs, multi-lateral agencies, and
regulations which all influence the activities of the chain and its operation capabilities in unique
forms.
With the analytic tools put forth we can now attempt to connect the framework to the
global health phenomena of increased childhood obesity. The GVC framework that can be
applied to understanding childhood obesity entails creating the value chains for food production
systems. These food production systems have both global and local interactions. The lead firms
at the global level within these chains are the large fast-food brand names mainly based out of
the United States (e.g., McDonald’s, KFC, Wendy’s, Burger King, etc.) and the food and
beverage processing manufacturers (e.g., Kraft, PepsiCo, Coca Cola, Nestlé). These
corporations are supplied with their food inputs that go into their final products through several
stages of the production supply, processing, and retail chains that are connected on local and
global scales.
13
However, the local and global linkages of the fast-food and processed food global value
chains differ from typical indicators that are used to gauge a country’s level of foreign
penetration (particularly lead corporations) with a GVC framework. There are three
international processes that are connected to the global processes of a GVC framework that when
applied to food industries and its connection to childhood obesity outlines some important
“myths” regarding how we analyze global local interactions between developed and developing
countries. The three global processes of trade, foreign direct investment, and a diffusion of
“Western lifestyles” exhibit interesting findings when applied to food production systems that
ultimately highlight the adoption at the local level of Western practices. The amount of trade of
processed foods from developed countries to developing countries is often connected to rising
obesity rates, yet the reality is that processed food is only a small amount of developing countries
imports. A 2005 United States Department of Agriculture report16 highlights that only 10
percent of the $3.2 trillion dollar global processed food sales in 2002 are traded products. Thus,
the majority of processed foods is created “in-country” and is connected to local supply chains
and production facilities. This does not mean that Western firms are absent from the process,
rather it positions that the constant evolution of food markets are linked to a broader global
change in technology in developing countries and the linkages between the global supply chain
and prevailing policies that favor the adoption of Western supply chain dynamics in developing
countries.
Similar to the “trade” analysis of processed foods, foreign direct investment (FDI) as a
measure of foreign capital in a region is not a direct link to the presence of foreign penetration
specifically as it pertains to the fast-food industry. The prevailing wisdom is that FDI in fast-
food chains promotes childhood obesity in developing countries, but most fast-food

14
multinational corporations (MNCs) operate under the “franchise model.” The franchise model is
promoted by MNCs as a way for the corporation to grant the right for individuals to sell their
business model (i.e., use of the name, products, and business strategies) without putting-up initial
capital spending. The “franchiser” is the sole individual who has initial costs. In 2006, Yum!
brands which includes KFC, Pizza Hut, Taco Bell, Long John Silver’s, and A&W had total
worldwide sales of $31.1 billion dollars. $22.7 billion of that came from franchise sales.17 FDI
in global supermarkets is also considered to be increasing around the world and contributing to
the consumption of processed or “modern” foods. However, recent researchers have argued that
there is only indirect evidence of the effects of supermarkets on childhood obesity. The diffusion
of supermarkets in developing countries is still quite limited.18 The best way to understand FDI
and how it pertains to food systems in developing countries and childhood obesity is primarily
indirect and captured at the national and local levels through the adoption of Western products
and practices by domestic food systems.
The last global process connected to a GVC framework that has connections to childhood
obesity but is more complex to capture is the diffusion of “Western lifestyles.” A common
perception is that a Western lifestyle promotes a corporate food culture and an imitation of
unhealthy diets that may lead to childhood obesity. While this phenomenon appears to be
happening to a certain extent in developing countries it is predominately limited to urban and
high income segments of the countries, with considerably regional variations within countries.
We should not blanket Western cultural domination as an all encompassing phenomenon that
hits all segments of a population equally. Rather it is important to follow the stages of the
development process that bring forth Western lifestyle changes and the adoption of Western
practices at the local level. Nevertheless, even though the different forms of the stages of

15
Western development and adoption are apparent there also appears to be a form of convergence
taking place. Modern technology and advertising is leading to a convergence of Western
practices across regions and income levels with the rapid emergence of local foods and retail
imitators. The trend seems to be accelerating.
By showing the “real” story behind the typical “myths” of the role of trade, FDI, and the
diffusion of a Western lifestyle in developing countries and how it affects food systems points to
the indirect effects of how global processes influence childhood obesity rates. The “real” story
lies at the local level and the interactions between the global and local value chains. In Figure 5,
we highlight the interaction of global and local food value chains between developed and
developing countries. The chain incorporates food manufacturers and fast-food chains. Within
the global value chain level (the top four boxes) in developed countries we highlight “global
agro-businesses,” “MNC food manufacturers,” “global fast-food franchises,” and “global
retailers.” These segments of the chain are linked to each other at a global level and a local
level. Global agro-businesses, like chicken farms or tomato or lettuce farms, operate farms
across the world or buy crops from small and medium sized farms in local economies. They then
supply for either multinational manufacturers or multinational fast-food stores. The
manufacturers sell their processed products to fast-food chains and global retailers.
Each segment of the chain is dictated by the strongest lead firms. Depending on the
governance structure the lead firms have with the non-lead firms within the segments and
between the segments, a form of power relationship is exhibited. For example, KFC as one of
the largest buyers of chicken around the world can specify what type of chickens they expect
farmers to raise and the standards which the chickens must meet. Because these standards are
specific and rigid and call for a level of technological sophistication and efficiency only the
16
largest agro-businesses may be able to compete as a supplier for KFC. The same may apply for
MNC manufacturers. MNC manufacturers may buy core input food products from agriculture
producers and dictate to them the standards the products must meet; however, they may choose
to have a more vertically integrated relationship with the processing, packaging, and distribution
stage of the supply chain for their products because these practices may entail sophisticated
production lines and processing techniques that are best performed in-house. Yet, unlike most
fast-food multinationals, multinational manufacturers may base their business practices on the
demands of global retail buyers. These buyers such as Wal*Mart may refuse to sell
manufacturers’ products unless they meet specific pricing and packaging requirements.
As the segments of the global value chain level show the intricacies of the governance
structures within the various lead firms in the segments, they also interact directly with local
level dynamics in developing countries. Global agro businesses may buy products from farms in
various regions of the world or set-up their own unique farms where they lease out plots to local
farms to cultivate the crops the agro-businesses demand. These local farms may also supply for
local food manufacturers or global MNCs who have set-up operations in the developing
countries in order to serve the local economy, along with local or global fast-food chains. The
key angle to understanding the interactions at the local food production systems is that MNCs are
not the only actors that are creating processed foods and setting-up fast-food restaurants and
exhibiting the most power relationships. However, these two separate actors are connected
because the standards, practices, and technological achievements the local manufacturers and
fast-food industries are using was adopted from Western firms. There is an interaction effect.
Once developing countries open their doors to globalized forces to spur economic development
they adopt the business practices of powerful MNCs in order to compete. Thus, the entire GVC

17
framework for manufacturing and fast-food systems can represent a diversity of relationships
between the different segments of the chain and the linkages that connect them. With this
framework we are able to identify who the lead firms are within the segments, their influence
upon the rest of the chain, and the avenues for change or upgrading within the chain. The fact
that local manufacturers and fast-food firms were able to position themselves within the chains
and become “brands” within themselves separate from MNCs, demonstrates that developing
countries have been able to upgrade to a higher value-added segment in the chain.
The GVC framework we highlight here is industry and firm-centric, but GVCs do not
operate in a vacuum. The role of government policies, social context, and external forces like
NGOs all can play a role in the operation of the chain. The strength of the framework is that all
actors who have an interest in specific segments and social contexts of the chain can use the
framework to determine the practices or police changes that are needed to influence the chain in
a manner that is more favorable for them. For example, national governments can require that
multinational firms that operate in their country buy only from local suppliers and/or provide
training for local producers and manufacturers in order to enter into higher segments of the
chain. This is where a public health agenda can come into play.
Applying a GVC framework to an analysis of rising childhood obesity rates assists us in
identifying the levers that influence behavior change at the population level. The abundance of
fast-food and processed foods due to the practices lead firms exhibit, such as their operations of
the supply chain and their corporate behavior through advertising and influence on children
impacts the social conditions of life in developed and developing countries that regulate
behavioral risk that can lead to obesity. A detailed analysis of a chain in a specific country can
allude to avenues where key interventions, such as policy recommendations for requiring the

18
selling of healthier food, or by placing limits on the chemicals and artificial flavors that can go
into processed foods, are best addressed through a conceptualization of a global value chain.
Many food MNCs have already been compelled to change certain practices along the segments
of the chains, such as procuring healthy products and forcing healthier standards upon their
suppliers. Furthermore, the framework also exposes if the practices lead firms are conducting to
address adverse consequences to the consumption of their products are only “skin deep.” While
firms may be adopting new nutritional corporate strategies they also may be advancing to less
regulatory environments and lobbying against government regulations.
IV. Conclusion
Applying a global value chain framework to understand increased obesity rates around
the world and particularly in developing countries is a valuable framework that researchers can
use to conduct multi-level studies of why we may have increased childhood obesity rates. The
framework incorporates the sociological factors of economic and political forces at the global,
national, and local contexts that mitigate the risk factors for childhood obesity which would be
lost if researchers only focused on medical interventionist models. The severity of the global
childhood obesity pandemic calls for new research agendas and new theoretical frameworks that
do not discard the broad factors and social contexts that are in play in affecting consumption
patterns and behavioral choices that lead to this public health crisis.
The next stage of research that is needed is to fully map-out a detailed global value chain
of the fast-food and manufactured food industries. By doing so researchers would be able to
elaborate on the interactions between the global and local food production systems in developing
countries, and show their impact on consumption patterns. This is carried-out by designing and
implementing focused field studies on childhood obesity in selected developing countries.

19
Particular avenues for detailed analysis within the GVC framework is an examination of the
impact of corporate advertising and effectiveness of CSR campaigns regarding healthy food in
congruence with an evaluation of the institutional initiatives within schools, communities, and
NGOs to combat childhood obesity. With the overall GVC framework new promising policy
options to improve healthy diets and lower levels of childhood obesity can be positioned by
advocating for strategic intervention into segments of the chain. This level of intervention can
fill a hole in the current forms of intervention that are focused at the individual or community
level.

20
Figure 1: International Comparisons between Developed Countries
a
a Table from IOTF EU Briefing Paper2 Figure 2: Obesity in the United States, 1971-1972
b b Table from Anderson and Butcher 3

21
Figure: 3
“Underwater” Genomic substrate, sub-cellular/molecular, cellular, multi-organ system
GlobalTransnational processes
SocietalNational/state-level processes
GroupAge, gender, race/ethnicity, income
IndividualBehavioral processes
Demographic/Ecological
Economic/Technological
Regulatory/Policy
Cultural/Symbolic
Multi-level Analysis of Childhood Obesity
InstitutionalSchools, workplaces, communities
Household structure
SE
S indicators
MN
C food production
MN
C advertising
International(W
HO
, WTO
)
Nat’l and local govt’s
School and localenvironm
ent
Social norm
s of dietary practice
Lifestyle change
Built environm
ent (TV
s, cars)
Food technology
GVC Focus

22
Figu
re 4
:
Re
cent
Rese
arc
h o
n C
hild
ho
od O
besity:
U.S
. C
ase
Food c
onsum
ption
patt
ern
s
Lifesty
le c
han
ge
(seden
tary
)
Unhealth
y D
iets
(f
ast-
food,
sod
a)
Mark
eting
to Y
outh
(“cooln
ess”)
Corp
ora
te F
oo
d
Culture
(f
ast-
food,
pro
ce
ssed,
low
prices)
Sch
ools
(r
ein
forc
e
food c
ultu
re)
House
hold
s
(lim
ited p
are
nta
l contr
ol or
pre
se
nce
)
Built
Envir
on
men
ts(T
Vs, vid
eo
ga
mes,
car
culture
)
Ha
stin
gs R
ep
ort
(20
06
)U
S I
nstitu
te o
f M
edic
ine
(2
006
)S
ch
or
& M
oh
r (2
006)
Ev
ide
nti
ary
Su
pp
ort
Die
tz &
Go
rtm
aker
(198
5)
Salli
s&
Gla
nz
(20
06)
Kra
tte
t al. (
20
00
)A
nd
ers
on &
Bu
tch
er
(20
06)
Savag
e e
t al. (
20
07
)
Ja
mes e
t a
l. (
20
04
)T
hom
pson
et
al. (
200
4)
Tra
vara
et al. (
2005
)
La
kda
wa
ll&
Phill
ipso
n(2
00
2)
Cu
tle
r e
t al. (
20
03
)C
aw
ley
(20
06
)
Ma
cP
he
rso
n(2
00
2)
Sch
an
zen
bach
(20
05)
An
de
rso
n &
Bu
tch
er
(20
06)
“En
erg
y IN
”
“Ene
rgy O
UT
”
Ch
ildhoo
d
Ob
esity
Ch
ildho
od
Ob
esity
Macro Meso Micro

23
Figu
re: 5
Inte
ractio
n o
f G
lobal an
d L
ocal F
oo
d V
alu
e C
ha
ins
Glo
ba
l va
lue
ch
ain
Lo
cal
foo
d p
rod
uc
tio
n s
yste
m
Glo
bal F
ast-
foo
d
Fra
nchis
es
(McD
on
ald
’s, K
FC
)
Local
Farm
ers
MN
C F
ranchis
es
(fa
st-
foo
d c
hain
s)
Local F
ran
chis
es
(fast-
foo
d &
tra
ditio
nal)
Fo
od
C
on
su
mp
tio
nP
att
ern
s(h
ealt
hy a
nd
u
nh
ealt
hy
die
ts)
Glo
bal
Agro
-B
usin
ess
MN
C F
ood
Manufa
ctu
rers
(Kra
ft, N
estlé)
Glo
bal R
eta
ilers
(su
perm
ark
ets
, dis
co
unt
foo
ds, W
al-
Mart
)
Local R
eta
ile
rs(s
upe
rmark
ets
, con
venie
nce
sto
res,
str
ee
t vend
ors
)
Local F
oo
d
Pro
ducers
De
ve
lop
ed C
ountr
ies
De
ve
lop
ing C
ou
ntr
ies
24
V. Appendix A:
Company Case Examples of Conducting GVC Analysis for Childhood Obesity
GVC analysis is firm centric and can be based in a particular country as a way to
understand that country’s position in the chain and their capabilities to leverage their position
toward an outcome that is favorable to the country – mainly a position that is more value-added.
In this section we highlight some case examples of lead multinational firms in the food and
beverage manufacturing (Kraft, Nestlé, and PepsiCo) and fast-food industries (Yum! (KFC) and
McDonald’s). We focus on the companies’ strategies of global branding, global reach, and
corporate social responsibility initiatives. This preliminary analysis points to the global strength
of these firms around the world and their influence on shaping consumption patterns. We also
showcase preliminary findings on childhood obesity in two developing countries: China and
Mexico. Specifically, we highlight the determinants researchers highlight in the literature and in
the corporate case studies the global reach the lead firms have made in the countries.
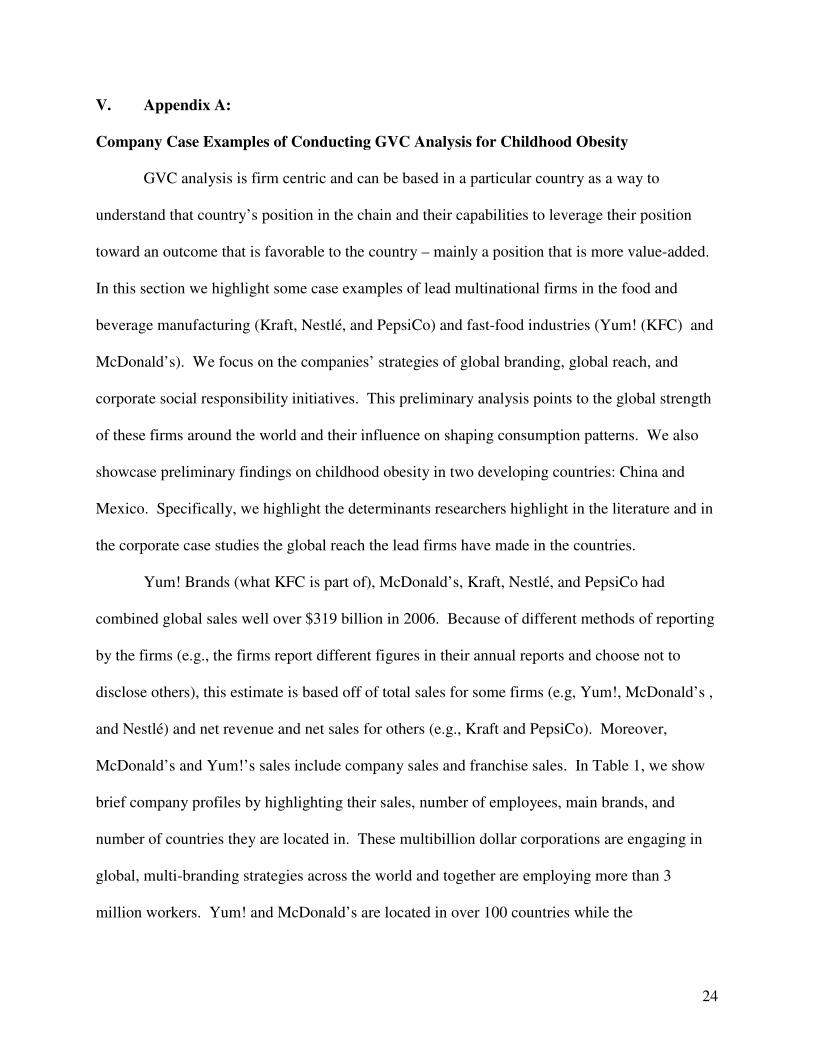
Yum! Brands (what KFC is part of), McDonald’s, Kraft, Nestlé, and PepsiCo had
combined global sales well over $319 billion in 2006. Because of different methods of reporting
by the firms (e.g., the firms report different figures in their annual reports and choose not to
disclose others), this estimate is based off of total sales for some firms (e.g, Yum!, McDonald’s ,
and Nestlé) and net revenue and net sales for others (e.g., Kraft and PepsiCo). Moreover,
McDonald’s and Yum!’s sales include company sales and franchise sales. In Table 1, we show
brief company profiles by highlighting their sales, number of employees, main brands, and
number of countries they are located in. These multibillion dollar corporations are engaging in
global, multi-branding strategies across the world and together are employing more than 3
million workers. Yum! and McDonald’s are located in over 100 countries while the
25
manufacturers, Nestlé, and PepsiCo are in over 200, and Kraft in over 150. For all of the
corporations their international strategies play a key role in their success.
Table 1: Food MNC Profiles, 2006
Source: Company Annual Reports and Euromonitor
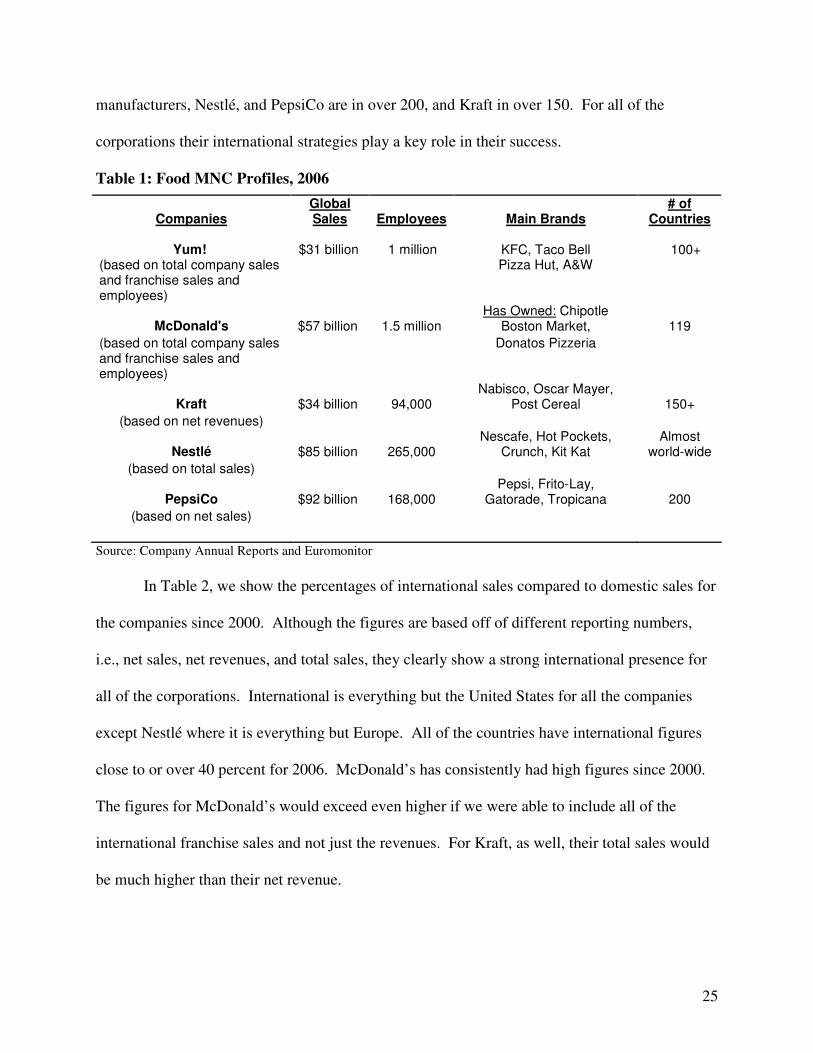
In Table 2, we show the percentages of international sales compared to domestic sales for
the companies since 2000. Although the figures are based off of different reporting numbers,
i.e., net sales, net revenues, and total sales, they clearly show a strong international presence for
all of the corporations. International is everything but the United States for all the companies
except Nestlé where it is everything but Europe. All of the countries have international figures
close to or over 40 percent for 2006. McDonald’s has consistently had high figures since 2000.
The figures for McDonald’s would exceed even higher if we were able to include all of the
international franchise sales and not just the revenues. For Kraft, as well, their total sales would
be much higher than their net revenue.
Companies Global Sales Employees Main Brands
# of Countries
Yum! $31 billion 1 million (based on total company sales
KFC, Taco Bell Pizza Hut, A&W
100+
and franchise sales and employees)
McDonald's $57 billion 1.5 million Has Owned: Chipotle
Boston Market, 119 (based on total company sales Donatos Pizzeria and franchise sales and employees)
Kraft $34 billion 94,000 Nabisco, Oscar Mayer,
Post Cereal 150+ (based on net revenues)
Nestlé $85 billion 265,000 Nescafe, Hot Pockets,
Crunch, Kit Kat Almost
world-wide (based on total sales)
PepsiCo $92 billion 168,000 Pepsi, Frito-Lay,
Gatorade, Tropicana 200 (based on net sales)
26
Table 2: Global Sales of Food and Beverage MNCs (as % of total sales)
Companies 2000 2001 2002 2003 2004 2005 2006 Yum! 35% 35% 35% 37% 39% 41% 43% (based on total company sales and franchise sales)
McDonald's
45%* 57% 58% 58% 61% 61% 62% (based on total company sales and franchise revenues) Kraft 30% 28% 28% 31% 34% 32% 33% (based on net revenues) Nestlé 68% 68% 65% 63% 64% 67% 67% (based on total sales) PepsiCo 41% 41% 34% 36% 37% 39% 41% (based on net sales)
Source: Company Annual Reports and Euromonitor Note: International is everything other than the U.S. except for Nestlé which is everything other than Europe. For McDonald’s, “Corporate” and “Other” sales are counted as U.S. For Nestlé, “Pharma” and “Other Food & Beverages” are counted as International. * Figure includes franchise sales and not solely franchise revenue
All of the synopses below regarding the companies’ global diffusion, marketing strength,
and lead firm status in the fast-food and manufacturing food industries’ global value chains sheds
light on potential avenues for how we can begin to understand the increasing childhood obesity
weight problem in developing countries – particularly China and Mexico. As countries go
through the process of development and globalization and open their doors to the Western world
they become recipients of Western global products and brand diffusion, and the technologies that
are needed to support these burgeoning forms of food consumption. However, the push toward
corporate social responsibility and nutrition and wellness programs all the companies are
embracing may be a key avenue where interventions can continue to be made, albeit further
analysis is needed to understand their effectiveness and the companies’ commitment to healthy
practices.

27
McDonald’s
Unlike their competitors, McDonald’s has chosen to focus solely on a one-brand image,
their McDonald’s restaurant chain. Formerly, they owned Chipotle, Boston Market, and Donatos
Pizzeria but over the last five years decided to use their corporate strength solely for the
McDonald’s restaurant brand. Although they have maintained a one-brand force, they have
always been at the forefront of opening-up in international markets. They were one of the
original fast-food multinational to aggressively pursue overseas expansion. In Figure 1,19 we see
the intense expansion of the number of restaurants outside the United States since 1994.
Expansion in the Asia-Pacific region is particularly strong. In 1994, the company had just over
2,000 restaurants in the region but by 2000 that number had tripled. Europe has increasingly
expanded, as well, along with Latin America, although Latin America has remained consistently
steady. These figures show the mere strength of McDonald’s operations. They have a total of
31,677 system unit restaurants with nearly 18,000 of those in international localities.

28
Figure 1: McDonald’s System Unit Restaurants by Region since 1994
0
2,000
4,000
6,000
8,000
10,000
12,000
14,000
1994 1995 1996 1997 1998 1999 2000 2001 2002 2003 2004 2005
Year
Num
ber
of R
esta
uran
ts
U.S. Europe Asia/Pacific Latin America Other Regions Source: McDonald’s Annual Reports
China is considered a key emerging market for McDonald’s and its performance to date
is positive, investing in new unit growth, including drive-thrus, as it looks to tap into rising levels
of car ownership. Currently they have 784 restaurants on the mainland, 210 in Hong Kong, and
345 in Taiwan. McDonald’s main competitor in China is Yum! Brand’s KFC who benefited
from first mover status and the fact that chicken is more widely consumed by locals than beef.
McDonald’s is in the process of trying to cater their menu toward a more chicken and fish
friendly option base in order to tap into local consumer preferences.
McDonald’s has also been leading the charge of changing the nutritional value on their
menu items and trying to follow health friendly, balanced lifestyle corporate strategies. They are
addressing the claim that they are contributing to the obesity crisis directly through their

29
corporate social responsibility strategies highlighted in their Worldwide Corporate
Responsibility Report of 2006.20 Starting in 2000, they introduced salads, low-fat desserts and a
wider choice of chicken and fish burgers; and they also introduced more regional menu variation
and began experimenting with new formats, such as cafes and kiosks. In 2004, after much
publicized consumer and government concerns regarding the obesity crisis, McDonald’s
discontinued its super size option and began a new range of salads. Also in 2004, they launched
a number of initiatives in keeping with its new “balanced lifestyles” platform which focuses on
three key areas: food choice, education and physical activity. One of the key components is Go
Active! which was tied-in with sponsorship of the Athens 2004 Olympic Games. In 2006, they
began a large-scale roll-out of printing nutritional information directly on their packaging, the
first major restaurant company to do so. The format is icon-based and can be understood
independent of language. The icons represent calories, protein, fat, carbohydrates and sodium.
Lastly, in 2006 they announced a collaboration with Scripps Research Institute. McDonald’s
will financially support research that focuses on understanding solutions to childhood obesity
and Type 2 diabetes. They have initially contributed $2 million.21
In addition to their health initiatives they also instituted new marketing and
communications practices. In March 2005 they launched a global public education initiative to
help consumers understand “energy balance.” Moreover, they argue that they are marketing and
advertising only responsible messages to children. For example, they state that through their
marketing they do not seek to undermine the authority of parents or imply a psychological, social
or physical superiority for consumers who use McDonald’s products.
All of these initiatives are strong starts toward addressing the obesity challenge but more
analysis is needed to understand how effective these initiatives are and how much consumers are

30
buying these health products in comparison to the other non-healthy menu items. Furthermore,
even if McDonald’s says they are marketing responsibly to children they may be reaching older
children, like teenagers, through the marketing of “coolness.” Lastly, these initiatives are only
limited in scope if McDonald’s actively lobbies against regulatory policy that would benefit
public health.
Yum! Brands – KFC
Kentucky Fried Chicken (KFC) has gone through several transformations since Colonel
Sanders began selling “home meal replacements” in 1930 from the service station he operated.
Currently there are over 11,000 KFC restaurants in over 80 countries and the numbers are still
rapidly growing. We highlight in the following sections the latest transformation of KFC. As
the lead brand for Yum! Brands, the multinational fast-food conglomerate, KFC is leading the
Yum!’s global strategies and marketing force in a large-scale global diffusion operation of fast-
food dominance. With this dominance we are able to see the worldwide influence of the
American brand in shaping preferences and norms, technological standards, and supply chain
structure.
KFC was originally acquired from a group of investors from Colonel Sanders in 1964
who held onto their interest until 1982 when R.J. Reynolds Industries, Inc. (now Nabisco)
acquired the company. In 1986 PepsiCo bought KFC from RJR Nabisco and in 1997 PepsiCo
created a spin-off division, Tricon Global Restaurants, for all their fast-food restaurants. Tricon
changed their name to Yum Brands, Inc. in 2002. Yum! Brands embrace a multi-branding
business strategy that uses different brands to serve specific market niches. There brands include
KFC, Pizza Hut, Taco Bell, A&W All-American Food Restaurant, Long John’s Silver, Pasto
Bravo, and WingStreet.

31
Yum! Brands’ top strategies are to drive international expansion, make expansion in
China a top focus, and to be the best at providing branded restaurant choice and multibranding
strong brands. KFC’s role is at the center of the company. KFC is Yum!’s largest brand and
from 1999-2003 the main generator of Yum! growth which grew in sales by 19% over this
period powered by global expansion. In 2006, Yum! and its franchises opened up 758 new
restaurants. 2006 was the seventh straight year Yum! opened over 700 restaurants. The
International Division at Yum! generated over $400 million in operating profit in 2006, over
doubling its $186 million profit in 1998. We show in Figure 222 the top twenty-five markets
where KFC has a strong presence. Second to the United States which leads the field with over
5,000 restaurants is Mainland China which has close to two thousand KFC outlets.
Figure 2: Top 25 KFC Markets by System Unit Count 2006
Top 25 KFC Markets 2006
01,000
2,0003,0004,0005,0006,000
Un ited State s
Mainland ChinaJapan
Great Brita
inCanada
Austra lia
Malaysia
IndonesiaKorea
Mex ico
South Africa
Thailand
Philippines
Taiwan
New Zealand
Saudia Arab ia
Puer to Rico
Spain
France India
S ingapore
Hong KongEgyp
t
Germany
Hawaii
Countries
Uni
ts
Series1
Source: Yum! Brands Media Documents
KFC opened their first restaurant in Beijing, China in 1987. The China division is such
an important and dominant component of Yum!’s global strategy anchored to the KFC brand that
the company has reported the China Division’s (includes mainland China, Thailand, and Taiwan)
profits separately since 2005. In 2006, the operating profits for the China Division were more
32
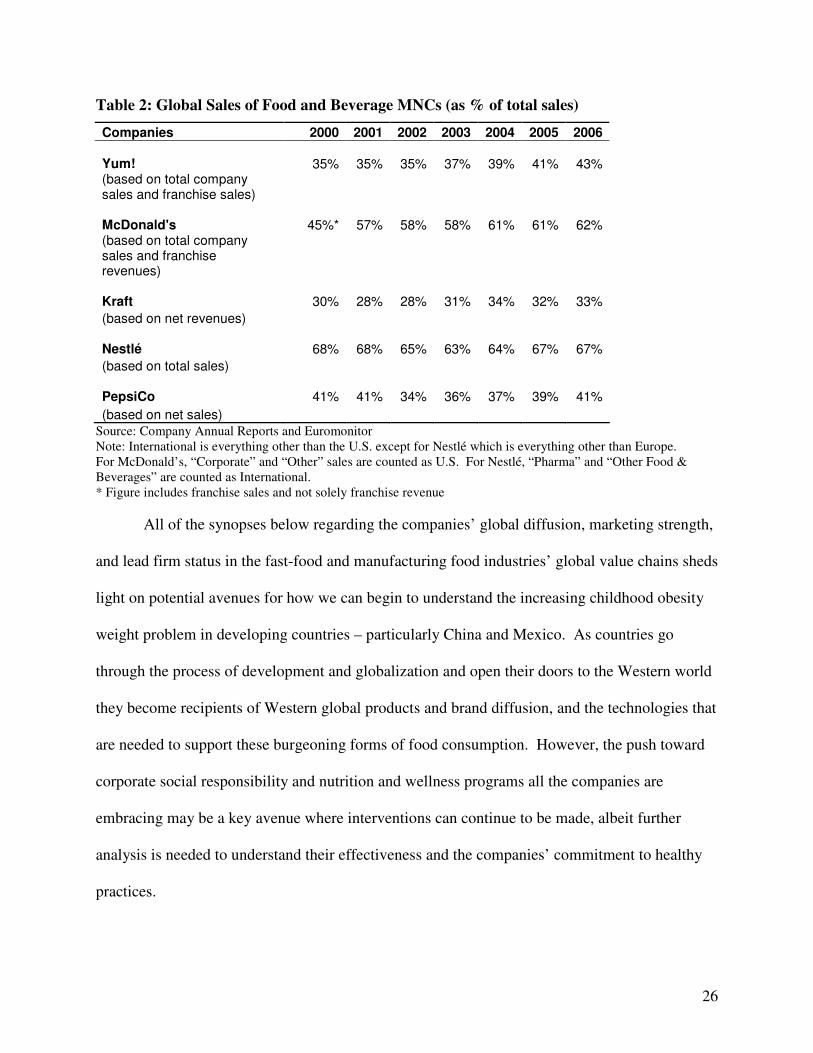
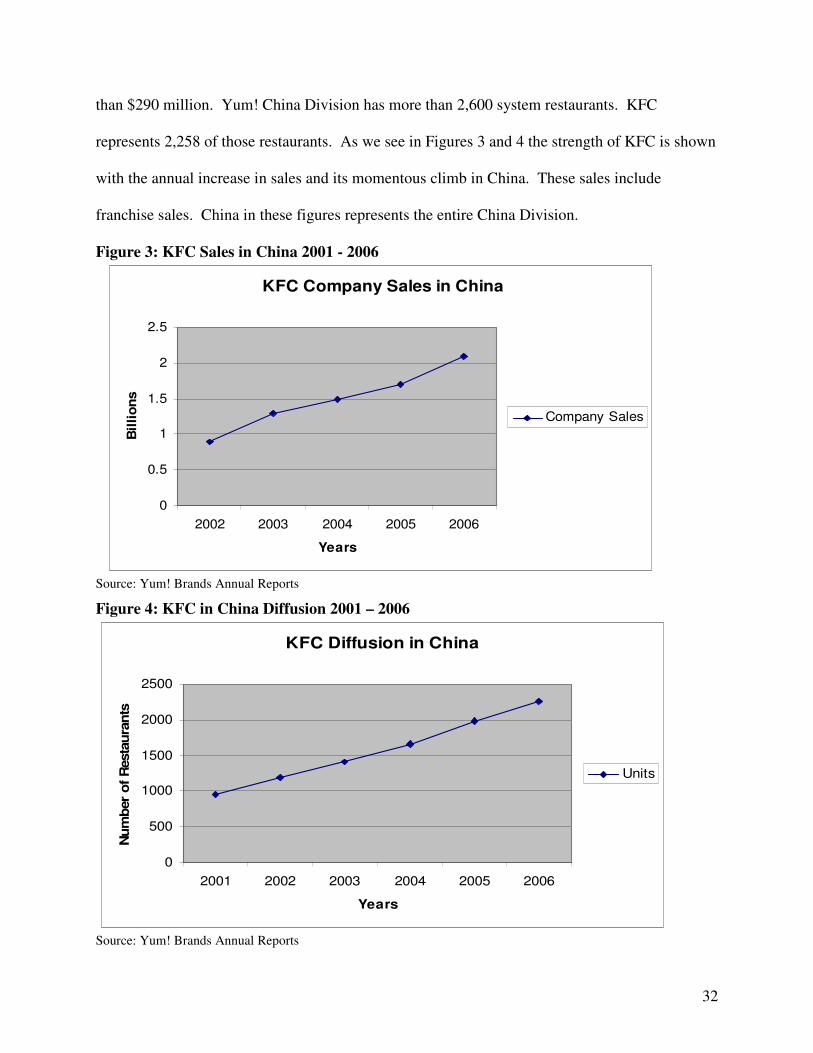
than $290 million. Yum! China Division has more than 2,600 system restaurants. KFC
represents 2,258 of those restaurants. As we see in Figures 3 and 4 the strength of KFC is shown
with the annual increase in sales and its momentous climb in China. These sales include
franchise sales. China in these figures represents the entire China Division.
Figure 3: KFC Sales in China 2001 - 2006
KFC Company Sales in China
0
0.5
1
1.5
2
2.5
2002 2003 2004 2005 2006
Years
Bill
ions
Company Sales
Source: Yum! Brands Annual Reports
Figure 4: KFC in China Diffusion 2001 – 2006
KFC Diffusion in China
0
500
1000
1500
2000
2500
2001 2002 2003 2004 2005 2006
Years
Num
ber
of R
esta
uran
ts
Units
Source: Yum! Brands Annual Reports

33
Mexico is KFC’s largest market for Latin America with 320 restaurants. Mexico is also
the oldest Latin American market for KFC because they opened their first restaurant in 1963 in
Monterrey. However, Mexico’s diffusion is no where close to the amount of restaurants opened
in China in a relatively short period of time pointing to the strength and investment being
focused on China in the last twenty years. Yet, similar to China, a break down of where the
restaurants are located within the country highlights a bias toward urban centers. Three main
regions occupy the center of KFC’s market in Mexico. The top two regions with the most KFC
outlets, Estado de Mexico (State of Mexico) and the Distrito Federal (Federal District), are part
of the main city center of Mexico City, with Nueve León, a northern border region, rounding up
the top three. Yum!’s diffusion strategy is catered to tapping into a growing middle-class
consumer group and the urbanization phenomena that accompanies economic development
policies.
KFC operates an intricate supply chain worldwide to service their growing consumers.
Yum! Brands’ purchasing of food and equipment is carried out worldwide by an internal
organization called Supply Chain Management which was founded in 1966. This division
sources, negotiates contracts and buys specified food supplies from hundreds of suppliers
throughout the world. As a lead firm Yum! dictates to the links on the supply chain the
standards and technological diffusion required to meet its needs as a lead buyer. Yum! suppliers
are required to meet strict quality control standards and they operate under the Supplier Code of
Conduct for U.S. Suppliers.
In addition to the power Yum! has as a global supply chain lead firm via pushing for
technological diffusion and quality standards, they also gain power and market strength through
their marketing techniques and localization strategies. KFC has been a leading brand at adapting
34
to the local customs for their host countries, presenting a fine balance between cultural marketing
and consumer branding of a “Western” brand. This balancing act is most witnessed through
KFC in China. According to a study by Li, initially few Chinese consumers were impressed with
KFC and its “food” but went to their restaurants to “experience” the lifestyle of how a Western
company works.23 Li highlights how KFC has two specific product strategies for China, first,
they want to reach a younger, hip, audience who are interested in the style of the West thus they
introduce western products; and, second, they still want to reach the more traditional Chinese
consumer so they offer Chinese influenced cuisine. This dual prong strategy keeps KFC both
“hip” yet culturally sensitive.24 The Chinese-styled food they have incorporated into the menu
are Old Beijing Chicken Roll, a wrap modeled after the way Peking duck is served; Sichuan
Spicy Chicken, which absorbs spicy flavors of Sichuan dishes, and Chinese-style breakfast
porridge. In addition to the menu, KFC also absorbs cultural elements into the decorum of the
stores. In 2003, they spent almost $1 million to redecorate their flagship outlet in Beijing with
Chinese kites and the Great Wall shadowgraph.
On the advertising side, KFC adapted its advertising campaign to suit both the young
Western crowd and the traditional Chinese consumer. The themes they address in their
advertisements are the concept of family, combining traditional and modern, and treating
children like “little princesses” or “little emperors.” One of their more popular commercials
specifically integrates old traditional customs with modern pop culture. In the commercial you
see the generational differences between a father and son with a father in one room listening to
Beijing opera and a son in the other room listening to hip-hop. They reconcile their generational
differences over an Old Beijing Chicken Roll.25

35
While Yum! Brands are leading the charge of international expansion and global brand
and technological diffusion, they are taking some heat domestically, like many fast-food chains,
for their unhealthy menu options and marketing to children. To combat these claims they have
started several initiatives. In 2003, KFC started a campaign that emphasizes how fried chicken
can be a part of a healthy diet. As part of the campaign they began airing advertisement
segments that favorably compared KFC chicken breasts to Burger King’s Whopper. They also
began posting nutritional information in restaurants and on their website; began encouraging
consumers to go “skinless;” and began product testing with healthier options like Oven Roasted
Chicken. Although the pressure has yet to reach the same levels as in the U.S., in China KFC
began to take steps to eliminate the negative health effects caused by its products by creating a
“White Book on KFC China Health Policy.” The aim of the white book and the former policies
is for KFC to show of the nutritional value of their products. However, while KFC is pushing
their corporate social responsibility, Yum! Brands as a whole spent more than $550,000 in the
first half of 2007 to lobby the federal government for favorable policies for the fast-food
industry, including relaxed nutritional regulation.26 Simon argues that the fast-food lobby is
working behind the scenes to make sure health regulatory legislation does not pass while their
clients wage a positive public relations campaign. She labels this phenomenon “nutriwashing.”
27
Kraft
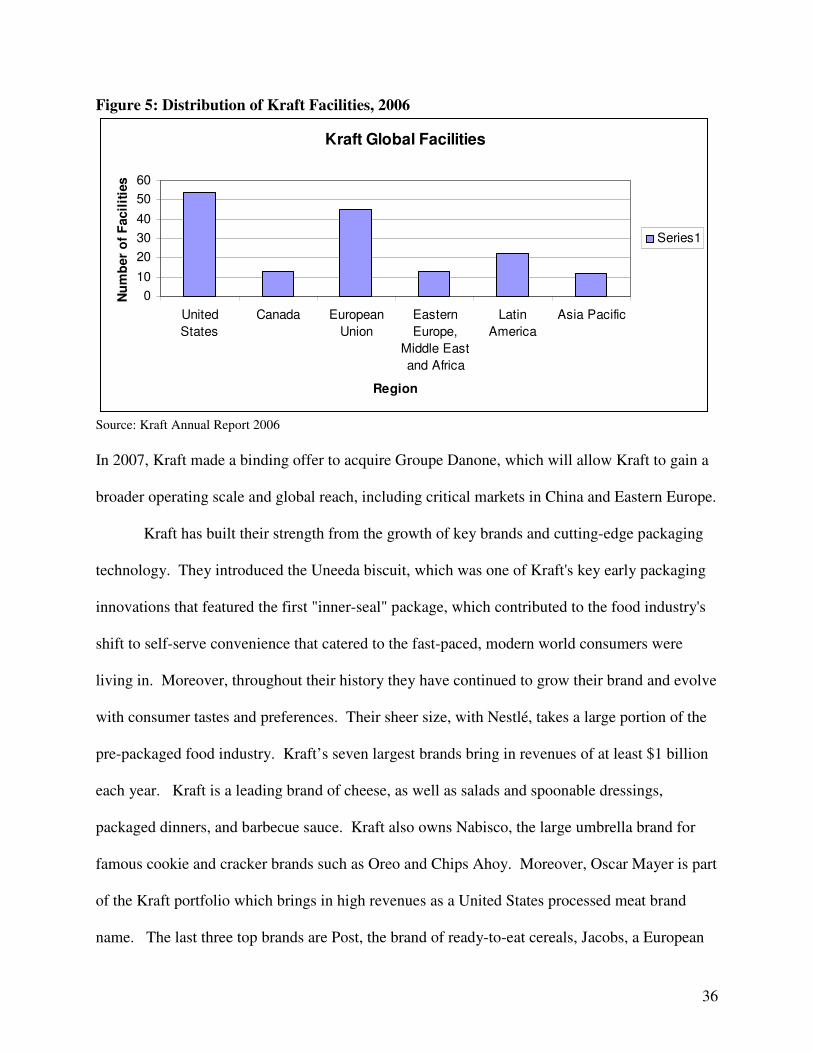
Kraft Foods is the #1 food company in the United States and #2 in the world behind
Nestlé. As of 2006, Kraft had 159 manufacturing and processing facilities worldwide. In North
America the company has 67 facilities and outside of North America there are 92 facilities
located in 41 countries. In Figure 528 we see the global diffusion of Kraft´s facilities.
36
Figure 5: Distribution of Kraft Facilities, 2006
Kraft Global Facilities
0102030405060
UnitedStates
Canada EuropeanUnion
EasternEurope,
Middle Eastand Africa
LatinAmerica
Asia Pacific
Region
Num
ber
of F
acili
ties
Series1
Source: Kraft Annual Report 2006 In 2007, Kraft made a binding offer to acquire Groupe Danone, which will allow Kraft to gain a
broader operating scale and global reach, including critical markets in China and Eastern Europe.
Kraft has built their strength from the growth of key brands and cutting-edge packaging
technology. They introduced the Uneeda biscuit, which was one of Kraft's key early packaging
innovations that featured the first "inner-seal" package, which contributed to the food industry's
shift to self-serve convenience that catered to the fast-paced, modern world consumers were
living in. Moreover, throughout their history they have continued to grow their brand and evolve
with consumer tastes and preferences. Their sheer size, with Nestlé, takes a large portion of the
pre-packaged food industry. Kraft’s seven largest brands bring in revenues of at least $1 billion
each year. Kraft is a leading brand of cheese, as well as salads and spoonable dressings,
packaged dinners, and barbecue sauce. Kraft also owns Nabisco, the large umbrella brand for
famous cookie and cracker brands such as Oreo and Chips Ahoy. Moreover, Oscar Mayer is part
of the Kraft portfolio which brings in high revenues as a United States processed meat brand
name. The last three top brands are Post, the brand of ready-to-eat cereals, Jacobs, a European
37
coffee brand, and Milka a leading European chocolate confectionary brand. To facilitate the
strengthening of their brand image Kraft has effectively used advertising throughout all stages of
their brand development. Kraft is home to the Kool-Aid Man, Mr. Peanut, the Oscar Mayer
Wienermobile and the lilac Milka cow, and some of popular culture’s most recognizable tag
lines, such as: Maxwell House coffee’s: "Good to the last drop"; "America spells cheese K-R-A-
F-T"; "My baloney has a first name, it's O-S-C-A-R...."; "It's not delivery, it's DiGiorno";
"There's always room for Jell-O"; and "Oreo: America's Favorite Cookie."29
Since 2000, Kraft has embarked on several key brand strategies which has them
embracing more health-conscious consumer items. In 2000, they bought Boca Burger (a soy-
based burger) for roughly $100 million and they also acquired Balance Bar (meal-replacement
snack bars, drink mixes, and beverages) for $268 million. However, it was also in 2000 that
Kraft officially bought Nabisco. In 2002, they sold Farley’s and Sathers and some other candy
brands (e.g., Now and Late, Mity Bite). In 2003, Kraft began making statements that they
intended to reduce the fat and sugar content and cut the portion sizes of its food products, as well
as cease marketing in schools. They also began cross-branding in 2004 with the South Beach
Diet brand. The South Beach Diet puts its trademark on some of Kraft’s products such as
cereals, meal replacements, cereal bars, refrigerated sandwich wraps, and frozen entrees and
pizzas. They also continued to sell-off some of their confectionary items such as when in 2005
they sold their Altoids breath mints, LifeSavers, and CremeSavers brands.
These brand acquisitions and the selling of particular brands follows Kraft’s shift toward
a nutrition and wellness emphasis. Kraft follows “Healthy Living Principles” which shape their
policies, practices, and business strategies. They highlight their principles as advocating for a
diverse diet where foods each day are selected from the major food groups; the limiting of foods
38
high in sugar and saturated trans fat; that most foods can fit into a balanced diet with appropriate
proportions and frequency; a balance between calories taken in and calories burned-off is
important for a balanced lifestyle; and, when practiced appropriately, selected foods can be
supported with vitamin, mineral, and nutrient supplements. These principles have begun
changing specific policies such as product nutrition practices.30 Kraft regularly modifies or
changes their nutrition contents such as by reducing fat in Cool Whip or adding more calcium to
Kraft cheese singles, and by also changing portion sizes such as the 100 calorie Oreo thin crisps.
In 2005, Kraft introduced “Sensible Solution” a labeling program to help consumers easily
understand important nutritional values in their products and which products are healthy choices.
Furthermore, changes in marketing practices have followed. Kraft does not advertise in the
media to a primary audience under age six. They also claim that their advertising follows the
appropriate proportion and consumption size a consumer should follow and does not advocate
and glorify sedentary lifestyles. Lastly, since 1997 Kraft has invested more than $26 million to
increase the nutritional value of food donated to people in need through the Kraft Community
Nutrition Program. Internationally, in China they support the Children’s Nutrition and Health
education campaign.
Nestlé
Nestlé is the #1 food company in the world. They market their products around the world
in over 130 countries. Their global sales are strongest in Europe, followed by the United States,
and Latin America & the Caribbean. Their brand products range from coffee, water, other
beverages, shelf stable beverages, chilled beverages, ice cream, infant nutrition, performance
nutrition, health care nutrition, bouillons, soups, seasonings, pasta sauces, frozen foods,
refrigerated products, chocolates, confectionaries, and biscuits. Some of their more popular

39
brands are Stouffer’s, Hot Pockets, Crunch, Kit Kat, Butterfinger, Nescafe, and Nestea.
Nestlé was a leader in supporting health conscious initiatives and changing their business
strategies. In 1992, Nestle began working with the French government providing financial
support in their pilot EPODE (Let’s work together to prevent obesity in children) initiative. The
initiative focuses on how obesity is a social challenge and how many stakeholders (health
professionals, companies, shops, supermarkets, media, etc.) need to be involved in changing
consumption and behavior patterns that may lead to childhood obesity. The success of the
program had childhood obesity falling to 9 percent in the towns where the project was executed
compared to an obesity rate of 18 percent in similar towns in the region not receiving the
program.31
In addition to the early support Nestle extended toward the EPODE initiative, they have
continued to make key strategic and health conscious acquisitions and business practices.
Overall they have begun broad initiatives to be more health conscious with all of its products
with a keen focus on children’s food.32 At the forefront is the start of Nestlé Nutrition which is a
division of Nestle that is solely focused on science-based nutrition products and services. This is
the largest private research organization in the world entirely dedicated to basic research in food
and nutrition. The products they create have centered on infant nutrition, healthcare nutrition,
and performance nutrition. In the last two years they have also acquired key acquisition in the
health and wellness market. In 2006, they acquired Jenny Craig, a weight management
company; in 2007 they agreed to acquire the entire medical nutrition business of Novartis
Medical Nutrition; and also in 2007, they acquired Gerber Products Company which will be
integrated into the infant nutrition segment of Nestlé Nutrition. However, their nutrition segment
is only 6 percent of their global sales for 2006.

40
PepsiCo
PepsiCo merged with Frito-Lay in 1965 to create PepsiCo Inc. It is now the 2nd largest
soft drink company in the world behind Coca-Cola. PepsiCo’s main brands are Pepsi Cola,
Frito-Lay, Tropicana, Gatorade, and Quaker. Its two core brands are Pepsi Cola in the soft drink
industry and Frito Lay in the packaged food industry. These brands are leading the company’s
brand strength and global sales. The United States and Mexico remain two of the top markets for
PepsiCo soft drinks and snack food products. However, PepsiCo has more than doubled its net
sales in non-North American countries from 2000 to 2006. Figure 6,33 is a breakdown of
PepsiCo’s global net sales since 2000 for the United States, Mexico, the United Kingdom,
Canada, and all other countries. Net sales in the United States are still the strongest but
international markets are increasing.
Figure 6: PepsiCo Net Sales
Geogarphic Breakdown of Net Sales
0
5,000
10,000
15,000
20,000
25,000
2000 2001 2002 2003 2004 2005 2006
Year
US
$ M
illio
ns
United States
Mexico
United Kingdom
Canada
All Other Countries
Source: Euromonitor
In 1982, Pepsi was one of the first multinational corporations to set up operations in China
after the Open Door policy but the venture was not always a smooth transition.34 Investing in
China often entails foreign investors seeking joint ventures with Chinese partners in order to

41
enter the highly competitive market. In 2002, Pepsi terminated a joint venture with a Chinese
bottling firm after eight years operating together because local Chinese partners wanted a larger
share of profit margins and development outside of their contractual regions. The profit-sharing
issues with Chinese partners were exacerbated by government protection of domestic beverage
makers. Moreover, the Chinese government controls the location of foreign plants so as to
distribute competition across the country. Pepsi claimed that it was pouring money into
advertising and marketing with investment liabilities still outweighing revenues after 20 years.
The company now has 40 joint and solely owned ventures in China, which is its second
largest soft drinks market outside the United States. Pepsi owns 25 bottling plants and 4
packaged food factories, and their new strategy is to double the Chinese workforce over the next
five years in order to match growth potential in that market. Their aggressive marketing tactics
in the past decade have included brand building by using celebrity endorsements and sports
sponsorships. In a survey by AC Neilsen in 2002, Pepsi now has a 44 percent market share in
major Chinese cities. An important strategy that has solidified Pepsi’s global strength is their
incorporation of localization. A PepsiCo spokesperson stated, “It is very clear based on our
experience that to succeed in the food and beverage market around the world our products, as
well as our marketing must be locally relevant… that means they must reflect the local culture,
as well as local taste preferences and ingredients.” 35 Investment in China alone totals over one
billion dollars, and Pepsi plans to expand its Chinese market by investing an additional $850
million between 2006 and 2009.
In order to penetrate emerging markets, PepsiCo applies the principles of adapting its
products to meet local preferences.36 For example, the company has expanded using joint
ventures and has employed local managers who have expertise in the preferences of that market.

42
Frito-Lay in Mexico sell chips with chili flavors while Frito-Lay in China sells crab or duck
flavored chips. By utilizing partnerships with local bottlers or local suppliers, Pepsi can also
appeal to consumers’ nationalistic sentiments. Sabritas in Mexico or Yazhou in China are both
popular brands sold by Pepsi with regional-sounding names. To increase understanding of their
target market, PepsiCo opened its first research and development site outside the United States in
Shanghai in 2006.
Developing countries like India and China are seeing the emergence of a middle class
that can now participate in spending on inexpensive consumer products. Urban Chinese children
are spending more on snacks and play items as well as influencing the spending of their
parents.37 PepsiCo’s top-line sales figures and profit margin should continue to expand in
developing markets because they have already laid down the asset investments and
infrastructure.
PepsiCo began to expand their beverages product line to add more noncarbonated drink
categories by the late 1990s. This early strategy shift to focus on healthier beverages has paid
off. The water and non-carbonates sector of PepsiCo has seen growth momentum in the past five
years. Aquafina is now the number one bottled water; Gatorade is the biggest sports drink; and
Propel Fitness Water continues to grow. Fruit and vegetable juices such as Tropicana and Dole
are doing well. As schools in the U.S. limit the presence of carbonates, Pepsi is shifting its focus
to market milk drinks in schools. Their soft drink line included more diet colas as well as non-
carbonate drinks with low sugar such as SoBe.
PepsiCo was ranked #1 globally in 2005 for sweet and savoury snacks, and 79.96 of the
company’s net sales is from packaged foods. In 2003, trans fat was removed from all chips as
they switched to using corn oil. By 2006, Lay’s and Ruffles chips were made using sunflower

43
oil. PepsiCo also strove to reduce sugar and sodium in their snack foods and expanded their
product range to more nuts and healthy snacks. In the snack foods sector, the pressure to shift
from focusing on the sweet and high fat snacks market led PepsiCo to explore two potential
development paths. The company can pursue the “impulse channel” or move towards acquiring
more healthy and organic snack options. The impulse channel refers to moving toward
convenient, on-the-go foods. PepsiCo launched Flat Earth fruit and vegetable chips in 2007.
They also introduced the widely popular 100-Calorie Mini Bites to address portion control
issues. This shift in focus toward healthier snacks like nuts or fruit snacks is not merely a
marketing ploy but rather a response to the increased demand for healthier choices in snacking.
With the initiatives mentioned above, PepsiCo has continued to devote itself to
promoting Health and Wellness initiatives to teach children to “balance what you choose with
how you move.” 38 PepsiCo launched their “Smart Spot” marketing campaign in 2004, which
includes labeling “healthy” products as well as exercise campaigns to promote smart lifestyle
choices. All products labeled with a “Smart Spot” sign meets nutrition criteria set by the Food
and Drug Administration and the National Academy of Science. By 2006, more than 40 percent
of PepsiCo’s annual revenues in the U.S. and Canada came from Smart Spot eligible products,
which include Baked Cheetos, Baked Lays, and Diet Pepsi. The Smart Spot campaign also
includes celebrity sponsorships of physical activity and a nation-wide instructional dance
program to promote a more active lifestyle. PepsiCo was also the first to voluntarily restrict
advertising to children in its Children’s Food and Beverage Advertising Initiative (CFBAI).
They partnered with the Alliance for a Healthier Generation to limit direct advertising to children
under 12 to only Smart Spot products.

44
VI. Appendix B:
Country Case Examples of Conducting GVC Analysis for Childhood Obesity
China
Childhood obesity is a growing problem in China that correlates to China’s emergence in
the global economy. Data in Figure 139 shows that increased childhood obesity and overweight
males in ages 7-12 has been steadily increasing since 1985 particularly in the main cosmopolitan
cities Shanghai and Beijing.
Figure 1: Chinese Childhood Obesity and Overweight Rates Overtime
Prevalence of obesity and overweight males (7-12), 1985-2000
0
5
10
15
20
25
30
35
Beijing Shanghai Easterncities
Inlandcities
Beijing Shanghai Easterncities
Inlandcities
Beijing Shanghai Easterncities
Inlandcities
1985 1995 2000
c�
c Data from Ji , Sun , and Chen.39 The Chinese standard for overweight is BMI more than or equal to 24 and less than 28. The WHO standard for obesity is BMI more than or equal to 30 while the Chinese standard for obesity is BMI more than or equal to 28. Reasons for the differences in the standards is attributed to the local sensitivity and specificity needed for identifying risk factors for specific diseases in Chinese populations.

45
The literature on childhood obesity in China has focused predominately on a few key
determinants that can be linked to a global value chain analysis: rapid modernization, increased
income, high urbanization, built environments, change in diet toward processed foods and meat,
and the one child policy. We discuss each determinant briefly below.
The growth of industry and technology in China over the past twenty years has translated
to greater food availability and decreased physical activity for both children and adults. The
economic reforms started in 1978 has not only led to high industrialization and modernization in
urban areas but also double digit growth in per capital income across the country.40 An increase
in commercial eating places such as restaurants and stalls have particularly impacted
consumption patterns in urban children. Many Chinese students now have consumer purchasing
power and eat regularly in restaurants with friends instead of at home with family. However,
compared with children in the United States or other Western countries, Chinese children rarely
“snack” between meals. Only 11 percent of Chinese children reported snacking regularly
compared with 91 percent of children in the United States.41 This trend of low snacking may
change as lifestyle changes impact more young people.
The economic transition also lead to high disposable incomes and a new middle-class that
could afford to go out to eat and purchase convenient snacks. Societal affluence and lifestyle
changes in the middle class population allow children to have more influence on parental
consumer purchases.42 Western franchises such as McDonald’s and beverage companies like
Pepsi have started to penetrate the Chinese market beyond Beijing and Shanghai. Chinese
parents are now more capable of indulging their child’s curiosity about foreign fast food or other
snacks. Parents now have the disposable income available to take their children to McDonald’s
or KFC as a reward, for example, for good grades.43

46
The typical Chinese adult ate 51 grams of fat per day on average in 1990, which is the
equivalent of one combo meal at KFC.44 Yum! Brands, the parent company of KFC, Pizza Hut,
and Taco Bell, currently operates the most restaurants in China with 2400 outlets. However,
survey results show the average Chinese person eats foreign fast food only two to three times per
month, which indicates that the expansion of KFC or McDonald’s is not the sole cause of the
obesity epidemic.45
The prevalence rate for overweight and obesity is significantly higher for urban
children.46 This may be due to socioeconomic stratifications between the countryside and urban
settings. In a study conducted of four hundred and eighty obese Chinese children, Ho and
colleagues found that a significant proportion of obese children were found in the upper and
middle social classes, as opposed to a general working population as determined by father’s
occupation.47 Moreover, a longitudinal study by Ji and colleagues shows significantly higher
obesity rates in large cities such as Shanghai and Beijing in the late 1990s which testifies to the
impact of urbanization in altering lifestyle and diet habits. In the span of 15 years from 1985 to
2000, the obesity and overweight percentage of male children age 7-12 in Beijing rose by
fivefold from 5.8 percent to 29.0 percent. The effects of rapid urbanization on pediatric weight
is concentrated in the period between 1995 and 2000, when urban growth spread to other Eastern
cities as well as inland cities.48 The socioeconomic stratifications between rural and urban
settings contribute to the availability of food options as well as the degree of deviation from
traditional foods to more Westernized diets.49
The average Chinese child has less periods of inactivity than Western children. They
watch less than 1 hour of TV per day and are much more focused on school-related activities.50
Modern Western-style TV programming and advertising truly took hold in 1997, so the trend for

47
childhood inactivity may show upward growth in the future. Physical activities outside of
school-sanctioned physical education are limited, but most students commute using public
transportation, walking, or biking. Only around 8 percent of children have physical activity
outside of school, and less than 20 percent do household chores.51 As children spend the
majority of their time either studying or doing sedentary activities, weight issues may present
more of a problem in the future.
The rapid economic development and urbanization of China has led to a nutritional shift
from traditional diets as well as lifestyle changes for Chinese children. As modernization spread
throughout China, people reduced their consumption of fresh vegetables and began to eat more
processed foods.52 Chinese people are gradually replacing their healthy traditional diets
consisting of cereals, high carbohydrate foods like rice and pasta, and vegetables with a high-fat
diet. Fat intake dramatically increased in the early 1990s because of increased consumption of
animal products and vegetable oil, both of which had become cheaper and more available.53 In
fact, the fat intake of both rural and urban boys increased by 30-50 percent from 1991 to 1995,
meaning that penetration of food technology and availability has reached beyond wealthy
Eastern cities. The increased proportion of meat in the diet may have a greater impact on the
incidence of obesity and heart disease in Chinese people because their metabolism works more
slowly than that of Westerners.54
Lastly, Yang researched the possible relationship between China’s one-child policy and
the rising pediatric overweight and obesity rates in China.55 The family planning program has
been suggested as a cause of overweight children due to spoiling the single child with more food.
The one-child policy varies across regions, with strict areas only allowing one child per couple,
moderate areas allowing for a second child if the first is a girl, and weak policy areas allowing
48
two or more children. Using longitudinal data from the China Health and Nutrition Survey,
Yang found that overweight prevalence in young children was indeed higher in those
communities with a stronger one-child policy. However, after adjustment for other confounding
factors such as urban residence and household characteristics, the one-child policy was not
shown to have causal relations with the overweight epidemic. The study points to urban
residence and province/ region, local socioeconomic development, and parental characteristics as
greater risk factors for childhood overweight than the one-child policy.
Mexico
Childhood obesity in Mexico is also growing at alarming rates. In Figure 2, researchers
show in the decade between the First (1988) and Second (1999) National Nutrition Surveys in
Mexico there was an increase in the prevalence of Mexican children ages 2–4 years who were
either obese or at risk for obesity, rising from 21.9 percent to 28.7 percent. This is the only age
group in children for which national trend data are available. However, data from the Second
National Nutrition Survey show equally alarming evidence of a growing obesity epidemic in
children and youth. Based on the age- and gender-specific body mass index scales developed by
the Centers for Disease Control and Prevention (CDC) in 2000, 21.1 percent of Mexican children
ages 6–11 years have a BMI equal to or greater than the 85th percentile and are considered to be
obese (8.8 percent) or at risk for obesity (12.3 percent).56

49
Figure 2: Prevalence of risk of obesity or at risk for obesity by region and year of survey in Mexico children ages 2-4.
d
d Table from Rivera and colleagues56
The determinants that are connected to the rising rates are often paradoxical with both low and
high SES and food insecurity with food prevalence. Unhealthy diets, the role of food
advertising, family structure, urban dwellers, and northern regions are also highlighted as
contributing factors. A GVC analysis can be connected to many of these. We briefly highlight
each determinant below.
The paradox of hunger and obesity can be found in Mexico. Scholars have found that
food insecurity is linked to obesity, even when controlling for age, sex and socioeconomic status.
In a study done in 2007, the highest rate of overweight children was found in children with
severe food insecurity at 15.8 per cent, followed by children with moderate food insecurity at
10.4 percent, and by food secure children at 6.9 percent. The children with food insecurity had a
greater consumption of fatty cereals, salty foods, and high energy density sweets.57 The research

50
concluded that food insecurity is related to greater risk of overweight possibly because the more
food insecure households acquire more low cost and high energy density foods.
In Mexico, there is also a growing presence of fast food restaurants that are changing
children’s diets and consumption habits as highlighted with the examples of McDonald’s and
KFC. Fast food has started to replace home-cooked meals, especially in the case where both
parents work outside of the house and have less time to devote to home cooking. Also, children
tend to snack more on junk food and similar unhealthy snacks such as sweets and pastries. In
addition, street stands have contributed to the trend of unhealthy diet consumption. Street stands
sell greasy and carbohydrate-based Mexican food such as fried tacos, tamales, and quesadillas.
There has also been an increase in soft drink consumption; Mexico is currently the largest per
capita carbonates consumer in the world as the above figures from PepsiCo also allude to. For
example, researchers studying indigenous communities found that the Yucatec Mayan diets had
become increasingly dependent on purchased foods, and reflected a greater consumption of
commercialized processed foods.58 Coca-Cola, an international icon of United States culture,
along with other local and internationally owned calorie-dense but nutrient-poor snack foods,
had become a common element of Mayan diets, leading to what they call "coca-colonization."
This change in diet is buttressed by aggressive marketing from corporations. Strategic
marketing of food and snacks for children has influenced what type of products attracts their
attention, and which type they ultimately consume affecting their weight gain. In Mexico,
marketing to children is usually done by advertising and featuring popular TV or movie
characters, and also including small trinkets, such as action figures in packaging of such
products. Many products have tie-ins with these characters, which are also an important factor
for other important items like toys and clothing. Junk food and beverage companies advertise
51
and operate without regulations in Mexico. A recent study by researchers at Stanford University
in California showed that Mexico has the greatest number of junk-food ads per hour on
television, plus worrying indices of infant obesity while there are no regulations applied to
advertising for children.59 Groups such as the EPC, a consumer protection group, have worked
to censure the Kellogg and Nestlé companies, which it accuses of being jointly responsible for
the increasing number of overweight kids in the country because of the marketing of their
various cereal brands.
Family structure is also argued to contribute to childhood obesity in Mexico. In 2005
Flores and colleagues found that maternal overweight and obesity are risk factors for overweight
or obesity in Mexican school-age children (ages 5-11).60 Interventions to prevent obesity in
children should be aimed towards promoting family lifestyle changes and modifying obesity-
inclined environments. In 2007, Duerksen found that greater family support for healthful eating
was associated with fewer snacks and more fiber consumed.61 Children (ages 8-18) of parents
who purchased food products that their children had seen advertised on television reported
consuming more snacks and more fat, and they spent more money on fast food and snacks. This
research concluded that family-based interventions are needed to moderate the potential
influence of television-advertised food products on children's requests for these food products.
In Mexico, urban residents have vastly different lifestyles than rural residents which are
argued can contribute to higher childhood obesity rates.62 These lifestyles create their own
patterns of food demand and time allocation. The consequences for diets, physical activity, and
health have been enormous. Inhabitants from urban zones consume fewer fruits and vegetables
than their rural counterparts, and are prone to eat fat and carbohydrate-based fast food. Urban
residents obtain a much higher proportion of energy from fats and sweeteners than do rural
52
residents. Most urban dwellers also eat greater amounts of animal products than their rural
counterparts. Urbanites consume a more diversified diet and more micronutrients and animal
proteins than rural residents but with considerably higher intakes of refined carbohydrates,
processed foods, and saturated and total fat and lower intakes of fiber. Increasing incomes
partially explain this turn toward fattier foods and sweeteners, but there also seems to be an
upward shift in consumer demand for sweeteners and higher-fat products at any given income
level. Greater penetration of mass media and modern marketing approaches into the lives of
urban residents may account for this shift in food choices. Also, urban work now requires less
physical exertion and allows more leisure. Leisure activity has been transformed, particularly by
changes in food preparation, production, and processing and by the revolutionary penetration of
the mass media into the developing world.
Lastly, one characteristic of childhood obesity is evident when you look at the situation
geographically, particularly in the northern region of the country. A study published by the Pan
American Health Organization in 2004 showed that in the mostly Hispanic population that lives
on either side of the Mexican-American border, rates of overweight, obesity, and diabetes are
higher than national averages in both countries.63 For adults it is acute. Seventy-four percent of
men and 70 percent of women are either overweight or obese. Sixteen percent were diabetic
compared to a 14.9 percent national rate in Mexico and the United States rate of 13.9 percent.
In the northern region of Mexico, in 1999, 35 percent of the children aged 6–11 years were over
the 85th percentile body mass index (BMI) from NCHS. The greatest prevalence of overweight
and obesity existed in the youngest children, who were 5, 44 percent, and 6, 46 percent years of
age. On the other hand, in the southern and rural regions of Mexico the prevalence of
overweight and obesity in children of the same age was lower, 22 percent.

53
A research study by Cruz and colleagues showed that the increase in unemployment and
lowering of wages led thousands of indigenous people in the Mexican countryside to join the
migratory flow towards the United States.64 Indian migration became massive from south to
north and from rural to urban areas in the mid-1980. Tijuana is considered one of the main
places maintained as an intermediate destination. Its location on the Mexico–US border allows
crossborder mobility for some family members, to travel between the agricultural fields in
northern Mexico and southwestern United States. Although recent migrants live under
precarious conditions in Mexico and the USA, they have more access to food than they did in
their original communities. Nevertheless, food insufficiency and hunger may coexist with the
presence of obesity.
The results of this study demonstrate simultaneous coexistence of obesity, hunger,
undernutrition and limited food group consumption among Indian children living in a large,
prosperous US–Mexico border city as alluded to in the above sections. The high 38 percent
prevalence of obesity is similar to the prevalence found in the NHANES II for American Indians
between 1976 and 1980. However, the prevalence found in this population is slightly higher
than the prevalence of obesity, 35 percent, for the same age group in the northern region of
Mexico from a Mexican survey conducted during 1999. The parents of the children living in
Tijuana were born in rural areas of southern Mexico, where the prevalence is reported to be 22
percent. Thus, the prevalence of obesity among these children in Tijuana is almost twice as large
as its prevalence among the children of their relatives living in the southern rural areas of
Mexico. The greatest prevalence of overweight and obesity among the youngest children might
also be the result of low health care and food intake during prenatal care. Parents of these

54
children migrate from areas with high prevalence of undernutrition; therefore, mothers may have
had a higher risk for undernutrition during gestation.
VII. References 1 Glass T, McAtee M. Behavioral science at the crossroads in public health: Extending horizons, envisioning the future. Social Science & Medicine. 2006;62:1650-1671. 2 EU Platform Briefing Paper. EU Platform on Diet, Physical Activity and Health. International Obesity Task Force; 2005. March 15. 3 Anderson P, Butcher K. Childhood obesity: trends and potential causes. Future of Children. 2006;16(1):19-45. 4 Factsheet on childhood obesity. Oxford Health Alliance. Web site. http://www.oxha.org/knowledge/publications/oxha-childhood-obesity-factsheet.pdf. 2005. Accessed August 2007. 5 1 6 1 7 Lakdawall D, Philipson T. Technological change and the growth of obesity. 2006. Cambridge, MA: National Bureau of Economic Research. Working Paper 8946. Cutler DM, Glaeser EL, Shapiro JM. Why have Americans become more obese? Journal of Economic Perspectives. 2003;17:93-118. Cawley J. Markets and childhood obesity policy. Future of Children. 2006;16:69-88. Institute of Medicine. Food Marketing to Children and Youth Threat or Opportunity. Washington, D.C.: The National Academies Press; 2006. Schor J, Ford M. From tastes great to cool: children’s food marketing and the rise of the Symbolic. Journal of Law, Medicine & Ethics. 2007;Spring:10-21. James J, Thomas P, Cavan D, Kerr D. Preventing childhood obesity by reducing consumption of carbonated drinks: cluster randomized controlled trial. British Medical Journal. 2004;328:1237-40. Thompson OM, Ballew C, Resnicow K, et al. Food purchased away from home as a predictor of change in BMI z- score among girls. International Journal of Obesity & Related Metabolic Disorders. 2004;28:282-89. Taveras EM, Berkey CS, Rifas-Shiman, et al. Association of consumption of fried food away from home with body mass index and diet quality in older children and adolescents. Pediatrics. 2005;116:E518-534. MacPherson K. Development Experts Say Children Suffer due to Lack of Unstructured Fun. Pittsburgh Post-Gazette (Pittsburgh, PA). October 1, 2002. Schanzenbach D. Do School Lunches Contribute to Childhood Obesity? Chicago, IL: Mimeo; 2005. Dietz W, Gortmaker S. Do we fatten our children at the television? obesity and television viewing in children and adolescents. Pediatrics. 2005;75:807-12. Sallis J, Glanz K. The role of built environments in physical activity, eating, and obesity in childhood. Future of Children. 2006;16:89-108. Kratt P, Reynolds K, Shewchuk R. The role of availability as a moderator of family fruit and vegetable consumption. Health Education and Behavior. 2000;27:471-482. Savage J, Fisher J, Birch L. Parental influence on eating behavior: conception to adolescence. Journal of Law, Medicine & Ethics. 2007;Spring: 22-34. 8 Kennedy G, Nantel G, Shetty P. Globalization of food systems in developing countries: impact on food security and nutrition. Rome, Italy: Food and Agricultural Organization (FAO) of the United Nations. Rome. 9 Murphy S. WTO Agreement on Agriculture: suitable model for a global food system? Foreign Policy in Focus. 2002;7(8). 10 Pinstrup-Anderson P. Achieving sustainable food security for all: required policy action. Paper prepared for Mansholt Lecture. Wageningen University, the Netherlands. 2001; November 14. 11 Monteiro C, Moura E, Conde W, Popkin B. Socioeconomic status and obesity in adult populations of developing countries: a review. Bulletin of the World Health Organization. 2004;82(12):940-812.

55
12 Lang T. Food industrialization and food power: implications for food governance. Development Policy Review. 2003;21(5-6):555-568. 13 Popkin B, Gordon-Larsen P. The nutrition transition: worldwide obesity dynamics and their determinants. International Journal of Obesity. 2004;28(S1-S9):52-59. 14 Concepts and tools. Global Value Chains. Web Site. http://www.globalvaluechains.org/concepts.html. Accessed October 9, 2007. 15 Gereffi G, Humphrey J, Timothy S. The governance of global value chains. Review of International Political Economy. 2005;12(1). 16 Regmi A, Gehlar Mark. New directions in global food markets. Agriculture Information Bulletin. Web site. http://www.ers.usda.gov/publications/aib794/aib794.pdf 2005; Number 794. February. Accessed October 1, 2007. 17 Yum! Brands. Annual Report. 2006. 18 Readon T, Henson S, Berdegue J. ‘Proactive fast-tracking’ diffusion of supermarkets in developing countries: implications for market institutions and trade. Journal of Economic Geography. 2007; March 1: 1-33. 19 McDonald’s Annual Reports. 1998. 1999. 2000. 2001. 2002. 2005. 2006. 20 McDonald’s. 2006 Worldwide Corporate Responsibility Report. Web Site. http://www.mcdonalds.com/corp/values/report.html. Accessed October 10, 2007. 21 The Scripps Research Institute, McDonald’s Align to Fight Childhood Obesity and Type 2 Diabetes. QSR. 2006; September 14. Web site. http://www.qsrmagazine.com/articles/news/story.phtml?id=5115. Accessed October 16, 2007. 22 Yum! Brands. Media Documents. Top 25 Markets of KFC. Web site. http://www.yum.com/investors/media/units.pdf. Accessed August 30, 2007. 23 Li D. Do in China as the Chinese do: an overview of KFC’s localization strategies in China. 2004. Web site. http:blog.lidan.net/2004/04kfcs_localization_strategies_in_china.html. Accessed August 15, 2007. 24 21
25 21 26 Yum! Brands spent $550K lobbying in 2007. CNNMoney. 2007 Web site. http://cnn.com/news/newsfeeds/articles/newstex/AFX-0013. Accessed September 18, 2007. 27 Simon M. Appetite for profit how the food industry undermines our health and how to fight back. New York: Nation Books; 2006. 28 Kraft Annual Report. 2006. 29 Kraft. Kraft’s most memorable marketing moments. Web site. http://www.kraft.com/100/innovations/marketing.html. Accessed October 15, 2007. 30 Kraft. Nutritional health and wellness. Web site. http://www.kraft.com/responsibility/nhw.aspx. Accessed October 15, 2007. 31 Nestlé. Nestlé’s Proactive Approach. Web site: http://www.nestlenutrition.com/en/nutrition_weight/young_obese_product.htm. Accessed September 16, 2007. 32 Green H. Global obesity: Nestlé initiatives in nutrition, health, and wellness. Nutrition Reviews. 2006; February. 33 PepsiCo Net Sales by Region in 2000-2006. Euromonitor International. 34 Pepsi was one of the earliest multinational companies. Foreign Direct Investment (FDI) Magazine. 2002; August. Web site. http://www.fdimagizine.com/news/fullstory.php/aid/46/Pepsi_was_one_of the_earliest_ multinational_companiesChina.html. Accessed September 28, 2007. 35 Merrett N. Pepsi goes local in Chinese expansion. Beveragedaily.com. 2007; April 4. Web site. http://www.beveragedaily.com/news/ng.asp?n=75487-pepsico-china-r-d-workforce. Accessed September 27, 2007. 36 Brush M. Pepsi pops with a snack-food empire. MSN Money. 2006; July 12. Web site. http://articles.moneycentral.msn.com/Investing/CompanyFocus/PepsiPopsWithASnackFoodEmpire.aspx. Accessed September 28, 2007. 37 McNeal JU, Yeh C. Development of consumer behavior patterns among Chinese Children. Journal of Consumer Marketing. 1997;14(1):45-60. 38 PepsiCo, Inc. PepsiCo’s Health & Wellness Initiatives. Web site. www.smartspot.com. 2006. Accessed on September 20, 2007. 39 Ji C, Sun J, Chen T. Dynamic analysis on the prevalence of obesity and overweight school-age children and adolescents in recent 15 years in China. China Journal of Epidemiology. 2004; 25:103-108. 40 Yang J. China’s one-child policy and overweight children in the 1990s. Social Science & Medicine.

56
2007;64:2043-2057. 41 Waller CE, Du S, Popkin BM. Patterns of overweight, inactivity, and snacking in Chinese children. Obesity Research. 2003;11(8): 957-961. 42 35 43 Liu, J. Doctors gain from bulging obesity in China. Bloomberg News. 2007; January 10. Web site. http://www.iht.com/bin/print.php?id=4159189. Accessed October 10, 2007. 44 41 45 Tianbi Q. Obesity in China. China Today Report. 2006. Web site. http://www.chinatoday.com.cn/English/e2006/e200611/p12.htm. Accessed October 10, 2007. 46 37 47 Ho TF, Yip WC, Tay JS, Rajan U. Social class distribution of obese Chinese children. Journal of Singapore Paediatric Society. 1991;33(1-2): 55-58. 48 37 49 38 50 39 51 Tudor-Locke C, Ainsworth BE, Adair LS, Du S, Popkin BM. Physical activity and inactivity in Chinese school-aged youth: the China Health and Nutrition Survey. International Journal of Obesity. 2003; 27:1093-1099. 52 Du S, Mroz TA, Zhai F, Popkin BM. Rapid income growth adversely affects diet quality in China—particularly for the poor! Social Science & Medicine. 2004;59:1505-1515. 53 Chunming C. Fat intake and nutritional status of children in China. American Journal of Clinical Nutrition. 2000;72:1368S-72S. 54 43 55 38 56 Rivera J, Barquera S, Prado B, Ridaura R. Preventing Obesity in Mexican Children and Adolescents. U.S.-Mexico Workshop on Preventing Obesity in Children and Youth of Mexican Origin. Web site. http://books.nap.edu/openbook.php?isbn=0309103258&page=81. Accessed September 30, 2007. 57 Ortiz-Hernandes L, Acosta-Gutierrez MN, Nunez-Perez AE, Peralta-Fonseca N, Ruiz-Gomez Y. Food insecurity and obesity are positively associated in Mexico City schoolchildren. La Revista de Investigacion Clinica. 2007;59:32-41. 58 Leatherman TL, Goodman A. Coca-colonization of diets in the Yucatan. Social Science & Medicine. 2005; 61:833-846. 59 Stanford study cited in Food Advertising News-Health Care Industry Today. Web site: health.einnews.com/news/food-advertizing?offset=35. Assessed October 12, 2007. 60 Flores M, Carrion C, Barquera S. Maternal overweight and obesity in Mexican school-age children. National Nutrition Survey (1999). 2005;47: 447-450. 61 Duerksen Susan, et al. Family restaurant choices are associated with child and adult overweight status in Mexican-American families. Journal of the American Dietic Association. 2007;10. 62 56 63 Carey, FJ. Malnutrition in Mexico. Web site. http://www.worldfoodprize.org/assets/YouthInstitute/05proceedings/FarragutHighSchool.pdf. Assessed October 12, 2007 64 Jimenes-Cruz A, Bacardí-Gascón M, Spinkler A. Obesity and hunger among Mexican-Indian migrant children on the US–Mexico border. International Journal of Obesity. 2003;27:740–747.