Embed Size (px)
Citation preview

RESEARCH ARTICLE
A global evaluation of forest interior area dynamics usingtree cover data from 2000 to 2012
Kurt Riitters . James Wickham .
Jennifer K. Costanza . Peter Vogt
Received: 3 April 2015 / Accepted: 25 August 2015 / Published online: 7 September 2015
� Springer Science+Business Media Dordrecht (outside the USA) 2015
Abstract
Context Published maps of global tree cover derived
from Landsat data have indicated substantial changes
in forest area from 2000 to 2012. The changes can be
arranged in different patterns, with different conse-
quences for forest fragmentation. Thus, the changes in
forest area do not necessarily equate to changes in
forest sustainability.
Objective The objective is to assess global and
regional changes in forest fragmentation in relation to
the change of forest area from 2000 to 2012.
Methods Using published global tree cover data,
forest and forest interior areas were mapped in 2000
and 2012. The locations of forest interior change were
compared to the locations of overall forest change to
identify the direct (pixel level) and indirect (landscape
level) components of forest interior change. The
changes of forest interior area were compared to the
changes of total forest area in each of 768 ecological
regions.
Results A 1.71 million km2 (3.2 %) net loss of global
forest area translated to a net loss of 3.76 million km2
(9.9 %) of forest interior area. The difference in loss
rates was consistent in most of the 768 ecological
regions. The indirect component accounted for 2.44
Electronic supplementary material The online version ofthis article (doi:10.1007/s10980-015-0270-9) contains supple-mentary material, which is available to authorized users.
Special issue: Macrosystems ecology: Novel methods and new
understanding of multi-scale patterns and processes.
Guest Editors: S. Fei, Q. Guo, and K. Potter.
K. Riitters (&)
Southern Research Station, United States Department of
Agriculture, Forest Service, 3041 Cornwallis Road,
Research Triangle Park, NC 27709, USA
e-mail: [email protected]
J. Wickham
National Exposure Research Laboratory, United States
Environmental Protection Agency,
Research Triangle Park, NC 27711, USA
J. K. Costanza
North Carolina Cooperative Fish and Wildlife Research
Unit, Department of Applied Ecology, North Carolina
State University, Raleigh, NC 27695, USA
Present Address:
J. K. Costanza
Department of Forestry and Environmental Resources,
North Carolina State University, Raleigh, NC 27695, USA
P. Vogt
Joint Research Centre (JRC), European Commission,
21027 Ispra, Italy
123
Landscape Ecol (2016) 31:137–148
DOI 10.1007/s10980-015-0270-9

million km2 of the net forest interior change, com-
pared to 1.32 million km2 that was attributable to the
direct component.
Conclusion Forest area loss alone from 2000 to 2012
underestimates ecological risks from forest fragmen-
tation. In addition to the direct loss of forest, there was
a widespread shift of the remaining global forest to a
more fragmented condition.
Keywords Spatial analysis � Forest fragmentation �Monitoring � Assessment
Introduction
Forest loss and degradation threaten the maintenance
of ecological services in forested landscapes (Millen-
nium Ecosystem Assessment 2005). Global monitor-
ing tends to focus on total forest area (e.g., FAO 2010)
but assessments are imprecise when they combine
country-level data (Mather 2005). An abundance of
satellite imagery has created opportunities to improve
forest inventory and conservation of forest resources
(Asner 2014; Rose et al. 2014). The publication of the
Landsat archive by the U.S. Geological Survey and the
National Aeronautics and Space Administration has
stimulated a variety of efforts to map forest extent and
change (Loveland and Dwyer 2012; Wulder et al.
2012; Roy et al. 2014). For example, Sexton et al.
(2013) produced a global forest map at the native
30 9 30 m (0.09 ha) spatial resolution of the Landsat
data. Remotely sensed data also provide a synoptic
perspective needed to monitor forest consistently
through time (Innes and Koch 1998; Pelletier and
Goetz 2015). From a global analysis of the Landsat
data to map tree cover, disturbance, and recovery,
Hansen et al. (2013) reported a gross forest loss of 2.29
million km2 from 2000 to 2012.
Does the reported decrease of global forest area
equate to increased risk of ecological impacts? The
answer is probably no, because forest area alone is an
incomplete indicator of the capacity of forests to
sustain ecological services (Chazdon 2008). The
spatial pattern of forest is important because the same
area of forest can be arranged in different ways on the
landscape with important consequences for ecosystem
processes (Harris 1984; Andren 1994; Pickett and
Cadenasso 1995; Fahrig 2003). Similarly, forest area
loss is an incomplete indicator of ecosystem changes
because the loss can occur in different patterns.
Furthermore, gross forest loss is an incomplete
indicator because forest gains may offset losses (Kurz
2010). Analysis of forest fragmentation has to account
for the patterns of the forest losses and gains in relation
to the extant forest patterns (Wickham et al. 2007,
2008).
In this study, we analyzed global changes in forest
fragmentation from 2000 to 2012 by mapping the
changes in forest interior area that were associated
with the forest gains and losses identified by Hansen
et al. (2013). Forest interior area is an ecologically
relevant indicator of fragmentation because most
natural forests cover large areas such that the natural
state of most forest area is interior. Forest area that is
not interior is at greater risk from ‘‘edge effects’’ that
range from higher rates of invasive species and
atmospheric pollutant deposition to less mesic micro-
climates (Kapos 1989; Robinson et al. 1995; Murcia
1995; Keddy and Drummond 1996; Laurance et al.
1998; Gascon et al. 2000; Cadenasso and Pickett 2001;
Weathers et al. 2001; Ries et al. 2004; Laurance 2008).
While single-date global analyses of forest fragmen-
tation have been conducted at 1 km2 resolution
(Riitters et al. 2000) and 0.09 ha resolution (Haddad
et al. 2015), the new forest maps for 2000 and 2012
permit an analysis of change in global forest fragmen-
tation, as defined by change in forest interior.
Forest interior is a contextual attribute in the sense
that a forest pixel is interior (or not interior) because of
the landscape context surrounding that pixel. Spatial
analysis of the new forest maps is required because
edge influences may extend hundreds of meters from
forest edge (Murcia 1995; Laurance 2000; Ries et al.
2004), making it unlikely that an isolated 30 9 30 m
forest parcel will support real forest interior condi-
tions. One approach to mapping forest interior is to
label a given forest pixel as interior (or not interior)
based on the proportion of its surrounding landscape
that is forest (Riitters et al. 1997). The resulting forest
interior map is the subset of the forest map which
meets a defined threshold proportion. This approach is
equivalent to a commonly used definition of forest
interior based on minimum distance to edge when the
threshold value is 1, and it reduces the influence of
isolated and small forest changes when the threshold
value is less than 1 (Riitters et al. 2002).
As the forest area changes over time, the patterns of
gains and losses cause direct and indirect changes of
138 Landscape Ecol (2016) 31:137–148
123
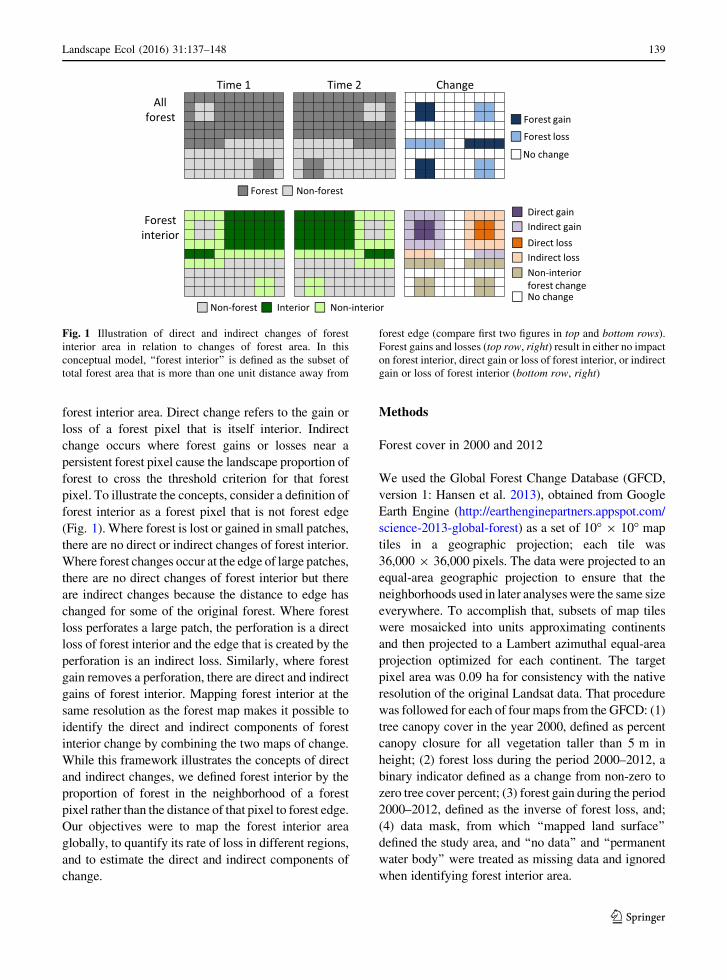
forest interior area. Direct change refers to the gain or
loss of a forest pixel that is itself interior. Indirect
change occurs where forest gains or losses near a
persistent forest pixel cause the landscape proportion of
forest to cross the threshold criterion for that forest
pixel. To illustrate the concepts, consider a definition of
forest interior as a forest pixel that is not forest edge
(Fig. 1). Where forest is lost or gained in small patches,
there are no direct or indirect changes of forest interior.
Where forest changes occur at the edge of large patches,
there are no direct changes of forest interior but there
are indirect changes because the distance to edge has
changed for some of the original forest. Where forest
loss perforates a large patch, the perforation is a direct
loss of forest interior and the edge that is created by the
perforation is an indirect loss. Similarly, where forest
gain removes a perforation, there are direct and indirect
gains of forest interior. Mapping forest interior at the
same resolution as the forest map makes it possible to
identify the direct and indirect components of forest
interior change by combining the two maps of change.
While this framework illustrates the concepts of direct
and indirect changes, we defined forest interior by the
proportion of forest in the neighborhood of a forest
pixel rather than the distance of that pixel to forest edge.
Our objectives were to map the forest interior area
globally, to quantify its rate of loss in different regions,
and to estimate the direct and indirect components of
change.
Methods
Forest cover in 2000 and 2012
We used the Global Forest Change Database (GFCD,
version 1: Hansen et al. 2013), obtained from Google
Earth Engine (http://earthenginepartners.appspot.com/
science-2013-global-forest) as a set of 10� 9 10� map
tiles in a geographic projection; each tile was
36,000 9 36,000 pixels. The data were projected to an
equal-area geographic projection to ensure that the
neighborhoods used in later analyses were the same size
everywhere. To accomplish that, subsets of map tiles
were mosaicked into units approximating continents
and then projected to a Lambert azimuthal equal-area
projection optimized for each continent. The target
pixel area was 0.09 ha for consistency with the native
resolution of the original Landsat data. That procedure
was followed for each of four maps from the GFCD: (1)
tree canopy cover in the year 2000, defined as percent
canopy closure for all vegetation taller than 5 m in
height; (2) forest loss during the period 2000–2012, a
binary indicator defined as a change from non-zero to
zero tree cover percent; (3) forest gain during the period
2000–2012, defined as the inverse of forest loss, and;
(4) data mask, from which ‘‘mapped land surface’’
defined the study area, and ‘‘no data’’ and ‘‘permanent
water body’’ were treated as missing data and ignored
when identifying forest interior area.
Time 1 Time 2 ChangeAll
forest
Forestinterior
Forest Non-forest
Forest gain
Forest loss
No change
Non-forest Interior Non-interior
Direct gainIndirect gain
No change
Direct lossIndirect lossNon-interiorforest change
Fig. 1 Illustration of direct and indirect changes of forest
interior area in relation to changes of forest area. In this
conceptual model, ‘‘forest interior’’ is defined as the subset of
total forest area that is more than one unit distance away from
forest edge (compare first two figures in top and bottom rows).
Forest gains and losses (top row, right) result in either no impact
on forest interior, direct gain or loss of forest interior, or indirect
gain or loss of forest interior (bottom row, right)
Landscape Ecol (2016) 31:137–148 139
123
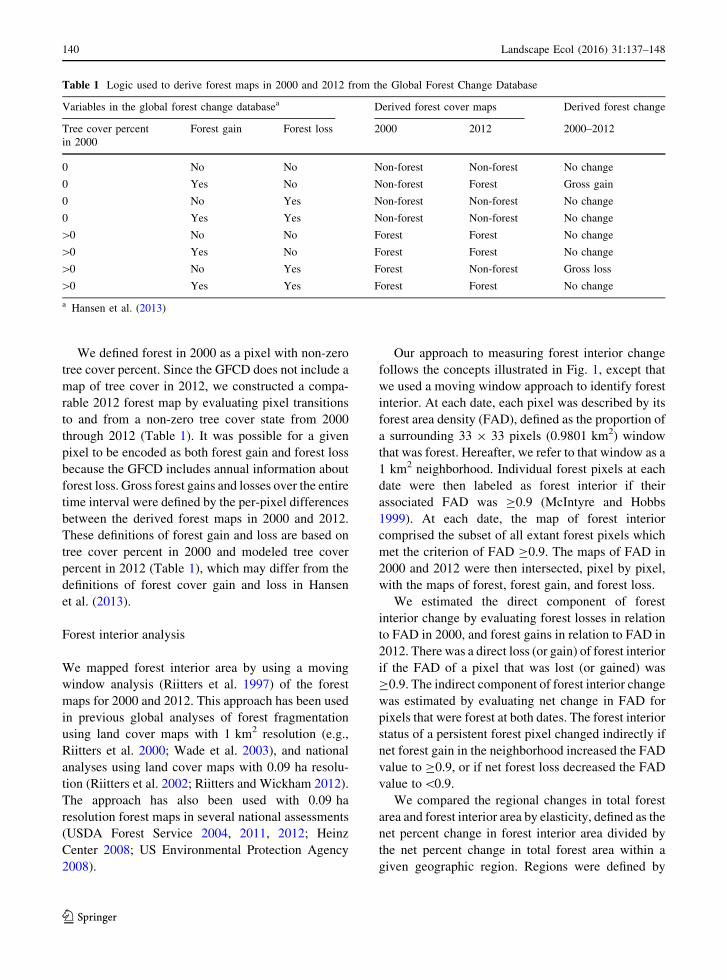
We defined forest in 2000 as a pixel with non-zero
tree cover percent. Since the GFCD does not include a
map of tree cover in 2012, we constructed a compa-
rable 2012 forest map by evaluating pixel transitions
to and from a non-zero tree cover state from 2000
through 2012 (Table 1). It was possible for a given
pixel to be encoded as both forest gain and forest loss
because the GFCD includes annual information about
forest loss. Gross forest gains and losses over the entire
time interval were defined by the per-pixel differences
between the derived forest maps in 2000 and 2012.
These definitions of forest gain and loss are based on
tree cover percent in 2000 and modeled tree cover
percent in 2012 (Table 1), which may differ from the
definitions of forest cover gain and loss in Hansen
et al. (2013).
Forest interior analysis
We mapped forest interior area by using a moving
window analysis (Riitters et al. 1997) of the forest
maps for 2000 and 2012. This approach has been used
in previous global analyses of forest fragmentation
using land cover maps with 1 km2 resolution (e.g.,
Riitters et al. 2000; Wade et al. 2003), and national
analyses using land cover maps with 0.09 ha resolu-
tion (Riitters et al. 2002; Riitters and Wickham 2012).
The approach has also been used with 0.09 ha
resolution forest maps in several national assessments
(USDA Forest Service 2004, 2011, 2012; Heinz
Center 2008; US Environmental Protection Agency
2008).
Our approach to measuring forest interior change
follows the concepts illustrated in Fig. 1, except that
we used a moving window approach to identify forest
interior. At each date, each pixel was described by its
forest area density (FAD), defined as the proportion of
a surrounding 33 9 33 pixels (0.9801 km2) window
that was forest. Hereafter, we refer to that window as a
1 km2 neighborhood. Individual forest pixels at each
date were then labeled as forest interior if their
associated FAD was C0.9 (McIntyre and Hobbs
1999). At each date, the map of forest interior
comprised the subset of all extant forest pixels which
met the criterion of FAD C0.9. The maps of FAD in
2000 and 2012 were then intersected, pixel by pixel,
with the maps of forest, forest gain, and forest loss.
We estimated the direct component of forest
interior change by evaluating forest losses in relation
to FAD in 2000, and forest gains in relation to FAD in
2012. There was a direct loss (or gain) of forest interior
if the FAD of a pixel that was lost (or gained) was
C0.9. The indirect component of forest interior change
was estimated by evaluating net change in FAD for
pixels that were forest at both dates. The forest interior
status of a persistent forest pixel changed indirectly if
net forest gain in the neighborhood increased the FAD
value to C0.9, or if net forest loss decreased the FAD
value to\0.9.
We compared the regional changes in total forest
area and forest interior area by elasticity, defined as the
net percent change in forest interior area divided by
the net percent change in total forest area within a
given geographic region. Regions were defined by
Table 1 Logic used to derive forest maps in 2000 and 2012 from the Global Forest Change Database
Variables in the global forest change databasea Derived forest cover maps Derived forest change
Tree cover percent
in 2000
Forest gain Forest loss 2000 2012 2000–2012
0 No No Non-forest Non-forest No change
0 Yes No Non-forest Forest Gross gain
0 No Yes Non-forest Non-forest No change
0 Yes Yes Non-forest Non-forest No change
[0 No No Forest Forest No change
[0 Yes No Forest Forest No change
[0 No Yes Forest Non-forest Gross loss
[0 Yes Yes Forest Forest No change
a Hansen et al. (2013)
140 Landscape Ecol (2016) 31:137–148
123
maps (World Wildlife Fund 2004) of the 14 terrestrial
biomes and 768 terrestrial ecological regions
described by Olson et al. (2001). We called six of
the 14 biomes ‘‘forest biomes’’ based on an expecta-
tion that the original land cover in those biomes was
dominated by forest. The remaining ‘‘non-forest
biomes’’ were included because we were interested
in all global forest area, and the non-forest biomes
contain a substantial share of the global tree-covered
area (Hansen et al. 2013). We excluded the Oceanic
and Antarctic biomes, ecological regions that were
outside the area of the tiles retrieved from the GFCD,
uninteresting ecological regions such as ‘‘rock and
ice,’’ and the small ecological regions that were not
represented after overlaying the GFCD.
In a moving window analysis, the measurement
scale is defined by the choices of window size and
threshold FAD value. In this study we used a single
measurement scale in order to focus on temporal
changes in forest interior area in relation to changes in
total forest area, and the geography of that relation-
ship. We selected the measurement scale based on our
experience conducting multi-scale moving window
analyses using national and global forest maps with
various spatial resolutions. The use of different
window sizes or threshold FAD values would natu-
rally change the absolute amount of forest interior area
at each date, which would change the magnitude of
loss rates and elasticity but not the geography of the
relationships between total forest change and forest
interior change (Riitters and Wickham 2012).
Although we used a consistent method globally,
global aggregate results are difficult to interpret
because they obscure which types of forest are lost
or gained. For example, the loss of tropical forest is
arguably not offset by a gain of temperate woodland.
Those differences are unimportant at the measurement
scale we used to identify forest interior because large
differences in forest types do not typically occur at that
scale. To account for large differences in forest types
over larger geographic extents, we summarized
changes within ecological regions and biomes (Olson
et al. 2001). In this way, our approach provided a
globally-consistent protocol to identify forest interior
while providing regional scale information about
forest interior trends in relation to total forest area
trends.
Results
Global
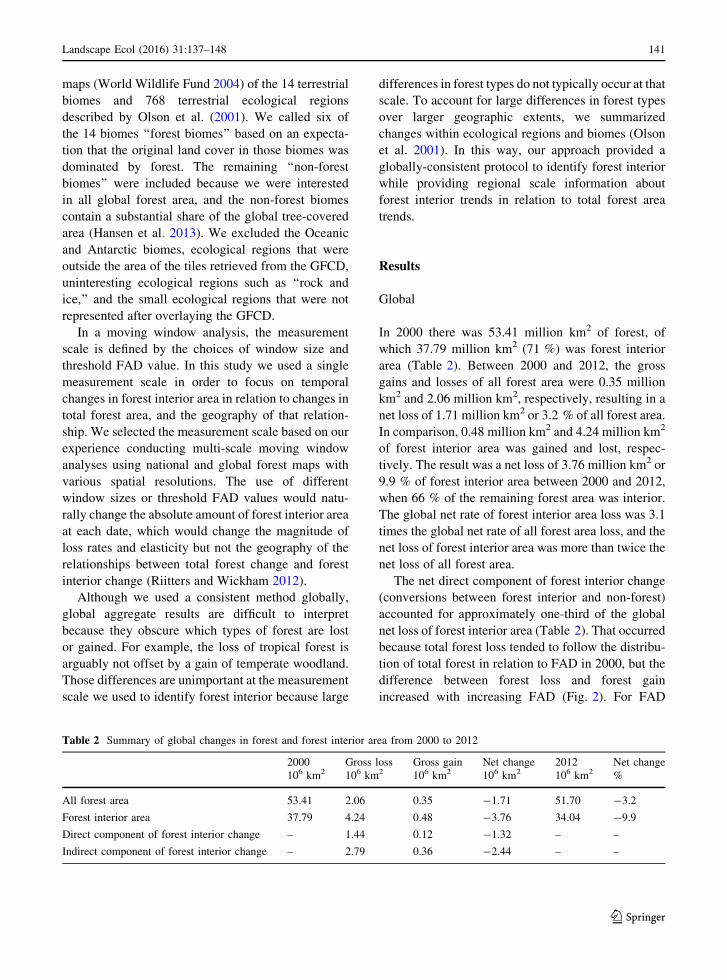
In 2000 there was 53.41 million km2 of forest, of
which 37.79 million km2 (71 %) was forest interior
area (Table 2). Between 2000 and 2012, the gross
gains and losses of all forest area were 0.35 million
km2 and 2.06 million km2, respectively, resulting in a
net loss of 1.71 million km2 or 3.2 % of all forest area.
In comparison, 0.48 million km2 and 4.24 million km2
of forest interior area was gained and lost, respec-
tively. The result was a net loss of 3.76 million km2 or
9.9 % of forest interior area between 2000 and 2012,
when 66 % of the remaining forest area was interior.
The global net rate of forest interior area loss was 3.1
times the global net rate of all forest area loss, and the
net loss of forest interior area was more than twice the
net loss of all forest area.
The net direct component of forest interior change
(conversions between forest interior and non-forest)
accounted for approximately one-third of the global
net loss of forest interior area (Table 2). That occurred
because total forest loss tended to follow the distribu-
tion of total forest in relation to FAD in 2000, but the
difference between forest loss and forest gain
increased with increasing FAD (Fig. 2). For FAD
Table 2 Summary of global changes in forest and forest interior area from 2000 to 2012
2000 Gross loss Gross gain Net change 2012 Net change
106 km2 106 km2 106 km2 106 km2 106 km2 %
All forest area 53.41 2.06 0.35 -1.71 51.70 -3.2
Forest interior area 37.79 4.24 0.48 -3.76 34.04 -9.9
Direct component of forest interior change – 1.44 0.12 -1.32 – –
Indirect component of forest interior change – 2.79 0.36 -2.44 – –
Landscape Ecol (2016) 31:137–148 141
123
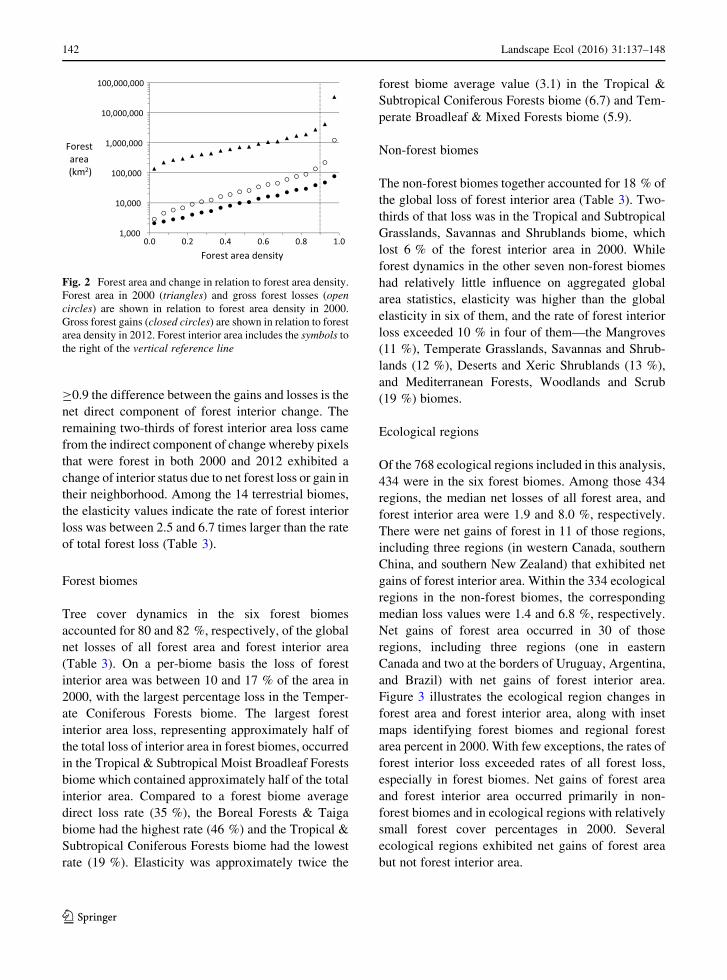
C0.9 the difference between the gains and losses is the
net direct component of forest interior change. The
remaining two-thirds of forest interior area loss came
from the indirect component of change whereby pixels
that were forest in both 2000 and 2012 exhibited a
change of interior status due to net forest loss or gain in
their neighborhood. Among the 14 terrestrial biomes,
the elasticity values indicate the rate of forest interior
loss was between 2.5 and 6.7 times larger than the rate
of total forest loss (Table 3).
Forest biomes
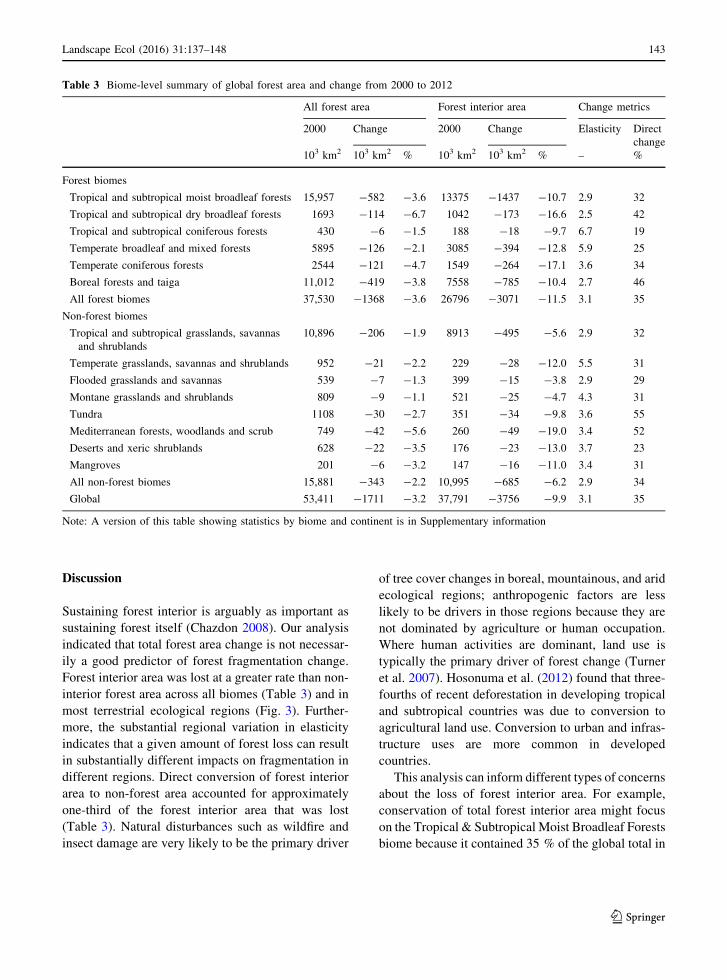
Tree cover dynamics in the six forest biomes
accounted for 80 and 82 %, respectively, of the global
net losses of all forest area and forest interior area
(Table 3). On a per-biome basis the loss of forest
interior area was between 10 and 17 % of the area in
2000, with the largest percentage loss in the Temper-
ate Coniferous Forests biome. The largest forest
interior area loss, representing approximately half of
the total loss of interior area in forest biomes, occurred
in the Tropical & Subtropical Moist Broadleaf Forests
biome which contained approximately half of the total
interior area. Compared to a forest biome average
direct loss rate (35 %), the Boreal Forests & Taiga
biome had the highest rate (46 %) and the Tropical &
Subtropical Coniferous Forests biome had the lowest
rate (19 %). Elasticity was approximately twice the
forest biome average value (3.1) in the Tropical &
Subtropical Coniferous Forests biome (6.7) and Tem-
perate Broadleaf & Mixed Forests biome (5.9).
Non-forest biomes
The non-forest biomes together accounted for 18 % of
the global loss of forest interior area (Table 3). Two-
thirds of that loss was in the Tropical and Subtropical
Grasslands, Savannas and Shrublands biome, which
lost 6 % of the forest interior area in 2000. While
forest dynamics in the other seven non-forest biomes
had relatively little influence on aggregated global
area statistics, elasticity was higher than the global
elasticity in six of them, and the rate of forest interior
loss exceeded 10 % in four of them—the Mangroves
(11 %), Temperate Grasslands, Savannas and Shrub-
lands (12 %), Deserts and Xeric Shrublands (13 %),
and Mediterranean Forests, Woodlands and Scrub
(19 %) biomes.
Ecological regions
Of the 768 ecological regions included in this analysis,
434 were in the six forest biomes. Among those 434
regions, the median net losses of all forest area, and
forest interior area were 1.9 and 8.0 %, respectively.
There were net gains of forest in 11 of those regions,
including three regions (in western Canada, southern
China, and southern New Zealand) that exhibited net
gains of forest interior area. Within the 334 ecological
regions in the non-forest biomes, the corresponding
median loss values were 1.4 and 6.8 %, respectively.
Net gains of forest area occurred in 30 of those
regions, including three regions (one in eastern
Canada and two at the borders of Uruguay, Argentina,
and Brazil) with net gains of forest interior area.
Figure 3 illustrates the ecological region changes in
forest area and forest interior area, along with inset
maps identifying forest biomes and regional forest
area percent in 2000. With few exceptions, the rates of
forest interior loss exceeded rates of all forest loss,
especially in forest biomes. Net gains of forest area
and forest interior area occurred primarily in non-
forest biomes and in ecological regions with relatively
small forest cover percentages in 2000. Several
ecological regions exhibited net gains of forest area
but not forest interior area.
1,000
10,000
100,000
1,000,000
10,000,000
100,000,000
0.0 0.2 0.4 0.6 0.8 1.0
Forestarea(km2)
Forest area density
Fig. 2 Forest area and change in relation to forest area density.
Forest area in 2000 (triangles) and gross forest losses (open
circles) are shown in relation to forest area density in 2000.
Gross forest gains (closed circles) are shown in relation to forest
area density in 2012. Forest interior area includes the symbols to
the right of the vertical reference line
142 Landscape Ecol (2016) 31:137–148
123
Discussion
Sustaining forest interior is arguably as important as
sustaining forest itself (Chazdon 2008). Our analysis
indicated that total forest area change is not necessar-
ily a good predictor of forest fragmentation change.
Forest interior area was lost at a greater rate than non-
interior forest area across all biomes (Table 3) and in
most terrestrial ecological regions (Fig. 3). Further-
more, the substantial regional variation in elasticity
indicates that a given amount of forest loss can result
in substantially different impacts on fragmentation in
different regions. Direct conversion of forest interior
area to non-forest area accounted for approximately
one-third of the forest interior area that was lost
(Table 3). Natural disturbances such as wildfire and
insect damage are very likely to be the primary driver
of tree cover changes in boreal, mountainous, and arid
ecological regions; anthropogenic factors are less
likely to be drivers in those regions because they are
not dominated by agriculture or human occupation.
Where human activities are dominant, land use is
typically the primary driver of forest change (Turner
et al. 2007). Hosonuma et al. (2012) found that three-
fourths of recent deforestation in developing tropical
and subtropical countries was due to conversion to
agricultural land use. Conversion to urban and infras-
tructure uses are more common in developed
countries.
This analysis can inform different types of concerns
about the loss of forest interior area. For example,
conservation of total forest interior area might focus
on the Tropical & Subtropical Moist Broadleaf Forests
biome because it contained 35 % of the global total in
Table 3 Biome-level summary of global forest area and change from 2000 to 2012
All forest area Forest interior area Change metrics
2000 Change 2000 Change Elasticity Direct
change
103 km2 103 km2 % 103 km2 103 km2 % – %
Forest biomes
Tropical and subtropical moist broadleaf forests 15,957 -582 -3.6 13375 -1437 -10.7 2.9 32
Tropical and subtropical dry broadleaf forests 1693 -114 -6.7 1042 -173 -16.6 2.5 42
Tropical and subtropical coniferous forests 430 -6 -1.5 188 -18 -9.7 6.7 19
Temperate broadleaf and mixed forests 5895 -126 -2.1 3085 -394 -12.8 5.9 25
Temperate coniferous forests 2544 -121 -4.7 1549 -264 -17.1 3.6 34
Boreal forests and taiga 11,012 -419 -3.8 7558 -785 -10.4 2.7 46
All forest biomes 37,530 -1368 -3.6 26796 -3071 -11.5 3.1 35
Non-forest biomes
Tropical and subtropical grasslands, savannas
and shrublands
10,896 -206 -1.9 8913 -495 -5.6 2.9 32
Temperate grasslands, savannas and shrublands 952 -21 -2.2 229 -28 -12.0 5.5 31
Flooded grasslands and savannas 539 -7 -1.3 399 -15 -3.8 2.9 29
Montane grasslands and shrublands 809 -9 -1.1 521 -25 -4.7 4.3 31
Tundra 1108 -30 -2.7 351 -34 -9.8 3.6 55
Mediterranean forests, woodlands and scrub 749 -42 -5.6 260 -49 -19.0 3.4 52
Deserts and xeric shrublands 628 -22 -3.5 176 -23 -13.0 3.7 23
Mangroves 201 -6 -3.2 147 -16 -11.0 3.4 31
All non-forest biomes 15,881 -343 -2.2 10,995 -685 -6.2 2.9 34
Global 53,411 -1711 -3.2 37,791 -3756 -9.9 3.1 35
Note: A version of this table showing statistics by biome and continent is in Supplementary information
Landscape Ecol (2016) 31:137–148 143
123

Forestinterior
>50% forest in 2000Forest biomes
Net change
> 1% gain
< 1% change 1 - 5% loss
5 - 10% loss
10 - 20% loss
> 20% loss
Allforest
Fig. 3 Net changes in forest area (top) and forest interior area
(middle) by ecological region from 2000 through 2012.
Terrestrial ecological regions are shaded according to net
changes, using the same legend to facilitate comparisons. The
inset maps (bottom) identify forest biomes (left) and ecological
regions with[50 % forest area (right)
144 Landscape Ecol (2016) 31:137–148
123

2000 and accounted for 38 % of global loss. The
Tropical & Subtropical Grasslands, Savannas and
Shrublands biome contained the second largest share
(24 %) of the global total in 2000, but accounted for
only 13 % of global loss. If instead the goal is to
conserve forest interior in the areas experiencing
relatively rapid rates of loss, attention might instead be
focused on the Temperate Coniferous Forests, the
Mediterranean Forests, Woodlands and Scrub, and the
Tropical and Subtropical Dry Broadleaf Forests
biomes, which together contained only 8 % of the
global total in 2000 but had the highest rates of loss.
Finally, if the goal is to identify where the patterns of
forest change removed the most forest interior per unit
of forest area lost, then attention would be drawn to
biomes with the highest elasticity including the
Tropical and Subtropical Coniferous Forests, the
Temperate Broadleaf and Mixed Forests, and the
Temperate Grasslands, Savannas and Shrublands
biomes.
Global attention is often focused on the dynamics of
tropical forests, but our analysis indicated that extra-
tropical forest interior area comprised approximately
half of the global total in forest biomes. Furthermore,
forest interior loss rates in temperate forests approx-
imated the rates in tropical forests. The two temperate
forest biomes had higher rates of interior loss and
larger elasticity values than two of the three tropical
forest biomes. Nevertheless, losses in tropical forests
are very important globally; the loss of forest interior
area from the Tropical & Subtropical Moist Broadleaf
Forests biome alone was more than double the area
loss from the two temperate forest biomes.
There are differences between our measurements of
global total forest area changes (Table 2) and those
reported by Hansen et al. (2013). Our measurement of
gross loss (2.06 million km2) is smaller than the value
of 2.29 million km2 reported by Hansen et al. (2013),
and our measurement of gross gain (0.35 million km2)
is much lower than the 0.80 million km2 reported by
Hansen et al. (2013). The differences are due to
different definitions of forest gain and forest loss. In
our study, forest gains and losses were contingent on
tree cover in 2000 (Table 1). Forest loss occurred only
if tree cover was greater than zero in 2000, forest gain
occurred only if tree cover was zero in 2000, and
instances of both tree cover loss and gain were
considered to represent no change. In contrast, gross
forest gains and losses were apparently not contingent
on tree cover in 2000 in the statistics reported by
Hansen et al. (2013). We found that the tree cover loss
map includes 0.06 million km2 loss where tree cover in
2000 was zero, and 0.18 million km2 where both loss
and gain occurred. The tree cover gain map includes
0.28 million km2 gain where tree cover was greater
than zero in 2000 and 0.18 million km2 where both loss
and gain occurred. Taken together, those results
explain almost all of the differences between our
estimates of forest area changes and those reported by
Hansen et al. (2013).
Our global results for 2000 are consistent with
fragmentation statistics reported by Haddad et al.
(2015) who measured distance from forest edge on a
different 0.09 ha resolution global forest map derived
from Landsat data circa 2000 (Sexton et al. 2013).
Haddad et al. (2015) reported (in their Fig. 1b) that
approximately 60 % of total forest area was within
700 m of edge. We derived a comparable estimate by
noting that the distance from the center to a corner of
our 33 9 33 pixels window is 700 m. Thus, the
maximum distance to edge for the extant forest pixels
for which FAD\1.0 is 700 m (Riitters and Wickham
2003). By that procedure we estimated that 62 % of
total forest area was no more than 700 m from nearest
edge in 2000. The remarkable similarity of the two
results was unexpected because of differences in the
forest maps, but nevertheless supports the view that
the majority of the global forest area in 2000 was
subjected to the degrading effects of fragmentation
(Haddad et al. 2015). Furthermore, our analysis
indicates that the percentage of extant forest that was
subjected to edge effects within 700 m increased from
62 % in 2000 to 77 % in 2012.
Forest pattern changes are relevant ecologically as
descriptors of extrinsic environmental drivers of eco-
logical processes (O’Neill et al. 1997; Rose et al. 2014;
Haddad et al. 2015). But every change happens at a
particular place, and that unique set of circumstances
ultimately determines the ecological consequences.
Several of the complicating factors are as follows.
Anthropogenic land use in the vicinity is a critical
factor influencing ecological impacts (Ricketts 2001).
Temporary deforestation (e.g., fire) is less important
than permanent deforestation (e.g., urban develop-
ment). Silvicultural operations (tree farms) usually
create forest environments that differ from those arising
through natural succession (an example in Fig. 3 is the
net gain of forest and forest interior area in savanna
Landscape Ecol (2016) 31:137–148 145
123

regions in South America). A given change may be
detrimental to one ecological service and beneficial to
another. Tree cover data may be insensitive to ‘‘cryptic
deforestation’’ (Turner et al. 2007) due to partial
harvest or degradation (e.g., shade crops). Finally, tree
cover data alone do not indicate forest type, quality, or
age. Land cover maps derived from tree cover are not
sufficient to address any of those complicating factors
without additional information.
As a practical matter, interpreting the results of a
global analysis will usually require a trade-off of local
precision for global consistency (Pelletier and Goetz
2015). Advances in remote sensing technology are
likely to improve the frequency, quality, and content
of global forest maps, but there will always be a need
for finer-scale ancillary data to answer increasingly
detailed questions about the causes and consequences
of forest fragmentation. Since the detailed questions
usually refer to specific locations, one general
approach is to integrate detailed local information if
it is available (Riitters et al. 2012). For example,
mensuration information can come from in situ inven-
tories, causal data may be derived from land use maps
or models, and biodiversity field data or remotely
sensed biophysical data can be examined to evaluate
some of the consequences of forest fragmentation.
Detailed investigations are currently opportunistic and
global consistency remains a worthwhile yet elusive
goal. But the current limitations and complications of
analyses such as ours do not obviate the need for, and
value of globally consistent forest assessments
(Mather 2005). Until better techniques are developed,
a strategy for global monitoring using remote sensing
data may be to minimize the failure to detect real
changes, even at the expense of detecting more but
sometimes unimportant changes. Under this strategy,
knowing where the changes in an important environ-
mental driver are occurring can guide where detailed
investigations may be needed.
Despite its inherent limitations, mapping tree cover
through remote sensing is presently the only feasible
way to consistently map and monitor the global status
and trends of forest interior area. In most regions, there
are no baselines for quantitative comparisons with
‘‘natural’’ amounts of forest interior, but the elasticity
of loss relative to total forest area at least shows where
disturbances have the largest fragmenting effects on
the remaining forest. As forest area is lost and the
remainder becomes more fragmented, there may be
scale- and process-dependent ‘‘tipping points’’ (Luck
2005) at which the residual forest no longer functions
as forest interior (Gascon et al. 2000). Monitoring
sudden changes in forest interior area may provide an
early warning of impending tipping points in depen-
dent ecological functions (Andersen et al. 2009;
Scheffer et al. 2009; Suding and Hobbs 2009). Earth
observation provides a unique perspective for identi-
fying some of the most important environmental
problems resulting from cumulative and interacting
changes over large regions and time intervals (O’Neill
et al. 1997; Carpenter et al. 2006).
Acknowledgments We thank M. Hansen, his colleagues, and
Google Earth Engine for the global forest change maps. The
United States Environmental Protection Agency (EPA), through
its Office of Research and Development, partially funded and
collaborated in the research described here. It has been subjected
to EPA review and approved for publication.
References
Andersen T, Carstensen J, Hernandez-Garcia E, Duarte CM
(2009) Ecological thresholds and regime shifts: approaches
to identification. Trends Ecol Evol 24:49–57
Andren H (1994) Effects of habitat fragmentation on birds and
mammals in landscapes with different proportions of
suitable habitat: a review. Oikos 71:355–366
Asner GP (2014) Satellites and psychology for improved forest
monitoring. Proc Natl Acad Sci 111:567–568
Cadenasso ML, Pickett STA (2001) Effect of edge structure on
the flux of species into forest interiors. Conserv Biol
15:91–97
Carpenter SR, DeFries R, Dietz T, Mooney HA, Polasky S, Reid
WV, Scholes RJ (2006) Millennium ecosystem assessment:
research needs. Science 314:257–258
Chazdon RL (2008) Beyond deforestation: restoring forests and
ecosystem services on degraded lands. Science 320:1458–1460
Fahrig L (2003) Effects of habitat fragmentation on biodiversity.
Annu Rev Ecol Evol Syst 34:487–515
FAO (Food and Agriculture Organization of the United Nations)
(2010) Global forest resource assessment 2010. FAO
Forestry Paper 163, Rome
Gascon C, Williamson GB, da Fonseca GAB (2000) Receding
forest edges and vanishing reserves. Science 288:1356–1358
Haddad NM, Brudvig LA, Clobert J, Davies KF, Gonzalez A,
Holt RD, Lovejoy TE, Sexton JO, Austin MP, Collins CD,
Cook WM, Damschen EI, Ewers RM, Foster BL, Jenkins
CN, King AJ, Laurance WF, Levey DJ, Margules CR,
Melbourne BA, Nicholls AO, Orrock JL, Song D-X,
Townshend JR (2015) Habitat fragmentation and its lasting
impact on Earth’s ecosystems. Sci Adv 1:e1500052
Hansen MC, Potapov PV, Moore R, Hancher M, Turubanova
SA, Tyukavina A, Thau D, Stehman SV, Goetz SJ,
Loveland TR, Kommareddy A, Egorov A, Chini L,
Justice CO, Townshend JRG (2013) High-resolution
146 Landscape Ecol (2016) 31:137–148
123

global maps of 21st-century forest cover change. Sci-
ence 342:850–853. http://earthenginepartners.appspot.
com/science-2013-global-forest. Accessed 5 March 2014
Harris LD (1984) The fragmented forest. University of Chicago
Press, Chicago
Heinz Center (The H. John Heinz III Center for Science, Eco-
nomics, and the Environment) (2008) The state of the
nation’s ecosystems 2008. Island Press, Washington, DC
Hosonuma N, Herold M, De Sy V, De Fries R, Brockhaus M,
Verchot L, Angelsen A, Romijn E (2012) An assessment of
deforestation and forest degradation drivers in developing
countries. Environ Res Lett 7:044009
Innes JL, Koch B (1998) Forest biodiversity and its assessment
by remote sensing. Glob Ecol Biogeogr Lett 7:397–419
Kapos V (1989) Effects of isolation on the water status of forest
patches in the Brazilian Amazon. J Trop Ecol 5:173–185
Keddy PA, Drummond CG (1996) Ecological properties for the
evaluation, management, and restoration of temperate
deciduous forest ecosystems. Ecol Appl 6:748–762
Kurz WA (2010) An ecosystem context for global gross forest
cover loss estimates. Proc Natl Acad Sci 107:9025–9026
Laurance WF (2000) Do edge effects occur over large spatial
scales? Trends Ecol Ecol 15:134–135
Laurance WF (2008) Theory meets reality: how habitat frag-
mentation research has transcended island biogeography
theory. Biol Conserv 141:1731–1744
Laurance WF, Ferreira LV, Rankin-De Merona JM, Laurance
SG (1998) Rain forest fragmentation and the dynamics of
Amazonian tree communities. Ecology 79:2032–2040
Loveland TR, Dwyer JL (2012) Landsat: building a strong
future. Remote Sens Environ 122:22–29
Luck GW (2005) An introduction to ecological thresholds. Biol
Conserv 124:299–300
Mather AS (2005) Assessing the world’s forests. Glob Environ
Change 15:267–280
McIntyre S, Hobbs R (1999) A framework for conceptualizing
human effects on landscapes and its relevance to man-
agement and research models. Conserv Biol 13:1282–1292
Millennium Ecosystem Assessment (2005) Ecosystems and
human well-being: biodiversity synthesis. World Resour-
ces Institute, Washington, DC
Murcia C (1995) Edge effects in fragmented forests: implica-
tions for conservation. Trends Ecol Evol 10:58–62
Olson DM, Dinerstein E, Wikramanayake ED, Burgess ND,
Powell GVN, Underwood EC, D’Amico JA, Itoua I, Strand
HE, Morrison JC, Loucks CJ, Allnutt TF, Ricketts TH,
Kura Y, Lamoreux JF, Wettengel WW, Hedao P, Kassem
KR (2001) Terrestrial ecoregions of the world: a new map
of life on Earth. Bioscience 51:933–938
O’Neill RV, Hunsaker CT, Jones KB, Riitters KH, Wickham
JD, Schwartz PM, Goodman IA, Jackson BL, Baillargeon
WS (1997) Monitoring environmental quality at the land-
scape scale. Bioscience 47:513–519
Pelletier J, Goetz SJ (2015) Baseline data on forest loss and
associated uncertainty: advances in national forest moni-
toring. Environ Res Lett 10:021001
Pickett STA, Cadenasso ML (1995) Landscape ecology: spatial
heterogeneity in ecological systems. Science 269:331–334
Ricketts TH (2001) The matrix matters: effective isolation in
fragmented landscapes. Am Nat 158:87–99
Ries L, Fletcher RJ, Battin J, Sisk TD (2004) Ecological
responses to habitat edges: mechanisms, models, and vari-
ability explained. Annu Rev Ecol Evol Syst 35:491–522
Riitters KH, Wickham JD (2003) How far to the nearest road?
Front Ecol Environ 1:125–129
Riitters KH, Wickham JD (2012) Decline of forest interior
conditions in the conterminous United States. Sci Rep
2:653
Riitters KH, O’Neill RV, Jones KB (1997) Assessing habitat
suitability at multiple scales: a landscape-level approach.
Biol Conserv 81:191–202
Riitters K, Wickham J, O’Neill RV, Jones B, Smith E (2000)
Global-scale patterns of forest fragmentation. Ecol Soc
4(2):3
Riitters KH, Wickham JD, O’Neill RV, Jones KB, Smith ER,
Coulston JW, Wade TG, Smith JH (2002) Fragmentation of
continental United States forests. Ecosystems 5:815–822
Riitters KH, Coulston JW, Wickham JD (2012) Fragmentation
of forest communities in the eastern United States. For Ecol
Manage 263:85–93
Robinson SK, Thompson FR III, Donovan TM, Whitehead DR,
Faaborg J (1995) Regional forest fragmentation and the
nesting success of migratory birds. Science 267:1987–1990
Rose RA, Byler D, Eastman JR, Fleishman E, Geller G, Goetz S,
Guild L, Hamilton H, Hansen M, Headley R, Hewson J,
Horning N, Kaplin BA, LaPorte N, Leidner A, Leimgruber
P, Morisette J, Musinsky J, Pintea L, Prados A, Radeloff
VC, Rowen M, Saatchi S, Schill S, Tabor K, Turner W,
Vodacek A, Vogelmann J, Wegmann M, Wilkie D, Wilson
C (2014) Ten ways remote sensing can contribute to con-
servation. Conserv Biol 29:350–359
Roy DP, Wulder MA, Loveland TR, Woodcock CE, Allen RG,
Anderson MC, Helder D, Irons JR, Johnson DM, Kennedy
R, Scambos TA, Schaaf CB, Schott JR, Sheng Y, Vermote
EF, Belward AS, Bindschadler R, Cohen WB, Gao F,
Hipple JD, Hostert P, Huntington J, Justice CO, Kilic A,
Kovalskyy V, Lee ZP, Lymburner L, Masek JG, McCorkel
J, Shuai Y, Trezza R, Vogelmann J, Wynne RH, Zhu Z
(2014) Landsat-8: science and product vision for terrestrial
global change research. Remote Sens Environ 145:154–
172
Scheffer M, Bascompte J, Brock WA, Brovkin V, Carpenter SR,
Dakos V, Held H, Van Nes EH, Rietkerk M, Sugihara G
(2009) Early-warning signals for critical transitions. Nat-
ure 461:53–59
Sexton JO, Song XP, Feng M, Noojipady P, Anand A, Huang C,
Kim D-H, Collins KM, Channan S, DiMiceli C, Town-
shend JR (2013) Global, 30-m resolution continuous fields
of tree cover: landsat-based rescaling of MODIS vegetation
continuous fields with lidar-based estimates of error. Int J
Digit Earth 6:427–448
Suding KN, Hobbs RJ (2009) Threshold models in restoration
and conservation: a developing framework. Trends Ecol
Evol 24:271–279
Turner BL II, Lambin EF, Reenberg A (2007) The emergence of
land change science for global environmental change and
sustainability. Proc Natl Acad Sci 104:2066–20671
US Environmental Protection Agency (2008) EPA’s 2008 report
on the environment. EPA/600/R-07/045F. National Center
for Environmental Assessment, Washington, DC.
Landscape Ecol (2016) 31:137–148 147
123

Available from the National Technical Information Ser-
vice, Springfield. http://www.epa.gov/roe
USDA (United States Department of Agriculture) Forest Service
(2004) National report on sustainable forests—2003.
Publication FS-766. USDA Forest Service, Washington, DC
USDA (United States Department of Agriculture) Forest Ser-
vice (2011) National report on sustainable forests—2010.
Publication FS-979. USDA Forest Service, Washington,
DC
USDA (United States Department of Agriculture) Forest Ser-
vice (2012) Future of America’s forest and rangelands:
Forest Service 2010 Resources Planning Act assessment.
General Technical Report WO-87. Washington, DC
Wade TG, Riitters KH, Wickham JD, Jones KB (2003) Distri-
bution and causes of global forest fragmentation. Ecol Soc
7(2):7
Weathers KC, Cadenasso ML, Pickett STA (2001) Forest edges
as nutrient and pollutant concentrators: potential
synergisms between fragmentation, forest canopies, and
the atmosphere. Conserv Biol 15:1506–1514
Wickham JD, Riitters KH, Wade TG, Coulston JW (2007)
Temporal change in fragmentation at multiple scales.
Landscape Ecol 22:481–489
Wickham JD, Riitters KH, Wade TG, Homer C (2008) Tem-
poral change in fragmentation of continental US forests.
Landscape Ecol 23:891–898
World Wildlife Fund (2004) Terrestrial ecoregions of the world.
Version 2.0 (digital map). The World Wildlife Fund, Wash-
ington, DC. http://www.worldwildlife.org/publications/
terrestrial-ecoregions-of-the-world. Accessed 4 Feb 2009
Wulder MA, Masek JG, Cohen WB, Loveland TR, Woodcock
CE (2012) Opening the archive: how free data has enabled
the science and monitoring promise of Landsat. Remote
Sens Environ 122:2–10
148 Landscape Ecol (2016) 31:137–148
123