Embed Size (px)
Citation preview

A Global Evaluation of Biodiversity Literacy in Zoo and Aquarium Visitors

Title:
A Global Evaluation of Biodiversity Literacy in Zoo and Aquarium Visitors
Authors:
Andrew Moss | Chester Zoo, Chester, UK Eric Jensen, PhD | Department of Sociology, University of Warwick, Coventry, UK Markus Gusset, PhD | World Association of Zoos and Aquariums (WAZA) Executive Office, Gland, Switzerland
Publisher:
World Association of Zoos and Aquariums (WAZA) Executive Office, Gland, Switzerland
Layout and design:
Michal Stránský | Staré Město, Czech Republic
Illustrations:
Júlia Hanuliaková | Zoo Design, Inc. www.zoodesign.co
Copyright:
© 2014 World Association of Zoos and Aquariums (WAZA)
Citation:
Moss, A., Jensen, E. & Gusset, M. (2014) A Global Evaluation of Biodiversity Literacy in Zoo and Aquarium Visitors. Gland: WAZA Executive Office, 37 pp.
Contents
Foreword ........................................................................ 1Executive summary ........................................................ 2Abstract .......................................................................... 5Introduction ................................................................... 5Methods ......................................................................... 7Results .......................................................................... 13Discussion ..................................................................... 31Acknowledgements ...................................................... 34References .................................................................... 34Appendix ...................................................................... 36
WAZA Executive Office IUCN Conservation Centre Rue Mauverney 28 CH-1196 Gland Switzerland
[email protected] www.waza.org
Foreword
Lee Ehmke, President of WAZA
Zoos and aquariums have embraced the idea that one of their primary responsibilities – if not their ultimate goal – is to provide education to enhance awareness and understanding of biodiversity, and to help their visitors take personal action to conserve biodiversity. But until now, no definitive scientific study of the effectiveness of these efforts has been undertaken. In many ways, this has been a threshold existential question: are the edu-cational efforts of zoos and aquariums directed towards their millions of visitors achieving meaningful results?
It is, therefore, with great interest and excitement that the results of A Global Evaluation of Biodiversity Literacy in Zoo and Aquarium Visitors are presented here. This report analyses and summarises the most comprehensive zoo and aquarium visitor biodiversity-awareness survey ever undertaken. Thirty WAZA mem-ber institutions from around the world participated in a broad-based study of visitors’ awareness of the values of biodiversity, their understanding of biodiver-sity, and of the steps they can take to conserve and use it sustainably. The very encouraging main finding of the study is that both biodiversity understanding and knowledge of actions to help protect biodiversity in survey respondents significantly increased during visits to a zoo or aquarium. This empirical evidence supports what we have long asserted and believed – that zoos and aquariums can be powerful catalysts for develop-ing a conservation ethic and awareness of supportive behaviours among our huge and growing global audience.
The results of this study underscore the potential role of zoos and aquariums in achieving progress towards the goal articulated in Aichi Biodiversity Target 1 that
‘by 2020, at the latest, people are aware of the values of biodiversity and the steps they can take to conserve and use it sustainably’. Of course, far more can and must be done; but we now have a strong baseline from which to measure our progress. Efforts like WAZA’s
‘Biodiversity is Us’ campaign, and the many interpre-tive programmes of individual zoos and aquariums, can now be developed and implemented with the affirma-tion that they potentially can make a difference for biodiversity.
1A Global Evaluation of Biodiversity Literacy in Zoo and Aquarium Visitors WAZA | 2014

Executive summary
The findings presented below are based on the largest and most international study of zoo and aquarium visitors ever conducted worldwide. The study used a pre - and post-visit repeated -measures survey design to evaluate biodiversity literacy – biodiversity understanding and knowledge of actions to help protect biodiversity – in zoo and aquarium visitors. In total, more than 6,000 visitors to 30 zoos and aquariums around the globe participated in the study.
Pre‑visit biodiversity understanding
• Respondents’ pre‑visit biodiversity understanding was 2.99 ± 1.20 on a 10‑point scale. A score of 3 out of 10 on this scale would indicate knowing that bio-diversity is related to biological phenomena, but no evidence of any deeper understanding.
• Based on the scoring criteria, 9.9% of respondents showed strongly positive evidence of biodiversity understanding, while 69.8% of respondents demon-strated at least some positive evidence of biodiversity understanding.
• Respondents that were first ‑time visitors showed significantly lower pre‑visit biodiversity understand-ing than those that were repeat visitors to zoos and aquariums.
• Respondents that were a member or season ticket holder of the zoo or aquarium showed significantly higher pre-visit biodiversity understanding than those that were not.
• Respondents that were a member of a nature, conser-vation or environmental group showed significantly higher pre-visit biodiversity understanding than those that were not.
• Younger respondents and respondents with longer formal education showed significantly higher pre‑visit biodiversity understanding, but effect sizes were small.
Change in biodiversity understanding from pre ‑ to post‑visit
• Respondents showed a significant increase in biodi-versity understanding from 2.99 ± 1.20 to 3.27 ± 1.22 between pre - and post-visit on a 10-point scale. This means that, despite the positive change, respondents’ biodiversity understanding was still somewhat limited after the zoo or aquarium visit.
• There was an increase from pre‑visit (69.8%) to post‑visit (75.1%) in respondents demonstrating at least some positive evidence of biodiversity under-standing.
• Respondents from Africa and Asia showed a signifi-cantly smaller change in biodiversity understanding between pre - and post-visit, while respondents from Europe and the Middle East showed a significantly larger change, than respondents from other world regions.
• Respondents that saw or heard biodiversity informa-tion during their visit showed a significantly larger change in biodiversity understanding between pre - and post-visit than those that had not.
• Respondents that were a member of a nature, conser-vation or environmental group showed a significantly smaller change in biodiversity understanding be-tween pre - and post-visit than those that were not.
• Older respondents and respondents with longer for-mal education showed a significantly larger change in biodiversity understanding between pre - and post‑visit, but effect sizes were small.
Characteristics of zoo and aquarium visitors
• 59.3% of respondents were women.• Respondents’ mean age was 35 years.• Respondents’ mean number of years spent in formal
education was 15.• 59.9% of respondents were repeat visitors to the zoo
or aquarium.• 18.6% of respondents had not visited any zoo or
aquarium before.• Respondents’ mean number of zoo and aquarium
visits in the last 12 months was four.• 47.9% of respondents were local to the area of the
zoo or aquarium.• 16.2% of respondents were a member or season
ticket holder of the zoo or aquarium.• 86.4% of respondents had watched TV nature shows
in the last 12 months.• Respondents’ mean visiting group size was six.• 12.7% of respondents were a member of a nature,
conservation or environmental group.
Characteristics of zoo and aquarium visits
• Respondents’ most selected categories of pre‑visit motivations for visiting the zoo or aquarium were: have a ‘fun day out’ (56.0%), ‘see animals’ (53.3%) and spend ‘family time’ (47.2%).
• There were substantial shifts from respondents’ pre-visit motivations to post-visit self-reports about their visiting experiences.
• Most substantially, while 39.1% of respondents indicated pre-visit that they expected to ‘learn about animals’, 63.0% of respondents self‑reported that they did learn about animals during their visit.
• Respondents’ mean time spent visiting the zoo or aquarium was 3 hours 16 minutes.
• 56.5% of respondents saw or heard biodiversity information during their visit.
• 44.7% of respondents attended an animal talk or show during their visit.
• 53.6% of respondents talked to zoo or aquarium staff or volunteers during their visit.
• 27.3% of respondents watched a video or film during their visit.
• 15.1% of respondents used a smartphone application during their visit.
2 3A Global Evaluation of Biodiversity Literacy in Zoo and Aquarium Visitors WAZA | 2014

Pre‑visit knowledge of pro‑biodiversity actions
• Respondents’ pre‑visit knowledge of actions to help protect biodiversity was 4.90 ± 2.04 on a 10-point scale. A score of 5 out of 10 on this scale could be obtained by being able to name one pro-biodiversity action that is not feasible to address as an individual and another specific action that could be achieved at an individual level.
• Based on the scoring criteria, 50.5% of respondents could provide a pro-biodiversity action that could actually be achieved at an individual level.
• By contrast, 62.1% of respondents self-reported having undertaken their named pro-biodiversity ac-tions within the month prior to completing the survey. This suggests that self-reports of having undertaken pro-biodiversity actions should be treated with scep-ticism.
• Respondents from Central and South America showed significantly lower pre‑visit knowledge of pro-biodiversity actions than respondents from other world regions.
• Female respondents showed significantly higher pre-visit knowledge of pro-biodiversity actions than male respondents.
• Respondents that had watched TV nature shows in the last 12 months showed significantly higher pre-visit knowledge of pro-biodiversity actions than those that had not.
• Respondents that were a member of a nature, conser-vation or environmental group showed significantly higher pre-visit knowledge of pro-biodiversity actions than those that were not.
• Younger respondents and respondents with longer formal education showed significantly higher pre‑visit knowledge of pro‑biodiversity actions, but effect sizes were small.
• Respondents suggested a wide range of actions or behaviours to help protect biodiversity. The larg-est category, in terms of number of responses, was
‘supporting other relevant organisations (not zoos or aquariums)’ (14.4%).
Change in knowledge of pro‑biodiversity actions from pre ‑ to post‑visit
• Respondents showed a significant increase in knowledge of actions to help protect biodiversity from 4.90 ± 2.04 to 5.17 ± 2.01 between pre ‑ and post-visit on a 10-point scale.
• There was an increase from pre‑visit (50.5%) to post‑visit (58.8%) in respondents that could identify a pro-biodiversity action that could be achieved at an individual level.
• Respondents from Africa, Asia and Central and South America showed a significantly smaller change in knowledge of pro-biodiversity actions between pre - and post-visit than respondents from other world regions.
• Female respondents showed a significantly smaller change in knowledge of pro-biodiversity actions be-tween pre - and post-visit than male respondents.
• Respondents that saw or heard biodiversity informa-tion during their visit showed a significantly larger change in knowledge of pro-biodiversity actions between pre - and post-visit than those that had not.
• Respondents that watched a video or film during their visit showed a significantly larger change in knowledge of pro-biodiversity actions between pre - and post-visit than those that had not.
• Respondents that were a member of a nature, conser-vation or environmental group showed a significantly smaller change in knowledge of pro-biodiversity actions between pre - and post-visit than those that were not.
• Older respondents showed a significantly larger change in knowledge of pro-biodiversity actions be-tween pre ‑ and post visit, but effect size was small.
• Respondents’ suggested pro‑biodiversity actions in the categories ‘recycling and waste management’ (14.4% post-visit), ‘responsible purchasing and diet choices’ (11.3%) and ‘zoos and aquariums’ (4.5%) significantly increased from pre ‑ to post‑visit, all of which contain actions that can be achieved at an individual level.
A Global Evaluation of Biodiversity Literacy in Zoo and Aquarium Visitors
AbstractThe United Nations Strategic Plan for Biodiversity 2011–2020 is a key initiative within global efforts to halt and eventually reverse the loss of biodiversity. The very first target of this plan states that ‘by 2020, at the latest, people are aware of the values of biodiversity and the steps they can take to conserve and use it sustainably’. Zoos and aquariums worldwide, attracting more than 700 million visits every year, could potentially make a positive contribution to this target. However, a global evaluation of the educational impacts of visits to zoos and aquariums is entirely lacking in the existing litera-ture. To address this gap, we conducted a large -scale impact evaluation study, using a pre - and post-visit repeated -measures survey design, to evaluate biodi-versity literacy – biodiversity understanding and know-ledge of actions to help protect biodiversity – in zoo and aquarium visitors. Our findings are based on the largest and most international study of zoo and aquar-ium visitors ever conducted worldwide; in total, more than 6,000 visitors to 30 zoos and aquariums around the globe participated in the study. The study’s main finding is that aggregate biodiversity understanding and knowledge of actions to help protect biodiversity both significantly increased over the course of zoo and aquarium visits. There was an increase from pre-visit (69.8%) to post‑visit (75.1%) in respondents demon-strating at least some positive evidence of biodiversity understanding. Similarly, there was an increase from pre‑visit (50.5%) to post‑visit (58.8%) in respondents that could identify a pro-biodiversity action that could be achieved at an individual level. This study provides the most compelling evidence to date that zoo and aquarium visits can contribute to increasing the num-ber of people who understand biodiversity and know actions they can take to help protect biodiversity.
Keywords: Aichi target, aquarium, biodiversity, conser-vation, education, impact, visit, zoo.
Andrew Moss1, Eric Jensen2 & Markus Gusset3,*
1 Chester Zoo, Chester, UK
2 Department of Sociology, University of Warwick, Coventry, UK
3 WAZA Executive Office, Gland, Switzerland
* E -mail for correspondence: [email protected]
IntroductionIn 2010, governments agreed to the Strategic Plan for Biodiversity 2011–2020, which is aimed at halting and eventually reversing the loss of biodiversity of the planet (http://www.cbd.int/sp/default.shtml). To build support and momentum for this urgent task, the United Nations General Assembly declared the period 2011–2020 to be the United Nations Decade on Biodi-versity. There are five strategic goals and 20 ambitious targets, collectively known as the Aichi Biodiversity Targets (http://www.cbd.int/sp/targets/default.shtml). Their purpose is to inspire broad -based action in sup-port of biodiversity over this decade. The very first tar-get (Target 1 of Strategic Goal A) states that ‘by 2020, at the latest, people are aware of the values of biodi-versity and the steps they can take to conserve and use it sustainably’. To successfully achieve such a target will require a major global effort from governments as well as civil society organisations, such as zoos, aquariums, science museums and many others. However, given the shared commitment of zoos and aquariums to pro-moting wildlife conservation and the enormous volume of visits they receive every year, these institutions may be in a particularly important position to contribute to Aichi Biodiversity Target 1.
The World Association of Zoos and Aquariums (WAZA), the unifying organisation for the world zoo and aquarium community, is an official partner of the Convention on Biological Diversity (CBD) during the Decade on Biodiversity. As a contribution to achieve Aichi Biodiversity Target 1, WAZA launched a campaign for raising awareness about biodiversity in zoo and aquarium visitors. This campaign is accompanied by a global evaluation of biodiversity literacy in zoo and aquarium visitors. Environmental education, and mea-suring its impact, is one of the primary aims of modern zoos and aquariums, as stipulated in the World Zoo and Aquarium Conservation Strategy (WAZA 2005). However, a large-scale evaluation of the educational impacts of visits to zoos and aquariums is entirely lacking in the existing literature. It is also needed by CBD for evaluat-ing Aichi Biodiversity Target 1.
Overall, this study provides the most compelling evidence to date that zoo and aquarium visits can contribute to increasing the number of people who understand biodiversity and know actions they can take to help protect biodiversity.
4 5A Global Evaluation of Biodiversity Literacy in Zoo and Aquarium Visitors WAZA | 2014

The potential of zoos and aquariums to be influential in achieving Aichi Biodiversity Target 1 should not be underestimated. With more than 700 million visits worldwide every year (Gusset & Dick 2011), zoos and aquariums may be uniquely placed to contribute to the goal of raising understanding of biodiversity and actions to help protect biodiversity. In addition to the quantity of annual visits, the majority of zoos and aquariums already have in place an institutional, and in some cases legal, commitment to public education on biodiversity conservation and wider environmental themes. Indeed, zoos and aquariums often highlight their role as education providers as one of their key contributions to biodiversity conservation. For example, Patrick et al. (2007) found that 131 out of 136 studied zoo mission statements contained specific reference to the theme of education, while 118 mentioned the theme of conservation itself. On the other hand, zoo and aquarium marketing practices may not always align with these mission statements. In a compre-hensive study of zoo websites, Carr & Cohen (2011) report that zoos are primarily portraying themselves as providers of entertainment, and that conservation and education messages are diluted by this portrayal. However, there is a large degree of concordance in the educational goals of the major zoo and aquarium accreditation organisations around the world (Moss & Esson 2013), thus allowing for a truly global campaign in support of Aichi Biodiversity Target 1.
Zoos and aquariums are undoubtedly providers of en-vironmental education (e.g. Packer & Ballantyne 2010; Esson & Moss 2013; Dove & Byrne 2014). However, they have been guilty of making strong, causal claims regarding the educational impacts of visiting zoos and aquariums, without having sufficient empirical evidence to justify these claims (RSPCA 2007; Dawson & Jensen 2011; Moss & Esson 2013; also see Jensen et al. 2011). Of equal concern, Luebke & Grajal (2011) found that while many zoos and aquariums undertake visitor research, it is largely based on operational needs, rather than any attempt to measure impact in relation to mission statements (also see Jensen 2011). Indeed, there are only limited published examples of any larger scale (multiple zoos and aquariums) visitor impact research. The largest (n = 3,018) single ‑zoo visitor study to date is a repeated -measures impact evaluation conducted with school children aged seven to 15 years visiting London Zoo, which found significant aggregate increases from pre - to post-visit in biodiversity -related learning (Jensen 2014; also see Wagoner & Jensen 2010, 2014). The multi -institutional research program in the USA (Falk et al. 2007) is probably the largest study of adult visitors to date. The main study gathered data from ‘a random sample of 1,862 adults’ from two zoos and two aquariums using a post-visit survey (which also included a ‘retrospective pre -test’). Falk et al. (2007) reported broadly positive visitor impacts relating to the conservation mission of zoos and aquariums based on their survey data. For example, 57% of respondents self-reported that their zoo or aquarium visits strength-ened their connection to nature (p. 10). However, this study also received peer -reviewed criticism, mainly directed at the study’s research design, survey instru-ment and theoretical assumptions (Marino et al. 2010; Dawson & Jensen 2011).
Balmford et al. (2007) surveyed 1,340 visitors to seven UK wildlife attractions and found ‘very little evidence… of any measurable effect of a single informal visit on adults’ conservation knowledge, concern, or ability to do something useful’ (p. 133). In an Australian study, Smith et al. (2008) investigated whether a zoo ‑based educational presentation promoting specific conser-vation actions had its desired impact. The research-ers assessed visitors’ recall of the presentation, the recommended conservation actions and their inten-tions to follow through on those actions. Respondents were asked to provide self-report data about whether they ‘recalled hearing’ the recommended conserva-tion actions from the presentation (81% said ‘yes’); 59% of these individuals said they already knew of all the actions mentioned in the presentation (only 14% acknowledged not knowing the actions before-hand). While this research would seem to indicate that zoo-based educational presentations are well-remem-bered by audiences and that zoo audiences are already well -versed in conservation actions, the results must be interpreted with caution. Because the researchers did not conduct any pre -presentation data collection, their data are subject to a potential bias wherein respond-ents give answers they believe are socially desirable. If respondents had been asked to list conservation ac-tions both before and after the presentation, it would have been possible to establish that the zoo -based educational presentation was the determining factor in any new knowledge. Clearly, there is a need for an international evaluation study using scientifically rigor-ous methods to provide direct impact measurement relevant to Aichi Biodiversity Target 1.
In our study, we assessed biodiversity literacy – bio-diversity understanding and knowledge of actions to help protect biodiversity – in a large sample (more than 6,000 visitors to 30 zoos and aquariums) from across the globe. This will help us evaluate Aichi Biodiversity Target 1 – to what extent people are aware of the values of biodiversity and the steps they can take to conserve and use it sustainably – and measure the edu-cational impacts of visits to zoos and aquariums. We sought to answer the following research questions: (1) Do zoo and aquarium visitors understand the term bio-diversity? (2) Do zoo and aquarium visitors understand the actions they can take to help protect biodiversity? (3) Are there any predictors of biodiversity understand-ing and knowledge of actions to help protect biodi-versity? (4) Can zoos and aquariums make a positive contribution to Aichi Biodiversity Target 1?
Methods
Survey instrument
Pre - and post-visit surveys were designed to measure our two dependent variables (biodiversity understand-ing and knowledge of actions to help protect biodiver-sity); to provide an indication of any change (positive or negative) in individual participants over the course of their zoo visit; and to assess the potential impact of various independent variables (see below) on the two dependent variables. As a result, the survey was designed specifically as a repeated ‑measures instru-ment (i.e. the same participants were measured twice). Both surveys were designed to be as succinct and clear as possible, and the final designs fitted onto one side of A4-size (standard letter) paper. The one -page limit was aimed at minimising logistical challenges for participat-ing institutions and the time burden on respondents.
As there has been little previous research employing direct impact measures with zoo visitors, particularly with this international diversity, the two depend-ent variables were operationalised using matching open -ended questions in both the pre - and post-visit surveys. These were:
• To measure biodiversity understanding: ‘Please list anything that comes to mind when you think of ‘bio-diversity’ (space for up to five responses)’.
• To measure knowledge of actions to help protect bio-diversity: ‘If you can think of an action that you could take to help save animal species, please list below (space for up to two responses)’.
Limiting responses to a series of closed -response op-tions would not have allowed us to validly assess the variability in zoo visitor understanding of biodiversity and the actions to protect it. That is, it would have required us to close off possible responses that visitors would want to give because we did not already have a good account of the range of thoughts and actions that visitors may have wished to communicate. This deci-sion clearly had ramifications in terms of the increased resources required to input data, and the way that those data would be analysed.
6 7A Global Evaluation of Biodiversity Literacy in Zoo and Aquarium Visitors WAZA | 2014

In addition to the two dependent variables, data relating to a number of independent variables (both categorical and continuous) were collected. In the pre-visit survey, these mainly related to demographic details of the respondents, their zoo visiting history, as well as their motivation for visiting. In the post-visit survey, independent variables mainly covered potential influential variables relating to the respondents’ experi-ence at the zoo, including whether they recalled seeing or hearing any information relating to biodiversity, or whether they used a smartphone application as an aid to their visit, for example. The pre - and post-visit survey forms are reproduced in the appendix.
External input into survey design
Opinions were sought and gratefully received from nine respected researchers at an early stage in the project (see Acknowledgements section), specifically regarding the survey design. We accounted for these opinions in the final survey design as much as possible, given the one -page limit for the survey instrument.
All of the participating institutions were also asked to provide feedback on the final survey design, in the hope that potential issues with cultural or linguistic dif-ferences could be highlighted and accounted for at that stage. Some of the participating institutions were able to pilot the surveys with their visitors, again provid-ing additional feedback. For the non -English speaking institutions, a member of staff conducted a translation of the survey.
Participating zoos and aquariums
A total of 30 WAZA member organisations participated in the survey, two of which sampled visitors at more than one institution. Table 1 shows the geographi-cal breakdown of participating institutions by world region, with all major regions being represented. The list of participating institutions is generally made up of large, well -known and well -visited zoos and aquariums (see Acknowledgements section). The number of valid surveys received, by world region, is also included in Table 1.
Table 1 Zoo and aquarium participants in visitor survey, by world region.
Number of participants
Number of valid surveys
Africa 3 408
Asia 5 984
Central and South America 5 1,598
North America 8 1,563
Europe and the Middle East 7 1,260
Oceania 2 544
Global total 30 6,357
Procedure
Procedural and sampling guidance documents were produced for all participating institutions, in order to promote consistency in data collection and organisa-tion at each site. Nevertheless, we acknowledge that, given the diverse nature of participating institutions, some uncontrolled procedural differences likely oc-curred across sites.
The survey was designed to be printed by participat-ing institutions, distributed on paper by staff and then self-administered by respondents. It included a pre - and a post-visit component for the same participants (repeated measures). Potential survey respondents – zoo visitors aged 10 years or above – were selected using systematic sampling (every nth visitor) or on a ‘continual ask’ basis (once one survey response was completed, the next visitor to cross an imaginary line was selected as the potential next respondent). Staff administering the surveys were instructed not to wear any overt conservation or biodiversity -related messag-ing on their clothing, and not to offer any guidance to respondents completing the survey. Survey questions could be read out and answers completed (verbatim) by staff, if the potential respondent requested this. Re-spondents were informed that the survey was for them to record their thoughts on an individual basis, and not as a joint response from a visitor group.
Any refusals to participate in the research were record-ed on a refusals log, containing any easily verifiable visual information about the person (gender, apparent age and apparent ethnicity) plus the stated reason for refusal. From this we were able to calculate a mean refusal rate across all participating institutions of 46.2%. Further analysis of refusals data suggests that the basic demographics of those visitors that chose not to participate in the survey were not different from the study sample (see explanations to Tables 2 and 3). Data collection began on 1 November 2012 and continued for six months until 30 April 2013, although the end date was extended to 31 July 2013 to allow for as many participating institutions as possible to complete the surveys. Completed surveys were then forwarded, ei-ther as digital scans or posted, to the research team for inputting, processing and analysis.
It is important to stress that we employed a repea-ted-measures research design in order to be able to evaluate the educational impacts of zoo and aquarium visits – that is, the same respondents were measured twice, once just before their visit and again just before leaving. As part of the procedural guidelines, par-ticipating institutions were advised to provide those respondents completing the pre-visit survey with a unique visitor number in the form of, for example, a sticker or wrist band. Small incentives (up to the value of around five Euros) were also used by some partici-pating institutions, but only after the post-visit survey had been completed. Incentives included, for example, zoo calendars, guides and postcards.
Data entry and handling
Once completed surveys were received by the research team (based at Chester Zoo), data were entered by a dedicated research assistant and a team of trained volunteers. Some participating institutions provided English translations of the open -ended survey respon-ses comprising the two dependent variables (biodi-versity understanding and knowledge of actions to help protect biodiversity), whereas other non -English responses were translated either by multi ‑lingual staff at Chester Zoo or with the assistance of the translation tool Google Translate (http://translate.google.com). Independent variables did not require translation, as these consisted of predefined closed ‑response op-tions. Initial data entry was made into a Microsoft Excel spreadsheet in the ‘wide’ format to allow for repea-ted-measures analysis.
As to be expected in a paper survey of this scale, many completed surveys contained missing data (i.e. not all questions were answered). If these missing data were relating to the independent variables, the data from the survey in question was still included in the final dataset. If both dependent variables were missing (biodiversity understanding and knowledge of actions to help protect biodiversity), the survey was excluded from the final dataset. However, if only one of the two dependent variables was missing, the survey was in-cluded in the final dataset. Two other factors that also led to the exclusion of some survey responses were in-correctly matched pre - and post-visit surveys (or where this was not clear) and illegible handwriting.
8 9A Global Evaluation of Biodiversity Literacy in Zoo and Aquarium Visitors WAZA | 2014

The number of valid surveys received from each participating institution was n = 187 ± 80 (mean ± stand-ard deviation). The largest contribution from any one participating institution was 299, and six out of the 30 institutions contributed less than 100 (minimum of 45). The total number of valid surveys received across the 30 participating institutions was 6,357 (Table 1). However, four participating institutions did not use the same respondents for the pre - and post-visit survey (i.e. they used independent samples) for logistical reasons. As the survey instrument was designed for use by the same respondents pre - and post-visit, this change to the specified procedures resulted in no demographic data being collected for the post-visit survey respond-ents from these four institutions and invalidated these data for the impact evaluation aspect of the study. As a consequence, the post-visit data from those particular institutions were excluded from the final dataset. This resulted in a final sample size of 5,661 valid matched pre - and post-visit surveys and 696 valid unmatched pre-visit surveys (that could still be used for the cross-sectional analysis focusing on incoming visitors to the participating institutions).
Data processing
The qualitative data from the two dependent variables (biodiversity understanding and knowledge of actions to help protect biodiversity) were subjected to content analyses, in order to provide quantitative data suitable for statistical analysis. Initial qualitative analysis to ex-plore the range, type and content of responses directly informed the scoring and coding schemes that were developed for each of the two dependent variables.
Dependent variable 1: biodiversity understanding
The preliminary qualitative analysis of data for this variable strongly suggested that there were continu-ous ‘degrees’ of biodiversity understanding or accuracy. From this, a five ‑point unidirectional scale was devel-oped. Each pre - and post-visit response was scored according to this scale:
• 1 | Inaccurate: completely inaccurate descriptions (no accurate elements) – e.g. ‘open air’, ‘everything in general’ – and/or too vague to indicate accurate knowledge of any kind – e.g. ‘many things’.
• 2 | Ambivalent: some evidence of accurate descrip-tions, some of inaccurate descriptions.
• 3 | Some positive evidence: mention of something biological – e.g. ‘species’ – but no other accurate ele-ments or detail.
• 4 | Positive evidence: some evidence of accurate de-scriptions, but (1) only mentioning animals or plants, not both (minimal inaccurate elements) and/or (2) using a vague but accurate description – e.g. ‘lots of life’, ‘many species’, ‘variety of species’.
• 5 | Strongly positive evidence: strong evidence of accurate descriptions, specifically mentioning both animals and plants (no inaccurate elements) – e.g.
‘variety of animals, fish and insects’, ‘loss of habitat’, ‘shared environment’, ‘wildlife and plant life in bal-ance’.
• -99 | Missing: no thought -listing data provided; ex-cluded and marked as missing data.
In addition, a series of binary coding variables (yes or no) were developed. All of these variables are based on CBD’s ‘Value of Biodiversity and Ecosystem Ser-vices’ (https://www.cbd.int/2011-2020/learn). Individual survey responses were again scored for each of the following (on a yes or no basis, with missing data again recorded as -99):
• Interconnections between species and the environ-ment mentioned?
• Genetic value of biodiversity mentioned?• Expressed importance of biodiversity for humans?• Expressed need for biodiversity conservation?• Mention of environmentally responsible behaviours
relating to biodiversity?
Data regarding each of the above binary variables were analysed separately. In addition, a master combined score was calculated as the sum of the biodiversity ac-curacy scale (1 to 5) and all of the five binary variables (yes = 1 and no = 0). The maximum combined score per survey response would therefore be 10. All data were coded by one primary researcher. In order to assess the consistency of assigned codes, an inter -coder reliability analysis was performed using a second, trained coder. A small, randomly selected sample of data for this outcome variable (n = 294) was coded separately (and blind to the previous coding) by the second researcher. A Cohen’s kappa statistic was calculated from the resulting second coding data, producing a value of kappa = 0.82 (p < 0.001), which indicates ‘almost perfect’ agreement between the two researchers (Landis & Koch 1977, p. 165).
Dependent variable 2: knowledge of actions to help protect biodiversity
Initial qualitative analysis of data for this variable sug-gested two main areas for content analysis: (1) the ac-tions reported fell along a continuum ranging from very general to very specific personal actions, and (2) the vast majority of actions could be grouped into a small number of behavioural categories. As a consequence, both analyses were conducted separately, following distinct analytical schemes described below.
Responses were coded under an initial binary variable (yes or no) to record if any action or behaviour was mentioned at all (yes = 1 and no = 0), and then along a continuous five ‑point scale as follows:
• 0 | Action or behaviour identified is not relevant to conservation.
• 1 | Vague platitudes about need for change (no specific action or behaviour mentioned) – e.g. ‘save ecosystems’.
• 2 | Specific identification of pro‑biodiversity action or behaviour, but is at a general level (not feasible to address as an individual) – e.g. ‘stop hunting’, ‘stop Chinese medicine’, ‘scientific research in environmen-tal studies and conservation’, ‘don’t cut our forests’,
‘give animals space and protect their environment’.• 3 | Very specific identification of pro‑biodiversity action
or behaviour that can be done at an individual level – e.g. ‘hanging bird houses, feeding birds in winter time’,
‘drive less to reduce effects of climate change’.• 4 | Very specific identification of pro‑biodiversity ac-
tion or behaviour that the respondent clearly states is a personal action or behaviour – e.g. ‘I recycle my mobile phone for gorillas’.
• -99 | Missing: no data provided; excluded and marked as missing data.
In the survey design, there were spaces left for re-spondents to identify up to two different actions. Where two actions were reported, both were coded as above. A total score was calculated from the sum of both, with a maximum combined score per survey response of 10. All data were coded by one primary re-searcher. To evaluate the quality of the analysis, a small, randomly selected sample of data for this outcome variable (n = 294) was coded separately (and blind to the previous coding) by a second researcher. A Cohen’s kappa statistic was calculated for these matching data, yielding a value of kappa = 0.84 (p < 0.001). This indicates ‘almost perfect’ agreement between the two researchers (Landis & Koch 1977, p. 165), and therefore establishes the reliability of the pro-biodiversity actions scoring system.
In order to categorise the pro-biodiversity actions or behaviours identified by respondents, the IBM SPSS Text Analytics for Surveys 4 software package was used. Initially, we conducted an automated analysis in which the software’s linguistic algorithms categorised responses. From this, categories were manually refined, and the remaining responses were assigned to them. Responses that fell across more than one category were assigned to both. The final categories applied across the entire dataset were as follows:
• Habitat protection and creation: comments relating to the protection of habitats and the creation of new ones – e.g. ‘save rainforests’, ‘plant more trees’.
• Pollution and climate change: comments relating to pollution and the effects of climate change – e.g.
‘control polluting industries’.• Recycling and waste management: comments relat-
ing to recycling and the management of waste – e.g. ‘think of the environment (save paper, separate waste)’.
• Responsible purchasing and diet choices: comments relating to purchasing and diet choices – e.g. ‘make sure that I don’t buy products sourced from tropical forests’, ‘go vegetarian’.
• Education: comments relating to the importance of education – e.g. ‘educating the public about conser-vation issues’.
• Conservation: comments relating to non -zoo related conservation; these comments were often more gen-eral in nature – e.g. ‘save tigers’.
• Animals: comments relating to the welfare of animals, generally in the wild, including those related to the hunting or poaching of animals – e.g. ‘better control poaching’.
10 11A Global Evaluation of Biodiversity Literacy in Zoo and Aquarium Visitors WAZA | 2014

• Zoos and aquariums: comments relating to zoos, including supporting them and/or the role of zoos in conservation – e.g. ‘breed endangered animals in captivity but in as natural environment as possible’.
• Supporting other relevant organisations (not zoos or aquariums): comments relating to the support of other organisations – e.g. ‘donate to conservation trusts or charities’.
• Other related comment: any other comments relat-ing to conservation or environmental issues or those that were too general to categorise elsewhere – e.g.
‘eco -friendly’.• Non -related or ambiguous comment: comments not
related to the question or those whose meaning was unclear – e.g. ‘developing areas for #1’.
Data analyses
Once quantified, we conducted statistical analyses on these data in two different ways. Firstly, we con-ducted a cross -sectional analysis primarily focusing on descriptive statistics. Secondly, we conducted a repea-ted-measures analysis (comparing pre - and post-visit data). Z -tests were applied for normality testing using skewness and kurtosis. Linear Mixed Models with inde-pendent variables as fixed effect factors and participat-ing institutions as a (categorical) random effect factor were used. The restricted maximum likelihood method was used to estimate variance components. Descrip-tive statistics for each survey question and sample demographics were also calculated. McNemar tests were employed to assess any differences in reported actions (categories) between pre - and post-visit. All statistical tests were two ‑tailed, with the significance level set at p ≤ 0.05, and were conducted using IBM SPSS Statistics 21.
Methodological limitations
There are a number of limitations in the data collection and analysis presented in this report. Firstly, in terms of data collection, there is more to be done to fully evaluate the risk of sampling bias. Not every participat-ing institution completed refusals logs. However, we have not yet assessed whether there are any patterns in the number or type of institutions that did not provide this information. Ideally, we would compare respondent demographics to refusals log demograph-ics only among the institutions that submitted refusals logs. Furthermore, we have not yet identified precisely how many institutions used which specific incentives. Beyond sampling, there is a risk that the quality of the formal education variable may not have been uni-formly interpreted across the sample, casting doubt on the validity of this predictor variable. Moreover, although we have treated our outcome variable scales as continuous data, we acknowledge the possibility that the interval between each of the points on our scales may not be exactly the same (even though we are treating the intervals as equal in the data analysis). To fully address this point, pilot testing of the scale with respondents in the target population would have been required. Regarding the linguistic software ‑derived pro-biodiversity action categories, these results should be considered provisional, as we have yet to validate these findings through human coding to ensure their validity and reliability. Likewise, more systematic validation of translations of non -English primary data would be desirable.
Primarily due to time and space constraints, we have not presented the full extent of statistical analyses that could be usefully conducted on these data. The current presentation of the analysis is effectively treating the entire sample as a single pool of people. As we do not provide details about the participating institutions, we have not established that our sample of respondents is representative of ‘world zoo and aquarium visitors’. Therefore, we have focused our claims in this report on our respondents rather than a broader claim of generalisation to a larger population (e.g. the global
population of zoos and aquariums). We have currently presented results at the level of world regions. How-ever, other formulations would be revelatory, including (1) analysis conducted at the individual institution level and then descriptive statistics presented to indicate what proportion of institutions evinced particular statistically significant patterns, or (2) the sample could be redistributed based on other categorisations. In ad-dition, when individuals left the open -ended outcome items blank, these responses were treated as ‘missing’ data (blank responses to just these questions, and not others, could alternatively be interpreted as indicating a lack of understanding). The main risk inhering in our interpretation is that we may be overestimating the overall level of biodiversity understanding and know-ledge of pro-biodiversity actions by excluding individu-als unable to answer these open -ended questions.
In the analysis of knowledge of pro-biodiversity actions, throughout the report we have used a 10-point scale combining scores from the two actions provided by respondents. We could have handled the dual reported actions in other ways analytically, which would have been less conservative. For example, to understand whether respondents know a specific action they can take to help protect biodiversity, we could have only used one of their scores from the two they reported (e.g. the higher scoring one). The current analysis is designed so that if someone could report two actions, this is represented in their ‘score’, compared to some-one who reported just one action. For variables with extreme values such as group size, a further analysis that excludes such extreme values to better identify the central tendencies is planned. Future analyses will also include pre - and post-visit cross -tabular analy-sis with the categorical outcome variables currently nested within the main biodiversity understanding vari-able. In general, for the reporting of means we do not provide the standard deviation below, even though this would help the reader get a sense of whether the mean is likely to be a good measure of central tendency for a given variable. In future analyses, we intend to use an analysis of variance to assess whether there is a rela-tionship between pre-visit motivations and the level of positive or negative change on the outcome variables from pre - to post-visit. Finally, due to space limitations, we have not included the results of z -tests applied for normality testing using skewness and kurtosis.
ResultsFor clarity, the results are presented within two sec-tions, a cross -sectional analysis and a pre - and post-visit comparison.
Cross ‑sectional analysis – descriptive statistics
The global total gave proportions of 59.3% women and 40.7% men. Across most world regions, more women than men responded to the survey (Table 2). This ratio was quite consistent across world regions, with between 60:40 and 70:30 women to men. The only exception to this was in Asia, where this pattern was almost exactly reversed, with 57.5% of those surveyed being men. Refusals data show that of those that chose not to respond to the survey, 57.5% were women and 42.5% were men. Given that this percentage is roughly consistent with the overall sample distribution in terms of gender, we can conclude that systematic gender bias in sampling is unlikely. Rather, women appear to be more prevalent in the global visitor population.
Table 2 Reported gender of respondents, by world region.
Number Percentage
Africa Male 156 38.3%Female 251 61.7%
Asia Male 562 57.5%Female 415 42.5%
Central and South America Male 672 42.4%Female 914 57.6%
North America Male 537 34.6%Female 1,014 65.4%
Europe and the Middle East Male 472 37.9%Female 772 62.1%
Oceania Male 167 31.0%Female 371 69.0%
Global total Male 2,566 40.7%Female 3,737 59.3%
12 13A Global Evaluation of Biodiversity Literacy in Zoo and Aquarium Visitors WAZA | 2014

Respondents’ reported age was quite consistent across world regions (Table 3), with mean ages ranging from 31 to 38 years. The minimum age was 10, with a maxi-mum age of 93. Refusals data show that of those that chose not to respond to the survey, the mean (mode) age was estimated to be between 30 and 39 years. Given that these estimates are consistent with the age pattern among respondents, we would conclude that there is no evidence of an age -based sampling bias.
Table 3 Reported age of respondents (years), by world region.
Mean Minimum Maximum
Africa 36 13 75
Asia 31 11 81
Central and South America 33 10 91
North America 38 10 93
Europe and the Middle East 36 10 83
Oceania 37 11 75
Global total 35 10 93
Respondents’ reported years of formal education were remarkably uniform across world regions (Table 4), with very little variation. Globally, a mean of 15 years of formal education was found, with a minimum of 10 and a maximum of 25.
Table 4 Respondents’ reported years of formal education, by world region.
Mean Minimum Maximum
Africa 15 10 25
Asia 15 10 25
Central and South America 15 10 25
North America 16 10 25
Europe and the Middle East 15 10 25
Oceania 15 10 24
Global total 15 10 25
Almost 60% of respondents overall were repeat visitors to the zoo they were visiting (Table 5). There was some variation across world regions, with the highest propor-tion of repeat visitors in Oceania (77.0%) and the lowest in Central and South America (51.6%).
Table 5 Proportion of visitors on first visit to participating zoo, by world region.
Number Percentage
Africa Yes 191 47.5%
No 211 52.5%
Asia Yes 438 45.0%
No 535 55.0%
Central and South America Yes 766 48.4%
No 817 51.6%
North America Yes 610 39.3%
No 943 60.7%
Europe and the Middle East Yes 399 31.9%
No 850 68.1%
Oceania Yes 124 23.0%
No 416 77.0%
Global total Yes 2,528 40.1%
No 3,772 59.9%
Only 18.6% of respondents had not visited any zoo before (Table 6). However, there was wide disparity across world regions in this variable. In Oceania, only 3.4% of respondents reported not having visited any zoo before, while in Asia this proportion was 41.2% of respondents.
Table 6 Proportion of respondents on first visit to any zoo, by world region.
Number Percentage
Africa Yes 59 15.6%
No 319 84.4%
Asia Yes 354 41.2%
No 505 58.8%
Central and South America Yes 316 22.9%
No 1,062 77.1%
North America Yes 124 10.5%
No 1,054 89.5%
Europe and the Middle East Yes 51 6.5%
No 736 93.5%
Oceania Yes 12 3.4%
No 341 96.6%
Global total Yes 916 18.6%
No 4,017 81.4%
There are clearly some respondents that are extremely regular visitors to zoos, including one respondent reporting 365 visits made (Table 7). These extremes of visitation only seem to occur in North America and Europe and the Middle East. These maximum numbers are unlikely to be precise, as large round numbers such as ‘300’ and ‘50’ tend to signify a qualitative judgment such as ‘many visits’, which is then translated into a number the respondent perceives to be ‘many’. The mean number of visits made to zoos by world region, and globally, is much lower. The highest mean is for North America at six visits in the last 12 months, while the global mean is four visits.
Table 7 Reported number of visits made by respondents to zoos in the last 12 months, by world region.
Mean Minimum Maximum
Africa 2 1 40
Asia 3 1 56
Central and South America 1 1 20
North America 6 1 365
Europe and the Middle East 4 1 300
Oceania 4 1 50
Global total 4 1 365
Globally, there is an almost even divide between those respondents that are local to the area of the zoo they were visiting (47.9%) and those that were visiting the area – or tourists (52.1%) (Table 8). There is some varia-tion in this variable across world regions, ranging from 33.1% local respondents in Central and South America, up to 69.4% local respondents in Oceania.
Table 8 Proportion of respondents that reported being local to the area of the participating zoo compared to visitors to the area, by world region.
Number Percentage
Africa Local 177 43.6%
Visitor 229 56.4%
Asia Local 681 69.8%
Visitor 294 30.2%
Central and South America Local 527 33.1%
Visitor 1,063 66.9%
North America Local 711 45.8%
Visitor 840 54.2%
Europe and the Middle East Local 480 43.9%
Visitor 613 56.1%
Oceania Local 374 69.4%
Visitor 165 30.6%
Global total Local 2,950 47.9%
Visitor 3,204 52.1%
A relatively small proportion of respondents (16.2%) reported being a member or season ticket holder of the zoo they were visiting (Table 9). However, there is some variation in this variable across world regions. Oceania in-stitutions showed the highest proportion of zoo members among respondents (30.4%), while African and Central and South American institutions were the lowest (4.5% each).
Table 9 Proportion of respondents that reported being a member or season ticket holder of the participating zoo, by world region.
Number Percentage
Africa Yes 18 4.5%
No 384 95.5%
Asia Yes 123 12.8%
No 838 87.2%
Central and South America Yes 61 4.5%
No 1,304 95.5%
North America Yes 379 24.5%
No 1,169 75.5%
Europe and the Middle East Yes 226 19.3%
No 946 80.7%
Oceania Yes 165 30.4%
No 377 69.6%
Global total Yes 972 16.2%
No 5,018 83.8%
The vast majority of respondents (86.4%) reported having watched TV nature shows in the last 12 months (Table 10). There is little variation across world regions, from 81.4% at Central and South American institutions, to 90.5% at African institutions.
Table 10 Proportion of respondents that reported having watched TV nature shows in the last 12 months, by world region.
Number Percentage
Africa Yes 287 90.5%
No 30 9.5%
Asia Yes 837 88.2%
No 112 11.8%
Central and South America Yes 1,251 81.4%
No 285 18.6%
North America Yes 715 88.5%
No 93 11.5%
Europe and the Middle East Yes 1,084 89.4%
No 128 10.6%
Oceania Yes 445 84.8%
No 80 15.2%
Global total Yes 4,619 86.4%
No 728 13.6%
14 15A Global Evaluation of Biodiversity Literacy in Zoo and Aquarium Visitors WAZA | 2014

The number of people in a visiting group varies by world region (Table 11). North America, Europe and the Middle East and Oceania all saw a mean of four people per group. Africa, Asia and Central and South America all saw higher mean group sizes, between seven and eight. There are also some extremely large maximum group sizes (up to 300), and these are generally attrib-uted to respondents that were part of a visiting school group.
Table 11 Number of people in visiting group, by world region.
Mean Minimum Maximum
Africa 7 1 200
Asia 8 1 300
Central and South America 8 1 270
North America 4 1 121
Europe and the Middle East 4 1 47
Oceania 4 1 20
Global total 6 1 300
For most world regions, the proportion of respondents that reported being a member of a nature, conserva-tion or environmental group was between 10.9% and 17.2% (Table 12). In Central and South American institu-tions, however, this proportion was much lower, at only 6.0%.
Table 12 Proportion of respondents that reported being a member of a nature, conservation or environmental group, by world region.
Number Percentage
Africa Yes 54 17.2%
No 260 82.8%
Asia Yes 155 17.1%
No 754 82.9%
Central and South America Yes 92 6.0%
No 1,451 94.0%
North America Yes 140 17.2%
No 673 82.8%
Europe and the Middle East Yes 176 14.8%
No 1,012 85.2%
Oceania Yes 55 10.9%
No 449 89.1%
Global total Yes 672 12.7%
No 4,599 87.3%
In terms of pre-visit motivations for visiting the zoo, the most selected category was to have a ‘fun day out’, with 56.0% of respondents selecting this option (Ta-ble 13). To ‘see animals’ and to spend ‘family time’ to-gether were also often selected, with 53.3% and 47.2% of respondents choosing these motivations, respec-tively. ‘Learn about animals’ was selected by 39.1% of respondents, with only 31.3% choosing ‘entertainment’.
Table 13 Self‑reported motivations for zoo visit (respondents could select more than one option).
Number Percentage
Fun day out 3,495 56.0%
See animals 3,324 53.3%
Family time 2,946 47.2%
Learn about animals 2,438 39.1%
Entertainment 1,954 31.3%
Other 470 7.5%
Cross ‑sectional analysis – inferential statistics
Dependent variable 1: biodiversity understanding
The global mean for pre-visit biodiversity under-standing was 2.99 ± 1.20 out of a possible total of 10 (n = 5,180) (Fig. 1). As defined in the Methods section, a score of 3 out of 10 on this scale would indicate know-ing that biodiversity is related to biological phenom-ena, but no evidence of understanding the breadth or variety of plant and animal species, the interdepend-ency of species, the genetic value of biodiversity, the importance of biodiversity for humans or the need for biodiversity conservation. Based on the scoring criteria, 9.9% of respondents (scoring between 5 and 7 on the scale) showed strongly positive evidence of biodiversity understanding, 69.8% of respondents (scoring be-tween 3 and 7 on the scale) demonstrated at least some positive evidence of biodiversity understanding, while the remaining 30.1% of respondents (scoring between 1 and 2 on the scale) had poor to no understanding of biodiversity.
Fig. 1 Histogram representing pre‑visit biodiversity understanding (10‑point scale).
Five of the independent variables significantly pre-dicted pre-visit biodiversity understanding (Table 14). These were: whether this was the respondent’s first visit to any zoo; whether the respondent is a zoo member; whether the respondent is a member of an environmental group; age of the respondent; and num-ber of years the respondent spent in formal education. These relationships are explored in more detail below.
Table 14 Test of fixed effects from Linear Mixed Model output on pre‑visit biodiversity understanding (significant effects in bold).
df F p
Intercept 585.052 306.386 0.000
World region 19.579 1.374 0.277
First visit to this zoo 1,863.101 0.416 0.519
First visit to any zoo 1,898.969 4.634 0.031
Zoo member or season ticket holder
1,890.932 5.547 0.019
Gender 1,899.640 0.695 0.405
Local to area or visitor 1,786.689 0.118 0.731
Watched TV nature shows in last 12 months
1,895.435 0.000 0.997
Member of environmental group 1,900.949 23.922 <0.001
Number of zoo visits in last 12 months
1,896.889 0.815 0.367
Age 1,896.766 35.739 <0.001
Years of formal education 1,900.994 30.959 <0.001
16 17A Global Evaluation of Biodiversity Literacy in Zoo and Aquarium Visitors WAZA | 2014

Respondents that reported this being their first visit to any zoo showed significantly lower pre‑visit biodi-versity understanding than those that had visited zoos before (F = 4.634, p = 0.031) (Fig. 2). The parameter estimate (b = ‑0.188, t = ‑2.153, p = 0.031) indicates that respondents that are first ‑time visitors score 0.188 lower (on 10-point scale) than those that are repeat visitors. This is a relatively small effect size, but still suggests that more visits to zoos are a predictive factor in explaining variation in pre-visit biodiversity under-standing.
Fig. 2 Relationship between zoo visitation history and pre‑visit biodiversity understanding (10‑point scale).
Respondents that reported being a zoo member or sea-son ticket holder showed significantly higher pre‑visit biodiversity understanding than those that are not (F = 5.547, p = 0.019) (Fig. 3). The parameter estimate (b = 0.209, t = 2.355, p = 0.019) indicates that respond-ents that are a zoo member or season ticket holder score 0.209 higher (on 10-point scale) than those that are not. This is a moderate effect size, suggesting that zoo membership is a noteworthy factor in predicting pre-visit biodiversity understanding.
Fig. 3 Relationship between zoo membership and pre‑visit biodiversity understanding (10‑point scale).
Respondents that reported being a member of a nature, conservation or environmental group showed significantly higher pre‑visit biodiversity understanding than those that are not (F = 23.922, p < 0.001) (Fig. 4). The parameter estimate (b = 0.389, t = 4.891, p < 0.001) indicates that respondents that are a member of a nature, conservation or environmental group score 0.389 higher (on 10‑point scale) than those that are not. This is a considerable effect size, so environmental group membership is clearly a key predictor of pre-visit biodiversity understanding.
Fig. 4 Relationship between nature, conservation or environmental group membership and pre‑visit biodiversity understanding (10‑point scale).
Respondents’ reported age significantly predicted pre‑visit biodiversity understanding (F = 35.739, p < 0.001) (Fig. 5). The parameter estimate (b = ‑0.013, t = ‑5.978, p < 0.001) indicates that biodiversity under-standing is 0.013 lower (on 10‑point scale) with each additional year of age. This small effect size suggests that age only becomes moderately predictive at the level of decades. That is, if there is a difference in age of two or three decades between respondents, then the likelihood of a difference in pre‑visit biodiversity understanding is notable.
Fig. 5 Relationship between age (years) and pre‑visit biodiversity understanding (10‑point scale).
Respondents’ reported years of formal education significantly predicted biodiversity understanding (F = 30.959, p < 0.001) (Fig. 6). The parameter estimate (b = 0.047, t = 5.564, p < 0.001) indicates that biodiver-sity understanding is 0.047 higher (on 10‑point scale) with each additional year of formal education. This small effect size suggests that formal education only becomes moderately predictive of pre-visit biodiversity understanding when a threshold of at least five years difference in formal education between respondents is reached.
Fig. 6 Relationship between formal education and pre‑visit biodiversity understanding (10‑point scale).
Dependent variable 2: knowledge of actions to help protect biodiversity
The global mean for pre-visit knowledge of actions to help protect biodiversity was 4.90 ± 2.04 out of a possible total of 10 (n = 4,664) (Fig. 7). As defined in the Methods section, a score of 5 out of 10 on this scale could be obtained by, for example, being able to name one pro-biodiversity action that is not feasible to address as an individual (e.g. ‘don’t cut our forests’) and another specific action that could be achieved at an individual level (e.g. ‘drive less to reduce effects of climate change’). Based on the scoring criteria, only 50.5% of respondents could provide an action or be-haviour that could actually be achieved at an individual level (scoring between 3 and 4 on the scale for each of the two responses to this question; Fig. 7 contains the combined data from both). By contrast, 62.1% of respondents self-reported having undertaken their named pro-biodiversity actions within the month prior to completing the survey. This suggests that self-re-ports of having undertaken pro-biodiversity actions should be treated with scepticism.
18 19A Global Evaluation of Biodiversity Literacy in Zoo and Aquarium Visitors WAZA | 2014

Fig. 7 Histogram representing pre‑visit knowledge of actions to help protect biodiversity (10‑point scale).
Six of the independent variables significantly predicted pre-visit knowledge of actions to help protect biodiver-sity (Table 15). These were: world region; gender of the respondent; whether the respondent has watched any TV nature shows in the last 12 months; whether the re-spondent is a member of an environmental group; age of the respondent; and number of years the respond-ent spent in formal education.
Table 15 Test of fixed effects from Linear Mixed Model output on pre‑visit knowledge of actions to help protect biodiversity (significant effects in bold).
df F p
Intercept 1,015.237 343.048 <0.001
World region 22.851 4.360 0.006
First visit to this zoo 1,681.055 0.166 0.684
First visit to any zoo 1,735.079 1.243 0.265
Zoo member or season ticket holder
1,723.796 3.205 0.074
Gender 1,729.104 12.870 <0.001
Local to area or visitor 1,512.460 1.641 0.200
Watched TV nature shows in last 12 months
1,730.605 5.737 0.017
Member of environmental group 1,735.999 4.688 0.031
Number of zoo visits in last 12 months
1,727.650 0.327 0.568
Age 1,654.780 15.706 <0.001
Years of formal education 1,733.085 3.891 0.049
World region is a significant predictor of pre‑visit knowledge of actions to help protect biodiversity (F = 4.360, p = 0.006) (Fig. 8). By examining the pa-rameter estimates, there is a single significant outlier in terms of world regions: Central and South America (b = ‑0.912, t = ‑3.071, p = 0.006). This indicates that respondents from Central and South America score 0.912 lower (on 10-point scale) than respondents from other world regions. This is a large effect size, suggest-ing that visitors in Central and South America have a much lower starting point in terms of their pre-visit knowledge of pro-biodiversity actions when compared with the rest of the world.
Fig. 8 Relationship between world region and pre‑visit knowledge of actions to help protect biodiversity (10‑point scale).
Female respondents showed significantly higher pre-visit knowledge of actions to help protect biodi-versity than male respondents (F = 12.870, p < 0.001) (Fig. 9). The parameter estimate (b = 0.351, t = 3.587, p < 0.001) indicates that female respondents score 0.351 higher (on 10‑point scale) than male respondents. This is a moderate effect size; therefore, gender is an important factor in predicting pre-visit knowledge of pro-biodiversity actions.
Fig. 9 Relationship between gender and pre‑visit knowledge of actions to help protect biodiversity (10‑point scale).
Respondents that reported having watched TV na-ture shows in the last 12 months showed significantly higher pre-visit knowledge of actions to help protect biodiversity than those that had not (F = 5.737, p = 0.017) (Fig. 10). The parameter estimate (b = 0.362, t = 2.120, p = 0.034) indicates that respondents that had watched TV nature shows in the last 12 months score 0.362 high-er (on 10-point scale) than those that had not. This is a moderate effect size, suggesting that watching TV na-ture shows is a noteworthy factor in predicting pre-visit knowledge of pro-biodiversity actions.
Fig. 10 Relationship between TV nature show watching in the last 12 months and pre‑visit knowledge of actions to help protect biodiversity (10‑point scale).
Respondents that reported being a member of a nature, conservation or environmental group showed signifi-cantly higher pre-visit knowledge of actions to help protect biodiversity than those that are not (F = 4.688, p = 0.031) (Fig. 11). The parameter estimate (b = 0.291, t = 2.165, p = 0.031) indicates that respondents that are a member of a nature, conservation or environmental group score 0.291 higher (on 10-point scale) than those that are not. This is a moderate effect size, suggesting that environmental group membership is an important factor in predicting pre-visit knowledge of pro-biodi-versity actions.
Fig. 11 Relationship between nature, conservation or environmental group membership and pre‑visit knowledge of actions to help protect biodiversity (10‑point scale).
Respondents’ reported age significantly predicted pre-visit knowledge of actions to help protect biodi-versity (F = 15.706, p < 0.001) (Fig. 12). The parameter estimate (b = ‑0.015, t = ‑3.963, p < 0.001) indicates that knowledge of actions to help protect biodiversity is 0.015 lower (on 10‑point scale) with each additional year of age. This small effect size suggests a weak relationship between age and pre-visit knowledge of pro‑biodiversity actions, unless age differences be-tween respondents are large (more than 15 years).
20 21A Global Evaluation of Biodiversity Literacy in Zoo and Aquarium Visitors WAZA | 2014

Fig. 12 Relationship between age (years) and pre‑visit knowledge of actions to help protect biodiversity (10‑point scale).
Respondents’ reported years of formal education signifi-cantly predicted pre-visit knowledge of actions to help protect biodiversity (F = 3.891, p = 0.049) (Fig. 13). The pa-rameter estimate (b = 0.030, t = 1.973, p = 0.049) indicates that knowledge of actions to help protect biodiversity is 0.030 higher (on 10‑point scale) with each additional year of formal education. This small effect size suggests a weak relationship between formal education and pre-visit knowledge of pro-biodiversity actions.
Fig. 13 Relationship between formal education and pre‑visit knowledge of actions to help protect biodiversity (10‑point scale).
A wide range of actions or behaviours to help protect biodiversity were reported by respondents (Fig. 14). The largest category, in terms of number of responses, was ‘supporting other relevant organisations (not zoos or aquariums)’. The most often quoted organisation within this category was the World Wide Fund for Na-ture (WWF). Other well -represented categories includ-ed ‘recycling and waste management’ and ‘responsible purchasing and diet choices’, both of which contained mainly reported actions that could be achieved at an individual level. Conversely, other well-represented categories, such as ‘animals’ and ‘habitat protection and creation’, contained a large proportion of reported actions that could not really be achieved at an individ-ual level; for example, ‘stop hunting’ or ‘save animals’.
Fig. 14 Categorisation of self‑reported pre‑visit actions or behaviours to help protect biodiversity.
Pre ‑ and post‑visit comparison – descriptive statistics
Globally, the mean time respondents spent in the zoo was 3 hours 16 minutes (Table 16), and there was lit-tle variation across world regions. Central and South American institutions saw the lowest visitor dwell time, at 2 hours 51 minutes; the highest was observed at Asian institutions, at 3 hours 36 minutes. The range of visitor dwell times, from minimum to maximum, was wide however, from just 27 minutes to 9 hours 14 minutes.
Table 16 Reported time respondents spent in zoo (hours and minutes), by world region.
Mean Minimum Maximum
Africa 3:24 0:30 7:12
Asia 3:36 0:30 9:14
Central and South America 2:51 0:27 7:45
North America 3:24 0:27 8:00
Europe and the Middle East 3:25 0:30 8:35
Oceania 3:20 0:49 7:20
Global total 3:16 0:27 9:14
The global proportion of respondents that reported seeing or hearing biodiversity information during their visit was 56.5% (Table 17). There was some variation across world regions, with the highest proportion of respondents at Oceania institutions (64.0%) and the lowest at Asian institutions (44.4%).
Table 17 Proportion of respondents that reported seeing or hearing biodiversity information during their visit, by world region.
Number Percentage
Africa Yes 161 61.0%No 103 39.0%
Asia Yes 383 44.4%No 479 55.6%
Central and South America Yes 900 62.0%No 551 38.0%
North America Yes 403 59.5%No 274 40.5%
Europe and the Middle East Yes 582 52.9%No 519 47.1%
Oceania Yes 277 64.0%No 156 36.0%
Global total Yes 2,706 56.5%No 2,082 43.5%
The global proportion of respondents that reported attending an animal talk or show during their visit was 44.7% (Table 18). There was some variation across world regions, with 60.2% of North American respondents reportedly attending an animal talk or show, while in Europe and the Middle East, this figure was only 35.9%.
Table 18 Proportion of respondents that reported attending an animal talk or show during their visit, by world region.
Number Percentage
Africa Yes 150 46.7%
No 171 53.3%
Asia Yes 382 39.7%
No 580 60.3%
Central and South America Yes 715 45.5%
No 856 54.5%
North America Yes 495 60.2%
No 327 39.8%
Europe and the Middle East Yes 445 35.9%
No 794 64.1%
Oceania Yes 252 46.8%
No 286 53.2%
Global total Yes 2,439 44.7%
No 3,014 55.3%
The global proportion of respondents that reported talking to zoo staff or volunteers during their visit was 53.6% (Table 19). The highest proportion was observed at North American institutions (74.4%), with the lowest at European and Middle Eastern institutions (36.2%).
Table 19 Proportion of respondents that reported talking to zoo staff or volunteers during their visit, by world region.
Number Percentage
Africa Yes 154 48.4%
No 164 51.6%
Asia Yes 536 55.7%
No 427 44.3%
Central and South America Yes 814 51.8%
No 757 48.2%
North America Yes 623 74.4%
No 214 25.6%
Europe and the Middle East Yes 449 36.2%
No 790 63.8%
Oceania Yes 356 66.2%
No 182 33.8%
Global total Yes 2,932 53.6%
No 2,534 46.4%
22 23A Global Evaluation of Biodiversity Literacy in Zoo and Aquarium Visitors WAZA | 2014

Only 27.3% of respondents reported watching a video or film during their visit (Table 20). There was some variation across world regions, ranging from 19.0% in Oceania to 33.2% in North America.
Table 20 Proportion of respondents that reported watching a video or film during their visit, by world region.
Number Percentage
Africa Yes 75 23.8%
No 240 76.2%
Asia Yes 265 27.4%
No 702 72.6%
Central and South America Yes 371 23.7%
No 1,197 76.3%
North America Yes 277 33.2%
No 558 66.8%
Europe and the Middle East Yes 400 32.5%
No 831 67.5%
Oceania Yes 102 19.0%
No 435 81.0%
Global total Yes 1,490 27.3%
No 3,963 72.7%
Only 15.1% of respondents reported using a smart-phone application during their visit (Table 21). Central and South American institutions, however, saw a higher proportion (25.6%), with institutions in Oceania much lower (7.7%).
Table 21 Proportion of respondents that reported using a smartphone application during their visit, by world region.
Number Percentage
Africa Yes 62 19.7%
No 252 80.3%
Asia Yes 107 11.3%
No 843 88.7%
Central and South America Yes 366 25.6%
No 1,065 74.4%
North America Yes 106 12.8%
No 721 87.2%
Europe and the Middle East Yes 115 9.3%
No 1,115 90.7%
Oceania Yes 41 7.7%
No 494 92.3%
Global total Yes 797 15.1%
No 4,490 84.9%
In terms of self-reported visiting experiences, a high proportion of respondents (67.4%) reported having had a ‘fun day out’ during their visit (Table 22). The propor-tion of respondents that self-reported having ‘learned about animals’ was almost as high (63.0%). This cate‑gory differed the most from the reported pre‑visit mo-tivation (Table 13), with an increase of 23.9% from the number of respondents that expected to learn about animals to the number that self-reportedly did learn about animals during their visit. Similar to the pre-visit motivation findings (Table 13), the entertainment cate‑gory was the least frequently selected by respondents (50.2%). Generally, there were substantial shifts from reported pre-visit motivations to self-reported visiting experiences.
Table 22 Self‑reported experiences of zoo visit (respondents could select more than one option).
Number Percentage
Had fun day out 3,687 67.4%
Saw many animals 3,793 69.4%
Had good family time 2,837 51.9%
Learned about animals 3,445 63.0%
Was entertained 2,742 50.2%
Other 146 2.7%
Pre ‑ and post‑visit comparison – inferential statistics
There was a significant difference between pre ‑ and post-visit data for both dependent variables of biodi-versity literacy (Fig. 15): biodiversity understanding (F = 124.718, p < 0.001) and knowledge of actions to help protect biodiversity (F = 76.895, p < 0.001). There was an increase from pre‑visit (69.8%) to post‑visit (75.1%) in respondents demonstrating at least some positive evidence of biodiversity understanding. Simi-larly, there was an increase from pre‑visit (50.5%) to post‑visit (58.8%) in respondents that could identify a pro-biodiversity action that could be achieved at an individual level.
Fig. 15 Overall comparison of the two dependent variables of biodiversity literacy – biodiversity understanding and knowledge of actions to help protect biodiversity – between pre ‑ and post‑visit (10‑point scale).
Dependent variable 1: biodiversity understanding
Five of the independent variables significantly pre-dicted change in biodiversity understanding between pre ‑ and post‑visit (Table 23). These were: world region; whether the respondent saw or heard any biodiver-sity information during visit; whether the respondent is a member of an environmental group; age of the respondent; and number of years the respondent spent in formal education. These relationships are explored in more detail below.
Table 23 Test of fixed effects from Linear Mixed Model output on change in biodiversity understanding between pre ‑ and post‑visit (significant effects in bold).
df F p
Intercept 1,718.992 411.098 <0.001
World region 1,737.922 11.361 <0.001
First visit to this zoo 1,728.870 2.329 0.127
First visit to any zoo 1,736.110 2.779 0.096
Zoo member or season ticket holder 1,721.429 2.389 0.122
Gender 1,726.566 0.316 0.574
Local to area or visitor 1,732.582 1.241 0.265
Saw or heard biodiversity information during visit
1,732.956 29.673 <0.001
Attended animal talk or show during visit
1,730.843 0.201 0.654
Talked to zoo staff or volunteers during visit
1,726.598 2.267 0.132
Watched video or film during visit 1,751.305 1.914 0.167
Used smartphone application during visit
1,717.782 2.180 0.140
Watched TV nature shows in last 12 months
1,724.234 1.312 0.252
Member of environmental group 1,702.775 10.407 0.001
Number of zoo visits in last 12 months
1,892.705 0.910 0.340
Age 1,746.361 24.737 <0.001
Years of formal education 1,730.773 23.792 <0.001
Number in visiting group 1,729.531 0.254 0.615
24 25A Global Evaluation of Biodiversity Literacy in Zoo and Aquarium Visitors WAZA | 2014

World region is a significant predictor of change in bio-diversity understanding (F = 11.361, p < 0.001) (Fig. 16). Examining the parameter estimates indicates that respondents from Africa (b = ‑0.378, t = ‑3.258, p = 0.001) and Asia (b = ‑0.314, t = ‑3.150, p = 0.002) score lower, while respondents from Europe and the Middle East (b = 0.198, t = 2.098, p = 0.036) score higher (on 10‑point scale), than respondents from other world regions. This is suggestive of a moderate effect size of world region in predicting change in biodiversity understanding between pre - and post-visit.
Fig. 16 Change from pre ‑ to post‑visit in biodiversity understanding (10‑point scale) as a function of world region.
Respondents that reported seeing or hearing biodiver-sity information during their visit showed a significantly larger change in biodiversity understanding than those that had not (F = 29.673, p < 0.001) (Fig. 17). The param-eter estimate (b = 0.287, t = 5.447, p < 0.001) indicates that respondents that saw or heard biodiversity infor-mation during their visit score 0.287 higher (on 10‑point scale) than those that had not. This is suggestive of a moderate effect size of exposure to biodiversity infor-mation during visit in predicting change in biodiversity understanding between pre - and post-visit.
Fig. 17 Change from pre ‑ to post‑visit in biodiversity understanding (10‑point scale) as a function of exposure to biodiversity information during visit.
Respondents that reported being a member of a nature, conservation or environmental group showed a signifi-cantly smaller change in biodiversity understanding than those that are not (F = 10.407, p = 0.001) (Fig. 18). The parameter estimate (b = ‑0.235, t = ‑3.226, p = 0.001) indicates that respondents that are a member of a na-ture, conservation or environmental group score 0.235 lower (on 10-point scale) than those that are not. This is suggestive of a moderate effect size of environmental group membership in predicting change in biodiversity understanding between pre - and post-visit.
Fig. 18 Change from pre ‑ to post‑visit in biodiversity understanding (10‑point scale) as a function of nature, conservation or environmental group membership.
Respondents’ reported age significantly predicted change in biodiversity understanding (F = 24.737, p < 0.001) (Fig. 19). The parameter estimate (b = 0.010, t = 4.974, p < 0.001) indicates that change in biodiver-sity understanding is 0.010 higher (on 10-point scale) with each additional year of age. This is suggestive of a small effect size of age in predicting change in biodiver-sity understanding between pre - and post-visit.
Fig. 19 Change from pre ‑ to post‑visit in biodiversity understanding (10‑point scale) as a function of age (years).
Respondents’ reported years of formal education significantly predicted change in biodiversity under-standing (F = 23.792, p < 0.001) (Fig. 20). The parameter estimate (b = 0.037, t = 4.878, p < 0.001) indicates that change in biodiversity understanding is 0.037 higher (on 10-point scale) with each additional year of formal education. This is suggestive of a small effect size of formal education in predicting change in biodiversity understanding between pre - and post-visit.
Fig. 20 Change from pre ‑ to post‑visit in biodiversity understanding (10‑point scale) as a function of formal education.
26 27A Global Evaluation of Biodiversity Literacy in Zoo and Aquarium Visitors WAZA | 2014

Dependent variable 2: knowledge of actions to help protect biodiversity
Six of the independent variables significantly pre-dicted change in knowledge of actions to help protect biodiversity between pre - and post-visit (Table 24). These were: world region; gender of the respondent; whether the respondent saw or heard any biodiversity information during visit; whether the respondent saw any video or film during visit; whether the respondent is a member of an environmental group; and age of the respondent. These relationships are explored in more detail below.
Table 24 Test of fixed effects from Linear Mixed Model output on change in knowledge of actions to help protect biodiversity between pre ‑ and post‑visit (significant effects in bold).
df F p
Intercept 1,551.017 497.394 <0.001
World region 1,549.771 14.948 <0.001
First visit to this zoo 1,558.249 0.285 0.594
First visit to any zoo 1,560.985 0.399 0.528
Zoo member or season ticket holder 1,557.090 1.769 0.184
Gender 1,536.968 10.204 <0.001
Local to area or visitor 1,572.226 1.345 0.246
Saw or heard biodiversity information during visit
1,542.459 15.629 <0.001
Attended animal talk or show during visit
1,553.962 0.254 0.614
Talked to zoo staff or volunteers during visit
1,543.823 1.380 0.240
Watched video or film during visit 1,555.524 7.799 0.005
Used smartphone application during visit
1,537.701 0.751 0.386
Watched TV nature shows in last 12 months
1,620.923 0.820 0.365
Member of environmental group 1,531.913 5.335 0.021
Number of zoo visits in last 12 months
1,734.101 0.404 0.525
Age 1,557.312 16.357 <0.001
Years of formal education 1,544.331 0.714 0.398
Number in visiting group 1,609.594 1.518 0.218
World region is a significant predictor of change in knowledge of actions to help protect biodiversity (F = 14.948, p < 0.001) (Fig. 21). The parameter esti-mates indicate that respondents from Africa (b = ‑0.659, t = ‑3.257, p = 0.001), Asia (b = ‑0.755, t = ‑4.317, p < 0.001) and Central and South America (b = ‑0.974, t = ‑6.075, p < 0.001) score lower (on 10‑point scale) than respond-ents from other world regions. This is suggestive of a large effect size of world region in predicting change in knowledge of pro-biodiversity actions between pre - and post-visit.
Fig. 21 Change from pre ‑ to post‑visit in knowledge of pro‑biodiversity actions (10‑point scale) as a function of world region.
Female respondents showed a significantly smaller change in knowledge of actions to help protect biodi-versity than male respondents (F = 10.204, p = 0.001) (Fig. 22). The parameter estimate (b = ‑0.285, t = ‑3.194, p = 0.001) indicates that female respondents score 0.285 lower (on 10‑point scale) than male respondents. This is suggestive of a moderate effect size of gender in predicting change in knowledge of pro-biodiversity actions between pre - and post-visit.
Fig. 22 Change from pre ‑ to post‑visit in knowledge of pro‑biodiversity actions (10‑point scale) as a function of gender.
Respondents that reported seeing or hearing biodi-versity information during their visit showed a signifi-cantly larger change in knowledge of actions to help protect biodiversity than those that had not (F = 15.629, p < 0.001) (Fig. 23). The parameter estimate (b = 0.365, t = 3.953, p < 0.001) indicates that respondents that saw or heard biodiversity information during their visit score 0.365 higher (on 10‑point scale) than those that had not. This is suggestive of a moderate effect size of exposure to biodiversity information during visit in pre-dicting change in knowledge of pro-biodiversity actions between pre - and post-visit.
Fig. 23 Change from pre ‑ to post‑visit in knowledge of pro‑biodiversity actions (10‑point scale) as a function of exposure to biodiversity information during visit.
Respondents that reported watching a video or film during their visit showed a significantly larger change in knowledge of actions to help protect biodiversity than those that had not (F = 7.779, p = 0.005) (Fig. 24). The parameter estimate (b = 0.284, t = 2.793, p = 0.005) indicates that respondents that watched a video or film during their visit score 0.284 higher (on 10‑point scale) than those that had not. This is suggestive of a moder-ate effect size of exposure to videos or films during visit in predicting change in knowledge of pro-biodiversity actions between pre - and post-visit.
Fig. 24 Change from pre ‑ to post‑visit in knowledge of pro‑biodiversity actions (10‑point scale) as a function of whether videos or films were watched during visit.
28 29A Global Evaluation of Biodiversity Literacy in Zoo and Aquarium Visitors WAZA | 2014
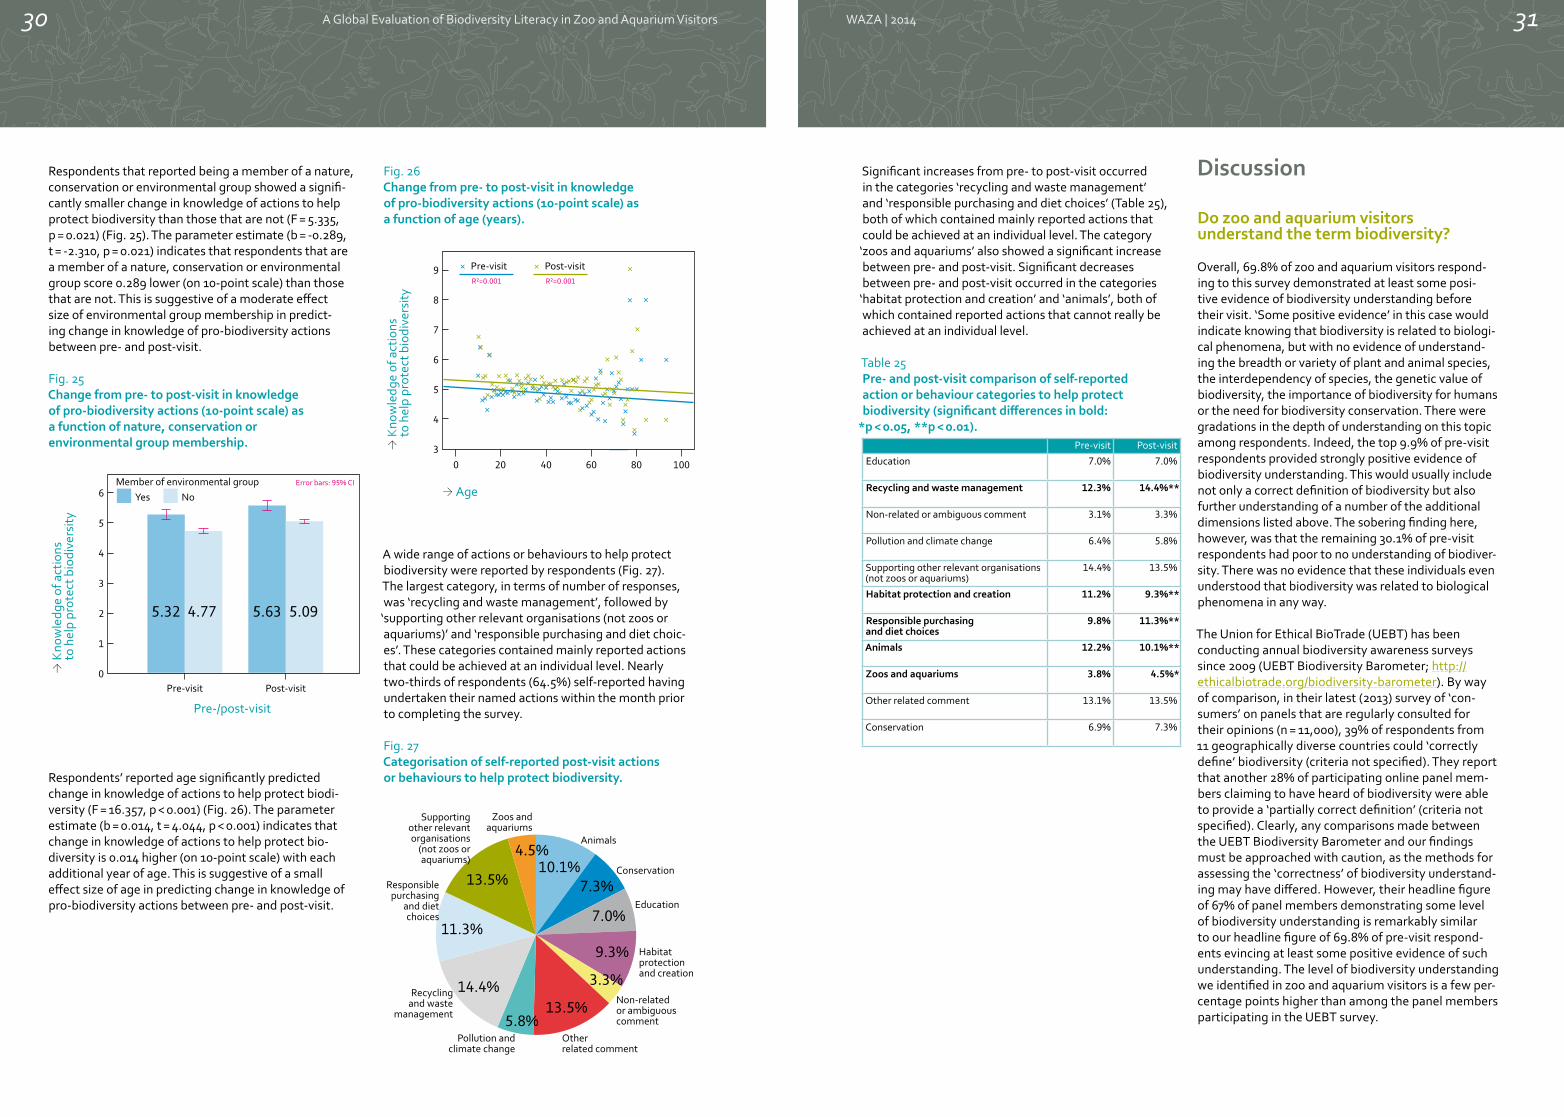
Respondents that reported being a member of a nature, conservation or environmental group showed a signifi-cantly smaller change in knowledge of actions to help protect biodiversity than those that are not (F = 5.335, p = 0.021) (Fig. 25). The parameter estimate (b = ‑0.289, t = ‑2.310, p = 0.021) indicates that respondents that are a member of a nature, conservation or environmental group score 0.289 lower (on 10‑point scale) than those that are not. This is suggestive of a moderate effect size of environmental group membership in predict-ing change in knowledge of pro-biodiversity actions between pre - and post-visit.
Fig. 25 Change from pre ‑ to post‑visit in knowledge of pro‑biodiversity actions (10‑point scale) as a function of nature, conservation or environmental group membership.
Respondents’ reported age significantly predicted change in knowledge of actions to help protect biodi-versity (F = 16.357, p < 0.001) (Fig. 26). The parameter estimate (b = 0.014, t = 4.044, p < 0.001) indicates that change in knowledge of actions to help protect bio-diversity is 0.014 higher (on 10-point scale) with each additional year of age. This is suggestive of a small effect size of age in predicting change in knowledge of pro-biodiversity actions between pre - and post-visit.
Fig. 26 Change from pre ‑ to post‑visit in knowledge of pro‑biodiversity actions (10‑point scale) as a function of age (years).
A wide range of actions or behaviours to help protect biodiversity were reported by respondents (Fig. 27). The largest category, in terms of number of responses, was ‘recycling and waste management’, followed by
‘supporting other relevant organisations (not zoos or aquariums)’ and ‘responsible purchasing and diet choic-es’. These categories contained mainly reported actions that could be achieved at an individual level. Nearly two ‑thirds of respondents (64.5%) self‑reported having undertaken their named actions within the month prior to completing the survey.
Fig. 27 Categorisation of self‑reported post‑visit actions or behaviours to help protect biodiversity.
Significant increases from pre ‑ to post‑visit occurred in the categories ‘recycling and waste management’ and ‘responsible purchasing and diet choices’ (Table 25), both of which contained mainly reported actions that could be achieved at an individual level. The category
‘zoos and aquariums’ also showed a significant increase between pre ‑ and post‑visit. Significant decreases between pre - and post-visit occurred in the categories
‘habitat protection and creation’ and ‘animals’, both of which contained reported actions that cannot really be achieved at an individual level.
Table 25 Pre ‑ and post‑visit comparison of self‑reported action or behaviour categories to help protect biodiversity (significant differences in bold:
*p < 0.05, **p < 0.01).Pre-visit Post-visit
Education 7.0% 7.0%
Recycling and waste management 12.3% 14.4%**
Non-related or ambiguous comment 3.1% 3.3%
Pollution and climate change 6.4% 5.8%
Supporting other relevant organisations (not zoos or aquariums)
14.4% 13.5%
Habitat protection and creation 11.2% 9.3%**
Responsible purchasing and diet choices
9.8% 11.3%**
Animals 12.2% 10.1%**
Zoos and aquariums 3.8% 4.5%*
Other related comment 13.1% 13.5%
Conservation 6.9% 7.3%
Discussion
Do zoo and aquarium visitors understand the term biodiversity?
Overall, 69.8% of zoo and aquarium visitors respond-ing to this survey demonstrated at least some posi-tive evidence of biodiversity understanding before their visit. ‘Some positive evidence’ in this case would indicate knowing that biodiversity is related to biologi-cal phenomena, but with no evidence of understand-ing the breadth or variety of plant and animal species, the interdependency of species, the genetic value of biodiversity, the importance of biodiversity for humans or the need for biodiversity conservation. There were gradations in the depth of understanding on this topic among respondents. Indeed, the top 9.9% of pre-visit respondents provided strongly positive evidence of biodiversity understanding. This would usually include not only a correct definition of biodiversity but also further understanding of a number of the additional dimensions listed above. The sobering finding here, however, was that the remaining 30.1% of pre‑visit respondents had poor to no understanding of biodiver-sity. There was no evidence that these individuals even understood that biodiversity was related to biological phenomena in any way.
The Union for Ethical BioTrade (UEBT) has been conducting annual biodiversity awareness surveys since 2009 (UEBT Biodiversity Barometer; http://ethicalbiotrade.org/biodiversity-barometer). By way of comparison, in their latest (2013) survey of ‘con-sumers’ on panels that are regularly consulted for their opinions (n = 11,000), 39% of respondents from 11 geographically diverse countries could ‘correctly define’ biodiversity (criteria not specified). They report that another 28% of participating online panel mem-bers claiming to have heard of biodiversity were able to provide a ‘partially correct definition’ (criteria not specified). Clearly, any comparisons made between the UEBT Biodiversity Barometer and our findings must be approached with caution, as the methods for assessing the ‘correctness’ of biodiversity understand-ing may have differed. However, their headline figure of 67% of panel members demonstrating some level of biodiversity understanding is remarkably similar to our headline figure of 69.8% of pre‑visit respond-ents evincing at least some positive evidence of such understanding. The level of biodiversity understanding we identified in zoo and aquarium visitors is a few per-centage points higher than among the panel members participating in the UEBT survey.
30 31A Global Evaluation of Biodiversity Literacy in Zoo and Aquarium Visitors WAZA | 2014
Do zoo and aquarium visitors understand the actions they can take to help protect biodiversity?
Despite 62.1% of respondents before their visit reporting they had undertaken an action to help protect biodiversity in the month prior to complet-ing the survey, in fact only 50.5% of reported actions could be achieved at an individual level. Therefore, in contrast to biodiversity understanding, it appears that respondents are less clear in their understanding of actions they can take to help protect biodiversity. This is clearly an area where zoos and aquariums can target educational programming to maximise knowledge of pro-biodiversity actions.
The categorisation of reported actions or behaviours was also revealing. Zoos and aquariums overwhelm-ingly see and portray themselves as biodiversity con-servation organisations (Patrick et al. 2007), yet only 3.8% of respondents saw visiting a zoo or aquarium as an action to help protect biodiversity before their visit. This would not be such a striking finding if it were not coupled with the fact that 14.4% of respondents cited supporting other relevant organisations (most often WWF), financially or otherwise, as an action to help protect biodiversity. However, the action category
‘zoos and aquariums’ showed a significant increase between pre ‑ and post‑visit (to 4.5% of respondents). Again, this would be an obvious theme for future zoo and aquarium education programmes.
Are there any predictors of biodiversity understanding and knowledge of actions to help protect biodiversity?
Respondents that were zoo or aquarium members (or season ticket holders) and repeat visitors had higher levels of pre-visit biodiversity understanding. The fact that first ‑time zoo and aquarium visitors have a lower level of pre-visit biodiversity understanding than re-peat visitors hints at a correlation between repeatedly visiting zoos and aquariums and higher biodiversity understanding.
Furthermore, respondents that were members of a nature, conservation or environmental group, younger respondents and respondents with longer formal edu-cation showed higher pre-visit biodiversity understand-ing and knowledge of actions to help protect biodiver-sity. Female respondents and respondents that had watched TV nature shows in the last 12 months also showed higher levels of biodiversity understanding. However, respondents from Central and South America showed lower pre-visit knowledge of actions to help protect biodiversity. These findings may help zoos and aquariums to more specifically target their biodiversity awareness -raising campaigns.
Can zoos and aquariums make a positive contribution to Aichi Biodiversity Target 1?
Aichi Biodiversity Target 1 states that ‘by 2020, at the latest, people are aware of the values of biodiversity and the steps they can take to conserve and use it sustainably’. From this we can discern two distinct components: biodiversity awareness and knowledge of how to conserve biodiversity and use it sustainably. In our study, we have measured biodiversity ‘understand-ing’, as we felt that was a more robust and meaningful measure than ‘awareness’. For example, someone could have awareness of the term biodiversity but could conceivably have an incorrect understanding of it, whereas it is unlikely that someone could understand the concept of biodiversity without being aware of it. Findings from the UEBT survey (2013) reinforce this point, where biodiversity ‘awareness’ (self-reported recognition of the term) was reported at 67%, but only 39% of respondents could ‘correctly define’ biodiversity.
In our study, respondents’ biodiversity understanding and knowledge of actions to help protect biodiver-sity both significantly increased between pre ‑ and post‑visit. There was an increase from pre‑visit (69.8%) to post‑visit (75.1%) in respondents demonstrating at least some positive evidence of biodiversity un-derstanding. Similarly, there was an increase from pre‑visit (50.5%) to post‑visit (58.8%) in respondents that could identify a pro-biodiversity action that could be achieved at an individual level. This suggests that zoos and aquariums can make a positive contribution to Aichi Biodiversity Target 1, as zoos and aquariums are increasing the number of people who understand biodiversity. They are also bolstering the ranks of those who are aware of the steps they can take to
conserve and use biodiversity sustainably by improv-ing knowledge of actions to help protect biodiversity. Furthermore, our findings provide a much‑needed baseline for CBD to measure progress towards achiev-ing Aichi Biodiversity Target 1. The challenge for zoos and aquariums is how to use these findings to directly improve the conservation of biodiversity. An increase in knowledge (or even pro -conservation attitudes) is not necessarily a reliable predictor of a related change in behaviour (Schultz 2011; Heberlein 2012). Understand-ing more about biodiversity, or increasing knowledge of actions to protect it, are nevertheless valuable outcomes of a zoo or aquarium visit. Building upon this knowledge and driving pro -conservation behavioural and social change should be seen as an equally impor-tant task for the zoo and aquarium community.
This conclusion is supported by a comparison of the actions or behaviours to help protect biodiversity that were reported by respondents both pre - and post‑visit: there was a significant aggregate increase in the number of respondents reporting pro-biodiversity action categories that can be achieved at an individual level. This mainly included individual -level actions in the categories of ‘recycling and waste management’ and ‘responsible purchasing and diet choices’. Simi-larly, when comparing the respondents’ self-reported motivation to visit the zoo or aquarium and their actual experience during the visit, the largest dif-ference was between the number of respondents expecting to learn about animals (39.1%) and the number that self-reportedly did learn about animals during their visit (63.0%). ‘Learned about animals’ was in fact among the most frequently chosen categories to describe a respondent’s visiting experience when asked post-visit.
Respondents that were exposed to biodiversity infor-mation during their visit showed a significantly larger change in both biodiversity understanding and know-ledge of actions to help protect biodiversity. In particu-lar, respondents that had watched a video or film dur-ing their visit showed a significantly larger change in knowledge of actions to help protect biodiversity. How-ever, just over half of the respondents (56.5%) report-edly saw or heard biodiversity information during their visit. Thus, zoos and aquariums would be well -advised to increase visitors’ exposure to biodiversity informa-tion at their institutions to reap the benefit of improved learning outcomes identified by this study. It seems that screening videos and films, which only about a quarter of respondents (27.3%) reportedly watched during their visit, would promote knowledge of pro-biodiversity actions. The campaign that WAZA launched for rais-ing awareness about biodiversity in zoo and aquarium visitors is about facilitating exposure to biodiversity information, including the provision of videos.
Generally, respondents from Africa, Asia and Central and South America showed smaller aggregate changes in both biodiversity understanding and knowledge of actions to help protect biodiversity between pre - and post-visit. Older respondents showed a larger change in both biodiversity understanding and knowledge of actions to help protect biodiversity between pre - and post‑visit. Respondents with longer formal education showed a larger change in biodiversity understand-ing from pre - to post-visit. Some of the respondent categories that showed higher aggregate pre-visit biodiversity understanding (i.e. members of environ-mental groups) and pre-visit knowledge of actions to help protect biodiversity (i.e. women and members of environmental groups) showed a smaller change in these two dependent variables between pre - and post‑visit. Again, these findings may help zoos and aquariums to more specifically target their biodiversity awareness -raising campaigns.
To our knowledge, this is the largest survey of its kind conducted to date. The two dependent variables of biodiversity literacy measured in our study correspond to the two components of Aichi Biodiversity Target 1: biodiversity awareness and knowledge of how to conserve biodiversity and use it sustainably. By using a repeated -measures survey design, we were able to assess any differences in the direction and magnitude of these zoo and aquarium visitor outcomes from pre - to post‑visit. The overarching finding here is that a sig-nificant number of visitors to zoos and aquariums from across the globe end their visit with higher biodiversity understanding and greater knowledge of actions to help protect biodiversity. While it is always difficult to confidently assign causes to a statistical relation-ship such as this, the timing of the changes identified strongly suggests that zoo and aquarium visits have at least some bearing on these positive changes. This study therefore highlights the important potential of zoos and aquariums as public engagement institutions dedicated to halting and eventually reversing the loss of biodiversity of the planet, as called for in the United Nations Strategic Plan for Biodiversity 2011–2020.
32 33A Global Evaluation of Biodiversity Literacy in Zoo and Aquarium Visitors WAZA | 2014
AcknowledgementsWe are indebted to the following WAZA member organisations that conducted the survey data collection: Houston Zoo, San Diego Zoo Global, Bronx Zoo – Wildlife Conservation Society, Lincoln Park Zoo, Georgia Aquarium, Smithsonian National Zoological Park, Vancouver Aquarium, Zoo de Granby, Zoo Leipzig, Zoo Frankfurt, London Zoo – Zoological Society of London, Chester Zoo, Zoo Zürich, Parken Zoo, Singapore Zoo – Wildlife Reserves Singapore, Ocean Park Hong Kong, Fundação Parque Zoológico de São Paulo, Zoológico Nacional de Chile, Fundación Temaikèn, Africam Safari, Perth Zoo, Melbourne Zoo – Zoos Victoria, uShaka Sea World, Johannesburg Zoo, Uganda Wildlife Education Centre, Zoo Outreach Organisation, Zoorasia Yokohama Zoological Gardens, Central Zoo Authority, Asociación Colombiana de Parques Zoológicos y Acuarios and Moscow Zoo. We are grateful to the following experts for providing initial survey design advice and guidance: Susan Clayton, Liam Smith, Brady Wagoner, Harry Schram, Katherine Irvine, Susan Kevin, Joe Heimlich, Mary Paden and David Ritchie. We are also grateful to the following Chester Zoo staff that assisted on this project: Sonny Bacigalupo, Ruth Pearson, Maggie Esson, Kate Brankin, Vicki Small and Laura Myers. Financial support for this project was gratefully received from the MAVA Foundation.
References• Balmford, A., Leader -Williams, N., Mace, G. M.,
Manica, A., Walter, O., West, C. & Zimmermann, A. (2007) Message received? Quantifying the impact of informal conservation education on adults visiting UK zoos. In: Zoos in the 21st Century: Catalysts for Conservation? (ed. by Zimmermann, A., Hatchwell, M., Dickie, L. A. & West, C.), pp. 120–136. Cambridge: Cambridge University Press.
• Carr, N. & Cohen, S. (2011) The public face of zoos: images of entertainment, education and conservation. Anthrozoos 24: 175–189.
• Dawson, E. & Jensen, E. (2011) Towards a contextual turn in visitor studies: evaluating visitor segmentation and identity -related motivations. Visitor Studies 14: 127–140.
• Dove, T. & Byrne, J. (2014) Do zoo visitors need zoology knowledge to understand conservation messages? An exploration of the public understanding of animal biology and of the conservation of biodiversity in a zoo setting. International Journal of Science Education, Part B: Communication and Public Engagement 4: in press.
• Esson, M. & Moss, A. (2013) The risk of delivering disturbing messages to zoo family audiences. Journal of Environmental Education 44: 79–96.
• Falk, J. H., Reinhard, E. M., Vernon, C. L., Bronnenkant, K., Deans, N. L. & Heimlich, J. E. (2007) Why Zoos and Aquariums Matter: Assessing the Impact of a Visit to a Zoo or Aquarium. Silver Spring, MD: Association of Zoos & Aquariums.
• Gusset, M. & Dick, G. (2011) The global reach of zoos and aquariums in visitor numbers and conservation expenditures. Zoo Biology 30: 566–569.
• Heberlein, T. A. (2012) Navigating environmental attitudes. Conservation Biology 26: 583–585.
• Jensen, E. (2011) Evaluate impact of communication. Nature 469: 162.
• Jensen, E. (2014) Evaluating children’s conservation biology learning at the zoo. Conservation Biology 28: in press.
• Jensen, E., Dawson, E. & Falk, J. H. (2011) Dialogue and synthesis: developing consensus in visitor research methodology. Visitor Studies 14: 158–161.
• Landis, J. R. & Koch, G. G. (1977) The measurement of observer agreement for categorical data. Biometrics 33: 159–174.
• Luebke, J. F. & Grajal, A. (2011) Assessing mission -related learning outcomes at zoos and aquaria: prevalence, barriers, and needs. Visitor Studies 14: 195–208.
• Marino, L., Lilienfeld, S. O., Malamud, R., Nobis, N. & Broglio, R. (2010) Do zoos and aquariums promote attitude change in visitors? A critical evaluation of the American zoo and aquarium study. Society and Animals 18: 126–138.
• Moss, A. & Esson, M. (2013) The educational claims of zoos: where do we go from here? Zoo Biology 32: 13–18.
• Packer, J. & Ballantyne, R. (2010) The role of zoos and aquariums in education for a sustainable future. New Directions for Adult and Continuing Education 2010: 25–34.
• Patrick, P. G., Matthews, C. E., Ayers, D. F. & Tunnicliffe, S. D. (2007) Conservation and education: prominent themes in zoo mission statements. Journal of Environmental Education 38: 53–60.
• RSPCA (2007) Evaluation of the effectiveness of zoos in meeting conservation and education objectives. In: The Welfare State: Measuring Animal Welfare in the UK in 2006, pp. 95–98. Horsham: Royal Society for the Prevention of Cruelty to Animals.
• Schultz, P. W. (2011) Conservation means behavior. Conservation Biology 25: 1080–1083.
• Smith, L., Broad, S. & Weiler, B. (2008) A closer examination of the impact of zoo visits on visitor behaviour. Journal of Sustainable Tourism 16: 544–562.
• Wagoner, B. & Jensen, E. (2010) Science learning at the zoo: evaluating children’s developing understanding of animals and their habitats. Psychology & Society 3: 65–76.
• Wagoner, B. & Jensen, E. (2014) Microgenetic evaluation: studying learning in motion. In: The Yearbook of Idiographic Science, Volume 6: Reflexivity and Change in Psychology (ed. by Marsico, G., Ruggieri, R. & Salvatore, S.), in press. Charlotte, NC: Information Age Publishing.
• WAZA (2005) Building a Future for Wildlife: The World Zoo and Aquarium Conservation Strategy. Berne: WAZA Executive Office.
34 35A Global Evaluation of Biodiversity Literacy in Zoo and Aquarium Visitors WAZA | 2014

Appendix
Pre-Visit Survey Form
10. Please list anything that comes to mind when you think of ‘biodiversity’:
1.
2.
3.
4.
5.
Visitor Survey
12. What prompted your zoo or aquarium visit today (tick all that apply)?
Fun day out Learn about animals
See animals Entertainment
Family time Other
If other, please specify:
This survey is done under the auspices of the World Association of Zoos and Aquariums (WAZA). For more information, please click on ‘Visitor Survey’ on www.waza.org.
Thank you very much for completing this survey!
1. Time:
AM / PM (circle)
2. Is today your first visit to this zoo or aquarium?
YES NO NOT SURE
3. If this is your first visit, is this your first visit to any zoo or aquarium?
YES NO NOT SURE
4. How many times do you think you have visited any zoo or aquarium in the last 12 months?
__________ visits
5. Are you a season ticket holder or member?
YES NO NOT SURE
6. What is your gender?
MALE FEMALE
7. What is your age?
__________ years
8. How many years of formal education (in school, college and university) have you had?
__________ years
9. Do you live locally or are you visiting?
LOCAL VISITOR / TOURIST
11. If you can think of an action that you could take to help save animal species, please list
below: (Or if you cannot think of any actions, tick here )
1.
2.
If you listed an action above, have you done it in the last month?
NO YES NOT SURE
Visitor number:Date:Institution
Post-Visit Survey Form
9. Please list anything that comes to mind when you think of ‘biodiversity’:
1.
2.
3.
4.
5.
11. Which of these describe your experience at the zoo or aquarium today (tick all that apply)?
Had fun day out Learned about animals
Saw many animals Was entertained
Had good family time Other
If other, please specify:
12. Are you part of a conservation, natureor environmental group of any kind?
YES NO NOT SURE
13. ‘I would be willing to participate in further research on this topic’:
YES NO
If YES, please provide e-mail address:
1. Time:
AM / PM (circle)
2. How many people are in your group today (including you):
__________ people
3. During your visit today, did you see or hear any information about ‘biodiversity’?
YES NO NOT SURE
4. During your visit today, did you attend any informational animal talk or show?
YES NO NOT SURE
5. During your visit today, did you talk to any zoo or aquarium staff or volunteers?
YES NO NOT SURE
6. During your visit today, did you watch any videos or films?
YES NO NOT SURE
7. During your visit today, did you use a smartphone application to enhance your visiting experience?
YES NO NOT SURE
If YES, please specify the ‘app’:
8. Have you watched any nature shows on television in the last 12 months?
YES NO NOT SURE
Visitor number:
10. If you can think of an action that you could take to help save animal species, please list
below: (Or if you cannot think of any actions, tick here )
1.
2.
If you listed an action above, have you done it in the last month?
NO YES NOT SURE
Visitor Survey Date:Institution
Pre‑visit survey form Post‑visit survey form
36 A Global Evaluation of Biodiversity Literacy in Zoo and Aquarium Visitors WAZA | 2014 37

www.waza.org