Embed Size (px)
Citation preview

01/01/2015
A GIS tool to create
human population
distribution layers
Michele Vittorio
June 29, 2016

2
Importance of high resolution population estimates
Monitor population
Emergency planning
Resources allocation
Scenario analysis

3
Availability of population data
Coarse resolution datasets.
Aggregate data significantly different than the data provided.
by the census.
Local data only partially covering the whole country.
Static data.

4
Different options for creating a population map
Choropleth maps
• A total number is assigned to each polygon (census blocks if available or districts/regions)
Isopleth maps
• A total number is assigned to each polygon (census blocks if available or districts/regions)
Dasymetric map
• Interpolation of data where ancillary information is used (“intelligent” dasymetric mapping)
Choropleth map Dasymetric map
Population/cell (250m)
0 - 15
16 - 50
51 - 100
101 - 200
201 - 250
251 - 400

5
Dasymetric map
Dasymetric mapping is a geospatial technique that uses additional information types to more
accurately distribute data that has been assigned to arbitrary boundaries.
Ancillary data
Land cover
Density data
Boundaries
Census blocks
Regions Districts Cities
Land cover map
Landsat
Census data

6
Dasymetric map workflow
Satellite images
Density map
Census data
Land cover
Population map

7
Ancillary data
WorldLand cover BaseVue 2013 and World Land Cover ESA 2010
Landsat 8
Global Total Population CIESIN, ESRI World Population Estimate, Oak Ridge LandScan™.

8
Assign the census data to polygons containing the values and the estimates.
The interpolation model is derived by the EnviroAtlas model published by EPA and (Mennis, J. and Hultgren, T., 2006. Intelligent
dasymetric mapping and its application to areal interpolation. Cartography and Geographic Information Science, 33(3): 179-194.)
Convert the polygons to raster with the selected resolution.Reclassify the land cover in classes that represents the same estimated population density.Estimate the expected population density in the different land use classes according
to the local census data and other data sources as Landscan and the ESRI WPE. Create a list of unique combinations of population units (districts) and land cover classes.Create the population layer using several iterations the dasymetric calculations.

9
Census polygons and Population density classes
Population units and cells grid

10
The Estimate Population GIS toolbox The workflow was saved as a Python toolbox.
The input parameters of the main tool are:
- The population targets layer (Census data)
- The land cover raster
- The expected population by cell in each land cover class
Additional tools:
- Create a time aware layer.
- Quality check and estimate the accuracy.

11
The Python tools
Python toolbox:
1) Population data to raster.
2) Combine population raster with population density
classes raster.
3) Recalculate the density according to expected
values.
4) Create the raster using the Lookup function.
Combine
12
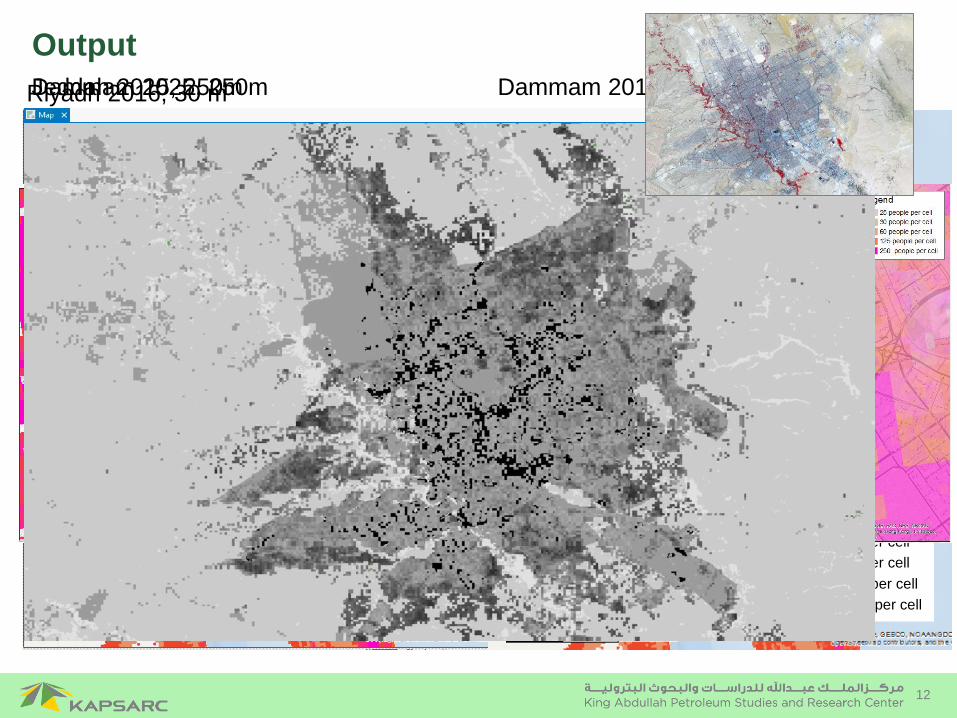
Output
Jeddah 2015, 250m Dammam 2015, 250mDammam 2025, 250m
Legend
25 people per cell
30 people per cell
60 people per cell
125 people per cell
250 people per cell
ESRI WPE KAPSARC WPE
Riyadh 2016, 30 m

13
Population clock map: Uganda
Data sources:
UN Population Division
http://countrymeters.info/

14
Population clock map: Kampala
2020: 45 856 367 2025: 53 496 737
0 25 50 Kilometers

15
Conclusions
Results:• A Python ArcGIS Pro toolbox that assists the preparation of the data and performs the calculation to
generate a raster representing a scenario of the distribution of human population within an area of interest.
Next steps:
• Create and test validation procedures.
• Create procedures to extract population density classes from satellite images.
• Calibration of the model for different areas,
• Publish the model on ArcGIS for Server to allow the creation and download of the population raster.
• Create land use scenarios and urban sprawl predictions layer.
Las Vegas 1984 and 2007, Image courtesy USGS