Embed Size (px)
Citation preview

Western Michigan University Western Michigan University
ScholarWorks at WMU ScholarWorks at WMU
Master's Theses Graduate College
12-2008
A Geophysical Survey of Fort St. Joseph (20BE23), Niles, A Geophysical Survey of Fort St. Joseph (20BE23), Niles,
Michigan Michigan
Daniel P. Lynch
Follow this and additional works at: https://scholarworks.wmich.edu/masters_theses
Part of the Archaeological Anthropology Commons
Recommended Citation Recommended Citation Lynch, Daniel P., "A Geophysical Survey of Fort St. Joseph (20BE23), Niles, Michigan" (2008). Master's Theses. 80. https://scholarworks.wmich.edu/masters_theses/80
This Masters Thesis-Open Access is brought to you for free and open access by the Graduate College at ScholarWorks at WMU. It has been accepted for inclusion in Master's Theses by an authorized administrator of ScholarWorks at WMU. For more information, please contact [email protected].

A GEOPHYSICAL SURVEY OF FORT ST. JOSEPH (20BE23), NILES, MICHIGAN
Daniel P. Lynch, M.A.
Western Michigan University, 2008
Fort St. Joseph is a 17th-18th century French (and later English)
mission-garrison-trading post complex located in southwest Michigan. A
geophysical survey was performed and the results of the survey were tested
through archaeological excavation. The geophysical methods included ground
penetrating radar, electromagnetic induction, electrical resistivity, magnetic
gradiometry, and magnetic susceptibility. The results of the archaeological
excavations demonstrate that magnetic gradiometry was the preferred
geophysical method at this particular site. The magnetic gradiometer survey
included both terrestrial and possible submerged portions the site. Laboratory
analysis of the magnetic susceptibility and magnetic viscosity of soils and rocks
demonstrated that the archaeological features at Fort St. Joseph have a
statistically significant magnetic contrast with those of the natural soils. This
study has the potential to contribute to the fields of French colonial archaeology,
wet site archaeology, and soil and rock magnetism. Recommendations for future
research are suggested, including investigating a possible submerged cultural
resource located a few meters north of the existing riverbank.

A GEOPHYSICAL SURVEY OF FORT ST. JOSEPH (20BE23), NILES, MICHIGAN
by
Daniel P. Lynch
A Thesis Submitted to the
Faculty of The Graduate College in partial fulfillment of the
requirements for the Degree of Master of Arts
Department of Anthropology
Western Michigan University Kalamazoo, Michigan
December 2008

Copyright by Daniel P. Lynch
2008

ii
ACKNOWLEDGMENTS
I would like to extend my sincere gratitude to the late Mr. Tom Hargrove
for introducing me to archaeological geophysics in 1996. Tom allowed me to
assist him on some interesting projects throughout North Carolina, and I have
been hooked on geophysics ever since. I would like to thank my committee
members, and particularly Dr. Michael Nassaney for providing me the
opportunity to work with the Fort St. Joseph Archaeological Project. Dr.
William Sauck helped to keep me on track with insightful comments and lively
discussion about geophysics. Dr. Allen Zagarell has inspired me to ‘think
outside the box’ since the day I arrived at WMU, and I am grateful to have him
on my committee. Although no longer on my committee due to retirement, I
would like to thank Dr. Bill Cremin for making the 2002 fieldwork so enjoyable.
I would also like to thank Mark Lynott of the Midwest Archaeological Center for
providing me with a summer internship at Hopeton Earthworks. This
opportunity allowed me to spend the summer collecting magnetometer data for
Dr. John Weymouth, a positive experience I will always remember.
Furthermore, I would like to thank Bruce Bevan, Rinita Dalan, Steve DeVore
and John Weymouth for providing me with copies of hard to find manuscripts. I
would like to thank my wife, Barrie Ann, for understanding why I had to
temporarily move 1000 miles away to go to graduate school in Michigan. I
would also like to express my gratitude to my parents, Claire and Doyle.
Daniel P. Lynch

iii
TABLE OF CONTENTS
ACKNOWLEDGMENTS .................................................................................. ii
LIST OF TABLES............................................................................................. vii
LIST OF FIGURES........................................................................................... viii
CHAPTER
I. PROJECT BACKGROUND .................................................................. 1
Fort St. Joseph Archaeological Project: 2002 Project Goals ......... 1
The Geophysical Problem .............................................................. 3
Significance of the Research .......................................................... 3
French Colonial Sites.............................................................. 4
Wet Environments .................................................................. 5
Soil and Rock Magnetism ....................................................... 5
Organization of this Study............................................................. 6
II. LITERATURE REVIEW ....................................................................... 8
A Brief History of Fort St. Joseph ................................................. 8
Types of Archaeological Features Expected........................... 10
A Brief History of Archaeological Geophysics............................... 11
Recent Trends in Archaeological Geophysics................................ 12
Geophysical Prospection at Midcontinental French Colonial Sites ................................................................................................ 13
Summary ........................................................................................ 15
III. SITE GEOLOGY AND DRAINAGE METHODOLOGY ...................... 17

Table of Contents—continued
iv
CHAPTER
Site Geology.................................................................................... 17
Drainage Methodology ................................................................... 19
Summary ........................................................................................ 20
IV. GEOPHYSICAL SURVEY METHODOLOGY ..................................... 22
Ground Penetrating Radar (GPR) Methodology ........................... 23
Electromagnetic Induction (Conductivity) Methodology .............. 24
Magnetic Gradiometer Methodology ............................................. 25
Electrical Resistivity Methodology ................................................ 27
Magnetic Susceptibility Methodology............................................ 28
Field Methods ......................................................................... 28
Laboratory Methods................................................................ 29
Summary ........................................................................................ 31
V. GEOPHYSICAL ANOMALY TESTING............................................... 32
Anomaly #1 (Feature 7) ................................................................. 33
Conductivity and Resistivity Anomaly #1 (Feature 7) .......... 33
Magnetometer Anomaly #1 (Feature 7) ................................. 34
GPR Anomaly #1 (Feature 7) ................................................. 34
Excavation Results Anomaly #1 (Feature 7).......................... 36
Anomaly #2 (Feature 6) ................................................................. 39
Conductivity and Resistivity Anomaly #2 (Feature 6) .......... 39
Magnetometer Anomaly #2 (Feature 6) ................................. 39
GPR Anomaly #2 (Feature 6) ................................................. 41

Table of Contents—continued
v
CHAPTER
Excavation Results Anomaly #2 (Feature 6).......................... 42
Anomaly #3 (Feature 5) ................................................................. 43
Conductivity and Resistivity Anomaly #3 (Feature 5) .......... 43
Magnetometer Anomaly #3 (Feature 5) ................................. 44
GPR Anomaly #3 (Feature 5) ................................................. 45
Excavation Results Anomaly #3 (Feature 5).......................... 45
Anomaly #4..................................................................................... 47
Conductivity and Resistivity Anomaly #4.............................. 47
Magnetometer Anomaly #4..................................................... 48
GPR Anomaly #4..................................................................... 48
Excavation Results Anomaly #4............................................. 48
Anomaly #5..................................................................................... 50
Conductivity and Resistivity Anomaly #5.............................. 50
Magnetometer Anomaly #5..................................................... 51
GPR Anomaly #5..................................................................... 51
Excavation Results Anomaly #5............................................. 51
Summary ........................................................................................ 52
VI. UNDERSTANDING THE GEOPHYSICAL SURVEY RESULTS....... 53
Understanding the GPR, EM, and ER Survey Results................. 54
GPR, EM, and ER Recommendations .................................... 55
Understanding the Magnetic Gradiometer Results...................... 55
Table of Contents—continued
vi
CHAPTER
Magnetic Susceptibility Results From Archaeological Context .................................................................................... 56
Statistical Examination of the Natural and Cultural Soils ......................................................................................... 58
Results of the Statistical Findings ......................................... 60
Magnetic Susceptibility Results From Experimental Archaeology on Naturally Occurring Stone Along the St. Joseph River............................................................................ 60
Results of the Magnetic Gradient Forward Models............... 62
Summary ........................................................................................ 64
VII. SUMMARY AND CONCLUSIONS ...................................................... 66
Addressing the Research Questions .............................................. 67
Future Considerations ................................................................... 68
APPENDICES
A. Ground Penetrating Radar Time Slice Amplitude Maps..................... 73
B. Electromagnetic Induction (Conductivity) Map ................................... 76
C. Magnetic Gradiometry Map.................................................................. 78
D. Electrical Resistivity Map..................................................................... 80
E. Soil Magnetic Susceptibility Data ........................................................ 82
F. Rock Magnetic Susceptibility and Forward Model Data ..................... 85
REFERENCES.................................................................................................. 88

vii
LIST OF TABLES
1. Geophysical Anomalies ............................................................................ 33
2. Statistical Test ......................................................................................... 59

viii
LIST OF FIGURES
1. Fort St. Joseph Archaeological Site 2002 Project Area........................... 17
2. Schematic Cross-section of the St. Joseph River .................................... 18
3. Well Point Drainage System................................................................... 21
4. Ground Penetrating Radar Survey Area................................................. 23
5. Electromagnetic Induction Survey Area ................................................. 24
6. Magnetic Gradiometer Survey Area........................................................ 25
7. Electrical Resistivity Survey Area........................................................... 28
8. Field Magnetic Susceptibility Survey...................................................... 29
9. Anomaly #1 Geophysical Results............................................................. 35
10. Creamware Recovered From Feature 7 (Anomaly #1)............................ 37
11. Magnetic Profile of Feature 7 (Anomaly #1) ........................................... 38
12. Anomaly #2 Geophysical Results............................................................. 40
13. GPR Profile at Anomaly #2...................................................................... 41
14. Creamware Recovered From Feature 6 (Anomaly #2)............................ 43
15. Anomaly #3 Geophysical Results............................................................. 44
16. Bone Artifact ............................................................................................ 46
17. Anomaly #4 Geophysical Results............................................................. 47
18. Anomaly #5 Geophysical Results............................................................. 50
19. Magnetic Susceptibility X-Y Plot............................................................. 57
20. Magnetic Susceptibility of Naturally Occurring Rocks From the St. Joseph River Valley.................................................................................. 61

List of Figures—continued
ix ix
21. Forward Model of a +2nT/m Magnetic Anomaly at Fort St. Joseph ...... 63
22. Two Possible Structures Discovered with Magnetic Gradiometry ......... 69
23. Over Water Magnetometer Survey.......................................................... 70
24. Fort Michilimackinac Outline Overlaid on Fort St. Joseph Project Area .......................................................................................................... 72

1
CHAPTER I
PROJECT BACKGROUND
Geophysical methods applied to archaeological problems are increasingly
being recognized as a valuable tool for characterizing subsurface cultural
deposits prior to excavation (Johnson 2006). Archaeological geophysics
encompasses an assortment of noninvasive methods for the analysis and
delineation of subsurface archaeological deposits. The noninvasive nature of
geophysical methods is attractive to the modern archaeologist, tasked with
managing the balance between conducting field research and implementing a
site conservation management plan.
The geophysical surveys discussed in this project helped guide
excavations during the 2002 Western Michigan University Archaeological Field
School at the Fort St. Joseph site (20BE23). Prior to initiating this work, some
project goals for the 2002 season were outlined. This study describes how
geophysical methods were used to meet some of those project goals and
subsequently help answer some important questions about the Fort St. Joseph
archaeological site.
Fort St. Joseph Archaeological Project: 2002 Project Goals
During October of 1998, faculty and students from the Western Michigan
University Anthropology Department discovered a deposit of eighteenth century
artifacts and associated animal bones at a location suspected to contain evidence

2
of Fort St. Joseph in Niles, Michigan (Nassaney et al. 2003; Nassaney 1999).
The results of the 1998 survey were promising, but the high ground water table
resulting from a milldam constructed downstream made it impossible to
determine whether or not the cultural deposits had integrity. In 2002, the
Western Michigan University Archaeological Field School returned to the site
under the auspices of the Fort St. Joseph Archaeological Project (FSJAP) in
order to conduct a geophysical survey and continue subsurface investigations.
The research team proceeded with a number of goals in mind. The goals were
to: (1) establish the vertical stratigraphic relationships of the cultural deposits,
(2) recover a larger sample of undisturbed artifacts and biological remains, and
(3) identify in situ subsurface features including in situ architectural remains to
establish site integrity and assist in interpretation (Nassaney et al. 2002-2004:
310).
As the 2002 research goals suggest, the 1998 survey team was uncertain
regarding the integrity of the cultural deposits within the project area. The high
water table prohibited visual inspection and identification of the subsurface
cultural deposits, making it impossible to determine their integrity. Moreover,
local artifact collections and historic photographs suggested that the location of
Fort St. Joseph was laid to the plough and under cultivation during the
nineteenth century (Ballard 1973). Furthermore, the site is closely bound on the
south and east by a twentieth century landfill, complicating the issue of site
integrity. To overcome the problem of the high water table, we employed a
sophisticated well point drainage system (Cremin 2002; Nassaney et al. 2002-
2004). With the drainage system in place, a stratified random subsurface
testing strategy and a multi-instrument geophysical survey were initiated.

3
The Geophysical Problem
When we considered using geophysics to help locate the remains of Fort
St. Joseph, our research questions were twofold. First, can geophysics help the
FSJAP locate in situ subsurface features including architectural remains?
Second, if geophysics could help us, what types of geophysical instruments are
best suited to find archaeological remains at this location? These research
questions are closely allied with the greater FSJAP goals stated above. In order
to test our research questions and meet our project goals we: (1) performed
geophysical surveys with multiple instruments, (2) determined which
geophysical anomalies were likely cultural in origin by examining their
geophysical response characteristics, and (3) tested a series of geophysical
anomalies through archaeological excavation in order to determine if they
represent in situ cultural deposits associated with colonial Fort St. Joseph. At
the beginning of the 2002 field season, we were unsure whether the cultural
remains on the bank of the St. Joseph River had integrity. The research
presented within this study will demonstrate how geophysics assisted in the
identification and evaluation of undisturbed archaeological deposits at Fort St.
Joseph.
Significance of the Research
As described above, the purpose of this work is to employ a geophysical
survey and evaluate its results within the context of the greater FSJAP 2002
project goals. Beyond the context of the project goals, this research has the
potential to inform on the application of geophysics on other French colonial

4
archaeological sites, as well as sites located in wet environments. Moreover,
some of the research on soil and rock magnetic properties will be of interest to
specialists in soil/rock magnetism and archaeological geophysics.
French Colonial Sites
A brief overview of the history of geophysical surveys at French colonial
sites in the Midcontinental United States is provided in Chapter II. This
background research supplies an introduction for individuals considering a
geophysical survey at a French colonial site in the region. Magnetometer
surveys dominate the research at these sites, and the research reported in this
study is no different. Two types of features previously detected with
magnetometry at French colonial sites are stone hearths and cylinder shaped
pits (water wells) (Huggins and Weymouth; von Frese 1978, 1984). These types
of features were also found during our magnetometer survey. Cylinder shaped
pits and fire hearths are excellent targets for magnetometry. Furthermore,
burnt daub (burnt clay chinking) has been reported at some of these sites and
this material is also an excellent target for magnetometry.
French colonial archaeologists might be interested in learning what types
of archaeological features are detected during geophysical surveys at these types
of sites. The literature review in Chapter II demonstrates that stone hearths,
water wells, and burnt daub architectural elements have been detected with
magnetometry at French colonial sites in the past and the findings reported here
in Chapter V are similar.

5
Wet Environments
Wet environments can significantly interfere with some geophysical
methods. Electrical resistivity (ER) and electromagnetic methods such as
electromagnetic induction (EM) and ground penetrating radar (GPR) are
hindered by the electrical properties of water. The high conductivity of water
and water-saturated soils can ‘mask’ underlying archaeological deposits from the
ER and EM methods. Moreover, water saturation of the soil tends to flatten out
the geophysical results and lessen the contrast between the archaeological and
natural deposits. With the GPR method, high water content increases the
dielectric permittivity of the soil, limiting the effective depth of investigation.
When the soil is both wet and highly conductive, all three of these geophysical
methods are limited in their ability to detect archaeological deposits.
The site drainage method discussed in this study (Chapter III) will be of
interest to those archaeologists who desire to conduct a geophysical survey at
wet sites. The drainage system facilitated the removal of large quantities of
water from the Fort St. Joseph site, allowing for the use of geophysical methods
that are otherwise not appropriate for use on wet sites.
Soil and Rock Magnetism
The study of soil and rock magnetism is an important element of many
disciplines including humanitarian de-mining, rock geology, environmental
magnetism, geophysics, paleomagnetism, and paleoclimatology among others.
Chapter VI explores the differences between the magnetic properties of the
natural and culturally emplaced soils at Fort St. Joseph. Of particular interest

6
are the relationship between magnetic susceptibility and the frequency
dependence of susceptibility (also known as magnetic viscosity) between the
natural and cultural soils.
The study of soil and rock magnetism is a broad discipline with a wide
variety of applications in many fields. In archaeology, it has long been known
that humans change the magnetic characteristics of the soil, mostly through the
use of fire. In this study, Chapter VI outlines the use of soil and rock magnetism
techniques to discriminate culturally emplaced soil from that of natural soil.
These methods, although commonplace in many disciplines, are rarely applied at
North American archaeological studies, especially at historic sites. Hopefully,
the positive results of this study will influence others to attempt similar
research at other historic sites. At the very least, the application and outcome of
these techniques, as reported in Chapter VI, will contribute to the small but
growing list of research into this sub-discipline of archaeological geophysics in
North America.
Organization of this Study
This study begins with a literature review (Chapter II), which provides
an overview of the history of Fort St. Joseph, a brief history of archaeological
geophysics, and a look at previous geophysical work conducted at French
colonial sites in North America. A description of the relatively recent change in
the site geology is covered in Chapter III, including an explanation of the water
drainage methodology we used to dry out this site. Chapter IV describes the
field and laboratory methods used to collect and process the geophysical data
reported in this study. Select geophysical anomalies and their associated

7
excavation results are presented in Chapter V. Chapter VI follows with
explanations derived from experimental and laboratory results as to why some
geophysical methods worked better at this site than others. The concluding
chapter (Chapter VII) summarizes the results of the study in relation to the
FSJAP goals, and also presents some potential directions for future research.

8
CHAPTER II
LITERATURE REVIEW
A Brief History of Fort St. Joseph
In 1679, the French explorer René-Robert Cavalier de La Salle explored
the St. Joseph River during his travels through the western Great Lakes. The
strategic importance of this area was recognized by the French and by the 1680s,
a group of Jesuits were granted a tract of land near Niles, Michigan. In 1691, a
mission-garrison-trading post was established, which came to be known as Fort
St. Joseph.
The location of the fort was selected because it is near an important
portage linking the St. Joseph River and the Great Lakes basin to the
Mississippi River drainage. This strategic location was one point along the
trade and communication network that connected the French territories in the
western Great Lakes basin to the other French colonies along the Mississippi
River. The establishment of the mission-garrison-trading post at this location
served to intensify the fur trade, solidify relations with the western tribes, and
also served to check the expansion of the Five Nations Iroquois Confederacy
(Brandão 1997; Brandão and Nassaney 2006; Eccles 1972; Meyers and Peyser
1991).
From 1691-1781, Fort St. Joseph served as an important center of
religious, military and commercial activity for Native peoples and European
colonists in southwestern Michigan. During the eighteenth century, the fort

9
ranked fourth among New France’s trading posts in the volume of furs traded
(Harris 1987). Fort St. Joseph had become one of the most important frontier
posts in the western Great Lakes region (Brandão and Nassaney 2006).
Fort St. Joseph also played an important role in the interactions between
Native Americans and their French and English counterparts on the western
frontier. The fort acted as a supply center during the 1720s and 30s for military
contingents in the Fox Wars and also later (1736-40) throughout a campaign
against the Chickasaw nations (Nassaney et al. 2003). With the onset of the
Seven Years War in 1755, the French garrison stationed at the fort was
withdrawn, leaving behind approximately one dozen fur traders and their
families.
Beginning in 1761, after 70 years of French occupation, the British
military began their occupation of the fort, and some English traders joined
them to continue the fur trade with the remaining French traders (Meyers and
Peyser 1991). British rule in the region marked an era of increased tension
between Native Americans and the English. In the spring of 1763, a group loyal
to the powerful Ottawa leader Pontiac attacked the fort. This attack was part of
a conflict historically known as ‘Pontiac’s Rebellion’ and also included attacks on
other forts in the region. The British did not regarrison Fort St. Joseph after
Pontiac’s Rebellion, but an estimated 10-15 households remained and continued
the fur trade.
In 1781, a small group of French and Native Americans, with the support
of the Spanish Governor in St. Louis, raided and occupied the fort for one day.
The fort was not reoccupied after the Spanish-sponsored raid, however traders
remained in the region until eventually becoming part of America’s Northwest

10
Territory during the nineteenth century (Nassaney et al. 2003).
Types of Archaeological Features Expected
Brandão and Nassaney (2006) overview the built environment and
demographics of Fort St. Joseph based upon documentary sources. The
documentary literature suggest that at various times Fort St. Joseph contained
~15 households, a commanders house, a home for a Native leader, a
blacksmith/gunsmith, a stone built jail with iron architectural elements for
security, a storehouse, a barracks for ~20 soldiers, and a ‘post in ground’ type
palisade around either some or all of Fort St. Joseph. The total permanent
population of the fort probably did not exceed 45 people, although the seasonal
population could have been significantly higher during the summer months, a
time of heavy trading activity.
The types of buildings at Fort St. Joseph could have possibly been
poteaux sur sole architecture. This type of architecture is built upon stone
foundations in contrast to post in ground constructions. Furthermore, French
colonial architecture often used clay daub, or bouzillage as a chinking material
(Moogk 1977; Peterson 2001:41-44; Thurman 1984:2; Waselkov 2002:9). One
would also expect to find water wells inside of the palisade because during times
of conflict, access to the water in the river may have been limited. Moreover,
given the cold climate in southwest Michigan during the winter months, one
would expect to find fireplaces or hearths at the site.

11
A Brief History of Archaeological Geophysics
In 1938, Mark Malamphy conducted the first documented archaeological
geophysical survey at Williamsburg VA (Bevan 2000). Malamphy used an
equipotential instrument that was unsuccessful in identifying cultural features
(there were none at the location surveyed), but he did map a naturally occurring
high resistance anomaly. Eight years later, English archaeologist Richard
Atkinson conducted the first electrical resistivity survey of an archaeological site
(Clark 1996:12). Around this time, similar electrical resistivity experiments
were employed in Mexico to locate fossilized human remains (De Terra 1947).
Martin Aitken (1958) was the first archaeologist to experiment with
magnetometry, demonstrating the great potential of this method. In the
Midwestern United States, Glenn Black was the first North American
archaeologist to use the electrical resistivity method (Black and Johnston 1962;
Johnston 1964). In 1958, he conducted a survey with a relative resistivity
instrument at the Angel site, a Mississippian mound center, in Indiana. A few
years later, Black used magnetometry at the Angel site, again becoming the first
archaeologist to employ this method on North American soil (Black and
Johnston 1962, 1967; Johnston 1964). During this period, Richard Ford was
among the first to experiment with resistivity in Michigan at both the Schultz
site and Norton Mound Group (Ford 1964; Ford and Keslin 1969).
These early surveys were time-consuming endeavors, owing to the
relatively slow sampling speed of the instruments. With the advent of faster
instruments and digital recording methods, geophysical applications have been
used by the archaeological community as time saving methodologies that are
capable of pinpointing excavations right on top of archaeological features of
12
interest, lowering the cost of expensive and time consuming subsurface testing
(Linington 1961, Linington 1963, Weymouth 1986, Wynn 1986). Other
arguments used to justify the use of geophysics in archaeology include the non-
invasive nature and repeatability of the techniques (Kvamme 2003; Smekalova
1992).
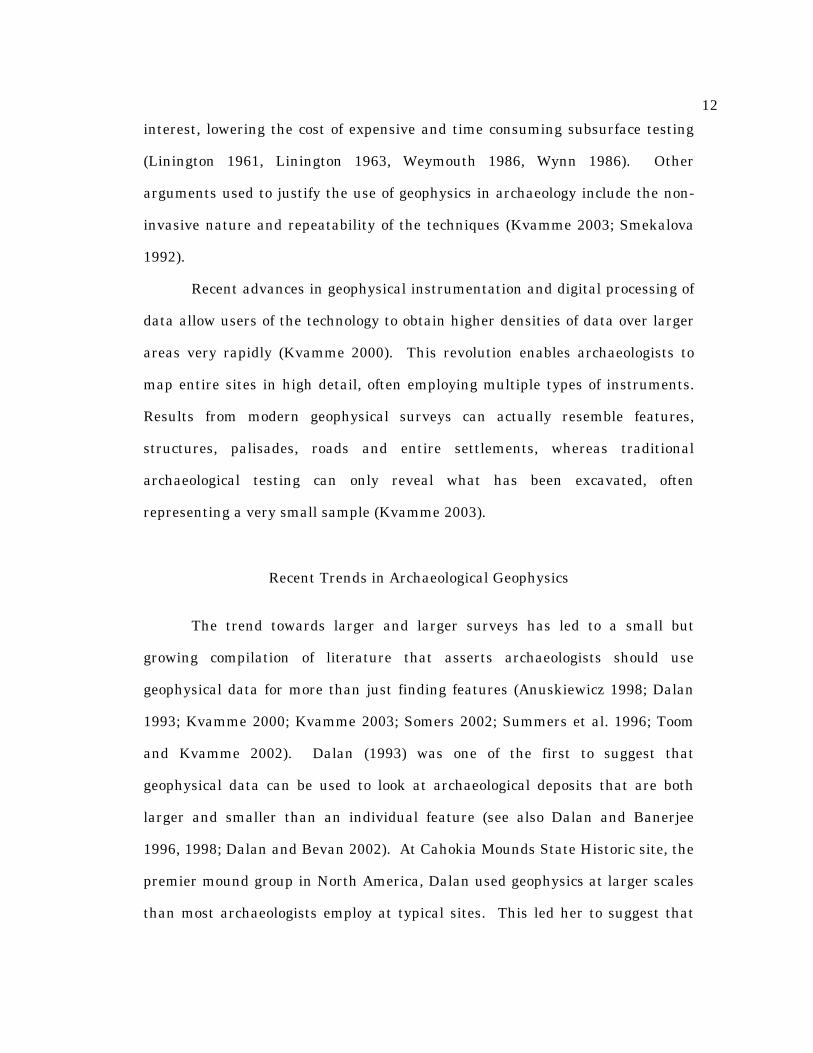
Recent advances in geophysical instrumentation and digital processing of
data allow users of the technology to obtain higher densities of data over larger
areas very rapidly (Kvamme 2000). This revolution enables archaeologists to
map entire sites in high detail, often employing multiple types of instruments.
Results from modern geophysical surveys can actually resemble features,
structures, palisades, roads and entire settlements, whereas traditional
archaeological testing can only reveal what has been excavated, often
representing a very small sample (Kvamme 2003).
Recent Trends in Archaeological Geophysics
The trend towards larger and larger surveys has led to a small but
growing compilation of literature that asserts archaeologists should use
geophysical data for more than just finding features (Anuskiewicz 1998; Dalan
1993; Kvamme 2000; Kvamme 2003; Somers 2002; Summers et al. 1996; Toom
and Kvamme 2002). Dalan (1993) was one of the first to suggest that
geophysical data can be used to look at archaeological deposits that are both
larger and smaller than an individual feature (see also Dalan and Banerjee
1996, 1998; Dalan and Bevan 2002). At Cahokia Mounds State Historic site, the
premier mound group in North America, Dalan used geophysics at larger scales
than most archaeologists employ at typical sites. This led her to suggest that

13
geophysics has broader application such as, “…understanding site or feature
formation processes, geomorphic settings, human impact on the landscape,
community organization, settlement patterns, and many other issues” (Dalan
1993:69). Other researchers have argued that geophysical studies should be
used as “primary” data to formulate questions of archaeological significance
concerning spatial relationships and settlement organization (Kvamme 2003,
Summers et al. 1996, Toom and Kvamme 2002). For example, Toom and
Kvamme (2002) hypothesize that one uncharacteristically large and well-defined
geophysical anomaly, clearly in the shape of a large prehistoric lodge, might
have had different social significance than the smaller structures at the
Whistling Elk Village site (39HU242). This is significant because they are able
to start posing hypotheses about the nature of geophysical anomalies, prior to
the start of archaeological excavations.
Geophysical Prospection at Midcontinental French Colonial Sites
Since the 1970s, there have been numerous high quality geophysical
surveys conducted at French Colonial sites in the Midwest and Great Lakes
region. Underwater archaeologists first used metal detection during 1973 at
Fort Charlotte, MN to recover metal artifacts from wet mucky sediments around
the area of a cedar log crib dock (Wheeler et al. 1975). Excavations and
subsequent plotting of artifact recoveries from around the crib dock provide
excellent spatial information about the informal underwater dumping ground
that had built up (Wheeler et al. 1975:42). Fort Charlotte was later surveyed
with a total field proton magnetometer that readily detected stone “fireplaces”
(Huggins and Weymouth 1979:3).

14
In 1974, a cooperative research team from Purdue University and
Michigan State University initiated magnetometer research at Fort Quiatenon
(12-T-9) on the Wabash River in northwestern Indiana (von Frese 1978, 1984;
von Frese and Noble 1984). The magnetometer survey at Fort Quiatenon
recorded many anomalies that subsequent excavations revealed as
concentrations of burnt daub, large pits, wells, linear anomalies, and iron
artifacts. Other magnetometer surveys near Fort Quiatenon in the Wabash
River valley have documented a contemporary Native American village site (12-
T-6), and a mixed French and Native American settlement called
Kethtippecanunk (Jones 1987; Trubowitz and Jones 1987). At the Notre Dame
University campus, magnetometry was unsuccessful in locating the 17th century
Jesuit mission site of Ste. Marie des Lacs, but successful in locating 19th century
cultural deposits (Schurr 1993).
In Illinois, Missouri, and Kansas, numerous surveys were conducted at
French Colonial sites. Fort de Chartres III was surveyed by magnetometry
(Bevan 1977) and later revisited with electrical resistivity (Melburn 1982). Fort
de Chartres I was successfully investigated with electromagnetics and
magnetometry (Weymouth 1982; Bevan 1983; Weymouth and Woods 1984). Fort
Kaskaskia was investigated by magnetometry with good results (Weymouth
1982; Weymouth and Woods 1984). Across the Mississippi River in Ste.
Genevieve, MO, there have been two magnetometer surveys and one resistivity
survey (Bevan 2002). In Kansas, a proton gradiometer survey pinpointed “the
location of the Catholic Mission to the Miami Indians near Paola, Kansas”,
however the cultural affiliation of the Catholic missionaries are not mentioned
in this news brief (Myers 1979).

15
Surprisingly, there has been very little geophysical work on French
Colonial sites in Michigan. The notable exception was the electrical resistivity
survey conducted immediately outside of Fort Michilimackinac in search of the
18th century village site (Williams and Shapiro 1982). During the late summer
of 1978, Williams and Shapiro employed the double-dipole electrical resistivity
technique and surveyed nearly one acre. Even by today’s standards, this is a
relatively large survey. The survey also employed modern survey strategies and
post processing techniques, including the use of standard sized grids, post-
processing of data on an IBM compatible computer, and computer generated
contour maps. NASA donated the computer program used for the project, and
the computer-generated contour maps were printed out at the University of
Georgia Computer Center. The authors recorded 84 electrical resistivity
anomalies, but at the time of writing their report, none had been tested. The
later English and American sites of Fort Wilkins and Mackinac were also
surveyed with geophysical methods (Grange 1987; Young and Droege 1986).
Summary
In consideration of all previous work on French Colonial sites in the
region, the magnetometer survey conducted at Fort Quiatenon is the most useful
for comparative purposes. Quiatenon is relatively close to Fort St. Joseph and
the two sites are contemporaneous.
At Quiatenon, von Frese (1978, 1984) reported rock, daub, and well-like
features during the testing of his magnetometer survey. Along with these
features, he recorded numerous magnetic anomalies, likely from iron objects, a
seemingly ubiquitous material on historic sites.
16
Since Fort St. Joseph and Fort Quiantenon are culturally and temporally
related, and geographically close, one should not be surprised if these two sites
had similar material remains. The documentary research performed by
Brandão and Nassaney (2006) suggest that Fort St. Joseph might indeed contain
material remains that are very similar to what was found at Fort Quiatenon,
including stone building materials, iron objects, and daub.

17
CHAPTER III
SITE GEOLOGY AND DRAINAGE METHODOLOGY
Site Geology
The project area is located in a low-lying, seasonally wet area on the
south side of the St. Joseph River in Niles, Michigan (Figure 1). The project
area is surrounded on the east and south by a 20th century landfill, and bounded
on the north by the St. Joseph River.
= Pu mp
= Well Point Array
= Excavation
= Geophysical Anomaly
= 5 meters
N
St. Joseph River
Cit y Lan d fi ll
Figure 1. Fort St. Joseph Archaeological Site 2002 Project Area. Red excavation units represent geophysical anomaly test locations.
The uppermost 25-30 cm of sediment consist of highly organic alluvium.
This sediment was deposited during the past 60+ years as the result of local

18
hydrology changes. Sometime after 1938, the 1914 French Paper Company dam,
located 375 m downstream, was raised by approximately 60 cm. This 60 cm
increase in dam height raised the ground water table and increased the
frequency of flooding resulting in the recent organic alluvial deposition found at
the site. Soundings of the St. Joseph River were made with the site transit
while the stadia rod was positioned in a small boat powered with an electric
trolling motor (Figure 2).
Figure 2. Schematic Cross-section of the St. Joseph River. Fort St. Joseph archaeological site stratigraphy. I) Organic alluvium; II) 19th-20th-century plowzone; III) 18th-century cultural deposits; IV) Yellow-brown sterile sand. View looking upstream. Vertical scale is exaggerated ten times (Modified after Nassaney et al. 2002-2004: Figure 9).
The organic layer is underlain by a late 19th – early 20th century gray silt
loam plow zone. Locals surface collected artifacts from this plow zone nearly a
century ago, many of which are currently curated in the Fort St. Joseph
Museum located in Niles, Michigan. The buried plow zone yielded hundreds of
18th century artifacts, and thousands of faunal remains during the 2002 field

19
season (Becker and Martin 2002; Giordano and Nassaney 2002).
Immediately below the old plow zone are undisturbed cultural deposits
associated with the 18th century occupation of the site. The soil matrix in this
stratum varies across the site from yellow brown silty sand “B horizon” soils to
heavily mottled, gleyed silty-loams. All of the intact cultural features discovered
during the 2002 field season originate from within this stratum.
Below the B horizon soils are sterile yellow brown sands. These sands
extend down to from ~2 meters to ~ 8 meters below the ground surface. Below
the yellow brown sterile sand is a layer of silty clay that extends to a depth of at
least 10 meters (Stevens 2000).
Drainage Methodology
When the 2002 Western Michigan University Archaeological Field School
entered the field on May 13, the St. Joseph River was in flood stage. At this
time the site was covered by nearly one meter of water. One week later the site
remained covered by 10-15 cm of water. We could not begin site drainage until
the river’s water had receded back within its banks. This occurred during the
last week of May, so we dispatched a crew of able-bodied students to start
clearing the site of brush, deadfall trees and sixty years of flotsam. The yearly
flooding had washed in flotsam in the form of both metallic and non-metallic
trash, as well as organic materials. There were numerous large deadfall trees
and tree limbs that had to be removed. Other small live trees and brush were
cut down flush with the ground surface so that the GPR antenna could remain
coupled with the ground during survey. Fine grooming of the site was
performed with iron rakes to further remove smaller organic and historic debris

20
prior to setting up the site grid.
On May 31, DeWind Dewatering of Zeeland, Michigan arrived and
installed 65 well points connected (in series) to a single large diesel pump
located on top of the landfill just downstream (east) of the site (Figures 1, 3).
The well point drainage array encompassed an area of approximately 2,200
square meters (Nassaney et al. 2002-2004). The array was arranged in a
horseshoe shape with the open end facing downstream. The on-site components
of the drainage array consisted of ‘geophysical friendly’ materials including: PVC
well points, PVC pipe main line, flexible plastic tubing, and rubber elbows. The
large diesel engine (pump) was located off site so as not to interfere with the
magnetic gradiometer results.
Summary
When we started the 2002 archaeological field season, Fort St. Joseph
was under nearly one meter of floodwater. Once the water receded the banks of
the St. Joseph River, we were able to employ a sophisticated well point array to
further remove standing water and rapidly dry out the site. With the site
drained of standing water, we were able to clear the site of debris, layout a
survey grid, and perform a geophysical survey of the project area. Without the
well point drainage system, none of this research would have been possible
during the 2002 field season.

21
Figure 3. Well Point Drainage System. Installation of the well point site drainage system by DeWind Dewatering of Zeeland, Michigan (Photo courtesy of M. Nassaney).

22
CHAPTER IV
GEOPHYSICAL SURVEY METHODOLOGY
On June 5th, 2002, Professor William Sauck and the WMU Field
Geophysics Class (GL 564) arrived at the project area to conduct the geophysical
surveys. Four geophysical methods were employed in the field including ground
penetrating radar (GPR), electromagnetic induction (EM), electrical resistivity
(ER), and magnetic gradiometry (magnetometer). In addition to the field
geophysics, numerous soil samples were collected and brought back to the lab for
magnetic susceptibility studies (MS). After excavations were completed, we
extended the magnetometer survey to cover an area of 2800 square meters to
further delineate and determine if any submerged portions of Fort St. Joseph
could be detected beneath the St. Joseph River.
Because floodwaters kept us off the site for nearly three weeks, the
geophysical survey had to be conducted at the same time as on going
excavations. Stratified random excavations, based upon artifact densities
recovered during the 1998 shovel test pit survey, were place along the riverbank
along the north edge of the drainage array. We roped off a 475 square meter
geophysical grid immediately south of the test excavations. Students
participating in the test excavations were instructed to keep all metal tools and
objects as far away from the geophysical grid as possible. On more than one
occasion, the field school students were asked to step away from their
excavations while the geophysical survey came into close proximity.

23
Ground Penetrating Radar (GPR) Methodology
The GPR survey encompassed an area of 430 square meters collected as
64 transects of a combined 780 linear meters (Figure 4, Appendix A). The GPR
data were acquired with a Geophysical Survey Systems Inc. SIR-10A+ digital
radar control unit with a bistatic 500 MHz antenna (model 3102A).
N
= P ump
= Well Point Array
= Survey Area
= 5 meters
St. Joseph River
Cit y Lan d fi ll
Figure 4. Ground Penetrating Radar Survey Area. The area (430 sq/m) covered by the ground penetrating radar survey.
All data files were collected as 16 bit (.dzt) files with a 60ns time window.
The parallel GPR profiles were located 0.5 meters apart with 2 m fiducial
markers located along all transects. The relative dielectric permittivity (εr) was
estimated by the hyperbolic fit method between εr=18-22. The high relative
dielectric permittivity can be attributed to the high water content of the organic
rich soils. Raw data were processed with multiple software packages, including

24
RADAN, GRORADARTM and GPR_PROCESS. Two dimensional radar profiles
were combined to produce 3D time–slice amplitude images of the subsurface,
and displayed in the mapping program SURFER v. 7.0 (Appendix A).
Electromagnetic Induction (Conductivity) Methodology
The electrical conductivity survey encompassed an area of 475 square
meters (Figure 5; Appendix B). Conductivity data were acquired with a Geonics
Limited, Model EM38 DLM-H (40.3 KHz operating frequency).
N
= Pum p
= W e l l Po in t A rray
= Survey Area
= 5 meters
S t. Josep h River
C it y Lan d fi ll
Figure 5. Electromagnetic Induction Survey Area. The area (475 sq/m) covered by the electromagnetic conductivity survey.
A DAP Microflex hand held computer running MS DOS 6.62 operating
system was used as a data logger. Geonics proprietary DAT38pro logging
software was used to record data in the field. The survey occurred over parallel
transects located 0.5 m apart. Readings were taken at 0.5 m stations, with a

25
stack (average) of 10 readings at each station location. Data were compiled in
DAT38 for WINDOWS, and exported to the mapping program SURFER for
display (Appendix B).
Magnetic Gradiometer Methodology
The first magnetometer survey, conducted in June 2002, encompassed an
area of 475 square meters (Figure 6, Appendix C). This first survey was used to
make decisions in the field about the placement of archaeological excavations.
= Survey Area
= Well Point Array
= Pump
N
= 5 meters
St. Joseph River
Ju n e 2002
Ju ly 2002
Winter 2003 (frozen)
St. Joseph R i ver
Cit y Lan d fi ll
Ju n e 2002
Figure 6. Magnetic Gradiometer Survey Area. The area (2300 sq/m) covered by the magnetometer surveys.

26
Magnetometry data were acquired with a Geometrics model 858 Mag
Mapper cesium-vapor gradiometer with sensors spaced at 0.8m. The bottom
sensor was held ~ 0.3m off the ground during survey. Parallel magnetometer
transects were located 0.5 meters apart, with 2 m fiducial markers located along
each line. During this first survey, the survey lines were all traversed heading
from south to north as a ‘one way’ survey. The instrument was programmed to
record ten readings per second. All data was exported to the mapping program
SURFER to create display maps.
The second magnetometer survey, conducted during July 2002, extended
out into the St. Joseph River in an attempt to acquire data over the possible
submerged portions of the site. The second survey increased the area coverage
to 1050 square meters (Figure 6). This survey required wading in nearly chest
high water with the magnetometer held at shoulder height. Long wooden stakes
marked the grid corners, and floatable plastic rope with painted markers
marked out the survey lines. Excluding the chest high water and floating grid
lines, all survey procedures and instrument setup were identical with the first
survey. However, the greater height of the sensors when held above the water
led to smoothing, attenuation, and decreased spatial resolution of sub-bottom
magnetic features.
A third wintertime magnetometer survey extended out over the frozen St.
Joseph River for combined area coverage of 2300 square meters (Figure 6,
Appendix C). We extended the grid out over the ice with a standard builders
level. Grid corners were marked out with spray paint. Because of safety
concerns regarding thin ice, we decided to survey this portion of the grid in a bi-
directional, zigzag pattern. Reducing the amount of walking on potentially thin

27
ice. This introduced a ‘saw tooth’ heading error of about 0.35 m into the data, a
common defect of zigzag surveys. Furthermore, we had to use a loaned
instrument (courtesy of Geometrics) during this portion of the survey that was
not in ideal working condition. The sensors on the rental instrument registered
weak signals and recorded sporadic ‘0’s’. These were easily removed during
post-processing, and since the data rate was 10 readings per second, a few
missing points still allowed for very dense coverage along lines. The instrument
also had a considerable amount of operational ‘noise’, which mapped out as
linear streaks in the final map (Appendix C). Regardless of these instrument
related issues, the data remains useful, with some underwater anomalies
present.
Electrical Resistivity Methodology
The electrical resistivity survey encompassed an area of 300 square
meters (Figure 7, Appendix D). Electrical resistivity data were acquired with an
IRIS SYSCAL R-2 resistivity system set up with a custom built Wenner probe
array (“a” spacing of 0.5m), specifically made for archaeological investigations.
Readings were taken at 0.5 m stations along transect lines separated by
0.5 m. The apparent resistivity (ρa) from the recorded voltage (V) and current (I)
was determined using the formula:
aIV
a πρ 2=
All readings were recorded by hand in the field. Resistivity data were entered
into Microsoft EXCEL and imported into SURFER to create contour maps.

28
N
= P ump
= Well Point Array
= Survey Area
= 5 meters
St . Joseph River
Cit y Lan d fi ll
Figure 7. Electrical Resistivity Survey Area. The area (300 sq/m) covered by the electrical resistivity (Wenner array) survey.
Magnetic Susceptibility Methodology
Field Methods
One hundred ml soil samples were acquired during fieldwork from
selected archaeological test excavations (Appendix E). Soil samples were
assigned standard field accession numbers associated with the arbitrary level
from which they were removed. In some test excavations, the soil samples were
collected at 10 cm arbitrary levels, and in some cases, by natural stratigraphic
units. All soil samples were brought back to the WMU archaeological lab for
further analysis with a Bartington MS2B™ laboratory grade dual frequency
sensor. Furthermore, field measurements were made on 116 random stones and

29
boulders along the St. Joseph River with a Bartington MS2D™ field coil (Figure
8, Appendix F).
The measurement of the magnetic susceptibility on the random sample of
local stones helped us better understand the magnetic properties of local
building materials that would have been available to the occupants of Fort St.
Joseph and will be discussed further in Chapter VI.
Figure 8. Field Magnetic Susceptibility Survey. The author performing a field magnetic susceptibility survey of naturally occurring rocks along the St. Joseph River (Photograph courtesy of B. A. Bilodeau Lynch).
Laboratory Methods
All soil samples were dried at room temperature in open air. The dried
samples were broken up and manually ground with a non-metallic mortar and

30
pestle. Ground samples were visually inspected for the removal of large root
inclusions. To remove smaller root and organic contamination, the samples
were then sieved thru graduated cylinders, with the finest mesh being 0.85 mm
(0.0331”). The soil was then recombined, excluding only those inclusions that
exceeded 2 mm in size. The processed soil samples were then weighed and
stored in 10 ml polyethylene vials for final analysis. Three unique samples of
stone, burnt daub and soil from a 1” diameter core were also processed (see
Appendix E). The stone sample (02-1-174) recovered from Feature 6 was
crushed and stored in a 10 ml sample vial. The second special sample (02-1-172)
was a chunk of fired daub recovered from Feature 7, Zone 2. The last special
sample (02-1-207) was a soil sample recovered from a 1” diameter soil core
recovered in the center of Feature 2, at 10 cm below the 2002 excavations. All
three special samples were processed in a similar manner to the regular soil
samples and stored in 10 ml vials.
Dried, sieved and weighed 10 ml samples were subjected to volumetric
(κ), mass specific (χ), and frequency dependence (χfd%) magnetic susceptibility
measurements (see Appendix E). Magnetic susceptibility measurements were
acquired with a Bartington MS2™ meter attached to the dual frequency
MS2B™ laboratory grade sensor. Mass specific measurements (χ) were acquired
at both high frequency (4.6 kHz) and low frequency (0.46 kHz) in order to
determine the frequency dependence percentage of χfd% (also known as magnetic
viscosity). Bartington’s proprietary software MULTISUS™ corrected for the
instrument drift during each measurement. Results were exported to a PC
compatible spreadsheet for further analysis and graphic display.

31
Summary
A multi-instrument geophysical survey was carried out at Fort St. Joseph
during the 2002 field season. Methods employed include GPR, ER, EM, and
magnetic gradiometry. The area covered by the different geophysical methods
varied. In addition to the field surveys, soil and rock samples were collected and
studied to determine their magnetic susceptibility and magnetic viscosity
characteristics in order to aid in the interpretation of the magnetic gradiometer
survey. Furthermore, a field magnetic susceptibility survey of locally occurring
rocks in the St. Joseph River valley helped us to understand the range of
variability in that parameter.

32
CHAPTER V
GEOPHYSICAL ANOMALY TESTING
During the period May 31 thru June 21 2002, the FSJAP investigated 20
square meters, representing 12 excavation units of various sizes (Figure 1).
Seven excavations units were outside the geophysical grid near the riverbank
where shovel test pits, conducted in 1998, indicated high artifact densities. To
identify in situ subsurface features, including in situ architectural remains
within the geophysical grid, we tested five geophysical anomalies in five
separate excavations (8 m²) (Table 1). Nominal designations for all test
excavation locations designated their southwestern XY grid coordinates (e.g.,
N27 E14).
Four of the five geophysical guided excavations recovered indisputable
evidence of the Fort St. Joseph occupation (Table 1). We avoided high frequency
magnetic dipole anomalies typical of surface iron artifacts, and opted to test
locations that had a higher probability of being architectural remains and
features represented by monopole and low frequency dipole signatures. In short,
we targeted anomalies that had a high probability of being archaeological
features, and a low probability of being singular artifacts.
Primarily, we used magnetometer data to guide the excavations because
some anomalies resembled archaeological features. Three of the excavations
relied solely on magnetometer data (Anomalies #1, #3, and #4). One excavation
was based upon combined magnetometer, GPR, and electrical resistivity data
(Anomaly #2). The only unsuccessful test excavation depended solely upon GPR
data (Anomaly #5).

33
Unit Type Description Excavation
Results
N27 E14 MAG Anomaly #1. Large +75 nT/m circular,
monopole magnetic anomaly
Feature 7
Possible well
N22 E02
MAG
GPR
ER
Anomaly #2. Magnetic dipole, high
amplitude GPR reflector, high electrical
resistivity
Feature 6
Stone hearth
N25 E08 MAG Anomaly #3. +30 nT/m monopole magnetic
anomaly
Feature 5
Burnt soil
N36 E39 MAG Anomaly #4. +75 nT/m monopole magnetic
anomaly
Culturally
emplaced
stone
N17 E06 GPR Anomaly #5. GPR reflector. Rodent
borrow
Table 1. Geophysical Anomalies. List of the location and findings of the anomalies tested during this study
Anomaly #1 (Feature 7)
Conductivity and Resistivity Anomaly #1 (Feature 7)
Neither the EM nor the ER surveys could detect Anomaly #1 (Figures 9-
A, 9-B). At this location there was a low resistivity / high conductivity
southwest to northeast trend. This trend was resultant from a naturally
occurring swale of low-lying wet organic soil. The moist, organic surface layer

34
‘masked’ Anomaly #1 from detection with the EM and ER instruments.
Magnetometer Anomaly #1 (Feature 7)
Anomaly #1 was most readily identified as a > 3 m diameter, +75 nT/m
monopolar magnetic anomaly (Figure 9-C). This anomaly immediately caught
our attention due to its large size, round shape, high amplitude and low-
frequency smooth contours. Generally, deeply buried objects and features
exhibit smooth contours. Magnetometry was the sole method used in selecting
this anomaly for excavation.
GPR Anomaly #1 (Feature 7)
Anomaly #1 showed up on GPR profiles: File 12, File 13, and File 14. Initial
field observations on the 2D raw data records indicated that this was an area of
interest. Unfortunately, the data was very noisy and did not translate well into
3D time-slice amplitude maps (Figure 9-D). There was however, a ring of high
amplitude (+80 to +120 relative amplitude) apparent in the time slice amplitude
map at this location. GPR results were not used to choose this anomaly for
excavation.

35
0
60
100
125
-50
-10
10
25
50
26
30
34
38
42
N
mS
/mnT
/m
ohm
/mR
elat
ive
Am
plitu
de
(A) 2 meters (B)
(C) (D)
12
16
19
22
excavated
Met
ers
Nor
th
25
27
29
Meters East
14 16 18
(E)(F)
Figure 9. Anomaly #1 Geophysical Results. A) Electromagnetic conductivity; B) Electrical resistivity; C) Magnetic gradiometry; D) GPR time-slice amplitude; E) Excavation location; F) Photograph of Feature 7 (Anomaly #1).

36
Excavation Results Anomaly #1 (Feature 7)
We placed a 1 x 2 meter (east /west orientation) excavation with the
southwest corner at N27 E14 (Figure 9-E). We selected this location so the
south wall of the excavation would cut through the heart of the magnetic
Anomaly #1 and provide a good profile. This location also allowed us to catch
the western edge of the anomaly in plan view. Our initial observations of the
smooth (low frequency) magnetic contour lines of Anomaly #1 indicated that the
source was likely to be deeply buried.
Excavation began by removal of the ~0.35 m organic overburden without
screening. The underlying gray silty loam plow zone was sampled by removing
arbitrary 0.5m x 0.5m x 0.1m soil columns for wet screening with a 3.2 mm
mesh. After numerous complaints of “there is nothing here” by the student
excavators, the source of the magnetic anomaly was finally identified at 0.7 m
below ground surface and designated Feature 7.
Feature 7 consists of two distinct stratigraphic ‘zones’ of cultural
deposits. The uppermost (0.7 m-1.15 m below ground surface) Zone I consist of a
dark, organic layer containing well-preserved faunal remains including antler
and bone. This zone also contained diagnostic ceramics including English
creamware (TPQ 1762) from 80-90 cm below ground surface (Figure 10). The
general pit-like shape and associated artifacts were consistent with identifying
this zone as a pit midden, temporally related to the later occupation of Fort St.
Joseph (ca. 1762 to abandonment).

37
Figure 10. Creamware Fragment Recovered From Feature 7 (Anomaly #1). These artifacts likely dates from the terminal occupation of Fort St. Joseph (Photo courtesy of B. Giordanao).
The second zone (1.15 m - >1.40 m below ground surface) contrasted
sharply with the first. Zone II was well defined with steep cylindrical walls.
Zone II consisted of mostly thumbnail to fist size chunks of burnt daub,
intermittent with charcoal and faunal remains. Some of the larger pieces of
burnt daub exhibited whitewashed surfaces and log impressions, indicating that
these architectural elements almost certainly originate from French colonial
architecture chinked with bouzillage. Unlike Zone I, Zone II did not contain any
English ceramics, indicating that this earlier deposit was possibly associated
with the French occupation of Fort St. Joseph.
The two zones within this feature were not only different visually and
possibly culturally, but also distinguished by their magnetic properties (Figure
11; Appendix E). Subsequent magnetic susceptibility studies of the daub from
this Zone II indicated that it had the highest levels recorded at Fort St. Joseph.
The high magnetic susceptibility, combined with the deeply buried origin and
cylinder-like shape of Zone II within Feature 7 accounted for the anomaly’s high
amplitude and smooth contours.

38
0
20
40
60
80
100
120
140
0 1 2 3 4 5 6 7 8 9
Frequency Dependence %
Dep
th (c
m)
Org a nicOv e rb urde n
P lo wzo ne
F. 7Zone 1
F. 7Zone 2
200 400 600 800 1000 1200 1400
)( χ lf
) (χ fd
) (χ fd
Mag netic Sus ceptibility10- 8 m 3 kg - 1
)( χ lf
Figure 11. Magnetic Profile of Feature 7 (Anomaly #1). Profile shows a significant increase in the mass specific magnetic susceptibility (χ lf) and frequency dependence % (χ fd) associated with the cultural stratigraphy of Feature 7.
At Fort Quiatenon, a very similar magnetic anomaly turned out to be a
water well (von Frese 1984: Figure 5). The general shape of our Anomaly #1
(Feature 7) and monopole signature was consistent with a vertical cylinder-like
archaeological feature such as a well or deep pit (von Frese 1984: 6). Our
excavations confirmed that this feature was at least a deep, cylinder-like pit, but
it could possibly also be a filled in water well. We never reached the bottom of
this feature, ending excavation at a depth of ~140 cm below ground surface
during the 2002 field season.

39
Anomaly #2 (Feature 6)
Conductivity and Resistivity Anomaly #2 (Feature 6)
Although the EM and ER methods are supposed to give similar results,
only the ER method detected Anomaly #2 (Figures 12-A, 12-B). As with
Anomaly #1, the organic surface layer likely ‘masked’ the underlying anomaly
from detection by the EM-38. Furthermore, the dynamic range on the
conductivity survey is very low, leaving little room for more sophisticated
display options that might resolve the anomaly (Figure 12-A). However, the
Wenner array ER results indicate a southwest to northeast trending, L-shaped,
‘high’ running through the location of our excavation (Figure 12-B). Resistivity
results at Anomaly #2 correlates to a high degree with our excavation results
that revealed a dry laid stone hearth designated Feature 6 (Figure 12-F) (see
Excavation Results below).
Magnetometer Anomaly #2 (Feature 6)
The magnetometer results over Anomaly #2 were definitive. This
anomaly was most readily identified as a +40 nT/m to –20 nT/m pair of magnetic
dipole anomalies. The two dipole anomalies were in close proximity, likely
resulting from two distinct sources (Figure 12-C). The northernmost dipole
anomaly was aligned with the magnetic low to the north and the high to the
south. This type of alignment is typical of an in-situ magnetic object, possibly
something that was burnt in place. The second (southern) dipole was oriented
opposite of the first with its magnetic low oriented towards the southwest. This
type of dipole anomaly is typical of an object containing remnant magnetization

40
(such as stone) that was rotated and displaced from its original orientation. The
close proximity of the two dipole anomalies combined to make what appeared to
be a single pear-shaped anomaly. This magnetic anomaly was chosen for
excavation because it resembled to a high degree both the ER and GPR
anomalies.
0
600
1200
1800
2400
3000
-30
-10
5
15
25
40
14
16
18
20
22
35
45
55
65
2 meters
N
mS
/mnT
/m
Rel
ativ
e A
mpl
itude
ohm
/m
(A) (B)
(C) (D)
exca
vate
d
1 2 3 4
22
23
24
Meters East
Met
ers
Nor
th
(E)1 meter
(F)
Figure 12. Anomaly #2 Geophysical Results. A) Electromagnetic conductivity; B) Electrical resistivity; C) Magnetic gradiometry; D) GPR time-slice amplitude at 21.75-29 ns; E) Excavation location; F) Photograph of dry laid stone hearth (Feature 6).

41
GPR Anomaly #2 (Feature 6)
Anomaly #2 was apparent on three GPR profiles: File 50, File 51, and
File 52 (Figures 12-D, 13). This anomaly consisted of a series of closely spaced,
semi-parabolic and flat reflectors beginning at approximately 17 nanoseconds
(two-way travel time) below ground surface. Because one would not expect to
find a series of closely spaced reflectors on a naturally sorted flood plain, we
considered this a high probability target. Furthermore, the time-slice amplitude
planview map produced from the combined GPR profiles, resembled (to a high
degree) the size and shape of the magnetometer, and also corresponded with the
resistivity anomalies (Figure 12).
22201816 24 26 28 30
M E T E R S N O R T H
Figure 13. GPR Profile at Anomaly #2. This file clearly shows Feature 6 (Anomaly #2). Crosshairs located at the top of the anomaly. Depth calculations of 66 cm on the right are estimates only. The top of this feature was revealed to be 1/2 of that depth (31 cm).

42
Excavation Results Anomaly #2 (Feature 6)
We placed a 1 x 2 meter (north /south orientation) excavation with the
southwest corner at N22 E02 (Figure 12-E, 12-F). The geophysical anomalies
from the different instruments were in slightly different locations (± 0.5 m). We
selected our excavation so it would catch at least part of the magnetic, resistivity
and GPR anomalies. This excavation location was also placed so the southern
portion would contain natural soil and catch the southern end of the anomaly in
planview.
Excavation began by removal of the relatively shallow organic overburden
without screening. The underlying gray silty loam plow zone was sampled by
removing arbitrary 0.5 m x 0.5 m x 0.1 m soil columns for wet screening with a
3.2mm mesh. Immediately below the plow zone (31 cm BD), we uncovered the
very top of numerous large flat stones. Further excavations at this location
revealed that the large flat stones were part of a dry-laid stone hearth
designated Feature 6 (Figure 12-F). Feature 6 contained domestic ceramics,
including painted English creamware (TPQ 1762), from an excavation depth of
between 28-44 cmbd (Figure 14). Feature 6 displayed a very high degree of
similarity to a contemporaneous hearth excavated from House C of the
Southeast Row House at Fort Michilimackinac (Halchin 1985). Stone
hearths/fireplaces were also readily detected with magnetometry at other
French colonial sites including Fort Charlotte, MN (Huggins and Weymouth
1979:3) and Fort Quiatenon, IN (von Frese 1978, 1984).

43
Figure 14. Creamware Fragment Recovered From Feature 6 (Anomaly #2). This artifact likely dates from the terminal occupation of Fort St. Joseph (Photo courtesy of B. Giordanao).
A magnetic susceptibility test on one of the hearth stones indicated that
it had enhanced magnetization, making the stone the likely dominant source of
the southern magnetic dipole anomaly (Figure 12-C, Appendix E: Sample 02-01-
174). Furthermore, the northeast corner of the excavation contained evidence of
intense burning, including fire-reddened soil. Laboratory magnetic
susceptibility measurements demonstrated enhanced susceptibility of these fire-
reddened soils (Appendix E: Sample 02-01-175). The induced magnetization
combined with the enhanced magnetic susceptibility resulting from the in-situ
burning of the hearth soil was the likely cause of the smaller, northernmost
dipole anomaly (Figure 12-C).
Anomaly #3 (Feature 5)
Conductivity and Resistivity Anomaly #3 (Feature 5)
Neither the EM nor the ER methods were able to detect Anomaly #3
(Figures 15-A, 15-B). As with Anomalies #1 and #2, the highly conductive
surface layer likely masked the underlying archaeological deposits at this

44
location.
Magnetometer Anomaly #3 (Feature 5)
Anomaly #3 was most readily identified as a +30 nT/m monopole
magnetic high (Figure 15-C). This was the lowest magnitude magnetic anomaly
that we tested. The anomaly was trivet shaped with its highest magnetic
readings located in its northern most section. We felt that this anomaly could
have represented the eastern edge of a larger structure that was associated with
the stone hearth previously designated Anomaly #2 / Feature 6 (Figure 12).
35
45
55
65
0
600
1200
1800
2400
3000
ohm
/m
Re
lati
ve
A
mp
litu
de
mS
/m
-3 00
-3 0
5
2 5
7 5
3 00
nT/m
0
6
10
14
16
18
20
22
30
N
1 meter
(A) (B) (C)
(D) 8 9 1025
26
27
Meters East
Met
ers
Nor
th
excavated
(E)
Figure 15. Anomaly #3 Geophysical Results. A) Electromagnetic conductivity; B) Electrical resistivity; C) Magnetic gradiometry; D) GPR time-slice amplitude; E) Excavation location.
Excavations of Anomaly #3 were based solely on the magnetometer data (Figure

45
15-C). Excavations at this location revealed a lens of dark, mottled, charcoal-
bearing soil designated Feature 5. This feature was interpreted as possibly
associated with the demolition of a structure at this location.
GPR Anomaly #3 (Feature 5)
The ground penetrating radar method was not able to detect Anomaly #3
(Figure 15-D). It is likely that the high conductivity and high water content of
the overburden at this location attenuated the GPR signal.
Excavation Results Anomaly #3 (Feature 5)
The excavation of Anomaly #3 was based exclusively on the
magnetometer results (Figure 15-C). We placed a 1 x 2 meter (east /west
orientation) excavation with the southwest corner at N25 E08 (Figure 15-E). We
originally laid the southwest corner of this excavation at N25 E08 but a tree
forced us to move this excavation 1 meter South to N25 E08. This caused us to
miss the heart of the highest magnetic readings in the northern section of this
anomaly.
Our excavation at N25 E08 recorded a mottled, charcoal-bearing lens of
soil (~15 cm deep) that also contained some well preserved faunal remains
(Figure 16). We interpreted this lens as the remains of a demolished wall (wall
fall) from a structure and designated it Feature 5. Laboratory measurements of
Feature 5 soil samples exhibited a slight enhancement of magnetic
susceptibility, possibly due to the effects of burning (Appendix E: Sample 02-01-
135). No evidence of in-situ burning (e.g., fire reddened soil) was recorded

46
during excavation but copious amounts of charcoal were noted at this location.
Feature 5 could be part of a larger structure that once housed the stone
hearth designated as Feature 6. The soil lens encompassed the entire 1 x 2
meter excavation unit and we did not encounter its edges. We bisected the soil
lens and took out its southern ½ in order to record the profile. Feature 5 is ~15
cm deep in section and was excavated from a depth of between 45-60 cm BD.
Below Feature 5 were more intact cultural deposits including some well
preserved faunal remains.
Figure 16. Bone Artifact. Well preserved bone implement (function unknown) recovered from Feature 5 (Anomaly #3)
Thin planar or lens-type features will always produce a lesser amplitude
anomaly than cylinder shaped features composed of similar magnetic materials
(Clark 1996: Table 3). It was apparent from our excavations and laboratory
studies of the magnetic properties of the soil that Feature 5 has enhanced
magnetic susceptibility probably due to fire.

47
Anomaly #4
Conductivity and Resistivity Anomaly #4
The EM method was unable to detect Anomaly #4 (Figure 17-A). Like all
of the other anomaly locations tested during this project, the highly conductive
and organic surface layer likely masked any underlying archaeological deposits.
The Wenner array ER survey did not cover this portion of the project area so, it
will not be included in this discussion.
Rel
ativ
eAm
plitu
de
mS
/m
N
1 meter
(A)(B) (C)
(D)
0
8
14
17
20
25
0
600
1200
1800
2400
3000
-300
-100-30-105
15254075150300
500
Meters East
Met
ers
Nor
th
nT/m
excavated
39 40
36
37
Figure 17. Anomaly #4 Geophysical Results. A) Electromagnetic conductivity; B) Magnetic gradiometry; C) GPR time-slice amplitude; D) Excavation location.

48
Magnetometer Anomaly #4
Anomaly #4 was identified as an oval +75 nT/m monopole magnetic high
(Figure 17-B). The dimensions of the anomaly were approximately 0.75 m
east/west by 0.5 meters north/south. This anomaly was similar to both Anomaly
#1 and Anomaly #3 in that it is a monopole. It had similar amplitude compared
to Anomaly #1 while its amplitude was nearly double that of Anomaly #3. This
type of magnetic anomaly could be typical of basin shaped pit or cylinder shaped
archaeological features. We chose to excavate this anomaly based exclusively
upon the magnetic data.
GPR Anomaly #4
The ground penetrating radar method was not able to detect Anomaly #4
(Figure 17-C). It is likely that the high conductivity and high water content of
the overburden at this location attenuated the GPR signal. This location was
very close to a small drainage stream and the ground water table was high here
resulting in poor penetration of the GPR signal.
Excavation Results Anomaly #4
The excavation of Anomaly #4 was based exclusively on the
magnetometer results (Figure 17-B). We placed a 1 x 1 m excavation with the
southwest corner at N36 E39 (Figure 17-D). We began excavation by removing
the ~0.25 meter organic overburden without screening. The underlying gray
silty loam plow zone was sampled by removing arbitrary 0.5 m x 0.5 m x 0.1 m
soil columns for wet screening with a 3.2 mm mesh. Immediately below the

49
plow zone (~54 cm BD), we uncovered a large, oval stone with dimensions of
approximately 0.4 m x 0.2 m x 0.35 m. The soil surrounding the large oval stone
contained some charcoal and some faunal remains. The large stone rested
directly on another similar stone of equal size.
We did not formally designate the area as an archaeological feature
because it was amorphous and not well defined. However, the soils did contain
colonial period artifacts and the stones were certainly not a natural occurrence
on this well sorted floodplain. Although not formally designated as an
archaeological feature, it is likely that the stones were culturally emplaced.
Furthermore, the surrounding soils were culturally modified, evidenced by the
artifacts, charcoal, faunal remains and enhanced magnetic susceptibility
(Appendix E).
The likely source of this magnetic anomaly was the combination of the
culturally emplaced soils and two large stones that were stacked one on top of
the other. These two stones, in effect, created a cylinder shaped magnetic body
buried within the soil matrix. The monopole anomaly (Figure 17-B) recorded
during this survey was similar to anomalies created by cylinder shaped targets
(Bevan 2006). In the next chapter, it will be demonstrated through experiment
that many naturally occurring stones within the lower St. Joseph River Valley
area were highly magnetic and likely detectable with a magnetometer at the
Fort St. Joseph archaeological site.

50
Anomaly #5
Conductivity and Resistivity Anomaly #5
This location within the project area was located in a low-lying swale that
was ~0.3 m lower than the surrounding site. After draining the site of water
(see Chapter III), this area dried out slower than the rest of the site, and at the
time of the geophysical survey it was still relatively wet. Both the Wenner array
electrical resistivity and electromagnetic conductivity methods were unable to
detect Anomaly #5 (Figures 18-A, 18-B). The conductive and organic surface
layer likely masked any underlying archaeological deposits. It is important to
note that none of the geophysical methods were successful at detecting
archaeological deposits at this location because there were none to be found.
ohm
/m
Re
lati
ve
A
mp
litu
de
mS
/m
N
2 meter
(A) (B)(C)
(D)
excavated
(E)
1 4
1 6
1 8
2 0
2 2
27
29
31
33
35
-30
-10
5
15
25
40
5 6 7 816
17
18nT
/m
Meters East
Met
ers
Nor
th
Figure 18. Anomaly #5 Geophysical Results. A) Electromagnetic conductivity; B) Electrical resistivity; C) Magnetic gradiometry; D) GPR time-slice amplitude; E) Excavation location.

51
Magnetometer Anomaly #5
The magnetometer survey did not record an anomaly at this location
(Figure 18-C).
GPR Anomaly #5
Students from Professor William Sauck’s 2002 Field Geophysics course
(GL 564) created a single time-slice amplitude map (Appendix A) of the GPR
survey area (Figure 4). Interestingly, this map (Figure 18-D, Appendix A)
showed some anomalies that were not apparent on other time-slice amplitude
maps created with a different computer program (Appendix A). We decided to
test a single anomaly based upon the GL 564 class time-slice amplitude map.
Excavation Results Anomaly #5
The excavation of Anomaly #5 was based exclusively on the GPR results
(Figure 18-D). We placed a 1 x 1 m excavation with the southwest corner at N17
E06 (Figure 18-E). We began excavation by removing the ~0.25 meter organic
overburden without screening. The underlying gray silty loam plow zone was
sampled by removing arbitrary 0.5 m x 0.5 m x 0.1 m soil columns for wet
screening with a 3.2 mm mesh. Immediately below the plowzone the silty B-
horizon soils contained the source of Anomaly #5. The anomaly turned out to be
a relatively recent rodent burrow. It is likely that the burrow, with less
compaction and higher air content caused our GPR reflection at this location.
The small air void in the loose fill acted to decrease the relative dielectric
permittivity of the soil, resulting in a strong radar reflection at this location.

52
Summary
In order to determine if geophysics will help the FSJAP locate in situ
subsurface features including architectural remains, we performed a multiple
instrument survey and tested the results with archaeological excavation. Four
of the five geophysical anomalies excavated contained significant archaeological
deposits, including subsurface features and architectural remains. These
excavation results answer this project’s first research question in the
affirmative: geophysical methods are successful at locating in situ subsurface
features including architectural remains at the Fort St. Joseph archaeological
site. The next chapter will focus on the second research questions: what
instruments are best suited to discover archaeological deposits at Fort St.
Joseph?

53
CHAPTER VI
UNDERSTANDING THE GEOPHYSICAL SURVEY RESULTS
The excavation results described in the previous chapter demonstrated
that geophysical methods were successful in locating archaeological deposits at
Fort St. Joseph. These excavation results confirmed that geophysics can, and
did help the FSJAP locate in situ subsurface features including architectural
remains, contributing to a successful field campaign that met all project goals.
For future considerations and research at the site, the FSJAP must know what
type of geophysical instruments are best suited for work at this site and why.
The magnetometer survey contributed to finding in situ archaeological
deposits in four successful test excavations (Anomalies 1-4). Electrical
resistivity and GPR both contributed to finding archaeological deposits in one
test excavation (Anomaly #2), while electromagnetic conductivity did not
contribute to finding any of the archaeological deposits.
We chose a series of geophysical anomalies for testing, and excavated
those anomalies to determine the potential source. It is clear from the
excavation results that the magnetometer survey was the most successful at
discovering in situ archaeological deposits, including architectural remains, at
Fort St. Joseph. But why was this method successful at finding cultural
deposits while the other methods failed?

54
Understanding the GPR, EM, and ER Survey Results
As described in Chapter I, wet soil conditions can have an adverse effect
upon the GPR, EM, and ER methods. The night before Professor Sauck arrived
with his Field Geophysics class (GL 564) on Wednesday, June 5th, the town of
Niles turned off the diesel pump that powered the well point drainage system
because a neighbor had complained about the noise. Without the aid of the 65
well points doing their duty, the soil began to turn back to its natural saturated
state. The orders had come down from City Hall; our giant diesel pump was to
be shut off every evening after we left the site. The pump had only been running
for an hour and a half by the time the geophysical surveys were underway. This
was hardly enough time to dry out the site adequately.
Torrential rainstorms exacerbated the wet situation on the site during
the entire EM survey and parts of the GPR survey. The rain was so severe at
one point, all of the archaeological students ran for the safety of the school van
and storage trailer while the geophysical students industriously continued at
their work. I remained with the geophysical students and watched them simply
cover the top of my personal Geonics EM38™ with a plastic bag and continued
on with the survey.
The results of the GPR, EM, and ER surveys should be contextualized
with the untimely intervention of City Hall turning off the pump and the
unfortunate timing of the severe rainstorm. Both the GPR and ER methods
were able to detect Anomaly #2 (Feature 6), the shallowest cultural deposit
discovered during the 2002 excavation season. Anomaly #2 only had ~31 cm of
soil over the top of it, and was located on a slight topographic rise relative to its
surroundings so it was drier than other locations.

55
GPR, EM, and ER Recommendations
The relatively poor results from the GPR, EM, and ER methods could
simply be explained by the wet conditions found on the site during the surveys.
If the surveys had been conducted a day earlier, these results might have looked
significantly different. One particular ER anomaly not excavated during the
2002 has potential to be a cultural feature. The anomaly is centered at grid
coordinate N23.75 E7 (Appendix D) and is similar in size and amplitude to
Anomaly #2 (Feature 6). A magnetic anomaly also corresponds near this
location (Appendix C).
Future research might benefit from trying GPR, EM, and ER methods
during the height of the summer dry season, when the river and local water
table are much lower. However, it is apparent that when the soils are wet at
Fort St. Joseph, these methods should be avoided.
Understanding the Magnetic Gradiometer Results
In order for archaeological deposits to be detected with the magnetic
gradiometer, they must posses a significant contrast in their magnetic
properties from the surrounding natural soils. To better understand how these
anomalies contrasted with the surrounding natural soils, we collected soil and
rock samples to perform magnetic susceptibility analysis at the WMU
archaeological laboratory. Our rock sample was however, very small (n=1)
because most of the excavated rocks were very large and left in-situ. We
suspected that the magnetometer was able to detect rocks from archaeological

56
context at Fort St. Joseph, so we conducted a magnetic susceptibility survey of
local rocks from the lower St. Joseph River valley (Figure 8). The results of the
rock magnetic susceptibility survey were imported into POTENT™ v.4.07, a
computer ‘forward model’ application, to determine how these rocks will respond
to a magnetic gradiometer survey under similar conditions to those encountered
at Fort St. Joseph (Geophysical Software Solutions 2003).
Magnetic Susceptibility Results From Archaeological Context
We collected 48 soil samples, 1 daub sample, and 1 rock sample from our
excavations (Appendix E). The soil samples separated into two broad categories,
natural and cultural. The natural soils were collected from the plowzone (Group
B”) and the organic overburden (Group B’) at the site. These samples were used
to establish the natural background levels of magnetic susceptibility at the site.
The remaining soil samples were collected from culturally emplaced soils such
as pits, fireplaces, hearths or other cultural stratigraphy (Group A).
The soil samples were subjected to both low and high frequency mass
specific magnetic susceptibility test (χ) (see Chapter IV). The difference between
the two readings is known as the frequency dependence % of χ (χfd), or commonly
as ‘magnetic viscosity’, and was determined with the following formula:
= (χ lf hfχ )-χ lf
χfd% 100
When these results are plotted as an x-y plot, the cultural soils (Group A) are

57
well discriminated from the natural soils (Group B’ and Group B”) (Figure 19).
Naturally occurring soils derived from weathered bedrock tend to have
larger and more stable multi-domain magnetic grains than culturally emplaced
soils do (Clark 1996:103). When the natural soils are measured for magnetic
susceptibility at different frequencies (high and low), they will have a low χfd.
The difference between the low and high frequency readings will be minimum.
Higher χfd results from ultra-fine (<0.03 µm) magnetic particles in the soil
referred to as superparamagnetic (SP) ferromagnetic minerals (Dearing
1999:46).
Figure 19. Magnetic Susceptibility X-Y Plot. Frequency dependence of magnetic susceptibility vs. magnetic susceptibility demonstrates good discrimination between the cultural (Group A) and natural (Group B) soils.
The measured apparent magnetic susceptibility of these SP minerals falls off

58
sharply at higher frequencies due to their unstable nature and the effects of
magnetic viscosity. The end result is a lower measurement of the apparent
magnetic susceptibility at higher frequencies (χhf) than that recorded at a lower
frequency (χlf).
Soils can develop SP minerals from the effects of burning, pedogenic
processes, and bacterial activity (Dearing 1999: 44). Culturally emplaced soils
often develop a higher percentage of SP minerals (and associated χfd), primarily
due to burning resulting from the ubiquitous presence of fires at archaeological
sites. The oxygen reducing and subsequent oxidizing effects of fire converts a
small percentage of weakly magnetic iron oxides into the strongly magnetic
maghemite (Le Borgne 1955, 1960).
Statistical Examination of the Natural and Cultural Soils
The soil samples plotted in Figure 19 demonstrate good discrimination
between the cultural Group A, and the natural Group B. But is the
discrimination between these soils, as represented in the X-Y plot (Figure 19)
statistically significant? To answer this question, firstly the Group B soils were
divided into two subgroups, Organic (Group B’) and Plowzone (Group B”). The
Group B soils from Fort St. Joseph came from two primary soil strata, the
organic overburden and the buried plowzone. The cultural soils primarily came
from feature context.
Before I could run an ANOVA test on these thee soils types, I first had to
determine if the organic overburden (Group B’) and plowzone (Group B”) were
statistically different from each other. Using a Student’s t-test, the two types of
natural soils (Group B’ and Group B”) demonstrate that there is not a statistical

59
difference between the magnetic properties of these soil types (Table 1: Test 1,
2). Although a plowzone is ‘culturally modified’ by definition, it is included in
the natural grouping because it is a stratigraphic layer that covers the entire
site and not a discrete depositional deposit like an archaeological feature.
Knowing that there is no statistical difference between the Group B soils
was an important step, because now both Groups B’ and B” can be combined into
a single Group B. After determining that Group B soils had no significant intra-
group variation, a Student’s t-test with Group B versus the cultural Group A
soils could be conducted (Table 1: Test 3, 4). Equally important, I can separate
the Group B soils back into B’ and B” and run an ANOVA between the three soil
types and be confident that a “null rejected” outcome is due to the difference
between the natural and cultural soils and not due to any intra-group variance
found in the Group B soils (Table 1: Test 5,6,7).
Table 2. Statistical Test. Various combinations of test demonstrate a highly significant statistical difference in the magnetic properties between the cultural (Group A) and natural (Group B) soils at Fort St. Joseph. All test performed at 95% confidence intervals.
In contrast to the statistical similarities found between the Group B soils,
Test Group A Group B Group B' Group B" Results Notes 1) t-test Organic χfd APZ χfd Null Accepted, p=0.21 No Difference
2) t-test Organic χ APZ χ Null Accepted, p=0.88 No Difference
3) t-test Cultural χfd Natural χfd Null Rejected, p=<. 0001 Highly Significant
4) t-test Cultural χ Natural χ Null Rejected, p=. 0005 Highly Significant
5) ANOVA Cultural χfd Organic χfd APZ χfd Null Rejected, p=<. 0001, F=28.06 Highly Significant
6) ANOVA Cultural χ Organic χ APZ χ Null Rejected, p=. 0024, F=7.271 Significant
7) ANOVA
Cultural SUM of χ + χfd
Organic SUM of χ + χfd
APZ SUM of χ + χfd
Null Rejected, p=. 0018, F=7.672 Highly Significant

60
the entire range of statistical tests performed between Group A and Group B
soils demonstrate either a ‘highly significant’ or ‘significant’ statistical difference
between the magnetic properties of the cultural and natural soils at the Fort St.
Joseph archeological site (Table 1: Test 3-6).
Results of the Statistical Findings
The results of these findings indicate that the cultural soils can be
statistically discriminated from the natural soils based upon their magnetic
characteristics alone. The primary mechanism for the increased magnetic
properties of the cultural soils is likely due to fire, and many of the cultural soils
exhibit telltale signs of burning activity. This is a significant finding in support
of our geophysical and excavation results that demonstrate magnetic
gradiometry is the best method to discover archaeological deposits including in-
situ architectural remains at the Fort St. Joseph archaeological site.
Magnetic Susceptibility Results From Experimental Archaeology on Naturally Occurring Stone Along the St. Joseph River
Two of the geophysical anomalies (Anomalies 2 & 4) tested during this
study have significant amounts of stone. We performed various magnetic
susceptibility tests on one sample of stone recovered from Anomaly #2 (Feature
6) and discovered that it has enhanced susceptibility (Appendix E: Accession #
02-01-174). Although outside of the scope of this project, other archaeological
features discovered during the 2002 excavations were also made of stone
(Nassaney et al. 2002-2004). The 2002 excavations of magnetic anomalies
proved that stone was used as architectural elements in at least some of the

61
structures at Fort St. Joseph and these stones are potentially detectable with
magnetic methods.
In order to better understand the magnetometer response to the variation
in the magnetic properties of locally available stone, volumetric magnetic
susceptibility (κ) tests were performed on naturally occurring stones (n=116)
along the banks of the St. Joseph River (Figures 8, 20, Appendix F, see also
Chapter IV). The stones sampled in this study came from the area between the
Fort St. Joseph archaeological site and the Lower Buchanan Dam. The results
for 30 stones, spread out across the spectrum of readings, were entered into a
potential field forward modeling computer application called POTENT™
(Geophysical Software Solutions 2003) in order to model how these stones would
appear during a magnetic gradient survey at Fort St. Joseph (Figure 21,
Appendix F).
0
800
1600
2400
3200
4000
0 20 40 60 80 100 120
Rock Sample Number
Vol
ume
Mag
neti
c S
usce
ptib
ilit
y
166
Threshold
κ
Figure 20. Magnetic Susceptibility of Naturally Occurring Rocks From the St. Joseph River Valley. Rock samples are ordered from lowest (left) to highest value (right). Any rock located above the threshold line will create a +2 nT/m or greater magnetic anomaly in the POTENT™ computer simulation.

62
The range of readings recorded during the rock magnetic susceptibility
survey is greater than an order of magnitude larger than that recorded for the
soil samples (Figure 20, Appendix F). The rocks range from slightly negative, or
diamagnetic (κ = -0.5 x 10⁻⁵ SI) to strongly magnetic (κ = 4130 x 10-5 SI). The
average background magnetic susceptibility of the plow zone and organic
overburden at the Fort St. Joseph archaeological site is κ = 66 x 10-5 SI.
For the purpose of the 30 magnetic models, the estimated size of a typical
stone at Fort St. Joseph is 0.3 x 0.3 x 0.6 m and buried at 0.5 m below ground
surface. The magnetic field in southwest Michigan (year 2002) is estimated at
55,717 nT, with an inclination of 70.4 and a declination of –4.3. The remnant
magnetization of the stones is not included in these models because they are not
known. These models are simply made with the recorded κ of our rock samples
buried in the average soil κ at the archaeological site and placed into a magnetic
field similar to that found in southwest Michigan during the summer of 2002.
Results of the Magnetic Gradient Forward Models
The magnetic dipole forward models listed in Appendix F range from a
low of –1.34 nT/m to a high of +84.57 nT/m. The minimum κ that a typical stone
(0.3 x 0.3 x 0.6 m) at Fort St. Joseph needs in order to produce a +2 nT/m dipole
anomaly is κ = 166 x 10-5 SI, an increase of 100 x 10-5 SI over the average soil
readings (Figure 21, Appendix F, Rock #57).
The +2 nT/m level is set as a reasonable ‘threshold’ for detection of stone
at Fort St. Joseph. In reality, the equipment used during the geophysical survey
can detect changes in the earth’s local magnetic field as small as 0.01 nT/m, but
in practice it is unlikely that any archaeologist would ever select an anomaly

63
that small for excavation.
D e p t h ( m )
0.5
Soil Matrix = 66 x 10 -5 SIκ Rock = 166 x 10 -5 S Iκ
0.0
0.2
0.4
TM I (nT )
-1 .6
-0 .0
1.6
3.2
TM I_dz (nT/m )
1
-0 2 4 6P(m )
-0
A z = 0 .0 deg
Figure 21. Forward Model of a +2nT/m Magnetic Anomaly at Fort St. Joseph. Top: Total field simulation. Middle: Gradiometer simulation of a +2 nT/m magnetic anomaly. Bottom: 0.3 x 0.3 x 0.6 m modeled rock (κ = 166 x 10-5 SI) inside of a soil matrix (κ = 66 x 10-5 SI).
The threshold of κ = 166 x 10-5 SI produced a +2 nT/m response in the
forward model. The rock with the highest magnetic susceptibility reading in the
study (Appendix F, Rock #116) produced a +84 nT/m anomaly in the forward
model. If the κ = 166 x 10-5 SI threshold is used, it means that 51% of the stones
(n=60) in the sample can be detected with a magnetic gradiometer at Fort St.
Joseph. If the sample of stone tested for this project is representative of the
local building materials available to the settlers at the time of building the fort,
then roughly 1 out of 2 stones used in building construction can be detected with
magnetic gradiometry. The results of the forward model indicate that
approximately 37% of the stones in this study produce a ≥ +5 nT/m anomaly,

64
27% of the stones produce a ≥ +10 nT/m, while 15% of the stones produce a ≥ +20
nT/m anomaly (Appendix F). These experimental results support our field
observations that some of the stones uncovered during excavations contribute to
the source of the magnetic anomalies.
Summary
At the time of the geophysical survey, the conditions at Fort St. Joseph
were not favorable for the GPR, EM and ER methods. The site was relatively
wet because the site drainage system (65 well points) had been turned off the
night before. Furthermore, heavy rain poured down during the EM and GPR
surveys, adding considerably to the soil moisture content. However, the GPR
and ER methods were able to detect the most shallow of cultural deposits
discovered during the 2002 field season (Feature 6). It is recommended that if
these methods are revisited at Fort St. Joseph, it should be done during the
summer dry season when the water table and river are lowered.
The magnetic gradiometer method is not affected by soil moisture
content. The magnetometer was able to detect cultural deposits, including
intact architectural remains. In order to better understand why the
magnetometer worked so well at this site, soil and rock samples were retained
and their magnetic properties were studied back at the WMU archaeological
laboratory. Statistical analysis of the magnetic properties of the soils, namely
magnetic susceptibility and magnetic viscosity, demonstrated with a high level
of certainty that archaeological soils (features) at Fort St. Joseph are
magnetically different from the natural soils. The magnetic contrast between
the cultural and natural soils allowed the magnetometer to detect the

65
archaeological deposits at Fort St. Joseph. But what about the stone found in
the excavations? Did the stone contribute to the magnetic anomalies recorded at
Fort St. Joseph?
To answer these questions, I had to conduct considerably more research.
Because only one rock sample from archaeological context was retained for
magnetic testing, a field survey of naturally occurring stone in the St. Joseph
River Valley was initiated. The stones (N=116) were analyzed in-situ (see
Figure 8) and volume magnetic susceptibility (κ) was recorded. The magnetic
susceptibility values of these stones were then used to ‘forward model’ a
gradiometer survey in a computer simulation. The results of the forward model
indicate that 51% of the stone could have been detected with the magnetic
gradiometer as ≥ +2 nT/m magnetic anomaly while 27% of the stones produced a
≥ +10 nT/m magnetic anomaly. This is a significant finding considering that
stone hearths and features exist at Fort St. Joseph. Magnetic gradiometry is
probably the best method to find these stone features considering the wet
conditions found at this site.

66
CHAPTER VII
SUMMARY AND CONCLUSIONS
The research described here demonstrates how geophysical techniques
were employed and evaluated in the archaeological search and discovery of
colonial Fort St. Joseph. Principally, two separate but related questions drove
this research project. First, could geophysics help the FSJAP locate in situ
subsurface features including architectural remains? And if geophysics could
help us, what types of geophysical instruments are best suited to find
archaeological remains at this location?
In order to determine if geophysics will help the FSJAP locate in situ
subsurface features including architectural remains, we performed a multiple
instrument survey and tested the results with archaeological excavation. Four
of the five geophysical anomalies excavated contain significant archaeological
deposits, including subsurface features and architectural remains. The
excavation results verify that geophysical methods can contribute and help the
FSJAP meet project goals including: (1) establishing the vertical stratigraphic
relationships of the cultural deposits, (2) recovering a larger sample of
undisturbed artifacts and biological remains, and (3) identifying in situ
subsurface features including in situ architectural remains to establish site
integrity and assist in interpretation (Nassaney et al. 2002-2004: 310)
67
Addressing the Research Questions
In order to answer these research questions, the FSJAP team first
drained the project area of water by employing a sophisticated well point
drainage system (Chapter III). With the drainage system in place, a multi-
instrument geophysical survey was conducted. Excavation of selected
geophysical anomalies followed and the first research question was immediately
answered. Excavations to investigate two anomalies revealed indisputable
evidence of subsurface archaeological features including architectural remains
(Chapter V). Moreover, four of the five geophysical anomalies tested proved to
contain significant cultural deposits.
It is important to note that seven of the twelve excavation units from the
2002 field season were not based on geophysical results. These excavation units
were also very successful in finding intact cultural features at Fort St. Joseph.
The seven excavations were located in areas where previous shovel test pits
(Nassaney 1999) recovered high artifact densities. The geophysical grid was
located just south of the high artifact density area. Because the seven
excavations are based on prior knowledge regarding artifact densities, it is
problematic to attempt to compare and contrast the results of each method
because the geophysical survey was located in an area known to have lower
artifact densities. Therefore, I can state with confidence that both methods were
successful at finding intact cultural deposits at Fort St. Joseph.
The results of the geophysical survey, subsequent excavations, and
laboratory analysis all contributed to answer the second research question: what
types of geophysical instruments are best suited to find archaeological remains
at this location? The research presented in Chapters V and VI demonstrates

68
that magnetic gradiometry is best suited for finding archaeological remains at
Fort St. Joseph, particularly features made of local stone, and burnt soil.
Analysis of the magnetic properties of soil proves with a high degree of
certainty, that the cultural soils are significantly different from the natural soils
at Fort St. Joseph. This contrast in the magnetic properties of the soils is an
essential factor contributing to a successful magnetic gradiometry survey.
Furthermore, magnetic analysis demonstrates that a good percentage of locally
available stone is also highly magnetic. Computer simulations (forward
modeling), placing these stones in the magnetic field and soil conditions at Fort
St. Joseph, reveal that 51% of them could have been detected during our
magnetic gradiometer survey. The 2002 excavations prove that stone was
available and used as a building material by the occupants of Fort St. Joseph.
The results of this project demonstrate that stone is one archaeological material
that can be detected with magnetic gradiometry at Fort St. Joseph.
Future Considerations
Significant additional areas were surveyed with magnetometry after the
2002 field excavations were finished. The survey was extended over a frozen St.
Joseph River in order to determine if any archaeological deposits exist under the
waters of the river. The extension of the survey over the river and the areas not
covered by the original 2002 survey allow FSJAP researchers to recognize some
large-scale patterns that are potentially cultural in origin.
The magnetometer survey distinguished three rectangular outlines,
probably barracks or row houses, on land and underwater. The two rectangular
anomalies on land were tested and found to contain stone fireplaces and hearths

69
(Figure 22, Nassaney et al. 2002-2004: Figures 6,7,8). The hearth and fireplace
are principally constructed with dry laid stone, and contain magnetically
enhanced soil, and given the results of this study, the stone was probably
magnetic as well. Another smaller stone feature (Feature 1) was also detected
with the magnetic gradiometer (Figure 22). The rectangular magnetic outlines,
likely structures (row houses, block houses or barracks), probably once enclosed
these stone features.
I
II
III
IV
Excavated feature.
Conjectural outline of structure.4 meters
A.
B.
+
-
nT/m
Figure 22. Two Possible Structures Discovered with Magnetic Gradiometry. A) Probable row house: I = Feature 6 (Anomaly #2), stone hearth; II = Feature 5 (Anomaly #3), collapsed wall; B) Larger structure: III = Feature 2, stone fireplace; IV = Feature 1, stone rubble. Solid lines excavated, while dotted lines are conjecture. (Modified after Nassaney et al. 2002-2004: Figure 7).

70
Another exciting prospect is that the magnetic gradiometer survey might
have delineated the northwestern edge of Fort St. Joseph (Smart et al. 2005).
The survey into the river (see Figure 23) does not show the many small magnetic
anomalies that the survey over the land does. Of interest is the increased
frequency of magnetic anomalies at and immediately north of the river’s edge (in
the river) that generally follows a westerly trend and then decreases toward the
southwest (Figure 24, Appendix C). The increase in magnetic anomalies along
the river edge may indicate the northwestern edge of the fort.
Figure 23. Over Water Magnetometer Survey. Professor William Sauck wading into the St. Joseph River with the magnetic gradiometer upon his shoulder and the battery pack around his neck during the July 2002 survey. The author is holding a marked rope to help keep the survey grid from floating away (Photograph courtesy of Laura Smart).

71
The third rectangular anomaly (underwater) is located directly north of
the river bank and centered on the grid coordinate N42.5 E7.5, although no
anomalies are located at that particular coordinate (Figures 23, 24, Appendix C).
When we surveyed this particular area in July 2002, the water in the river was
only waist high (Figure 23). This anomaly is approximately 10 x 6 meters in size
and could represent a significant submerged cultural deposit. Could this be the
northern entrance to the fort, or possibly another rowhouse or barracks?
To demonstrate the scale of the possible northwestern edge of the fort, an
outline of Fort Michilimackinac is overlaid on top of the magnetic gradient map
of the project area (Figure 24). Fort St. Joseph is contemporary with Fort
Michilimackinac and both were likely similarly constructed. The Fort
Michilimackinac overlay is oriented with an entrance facing towards the river
that corresponds with the 10 x 6 meter underwater magnetic anomaly.
Interestingly, the underwater anomaly is a similar size to the Michilimackinac
entrance. If the northwestern boundary of the fort has been delineated and if
the dimensions of the two forts are similar, than more than 2/3rds of the fort
may still lie beneath the 20th century landfill located to the south of the river
and current project area.
Further archaeological and geophysical work could help delineate the
boundaries of this site. This work would benefit greatly if it could be conducted
during the summer dry season when the river is low. It would be interesting to
build a small sandbag cofferdam around a portion of the underwater anomaly
while the water level is low, remove the standing water with a simple pump, and
test the location. As the research in Chapter VI suggest, these underwater
anomalies could very well be stone remnants of a former structure associated

72
with Fort St. Joseph. Stone would also make sense on another level, as it is one
material strong enough to resist the erosion caused by the French Paper Co.
Dam. Stone would be easy to recognize archaeologically, even in the mucky silt
that the St. Joseph River has to offer. Hopefully, future research at Fort St.
Joseph will be able to test these hypotheses.
-20 -15 -10 -5 0 5 10 15 20 25 30 35 40 45 50Meters East
5
10
15
20
25
30
35
40
45
50
55
60
65
70
75
80
85
90
Met
ers
Nor
th
nT/m-7000
-200
-20
5
25
75
300
Landf illBoundary
Rive r Edge
Fort Michilimackinac Outline
N
Figure 24. Fort Michilimackinac Outline Overlaid on Fort St. Joseph Project Area. The Fort Michilimackinac outline is scaled and overlaid to the Fort St. Joseph magnetometer map (Modified after Smart et al. 2005).

73
Appendix A
Ground Penetrating Radar Time Slice Amplitude Maps

74
0-7.25 ns
7.25-14.5 ns
14.5-21.75 ns
21.75-29 ns
-5000200400600800100012001400160018002000220024002600280030003200
GPR TIME SLICE AMPLITUDE MAPS
HIGH
LOW
Rela
tive
Am
plitu
de

75
Depath = 0.25 - 0.75 meters

76
Appendix B
Electromagnetic Induction (Conductivity) Map

77
0 2 4 6 8 10 12 14 16 18 20 22 24 26 28 30 32 34 36 38 40
METERS EAST
ELECTROMAGNETIC INDUCTION (CONDUCTIVITY)
10
12
14
16
18
20
22
24
26
28
30
32
34
36
38
40M
ETE
RS
NO
RTH
046810121415161718192021222530
mS/m

78
Appendix C
Magnetic Gradiometry Map

79
nT/m
-7000-3000-1000-500-200-100-50-30-20-10-5051015202530405075100150200300400500700
-20 -15 -10 -5 0 5 10 15 20 25 30 35 40 45 50
Meters East
MAGNETIC GRADIOMETRY
10
15
20
25
30
35
40
45
50
55
60
65
70
75
80
85
90M
eter
s N
orth

80
Appendix D
Electrical Resistivity Map

81
0 2 4 6 8 10 12 14 16 18 20METERS EAST
ELECTRICAL RESISTIVITY (WENNER ARRAY)
10
12
14
16
18
20
22
24
26
28
30M
ETE
RS
NO
RTH
242526272829303132333435404550556065707275
Ohm/m

82
Appendix E
Soil Magnetic Susceptibility Data

83
Sensor Bartington MS2B Range 0.1 Units SI Frequency LF/HF Drift Limit 5 Weight Correction 1 Container weight 4.7 Container volume 10cc Container Correction 1 Container sus SI -0.7 Container sus CGS -0.5573248 --------------------------------------------------------------
Sample / Accession # Strata / Feature # Depth (cm) Weight (g)LF χ
(m³kg -¹ ) x 10-8
HF χ (m³kg -¹ ) x 10-8 Freq. Dep.% χ (SI) x 10-5
N38E20, 02-1-* organic Organic 0-30 11.62 86.2 84.8 1.62 62 02-1-130 APZ 39 16.86 69.8 69.1 1 84 02-1-176 Feature 2, zone VIII 54-64 17.08 64.6 63.9 1.08 80 02-1-177 Feature 2, zone VII 54-64 14 85.4 81.9 4.1 81 02-1-178 Feature 2, mixed zone VII & VII 54-63 15.3 103.4 98.3 4.93 111 02-1-207 Feature 2 62-72 16.25 174.2 162.7 6.6 204
N30E0, 02-1-* organic Organic 0-25 11.51 86.4 84.5 2.2 54
02-1-074 dark lens 55-65 17.51 55.9 55.3 1.07 71 02-1-185 ? 65-75 17.63 74.2 72.6 2.16 96 02-1-121 B horizon 75-82 17.92 39.4 38.8 1.52 52
N27E14, 02-1-* organic Organic 0-30 10.57 51.5 51 0.97 31
02-1-145 B horizon 70-80 15.79 75.7 72.8 3.83 86 02-1-146 Feature 7, zone I 70-80 15.79 195.9 185.4 5.36 224 02-1-166 Feature 7, zone I 80-90 13.91 286.7 268.3 6.42 267 02-1-167 Feature 7, zone I 80-90 15.12 285.2 269.4 5.54 306 02-1-168 Feature 7, zone I 110-115 15.69 147.1 139.4 5.23 162 02-1-172 Feature 7, zone II 115-120 16.08 324.8 304.3 6.31
02-1-172 daub Feature 7, zone II 115-120 15.51 1315.2 1203.6 8.49 1425 02-1-211 Feature 7, zone II 120-130 16.48 190 175.9 7.42 223
N36E39, 02-1-* organic Organic 0-34 10.8 58.2 56.9 2.23 39
02-1-170 APZ 34-44 15.21 70.8 70.4 0.56 80 02-1-186 APZ / B interface? 54-64 17.65 75.9 73.3 3.43 99 02-1-189 Mottled 64-74 17.48 76.9 74.1 3.64 109 02-1-191 Mottled / burnt? 64-65 16.58 100.3 96.9 3.39 123 02-1-200 Mottled / B horizon 74-84 17.98 80.9 78.2 3.34 89
N09E07, 02-1-* organic Organic 0-30 13.32 65.7 65.5 0.3 48
02-1-097 APZ 40-50 17.64 78 75.7 2.95 97 02-1-125 Burnt Soil? 60-70 16.64 109.2 104.1 4.67 130 02-1-137 B horizon? 70-80 17.94 95.3 91.3 4.2 117
N22E02, 02-1-* organic Organic 0-25 10.8 72 70.2 2.5 52
02-1-123 APZ 25-35 14.83 55.4 55.1 0.54 59 02-1-134 APZ 35-45 16.66 64.8 64.1 1.08 84
02-1-174 rock Feature 6 35 19.66 216.5 213.5 1.39 315 02-1-149 Feature 6 39 16.85 51.8 51.2 1.16 67 02-1-175 Feature 6 (burnt) 44-54 16.47 107 102.4 4.3 117
N17E06, 02-1-* organic Organic 0-25 10.83 52.3 50.9 2.68 31
02-1-151 APZ 35-45 15.43 53.7 53.3 0.74 61 02-1-157 Mottled/B horizon 50-60 16.6 72.6 70.6 2.75 78
N25E08, 02-1-* organic Organic 0-25 11.3 75.3 73.8 1.99 54
02-1-135 Feature 5 46-51 16.7 96.4 94.9 1.56 106 02-1-165 Feature 5 51-55 16.29 74.2 72 2.96 88

84
Sample / Accession # Strata / Feature # Depth (cm) Weight (g)LF χ
(m³kg -¹ ) x 10-8
HF χ (m³kg -¹ ) x 10-8 Freq. Dep.% χ (SI) x 10-5
N31.5E04, 02-1-131 APZ 40 15.87 78 75.1 3.72 95 02-1-142 APZ 56 17.12 82 81.7 0.37 114 02-1-148 Mottled 60 16.52 176.8 175.1 0.96 248 02-1-162 Mottled 63 17.2 180.7 178.3 1.33 231
N32E04, 02-1-* organic Organic 0-40 12 89.9 88.1 2 59
02-1-075 APZ 40-50 16.2 76.4 74 3.14 87 02-1-090 APZ 50-60 16.7 78.6 77.8 1.02 97

85
Appendix F
Rock Magnetic Susceptibility and Forward Model Data

86
Rock Sample # Volume Magnetic
Susceptibility (κ) Gradient Model Dipole Results
POTENT (+-nT/m)
Rock Sample # Volume Magnetic Susceptibility (κ)
Gradient Model Dipole Results
POTENT (+-nT/m)
1 -0.5 29 16.5
2 -0.5 30 17
3 0 31 17
4 0.5 32 17.5
5 1 33 29.5 +0.10 / -0.76
6 1 34 36.5
7 2 +0.18 / -1.34 35 48
8 4 36 52 +0.03 / -0.30
9 5 +0.17 / -1.28 37 55
10 5 38 63.5
11 5 39 68
12 5 40 73.5
13 5 41 75 +0.19 / -0.03
14 6 42 79
15 6 43 84
16 6.5 44 87.5
17 8 45 91.5 +0.55 / -0.07
18 8 46 106 +0.84 / -0.10
19 8 47 112.5
20 9 48 118
21 10 +0.15 / -1.17 49 123.5
22 10.5 50 124
23 10.5 51 128 +1.30 / -0.17
24 12 52 128
25 15.5 53 154
26 15.5 54 154.5
27 16 +0.14 / -1.05 55 157.5
28 16.5 56 161.5

87
Rock Sample # Volume Magnetic
Susceptibility (κ) Gradient Model Dipole Results
POTENT (+-nT/m)
Rock Sample # Volume Magnetic Susceptibility (κ)
Gradient Model Dipole Results
POTENT (+-nT/m)
57 166 +2.09 / -0.28 87 569.5 +10.56 / -1.38
58 176 88 650.5 +12.23 / -1.60
59 185 89 678
60 190.5 90 683.5
61 193 +2.66 / -0.35 91 712.5
62 194.5 92 715.5
63 195.5 93 784 +15.00 / -1.97
64 212 +3.06 / -0.40 94 793
65 218 95 865.5 +16.75 / -2.20
66 229 96 915
67 237 97 930 +18.01 / -2.37
68 249 98 959.5
69 251.5 +3.89 / -0.51 99 1060 +20.80 / -2.72
70 258.5 100 1101.5
71 270.5 101 1106
72 283 102 1131 +22.29 / -2.92
73 336 103 1460.5 +29.15 / -3.81
74 345 +5.85 / -0.77 104 1564
75 375 105 1760 +35.4 / -4.63
76 389.5 106 1769
77 392 107 2224 +45.07 / -5.90
78 396.5 108 2352
79 420 +7.42 / -0.97 109 2622.5
80 422.5 110 2727
81 455 111 2900.5 +59.11 / -7.72
82 495 112 2920
83 504 +9.18 / -1.20 113 3078.5
84 505.5 114 3442
85 537 115 3705 +75.79 / -9.90
86 543.5 116 4130 +84.57 / -11.03

88
REFERENCES Aitken, M. J.
1958 Magnetic Prospecting. The Water Newton Survey. Archaeometry 1(1):24-29.
Anuskiewicz, R. J.
1998 Technology, Theory, and Analysis: Using Remote Sensing as a Tool for Middle-Range Theory Building in Maritime and Nautical Archaeology. In Maritime Archaeology: A Reader in Substantive and Theoretical Contributions, edited by L. E. Babits, and Hans Van Tilburg, pp. 223-231. Plenum Press, New York.
Ballard, R.
1973 Introduction to the 1973 Hardscrabble Edition. In Old Fort Saint Joseph. Hardscrabble Books, Berrien Springs, Michigan.
Becker, R., and T. J. Martin
2002 A Preliminary Report on Animal Exploitation Patterns at Fort St. Joseph (20BE23). Paper presented at the 48th annual meeting of the Midwest Archaeological Conference, Columbus, OH.
Bevan, B. W.
2006 Understanding Magnetic Maps. Unpublished Technical Report. Geosight, 356 Waddy Drive Weems, Virginia 22576. In possession of author.
1977 Current Research. American Antiquity 42(4):639.
1983 Electromagnetics for Mapping Buried Earth Features. Journal of Field Archaeology 10(1):47-54.
2000 An Early Geophysical Survey at Williamsburg, USA.
Archaeological Prospection 7(1):51-58. 2002 A Listing of Geophysical Surveys in the Americas. Records #304,
#306 & #308, Unpublished Database, 16 October 2002, Geosight, 356 Waddy Drive Weems, Virginia 22576. In possession of author.

89
Black, G. A., and R. B. Johnston 1962 A Test of Magnetometry as an Aid to Archaeology. American
Antiquity 28:199-205. 1967 Angel Site: An Archaeological Historical, and Ethnological Study.
2 vols. Indiana Historical Society, Indianapolis. Brandão, J. A.
1997 "Your Fyre Shall Burn No More:" Iroquois Policy Toward New France and Its Native Allies to 1710. University of Nebraska Press, Lincoln, NE.
Brandão, J. A., and M. S. Nassaney
2006 A Capsule Social and Material History of Fort St. Joseph (1691-1763) and Its Inhabitants. French Colonial History 7:61-75.
Clark, A.
1996 Seeing Beneath the Soil: Prospecting Methods in Archaeology. Routledge, New York.
Cremin, W. M.
2002 Water, Water Everywhere: Methods of Site Dewatering, Wet Screen Recovery, and Preliminary Botanical Findings. Paper presented at the 48th annual meeting of the Midwest Archaeological Conference, Columbus, OH.
Dalan, R. A.
1993 Issues of Scale in Archaeological Research. In Effect of Scale on Archaeological and Geoscientific Perspectives, edited by J. K. Stein and A. R. Linse, pp. 67-78. Special Paper 283. Geological Society of America, Boulder, CO.
Dalan, R. A., and S. K. Banerjee
1996 Soil Magnetism, an Approach for Examining Archaeological Landscapes. Geophysical Research Letters 23(2):185-188.
1998 Solving Archaeological Problems Using Techniques of Soil
Magnetism. Geoarchaeology 13(1):3-36.
Dalan, R. A., and B. W. Bevan 2002 Geophysical Indicators of Culturally Emplaced Soils and
Sediments. Geoarchaeology 17(8):779-810.

90
De Terra, H.
1947 A Preliminary Note on the Discovery of Fossil Man at Tepexpan in the Valley of Mexico. American Antiquity 13:40-44.
Dearing, J.
1999 Environmental Magnetic Susceptibility: Using the Bartington MS2 System. Chi Publishing, Kenilworth, England.
Eccles, W. J. 1972 France in America. Harper and Row, New York. Ford, R. I.
1964 A Preliminary Report of the 1964 Resistivity Survey at the Schultz Site (20SA2). Michigan Archaeologist 10(3):54-58.
Ford, R. I., and R. O. Keslin
1969 A Resistivity Survey at the Norton Mound Group, 20-KT-1, Kent County, Michigan. Michigan Archaeologist 15(3):86-92.
Geophysical Software Solutions
2003 POTENT v.4.07 Users Guide. Geophysical Software Solutions Pty. Ltd., Canberra, Australia.
Giordano, B., and M. S. Nassaney
2002 A Glimpse into the Artifact Inventory from Fort Saint Joseph. Paper presented at the 48th annual meeting of the Midwest Archaeological Conference, Columbus, OH.
Grange, R. T., Jr.
1987 Excavations at Fort Mackinac. Mackinac Island State Park Commission, Mackinac Island, MI.
Harris, R. C. (editor)
1987 The Historical Atlas of Canada, vol. 1, From the Beginning to 1800. University of Toronto Press, Toronto.
Halchin, J. Y.
1985 Excavations at Fort Michilimackinac 1983-1985: House C of the Southeast Row House: The Solomon-Levy-Parant House. Mackinac Island State Park Commission, Mackinac Island, MI:

91
Huggins, R., and J. W. Weymouth
1979 A Magnetic Survey of Fort Charlotte, Grand Portage National Monument. Ms. on file, National Park Service, Midwest Archeological Center, Lincoln, NE.
Johnson, J. K. (editor)
2006 Remote Sensing in Archaeology. An Explicitly North American Perspective. The University of Alabama Press, Tuscaloosa, AL.
Johnston, R. B.
1964 Proton Magnetometry and its Application to Archaeology: An Evaluation at Angel Site. Indiana Historical Society, Prehistory Research Series IV(II).
Jones, J. R., III
1989 Kethtippecanunk, a Mixed 18th- and Early 19th-century Town on the Banks of the Tippecanoe River - Recent Research. Current Research in Indiana Archaeology and Prehistory: 1987. Glenn A. Black Laboratory of Archaeology, Research Reports No. 10.
Kvamme, K. L.
2000 Current Practices in Archaeogeophysics: Magnetics, Resistivity, Conductivity, and Ground-Penetrating Radar. In Earth Sciences and Archaeology, edited by Goldberg P., V. Holliday, and R. Ferring, pp 353-384. Plenum Press, New York.
2003 Geophysical Surveys as Landscape Archaeology. American
Antiquity 68(3):435-457.
Le Borgne, E. 1955 Susceptibilité magnétique anormale du sol superficiel. Annales de
Geophysique 11:399-419. 1960 Influence du fea sur les propriétés magnétiques du sol et du
granite. Annales de Geophysique 16:159-195. Linington, R. E. 1961 Physics and Archaeological Salvage. Archaeology 14:287-289.
1963 The Application of Geophysics to Archaeology. American Scientist 51(1):48-70.

92
Melburn, T. 1982 Current Research. Society of Archaeological Sciences Bulletin 6(1). Moogk, P.
1977 Building a House In New France: An Account of the Perplexities of Client and Craftsman in Early Canada. McClelland and Stewart, Toronto, Canada.
Myers, R. C., and J. L. Peyser
1991 Four Flags Over Fort St. Joseph. Michigan History Magazine 75 (5):11-21
Myers, T. P., editor 1979 Current Research. American Antiquity 44(2):364. Nassaney, M. S., W. Cremin, R. Kurtzweil, and J. A. Brandao
2003 The Search for Fort St. Joseph (1691-1781) in Niles, Michigan. Midcontinental Journal of Archaeology 28(2):1-38.
Nassaney, M. S., W. Cremin, and D. Lynch
2002-2004 The Identification of Colonial Fort St. Joseph, Michigan. Journal of Field Archaeology 29(3 and 4):309-321.
Nassaney, M. S., editor
1999 An Archaeological Reconnaissance Survey to Locate Remains of Fort St. Joseph (20BE23) in Niles, Michigan. Archaeological Report No. 22. Department of Anthropology, Western Michigan University Kalamazoo, MI.
Peterson, C. E.
2001 Colonial St. Louis: Building a Creole Capital. The Patrice Press, Tucson, AZ.
Schurr, M. R.
1993 Exploring the Foundations of Notre Dame: The 1991 Archaeology Fieldschool. Current Research in Indiana Archaeology and Prehistory: 1991. Glenn A. Black Laboratory of Archaeology, Research Reports No. 14, 1993.

93
Smart, L., W. Sauck, and D. Lynch
2005 Progress in the Geophysical Delimitation of Fort St. Joseph, Niles, MI. Paper presented at the 18th Symposium on the Application of Geophysics to Engineering and Environmental Problems (SAGEEP), Atlanta, GA.
Smekalova, T. N.
1992 The Use of Magnetic Prospecting in Archaeology. Ms. on file, Radiophysics Department, St. Petersburg University, St. Petersburg, Russia.
Somers, L. E.
2002 Resistivity Survey In North American Archaeology. Vale of the White Horse, Berkely, CA.
Stevens, J. M.
2000 Dewatering Services, Fort St. Joseph Site, Niles, MI. Letter report dated October 16, 2000. Kelley Dewatering & Construction Co., Wyoming, MI. On file, Department of Anthropology, Western Michigan University, Kalamazoo, MI.
Summers, G. D., M. E. F. Summers, N. Baturayoglu, O. Harmansah, and E. McIntosh
1996 The Kerkenes Dag Survey: An Interim Report. Anatolian Studies 46:201-234.
Thurman, M. D.
1984 Building a House in 18th Century Ste. Genevieve. Pendragon's Press, Ste. Genevieve, MO.
Toom, D. L., and K. L. Kvamme
2002 The "Big House" at Whisling Elk Village (39HU242): Geophysical Findings and Archaeological Truths. Plains Anthropologist 47:5-16.
Trubowitz, N. L., and J. R. I. Jones
1987 Historical Archaeological Research by IUPUI, 1986. Current Research in Indiana Archaeology and Prehistory: 1986. Glenn A. Black Laboratory of Archaeology, Research Reports No. 7.

94
von Frese, R. R. B.
1978 Magnetic Exploration of Historical Midwestern Archaeological Sites as Exemplified by a Survey of Ft. Quiatenon (12-T-9). Unpublished Masters Thesis, Department of Geosciences, Purdue University, West Lafayette, IN.
1984 Archaeomagnetic Anomalies of Midcontinental North American
Archaeological Sites. Historical Archaeology 18(2):4-19.
von Frese, R. R. B., and V. E. Noble 1984 Magnetometry for Archaeological Exploration of Historical Sites.
Historical Archaeology 18(2):38-53.
Waselkov, G. A. 2002 French Colonial Archaeology at Old Mobile: An Introduction.
Historical Archaeology 36(1):3-12 Weymouth, J. W.
1982 Final report on Magnetic Surveys over the sites of Fort Kaskaskia and Fort de Chartres Number I. Submitted to the Illinois Department of Conservation, Springfield IL.
1986 Archaeological Site Surveying Program at the University of
Nebraska. Geophysics 51(3):538-552. Weymouth, J. W., and W. I. Woods
1984 Combined Magnetic and Chemical Surveys of Forts Kaskaskia and de Chartres Number 1, Illinois. Historical Archaeology 18(2):20-37.
Wheeler, R. C., W. A. Kenyon, A. R. Woolworth, and D. A. Birk
1975 Voices From the Rapids: An Underwater Search for Fur Trade Artifacts 1960-73. Minnesota Historical Society, St. Paul, MN.
Williams, M., and G. Shapiro
1982 A Search for the Eighteenth Century Village at Michilimackinac: A Soil Resistivity Survey. Archaeological Completion Report Series, Number 4, Mackinac State Historic Parks, Mackinac Island, MI.
Wynn, J. C.
1986 Review of Geophysical Methods Used in Archaeology. Geoarchaeology 1(3):245-257.

95
Young, C. T. and D. R. Droege
1986 Archaeological Applications of Resistivity and Magnetic Methods at Fort Wilkins State Park, Michigan. Geophysics 51(3):568-575.