Embed Size (px)
Citation preview

Ladak, JASA
A geometrically nonlinear finite-element model of thecat eardrum
Hanif M. Ladaka)
Department of Medical Biophysics, The University of Western Ontario, London,Canada N6A 5C1Department of Electrical & Computer Engineering, The University of Western Ontario, London, Canada N6A 5B9Department of Otolaryngology, The University of Western Ontario, London, Canada N6A 5A5Imaging Research Labs, Robarts Research Institute, London, Canada N6A 5K8
W. Robert J. FunnellDepartments of BioMedical Engineering and Otolaryngology, McGill University, Montréal, Canada H3A 2B4 Willem F. Decraemer and Joris J.J. DirckxLaboratory of BioMedical Physics, University of Antwerp, Antwerpen, Belgium B-2020
Submitted to the Journal of the Acoustical Society of AmericaSeptember 10, 2005
Revised and resubmitted February 22, 2006Accepted February 27, 2006
Added missing reference
Running title: Geometrically nonlinear model of cat eardrum
a) Electronic mail: [email protected]
1

Ladak, JASA
ABSTRACT
Current finite-element (FE) models of the eardrum are limited to low pressures because of the assumption of linearity. Our objective was to investigate the effects of geometric nonlinearity in FE models of the cat eardrum with an approximately immobile malleus for pressures up to ±2.2 kPa, which are within the range of pressures used in clinical tympanometry. Displacements computed with nonlinear models increased less than in proportion to applied pressure, similar to what is seen in measured data. In both simulations and experiments, there is a shift inferiorly in the location of maximum displacement in response to increasingly negative middle-ear pressures. Displacement patterns computed for small pressures and for large positive pressures differed from measured patterns in the position of the maximum pars-tensa displacement. Increasing the thickness of the postero-superior pars tensa in the models shifted the location of the computed maximum toward the measured location. The largest computed pars-tensa strains were mostly less than 2%, implying that a linearized material model is a reasonable approximation. Geometric nonlinearity must be considered when simulating eardrum response to high pressures because purely linear models cannot take into account the effects of changing geometry. At higher pressures, material nonlinearity may become more important.
PACS numbers: 43.64.Ha
2

Ladak, JASA
I. INTRODUCTION
Existing finite-element (FE) models of the eardrum (e.g., Funnell and Decraemer, 1996; Beer et al., 1999; Bornitz et al., 1999; Eiber 1999; Ferris and Prendergast, 2000; Koike et al., 2002; Gan et al., 2004) are limited to low pressure levels because of the simplifying modelling assumption that the relationship between applied pressure and the resulting displacements is linear (i.e., that an increase in pressure results in a proportional increase in displacement). However, modelling the response to high pressures would be useful in understanding the mechanics of impedance tympanometry in which the static pressures that are used are so high that the responses become nonlinear.
As one step toward our goal of developing and evaluating an FE model of the eardrum that is valid for high pressures, we measured the shape and displacement patterns of the cat eardrum in response to static pressures (Ladak et al., 2004) by using phase-shift shadow-moiré topography, a non-contacting optical technique that was originally adapted for measurements on the eardrum by Dirckx et al. (1988). Our experiments involved cyclically pressurizing the middle ear up to ±2.2 kPa after immobilizing the malleus. The immobile-malleus condition allows us to investigate the behaviour of the eardrum in isolation from any possible nonlinearities of the cochlea and middle-ear structures. The immobile-malleus data indicate that the eardrum response itself is nonlinear at the pressures used in the study. In other words, eardrum displacements do not increase in proportion to the applied pressure; specifically, the displacements grow less than in proportion to applied pressure, like that of a stiffening structure.
In order to model the measured data, nonlinearities must be added to current models. Two basic types of nonlinearities must be considered in modelling the eardrum or any other structure: material nonlinearity and geometric nonlinearity. Material nonlinearity manifests itself as a nonlinear relationship between stress and strain. Experimental measurements on the pars tensa indicate that the relationship between stress and strain is indeed nonlinear, with the material becoming stiffer as it undergoes large stretches (Decraemer et al., 1980). For small changes in strain from an equilibrium state, however, materials can often be approximated as linear.
Geometric nonlinearity is related to changes in the shape of the structure while the structure is being loaded. Large displacements can significantly alter the shape and therefore the stiffness of a structure as well as the line of action of applied loads. For small displacements, geometric nonlinearity can be neglected. However, for thin-shell structures such as the eardrum, geometric nonlinearity starts to become important when the displacements are as large as the thickness of the structure (Timoshenko and Woinowsky-Krieger, 1959; Fung, 1965). At the highest pressures in our experimental study (±2.2 kPa), eardrum displacements measured with an immobile malleus are many times larger than the thickness of the pars tensa (Ladak et al., 2004), implying that geometric nonlinearity must be included in eardrum models when simulating the response to such high pressures.
For soft tissues, both geometric and material nonlinearities often occur together. We hypothesize that for our experiments on the eardrum with an immobile malleus and for pressures up to ±2.2 kPa, geometric nonlinearity must be taken into account because the displacements are larger than the thickness of the pars tensa. However, the relative importance of material nonlinearity is not clear. Although the measured displacements are large relative to the thickness of the pars tensa, they are small relative to the overall dimensions of the eardrum, and the resulting strains may also be small. If the strains are indeed small, then linearizing the relationship between stress and strain under these specific experimental conditions may be a reasonable approximation.
3

Ladak, JASA
The objective of this work was to investigate the effects of geometric nonlinearity alone on the behaviour of the eardrum with an immobile malleus measured for pressure levels up to ±2.2 kPa, by incorporating such nonlinearity into our FE models of the cat eardrum and by comparing computed displacements with measured ones. To investigate the eardrum in isolation from the loading effects of the middle-ear structures and cochlea, we confined our simulations to the case of an immobile malleus as in the experimental study.
II. FINITE-ELEMENT MODELS
A. Mesh geometry
The response of the eardrum depends significantly on its shape (Funnell and Laszlo, 1978; Funnell and Decraemer, 1996), which can vary from subject to subject; hence, individualized FE meshes were constructed from resting-shape data measured in our previous experimental study (Ladak et al., 2004); the resting shape is taken to be the shape measured at the beginning of an experiment, with no pressure applied to the eardrum. Meshes were defined for three cats from the previous study (MY1216L, MY1630L, MY0923R) in which experiments were done with an immobile malleus. A sample image of the resting shape for cat MY1612L is shown in Figure 1. The grey levels in the image vary from black (points furthest from reader) to white (points closest to reader). A vertical profile through the pars tensa just inferior to the manubrium is shown to the left of the image, and a horizontal profile through the posterior pars tensa is shown below the image. The locations of the profiles in relation to the original image are shown by the dashed lines. The figure also shows a lateral view of the corresponding eardrum mesh along with vertical and horizontal profiles through the mesh corresponding to the profiles shown through the moiré shape image. The procedure for constructing an FE mesh from a moiré shape image has previously been described in detail (Funnell and Decraemer, 1996). The mesh shown has a nominal resolution of 25 elements/diameter (Funnell, 1983). Each element of the mesh represents an S3R general-purpose shell element of the ABAQUS commercial FE software package (Hibbit, Karlsson & Sorensen Inc., Pawtucket, RI, U.S.A.). This element is accurate for both thin and thick shells. No elements are generated for the manubrium, as it is assumed to be completely immobile along its entire length in order to model our previously reported immobile-malleus data. In some areas, the mesh only appears to overlap the bony part of the ear canal; however, here the eardrum is actually concealed by overhanging bone. In such cases, the location of the periphery of the eardrum was estimated by extrapolation as described by Funnell and Decraemer (1996).
B. Mechanical properties
As in previous simulations (e.g., Funnell and Decraemer, 1996), both the pars tensa and the pars flaccida are assumed to be elastic, that is, the eardrum is assumed to return to its resting shape upon the removal of applied pressure. Because the purpose of this study was to investigate the effects of geometric nonlinearity, the material of the eardrum was assumed here to be linear, as in our previous simulations. That is, the relationship between stress and strain is assumed to be linear. Furthermore, again as in previous reports, the pars tensa and the pars flaccida are assumed to be isotropic and homogeneous. The pars tensa is characterized by a single Young’s modulus or stiffness of 20 MPa, a thickness of 40 µm and a Poisson’s ratio of 0.3; the pars flaccida is assumed to have a Young’s modulus of 1 MPa, a thickness of 80 µm and a Poisson’s ratio of 0.3
4

Ladak, JASA
(Funnell and Decraemer, 1996). The periphery of the eardrum is assumed to be fully clamped to the ear canal, so that
nodes on the boundary of the model do not undergo translation or rotation. The boundary of the manubrium is also assumed to be fully clamped in order to simulate an immobile manubrium.
C. Solution procedure
For each model, static-displacement patterns were computed in response to uniform static middle-ear pressures from 0 to +2.2 kPa in steps of 0.1 kPa and from 0 to –2.2 kPa in steps of −0.1 kPa. The static pressure is applied to the medial (middle-ear) surface of the tympanic membrane, such that positive pressures cause laterally directed motions (into the external ear), while negative pressures produced medially directed motions (into the middle ear).
The FE method results in a system of equations of the form
Ku= f (1)
where K is a global stiffness matrix that is assembled from the known geometry and material properties of each element, f is a vector of applied nodal forces that is assembled from the known applied pressure and geometry, and u is an unknown vector of nodal displacements and rotations that needs to be computed. In linear problems, both K and f are constants and approximated as being independent of u; thus, u can easily be computed as u=K−1 f .
In geometrically nonlinear problems, however, the displacements and rotations are large, and the dependence of K and f on u cannot be ignored: Changes in the shape of the structure as it is being loaded can significantly alter K and f. Because K and f depend on u, simple matrix inversion cannot be used to compute the unknown vector u. Instead, in ABAQUS, an incremental-iterative solution procedure is used to compute u at each pressure step. The nonlinear solution procedure used in this work is well described in the literature (e.g., Bathe, 1982). Basically, each pressure step of size ±0.1 kPa is automatically broken into smaller increments, the sum of which equals the applied step size. Applying the total pressure step in small increments allows displacements to be accurately computed as the pressure is increased to its final level. At the beginning of each increment, an initial stiffness matrix K0 is computed from the current geometry of the mesh and its mechanical properties. Based on this stiffness, a linear solution is computed and the geometry of the mesh is updated. Generally, force equilibrium will not be satisfied within the deformed mesh, and the residual vector defined by r= f −K−1 u will be nonzero. ABAQUS uses Newton’s method to find a deformed configuration that satisfies force equilibrium and results in an approximately zero residual vector. Note that we calculate the solution in steps of 0.1 kPa instead of the larger step sizes used in the experiments (see Section III-A). The smaller step size used with the numerical solution procedure ensures convergence to an equilibrium solution at each step.
III. RESULTS
A. Full-field displacement and strain patterns
Displacement patterns computed at a pressure of +2.2 kPa from FE models for cats MY1216L, MY1630L and MY0923R, are shown by iso-amplitude contours in the left-hand
5

Ladak, JASA
column of Figure 2. In all plots, we present the component of displacement perpendicular to the plane of the tympanic ring. The difference in amplitude between adjacent contours is 25 μm. As a guide, some of the contours are labelled. Simulated eardrum displacements are maximal in the postero-superior portion of the pars tensa, close to the pars flaccida. Patterns for smaller positive pressures are similar to that for a pressure of +2.2 kPa. (The exact variations in displacement as a function of pressure are described in Section III-B.)
For comparison, the right-hand column of Figure 2 shows our previously published displacement patterns measured with the moiré method (Ladak et al., 2004). In those experiments, three cycles of pressure were applied to the middle-ear cavity. Each cycle started from rest (i.e., zero pressure in the cavities) and involved loading the eardrum by applying positive middle-ear pressures in the order 0.1, 0.2, 0.4, 0.7, 1.1, 1.6 and 2.2 kPa, then unloading back to 0 Pa in the reverse order. The eardrum was then loaded by applying negative pressures to the cavities in the same order and unloaded in the reverse order. A moiré measurement is made 5 s after the pressure is adjusted to the new level, and requires approximately 45 s. The figure shows the displacements measured at a pressure of +2.2 kPa during the first cycle; patterns for other positive pressures, including other cycles, are qualitatively similar but with differences in size as described in Section III-B. Some of the iso-amplitude displacement contours appear to end abruptly because the periphery of the eardrum is obscured by overhanging tissue. The measured patterns are not smooth because they contain small systematic errors associated with the moiré apparatus (Ladak et al., 2000). Nevertheless, a notable difference between the two sets of patterns (simulated and measured) is that the maximal pars-tensa displacement in the simulated patterns is located more superiorly than that in the measured data. The sizes of the simulated and experimental maximal pars-tensa displacements also differ. In cat MY1216L, the maximum value based on the simulation is twice as large as the measured value, and for cat MY1630L, the simulation-based value is 1.5 times as large as the measured value. For cat MY0923R, the simulation result is smaller than the measured value. The measured displacement pattern for cat MY0923R exhibits local maxima in both the anterior and the posterior pars tensa.
Figure 3 shows displacement patterns, both simulated and measured, for a pressure of −2.2 kPa. For large negative pressures, the point of maximum pars-tensa displacement in the simulated patterns is shifted inferiorly compared with that for positive pressures. A shift in the inferior direction can also be seen in the experimental data shown in the right-hand column of the same figure; however, the degree of shift is larger in the simulations than in the measured data. In both the simulations and the experiments, the shift in the location of maximum displacement occurs gradually with pressure. This is illustrated in Figure 4 which shows computed displacement patterns for +1.1 kPa, +0.1 kPa, -0.1 kPa and -1.1 kPa for cat MY1216L; the patterns for pressures of +2.2 kPa and -2.2 kPa are shown in Figures 2 and 3, respectively. For negative pressures close to zero (e.g., –0.1 to –0.2 kPa), patterns are similar to those for positive pressures, with the location of maximum displacement occurring in the postero-superior region of the pars tensa. As the eardrum is further loaded toward –2.2 kPa, the location of the maximum moves inferiorly. Trends in the experimental data are consistent with the computed displacement patterns, but artifacts in the measurements make it difficult to discern the shift.
For negative pressures, there are also differences in maximal pars-tensa displacement magnitudes between the simulations and the experimental data. Specifically, for -2.2 kPa, the displacement magnitude in the simulation for cat MY1216L is twice as large as the measured value. For cat MY1630L the simulation result is half the size of the measured value, and for cat MY0923R the simulation gives a result that is about one third the size of the measured value.
The FE models presented here are not truly subject-specific because only the shapes of the models are individualized to match each cat’s eardrum; the thickness and Young’s modulus
6

Ladak, JASA
are not subject-specific because these data were not available. Nevertheless, subject-specific comparisons between simulations and measured data are made because individual eardrum shape significantly affects displacement patterns.
Figure 5 shows the calculated maximum principal nominal strains at the two highest pressures used in this study. The nominal strain is defined as
(2)
where I is the identity matrix, V =FFT and F= ∂ x∂ X is the deformation gradient
tensor which is computed from knowledge of the initial location of a material particle at some 3-dimensional position in space specified by the vector X and its new position x after deformation. The nominal strain is computed with respect to the initial unpressurized state. Maximum principal strains represent the largest possible strains in the tissue. The largest strains in the pars tensa are generally less than 2%. In cats MY1216L and MY1630L, however, strains of 3% to 5% occur in a very small strip along the periphery of the postero-superior pars tensa. Strains in the pars flaccida are generally less than 5% with a few localized areas of higher strain. Although the calculated strains are small, displacements are large because the eardrum has a relatively large diameter and is very thin.
B. Pressure-displacement curves
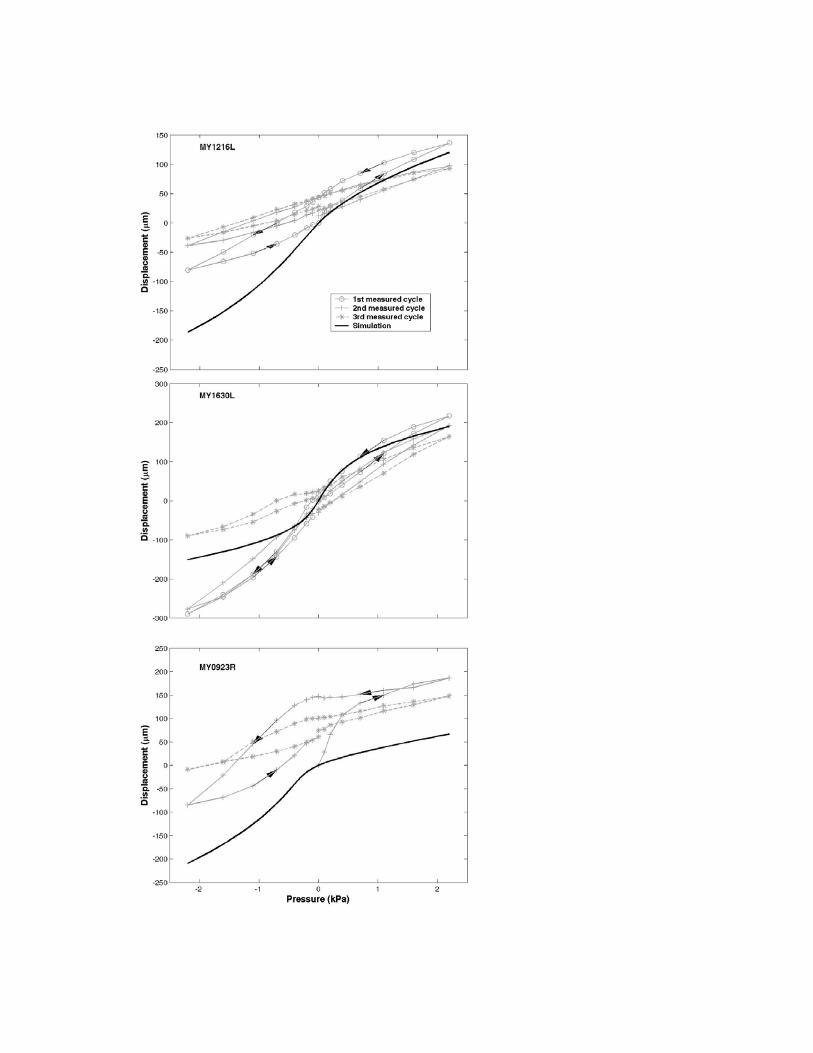
Figure 6 shows pressure-displacement curves for the locations indicated by triangles in the left-hand column of Figure 2. Simulated pressure-displacement curves are shown in black, whereas all cycles of measured data are shown in grey. The measured curves are for the same locations indicated by the triangles in Figure 2. The measured curves vary from one cycle of pressurization to the next and exhibit hysteresis. All three measured cycles are presented for cats MY1216L and MY1630L; however, only the second and third cycles are presented for cat MY0923R. As previously noted (Ladak et al., 2004), for cat MY0923R, the first cycle is considerably different from the second and third cycles. After the first cycle (not shown), the response appears to stabilize. Hysteresis is pronounced in this cat as indicated by the large non-zero displacement from the resting shape when the pressure is increased from 0 kPa to +2.2 kPa and brought back to 0 kPa. There is only one simulated curve in the figure because the material is assumed to be elastic, with no hysteresis. For positive pressures, the simulated pressure-displacement curves agree reasonably well with the measured data. For negative pressures, displacements calculated from the nonlinear model for cat MY1216L are larger in magnitude than measured values. In cats MY1630L and MY0923R, there is substantial variation in measured displacements from one cycle to the next, especially for negative pressures. The variation for negative pressures may be due to mechanical instability (Ladak et al., 2004). In any case, for both cats, simulated displacements fall within the range of measured displacements.
Both simulated and measured displacements grow less than in proportion to the applied pressure. For example, at a pressure of +1.1 kPa, the displacement calculated from the model for cat MY1216L is 73 µm; when the pressure is doubled to +2.2 kPa, however, the displacement does not double but increases by a factor of only 1.6, to 120 µm. Similarly, the measured displacement increases by a factor of 1.6, from 84 µm to 136 µm.
Displacements were also computed from purely linear models. The pressure-displacement curves in these cases are straight lines passing through the origin. Displacements
7
ε N=V − I

Ladak, JASA
calculated from linear and geometrically nonlinear models agree well with each other for low pressure levels. For instance, at a pressure of 0.1 kPa the displacements calculated from linear models are only 5% to 7% larger than those calculated from geometrically nonlinear models. For very high pressures, however, the linear models predict much larger displacement magnitudes than do the geometrically nonlinear models. For instance, when a linear model is used, the displacement magnitude computed for the point indicated by the triangle in Figure 2 for cat MY1216L is twice as large as the value computed when a geometrically nonlinear model is used.
For all cats, the discrepancy between simulated (linear or nonlinear) and measured pressure-displacement curves is greatest for points in the superior portion of the posterior pars tensa. Simulation results here are larger in magnitude than measured values, which is consistent with the observation that for positive pressures the point of maximum pars-tensa displacement is located more superiorly in the simulations.
C. Effect of non-uniformity
The location of the displacement maximum can be shifted inferiorly in the simulations, to better match the measured patterns, by including non-uniformity in the models. Since the mechanical behaviour of the eardrum is sensitive to both its thickness and its Young’s modulus (Funnell and Laszlo, 1978), stiffening the superior region of the posterior pars tensa by increasing either the Young’s modulus or the thickness can potentially shift the location of the maximum inferiorly. To demonstrate this, in the model for cat MY1216L, we arbitrarily increased the thickness of the superior third of the posterior pars tensa from 40 μm to 80 μm. Figure 7 shows displacement patterns computed for pressures of +2.2 kPa and –2.2 kPa. Increasing the thickness in this region has the effect of shifting the pars-tensa maximum inferiorly for positive pressures by decreasing the size of displacements in the postero-superior pars tensa; however, displacements in the inferior region are not significantly altered. Although displacements in the postero-superior region are smaller after the increase in thickness, they remain larger than measured values; no attempt was made to exactly match the simulated and measured displacements by adjusting the thickness of the pars tensa. The location of the maximum for negative pressures does not shift as much and remains in the inferior portion of the pars tensa.
IV. CONCLUSIONS AND DISCUSSION
When geometric nonlinearity is incorporated into FE models, the calculated displacements increase less than in proportion to the applied pressure for high pressures, i.e., those greater than about ±0.1 kPa. Such a lack of proportionality was also observed in the experimental data. By contrast, in linear simulations, computed displacements increase in proportion to the applied pressure because the effects of changing geometry on the stiffness matrix and on the direction of applied pressure are ignored.
For small pressures (both positive and negative) and for large positive pressures, the position of the maximum pars-tensa displacement is located more superiorly for the simulation results than it is for the experimental results if uniform mechanical properties are assumed for the model pars tensa. This difference between experiment and theory is also present in linear models (Funnell & Decraemer, 1996) and is not specific to the present addition of geometric nonlinearity. By including non-uniformity in the models (e.g., by increasing the thickness of the superior portion of the posterior pars tensa), it is possible to shift the location of the maximum in the simulations toward the experimentally observed location. Such a thickness increase is
8

Ladak, JASA
consistent with recent experimental point-by-point thickness measurements (Kuypers et al., 2005). Differences between simulated and measured displacement patterns and magnitudes can also be reduced by varying the Young’s modulus of the pars tensa across its surface. The value used here for the pars-tensa thickness, adopted from our previous models and originally based on a value reported by Lim (1968), is considerably larger than the values found by Kuypers et al. (2005). Any adjustment downward of this model parameter could be counterbalanced by an increase in the value of the Young’s modulus, as done by Fay et al. (2005). The Young’s modulus used here, also adopted from our previous models, was originally based on a value reported by Békésy (1949) for a human-cadaver eardrum. The current work underscores the need for detailed quantitative measurement of eardrum properties across its surface.
The similarity in displacement patterns and magnitudes computed from the nonlinear models for small negative and positive pressures is expected since for small pressures, between 0 and ±0.1 kPa, the behaviour of the nonlinear models is approximately linear, and a linearized model would predict the same displacements (apart from sign) for both positive and negative pressures. At higher negative pressures, the inclusion of geometric nonlinearity in the models accounts for the change in location of the maximum displacement. The same trends are observed in the measurements, where patterns for small negative pressures are found to be similar to patterns for small positive pressures, but the maximum is found to shift inferiorly for higher negative pressures.
As already noted, eardrum displacement magnitudes are significantly affected by the thickness, Young’s modulus and shape of the eardrum (Funnell and Laszlo, 1978), all of which can vary from one subject to the next. Furthermore, as discussed above, displacement patterns are affected by variations in the thickness and Young’s modulus across the surface of an individual eardrum. Although we have taken into account individual eardrum shape in our FE models, we have not taken into account inter- and intra-individual differences in eardrum thickness and Young’s modulus because of the unavailability of such data. The discrepancies between corresponding simulated and measured displacement patterns seen in Figures 2 and 3 presumably arise in part because inter- and intra-individual variations in thickness and Young’s modulus were not taken into account. As discussed below, the degree of malleus fixation may also affect eardrum displacement magnitudes, but to a smaller degree.
Inspecting the left-hand column of Figures 2 and 3 shows that simulated displacement patterns vary between cats. In constructing the models, only the shapes of the models were individualized to the particular cat; the thickness and Young’s modulus were assumed to be the same. Hence, any variations in simulated displacement patterns between individual models arise only from variations in the shapes. Figure 8 shows iso-depth contours for the measured resting shapes of the three cats; the difference in depth between adjacent contours is 0.1 mm. The depth of the eardrum is approximately 1.5 mm for the three cats used in the present study. However, there are subtle local variations in curvature between the eardrums as indicated by local variations in spacing between adjacent iso-depth contours. Simulated displacement magnitudes have previously been shown to be sensitive to both global (Funnell and Laszlo, 1978) and local (Funnell and Decraemer, 1996) variations in curvature. There is noticeable difference in the lengths of the major and minor axes of the tympanic ring. The sensitivity study of Funnell et al. (1993) indicates that expansion or contraction of the tympanic ring does affect displacement magnitude.
In our models, the eardrum was assumed to be isotropic. This simplification is consistent with our previous models of the cat eardrum (e.g., Funnell and Laszlo, 1978; Funnell and Decraemer, 1996). Funnell and Laszlo (1978) found that the inclusion of anisotropy did not change the basic shape of the displacement patterns as compared to an isotropic model, although
9

Ladak, JASA
the maximal pars-tensa displacement did increase. The actual nature and degree of anisotropy in the eardrum are not known.
The present study is limited to the case of an immobile-malleus condition. However, measurements indicate that the lack of proportionality between pressure and eardrum displacements is more pronounced with a normal mobile malleus (Ladak et al., 2004). Under normal conditions, eardrum response would be affected by the mechanical load exerted on it by the rest of the middle ear and cochlea. One source of nonlinearity in middle-ear response may be due to an asymmetry in ossicular displacements at high static pressures caused by slippage in the joints between the malleus and the incus (Cancura, 1980; Hüttenbrink, 1988) and between the incus and the stapes (Hüttenbrink, 1988). Another source of nonlinearity in middle-ear response is thought to be due to the annular ligament connecting the stapes to the cochlea, which limits the displacement of the stapes (Price, 1974; Price and Kalb, 1986). Indeed, Price and Kalb (1991) feel that this is the main source of nonlinearity in middle-ear response at high pressures.
In the simulations, the manubrium is assumed to be completely immobile along its length. This only approximately simulates the experimental condition. In the experiments, an attempt was made to immobilize the malleus by gluing a point on the mallear head to the middle-ear wall. Although this does substantially reduce manubrial displacements relative to the case where the malleus is not fixed in this manner, it does not ensure that all points on the manubrium will be immobile (Ladak et al., 2004). Indeed, the experimental data in Figures 2 and 3 indicate that the manubrium deforms. Specifically, the ratio of umbo displacement after mallear fixation to the displacement without fixation was 21% for MY1216L, 30% for MY1630L and 31% for MY0923R at a pressure of +2.2 kPa during the first cycle (Ladak et al., 2004). The ratio of the displacement of the superior end of the manubrium after fixation to the displacement before fixation was 7% for cat MY1216L, 17% for cat MY1630L and 22% for cat MY0923R (Ladak et al., 2004). As the focus of this study was to investigate the effects of geometric nonlinearity on eardrum displacements, we have for simplicity assumed the manubrium to be immobile along its entire length. Although it would be more realistic to explicitly model the malleus with only its head constrained, any resulting small displacements of the manubrium would probably have only a very small effect on the displacements of the eardrum. For example, Funnell and Laszlo (1978) showed that doubling the ossicular-hinge stiffness in their middle-ear model decreased the maximal pars-tensa displacement by only 11%, with little change in the form of the displacement pattern. The effects in the present case would presumably be even smaller.
Material nonlinearity has been ignored in this work in order to investigate the effects of geometric nonlinearity alone. Uniaxial tension tests by Decraemer et al. (1980) on strips of pars tensa cut out from the eardrum suggest that the relationship between stress and strain is nonlinear for small strains and approximately linear for high strain levels. Data in their paper are presented as graphs of stress versus specimen length instead of stress versus strain since the resting length of the specimen could not be accurately determined in order to compute strain. It is difficult to determine the resting length of eardrum strips as they tend to wrinkle when no stress is applied. A priori it is not clear in which portion of the stress-strain curve (linear or nonlinear) the eardrum is functioning because quantitative experimental data on eardrum pre-stress are not available; existing data based on perforation tests are of a qualitative nature (Békésy, 1949; Kirikae, 1960) and their validity is questionable (Funnell and Laszlo, 1982). In any case, for small variations in strain with pressure, the stress-strain curve may be linearized. The largest pars-tensa strains computed from each of the models are generally less than 2%, which implies that a linearized material model is a reasonable approximation for most of the pars tensa for pressures up to ±2.2
10

Ladak, JASA
kPa, at least under the condition of an approximately immobile malleus. For the pars flaccida, material nonlinearity may be more important since the strain variations are larger.
As our focus was to investigate the effects of including geometric nonlinearity, we have not modelled the hysteresis observed experimentally in the pressure-displacement curves during cyclical loading, which would require the inclusion of viscoelastic effects. This should then permit the quantitative modelling of eardrum behaviour during impedance tympanometry, including the fact that differences in measurement protocols cause pronounced differences in tympanometric results (Osguthorpe and Lam, 1981).
ACKNOWLEDGEMENTS
Funding for this work was provided through an operating grant from the Canadian Institutes of Health Research (WRJF), and through fellowships and grants from the Natural Sciences and Engineering Research Council of Canada (HML) and the Québec-Belgium Exchange Programme (HML). We thank J. Lauzière for editing the manuscript.
11
Ladak, JASA
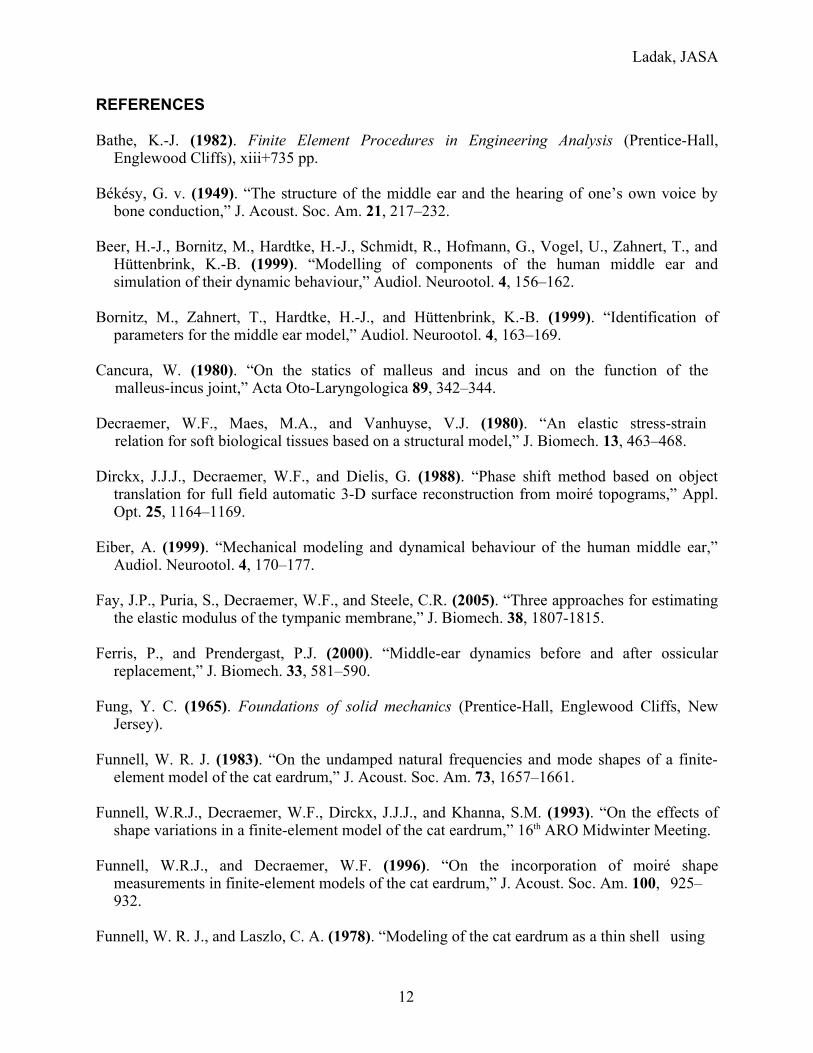
REFERENCES
Bathe, K.-J. (1982). Finite Element Procedures in Engineering Analysis (Prentice-Hall, Englewood Cliffs), xiii+735 pp.
Békésy, G. v. (1949). “The structure of the middle ear and the hearing of one’s own voice by
bone conduction,” J. Acoust. Soc. Am. 21, 217–232.
Beer, H.-J., Bornitz, M., Hardtke, H.-J., Schmidt, R., Hofmann, G., Vogel, U., Zahnert, T., and Hüttenbrink, K.-B. (1999). “Modelling of components of the human middle ear and simulation of their dynamic behaviour,” Audiol. Neurootol. 4, 156–162.
Bornitz, M., Zahnert, T., Hardtke, H.-J., and Hüttenbrink, K.-B. (1999). “Identification of parameters for the middle ear model,” Audiol. Neurootol. 4, 163–169.
Cancura, W. (1980). “On the statics of malleus and incus and on the function of the malleus-incus joint,” Acta Oto-Laryngologica 89, 342–344.
Decraemer, W.F., Maes, M.A., and Vanhuyse, V.J. (1980). “An elastic stress-strain relation for soft biological tissues based on a structural model,” J. Biomech. 13, 463–468.
Dirckx, J.J.J., Decraemer, W.F., and Dielis, G. (1988). “Phase shift method based on object translation for full field automatic 3-D surface reconstruction from moiré topograms,” Appl. Opt. 25, 1164–1169.
Eiber, A. (1999). “Mechanical modeling and dynamical behaviour of the human middle ear,” Audiol. Neurootol. 4, 170–177.
Fay, J.P., Puria, S., Decraemer, W.F., and Steele, C.R. (2005). “Three approaches for estimating the elastic modulus of the tympanic membrane,” J. Biomech. 38, 1807-1815.
Ferris, P., and Prendergast, P.J. (2000). “Middle-ear dynamics before and after ossicular replacement,” J. Biomech. 33, 581–590.
Fung, Y. C. (1965). Foundations of solid mechanics (Prentice-Hall, Englewood Cliffs, New Jersey).
Funnell, W. R. J. (1983). “On the undamped natural frequencies and mode shapes of a finite-element model of the cat eardrum,” J. Acoust. Soc. Am. 73, 1657–1661.
Funnell, W.R.J., Decraemer, W.F., Dirckx, J.J.J., and Khanna, S.M. (1993). “On the effects of shape variations in a finite-element model of the cat eardrum,” 16th ARO Midwinter Meeting.
Funnell, W.R.J., and Decraemer, W.F. (1996). “On the incorporation of moiré shape measurements in finite-element models of the cat eardrum,” J. Acoust. Soc. Am. 100, 925–932.
Funnell, W. R. J., and Laszlo, C. A. (1978). “Modeling of the cat eardrum as a thin shell using
12

Ladak, JASA
the finite-element method,” J. Acoust. Soc. Am. 63, 1461–1467.
Funnell, W. R. J., and Laszlo, C. A. (1982). “A critical review of experimental observations on ear-drum structure and function,” ORL 44, 181–205 [list of references is available at http://audilab.bmed.mcgill.ca/~funnell/AudiLab/earref.html].
Gan, R.Z., Feng, B., Sun, Q. (2004). “Three-dimensional finite element modeling of human ear for sound transmission,” Ann. Biomed. Eng. 32, 847–859.
Hüttenbrink, K. N. (1988). “The mechanics of the middle ear at static air pressures,” Acta Otolaryngol. (Stockh.) Suppl. 451, 1–35.
Kirikae, I. (1960). The Structure and Function of the Middle Ear (Univ. Tokyo Press, Tokyo).
Koike, T., Wada, H., and Kobayashi, T. (2002). “Modeling of the human middle ear using the finite-element method,” J. Acoust. Soc. Am. 111, 1306–1317.
Kuypers L.C., Decraemer W.F., Dirckx J.J.J. and Timmermans J.-P. (2005). “Thickness distribu-tion of fresh eardrums of cat obtained with confocal microscopy,” JARO 6, in press.
Ladak, H.M., Decraemer, W.F., Dirckx, J.J.J., and Funnell, W.R.J. (2000). “Systematic errors in small deformations measured using shadow-moiré topography,” Appl. Opt. 39, 3266–3275.
Ladak, H.M., Decraemer, W.F., Dirckx, J.J.J., and Funnell, W.R.J. (2004). “Response of the cat eardrum to static pressures: Mobile versus immobile malleus,” J. Acoust. Soc. Am. 116, 3008–3021.
Lim, D.J. (1968). “Tympanic membrane. Electron microscopic observation. I: pars tensa,” Acta Otolaryngol. 66, 181-198.
Osguthorpe, J.D., and Lam, C. (1981). “Methodologic aspects of tympanometry in cats,” Otolaryngol. Head Neck Surg. 89, 1037–1040.
Price, G. R. (1974). “Upper limit to stapes displacement: implications for hearing loss,” J. Acoust. Soc. Am. 56, 195–197.
Price, G. R., and Kalb, J. T. (1986). “Mathematical model of the effect of limited stapes displacement on hazard from intense sounds,” J. Acoust. Soc. Am. Suppl. 1, 80, S122.
Price, G. R., and Kalb, J. T. (1991). “Insights into hazards from intense impulses from a mathematical model of the ear,” J. Acoust. Soc. Am. 90, 219–227.
Timoshenko, S. and Woinowsky-Krieger., S. (1959). Theory of Plates and Shells, 2d ed. (McGraw-Hill, New York).
13

Ladak, JASA
CAPTIONS
Figure 1 Grey-level image of the resting shape of the eardrum of cat MY1216L with corresponding FE mesh superimposed. The thick white line encloses the visible portion of the eardrum. The grey levels in the image vary from black (point furthest away from reader) to white (point closest to reader), whereas the mesh is shown in a uniform light grey. The regions of the mesh corresponding to the pars tensa (PT), pars flaccida (PF) and manubrium (M) are labelled. The anterior (Ant), posterior (Post), inferior (Inf) and superior (Sup) directions are approximate because the cat eardrum is actually tilted, and therefore the pars flaccida is both posterior and superior (dorsal) and the manubrium runs in the antero-inferior to postero-superior direction. The bottom panel shows horizontal profiles through the image (black profile) and through the mesh (grey), taken just posterior to the manubrium as indicated by the horizontal dashed line in the image. The left panel shows vertical profiles through the image (black profile) and through the mesh (grey), taken through the pars tensa just inferior to the manubrium as indicated by the vertical dashed line in the image. Mesh profiles are offset so as not to overlap with image profiles.
Figure 2 Simulated and measured iso-amplitude displacement contours for a pressure of +2.2 kPa with an immobile malleus. Computed patterns are shown on the left, and corresponding measured data from Ladak et al. (2004) are shown on the right. The measured data are for the first cycle of pressurization. Displacements are in μm, and adjacent contours are 25 μm apart. In cat MY0923R, measurements were made on the right ear instead of on the left ear as in the other two cats. In order to facilitate comparison of MY0923R with the other cats, the image of the eardrum was mirrored to look like the others. The triangles indicate points for which results are plotted in Figure 5.
Figure 3 Simulated and measured iso-amplitude displacement contours for a pressure of –2.2 kPa with an immobile malleus, displayed as in Fig. 2. The negative signs indicate that the displacements are directed medially.
Figure 4 Simulated iso-amplitude displacement contours for cat MY1216L for pressures of +1.1 kPa, +0.1 kPa, -0.1 kPa and -1.1 kPa. Displacements are in μm. For pressures of +1.1 kPa and -1.1 kPa, adjacent contours are 25 μm apart, whereas for pressures of +0.1 kPa and -0.1 kPa, adjacent contours are 2.5 μm apart. The square indicates the location of maximal pars-tensa displacement.
Figure 5 Calculated maximum principal nominal strains for pressures of ±2.2 kPa with an immobile malleus.
Figure 6 Computed (black) and measured (grey) pressure-displacement curves for cats MY1216L, MY1630L and MY0923R after mallear fixation, for locations indicated by triangles in the left-hand column of Figure 2. The three cycles of measured data are from Ladak et al.
14

Ladak, JASA
(2004). The arrows on the measured curves indicate the temporal order of the measurements. Lateral displacements are positive, whereas medial displacements are negative.
Figure 7 Computed iso-amplitude displacement patterns for cat MY1216L for pressures of +2.2 kPa and –2.2 kPa after increasing the thickness of the superior third of the posterior pars tensa from 40 μm to 80 μm. Adjacent iso-displacement contour lines (black) are 25 μm apart and are superimposed on the FE mesh (grey).
Figure 8 Iso-depth shape contours. Adjacent contours are 0.1 mm apart. Ticks along the horizontal and vertical axes are 1 mm apart. For each cat, the thick black line encloses the visible portion of the eardrum. For cats MY1216L and MY1630L, measurements were made on the left eardrum, whereas the right eardrum was used for cat MY0923R. To facilitate comparison of cat MY0923R with the other cats, the image of the eardrum was mirrored to look like the others.
15

-1.5
-1
-0.5
0
0.5
1
PT
MPF
B
Ant
Post
Inf
Su
p
mm
-1 0 1
6
5
4
3
2
1
0
z (mm)
y (m
m)
Med Lat
0 1 2 3 4 5 6 7 8 9
-1
0
1
x (mm)
z (m
m)
Med
Lat

Measured Data
125 100 75 50 25
MY1216L
200 175150 125
50
MY1630L
150175
225
200175
5075
125
10075
50
MY0923R
Simulation Results
MY1216L
50 25
25
50
75 100 125150 175 200 225 250
Ant
Post
Inf
Su
p
25 50 75
255075
100125 175200 200
325
MY1630L
2550
25
50
75 100 125150
MY0923R

Measured Data
-100
-75-50
MY1216L
-300 -250-200 -150
MY1630L
-600 -500 -400 -300-200
MY0923R
Simulation Results
-75 -50 -25
-200-175
-150
-125
MY1216L Ant
Post
Inf
Su
p
-75 -50 -25
-150-125
-100
-75-50
-25
MY1630L
-75 -50 -25
-225 -200 -175 -150
-125
MY0923R

+1.1 kPa
+0.1 kPa
-0.1 kPa
-1.1 kPa

+2.2 kPa
MY1216L
0%
2%
4%
6%
8%
10% 0-1%
1-2%
2-3%
0-1%4-5%
0-1%
1-2%
1-2%
3-4%
1-2%
MY1630L
0-1%
1-2%
2-3%
1-2%
1-2%
1-2%
MY0923R
-2.2 kPa
0-1%
1-2%
1-2%
2-3%
2-3%
MY1216L
MY1630L
0-1%
1-2%
1-2%
MY0923R
0-1%
1-2%
2-3%
1-2%

+2.2 kPa
2550
2550
75100 125 150
175
-2.2 kPa
-25-50-75
-200 -175-150
-125-100
-75
-50
-25

MY1216L
MY1630L MY0923R