Embed Size (px)
Citation preview
1
A GENERATION OF PATENT LITIGATION: OUTCOMES AND PATENT QUALITY
Michael Risch*
INTRODUCTION
Patent quality is a slippery concept; there are many ways to consider quality, such as disclosure and technology breadth.1 Perhaps the simplest measure of quality is whether a patent is valid – that is, whether it is novel, nonobvious, and otherwise compliant with the Patent Act.2 Validity quality can only be observed when a court finally adjudicates a patent, but patents are never adjudicated valid. Instead, courts merely rule that they will survive this challenge, and the next time could be different. Moreover, most cases settle without every ruling on the patent; whether the patent would have eventually been invalidated is never resolved. Because actual invalidity rulings are rare, there are very few observations available to predict when patents are of low quality – that is, invalid.
This study changes that by examining patents that are tested on the merits – and those that are not – over twenty-five years. The findings may be surprising to some. Patents asserted by highly litigious licensors (some
* ©2014 Michael Risch, Professor of Law, Villanova University School of Law. The
author thanks Chris Buccafusco, Michael Burstein, Colleen Chien, Eric Claeys, John Duffy, David Schwartz, Josh Wright, Felix Wu, and participants of the 2013-14 Edison Fellowship Program and 2013-14 Cardozo IP Colloquium for their helpful comments and feedback. The author further thanks Patent Freedom, Lex Machina, John Allison, and Brian Corcoran for providing (or assisting in providing) some of the data used in this study. This seemingly endless project could not have been completed without the seemingly endless support provided by the Villanova University School of Law. Valuable research assistance for this study was provided by Dustin Bednarz, Doug Behrens, Brian Corcoran, Jarina D’Auria Richard Eiszner, Adam Fenstermaker, Amanda Garger, Nate Griffith, Simran Kaur, Josh Nightingale, Samantha Peruto, Thomas Sager, and Brett Zakeosian. Data collection efforts were supported by an Edison Fellowship and a Da Vinci Fellowship from the Center for the Protection of Intellectual Property, and summer research assistant grant from Intellectual Ventures. None of the patents studied was asserted by Intellectual Ventures.
1 R. Polk Wagner, Understanding Patent-Quality Mechanisms, 157 Penn L. Rev. 2135, 2138 (2009) (describing difference between quality and value); Michael Risch, Patent Portfolios as Securities, 63 DUKE L.J. 89, 137-51 (2013) (surveying various methods for valuing patents).
2 Wagner, id; Michael Risch, Everything is Patentable, 75 TENN. L. REV. 591, 594 (2008) (“Thus, this Article assumes that maximum social value is obtained by the issuance of only those patents that are justified under the statute.”).

A Generation of Patent Litigation
2
might call trolls) are invalidated much more often than randomly selected counterparts; however, so few patents are actually tested on the merits that less than 4% of all the cases involve an invalidated patent. More important, it turns out that courts finding invalidity have more to do with who NPEs sue than who they are. The best explanation for when a patent will be invalidated is when it gets challenged in court, and NPEs are more likely to be challenged because they sue more defendants more often than others. Once you take this selection effect out of the equation, NPE status has no statistical impact. It turns out that product companies that sue more defendants more often are also invalidated more often.
The data also shows—surprisingly again—that a key metric of patent quality, namely a patent’s citations to other work, is negatively correlated with validity. That is, the more backward citations a patent has, the more likely it is that it will be invalidated. This is directly contrary to the current view that such citations are an indicator of patent quality.3
This is not to say that all is right in patent litigation. Increasing number of cases, increasing case complexity, and increasing stakes are all important. So-called patent trolls are at the center of this maelstrom, and provoke a visceral reaction in many who read about them. The goal of this study is to take a step back from rhetoric, consider the data in a neutral way,
3 See, e.g., John Hagedoorn & Myriam Cloodt, Measuring Innovative Performance: Is
There an Advantage in Using Multiple Indicators?, 32 RES. POL’Y 1365 (2003) (discussing backward citations as indicator of patent quality); Manuel Trajtenberg, A Penny For Your Quotes: Patent Citations and the Value of Innovations, 21 RAND J. ECON. 172 (1990); Manuel Trajtenberg, Rebecca Henderson & Adam B. Jaffe, University Versus Corporate Patents: A Window on the Basicness of Invention, in PATENTS, CITATIONS & INNOVATIONS: A WINDOW ON THE KNOWLEDGE ECONOMY 60, 63 (Adam B. Jaffe & Manuel Trajtenberg eds. 2002) (including backward citations in measures of patent quality); Jean O. Lanjouw & Mark Schankerman, The Quality of Ideas: Measuring Innovation with Multiple Indicators, at 10 (Nat’l Bureau of Econ. Research Working Paper Series, No. 7345, 1999), available at http://www.nber.org/papers/w7345 (modeling value based on citations); John R. Allison, Mark A. Lemley, Kimberly A. Moore & Derek R. Trunkey, Valuable Patents, 92 GEO. L.J. 435, 453‒55 (2004) (finding backward citations significant); Maayan Filmar, An Ex Ante Method of Patent Valuation: Transforming Patent Quality into Patent Value, 13 J. HIGH TECH. L. (forthcoming 2013) (manuscript at 45‒52) (describing several objective measures of patent valuation), available at http://papers.ssrn.com/sol3/papers.cfm?abstract_id=2252251. But see Alan C. Marco, The Dynamics of Patent Citations, 94 ECON. LETTERS 290, 295 (2007) (observing that citations may not fully encapsulate value); Lanjouw & Schankerman, id. at 16 (finding that backward references did not affect the probability that maintenance fees would be paid on the patent); John R. Allison, Mark A. Lemley & Joshua Walker, Patent Quality and Settlement Among Repeat Patent Litigants, 99 GEO. L.J. 677, 681, 686–87 (2011) (finding that most litigated patents won less often, despite having more backward citations).

A Generation of Patent Litigation
and detail policy implications that arise. To provide this analysis, this article fills two persistent gaps in the
literature studying patents and patent litigation. First, it provides long-term trends involving the same patents in multiple cases rather than cross-sectional snapshots examining the outcomes of a single year or a few patents. Second, it examines the entirety of patent litigation in detail, rather than only those cases that result in a ruling on the merits of the case.
Study after study examines the results of patent litigation. Most of these studies historically only looked at published opinions available in research databases.4 With a few exceptions, only recently have studies begun to look at orders—when judges rule on patents in unpublished rulings.5 A few studies examine what happens when judges don’t rule, counting settlements, denials of summary judgment, and the like.6 But gathering quality data is time consuming and error prone, and until 2001 was nearly impossible. Thus, every study faces a tradeoff between detail and breadth. As a result, longitudinal surveys in the literature often lack detail.7 Conversely, detailed
4 See, e.g., Matthew Henry, Thomas P. McGahee & John L. Turner, Dynamics of
Patent Precedent and Enforcement: An Introduction to the UGA Patent Litigation Datafile (Univ. Ga. Working Paper, 2013), available at http://papers.ssrn.com/sol3/papers.cfm?abstract_id=2228103 (describing a data set built to analyze patent litigation in the United States during 1929-2006 using USPQ); John R. Allison & Mark A. Lemley, Empirical Evidence on the Validity of Litigated Patents, 26 AIPLA Q.J. 185 (1998) (using USPQ reports); Alan C. Marco, The Selection Effects (and Lack Thereof) in Patent Litigation: Evidence from Trials, 4 TOPICS ECON. ANAL. &POL’Y 1, 5 (Iss. 1, Art. 21 2004) (using USPQ). But see Jean O. Lanjouw & Mark Schankerman, Protecting Intellectual Property Rights: Are Small Firms Handicapped?, 47 J. L. & ECON. 45, 57 (2004) (using docket data, but only at a coarse level); Paul M. Janicke & Lilan Ren, Who Wins Patent Infringement Cases, 34 AIPLA Q. J. 1, 7 (2006) (studying published opinions).
5 Jay P. Kesan, & Gwendolyn G. Ball, How are Patent Cases Resolved? An Empirical Examination of the Adjudication and Settlement of Patent Disputes. 84 WASH. U. L. REV. 237, 258 (2006); Gwendolyn G. Ball & Jay P. Kesan, Transaction Costs and Trolls: Individual Inventors, Small Firms and Entrepreneurs in Patent Litigation 14 (Univ. Ill. Law. & Econ., Working Paper No. LE09-005, 2009), available at http://papers.ssrn.com/sol3/papers.cfm?abstract_id=1337166; John R. Allison, Mark A. Lemley & David L. Schwartz, Understanding the Realities of Modern Patent Litigation, 92 TEX. L. REV. 1769 (2014).
6 Allison, Lemley & Walker, supra note 3, at 686 (tracking outcomes by owner type); Robin Feldman, et al., The AIA 500 Expanded: The Effects of Patent Monetization Entities, 17 UCLA J.L. & Tech. 1(2013) (summarizing outcomes); Allison, Lemley & Schwartz, supra note 5, at 1777 (studying denials of summary judgment, but not settlements prior to merits rulings); Kesan & Ball, supra note 5; Ball & Kesan, supra note 5.
7 See, e.g., Henry, et al., supra note 4 (focusing only on published opinions); Lanjouw

A Generation of Patent Litigation
4
outcome studies often cover a small sample, limited by time and by those that actually reached some judicial ruling one way or the other.8 Limiting detailed samples this way causes two problems. First, it can lead to a sample too small to statistically test theories about patent quality. Second, it leads to potential explanatory data loss by leaving out patent and outcome information from cases that end without a judge ever passing on the merits. Even those studies that consider cases that never reach a merits ruling only do so for a few years or a few patents.
The data collected in this study attempts to bridge the gap by providing detail and longevity. Rather than considering a short sample of judicial rulings, it opts instead to consider a large sample of lawsuits over a twenty-five year period of time to determine what happened in every case associated with a set of patents, through appeal, whether a court ruled on the merits or not. This twenty-five year history of litigation allows for an unprecedented comparison between highly litigious non-practicing entities (often called NPEs, PAEs, or patent trolls) and other patent litigants. While prior studies, including my own, helpfully examine pieces of the puzzle this Article seeks a glimpse at the entire picture.
This Article follows Patent Troll Myths,9 which studied the ten most litigious patent owners that offer no products or services. Starting with the patent plaintiffs in that article, we identified a set of random patent plaintiffs selected to match the rate of assertion over the same 25 year period, and
& Schankerman, supra note 4 (granular litigation data unavailable); Shawn P. Miller, Where’s the Innovation? An Analysis of the Quantity and Qualities of Anticipated and Obvious Patents, 18 VA. J. LAW & TECH 1, 6 (2013) (considering obviousness and anticipation only); Michael J. Mazzeo, Jonathan H. Ashtor & Samantha Zyontz, Note, Do NPEs Matter? Non-Practicing Entities and Patent Litigation Outcomes, 9 J. COMPETITION L. & ECON. 4, 879-904 (2013) (examining only judge and jury trial outcomes); PricewaterhouseCoopers, 2014: Patent Litigation Study: As Case Volume Leaps, Damages Continue General Decline, http://www.pwc.com/en_US/us/forensic-services/publications/assets/2014-patent-litigation-study.pdf (last visited July 15, 2014) (hereafter “PwC 2014”); PricewaterhouseCoopers, 2013: Patent Litigation Study: Big Cases Make Headlines, While Patent Cases Proliferate, http://www.pwc.com/us/en/forensic-services/publications/2013-patent-litigation-study.jhtml (last visited July 9, 2014) (hereafter “PwC 2013”); Feldman, supra note 6 (coding all litigation for four years by end result, but not by patent).
8 Christopher Anthony Cotropia, Jay P. Kesan & David L. Schwartz, Unpacking Patent Assertion Entities (PAEs) (Working Paper, 2014), available at http://papers.ssrn.com/sol3/papers.cfm?abstract_id=2346381 (considering two years of litigation, for plaintiff status only); Allison, Lemley & Schwartz, supra note 5 (considering two years only, and merits decisions only); Allison, Lemley & Walker, supra note 3 (considering most litigated patents only).
9 Michael Risch, Patent Troll Myths, 42 SETON HALL L. REV. 457 (2012).

A Generation of Patent Litigation
gathered all of the cases involving the patents involved in those cases. Thus, the Article builds on the very best parts of current cross-sectional work10 by adding a longitudinal component by finding every case that asserted a set of patents, and then separately tracing the outcome of every patent asserted in each of those cases.
This article focuses on litigation outcomes and patent quality. A followon article will consider what information the data might reveal about innovation and secondary markets.
Part I discusses the debate about patent troll patent litigation. It focuses on how other studies have measured patent quality through patent litigation data.
Part II discusses this study’s methodology: the collection of data about highly litigious NPEs and a control group of randomly selected nonNPEs. It describes how the cases were selected, as well as the data collected in different phases of the study. This includes collection of previously untapped data: reexamination outcomes.
Part III presents the data in a variety of formats, and follows each section with a discussion of potential policy implications associated with the data.
Part A shows the growth in case complexity, including defendant counts, transfers and consolidations, and selection of district court venue. This part includes a linear regression showing the effect of NPEs on case duration.
Part B shows how much more often the NPEs settled, as well as all of the different ways that cases ended. For example, NonNPEs ended a large portion of their cases with consent judgments, though NPEs used consent judgments as well.
Part C presents data about invalidity in a number of ways: in terms of adjudicated patents, all patents, and cases. This part presents a novel regression estimating the likelihood that an asserted patent will be invalidated, and finds that NPE status is not among the factors.
Part D examines infringement findings, and shows that the primary concern with NPEs may be noninfringement rather than invalidity. Both Parts C and D show that decisions on the merits of cases are so rare that it is difficult to base policies on them.
The article concludes with some thoughts about how the results might guide policy.
10 Allison, Lemley & Schwartz, supra note 5 (examining every case from 2008 and
2009, including denials of summary judgment).

A Generation of Patent Litigation
6
I. BACKGROUND
The costs and, for some, benefits of patent litigation have captured the public’s attention in a way that few could have predicted only four years ago. News stories have shifted from President Obama having famous patents in his office11 to President Obama decrying the cost of frivolous litigation both in town hall meetings12 and even in the State of the Union address.13
As a result, the pressure to study patent litigation has grown, and production of these studies has been aided by great improvement in patent litigation docket data, which allows access not only to cases filed, but also to each document filed in recent cases.14
Data is so available that studies of litigation behavior has almost become a cottage industry.15 Some of the studies become rallying cries for reform,16 some present different conclusions from essentially the same
11 See Nancy Benac, Obama Oval Office Gets an Updated Look, HUFFINGTON POST
(Associated Press Mar. 18, 2010), http://www.huffingtonpost.com/2010/01/07/obama-oval-office-gets-an_n_411365.html (last visited July 14, 2014) (“Also new to the Obama bookshelves are three mechanical devices on loan from the National Museum of American History's patent collection: models for Samuel Morse's 1849 telegraph register, John Peer's 1874 gear-cutting machine and Henry Williams' 1877 feathering paddlewheel for steamboats.”).
12 Ali Sternburg, Obama Acknowledges Patent Troll Problem, PATENT PROGRESS (Feb. 14, 2013) (describing Google Hangout discussion: “I do think that our efforts at patent reform only went about halfway to where we need to go and what we need to do is pull together additional stakeholders and see if we can build some additional consensus on smarter patent laws.”), http://www.patentprogress.org/2013/02/14/obama-acknowledges-patent-troll-problem-w-transcript/
13 Erin Merson, Obama Backs Patent Reform Effort in State of the Union, POLITICO (Jan. 28, 2014), http://www.politico.com/blogs/politico-live/2014/01/obama-backs-patent-reform-effort-in-state-of-the-union-182139.html.
14 Bloomberg dockets provides every electronically available federal filing to subscribers – not just docket entries, but also the underlying document. Services such as Lex Machina, Docket Navigator, RPX, and Patent Freedom have improved their coverage with varying degrees of public accessibility.
15 RPX, Patent Freedom (now purchased by RPX), Lex Machnia, and Docket Navigator all provide litigation data services. RPX, Lex Machina, and PriceWaterhouseCoopers all issue annual litigation reports.
16 See, e.g., James Bessen & Michael J. Meurer, Note, The Direct Costs from NPE Disputes, 99 CORNELL L. REV. 387 (2014) (estimating the direct costs to defendants arising from NPE patent assertions); Colleen V. Chien, Patent Assertion and Startup Innovation, NEW AMERICA FOUNDATION (2013), available at http://newamerica.net/sites/newamerica.net/files/policydocs/Patent%20Assertion%20and%20Startup%20nnovation.pdf (recommending several interventions to ameliorate the harms of patent assertion on small companies, keeping in mind the special needs of startups who,

A Generation of Patent Litigation
data,17 and some argue that there is no real problem.18 Each of these studies has some role to play in the formation of public policy.
Some studies have looked at NPE litigation. Many studies have examined the number of NPE suits in comparison with patent litigation generally; the nearly uniform findings indicate that NPE filings have grown in recent years.19 As late as 2009, the evidence showed NPEs filing only a small fraction of all patent infringement suits,20 though many highly litigated patents are owned by NPEs.21 But since then, NPE lawsuits have grown to more than half of filings, depending on how one defines an NPE.22
with their fewer resources, less time, and greater focus on building the business, are at a relative disadvantage when patent processes are expensive, slow, or require deep patent expertise); Colleen Chien, Startups and Patent Trolls, 17 STAN. TECH. L. REV. 461 (2014) (finding most unique defendants to troll suits are small and presenting data that suggest that a number of reforms put in place over the last year are having a positive impact); Catherine E. Tucker, The Effect of Patent Litigation and Patent Assertion Entities on Entrepreneurial Activity (2014), available at http://papers.ssrn.com/sol3/papers.cfm?abstract_id=2457611 (investigating the statistical relation between levels of patent litigation and venture capital investment in the U.S.).
17 Compare Cotropia, Kesan & Schwartz, supra note 8, at 37 (comparing different results from three studies).
18 U.S. GOV’T ACCOUNTABILITY OFFICE, GAO-13-465, INTELLECTUAL PROPERTY: ASSESSING FACTORS THAT AFFECT PATENT INFRINGEMENT LITIGATION COULD HELP IMPROVE PATENT QUALITY 17 (2013) (finding only slight increase in patent monetization entity lawsuits between 2007 and 2011); Steve Moore, Probing 10 Patent Troll Myths – A Factured Fairytale Part 2, IP WATCHDOG (July 30, 2013) (finding few differences between NPEs and nonNPEs), http://www.ipwatchdog.com/2013/07/30/probing-10-patent-troll-myths-a-factured-fairytale-part-2/id=43754/.
19 Cotropia, Kesan & Schwartz, supra note 8; Sara Jeruss, et al., The America Invents Act 500: Effects of Patent Monetization Entities on US Litigation, 11 DUKE L. & TECH. REV. 357(2012).
20 Colleen Chien, Of Trolls, Davids, Goliaths, and Kings: Narratives and Evidence in the Litigation of High – Tech Patents, 87 N.C. L. REV. 1571, 1572 (2009); Ball & Kesan, supra note 5 (noting that small percentage of patent plaintiffs are licensing companies); Axel Haus & Steffen Juranek, Patent Trolls, Litigation, and the Market for Innovation, at 8 (2014) (random sample of litigation between 2004 and 2007 showed only 12% of cases as NPEs), available at http://papers.ssrn.com/abstract=2424407. See also David L. Schwartz & Jay P. Kesan, Analyzing the Role of Non-Practicing Entities in the Patent System, 99 CORNELL L. REV. 426, 441 (2014) (highlighting debates about what constitutes an NPE).
21 John R, Allison, Mark A. Lemley & Joshua Walker Extreme Value or Trolls on Top? The Characteristics of the Most Litigated Patents, 158 U. PA. L. REV. 1 (2009) (showing that approximately half of the most litigated patents are enforced by NPEs) [hereinafter Most Litigated].
22 See, Cotropia, Kesan & Schwartz, supra note 8.
A Generation of Patent Litigation
8
Other studies have examined the quality of patents owned by trolls, but they are either non-comprehensive,23 or they focus only on merit rulings.24
Finally, a few studies have examined NPE case outcomes not on the merits. One study found that licensing companies are more likely to settle cases than other small entities.25 Another study considered the outcome of cases over a six year period, but did not track consolidated cases, appeals, or by patent.26 A study of highly litigated patents finds a 90% settlement rate among the most highly litigated patents.27 This follows a theory that NPEs are most successful when they do not reach a jury verdict.28
But each study suffers from some particular drawbacks. First, they are virtually all cross-sectional, looking at a year or two (sometimes four or five) of patent litigation, but not tracing the same patents throughout. This is helpful for some purposes, but not helpful to determine whether current observations are different from long-term trends. Second, many of them lack a control group; they present data for one type of group without showing that the results differ from the other group.
Cross-sectional data without a control group significantly detracts from the ability of a study to inform policy.29 This study provides longitudinal data. It also provides a control group.30 These two improvements alone should aid policy.
23 See, Sannu K. Shrestha, Note, Trolls or Market-Makers? An Empirical Analysis of
Nonpracticing Entities, 110 COLUM. L. REV. 114, 119–31 (2010) (examining a small, high profile set of cases).
24 See, Miller, supra note 7 (examining only obviousness and anticipation rulings); PwC 2013, supra note 7; PwC 2014, supra note 7 (examining only win rates); Jonathan H. Ashtor, et al., Patents at Issue: The Data Behind the Patent Troll Debate, 21 GEO. MASON. L. REV. 957(2014) (studying merits rulings only).
25 Ball & Kesan, supra note 5, at 20. See also, Ashtor, et al., id. at 95; Haus & Juranek, supra note 18, at 8 (finding NPE cases resolve faster).
26 Feldman, supra note 6, at 61. 27 Allison, Lemley & Walker, supra note 3, at 689. 28 Magliocca, supra note Error! Bookmark not defined., at 1813 (“[S]ince trolls and
sharks succeed as long as they reach settlements, a substantive solution will be ineffective because most of these cases never get to court.”).
29 Gerald H. Kramer, The Ecological Fallacy Revisited: Aggregate- versus Individual-level Findings on Economics and Elections, and Sociotropic Voting, 77 AM. POLI. SCI. REV. 92, 93 (1983) (mounting influential critique of cross-sectional studies of behavior).
30 Cf. Haus & Juranek, supra note 18, at 8 (describing another study: “Unfortunately, the authors only investigate NPE cases and lack a control group.”).
A Generation of Patent Litigation
II. METHODOLOGY AND DATA COLLECTION
A goal of this study was to compare evidence about litigation by patent plaintiffs with the evidence previously gathered about NPEs. Thus the study collected data from the same basic sources as those described in Patent Troll Myths, and summarized below. However, data sources have improved somewhat since 2010, and collection of detailed case outcome information revealed some erroneous or duplicative data from the prior article. Thus, some of the summary data here will not identically match the results from Patent Troll Myths, though the differences are minor.
A. Selecting the NPEs
The study begins with the ten most litigious NPEs of the 2000s.31 Some of these entities are still the most litigious, but many are not. These particular NPEs are worth studying for several reasons. First, as the most litigious entities, they likely imposed the greatest social cost in litigation defense and otherwise.32 Second, their cases are more likely to be completed than more recent litigious NPEs. Third, at least two of the NPEs, Acacia and Plutus (now IP Nav) continue to be active and highly litigious.
Fourth, there is no reason to believe that the patents themselves are unrepresentative of NPE patents generally,33 though admittedly this is not proven statistically. The NPEs in this study represent a mix of business types, including aggregators, inventor owned companies, and privateering,34 and thus obtain their patents from the same sources as other NPEs. Further, these very patent plaintiffs are the objects of derision in articles about patent trolls.35
31 More accurately, these are the plaintiffs that filed the most lawsuits between 2003
and 2009, though we gathered their cases for all years. 32 Risch, supra note 9, at 468 (2012). 33 See Michael Risch, A Patent Behemoth Rears Its Head, MADISONIAN BLOG (Dec.
8, 2010), http://madisonian.net/2010/12/08/a-patent-behemoth-rears-its-head (arguing that Intellectual Ventures patents have characteristics similar to the patents in this study, such as the fact that they are coming from individual inventors, start-ups, and large corporations).
34 Privateers enforce practicing company patents. 35 See, e.g., Rik Myslewski, Survey: Patent Litigation Skyrocketing, Trolls Top 10
Sueball Chuckers, THE REGISTER (May 14, 2014) (Ronald A. Katz Technology Licensing in top ten list for most patents involved in lawsuits), http://www.theregister.co.uk/2014/05/13/survey_patent_litigation_skyrocketing_trolls_top_10_sueball_chuckers/; Paul Belleflame, What to Think of ‘Patent Trolls’? The Return, IPDIGIT (Oct. 31, 2011) (article and comments debating merits of General Patent Corp. as a

A Generation of Patent Litigation
10
Fifth, if they are unrepresentative, then the bias likely runs against NPEs in general rather than in favor of them—at least among those NPEs that file lawsuits.36 Many companies classified as NPEs are design houses, or assert just a few patents, such that the likelihood of complex mass litigation is unlikely.37 Furthermore, as will be seen below, NPEs in general are far more successful in litigation than the NPEs studied here.38
If these highly litigious plaintiffs lose more often than other NPEs, then the quality differences found here may be smaller among the general patent assertion population. In other words, if these NPEs are not representative,
troll), http://www.ipdigit.eu/2011/10/what-to-think-of-patent-trolls-the-return/; Microsoft Sues Acacia Over Smartphone Patents, REUTERS (Nov. 20, 2013) (quoting industry lawyer: "Acacia's lawsuits are the worst kind of abusive litigation behavior, attempting to extract payment based on litigation tactics and not the value of its patents."), http://news.yahoo.com/microsoft-sues-acacia-over-smartphone-patents-195020778--sector.html; Preston H. Heard, Georgia Federal Court Does Not Require Internal Communications Of Outside Counsel To Be Listed On Privilege Log, NAT. L. REV. (Feb. 7, 2014) (discussing sham litigation allegation against Catch Curve); Joe Mullin, Rackspace Sues “Most Notorious Patent Troll in America,” ARS TECHNICA (Apr. 4, 2013) (claiming wrongful assertion by IPNav), http://arstechnica.com/tech-policy/2013/04/rackspace-sues-most-notorious-patent-troll-in-america/ ; David Segal, Has Patent, Will Sue: An Alert to Corporate America, NY TIMES (July 13, 2013) (profile of Erich Spangenberg and IPNav), http://www.nytimes.com/2013/07/14/business/has-patent-will-sue-an-alert-to-corporate-america.html.
36 While there may be NPEs with a few (weak) patents that are under fire for abusive settlement demands, no litigation study would capture their activities. See, e.g., Julie Samuels, MPHJ Exposed: The Real Dirt on the Notorious Scanner Troll, ELECTRONIC FRONTIER FOUNDATION (Jan. 14, 2014), https://www.eff.org/deeplinks/2014/01/mphj-exposed-the-real-dirt-notorious-scanner-troll (discussing demand letters sent by MPHJ); MN Attorney General Lori Swanson, Attorney General Lori Swanson Announces First-In-The-Nation Order to Stop Delaware Company from “Patent Trolling” in Minnesota (Press Release Aug. 20, 2013) (on file with author); Joe Mullin, Patent Stunner: Under Attack, Nation’s Most Notorious “Troll” Sues Federal Gov’t, ARS TECHNICA (Jan. 14, 2014) (noting if the FTC sues MPHJ, it will be the first time the FTC has taken direct legal action against a patent assertion entity), http://arstechnica.com/tech-policy/2014/01/patent-stunner-under-attack-nations-most-notorious-troll-sues-federal-govt/; Martyn Williams, Patent Troll MPHJ will Repay All New York Licenses in Settlement with State, PC WORLD (Jan. 14, 2014) (discussing that the MPHJ settlement should serve as a warning to other patent owners engaged in similar practices), http://www.pcworld.com/article/2087720/patent-troll-mphj-will-repay-all-new-york-licensees-in-settlement-with-state.html.
37 Colleen Chien, Patent Trolls by the Numbers (Working Paper 2013), available at http://papers.ssrn.com/sol3/papers.cfm?abstract_id=2233041 (describing different “trolls” to include a variety of business models); Cotropia, Kesan & Schwartz, supra note 8 (describing different business models for NPEs).
38 PwC 2014, supra note 7 (finding that NPEs win 25% of cases decided on the merits, including 65% of their cases at trial).
A Generation of Patent Litigation
they are biased in a ways that implies more patents, weaker patents, more cost, and more litigation. If it exists, such bias is preferable for policymaking than assuming every other NPE holds better patents than these NPEs. These cases are, after all, a large portion of the docket.
But that is the worst case scenario. It is unclear that the patents in this study are unrepresentative. For example, individual plaintiffs have a much lower win rate than other NPEs, and many of the NPEs in this study are inventor owned companies39 that might also have lower win rates. Further, if there are differences from the general NPE population, those differences may manifest themselves in different ways. For example, the patents in this study may have the same quality, but the may be asserted against noninfringing products.40 Or, the patents and cases may be of the same general quality, but simply have been asserted more times, and thus more likely to be unsuccessful.41
From this discussion it bears noting, though, that throughout this paper the term NPE is used generally to refer to these ten NPEs. How much (and how) to extrapolate the data to the general population is a more complex question.
B. Selecting a Loosely Matched Random Control Set
The control group consists of a randomly selected set of asserted patents and the cases in which they were asserted. These patent owners/cases are not necessarily highly litigious.
1. Choosing “Normal” Cases
If data about the most litigious NPEs might be biased, this raises an alternative question: why not compare them against the most litigious practicing entities? It turns out that some of the most litigious entities (such as Monsanto) are in the matched set, but some are not. There are three reasons not to do select only highly litigious nonNPEs.
39 For example, PwC 2014, supra note 7. 40 Cf. Allison, Lemley & Schwartz, supra note 5 (finding more cases determined on
noninfringement than on invalidity). 41 Part III(C), below, finds that more assertion leads to a higher likelihood of
invalidity. Allison, Lemley & Walker, supra note 3, found that more assertion led to more losses.

A Generation of Patent Litigation
12
First, and most practically, the most litigious practicing entities assert many fewer patents,42 and thus are not likely to generate a comparable set of patents or even litigations to consider.
Second, a primary goal of this study is to compare NPE litigation to the “average” litigation. Selecting highly litigious practicing entities will not achieve this goal. It might answer other questions, like whether the most litigious NPEs behave differently than the most litigious nonNPEs,43 but it will not help determine whether NPEs are different in kind from the usual case. This is why the potential bias of using the most litigious NPEs is not problematic; however the most litigious NPEs compare with the average nonNPE, the average non-litigious NPE will compare the same or better.
Third, and more technically, to the extent that the most litigious practicing entities hold patents in a few technology classes (as one might expect from a product company), then it becomes impossible to compare whether NPEs assert patents in similar classes to random practicing entities. The same concern does not necessarily run the other direction, because many of the studied NPEs have an incentive to obtain diversified portfolios. This same justification applies more generally to other comparisons, such as original patent assignees; NPEs obtain patents from a variety of sources, while the most litigious practicing entities likely obtain theirs from only a few.
2. Selecting the Cases
The studied NPEs were involved in more than 900 cases, associated with 350 patents. The goal was to find a random set of nonNPE cases distributed over the same time period—a matching set. Because we44 had patent data, and we had litigation data, we had two primary choices for selecting this random control sample: choosing cases from the same time periods, or choosing patents from the same time periods.
We used a hybrid matching solution that used information about both the patents and the cases. We began with the number of patents, and thus identified 350 random cases distributed by year in the same proportions as NPE litigation. We did not match patents, though; instead, we took the number of patents as our initial draw of random cases.
42 Monsanto, for example, filed 116 cases using the same patent, and included 13 other
patents in a few of the cases (at most 35, for two patents). 43 See Allison, Lemley & Walker, supra note 21, and Allison, Lemley & Walker,
supra note 3, for a study of highly litigated patents, which is a similar question. 44 The use of “we” throughout refers to the author and research assistants/data coders.
Final decisions about methodology and data collection were the author’s.

A Generation of Patent Litigation
After identifying 350 nonNPE cases distributed proportionally during the same years as our NPE litigation, we identified the patents asserted in those cases. We then found every case asserting those patents regardless of year filed, and also logged the patents asserted in those cases. We only dug one level deep; we did not seek to find all of the cases asserting each new patent identified in later cases. This will likely bias the tally of how many times each patent was asserted, because many of our nonNPE patents are truncated at 1. The bias is likely negligible, since the median even among NPEs is only 2 cases per patent.
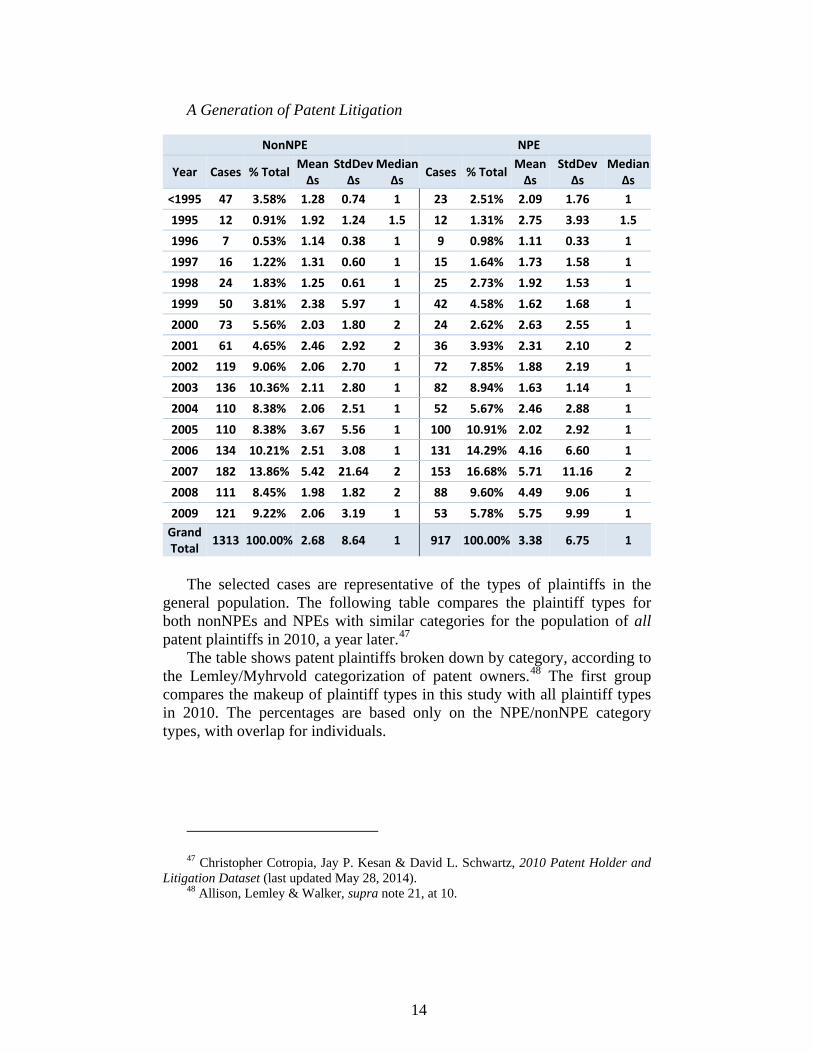
The end result of the matching is a set of 1313 patent cases involving 752 patents. The following table shows the difference between the two sets; the percentage distributions are roughly equal—close enough to avoid a bias associated with too much emphasis on early years—but the differences are statistically significant.45 The drop in cases by NPEs in 2009 implies that many of the individual inventor NPEs were winding down activities, perhaps as their patents expired. The following table lists the number of cases filed each year, along with the mean, standard deviation and median number of defendants in each case.46
45 P=.000 in a chi-squared test 46 Some data for the NPEs will not exactly match the data in Patent Troll Myths; new
and improved docket access tools coupled with better deduplication associated with determining case outcome resulted in some changed case counts. The changes were not biased in any direction. For example, the prior set included some consolidated cases; tracing the individual cases back to original filings both a) increased the number of cases, and b) changed the date the litigation commenced. However, there were also cases that had both the original and the transferred cases listed. Removing the transferred case left the litigation initiation the same, but decreased the number of cases.
A Generation of Patent Litigation
14
NonNPE NPE
Year Cases % Total Mean Δs
StdDev Δs
Median Δs Cases % Total Mean
Δs StdDev
Δs Median
Δs <1995 47 3.58% 1.28 0.74 1 23 2.51% 2.09 1.76 1 1995 12 0.91% 1.92 1.24 1.5 12 1.31% 2.75 3.93 1.5 1996 7 0.53% 1.14 0.38 1 9 0.98% 1.11 0.33 1 1997 16 1.22% 1.31 0.60 1 15 1.64% 1.73 1.58 1 1998 24 1.83% 1.25 0.61 1 25 2.73% 1.92 1.53 1 1999 50 3.81% 2.38 5.97 1 42 4.58% 1.62 1.68 1 2000 73 5.56% 2.03 1.80 2 24 2.62% 2.63 2.55 1 2001 61 4.65% 2.46 2.92 2 36 3.93% 2.31 2.10 2 2002 119 9.06% 2.06 2.70 1 72 7.85% 1.88 2.19 1 2003 136 10.36% 2.11 2.80 1 82 8.94% 1.63 1.14 1 2004 110 8.38% 2.06 2.51 1 52 5.67% 2.46 2.88 1 2005 110 8.38% 3.67 5.56 1 100 10.91% 2.02 2.92 1 2006 134 10.21% 2.51 3.08 1 131 14.29% 4.16 6.60 1 2007 182 13.86% 5.42 21.64 2 153 16.68% 5.71 11.16 2 2008 111 8.45% 1.98 1.82 2 88 9.60% 4.49 9.06 1 2009 121 9.22% 2.06 3.19 1 53 5.78% 5.75 9.99 1
Grand Total 1313 100.00% 2.68 8.64 1 917 100.00% 3.38 6.75 1
The selected cases are representative of the types of plaintiffs in the
general population. The following table compares the plaintiff types for both nonNPEs and NPEs with similar categories for the population of all patent plaintiffs in 2010, a year later.47
The table shows patent plaintiffs broken down by category, according to the Lemley/Myhrvold categorization of patent owners.48 The first group compares the makeup of plaintiff types in this study with all plaintiff types in 2010. The percentages are based only on the NPE/nonNPE category types, with overlap for individuals.
47 Christopher Cotropia, Jay P. Kesan & David L. Schwartz, 2010 Patent Holder and
Litigation Dataset (last updated May 28, 2014). 48 Allison, Lemley & Walker, supra note 21, at 10.

A Generation of Patent Litigation
Category nonNPE CKS2010 NPE CKS2010 1 Licensing entity 53.38% 67.17% 2 University 0.00% 0.92% 3 Failed Startup 0.23% 0.21% 5 Inventor Owned Company 1.45% 2.94% 41.70% 19.78% 8 Product or Service Co. 92.16% 86.00% 9 Individual 4.34% 6.37% 9.15% 10 Undetermined 0.15% 0.19% 12 IP Licensing Arm of Product Company 1.68% 1.25% 4.91% 3.90%
This study slightly oversamples product companies and undersamples
individual plaintiffs and inventor owned companies. This is an acceptable tradeoff, given scholarship that favors product companies as a plaintiff class. Among the NPE samples, this study undersamples licensing companies and oversamples inventor owned companies. The difference is primarily explained by two factors. First, about 5% of the 2010 NPE cases were filed by ArrivalStar, which is likely an inventor owned company,49 but are coded as a licensing entity. Second, it may reflect a historical change away from individual firms to licensing entities, given that the plaintiffs studied here were active from 1985 to 2009. For example, when limited to just 2008 and 2009, the cases in this study were 68% in Category 1 (licensing) and 24% in Category 5 (inventor owned), which is much closer to the 2010 distribution for the entire population. Of course, there is also likely to be some random variation from year to year.
3. Using a Hybrid Solution
The hybrid matching algorithm is a bit unusual; most studies either match by case, or by patent. These usual solutions leave much to be desired for a sample of all litigation relating to particular patents asserted by a representative sample of litigants.50
49 Paul Brinkmann, Delray Beach Inventor Files Hundreds of Patent Suits Nationwide,
S. FLA. BUS. J. (Jan. 25, 2013) (“Hundreds of patent lawsuits … lead back to one South Florida-based inventor, Martin Kelly Jones, and a company associated with him, ArrivalStar S.A.”), http://www.bizjournals.com/southflorida/print-edition/2013/01/25/delray-beach-inventor-files-hundreds.html.
50 See, e.g., Allison, Lemley & Walker, supra note 21, at 5 and Allison, Lemley & Walker, supra note 3, generally (considering the 106 most litigated patents, and comparing to 106 random patents, but not comparing litigation results to those random patents).

A Generation of Patent Litigation
16
Picking a proportional number of cases filed in a given year appears preferable, because the goal of the study is to compare patents and litigation outcomes, and those might be dependent on the year. For example, choosing a disproportionate number of cases from 1989 (when there were few NPE cases) would yield a biased match in testing whether a particular technology was asserted at the same rates; a group with too many early patents would appear to have much more technology from the 1980s. It would be better to match the rate of case filings by year, and then compare technologies between groups.
But strict case proportionality has its own problems. Selecting 900 random cases distributed between 1985 and 2009 is also inappropriate. While the control set would be random, it would only include one case per patent, and ignore all of the other cases in which the patent might be asserted. Limiting cases to one per patent would not reflect the realities of patent litigation, nor provide an adequate comparison for repeat assertion, an important aspect of patent litigation. The random set must contain as many cases asserting a patent as can be found.
Matching on 350 patents, and then finding the cases in which they were asserted would also be insufficient. The preferred criteria to match would be the earliest priority date, the grant date, or maybe the application date. But each of these would also be divorced from the date of litigation, because patents are often held for years—and asserted in lawsuits at highly varying times.51 Indeed, measuring the age of patents in litigation is a goal of this study,52 so matching patents by age would not allow for a comparison.
Thus, the hybrid method, which begins with cases distributed by year, but then also finds all the other litigation associated with the patents in those cases, is a useful compromise to glean full knowledge from the data.
4. NPEs in the Matching Set
With some exceptions discussed below, litigation by any NPE plaintiff (including those studied here) was discarded from the random cases identified.53 Because individuals have always been a measurable portion of patent plaintiffs,54 we retained individual inventors55 and individual inventor companies.56
51 Cf. Miller, supra note 7, at 21 (matching patents to estimate likelihood that a random
patent would be adjudicated, but also counting other assertions of the patents). 52 This is discussed in Part II. 53 Not surprisingly, this became more common for later litigation years. 54 Ball & Kesan, supra note 5, at 31; Cotropia, Kesan & Schwartz, supra note 8, at 16. 55 A couple patents wound up in both sets: first asserted by an individual, then

A Generation of Patent Litigation
We also retained three companies that may be controversial. First, we retained Network Signatures. This company might be controversial because both RPX57 and Feldman, et al.,58 list it as one of their top 10 most litigious NPEs. Network Signatures may well be an NPE now, but at the time of its first lawsuits that are part of our study it was providing a service. Archived versions of its website show that it offered a beta test of a virtual private networking portal,59 released an iPhone app,60 and hired a public relations firm to aid it in selling services to business customers.61 Other researchers examining the evidence independently came to the same conclusion.62 There were no rulings on the merits in any of these cases.
Second, we encountered US Ethernet LLC, which is an LLC that enforces 3Com’s patents. The difficulty is that 3Com asserted these very same patents earlier (quite successfully). We included all patents and outcomes originally assigned to 3Com, but excluded patents issued directly to US Ethernet, on the theory that ownership by an NPE might somehow change the characteristics and assertion of such patents. There was only one case brought by US Ethernet, involving four patents, and no judgment on the merits.
Third, Card Activation Technologies actively asserted a single patent assigned to it and had no other business. However, we treated this plaintiff as a licensing arm of a public company. Medcom USA, a product company, acquired the patent through the acquisition of the original assignee, another product company, and then spun out Card Activation Technologies to manage a single patent.63 When the patent was eventually
assigned to Nike, and finally asserted by Plutus/IP Nav. Cases like this are a key reason why individuals were not excluded—there is often a fine line between the individual and the manufacturer.
56 For example, we retained Barry J. Fiala, Inc., which also appears to have been a practicing entity at the time of litigation.
57 RPX CORP., 2012 NPE ACTIVITY REPORT, at 30 (2013), available at http://patentlyo.com/media/docs/2013/07/0BF995E82CFF591EE80EFE8AC69259E7.pdf
58 Jeruss, supra note 19, at 382 59 https://web.archive.org/web/20080222024502/http://vpn.networksignatures.com/. 60 https://web.archive.org/web/20110208005402/http://vpn.networksignatures.com/. 61 Network Signatures Retains CrowdGather for Online Marketing (Aug. 17, 2009),
http://www.socialmediaportal.com/PressReleases/2009/08/Network-Signatures-Retains-CrowdGather-for-Online-Marketing.aspx (last visited July 19, 2014).
62 Christopher Cotropia, Jay P. Kesan & David L. Schwartz, 2010 Patent Holder and Litigation Dataset (last updated May 28, 2014), available at http://www.npedata.com.
63 MedCom USA, Inc. Has Organized and Named its New Subsidiary Company, Card Activation Technologies, Inc. (Sep. 11, 2006),

A Generation of Patent Litigation
18
invalidated, the company ceased operations.64 The regressions in this paper were re-estimated with these parties excluded, and the results did not meaningfully change.
C. Litigation Identification and Data
We identified litigations based both on entity name and on patents asserted.65 Party name searching was impractical for finding other case in our matching set; there may have been many patents owned by a plaintiff that were not litigated, and there may have been other litigation by the same plaintiff that did not involve the patents from the original case. When we searched, we identified cases by patent number only using Westlaw docket reports, Lex Machina, Federal Circuit appellate opinions, the U.S. PTO, Derwent/Litalert, and Lexis databases of patent litigation notices,66 and even Google. We found mistakes and typos in many of the databases (and even some of the source documents filed by the parties themselves!).
We also kept track of transferred cases to ensure that there was no double counting.67 This differentiates this study from many other “patent count” studies that do not do so, or simply drop transferred cases.68
The litigation data was coded to include case name, location, filing date, and number of parties.69 We also gathered data about duration and outcomes of litigation.70
http://www.medcomusa.com/pages/displaynews.asp?id=52. 64 Card Activation Advises No Further Enforcement Activities Can Be Taken
Concerning its Patent (Dec. 18, 2012), http://www.cardactivationtech.com/news_detail.php?news_id=144.
65 Patent Troll Myths describes our methodology for finding NPE litigation data. Risch, supra note 9, at 469-70.
66 35 U.S.C. § 290 (2010) requires district court clerks to notify the PTO when any patent litigation is initiated.
67 We noted the source and destination case numbers, such that movement of cases might be studied in the future.
68 See, e.g., Feldman, supra note 6, at 60 (listing transfer and consolidation as the third and fourth most common case termination events, but deducting them rather than tracing them); Haus & Juranek, supra note 18, at 8 (dropping transferred and consolidated cases, more than 25% of cases).
69 Defendant names were not recorded with precision; some cases had more than 100 defendants. Additionally, we kept track of whether the NPE had filed the case or was a declaratory relief defendant.
70 Case dispositions change on a daily basis, though this study allowed sufficient time to let most cases resolve. Other studies have also tracked outcomes. Ball & Kesan, supra note 5; Allison, Lemley & Walker, supra note 3; Chien, supra note 20, at 1605-06;

A Generation of Patent Litigation
D. Patent Identification and Data
The next phase of the study identified the patents at issue in each of the litigation cases identified. The ten NPEs were involved in 917 unique litigations, which were consolidated into 760 final actions (82% of the total). These litigations involved 352 patents. In turn, the 352 patents resulted from 176 initial patent applications, many of which spawned multiple patents (the max was 41 patents from one application).
The matching litigation involved 1313 unique cases, which were consolidated into 1185 final actions (90% of the total). The litigations involved 792 patents stemming from 536 applications (the max was 9 from one application).
To find the asserted patents, we read the Complaints, Answers, motions, and other documents accessible in docketing databases. We also (again) searched the U.S. PTO, Lexis, and Derwent/Litalert databases of litigation notices. As described above, we used patents discovered in each case to identify additional litigation to include in the database. Thus, litigation and patent identification was symbiotic: litigation led us to patents and patents led us to other litigation.
Many litigated cases involved multiple patents, emphasizing the repeated use of a relatively small number of inventions. The average number of litigations for each NPE patent was 8.58 and for each NonNPE patent was 3.23. The average number of NPE patents per litigation was 3.35, and the average number of NonNPE patents per case was 1.96. However, the number of patents per case was highly variable, with comparable means between the parties for most years, except two during which there were significant outliers among the NPEs that skew the average.
Shrestha, supra note 23, at 114; Miller, supra note 7.

A Generation of Patent Litigation
20
NonNPE NPE
Year Mean Patents/Case StdDev Median Mean
Patents/Case StdDev Median
<1995 1.06 0.44 1 1.18 0.85 1 1995 1.17 0.39 1 1.50 1.45 1 1996 1.14 0.38 1 2.11 1.69 1 1997 1.19 0.54 1 3.87 5.94 1 1998 1.87 0.87 2 1.44 1.04 1 1999 2.06 1.53 1 2.29 3.29 1 2000 2.44 0.80 3 1.63 1.28 1 2001 2.60 3.11 2 2.97 3.43 2 2002 1.69 1.75 1 2.15 1.22 2 2003 2.24 1.58 2 3.02 2.66 2 2004 2.15 1.91 1 2.75 2.18 2 2005 1.39 0.89 1 2.87 2.80 2 2006 2.07 2.49 1 5.66 7.76 2 2007 2.08 1.43 2 5.13 7.59 2 2008 1.75 1.20 1 2.16 1.49 2 2009 2.12 1.88 1 2.25 2.50 1 Total 1.96 1.73 1 3.35 4.92 2
This phase revealed a limitation of the study; prior to the introduction of
electronic court filing in the late 1990’s, Pacer did not contain litigation documents. Indeed, because complaints were always filed in paper form to open a case, many districts did not make complaints available online until approximately 2002 even if they had adopted electronic filing rules. As a result, there are a few cases with missing patents in the 2000’s,71 and several cases filed prior to 1999 that are missing patent data.
Given that we searched by name for NPEs only, it is not surprising that the NPE data includes more missing patent numbers. While finding cases by name revealed cases with missing patent data, if we started with the patent data then our work was already done once we found a case.72 Even
71 Many gaps were filled using litigation notices, but not all court clerks follow the
statute in every case. 72 This is not entirely so. There were many errors in reporting cases by patent data due
to typos, machine coding errors, and linking of extraneously name (but not asserted) patent numbers. This study is differentiated from many others because we verified each case by reading court documents where possible rather than relying on data reported by a service.

A Generation of Patent Litigation
with gaps, we were remarkably successful at identifying patents at issue. We missed patent data for 45 NPE cases and 19 nonNPE cases, almost all before 2000.73
We were able to obtain outcome information for virtually all of these missing cases, and none included a judgment on the merits of an unknown patent. Further, because NPEs typically litigated the same patents multiple times, it is likely that many of the cases for which data is unavailable involved the same patents already included in the study.74
Patent data included the patent number, patent filing and issue dates, technology classifications, total number of claims, inventors and assignees, and number of continuations.75 We also determined the earliest claimed priority date for each patent. Patent citation data was gathered, including references cited (backward cites) and citing patents (forward cites).76 Finally, we obtained data on entity size, assignment/conveyance history, and reexamination outcomes.
E. Patent Initial Assignee Data
After gathering all litigation and patent data, we gathered data about the parties that obtained each patent – the initial assignees. Inventors must always apply for patents in their own names. They can, however, assign their patent to a company or another person at any time. If they do so before a deadline set by the PTO, that assignee is shown on the face of the patent, and is called an “initial assignee.” This study includes data about inventors and initial assignees. Some patents may have been assigned to others
73 Rates Technology was the plaintiff in 28 of the 45 cases, many of which dated back
to the late 1980s and early 1990s. 74Also, given that many commentators associate the rise of particular NPE behavior
with the 2000’s, a data set covering post-1999 activity will still provide useful information. Of course, there might be a difference in the types of patents litigated now than litigated before 2003. However, most of the patents litigated after 2003 issued before 2003 and were certainly applied for before 2003, such that this is a minor concern. Future studies might obtain paper court filings to determine the patents at issue in pre-1999 cases.
75 No distinction was made between continuations and continuations-in-part, and divisionals were not recorded.
76 Forward citations were adjusted in two ways: average per year, and by normalizing by the average number of forward citations received in the same grant year. See Bronwyn H. Hall, Adam B. Jaffe & Manuel Trajtenberg, The NBER Patent-Citations Data File: Lessons, Insights, and Methodological Tools, PATENTS, CITATIONS, & INNOVATIONS 403, 434–41 (Adam B. Jaffe & Manuel Trajtenberg eds., 2002). The latter method captures year effects for citations.

A Generation of Patent Litigation
22
shortly after their issuance, but such conveyances are not considered initial assignments here.
We collected information about the initial assignees of patents. First, we gathered objective data available in Hoovers and in Dun & Bradstreet’s Million Dollar Database. Objective data includes founding date, number of employees, revenues, and industry codes. Data was not available for all companies for all fields. Some fields, such as number of employees, were sufficiently rare that only their descriptive statistics could be reported, but they could not reliably be used for regressions.77
Second, we gathered publicly available information about assignees from a variety of sources, including the SEC, press releases, financial web sites, and Wharton’s WRDS database. This data includes date of initial public offering, market value at the time of patent filing and grant, and various dummy variables relating to the relationship of the company’s public status and the patent.
Third, we gathered venture investment data using Thomson’s VentureXpert database. The VentureXpert data included the number of investment rounds, the amount invested, the date of first investment, and public offering/acquisition data. Thomson tracks millions of venture backed companies and virtually all of the largest venture funds, such that most venture-backed companies would appear in the database.78 Thus, the analysis here assumes that absence from that database indicates no venture funding for the company. This, of course, may not be true, and potential missing venture funding information is a limitation of the data.
Fourth, we gathered whatever subjective and objective data we could from other sources, including the world-wide-web. This includes press releases, company name changes, self-reported revenues and employee counts, industry focus, and mergers and acquisitions. Much of the data collected during this phase will be more relevant to Part II of this article relating to innovation and markets.
77 For a variety of reasons, one would expect missing data in Dun & Bradstreet to
disproportionately relate to non-operating companies. 78 There is no reason to believe that there is a selection bias, though it is theoretically
possible that the types of venture capital companies that would invest in the types of assignees here are the same types that would be excluded from VentureXpert. See Ronald J. Mann & Thomas W. Sager, Patents, Venture Capital, and Software Startups, 36 RES. POL. 193, 195 (2007), for further discussion of VentureXpert.

A Generation of Patent Litigation
III. ANALYSIS AND POLICY IMPLICATIONS
This section analyzes the data, primarily by comparing NPEs with nonNPEs. Because so many diverse areas are being considered, each section subsection contains two parts: an analysis of the data, and the primary policy considerations associated with the results.
A. Case Complexity
The first area of consideration is case complexity, which the Article considers by defendant count and case transfers.
1. The Data
The summary table in Part II(A) above shows defendant counts by year. The median litigation for each group involved one defendant. Surprisingly, the nonNPE group had more years with a median of two defendants than the NPE group did. However, the skew in the data is unmistakable. Beginning in 2006, the standard deviations in the NPE group begins to grow much larger, reflecting the growth in mass patent litigation.79 In short, run-of-the-mill litigation involved few defendants, but more and more cases (though far less than half) included many more defendants.
Cases that are transferred also increase complexity, especially those that consolidate multiple cases into one (which essentially turns any litigation into a mass litigation). The following table shows the number of cases transferred to other districts or consolidated with other cases (including Multi-District Litigation).80
79 One year for the nonNPEs includes a large standard deviation, but that is driven by a
single outlier. 80 Multi-District Litigation, or MDL, consolidates cases for pretrial activities, but then
returns the case to the original court for trial. 28 U.S.C. §1407. In our set, only one initial filing was returned for trial, and it settled shortly thereafter. Thus, consolidation to an MDL is, for most purposes, a consolidation.
A Generation of Patent Litigation
24
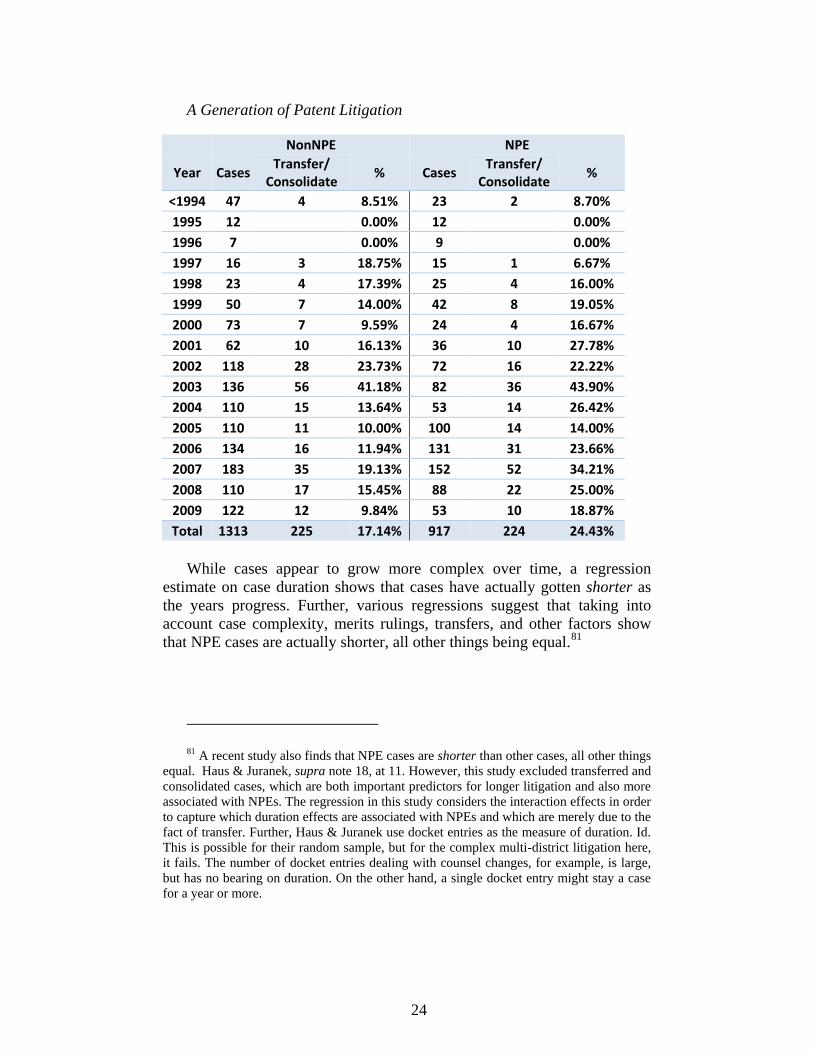
NonNPE NPE
Year Cases Transfer/ Consolidate % Cases Transfer/
Consolidate %
<1994 47 4 8.51% 23 2 8.70% 1995 12 0.00% 12 0.00% 1996 7 0.00% 9 0.00% 1997 16 3 18.75% 15 1 6.67% 1998 23 4 17.39% 25 4 16.00% 1999 50 7 14.00% 42 8 19.05% 2000 73 7 9.59% 24 4 16.67% 2001 62 10 16.13% 36 10 27.78% 2002 118 28 23.73% 72 16 22.22% 2003 136 56 41.18% 82 36 43.90% 2004 110 15 13.64% 53 14 26.42% 2005 110 11 10.00% 100 14 14.00% 2006 134 16 11.94% 131 31 23.66% 2007 183 35 19.13% 152 52 34.21% 2008 110 17 15.45% 88 22 25.00% 2009 122 12 9.84% 53 10 18.87% Total 1313 225 17.14% 917 224 24.43%
While cases appear to grow more complex over time, a regression
estimate on case duration shows that cases have actually gotten shorter as the years progress. Further, various regressions suggest that taking into account case complexity, merits rulings, transfers, and other factors show that NPE cases are actually shorter, all other things being equal.81
81 A recent study also finds that NPE cases are shorter than other cases, all other things
equal. Haus & Juranek, supra note 18, at 11. However, this study excluded transferred and consolidated cases, which are both important predictors for longer litigation and also more associated with NPEs. The regression in this study considers the interaction effects in order to capture which duration effects are associated with NPEs and which are merely due to the fact of transfer. Further, Haus & Juranek use docket entries as the measure of duration. Id. This is possible for their random sample, but for the complex multi-district litigation here, it fails. The number of docket entries dealing with counsel changes, for example, is large, but has no bearing on duration. On the other hand, a single docket entry might stay a case for a year or more.

A Generation of Patent Litigation
The following model tests the various effects on duration: Log(duration) = α + ∑βixi + ε where duration is number of days between
filing and final judgment,82 α is the estimated intercept, βi are coefficients, xi are independent variables, and ε is error.
The following table shows the results of four ordinary least squares regressions with the following factors that one would expect might increase case complexity or otherwise affect the length of a case:
(1) NPE -- 0 for nonNPE, 1 for NPE Dec. Relief – 1 if the case was filed for declaratory relief only Xfer/Consol – 1 if the case was transferred to another district or
consolidated with another case NPExXfer – an interaction dummy variable, because NPE cases are
transferred disproportionately. Stayed – 1 if the case was stayed Appeal – 1 if a judgment was appealed AnyMerits – 1 if the court issued a merits ending ruling on
invalidity, infringement, or unenforceability83 NumPatents – the number of patents at issue in the case NumDefs – the number of defendants sued in the case Logclaims – The logarithm of the number of claims in the patent Yearfiled – the year the case was initiated
(2) Same regression as (1), but with district court effects included. Every district was included in the regression, but only those that were statistically significant are included.84
(3) Same as regression (2), but with Xfer and Anymerit interaction effects removed as test of robustness
(4) Same as regression (3), but with NPExDistrict interaction effects, because NPEs choose some districts disproportionately.
82 Open cases were given an arbitrarily late date (12/31/2013) rather than excluded.
Because some patents were terminated from cases at different times, each patent is a data point, but given an importance weighting based on the number of patents in the case. Thus, a one patent case would get full weight, and the durations of each patent in a four patent case would get a ¼ weight each.
83 Only rulings that would dispose of a patent issue are included. A denial of summary judgment is not included, because that would not shorten the case.
84 Not surprisingly, the significant districts were those with the most volume of cases.

A Generation of Patent Litigation
26
(1) (2) (3) (4)
log duration
log duration
log duration
log duration
NPE=1 0.727*** 0.705*** 0.727*** 0.988 (0.000) (0.000) (0.000) (0.918) Dec. Relief=1 0.892 0.832* 0.828* 0.798* (0.194) (0.045) (0.040) (0.015) Xfer/Consol=1 2.070*** 1.924*** 1.920*** 1.829*** (0.000) (0.000) (0.000) (0.000) NPE=1 X Xfer=1 0.906 0.970 (0.397) (0.804) Stayed=1 2.942*** 2.900*** 2.884*** 2.809*** (0.000) (0.000) (0.000) (0.000) Appeal=1 2.125*** 2.140*** 2.187*** 2.189*** (0.000) (0.000) (0.000) (0.000) AnyMerits=1 2.111*** 1.923*** 2.222*** 2.069*** (0.000) (0.000) (0.000) (0.000) NPE=1 X AnyMerits=1 1.224 1.377*
(0.177) (0.037) NumPatents 1.025*** 1.018* 1.018* 1.017* (0.001) (0.015) (0.014) (0.026) NumDefs 1.011*** 1.010*** 1.010*** 1.010*** (0.000) (0.000) (0.000) (0.000) Logclaims 0.971 0.969 0.968 0.982 (0.189) (0.172) (0.154) (0.448) Yearfiled 0.986* 0.980** 0.980** 0.981** (0.023) (0.002) (0.003) (0.004) D. Del.85 1.463** 1.451** 1.852*** (0.007) (0.009) (0.000) E.D. Tex. 1.378*** 1.352** 1.412* (0.001) (0.002) (0.027)
85 The Central District of California was the first listed (in alphabetical order), such
that it does not appear. It is the baseline district, from which all other districts differ.

A Generation of Patent Litigation
N.D. Cal. 1.410** 1.406** 1.638** (0.005) (0.006) (0.004) NPE=1XD. Del. 0.508* (0.023) NPE=1XE.D. Tex. 0.809 (0.293) NPE=1XN.D. Cal. 0.696 (0.135) Observations (weighted) 2052 2052 2052 2052
Adjusted R2 0.283 0.299 0.298 0.316 Exponentiated coefficients;86 p-values in parentheses * p < 0.05, ** p < 0.01, *** p < 0.001
The regression suggests that many of the things that one might expect
lengthen (or shorten) duration, such as whether a case is transferred, stayed, or appealed. Interestingly, when courts rule on the merits, cases tend to be longer,87 probably because of the briefing time, potential appeals, and lack of settlement. Furthermore, factors that increase complexity, such as number of defendants and number of patents increase duration, though the number of patent claims has no statistically significant effect. Surprisingly, cases initiated each passing year are shorter on average.
Given all other factors held equal, NPE cases tend to be shorter – much shorter – than nonNPE cases. Even transferred NPE cases are shorter than transferred nonNPE cases on average, though not enough to be statistically significant. Of course, not all factors are equal: NPEs are 40% more likely to file a case that is eventually transferred, which means that NPE cases may well be longer because NPEs select improper venues. The inferences from this are ambiguous, though. First, if NPE cases that are transferred are longer, then this implies that NPEs simply go away if they lose their choice of venue.88 Second, the NPE cases are so much shorter that even the
86 Exponentiated coefficients in a log-linear regression can be read as a percentage
change in the non-transformed dependent variable. For each unit the independent variable changes, the duration increases or decreases by the amount above/below one. Thus, a coefficient below one implies a decrease in duration.
87 But see Christina L. Boyd & David A. Hoffman, Litigating Toward Settlement, 29 J. LAW, ECON., & ORG. 898, 919 (2013) (finding that motions shorten duration).
88 Of course, some NPEs may do that, but not the most litigious.

A Generation of Patent Litigation
28
average duration including transfers (662 days) is only 6% longer than average nonNPE durations not including transfers (622 days).
Duration is likely affected by districts. Caseload and patent data by judge was not available for the entire length of the data, especially given transferred and consolidated cases.89 Thus, district effects were modeled by including both district location (regression 3) and a district/NPE interaction dummy (regression 4), because NPEs were more likely to choose certain districts. While only 3 districts were statistically significant, district selection as a whole was significant to the estimate. Each of the significant districts coefficients was about 35%-40% longer duration than the Central District of California, the baseline here.90 It is important to note, though, that these are the initial districts. The final district may be different, and this effect is captured in the transfer/consolidation factor.
However, a curious thing happens when district/NPE interactions are included. The coefficient on NPE becomes statistically indistinguishable from 1 (meaning no effect). The interaction factors, however, are virtually all, less than one, and many less than 0.5.91 Rather than imply that the other regressions are not robust, this implies that duration is highly variable by district, but in most districts the duration for NPEs is much lower than for nonNPEs.
2. Policy Implications
a. Venue and Filing Rules
The America Invents Act in 2011 required that each defendant be sued in a separate case.92 The data here implies that the separate case requirement was warranted, but only affected particular patent plaintiffs. In that sense, it was targeted not just at patent trolls, but at very particular patent trolls.
Separate case filing, along with more stringent venue rules,93 affected 89 Cf. Haus & Juranek, supra note 18, at 12 (using caseload and patent propensity to
isolate judge based effects on duration). 90 Accord Mark A. Lemley, Where to File Your Patent Case, 38 AIPLA Q. J. 401,
414-15 (2010) (showing C.D. Cal. with relatively short time to resolution, in part due to early disposition of cases).
91 This includes unreported districts. While most were not individually statistically significant, as a group they add explanatory power.
92 35 U.S.C.A. §299. 93 In re TS Tech USA Corp., 551 F.3d 1315, 1318 (Fed. Cir. 2008) (applying 5th
Circuit precedent and reversing district court to transfer case out of E.D. Tex.); Efrén Garcia, Effects of In re TS Tech USA Corp. on Patent Cases in the E.D. Texas at 29 (2010)

A Generation of Patent Litigation
everyone. While NPE cases were more likely to be transferred and/or consolidated with others, nonNPEs filed plenty of cases—including 16% of declaratory judgment cases filed by nonNPEs against competitors and NPEs alike—that were later transferred or consolidated.94 Obtaining an improper venue advantage is not a purely NPE pursuit. Though more cases were transferred as time passed, they were never more than a minority of all cases.
b. The Rise of the Eastern District of Texas
The following table shows the initial choice of venue over time in four popular districts: Central District of California, District of Delaware, Eastern District of Texas, and the Northern District of California. These are the venues in which cases were filed, and not the final venue; many cases may have been transferred in or out of districts after filing.
(showing increased number of granted transfer motions), available at https://www.utexas.edu/law/journals/tiplj/documents/symposia/2010/Slides/Efren%20Garcia%20-%20Effects%20of%20In%20re%20TS%20Tech.pdf.
94 Theoretically, filing against many defendants would lower the number of transfers because only one defendant venue need be proper. In reality, this likely had little effect. Many high defendant cases were transferred or consolidated.

A Generation of Patent Litigation
30
NonNPE NPE
Year C.D. Cal.
D. Del.
E.D. Tex.
N.D. Cal.
C.D. Cal.
D. Del.
E.D. Tex.
N.D. Cal.
<1995 4.26% 2.13% 0.00% 2.13% 13.04% 8.70% 0.00% 8.70% 1995 8.33% 8.33% 0.00% 8.33% 0.00% 0.00% 0.00% 8.33% 1996 0.00% 0.00% 0.00% 14.29% 0.00% 0.00% 0.00% 22.22% 1997 6.25% 0.00% 0.00% 0.00% 13.33% 0.00% 0.00% 6.67% 1998 16.67% 4.17% 0.00% 8.33% 0.00% 4.00% 0.00% 20.00% 1999 6.00% 2.00% 0.00% 6.00% 9.52% 2.38% 0.00% 14.29% 2000 27.40% 1.37% 0.00% 5.48% 4.17% 4.17% 0.00% 8.33% 2001 11.48% 1.64% 1.64% 4.92% 11.11% 0.00% 0.00% 8.33% 2002 6.72% 1.68% 0.84% 2.52% 38.89% 0.00% 1.39% 6.94% 2003 16.18% 1.47% 0.00% 2.94% 40.24% 0.00% 0.00% 4.88% 2004 13.64% 2.73% 0.00% 6.36% 9.62% 3.85% 7.69% 11.54% 2005 20.91% 3.64% 7.27% 2.73% 12.00% 1.00% 6.00% 8.00% 2006 17.91% 5.97% 8.96% 0.75% 6.11% 6.11% 30.53% 3.05% 2007 9.34% 3.85% 8.24% 1.65% 4.58% 5.23% 37.25% 3.27% 2008 13.51% 1.80% 3.60% 3.60% 7.95% 2.27% 25.00% 4.55% 2009 15.70% 4.96% 9.09% 1.65% 18.87% 0.00% 18.87% 3.77%
Grand Total 13.79% 3.05% 3.96% 3.20% 13.52% 2.84% 15.27% 6.54%
The growth in plaintiffs using the Eastern District of Texas is
unmistakable. But there are a few interesting data points to note. First, the choice of that district is relatively new, with no selection among these NPEs before 2002, and no widespread adoption until 2004. It is likely that other NPEs filed in the Eastern District with positive results, and these plaintiffs followed suit. Second, despite being considered a haven for NPE plaintiffs, only about 15% of all cases were filed there, even in 2009, though the percentages were higher in the three preceding years. Third, the number of NPEs filing in the Northern District of California is surprising, given that cases filed in that district are less likely to be successful.95 Fourth, the Eastern District is not just for NPEs anymore. While the percentage of cases filed is not as high, nonNPEs filed a substantial number of cases in the E.D. Tex.
95 Lemley, supra note 90, at 409-411(showing below average win rates and likelihood
of trial in N.D. Cal.); PwC 2014, supra note 7, at 18 (showing that NPEs win only 13% of their cases in N.D. Cal., but 46% of their cases in E.D. Tex.).
A Generation of Patent Litigation
Finally, despite the continued popularity of the Eastern District of Texas, since the passage of the America Invents Act Delaware is now the most popular place to file a patent claim.96 This growth may seem surprising given the percentages above. The anti-joinder provisions were intended to stem the tide of litigation, but have not done so. This implies that patent plaintiffs will merely adapt to procedural restrictions.
c. Case Management
A third lesson to draw from the data concerns case management. For example, as courts have taken a more active role in more recent years, the cases have actually grown shorter.
However, the AIA was responsible for a large increase in the number of patent cases filed.97 Based on history, it is unclear what effect this will have. Both the NPE and the nonNPE data sets included sets of litigation that were consolidated into multi-district litigation cases for all purposes other than trial. This had the practical effect of including many defendants together as if they had been sued at the same time. To the extent that post-AIA cases are consolidated, they may look very similar to pre-AIA cases.
However, many consolidated cases were only for pretrial actions, and when those pretrial proceedings were completed, cases were to be sent back to their original districts. This “separate case, but consolidated pretrial” preserves the separate right to a trial for each defendant, but it creates other problems. First, pretrial proceedings still require coordination, and some defendants may not want to be consolidated even for pretrial. Second, multi-district litigation costs more than other cases with many defendants, because defendants must find counsel to defend them in two different districts: one district for pretrial and, if the case should go that far, the original district for trial.98
96 James C. Pistorino & Susan J. Crane, 2011 Trends in Patent Case Filings: Eastern
District of Texas Continues to Lead Until America Invents Act is Signed 12-13 (2012), available at http://www.perkinscoie.com/files/upload/PL_12_03PistorinoArticle.pdf.
97 GAO, supra note 18, at 14-15. 98 Plaintiff costs can also rise. Remand from multi-district proceedings gives
defendants another opportunity to seek delay or otherwise avoid a trial with a new judge unfamiliar with the case history. For example, in Ronald A. Katz Tech. Lic. LLC v. Comcast et al. (D. Del. 1:07-cv-00361-GMS), Defendant Geico objected to remand, but its argument that more summary judgment challenges should be allowed in multi-district litigation was rejected. Conditional Remand Order (Feb. 14, 2013, Docket Entry 48). Geico nonetheless moved for another stay pending reexamination of the patent, and also argued that further claim construction was necessary. Joint Statement (June 28, 2013, Docket

A Generation of Patent Litigation
32
Given the costs of consolidation, efficient case management probably dictates the current rule: filing separate cases against unrelated defendants. At the very least, each defendant will have an opportunity to argue non-infringement based on different product configurations. Further, cases may be resolved more simply. The number of docket entries seemed to grow exponentially99 with consolidated cases, even as defendants settled out. Given that most cases settle before trial, bringing separate cases seems like a good use of judicial resources.
However, there is a cost to requiring non-consolidation. First, there is a likelihood of many more claim construction hearings – and conflicting ones at that – especially as patent reform proposals seek to hold discovery until after claim construction.100 Courts will be faced with patentee arguments (with debate about the estoppel effect of any non-final construction in another case), defendant arguments, and orders from other cases, if any. All of this is supposed to be done with an eye toward determining which claim terms are important to the particular litigation heard by the court.101 This is a potentially costly exercise.
d. Reporting
There is one more problem caused by cases with many defendants: they are much harder to study. This consideration is relatively minor in the scheme of things; the courts should not be organized to make it easier for professors and the media to find out who won which case and how. Even so, consolidation has a significant impact on how data is reported.
Quite often, a consolidated case with hundreds of defendants will lead to settlements with defendants over a period of time on varying terms; in some cases the defendant will pay, and in others the plaintiff will be convinced there is no infringement. But the final challenge is often only by a single defendant. The final judgment of the case—and more importantly
Entry 61). 99 Eugene Volokh, Careful With Those Scientific Allusions, VOLOKH CONSPIRACY
(Jan. 5, 2008 2:00pm) (“’Exponential increases’ does communicate ‘large increases,’ in a way I have to grudgingly accept (down, math pedant self, down!).”
100 Patent Progress’s Guide to Patent Reform Legislation, PATENT PROGRESS http://www.patentprogress.org/patent-progresss-guide-patent-reform-legislation/ (last visited July 20, 2014).
101 Jeffrey Steck, Construing Claims “Without Reference to the Accused Device” Is Put to the Test, PATENTLY-O (March 23, 2006) (“[T]he Federal Circuit has sent the message that a district court’s claim construction must include some analysis of the accused products.”), http://patentlyo.com/patent/2006/03/construing_clai.html.

A Generation of Patent Litigation
the media—will usually reflect only the final merits outcome of a single defendant, despite a long history of other outcomes associated with each of the other defendants.
Those who believe the patent system is already broken would likely argue that being able to study each of the settlement outcomes adds little value. They might argue that if the patentee loses against the lone holdout, then such a loss proves that all of those earlier settlements must have been due to strongarm tactics or cost of litigation attrition. One problem with attributing a single loss to all prior settlements, though, is that those who believe this system is broken do not make the same assumption about prior settlements when the patentee wins against the final holdout defendant.102 Instead of recognizing that perhaps the patentee had a valid claim and the other parties rationally settled to avoid risk of loss or to receive a discount for settling early, winning patentees are often portrayed as lucky and likely to lose on appeal.103 Thus, complex litigation can mask all of the underlying settlement activity in a case, for better or worse. It would better serve transparency if each case outcome was clearly recorded with respect to each defendant.
B. Non-Merits Outcomes
A longitudinal analysis of asserted, adjudicated, and dismissed litigation provides a broad look into the patent landscape. As others have reported,104 most patent cases end with some sort of settlement or other dismissal. It is
102 See, e.g., Allison, Lemley & Walker, supra note 3, at 687 (listing eight trial wins
among most litigated patents, but not counting prior settlements with other defendants in those cases as wins).
103 Mike Masnick, Insanity Rules in East Texas: Jury Finds Newegg Infringes On Ridiculous Encryption Patent, TECH DIRT (Nov. 26, 2013) (describing TQP win: “It shows how arbitrary jury trials can be, especially when you have jurors who simply don't understand the technology or the history at play.”), http://arstechnica.com/tech-policy/2013/11/jury-newegg-infringes-spangenberg-patent-must-pay-2-3-million/. Of course, sometimes they do lose on appeal. Joe Mullen, How Newegg Crushed the “Shopping Cart” Patent and Saved Online Retail, ARS TECHNICA (Jan. 27, 2013) (describing loss on appeal by Soverain Software), available at http://arstechnica.com/tech-policy/2013/01/how-newegg-crushed-the-shopping-cart-patent-and-saved-online-retail/. But sometimes they win. Kirk Teska, The Story of the BlackBerry Case, IEEE SPECTRUM (Mar. 1, 2006) (describing $450 million settlement after NTP win on appeal), http://spectrum.ieee.org/consumer-electronics/gadgets/the-story-behind-the-blackberry-case/0.
104 Allison, Lemley & Walker, supra note 3; Feldman, supra note 6; Allison, Lemley & Schwartz, supra note 5, at 1777.

A Generation of Patent Litigation
34
difficult to tell which party was favored in each settlement, and we did not try. We did, however, collect information about default judgments, consent judgments, and dismissals that did not appear to be settlements.
The following table lists summary data for outcomes for each initial case. There were, of course, fewer final cases after consolidation. However, tracking outcomes by the initial case allowed the ability to track settlements with some parties that exited consolidated suits while others remained in the suit.
NonNPE NPE Cases 1313 917
N % Total % Resolved N % Total % Resolved Cases Resolved 722 54.99% 100% 501 54.63% 100%
Settled 272 20.72% 37.67% 247 26.94% 49.30% Consent105 236 17.97% 32.69% 63 6.87% 12.57%
Default 19 1.45% 2.63% 16 1.74% 3.19% Injunction 286 21.78% 39.61% 14 1.53% 2.79%
Procedural 46 3.50% 6.37% 68 7.42% 13.57% Validity Ruling 53 4.04% 7.34% 96 10.47% 19.16% Infringe Ruling 92 7.01% 12.74% 119 12.98% 23.75%
Stayed 20 1.52% 2.77% 17 1.85% 3.39% Open 18 1.37% 2.49% 33 3.60% 6.59%
The table first lists settlements and consent judgments, which together
constitute all settlements. It then lists injunctions, most of which were obtained as part of consent or default judgments. Finally, it lists other ways that cases were terminated, such as procedural terminations for lack of personal jurisdiction or, in the case of declaratory relief actions, lack of case or controversy. It then lists cases with a merits ruling, cases that have been stayed, and cases that are open. There is some overlap in these categories, as there might be two types of merit ruling, or there might be a merit ruling but the case is still open on appeal.
Coding case resolution was a necessarily judgment call because reasons for termination were not always clear. We coded for a settlement primarily when the documents in the case, the timing, or the state of the docket made it relatively clear there was a settlement. We surely missed many.
As a result, about 45% of the cases were left in an “other dismissal” category. Most of these were likely settlements of one sort or another,
105 Other than three exceptions, consent judgments were also coded as settlements.
However, they are not included in the settlement tally here.

A Generation of Patent Litigation
though undoubtedly some of the dismissals were to avoid a negative judgment. The normative implications will depend in part on a) whether one views a walkaway as a settlement, and b) one’s guess at how many dismissals were to avoid an invalidity judgment. Note, however, that merit rulings were recorded, so that dismissals to avoid a negative judgment after a summary judgment loss do not affect the merit findings.
When consent judgments are included, nonNPEs settle nearly as often as NPEs. This does not lend too much support to prior studies (and the conventional wisdom) that find that NPEs prefer to settle more often.
However, a look at settlements by patent sheds more light on this question. The following table shows similar statistics, but this time counting patents rather than cases settled.
NonNPE NPE Patents 792 352
N % Total % Resolved N % Total % Resolved Patents Resolved 517 65.28% 100% 274 77.84% 100%
Settled 228 28.79% 44.10% 173 49.15% 63.14% Consent 144 18.18% 27.85% 64 18.18% 23.36% Default 21 2.65% 4.06% 14 3.98% 5.11%
Injunction 119 15.03% 23.02% 12 3.41% 4.38% Procedural 95 11.99% 18.38% 102 28.98% 37.23%
Validity Merits 60 7.58% 11.61% 45 12.78% 16.42% Infringe Merits 105 13.26% 20.31% 61 17.33% 22.26%
Stayed 29 3.66% 5.61% 17 4.83% 6.20% Open 18 2.27% 3.48% 41 11.65% 14.96%
When viewed through the lens of patents, the differences between the two groups becomes stark. While only 54% of the cases in each group had some measurable outcome, a total of 65% and 78% of nonNPE and NPE patents, respectively, had at least one outcome.
More important, the settlement percentages are much more differentiated. Only 29% of nonNPE patents were involved in a settlement and 18% were the subject of a consent judgment.106 For NPE’s, 49% of all patents were part of some settlement, with another 18% in consent judgments. This equates to 44% (nonNPE) and 63% (NPE) of all resolved patents being settled at least once.
106 Unlike the case data, these two counts cannot be combined for patents. Because
patents are asserted in more than one case, there were patents that were settled in one case and subject to a consent judgment in another.

A Generation of Patent Litigation
36
This difference from the case-by-case settlements implies that the NPE propensity to assert patents more often yields more settlements associated with those patents, even if it results in many cases that wind up not looking like a favorable settlement.
Finally, this data challenges the conventional wisdom that 90% or more of cases settle. For these NPEs, at least, procedural dismissals entailed more than 10% of the outcomes, and merits rulings involved at least another 12% of all original cases filed (though, as discussed below, a much, much smaller percentage of final consolidated cases). Thus, no more than 75% of the NPE cases could ever settle, and many of these are disposed of by default judgments and “other” dismissals.107 It is true that very few cases go through to trial, but not all cases are settling.108
C. Invalidity Outcomes
Economists often judge a patent’s quality by the technology breadth it covers.109 This study prefers a more basic metric of patent quality: whether the patent is valid.110 Thus, one of the most important results of this study is a comparison of validity outcomes between NPEs and nonNPEs.
1. The Data
The table below shows the basic data associated with those patents whose validity was adjudged on the merits.
NonNPE NPE Patents 792 352
N % All Patents
% Adjudicated Patents N % All
Patents % Adjudicated
Patents Patents Adjudicated 60 7.58% 100% 45 12.78% 100%
All Claims Valid 28 3.54% 46.67% 4 1.14% 8.89% Any Claim Invalid 12 1.52% 20.00% 17 4.83% 37.78% All Claims Invalid 20 2.53% 33.33% 24 6.82% 53.33%
Total w/any Invalid 32 4.04% 53.33% 41 11.65% 91.11%
107 Accord, Lemley, supra note 95, at 405 (“Not surprisingly, most patent cases
(75.5%) settle.”); Feldman, supra note 6, at 60 (finding that about 75% of cases settle). 108The rate of pre-trial resolution is consistent with all cases, including the growth in
pre-trial challenges in recent years. Gene Quinn, Patent Litigation Statistics: 1980 – 2010, IP WATCHDOG (Aug. 2, 2011), http://www.ipwatchdog.com/2011/08/02/patent-litigation-statistics-1980-2010/id=17995/.
109 See, e.g., Trajtenberg, supra note 3, at 63 (defining generality and originality). 110 A followon paper will consider technology distribution.

A Generation of Patent Litigation
When considered as a percentage of those patents actually adjudicated,
NPE patents look quite poor. When challenged, some or all of the claims are invalided more than 90% of the time. However, only a few patents are ever challenged, so less than 12% of the patents asserted over 25 years were invalidated either partially or completely. Importantly, the many untested patents are not considered invalidated, and live on for another case.
Looking at only invalidated patents reveals just part of the story, however. It turns out that most cases do not involve an invalidated patent. As the next table shows, these challenges took place in even fewer contested cases. The following table summarizes the percentage of final (that is, consolidated) cases in which a merits ruling on invalidity issued.
This table shows that patents are invalidated in only 68.75% of all cases
with an adjudication. This is less than the 91% tally when measured on a per patent basis, which means that the invalidated patents are bunched into a few cases.111 The percentage of adjudicated cases invalidating nonNPE patents remains about the same, presumably because there are fewer patents in such cases, as well as fewer consolidations.
Indeed, invalidated patents tend to group together in just a few cases. One reason for this may be that the patents are related. This is certainly true of invalidity findings in cases brought by Ronald A. Katz Technology Licensing. Allison, Lemley & Walker call these patents the “Katz effect,”
111 But see Allison, Lemley & Schwartz, supra note 5, at 1796 (when multiple patents
were asserted in a case, patentees were more likely to avoid loss).
NonNPE NPE Consolidated Cases 1181 760
Avg. Patents per Adjudicated Case 2.95 3.75
N % All Cases
% Cases w/ Merits Ruling N
% All Cases
% Cases w/ Merits Ruling
Cases Adjudicated 42 3.56% 100% 32 4.21% 100%
All Claims Valid 15 1.27% 35.71% 4 0.53% 12.50% Any Claim Invalid 10 0.85% 23.81% 5 0.66% 15.63% All Claims Invalid 12 1.02% 28.57% 17 2.24% 53.13%
Total w/any Invalid 22 1.86% 52.38% 22 2.89% 68.75%

A Generation of Patent Litigation
38
because the company filed so many cases based on so many patents.112 In this case, Katz had 18 patents partially or completely invalidated in a single ruling in a single case113 – all based on one defective patent application.
Thus, the percentages between nonNPEs and NPEs are much closer than when measured on a per patent basis, which implies that NPE cases involve patents with some invalid claims about 30% more often, even if 70% more of the patents are invalidated if and when a court rules.
Perhaps more important than these comparisons when courts rule is consideration of what happens in all of the cases—the vast majority—where courts do not rule. The NPE invalidated patents were challenged in less than 3% of the cases, which means that only 22 out of 760 filed cases involved a completely invalidated patent.114 The other 738 cases did not result in any kind of merits ruling.
Further, as noted above, many nonNPE patents go unchallenged (or survive challenge) into trial, where they are overwhelmingly upheld and there is no appeal to test the jury’s verdict. This is a marked difference from NPEs, which prefer to settle their cases than go to trial. That is, there are selection effects at play. First, only the weakest patents are likely to be the subject of invalidation rulings; for most patents untested on the merits, summary judgment is denied115 and parties often settle. Second, NPEs are more likely to settle, even if they survive summary judgment challenges. That is, NPEs select into settlement rather than trial. This is not to say that there are no selection effects the other way. Competitors may settle in order to maintain business relationships. Further, nonNPEs are more likely to get an injunction,116 which may change settlement dynamics. Nonetheless, NPE preference for settlement is relatively well documented (including in this article),117 and the data imply that NPE preferences to avoid trial outweigh
112 Allison, Lemley & Walker, supra note 21, at 26. 113 And there had been more, some were partially revived on appeal. In re Katz
Interactive Call Processing Patent Litig., 639 F.3d 1303 (Fed. Cir. 2011). 114 When recalculated by pre-consolidated cases, the percentage is higher: 113 cases
out of 916 resulted in an eventual invalidation of some or all of a patent claim – about 12%. But even this is a relatively small percentage of all cases. The compression of 113 preconsolidation cases down to 22 final cases implies that the preconsolidation cases most likely to involve invalidations are those with many patents or those with the same patents used many times against different defendants. For nonNPE’s, by contrast, 32 preconsolidation cases compress to 22 postconsolidation cases.
115 Allison, Lemley & Schwartz, supra note 5, at 1785 (finding that 70% of invalidity motions for summary judgment were unsuccessful for all cases filed in 2008 and 2009).
116 eBay Inc. v. MercExchange, L.L.C., 547 U.S. 388, 396 (2006) (describing licensing firms as less likely to obtain injunctions).
117 See, e.g., Ball & Kesan, supra note 5 at 20-21 (finding that licensing firms are more

A Generation of Patent Litigation
nonNPE preferences. Whether one considers such settlements a nuisance or not, the fact
remains that many of those patents might be upheld at trial.118 By including trial data in adjudicated merits rulings counts, the percentage reporting deck is stacked against NPEs.
When only judicially examined trial outcomes are at issue, NPEs and NonNPEs are invalidated at nearly identical rates. The following table presents invalidity findings with trial verdicts removed. NonNPE NPE
Patents 769 352
N % All Patents
% Adjudicated Patents N % All
Patents % Adjudicated
Patents Patents Adjudicated 37 4.81% 100% 45 12.78% 100%
Valid/Appealed 4 0.52% 10.81% 4 1.14% 8.89% Any Claim Invalid 12 1.56% 32.43% 17 4.83% 37.78% All Claims Invalid 21 2.73% 56.76% 24 6.82% 53.33%
Total w/any Invalidity 33 4.29% 89.19% 41 11.65% 91.11%
On an absolute basis, the number of patent invalidations is essentially the same as before. This is expected, because the column measures how many patents in the entire population are invalidated, rather than simply counting percentages of those patents that happen to make it to a merits ruling.
The next column makes this clear, and shows how sensitive the reporting is to the number of patents found valid. When patents held “valid” but not tested on appeal are removed, the nonNPE patents don’t make out so well: their invalidation rate is nearly identical to the NPE invalidation rate. In other words, the only reason why nonNPEs look better when challenged is that many of those challenges are before a jury without appeal – an admittedly easier audience.119 When the benefit of the jury is removed (or whether the selection effect is corrected for, depending on your viewpoint) nonNPE patents are invalidated at the same rate as NPE patents among those patents that have a ruling on the merits.
In other words, it could be – though we have no way of actually
likely to settle); Ashtor, supra note 24, at 959 (finding NPEs more likely to settle); Haus & Juranek, supra note 18, at 3 (“[W]e find that NPE cases are settled significantly faster.”).
118 PwC 2014, supra note 7, at 19 (showing that company NPEs from 1995-2013 won 30% of all their cases that reached a definitive merits ruling).
119 PwC 2014, supra note 7, at 8 and 11 (showing differential win rates for judge, jury, and summary judgment);

A Generation of Patent Litigation
40
knowing – that if more NPE cases were tried and then settled without an appeal,120 then the invalidation rates even among those adjudicated patents would match nonNPE rates.
This exercise is not meant to make a statement about the quality of patents so much as the reporting about the quality of patents. After all, NPE patents are still invalidated about three times as often. Instead, the revised table shows that validity findings – which are not really findings at all, given that the next case can invalidate the same patent – are unhelpful in reporting patent quality. Furthermore, listing only those cases in which there is an adjudication, when summary judgment is denied so often, is also misleading.
2. Bases for Invalidity
The following table lists the primary bases for invalidity for each of the two groups. NonNPE NPE Patents w/ Invalidated Claims 32 % 41 %
102(a) 7 21.88% 3 7.32%
102(b) Publication 0 0.00% 7 17.07% 102(b) Use 0 0.00% 2 4.88%
102(b) On Sale 3 9.38% 6 14.63% 103 15 46.88% 9 21.95%
112 Enablement 0 0.00% 2 4.88% 112 Description 1 3.13% 12 29.27%
The numbers are too small to reach any definitive conclusions, but two
results (and a missing result) stick out. First, NPE patents were far more likely to be invalidated for lack of written description.121 However, the result is subject to the Katz effect. Ten of the twelve NPE patents invalidated on description were owned by Katz Technology Licensing, and they were all defective for very similar (if not the same) reasons.
Second, NPE patents were invalidated based on statutory bars 120 Consider Soverain, in which a patent was affirmed as valid by a jury, like so many
nonNPE patents; NewEgg vowed never to settle and appealed to reverse the judgment. Mullen, supra note 103.
121 Written description determines whether the patentee described enough to show that she possessed the full claim scope, not whether the patent taught others to practice the claim. Ariad Pharm., Inc. v. Eli Lilly & Co., 598 F.3d 1336, 1349 (Fed. Cir. 2010).
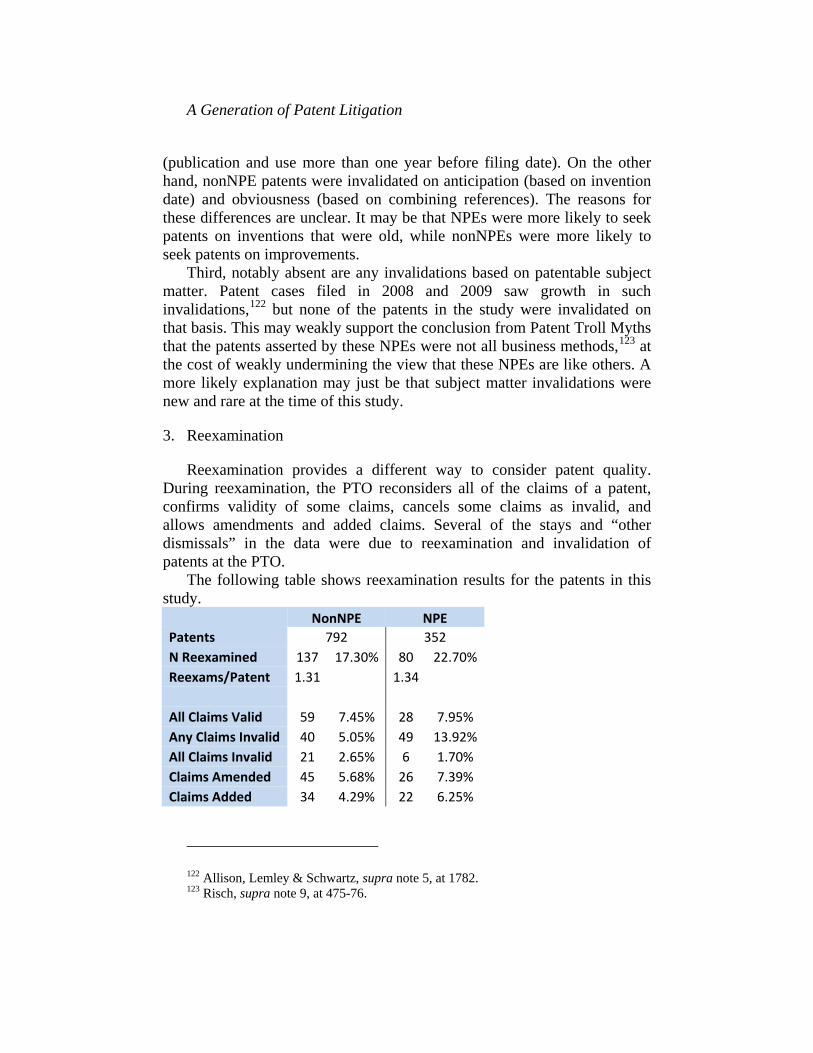
A Generation of Patent Litigation
(publication and use more than one year before filing date). On the other hand, nonNPE patents were invalidated on anticipation (based on invention date) and obviousness (based on combining references). The reasons for these differences are unclear. It may be that NPEs were more likely to seek patents on inventions that were old, while nonNPEs were more likely to seek patents on improvements.
Third, notably absent are any invalidations based on patentable subject matter. Patent cases filed in 2008 and 2009 saw growth in such invalidations,122 but none of the patents in the study were invalidated on that basis. This may weakly support the conclusion from Patent Troll Myths that the patents asserted by these NPEs were not all business methods,123 at the cost of weakly undermining the view that these NPEs are like others. A more likely explanation may just be that subject matter invalidations were new and rare at the time of this study.
3. Reexamination
Reexamination provides a different way to consider patent quality. During reexamination, the PTO reconsiders all of the claims of a patent, confirms validity of some claims, cancels some claims as invalid, and allows amendments and added claims. Several of the stays and “other dismissals” in the data were due to reexamination and invalidation of patents at the PTO.
The following table shows reexamination results for the patents in this study. NonNPE NPE Patents 792 352 N Reexamined 137 17.30% 80 22.70% Reexams/Patent 1.31 1.34 All Claims Valid 59 7.45% 28 7.95% Any Claims Invalid 40 5.05% 49 13.92% All Claims Invalid 21 2.65% 6 1.70% Claims Amended 45 5.68% 26 7.39% Claims Added 34 4.29% 22 6.25%
122 Allison, Lemley & Schwartz, supra note 5, at 1782. 123 Risch, supra note 9, at 475-76.
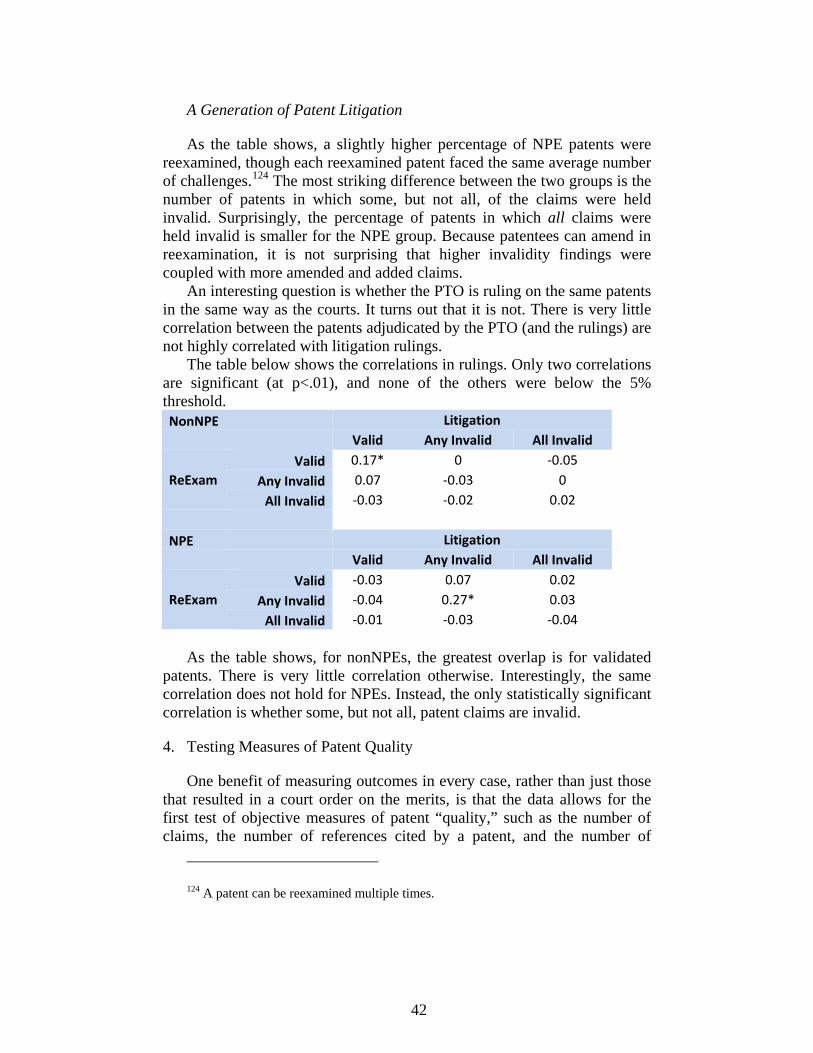
A Generation of Patent Litigation
42
As the table shows, a slightly higher percentage of NPE patents were reexamined, though each reexamined patent faced the same average number of challenges.124 The most striking difference between the two groups is the number of patents in which some, but not all, of the claims were held invalid. Surprisingly, the percentage of patents in which all claims were held invalid is smaller for the NPE group. Because patentees can amend in reexamination, it is not surprising that higher invalidity findings were coupled with more amended and added claims.
An interesting question is whether the PTO is ruling on the same patents in the same way as the courts. It turns out that it is not. There is very little correlation between the patents adjudicated by the PTO (and the rulings) are not highly correlated with litigation rulings.
The table below shows the correlations in rulings. Only two correlations are significant (at p<.01), and none of the others were below the 5% threshold. NonNPE
Litigation
Valid Any Invalid All Invalid
ReExam Valid 0.17* 0 -0.05
Any Invalid 0.07 -0.03 0 All Invalid -0.03 -0.02 0.02
NPE
Litigation
Valid Any Invalid All Invalid
ReExam Valid -0.03 0.07 0.02
Any Invalid -0.04 0.27* 0.03 All Invalid -0.01 -0.03 -0.04
As the table shows, for nonNPEs, the greatest overlap is for validated
patents. There is very little correlation otherwise. Interestingly, the same correlation does not hold for NPEs. Instead, the only statistically significant correlation is whether some, but not all, patent claims are invalid.
4. Testing Measures of Patent Quality
One benefit of measuring outcomes in every case, rather than just those that resulted in a court order on the merits, is that the data allows for the first test of objective measures of patent “quality,” such as the number of claims, the number of references cited by a patent, and the number of
124 A patent can be reexamined multiple times.

A Generation of Patent Litigation
references citing a patent have almost no bearing on whether a court will eventually find the patent invalid. Because so few patents are actually judged on the merits (fewer than 100 out of 1600 in our sample), it is nearly impossible to statistically test whether a patent–once tested on the merits–will be invalidated. However, patents are asserted many times, and most patents are never invalidated at all, either because they go untested or because they survive pre-trial challenges and cases are settled before trial. This allows for a sufficiently large sample to fully test what factors will lead to a likely invalidity finding of a given patent, once asserted.125
The problem is essentially a two-step selection problem: which patents are selected for merit consideration and, once considered, which patents are invalidated. However, estimates using the Heckman selection method revealed something curious: there is no correlation between those two questions. This is not terribly surprising, because most of the factors one would use to test patent quality, such as citations and claims, have no statistically significant basis on outcomes.126
But this is not to say that outcomes are random. Using stepwise regression, I show that selection effects outweigh any measurable patent quality effects in determining which patents are invalidated.
The following table shows five successive logistic regressions.127 They each test for a binary outcome: AnyClaimInvalid, which is 1 if the case held any claim in the patent invalid, and 0 if the case did not. The estimations test whether specific case invalidated one or all of the asserted claims in a patent.
Regression (1) tests whether courts invalidate patents using traditional patent quality metrics (with the existence of NPEs included, given that a primary goal is determining whether NPEs assert weaker patents. The independent variables in estimate (1) include:
NPE: Is the plaintiff one of the most litigious NPEs
125 Miller, supra note 7, attempts to estimate which patents in the general population
would be adjudicated. 126 This study becomes part of the growing body of work that questions the use of such
metrics for patent value. Allison, Lemley & Schwartz, supra note 5, at 1798-99 (finding that patent citations do not affect validity outcomes); David S. Abrams, Ufuk Akcigit & Jilliam Popadak, Patent Value and Citations: Creative Destruction or Strategic Disruption? (Nat’l Bureau of Econ. Research Working Paper Series, No. 19647, 2013) (finding that forward citations have U-shaped correlation with patent license value), available at http://www.nber.org/papers/w19647.
127 For robustness, errors in each regression are clustered by patent number, because identical patents are presumably not independent.

A Generation of Patent Litigation
44
Reexam-AnyClaimInvalid: 1 if the PTO found any claim invalid during a reexamination, 0 otherwise
Reexam-Amended: 1 if the inventor amended a patent claim in reexamination (presumably to avoid invalidity), 0 otherwise
Reexam-Added: 1 if claims were added to the patent in reexamination, 0 otherwise
Log backwardcitations: The logarithm of the number of patents and other references cited by the patent at issue
Log adjusted forward citations: The logarithm of the number of patents that cite to the studied patent, adjusted by yearly cohort
Log pendency: The logarithm of the number of days between the very earliest priority date of the patent and its issuance128
Log claimcount: The logarithm of the number of claims in the patent Yearfiled: The year the case was filed The results of Regression (1) were a bit surprising. It was no surprise
that NPE patents would be much more likely to be invalidated. Indeed, that factor seems to be doing all of the work since the NPE patents are invalidated much more often.129 However, the fact that a patent claim was invalidated in reexamination is not significant, as one would expect. It turns out that the correlation with invalidation in litigation is not high, as the next regression will show. However, adding claims in reexamination is statistically significant and associated with a large (95%) reduction in the likelihood of an invalidity finding. Perhaps this is because such patents with added claims survive more strong than before, or perhaps because the added claims are narrower and more difficult to invalidate.
The only significant patent metric is backward citations, but the direction is surprising. One would think that more citations means that the patent has survived examination despite the PTO being aware of more prior art. Instead, more backward citations are associated with a fairly substantial increase in the odds of invalidation. The implications of this are discussed further below.
Finally, the year the case was filed is not significant. This is a bit surprising, because the conventional wisdom is that asserted patents have
128 As an alternative, the regressions using the number of continuations were also
tested with similar non-significant results. 129 To be clear: this regression is testing invalidity in the original case, and in the
original case, NPE patents are invalidated in whole or part about five times as often. However, because cases are consolidated, that ratio is reduced for final cases. These regressions use original cases because the selection effects can be better tested that way.

A Generation of Patent Litigation
become weaker over time.130 The fact that some cases remain open may not be a sufficient explanation; more cases are open from 2006/2007 than from 2008/2009, and many open cases have invalidity findings in any event.
(1) (2) (3) (4) (5) AnyClaim
Invalid AnyClaim Invalid
AnyClaim Invalid
AnyClaim Invalid
AnyClaim Invalid
NPE 3.466**
(0.004) 1.537 (0.329)
1.581 (0.297)
2.196 (0.073)
Reexam-AnyClaim Invalid
2.169* (0.026)
0.984 (0.980)
Reexam- Amended
1.589 (0.665)
1.622 (0.489)
Reexam- Added 0.0490**
(0.001) 0.0374** (0.004)
0.0463** (0.005)
0.0402** (0.001)
0.0211*** (0.001)
Log backward citations
1.505** (0.004)
1.461 (0.056)
1.464 (0.057)
1.464** (0.009)
1.464** (0.008)
Log adjusted forward citations
1.041 (0.821)
1.065 (0.740)
1.052 (0.786)
1.102 (0.609)
1.139 (0.490)
Log pendency of Patent App
0.938 (0.875)
0.909 (0.787)
0.894 (0.752)
0.815 (0.538)
0.879 (0.698)
Log claimcount 1.073
(0.675) 1.168 (0.409)
1.156 (0.458)
0.994 (0.970)
1.002 (0.992)
yearfiled 0.957
(0.148) 1.045 (0.428)
1.035 (0.527)
0.936 (0.168)
0.939 (0.193)
Rexamined
1.535 (0.158)
1.566* (0.019)
1.556** (0.003)
1.572** (0.004)
Stayed
3.597 (0.074)
3.515 (0.076)
2.035 (0.393)
2.396 (0.274)
Xfer/Consol 7.855*** 7.968*** 13.01*** 13.18***
130 Other unreported regressions suggested by others for results after claim
construction (Markman hearings) and after 2006 yielded little differences, for example.

A Generation of Patent Litigation
46
(0.000) (0.000) (0.000) (0.000) NumDefs
1.027*** (0.000)
1.027*** (0.000)
1.030*** (0.000)
1.030** (0.001)
Dec. Relief
1.029 (0.951)
1.028 (0.953)
0.892 (0.752)
0.907 (0.790)
Prior Assertions
0.955*** (0.000)
0.955*** (0.000)
0.975 (0.062)
0.975 (0.063)
Total Assertions
1.034** (0.002)
1.033** (0.002)
1.023** (0.004)
1.029*** (0.000)
NumPatentsCase
0.992 (0.630)
0.991 (0.580)
0.950* (0.025)
0.955* (0.042)
MeritInfringe Ruling
46.91*** (0.000)
46.72*** (0.000)
Observations 5527 5527 5527 5527 5527 Pseudo R2 0.178 0.466 0.466 0.298 0.293 Chi-squared 107.6 205.3 201.2 233.7 233.8 p>chi2 0.000 0.000 0.000 0.000 0.000
Regression (2) adds several more factors that relate more to selection for
challenge than to quality: Reexamined: The number of times the patent has been reexamined.
Either the patentee seeking to enforce or threatened defendants would seek reexamination.
Stayed: 1 if the case was ever stayed, 0 otherwise. Cases are often stayed pending reexamination by aggressive defendants (though there were a few bankruptcy stays).
Xfer/Consolidation: 1 if the case was ever transferred or consolidated. This too can imply an active defendant or a high activity patent.
NumDefs: The number of defendants in a case. The more defendants, the more likely one will challenged.
Dec. Relief: Whether the case was solely a declaratory relief action by a defendant.
PriorAssertions: The number of times the patent has been asserted as of the case filing date (including the current case). Cases filed on the same day have the same number assigned.
TotalAssertions: The number of times the patent was asserted in all cases in the set.
NumPatentsCase: The number of patents in the same case as the studied patent.

A Generation of Patent Litigation
MeritInfringeRuling: Whether the judge or jury issued a ruling on infringement (in favor of either party) in the case. Presumably, active cases will be more likely to have an infringement ruling.131
The results of Regression (2) are somewhat less surprising. Most of the factors that one would expect might lead a patent to be challenged are statistically significant. Rulings on infringement, especially, appear to be highly correlated with rulings on invalidity. It appears that selection metrics play a more important role in determining whether a patent is invalidated than quality metrics.
The one surprise in Regression (2) is that NPE is no longer statistically significant. Once other case factors, such as number of defendants, number of assertions, etc. are considered, whether the party is an NPE adds little explanatory value. This will be tested further in equation 5.
Regression (2) does expose one oddity: Invalidity in reexamination is no longer significant. On the other hand, whether a patent was reexamined is positively correlated, but not significant either. These two are likely offsetting each other. Regression (3) drops the insignificant reexamination outcome factors, and the result is that the fact of reexamination is now statistically significant. It appears that reexamination may be a selection factor as well.
Whether the court ruled on infringement is surely explanatory, but it may overdetermine the model by capturing all of the unobserved reasons why some parties take their cases to judgment and others don’t. Regression (4) tests this by removing the factor from the regression. As the drop in Pseudo R2 shows, the model captures less of the variation, but the chi-squared statistic actually increases. However, most of the other coefficients stay essentially the same, except for Xfer/Consolidate, which doubles. This implies that some of the same decisions that led to more infringement rulings may have led to more transfers and consolidations. To the extent that NPEs might assert more noninfringed patents (as discussed below) and also file cases subject to more transfers (as discussed above), this means that NPE choices lead to patent invalidity decisions, even if the quality of their patents might not.
Finally, Regression (5) tests the NPE question directly. It drops NPEs from the regression, and finds it virtually unchanged. NPE status has no virtually no explanatory value above and beyond other measurable selection effects. As noted, some of the factors relate to NPE status, but do not fully explain it. For example, in an unreported regression replacing
131 Part D, below, discusses overlap between validity and infringement rulings.

A Generation of Patent Litigation
48
Xfer/Consolidate with NPE in Regression (5) does not lead to a statistically significant result (p=.065).
These stepped regressions imply that, among the more than 5500 opportunities for courts to invalidate a patent, the most statistically (and magnitudinally) significant factors influencing invalidation related to whether the plaintiff asserted a patent in a way that was more likely to invite a patent challenge. To be sure, there are unobserved patent quality factors that affected whether to mount a challenge and whether that challenge was successful, but those quality factors are not on the face of the patent, nor are they explained by NPE status.132
More important, and most counterintuitively, the more prior art cited by a patent, the more likely a patent was to be invalidated. This is the exact opposite of what one would expect to see. The conventional wisdom is that more prior art means that the claims have been “bullet-proofed” against prior art. More likely, however, it appears that more prior art means that the claims are the most likely to be aggressively challenged in patent office reexaminations (leading to more prior art citations) and more aggressively litigated (leading to more invalidity findings).
5. Policy Implications
Do NPEs really assert weaker patents than other patent plaintiffs? The answer is yes, NPE patents are invalidated more often. But the level of concern depends on how one frames the data. Reporting invalidations as a percentage of all patents asserted makes the absolute difference appear much smaller. Further reporting them as a percentage of all cases reduces the difference even further, and the absolute effect to less than three percent of all cases filed.
In other words, while any given NPE case is about twice as likely to result in an invalidation, the magnitude of this difference is a blip in the patent litigation ecosphere, affecting less than 3% of all pending cases. The quality of the remaining patents is ambiguous: settlements might occur because the patents are strong, because the patents are weak, because defendants feared a jury, because the NPE sought a reasonable settlement that reflected the value of the patent, or because the NPE sought a nuisance settlement that overvalued the patent but remained less than trying the case. The regression estimates in this case imply that NPE patents are invalidated
132 Testing using NBER technology categories yielded little information. Most NPE
patents were in group 21, computer communications – so many that the results were unhelpful. A future paper will test whether software patents are invalidated more often.

A Generation of Patent Litigation
more often because they sue more defendants more often and more aggressively.
Furthermore, the data implies that the PTO and the courts run on two different tracks, examining different patents. Patents that survive reexamination are tested in litigation, and vice versa. This is a consideration for any policy considering delay of litigation for PTO proceedings.
Thus, the invalidity findings have important implications. First, they show that only a very small percentage of all patents asserted and an even smaller percentage of cases involve patents held invalid. Second, they show that patents tested at trial, but not appeal, tend to be upheld. Third, they are important for what they do not show: whether the lack of NPE validity findings at trial is due to socially undesirable behavior by NPEs or is otherwise indicative of quality of NPE patents.
The finding about backward citations is surprising, and has an important policy implication: spending time and effort bulletproofing a patent, whether by the patentee133 or during a “gold plating”134 review, may be wasted.135 If a patent is asserted multiple times, it will be invalidated regardless of such efforts.
D. Infringement Outcomes
A patentee must win two halves of each case: validity and infringement. If the facts support it, non-infringement may be an easier defense, as it requires no research in old prior art.136 This section considers infringement outcomes in this study.
133 F. Scott Kieff, The Case for Registering Patents and the Law and Economics of
Present Patent-Obtaining Rules, 45 B.C. L. REV. 55, 116 (2003) (identifying problems with ex parte nature of reexamination).
134 Doug Lichtman & Mark A. Lemley, Rethinking Patent Law's Presumption of Validity, 60 STAN. L. REV. 45, 50 (2007) (“Congress or PTO officials should create a new opportunity for patent applicants to “gold-plate” their patents--funding and submitting to a vigorous review process in the PTO, and in return earning a significant presumption in favor of patent validity.”).
135 This is further supported by evidence that patent examiners do not consider material cited by applicants. Christopher A. Cotropia, Mark A. Lemley & Bhaven N. Sampat, Do Applicant Patent Citations Matter?, 42 RES. POL’Y 844, 844 (2013).
136 See generally, Allison, Lemley & Schwartz, supra note 5 (finding that defendants were much more successful in noninfringement motions than on invalidity motions, and that the combination of the two meant that patentees win only 25% of the time).

A Generation of Patent Litigation
50
1. The Data
Of specific interest are those cases in which patent infringement was adjudicated on the merits. The first table shows cases with any infringement ruling on the merits. The results are similar to invalidity – nonNPEs go to trial much more often, and when they do, they win. There are twice as many nonNPE patents in the study, which means that NPE patents are found non-infringing twice as often. Of the three infringement findings for NPEs, one was at trial with a $16m damages award, one was settled, and one is still pending.
All Infringement Findings NonNPE NPE
N % N % Patents Literally Infringed at least Once 45 5.7% 3 .9%
Patents Infringed by Equivalents at Least Once 4 .5% 0 0% Patents Found Noninfringed at Least Once 55 6.9% 59 16.8%
More than 16% of the patents were found infringing at one point or
another. This is more than twice the 6.8% of patents found invalid. A similar ratio applies to nonNPE patents as well.137 Further, the very small number of infringement findings for these NPEs was surprising, at it is well below the win rate for all NPEs.138
Like invalidity, the noninfringement findings appear to be limited to fewer cases than the number of patents. This is not surprising, given that multiple patents are asserted in each case. The following table shows the infringement data by original case number. Unlike validity, in which consolidated defendants will each attack the patent on similar grounds, infringement defendants in different cases will more often have different products, and thus different bases for non-infringement.
137 Accord Allison, Lemley & Schwartz, supra note 5 (finding that noninfringement
was a basis for defendant victory slightly more than twice as often as invalidity). 138 PwC 2014, supra note 7.

A Generation of Patent Litigation
NonNPE NPE Cases 1313 916
Patents/Case 2.51 6.53
N % All Cases % Adjudicated N % All Cases % Adjudicated Cases Adjudicated 92 7.01% 100.00% 119 12.99% 100.00%
Infringed 46 3.50% 50.00% 3 0.33% 2.52% Inf. By Equivalents 5 0.38% 5.43% 0 0.00% 0.00%
Not Infringed 50 3.81% 54.35% 117 12.77% 98.32%
It appears that 16.8% of NPE patents were found noninfringing in 12% of the cases. More important, and NPE case was more than three times as likely to end with a noninfringement ruling. Even nonNPEs are subject to noninfringement rulings in many more cases than invalidity.
The data implies that a greater failing of NPEs and nonNPEs alike is not the assertion of invalid patents—though that certainly exists—but instead the assertion of noninfringed patents.139 For NPEs, especially, this is consistent with a “war chest” model, in which more broad and potentially lucrative patents are asserted over time.140
However, one should not over-extend inferences of the data. Like invalidity, these results only show definitive rulings, and they were only a small fraction of all the patents asserted. There were several motions filed by defendants in which the court denied summary judgment and sent the case to a jury. A jury never saw most of those cases, especially for NPEs, and they are not reflected here. Thus, there may well be a selection effect: perhaps only the most clearly noninfringing defendants filed and won motions, while the remaining 84% of the patents asserted included at least a colorable claim for infringement.
Of course, a few NPEs may have overextended and relied on a poor quality patent. The following table shows infringement findings for just
139 Michael Risch, What is a Patent Troll?, PRAWFSBLAWG (Apr. 15, 2011)
(“Individuals are rarely called trolls. One might think this is because of the garage inventor ethos. I'm doubtful, though, because individuals become trolls when they gather enough resources and sue enough defendants to get noticed. At that point, they may be more likely to try to stretch their patents to cover technologies that they did not invent. This, I think, leads to the real definition for me - I think trolls are trolls when they overreach.”), http://prawfsblawg.blogs.com/prawfsblawg/2011/04/what-is-a-patent-troll.html.
140 David L. Schwartz, The Rise of Contingent Fee Representation in Patent Litigation, 64 ALA. L. REV. 335, 368 (2012) (“Rather than suing them all at once, the patentee asserts its patent in waves. Typically, weaker defendants are approached or sued initially.”).”

A Generation of Patent Litigation
52
those patents where all asserted claims are found invalid. Interestingly, two of the three NPE patents that were found infringed were found invalid in other cases.141 Further, there is a large overlap with non-infringed patents. Of the 59 NPE patents found noninfringing, 20 were also found completely invalid.142 NonNPEs fared better – only one of their infringed patents were found completely invalid, and 48 of their non-infringed patents survived all challenges in the study, which means they could be asserted again.
Patents Completely Invalid NonNPE NPE
Patents Literally Infringed at Least Once 1 2 Patents Infringed by Equiv. at Least Once 2 0
Patents Found Noninfringed at Least Once 7 20
The following table presents findings of patent validity. Only 16 of the original 45 nonNPE literally infringed patents were found both valid and infringed. This odd result stems from the nature of validity challenges. Invalidity is a defense, so if there is no real evidence then the jury never rules. Patentees simply win infringement without any validity ruling. This result is common in, for example, Monsanto cases, where the patent is never seriously challenged. The one NPE valid/infringed result is the one jury verdict in favor of an NPE. However, a finding of validity in the noninfringed cases allows the patent to be asserted in the future.
Patents Found Valid NonNPE NPE
Patents Literally Infringed at Least Once 16 1 Patents Infringed by Equiv. at Least Once 0 0
Patents Found Noninfringed at Least Once 7 3
The final infringement comparison counts how many patents survived validity challenges, but which avoided any infringement ruling at all on the merits – they were simply never tested, presumably due to settlement. The totals are very small: two (2) for nonNPEs, and four (4) for NPEs. This was a bit surprising, because one would expect more settlements when patents survive validity challenges. However, the small numbers may imply the
141 We only measured whether all asserted claims were invalidated, so it is possible
that different asserted claims were found infringed in other cases. 142 Another 12 NPE patents were found noninfringed with some, but not all, of the
claims held invalid. The remaining claims could live another day.

A Generation of Patent Litigation
opposite. First, if the patents survive validity challenge, then some patent holders—NPEs included—are unlikely to settle. This may mean that at least some cases are not simply cost of litigation nuisance suits. Second, when a patent holder does “reach,” it tends to be a complete overreach – a weak patent stretched to the limits of claim breadth,143 such that very few losing patents escape judgment on both validity and infringement.144
Alternatively, judges could be predisposed against patent trolls, finding against them in every way possible to end each case. This is unlikely (with respect to this particular issue, at least), because NPEs and nonNPEs seem to have the same small rate of patents that survive challenge but avoid infringement.
Finally, it could mean that there are several defendants that know they are infringing but believe the patent is invalid. They would maintain the case long enough to challenge validity, but settle if they lose. This would explain these six examples, and perhaps those three patents that were found infringed but were later held invalid.145
2. Policy Implications
Comparing infringement outcomes is a bit ambiguous from a policy perspective. On the one hand, infringement findings have little to do with the quality of the patent because they are based on the accused product or service. On the other hand, lack of infringement success implies that a party is bringing a meritless case.146
In this sense, patent troll critics are attempting to have their cake and eat it too, simultaneously claiming that the patents are software that is so broadly defined it covers everything but simultaneously bringing weak cases against products that do not infringe. The data here helps settle that issue a bit: to the extent that courts actually rule on infringement, NPE claims do not seem to be overbroad (even though the patent owner might wish it were so). Instead, defendants who defend themselves seem to be
143 The broader patentees claim their patents are, the more likely they are to be invalid, because more prior art might apply.
144 These six patents were subject to validity challenges in a tiny fraction of all the cases filed. In every other case, all validity challenges failed or there was a disposition without any validity challenge.
145 Note that two of those three (the NPE patents) were found invalid in different cases. 146 Allison, Lemley & Walker, supra note 3, at 687 (finding 10% win rate among most
litigated patents).

A Generation of Patent Litigation
54
able to convince courts that their products are not the same as the patent.147 This is not to say that the enterprise is costless; getting to that judgment costs money. However, that is a different problem than patentees asserting claims that are so broad that everything infringes. Furthermore, even though patents are not so broad as to be infringed, they are still ruled invalid, though for NPEs this is often based on things other than the prior art.
Because adjudicated patents are such a small portion of the total, however, this small window does not tell us about all of the patents that resulted in settlements. Some would argue that settled patents are the ones that are too broad, or perhaps just nuisances. Others would argue that settled patents are most likely to win, and thus are never challenged. The truth surely lies in between.
This data set provides more information than available before: that a number of cases ended in default judgments and consent judgments. The damages sought in many of these cases were quite small – as low as $7,500; this implies that the suits may not have even been to extract a settlement based on litigation costs. As to the rest, unfortunately, the answer depends on whether one thinks the unchallenged patents look like the challenged ones. It is likely that the narrowest patents are challenged, so the untested patents are probably broader. Just how much broader is a difficult question.
CONCLUSION
Patent policy in the age of NPEs has many moving parts. The key is to find the right combination of rules and reforms to improve outcomes for all participants in the system. This paper’s contribution sheds light on patent quality and outcomes among NPEs and nonNPEs. There are four key takeaways, among other interesting results.
First, while a larger percentage of NPE patents was invalidated, very few cases involved an invalidated patent. Second, predicting which patents were invalidated had more to do with case specific factors (like the number of defendants) than with objectively measurable patent quality. Third, once these factors are considered, whether the plaintiff was an NPE was not statistically significant. Of course, NPEs made choices about who to sue and how many cases to bring. But nonNPEs who made similar choices
147 Accord, Mark A. Lemley, et al., Does Familiarity Breed Contempt Among Judges
Deciding Patent Cases?, 66 STAN. L. REV. 1121, 1140-43 (2014) (finding that judges who issue more merits rulings are more likely to find more noninfringement rather than invalidity).

A Generation of Patent Litigation
faced similar odds of invalidation for the same choices. Fourth, while still a small fraction of all cases, noninfringement was a much more common reason for NPE loss.
Together, these findings imply some direction for patent reform proposals. Rules targeted at specific entities would be missing the point, because plenty of invalid patents would still be asserted by nonNPEs. Further, any rules designed to increase the likelihood that parties avoid settlement and instead seek judgments on the merits should be balanced against a) the costs of getting to such judgments and b) the possibility that NPEs might win more often if pushed to the merits rather than settling. After all, many motions for summary judgment were denied. Of course, NPEs might not win, and so the goal should be reducing duration and costs. Mutual fee shifting may be an option that serves these dual purposes, because defendants would have an incentive to challenge, but would also face the risk of driving up defense costs if the challenge is ill-advised. Fee shifting might also make it easier for small defendants to obtain contingency defense counsel.
Furthermore, rules that make it easier to determine whether a case is high-stakes enough to challenge may be helpful. Improved certainty in damages might help the parties make such determinations. Ironically, the AIA’s requirement that each defendant be sued separately may not have been a helpful change. Given that cases with many defendants were those most likely to see challenges and invalidation, forcing NPEs to sue defendants separately may have reduced the likelihood of invalidation.
Finally, early certainty about infringement might be the best place to focus reforms. Early claim construction conducted in light of the accused product would give all parties a better, cheaper look at whether a case will be successful.
In all events, this article provides data that might guide policy in the future.