Embed Size (px)
Citation preview

A General Performance EvaluationFramework for Network Selection
Strategies in 3G-WLAN InterworkingNetworks
Hao Wang1 Dave Laurenson1 and Jane Hillston2Hao Wang1, Dave Laurenson1, and Jane Hillston2
1Institute for Digital Communications2Laboratory for Foundations of Computer Science3The University of Edinburgh
Outline
� 3G-WLAN Interworking Networks and Network SelectionStrategies
� Models of Network Selection Strategies
� Derivation of Network Blocking Probabilities and Handover
2
� Derivation of Network Blocking Probabilities and HandoverRates
� Evaluation Results
� Conclusions

Heterogeneous wireless networks
� Users are able to use a wide range of wireless networks,often with multiple networks available at the same time.
3

Heterogeneous wireless networks
� Heterogeneous wireless networks have complementarycharacteristics such as data rate and coverage, e.g.
Coverage Area Data Rate
3G ~ 1 – 2 km2 Mbps(3G)
4
� Therefore, it is envisioned that next-generation wirelesscommunications will focus on the integration of theseheterogeneous networks.
( )
WLAN ~ 100 – 200 m54 Mbps
(802.11a)
Bluetooth ~ 10m24 Mbps
(version 3.0)

3G-WLAN interworking architecture
� It is becoming necessary to integrate wireless LANs(WLANs) and 3G cellular networks, to form 3G-WLANinterworking networks.
5

Horizontal and vertical handovers
� In heterogeneous wireless networks, a mobile node mayperform handovers during its communications:� horizontal handover (HHO): a mobile node moves across cells
that use the same type of access technology.� vertical handover (VHO): the movement between different
types of wireless networks.
6

Handover decision of HHO and VHO
� Before a mobile node performs either handover it must:� collect information to confirm the need for a handover, and� decide whether to perform the handover.
� For a HHO, the handover criterion is usually just the signalstrength received by the mobile node.
7
� For a VHO, various handover criteria can be taken intoaccount when making a handover decision e.g.:� cost of service: cost is a major consideration, and could be
sometimes be the decisive factor.� network conditions: network-related parameters such as
bandwidth and network latency.� mobile node conditions: the node’s dynamic attributes such
as mobility pattern, account balance and power consumption.� user preference: a user may have preference for one type of
network over another.

Network selection strategies
� To facilitate the above evaluation process, mathematicalexpressions are introduced: network selection strategies(NSSs).
� A number of NSSs have been proposed and they aregenerally based on multiple attribute decision making(MADM) theory.
� normalised value ofattribute j of network i,where M is the number
8
� A typical example is the simple additive weighting (SAW)strategy:� each network is associated with a point, which is calculated as
the weighted sum of all the handover related attribute values.
� , where
� there are N attributes � weight of attribute jwhere M is the numberof candidate networks.� this is used to cancelthe effect of the unit ofdifferent attributes

Framework structure
Component formobility
Component fortraffic
Component forNSS
PEPA model of NSS
� captures movementcharacteristics in 3G-WLAN environment
�represents featuresof multimedia services
� controls networkselection behaviour ofa mobile node
� the generality of theframework is achieved byhaving two interfaces
� the generality of theframework is achieved byhaving two interfaces
� represents how networkresources are consumed� determines network
9
network resourceconsumption model
resources are consumedby mobile nodesselection probabilities
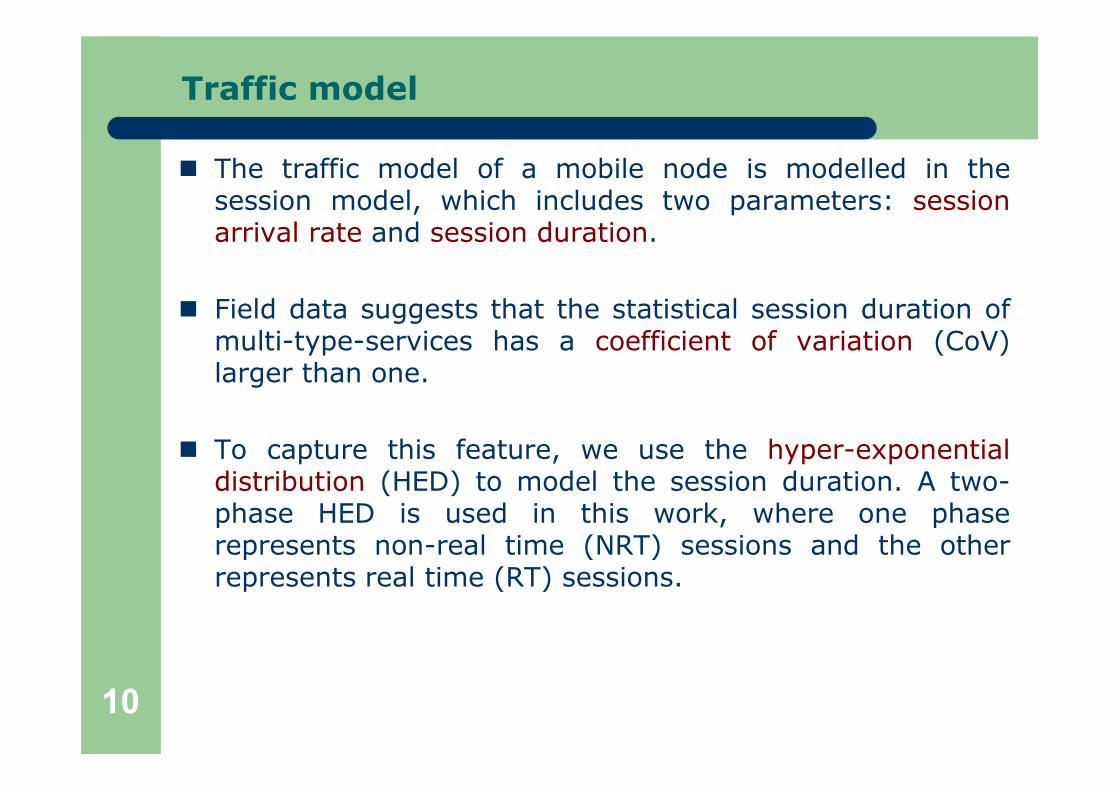
Traffic model
� The traffic model of a mobile node is modelled in thesession model, which includes two parameters: sessionarrival rate and session duration.
� Field data suggests that the statistical session duration ofmulti-type-services has a coefficient of variation (CoV)larger than one.
10
� To capture this feature, we use the hyper-exponentialdistribution (HED) to model the session duration. A two-phase HED is used in this work, where one phaserepresents non-real time (NRT) sessions and the otherrepresents real time (RT) sessions.
Traffic model
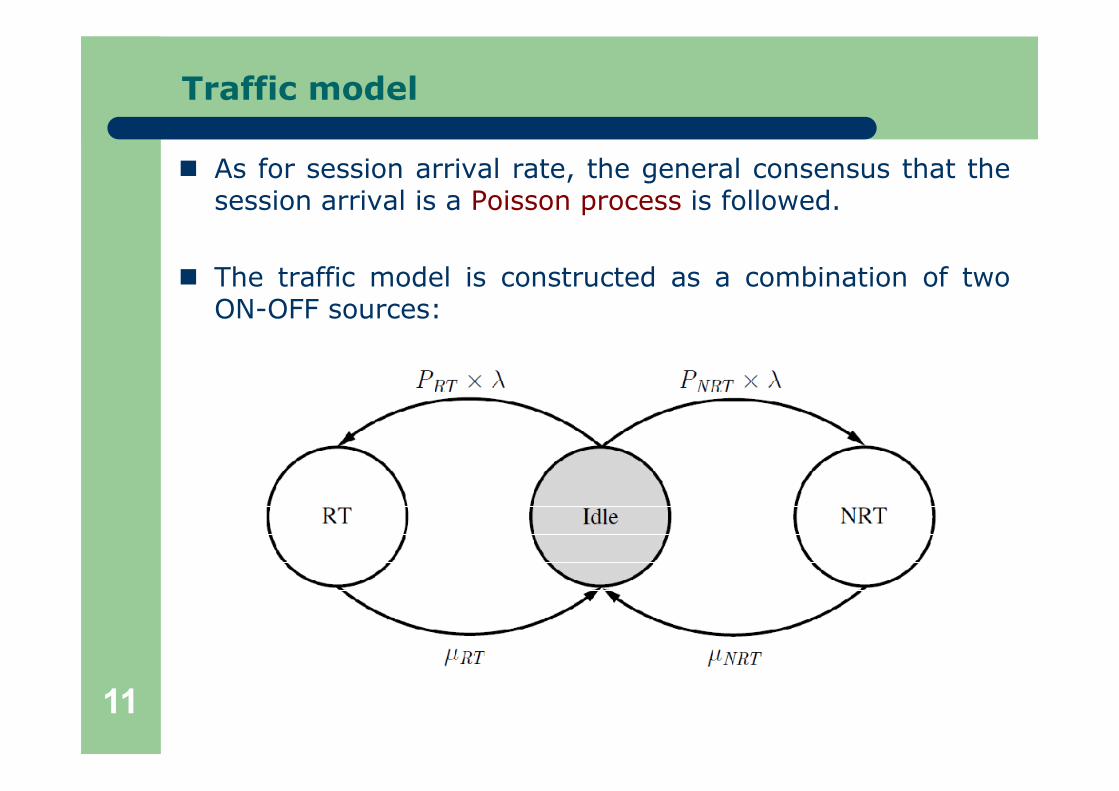
� As for session arrival rate, the general consensus that thesession arrival is a Poisson process is followed.
� The traffic model is constructed as a combination of twoON-OFF sources:
11
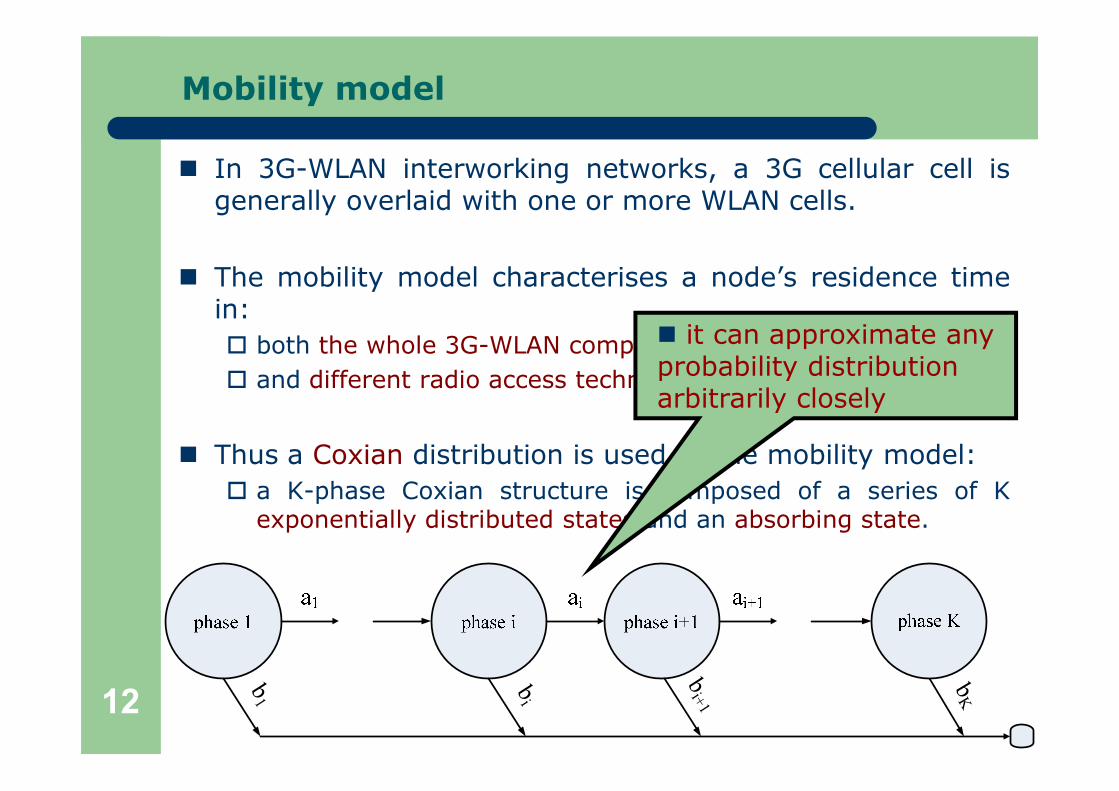
Mobility model
� In 3G-WLAN interworking networks, a 3G cellular cell isgenerally overlaid with one or more WLAN cells.
� The mobility model characterises a node’s residence timein:� both the whole 3G-WLAN compound cell� and different radio access technology (RAT) areas.
� it can approximate anyprobability distributionarbitrarily closely
12
� Thus a Coxian distribution is used as the mobility model:� a K-phase Coxian structure is composed of a series of K
exponentially distributed states and an absorbing state.
bi
bi+1
bK
b1
arbitrarily closely

Mobility model
� A modified Coxian structure without the absorbing state:we assume even number (N) of phases and they representthe mobile node’s position in terms of RAT areas.
� odd phases: 3G onlycoverage area
� even phases: 3G-WLANdual coverage area � transitions between
neighbouring phases:movements betweendifferent RAT areas
� transitions back tophase 1: movements outof a compound cell andentering another one
13
� Two assumptions are made:� WLAN cells do not overlap with each other;
� HHO between WLAN cells is not considered� WLAN cells that overlap with adjacent cellular cells belong to
all the cellular cells;� the start point of the track of the mobile node in a 3G-
WLAN compound cell is always the 3G area
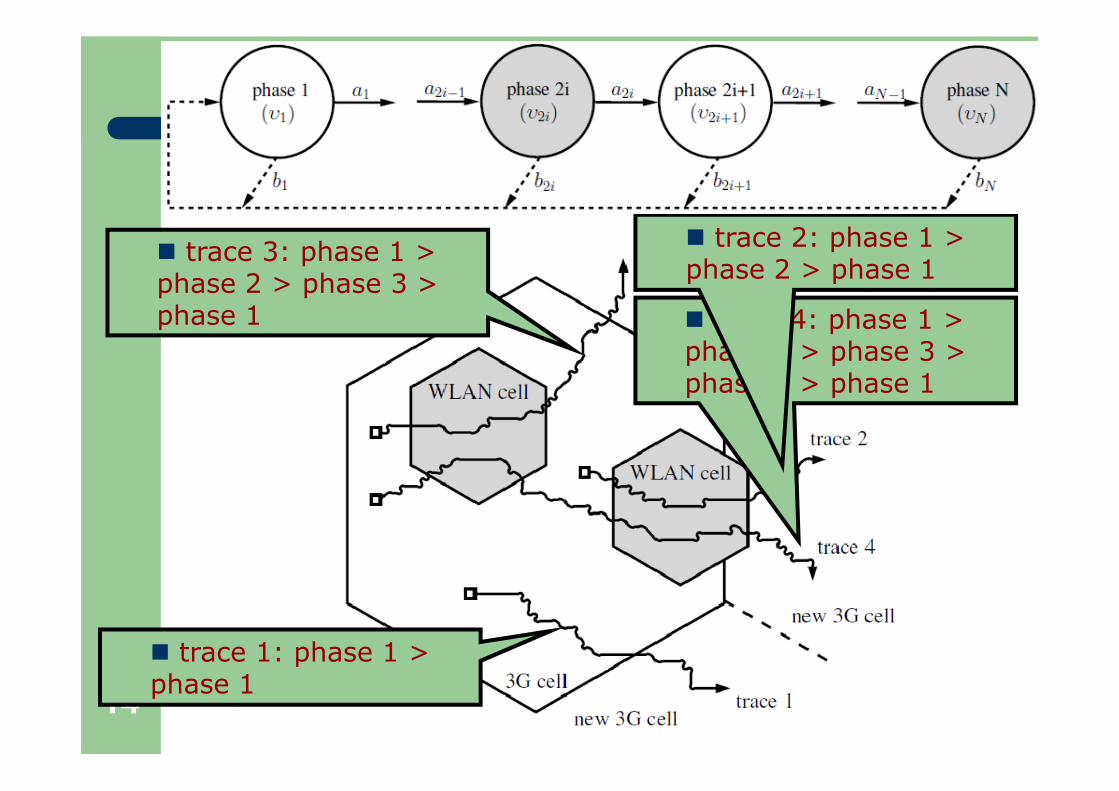
Mobility model
� The above mobility model can capture various traces of themobile node in 3G-WLAN interworking networks.
� trace 4: phase 1 >phase 2 > phase 3 >phase 4 > phase 1
� trace 3: phase 1 >phase 2 > phase 3 >phase 1
� trace 2: phase 1 >phase 2 > phase 1
14� trace 1: phase 1 >phase 1
p p

PEPA models for NSSs (general description)
� In the PEPA model for NSSs, a mobile node� can generate different types of sessions, and these sessions
are submitted to different networks according to NSSs(parameters PC and PW are used in the definitions of PEPAmodels);
� can perform different types of handovers according to theNSSs;
15
NSSs;
� is aware of network blocking for both new and handoversessions in 3G and WLAN networks (parameters PB
C and PBW
are used in the definitions of PEPA models);
� is aware of the different data rates that are provided bydifferent RATs; (NRT sessions (e.g. file downloading) usuallyneed less time using WLAN RAT than using 3G RAT)
System states and performance measures
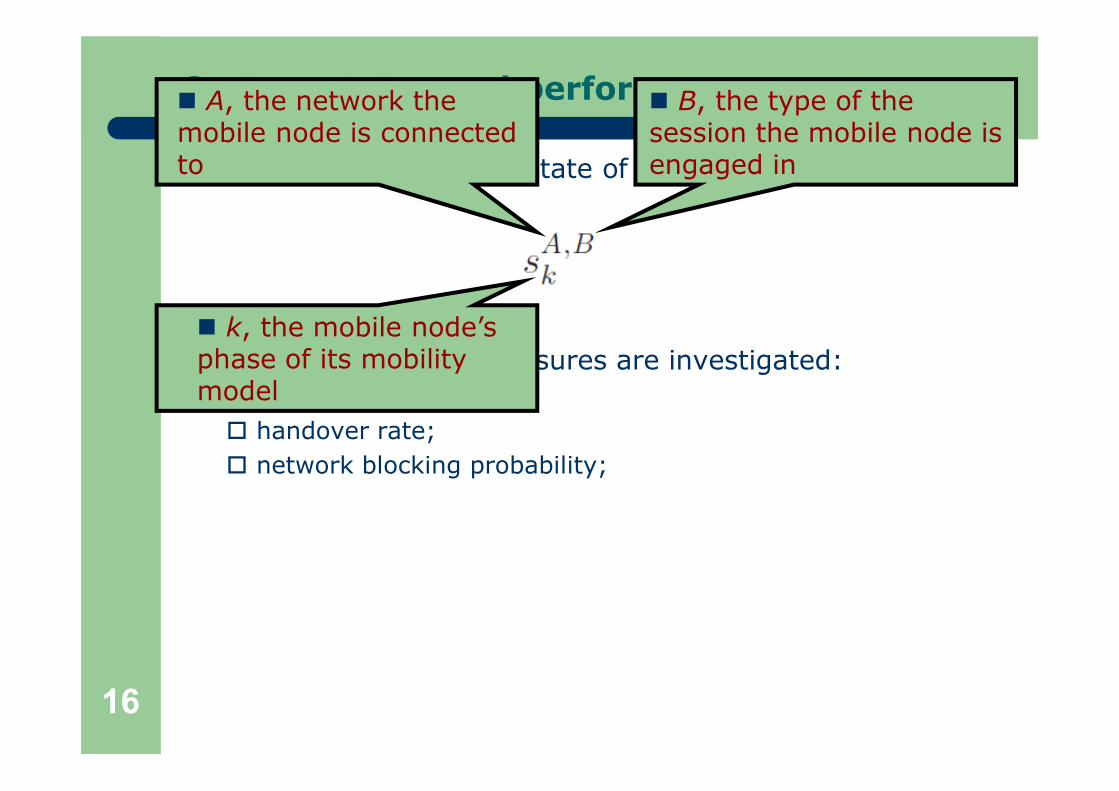
� In this work, a system state of a PEPA model is denoted as:
� Three performance measures are investigated:� average throughput;
� k, the mobile node’sphase of its mobilitymodel
� A, the network themobile node is connectedto
� B, the type of thesession the mobile node isengaged in
16
� average throughput;� handover rate;� network blocking probability;
model
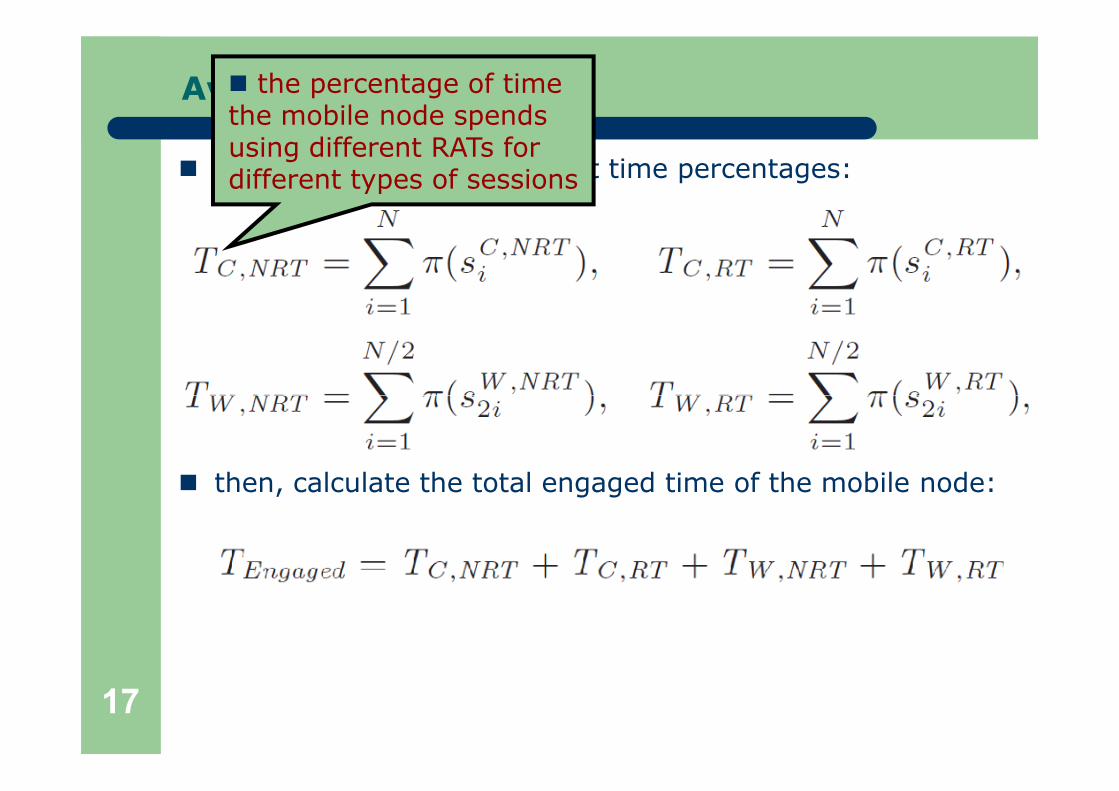
Average throughput
� first of all, calculate different time percentages:
� the percentage of timethe mobile node spendsusing different RATs fordifferent types of sessions
17
� then, calculate the total engaged time of the mobile node:

Average throughput
� then, the average throughput is defined as a weighted sum:
18
� the data rates that canbe achieved usingdifferent RATs for differentsessions

Handover rate
� is defined as the throughput of corresponding activities
� states that can performthe correspondinghandover
� the activity rate of thecorresponding handover
19

Network blocking probability
� Like network selection probabilities, these networkblocking probabilities can be used as input parameters.
� In this work, they are derived from a 2D-CTMC thatmodels the resource consumption of a 3G-WLANcompound cell.
20
� the state of the 2D-CTMC is denoted by two integers (c,w),where c and w represent the numbers of engaged users in 3Gand WLAN networks respectively;

Network blocking probability
� There are five types of events that can change the state ofthe 2D-CTMC:
� new session requestsare generated in 3G andWLAN networks
� sessions are finishedand resources are released
� sessions are internallyhanded over between 3Gand WLAN� sessions are externally
handed over out of 3G andWLAN
� sessions are externallyh d d i t 3G d
21
handed over into 3G andWLAN

Network blocking probability
� This diagram shows the outward transitions of a non-boundary state (c,w) of the 2D-CTMC is
� note that the definitionof the 2D-CTMC useshandover rates asparameters
� note that the definitionof the 2D-CTMC useshandover rates asparameters
� note that the definitionof the 2D-CTMC useshandover rates asparameters
� note that the definitionof the 2D-CTMC useshandover rates asparameters
22

Network blocking probability
� The blocking probabilities of 3G and WLAN networks arethen calculated as:
23
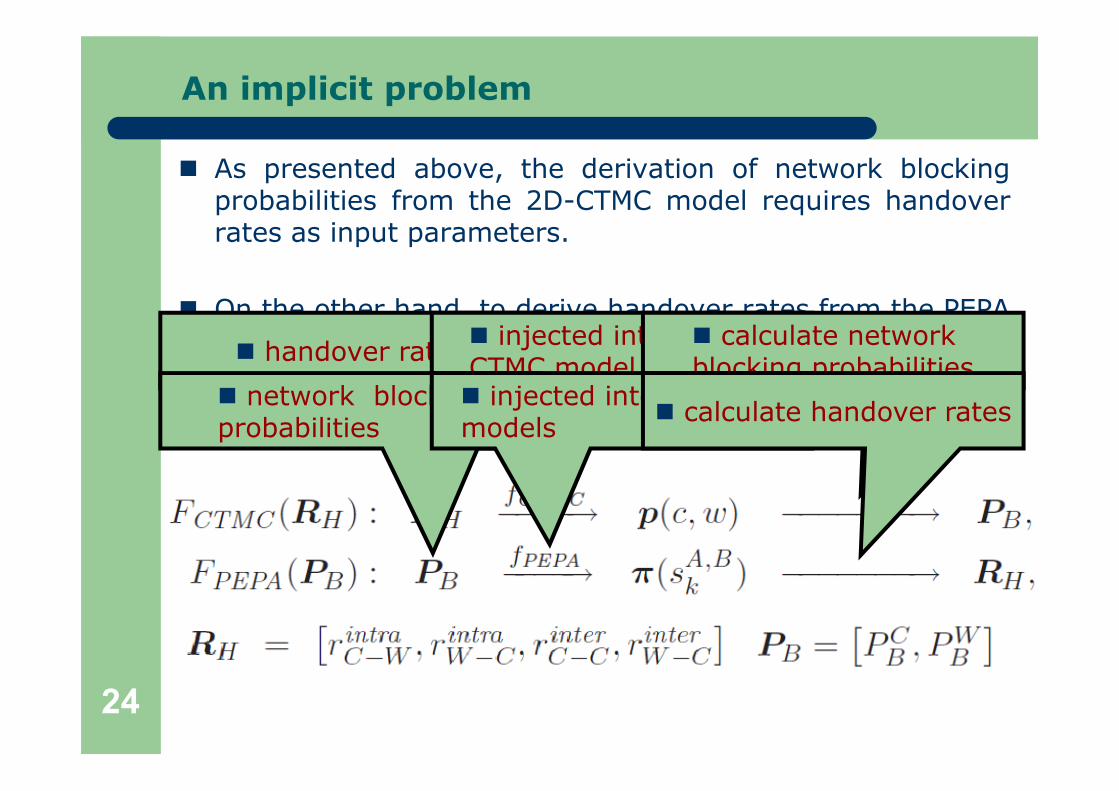
An implicit problem
� As presented above, the derivation of network blockingprobabilities from the 2D-CTMC model requires handoverrates as input parameters.
� On the other hand, to derive handover rates from the PEPAmodels, network blocking probabilities are needed.� handover rates� injected into the 2D-
CTMC model� calculate networkblocking probabilities
� network blocking� injected into the PEPA
24
� This forms an implicit problem, that is� network blockingprobabilities
� injected into the PEPAmodels � calculate handover rates
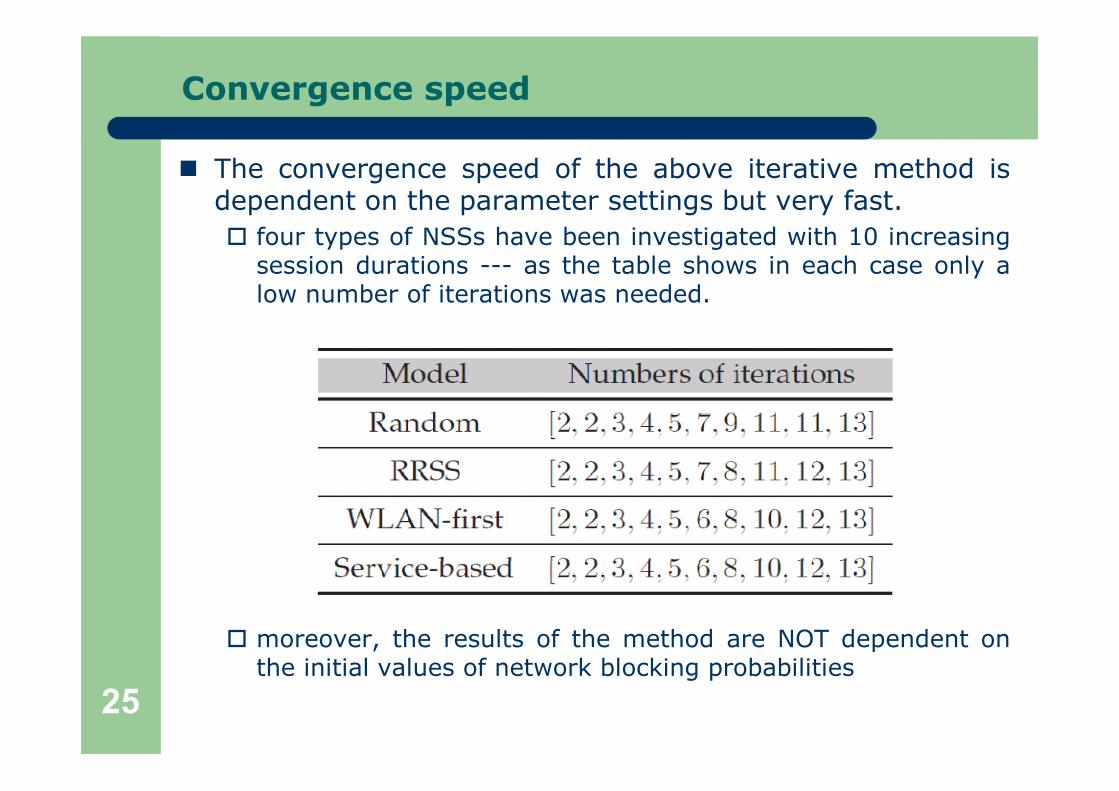
Convergence speed
� The convergence speed of the above iterative method isdependent on the parameter settings but very fast.� four types of NSSs have been investigated with 10 increasing
session durations --- as the table shows in each case only alow number of iterations was needed.
25
� moreover, the results of the method are NOT dependent onthe initial values of network blocking probabilities

Evaluation Results

Four types of NSSs
� Random:� the mobile node selects 3G and WLAN with equal probabilities,
i.e., 0.5;
� Relative received signal strength (RRSS):� the mobile node selects the network with the strongest signal
strength;
27
� WLAN-first:� the mobile node always choose WLAN when it is available,
because of its high bandwidth, small delay and cheap cost;
� Service-based:� the mobile node selects 3G for RT sessions (for less
handovers) and WLAN for NRT sessions (for high data rate);

Parameter settings
� Network selection probabilities of different NSSs are:
28

Controlled parameters
� Effect of two mobility patterns� mobility pattern 1 (t3G-WLAN=474, PNRT=PRT=0.5)� mobility pattern 2 (t3G-WLAN=1200, PNRT=PRT=0.5)
29
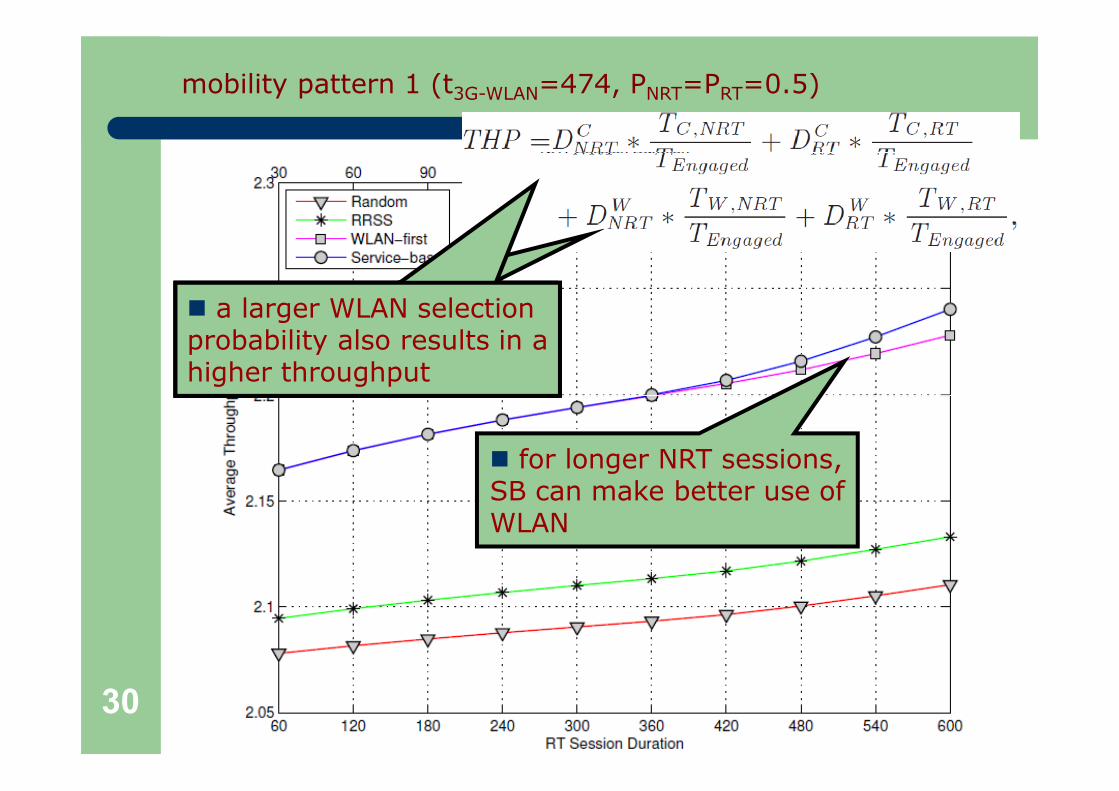
Average throughputmobility pattern 1 (t3G-WLAN=474, PNRT=PRT=0.5)
� it mostly depends onhow much time an NRTsession uses the WLAN
� a longer NRT sessionresults in a higherthroughput
� a larger WLAN selectionprobability also results in ahigher throughput
30
� for longer NRT sessions,SB can make better use ofWLAN

Average throughputmobility pattern 2 (t3G-WLAN=1200, PNRT=PRT=0.5)
� a longer sojourn time in3G-WLAN area results in ahigher throughput
31

3G network blocking probabilitymobility pattern 1 (t3G-WLAN=474, PNRT=PRT=0.5)
� it depends on howfrequently 3G is chosen,and how long network
d
32
resources are engaged

3G network blocking probabilitymobility pattern 1 (t3G-WLAN=474, PNRT=PRT=0.5) andmobility pattern 2 (t3G-WLAN=1200, PNRT=PRT=0.5)
� a longer stay in 3G-WLAN area results in ahigher 3G networkbl ki b bilit
33
blocking probability

WLAN network blocking probabilitymobility pattern 1 (t3G-WLAN=474, PNRT=PRT=0.5)
� again it depends on thetraffic load in WLAN, andthe difference is moreobvious
� NRT sessions engageWLAN resources shorterthan RT sessions, becausetheir awareness of datarate
34

WLAN network blocking probabilitymobility pattern 1 (t3G-WLAN=474, PNRT=PRT=0.5) andmobility pattern 2 (t3G-WLAN=1200, PNRT=PRT=0.5)
� a longer stay in 3G-WLAN area results in alower WLAN networkblocking probability
35

Vertical handover ratemobility pattern 1 (t3G-WLAN=474, PNRT=PRT=0.5)
36
� it depends on the probabilityof being connected to WLANwhen moving out a 3G-WLANcompound cell� and also the WLAN selectionprobability

Vertical handover ratemobility pattern 2 (t3G-WLAN=1200, PNRT=PRT=0.5)
37
� again, a longer stay in3G-WLAN area results inlower handover rates

Average throughputtraffic pattern 1 (t3G-WLAN=1200, PNRT=0.3 PRT=0.7)
� a longer NRT sessionresults in a higherthroughput
� a larger WLAN selectionprobability also results in ahigher throughput
38
� for longer NRT sessions,SB can make better use ofWLAN

Average throughputtraffic pattern 2 (t3G-WLAN=1200, PNRT=0.7 PRT=0.3)
39
� a larger NRT sessionproportion results in ahigher throughput
� difference between SBand WF gets smaller atlarger NRT probability

3G network blocking probability
� it depends on howfrequently 3G is chosen,and how long network
d
traffic pattern 1 (t3G-WLAN=1200, PNRT=0.3 PRT=0.7)
� for SB, 70% traffic isinjected in 3G network
40
resources are engaged

3G network blocking probabilitytraffic pattern 1 (t3G-WLAN=1200, PNRT=0.3 PRT=0.7) andtraffic pattern 2 (t3G-WLAN=1200, PNRT=0.7 PRT=0.3)
� lower RT probabilityreduces 3G networkbl ki b bilit
� SB decrease by a largerextent as it is more
iti t ffi t
41
blocking probabilitysensitive on traffic type

WLAN network blocking probability
� again it depends on theWLAN selection probabilityand WLAN resourceengagement time
traffic pattern 1 (t3G-WLAN=1200, PNRT=0.3 PRT=0.7)
42

WLAN network blocking probability
� for SB, larger NRTprobability increase trafficload in WLAN
traffic pattern 1 (t3G-WLAN=1200, PNRT=0.3 PRT=0.7) andtraffic pattern 2 (t3G-WLAN=1200, PNRT=0.7 PRT=0.3)
� for the others, largerNRT probability meansmore traffic is aware ofhigh data rate of WLAN
43

Vertical handover ratetraffic pattern 1 (t3G-WLAN=1200, PNRT=0.3 PRT=0.7)
44

Vertical handover ratetraffic pattern 2 (t3G-WLAN=1200, PNRT=0.7 PRT=0.3)
45
� for SB, larger NRTprobability means WLAN ismore frequently used, andthus higher handoverrates

Conclusions
In conclusion
� For deterministic strategies (service-based and WLAN-first):� easy to implement;� user knows which network is connected to;� their performance in terms of the investigated measures are
usually the boundaries of the studies strategies;
� For non-deterministic strategies (RRSS and random):
47
� not easy to implement� users experience uncertainty during handover;� they produce more balanced performance on the investigated
measures;

Thank You!

Horizontal handover ratemobility pattern 1 (t3G-WLAN=474, PNRT=PRT=0.5)
49
� it depends on theprobability of beingconnected to 3G whenmoving out a 3G-WLANcompound cell

Horizontal handover ratemobility pattern 2 (t3G-WLAN=1200, PNRT=PRT=0.5)
� a longer stay in 3G-WLAN area obviouslyreduces handover rates
50

Horizontal handover ratetraffic pattern 1 (t3G-WLAN=1200, PNRT=0.3 PRT=0.7)
51
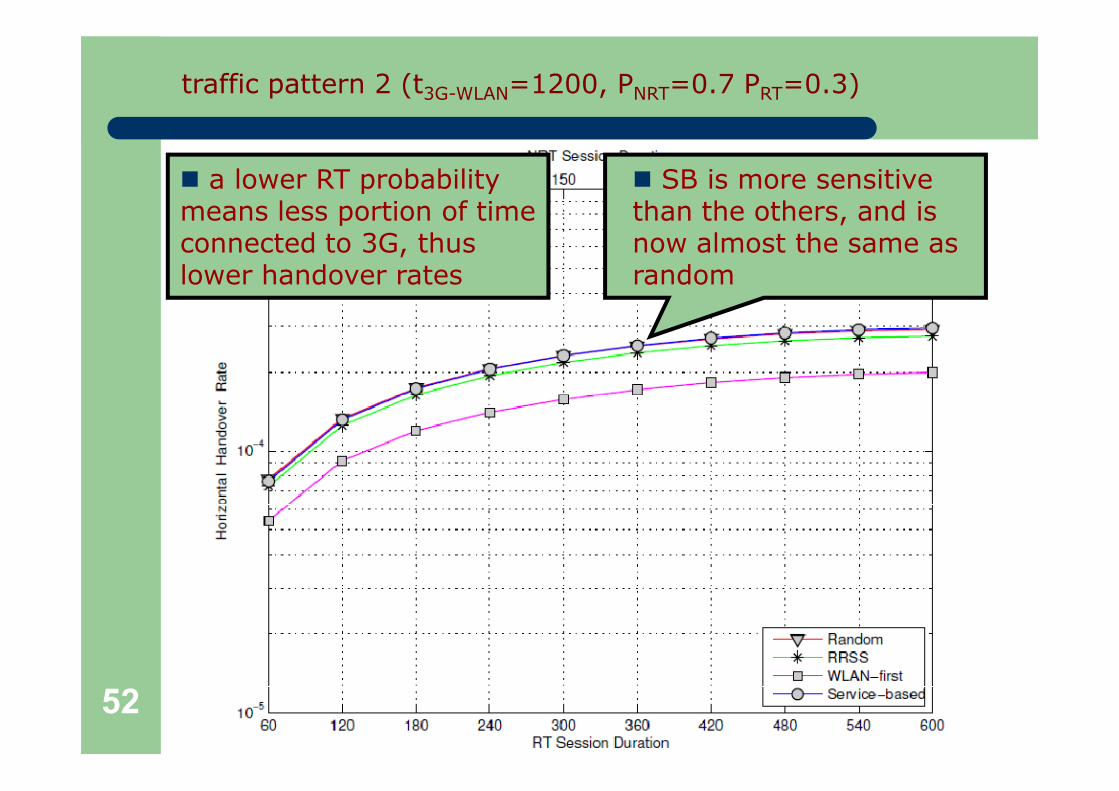
Horizontal handover rate
� a lower RT probabilitymeans less portion of timeconnected to 3G, thuslower handover rates
traffic pattern 2 (t3G-WLAN=1200, PNRT=0.7 PRT=0.3)
� SB is more sensitivethan the others, and isnow almost the same asrandom
52