Embed Size (px)
Citation preview

A General Kinetic Model for Quantitative Perhsion Imaging with Arterial Spin Labeling
Richard B. Buxton, Lawrence R. Frank, Eric C. Wong, Bettina Siewert, Steven Warach, Robert R. Edelman
Recently, several implementations of arterial spin labeling (ASL) techniques have been developed for producing MRI images sensitive to local tissue perfusion. For quantitation of perfusion, both pulsed and continuous labeling methods po- tentially suffer from a number of systematic errors. In this study, a general kinetic model for the ASL signal is described that can be used to assess these errors. With appropriate assumptions, the general model reduces to models that have been used previously to analyze ASL data, but the general model also provides a way to analyze the errors that result if these assumptions are not accurate. The model was used for an initial assessment of systematic errors due to the effects of variable transit delays from the tagging band to the imaging voxel, the effects of capillary/tissue exchange of water on the relaxation of the tag, and the effects of incomplete water extraction. In preliminary experiments with a human subject, the model provided a good description of pulsed ASL data during a simple sensorimotor activation task. Key words: MRI; arterial spin labeling; perfusion; cerebral blood flow.
INTRODUCTION
In recent years, a number of MRI techniques have been developed to measure different aspects of the perfusion state of the brain. Dynamic imaging with exogenous con- trast agents that remain intravascular allows measure- ment of local blood volume, and techniques that exploit the paramagnetic properties of deoxyhemoglobin are sen- sitive to local blood oxygenation (1, 2). Although these methods provide useful information related to perfusion, they are not a direct measurement of quantitative cere- bral blood flow (CBF), the rate of delivery of blood to a local tissue volume. A promising approach to measuring local tissue perfusion with MRI is use of arterial presatu- ration pulses to invert or saturate the magnetization of the arterial blood (3,4). The water molecules carrying the labeled magnetization are delivered to R particular brain imaging voxel by flow, where they are extracted from the capillary hed and join thc larger pool of brain water. The
MRM a383-396 (1998) From the Departments of Radiology (R.B.B., L.R.F., E.C.W.) and Psychiatry (E.C.W.). University of San Diego, San Diego, California; and the Depart- ment of Radiology (B.S., S.W., R.R.E.), Beth Israel Hospital, Boston, Mas- sachusetts. Address correspondence to: Richard B. Buxton, Ph.D., Department of Radiology, 8756, UCSD Medical Center, 200 West Arbor Drive, San Diego, CA 92103. e-mail: [email protected]. Received September 10, 1997; revised December 10, 1997: accepted February 15, 1998.
Copyright 0 1998 by Williams & Wilkins All rights of reproduction in any form reserved.
0740-3194/98 $3.00
experiment is then repeated without labeling the arterial blood and the image signals are subtracted to yield a difference signal that directly reflects quantitative local perfusion.
The original demonstrations in rats of perfusion mea- surement with arterial spin labeling (ASL) by Detre et al. combined repeated saturation pulsns (3) or adiabatic con- tinuous inversion (4) in the neck with imaging in a slice through the brain. In this approach, the inverted magne- tization of arterial water is delivered to the brain for a sufficiently long time that a steady state is reached in which the net longitudinal magnetization is reduced from its equilibrium value, and the amount of reduction is proportional to the local perfusion. Potential problems with this method are unwanted magnetization transfer effects in the slice of interest due to the long off- resonance inversion pulse, incomplete inversion of the arterial blood, relaxation during the transit from the in- version region to the slice, and signal contributions from large vessels (3, 5-9). When these effects are taken into account, the steady-state method can provide a quantita- tive measurement of local perfusion. Initial animal stud- ies involving CBF alterations by altering pC0, showed excellent agreement between CBF measured with arterial spin labeling and with microspheres (10). The steady- state technique was successfully applied in human sub- jects by Roberts et al. (11) and, more recently, in several studies (12, 13).
Edelman et al. (14, 15) introduced a related method, called EPISTAR (echo-planar imaging and signal target- ing with alternating rddiofrequency), which grew out of MR angiography techniques (16, 17). The EPISTAR method is essentially a pulsed form of the method of Detre et al. (3) that does not require continuous inver- sion. In EPJSTAR imaging, a selective 180" inversion pulse is applied to a thick slab just below the slice of interest to invert the arterial blood, and after a delay inversion time (TI), an image is acquired. The experiment is then repeated without inverting the arterial water and the images are subtracted to yield a difference image that ideally reflects the amount of blood that has entered a voxel during TI. A conceptually similar experimental approach was introduced by Kwong et al. (18) and later named FAIR (flow-sensitive alternating inversion recov- ery) by Kim (19). In this technique, an inversion recovery image with a slice-selective inversion pulse is subtracted from an image with a nonselective inversion pulse. Again, the difference signal reflects the difference in magnetization of blood delivered to the slice during the time TI.
383

384 Buxton et al.
With all of the ASL techniques, the goal is to produce a tagged image and a control image in which the static tissue signals are identical so that the difference signal is due only to blood that has entered the image voxel. With continuous labeling, asymmetric magnetization transfer effects may contaminatc the subtractions, and a cycling scheme may be required to correct for this effect (8). For the pulsed techniques, magnetization transfer effects seem to be less important than slice profile effects in affecting the quality of the subtraction (20). Recently, Wong et al. (21) introduced a new variation on pulsed ASL, called PICORE (proximal inversion with a control for off-resonance effects), in which the control pulse is applied in the absence of field gradients but shifted in frequency so that the image plane experiences the same off-resonance RF pulse in both control and tag images. In this way, any asymmetry of magnetization transfer effects is automatically balanced. In addition, this technique has the advantage that venous blood entering from the supe- rior side of the image plane is not tagged, whereas with EPISTAR, such blood appears as a negative signal, and with FAIR, it appears with a positive signal. In this study, we did not address quantitation issues related to imper- fect subtractions and venous signals. Instead, we as- sumed that the static tissue was subtracted accurately and focused on the interpretation of the difference signal as a measure of magnetization delivered by arterial flow.
For each of these ASL methods, a detailed model of the process combining kinetics and relaxation is needed to extract a quantitative measurement of perfusion. Detre et ul. (3) introduced a modeling approach based on com- bining single-compartment kinetics with the Bloch equa- tions, and this approach was extended to the FAIR ex- periment by Kim (19) and Kwong et ~ l . (22, 23). In this paper, we describe a more general model for ASL exper- iments that includes both the pulsed and the continuous labeling techniques. With appropriate assumptions, the model reproduces the earlier modeling work, but it is framed in a way that clarifies the confounding effects of other tissue parameters on quantitative measurements of perfusion. As an illustration of the use of the model, we have performed an initial evaluation of systematic errors due to the effects of variable transit delays from the tagging band to the imaging voxel, the effects of capil- laryhissue exchange of water on the relaxation of the tag, and the effects of incomplete water extraction. Based on the model, we describc a relatively simple double- subtraction strategy for calculating quantitative perfii- sion maps from pulsed ASL images that reduces the systematic errors associated with these confounding ef- fects. We also report the results of initial experimental tests of the adequacy of the model for describing dynamic EPISTAR data in a human subject. A preliminary version of this work was reported previously (24), but the current formulation of the model differs somewhat from this earlier version.
THEORY A General Kinetic Model for the ASL Signal
To be specific, we will develop the theory in the context of the pulsed ASL methods, with EPISTAR as an exam-
ple, and then show how the results can be generalized to any spin-labeling method. A typical implementation of the EPISTAR pulse sequence (14) consists of the follow- ing: (a) a 90' saturation pulse is applied on the slice of interest to partially suppress the static signal; (b) an arterial blood tagging pulse (180' inversion) is applied to a thick slab below the slice of interest; (c) a time interval tallows inflow of the tagged blood followed by a 90' read pulse with echo-planar imaging (EPI) readout; (d) the pulse sequence is repeated, except that the inversion band is applied the same distance above the slice of interest to measure a control signal; and (e) the image with arterial tagging is subtracted from the control image to form the EPISTAR difference image. The PICORE and FAIR techniques differ only in how the control image is acquired. With all of these techniques, a good control image is essential for quantitating the signal change due to perfusion. In the initial report on qualitative perfusion imaging with EPISTAR, a superior control was not used. However, for quantitative applications, the effects of off- resonance excitation must be balanced with an appropri- ate control image.
If the off-resonance and magnetization transfer effects of the tag and control pulses are the same, the ASL signal is simply proportional to the difference (untagged minus tagged) in longitudinal magnetization AM(t) in the tissue due to blood that entered the voxel during the interval t and is still present in the voxel. Specifically, we can consider two groups of spins, defined by their location just after the labeling inversion pulse: (a) tissue spins in the image voxel, and (b) tagged arterial blood spills that will ultimately travel to the voxel. Then, the central assumption of the method is that the longitudinal mag- netization of the first group is identical during the two parts of the experiment, so that AM(t) only depends on the difference of the longitudinal magnetization of the second group, the labeled blood.
We can develop a gencral kinetic model for AM(t) by considering this magnetization difference to be a quan- tity of magnetization that is carried into the voxel by arterial blood. Then, the amount of this magnetization in the tissue at a time t will depend on the history of delivery of magnetization by arterial flow and clearance by venous flow and longitudinal relaxation. These vari- ous physical processes can be described by defining three functions of time: (a) the delivery function c(t) is the normalized arterial concentration of magnetization arriving at the voxel at Lime t; (b) the residue function r(t,t'] is the fraction of tagged water molecules that ar- rived at time t' and are still in the voxel at time t; and (c) the magnetization relaxation function m(t,t') is the frac- tion of the original longitudinal magnetization tag carried by the water molecules that arrived at time t' that re- mains at time t. If the physiological state of the tissue is not changing, then r(t,t') and m(t,t') are functions of just the interval t-t', and we will write them as dt] and m(t) with this understanding. As an example, if there is a sharp transition at time At from untagged to tagged blood arriving at the voxel, c[t) is zero until t > A t and exp[-tl TI,] thereafter for pulsed ASL, where T, is the longitu- dinal relaxation time of arterial blood. If the clearance of water from the tissue follows single-compartment kinet-

General Kinetic Model for Quantitative Perfusion Imaging with ASL 385
ics, r(t) is a single exponential. And if decay occurs with time constant TI, m(t) is a decaying exponential with time constant TI.
With these definitions, AM(t) can be constructed as a sum over the history of delivery of magnetization to the tissue weighted with the fraction of that magnetization that remains in the voxel. After the inversion pulse, the arterial magnetization difference is 2aM,,, where Mob is the equilibrium magnetization of arterial blood and the factor a accounts for incomplete inversion during the tagging pulse: a is the fraction of the maximum possible change in the longitudinal magnetization that was achieved (6, 13). The amount delivered to a particular voxel between t’ and t’ + dt’ is 2crMc&[t’), wherefis the CBF (expressed in units of ml of blood per ml of voxel volume per second). The fraction of that magnetization that remains at time t is r(t - t’)m(t - t’). Then,
AM(t ) = 2A40bf\o*c(tr)r(t - t’)m(t - t‘)dt’
[I1
= 2Mobf{c(t) -* [dt) nl(t)ll where * denotes convolution as defined in Eq. [I].
The structure of Eq [ I ] is relatively simple. The abso- lute scale of the magnetization difference is set by the equilibrium magnetization of blood, and AM(t) is also directly proportional to perfusion f. The integral in brackets has the dimensions of time, and the physical interpretation of Eq. [I] is clearest in the oversimplified case when magnetization decay and clearance from tis- sue are neglected, so that r(t) = m(t) = 1. If the delivery of magnetization to the voxel starts at t = 0 and continues for a time r , so that c(t) = 1 for f < r and zero thereafter, the integral in brackets is simply T. In this idealized case, the tagged blood behaves as a microsphere, and the amount accumulated is directly proportional to the flow and the delivery time. In reality, we must deal with transit delays from the tagging region to the voxel, mag- netization decay, exchange of water between blood and tissue, clearance by venous flow, and different forms of arterial tagging. All of these processes can be taken into account with appropriate forms of the delivery function c(t), the clearance function (or rcsidue function) r(t), and the magnetization relaxation function m(t).
The Standard ASL Kinetic Model
Early models for the ASL signal did not take into account the effects of transit delays from the tagging region to the imaged voxel. More recently, several groups have empha- sized the importance of this effect for quantitative perfu- sion imaging using either continuous or pulsed labeling, and in recent years, a basic model has been developed that we will refer to as the standard model (6, 13, 21, 24-26). The standard model is based on three key as- sumptions:
1. The arrival of labeled blood at a particular voxel is assumed to be via uniform plug flow, so that before an initial transit delay At, no labeled blood arrives,
between t = At and t = At + r , the arriving blood is uniformly labeled; and for t > At + r , the arriving blood is again unlabeled, The time delay At arises because the tagged blood must cross a gap between the tagging region and the image plane. For the pulsed techniques, a gap is necessary to minimize effects due to imperfect slice profiles, and even for the FAIR technique, the slice-selective inversion pulse is typically wider than the imaged slice to ensure a uniform inversion of the image plane (18, 19, 27). For continuous labeling, Af is typically longer than for pulsed labeling because the gap is larger. The duration r of delivery of labeled blood will depend on the spatial cxtent of the inversion band for the pulsed ASL experiments. For EPISTAR and PICORE, this is set by the extent of the slice- selective inversion pulse. For FAIR, the nonselec- tive inversion pulse acts as the tagging pulse, so the extent is set by the size of the RF coil used. For the continuous labeling method, T is the duration of the labeling RF pulse. In the original steady-state ver- sion, T was essentially assumed to be infinite, but in the more recent version described by Alsop and Detre (131, the continuous labeling is a long pulse, with T approximately 3 s. The essential difference between the techniques is that for pulsed ASL, the arterial blood is tagged at one time, t = 0, whereas for continuous ASL, the blood in the tagging region is continuously tagged while the RF is on. With the assumption above, for both techniques c(t) is non- zero only in the interval A t < t < A t + T. In this interval, c(t) = exp[-t/T,,l for the pulsed experi- ment and c(t) = exp[-At/Tlb] for the continuous experiment, where T l b is the longitudinal relax- ation time of blood.
2. The kinetics of water exchange between tissue and blood are assumed to be described by single- compartment kinetics. The essential assumption of single-compartment kinetics is that whatever sub- compartments may exist within the tissue are un- dergoing such rapid exchange of water that their concentration ratios remain constant even though the total tissue concentration is a function of time. In particular, we are assuming that the ratio of the total tissue concentration AM(t) to the venous con- centration is a constant equal to the equilibrium tissue/blood partition coefficient of water, A. With this assumption, r(f) = exp[-ft/A] (28).
3. After the inversion pulse, the magnetization ini- tially decays with the relaxation time of blood, Tlb, but after the labeled water molecules have reached the tissue voxel, the magnetization is assumed to decrease with the relaxation time of the tissue, TI. This essentially assumes that water is completely extracted from the vascular space immediately after arrival in the voxel. In fact, the labeled water is likely to remain in vessels for some time after reach- ing the voxel as the tagged blood travels down the vascular tree to the capillary bed (13), and the con- sequences of this assumption are considered below. With this assumption, m(t) = exp[-t/T,l.

386 Buxton et al.
Thus, the standard model can be summarized as:
c(t) = 0 O < t < A t (pulsed) A t < t < r + A t ff -;: Tlb
ff e - h t / T ~ h (continuous) 0 r + A t < t [21
r( t ) = e Jtlh
m ( t ) = e-””
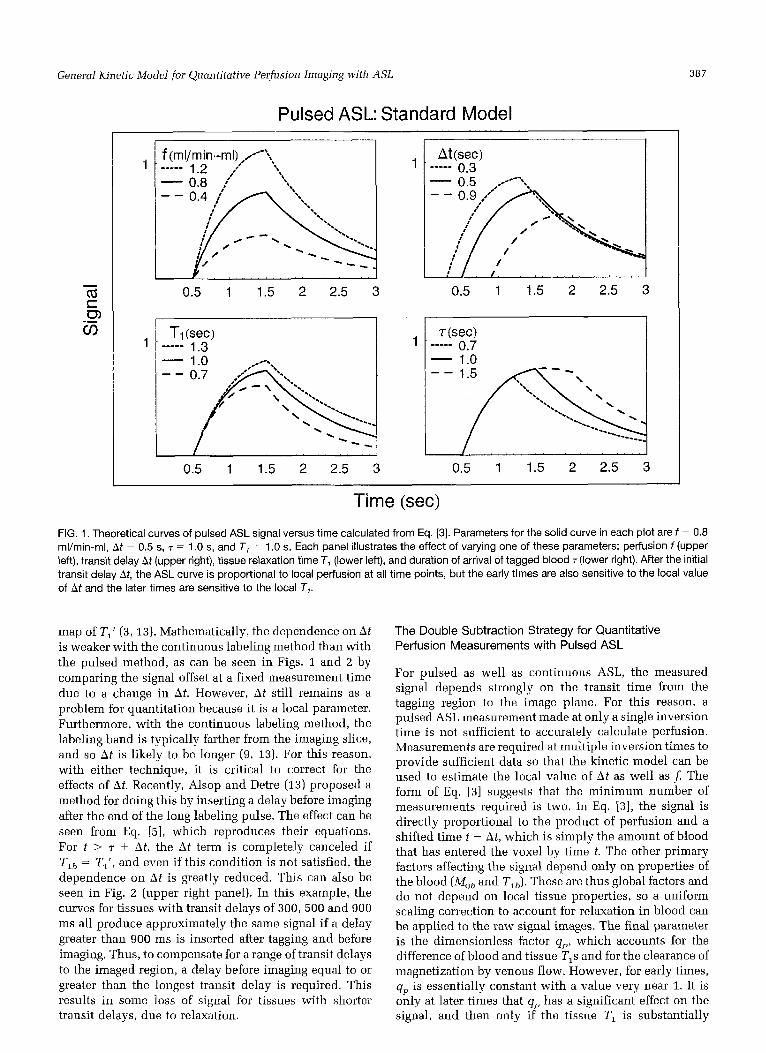
any single time delay, an observed signal difference be- tween two tissues could reflect differences in A t as well as perfusion. The lower left plot shows that the tissue relaxation time primarily affects the later part of the curve. Finally, the lower right plot shows that the width of the arrival time distribution leads to a sharp decrease in the signal after the last of the labeled blood has ar- rived. If r is sufficiently long, the signal will reach a natural maximum where the delivery of magnetization is balanced by clearance. This maximum signal, calculated from Eq. [3], is:
The Pulsed ASL Signal
Applying Eq. [I] with the assumptions represented by Eq. [21 leads to the following expression for the pulsed ASL difference signal:
SM(t) = 0 0 < t < A t = ZM,,Dflt - At)a e-fiT1h gp( t ) A t < t < T + At = 2 ~ , , f T a e-‘’T1h q,(t) r + A t < t
[3]
with
ekt(e-kht - e-kt)
qp ( t ) = A t < t < T i - A t k( t - At)
- = - + - 1 l f TI’ TI A
The motivation for writing the expression for AM(t) in the form of Eq. [3] is that the factors related to different relaxation times and venous clearance are lumped into the term q,(t), which is dimensionless and typically has a value near 1. As k approaches zero, q!, approaches 1. Equation [3] is the standard model for the pulsed ASL signal and is equivalent to equations presented previ- ously (21, 24, 25).
The measured signal difference thus is proportional to the local perfusion f but is also affected by several pa- rameters in addition to perfusion. In Fig. 1, theoretical curves illustrating the dependence of the pulsed ASL signal on several relevant parameters are shown. These ASL curves depend on the longitudinal relaxation time of arterial blood, and measurements of TIL have ranged from approximately 1.1 s at 1.4 T and room temperature (29) to 1.9 s at 4 . 7 T and body temperature (30). For the calculations in this paper, we assumed a value of 1.3 s. The upper left plot shows that the amplitude of the curve is proportional to f, arid the upper right plot shows how the transit delay At shifts the curve along the time axis. Because the signal rises quickly after the delay, measure- ments at only one delay are potentially strongly sensitive to variations in A t across the imaged plane. As a result, at
where
E(p) = p 1/11 8)
The function E(P) varies slowly and is equal to e when p = 1.
The Continuous Labeling ASL Signal
The signal measured with the steady-state technique can also be calculated from Eqs. [I] and [ a ] :
A M ( t ) = 0 Q < t < A l = ZM,,, f TI‘ 01 e-’tiT1h
= 2~,, f T ~ ’ a e-AtiT1h
At < t < r + A t q d t ) l.51
T + A t < t q,,(t) - I t - 7 - h t i / 7’1 ’
with
q,,(t) = 1 - e ‘ f W/11’ A t < t < r + At r + A t < t - - 1 - e - ~ / T ~
Wo have expressed bM(t ) using a dimensionless term q,,(t) to isolate terms related to the approach to the steady state. If t and T are much longer than Tl’, qsq is approxi- mately 1. Under these conditions, the signal reaches a steady state that depends on f , T7’, and Af . This peak steady-state signal is idcntical to the maximum pulsed ASL signal (Eq. 141) except for the factor of ~ ( p ) . That is, the maximum steady-state signal is stronger than the maximum dynamic signal by about a factor of e. This theoretical signal advantage of continuous over pulsed ASL has been discussed previously (31).
As with the pulsed ASL signal, the continiious labeling signal depends on several parameters in addition to the local perfusion f, as illustrated in Fig. 2. For the original steady-state method the signal would be measured at the peak of the curve. The apparent relaxation time (Tl’) enters directly as a multiplicative factor in Eq. [5], and the strong dependence of the signal on TI‘ is evident in Fig. 2. To remove the TI’ dependence of the signal, this parameter is typically measured in another series of ex- periments, and the map of ASL signal is divided by the
General Kinetic Model for Quantitative Perfusion Imaging with ASL
1 T1 (set) ----- 1.3
387
r(sec) - 0.7 - 1.0
Pulsed ASL: Standard Model
1
0.5 1 1.5 2 2.5 3
I : / /
0.5 1 1.5 2 2.5 3
Time (sec) FIG. 1. Theoretical curves of pulsed ASL signal versus time calculated from Eq. [3]. Parameters for the solid curve in each plot are f = 0.8 ml/min-ml, At = 0.5 s, T = 1 .O s, and T, = 1 .O s. Each panel illustrates the effect of varying one of these parameters: perfusion f (upper left), transit delay At (upper right), tissue relaxation time T, (lower left), and duration of arrival of tagged blood T (lower right). After the initial transit delay At, the ASL curve is proportional to local perfusion at all time points, but the early times are also sensitive to the local value of At and the later times are sensitive to the local T,.
map of TIt (3, 13). Mathematically, the dependence on A t is weaker with the continuous labeling method than with the pulsed method, as can be seen in Figs. 1 and 2 by comparing the signal offset at a fixed measurement time due to a change in At. However, A t still remains as a problem for quantitation because it is a local parameter. Furthermore, with the continuous labeling method, the labeling band is typically farther from the imaging slice, and so A t is likely to be longer (9, 13). For this reason, with either technique, it is critical to correct for the effects of At. Recently, Alsop and Detre (13) proposed a method for doing this by inserting a delay before imaging after the end of the long labeling pulse. The effect can be seen from Eq. [ 5 ] , which reproduces their equations. For t > 7 + At, the At term is completely canceled if Tlb = Tl', and even if this condition is not satisfied, the dependence on A t is greatly reduced. This can also be seen in Fig. 2 (upper right panel). In this example, the curves for tissues with transit delays of 300, 500 and 900 ms all produce approximately the same signal if a delay greater than 900 ms is inscrted after tagging and before imaging. Thus, to compensate for a range of transit delays to the imaged region, a delay before imaging equal to or greater than the longest transit delay is required. This results in some loss of signal for tissues with shorter transit delays, due to relaxation.
The Double Subtraction Strategy for Quantitative Perfusion Measurements with Pulsed ASL
For pulsed as well as continuous ASL, the measured signal depends strongly on the transit time from the tagging region to the image plane. For this reason, a pulsed ASI. measurement made at only a single inversion time is not sufficient to accurately calculate perfusion. Measurements are required at multiple inversion times to provide sufficient data so that the kinetic model can be used to estimate the local value of A t as well as f. The form of Eq. [3] suggests that the minimum number of measurements required is two. In Eq. [3], the signal is directly proportional to the product of perfusion and a shifted time t - At, which is simply the amount of blood that has entered the voxel by time t. The other primary factors affecting the signal depend only on properties of the blood (M,,, and T,J. These are thus global factors and do not depend on local tissue properties, so a uniform scaling correction to account for relaxation in blood can be applied to the raw signal images. The final parameter is the dimensionless factor qp, which accounts for the difference of blood and tissue T,s and for the clearance of magnetization by venous flow, However, for early times, qp is essentially constant with a value very near 1. It is only at later times that Q has a significant effect on the signal, and then only if the tissue TI is substantially

388
Continuous ASL: Standard Model
Buxton et al.
- - - -
1 2 3 4 5
1 2 3 4 5
Atisec) ----- 0.3
1 2 3 4 5
1 2 3 4 5
Time (sec) FIG. 2. Theoretical curves of continuous ASL signal versus time calculated from Eq. [5]. Parameters for the solid curve in each plot are f = 0.8 ml/min-ml, At = 0.5 s, T = 3.0 s, and T, = 1 .O s. Each panel illustrates the effect of varying one of these parameters: perfusion f (upper left), transit delay At (upper right), tissue relaxation time T, (lower left), and duration of arrival of tagged blood r (lower right). As with pulsed ASL, after the initial transit delay At, the ASL curve is proportional to local perfusion at all time points. However, the peak, steady-state signal is also sensitive to the local values of At and T,. By inserting a delay after the end of labeling that is longer than the longest At, the sensitivity to A t is much reduced (13).
different from that of blood, Tlb. Furthermore, by assum- ing that the magnetization begins to relax with the relax- ation time of thc tissue as soon as the water enters the voxel, we are undoubtedly overestimating the role of tissue TI. Although perfusion also enters the factor q, in the form of an apparent relaxation time TI ' , it has a negligibly small effect. A typical human CBF of 60 ml/ 100 g/min corresponds to f = 0.01 s ', and with h = 0.9 (32) and TI of approximately 1 s, the difference between TI' and TI is only approximately 1%.
Thus, after a global correction for relaxation in blood, the signal will show an approximately linear increase with time, after the initial transit delay At, with a slope equal to zMoJ. And because Mob is a global parameter, a map of the slope is, in fact, an uncalibrated map of perfusion. Absolute calibration requires a separate mea- surement of Mob (ie. , the image signal of a voxel filled with fiilly relaxed blood). The slope of the curve can be measured with a minimum of two pulsed ASL measure- ments, if the TI of the first measurement is after At, and the second TI is before the end of the tag reaches the slice. We refer to this as a double-subtraction strategy because a pulsed ASL measurement at one TI requires a subtraction of tagged and control images, and the snbse- quent subtraction of two ASL signals at two TIs (after correction for decay in blood) yields a measure of the slope.
Relaxing the Assumptions of the Standard Model
As an illustration of the use of the general model, the effects of adopting more realistic forms for c(t), df), and m(t) are illustrated in Fig. 3. Specifically, we illustrate three different departures from the standard model rep- resented by Eq. 121:
1. The delivery function is replaced by a smoother input function c(t), appropriate for delivery de- scribed by a range of transit times. In Fig. 3 (top), the smoothed versions of c(t) are shown on the left for both pulsed and continuous labeling. The resulting signal curves shown on the right were calculated by numerically calculating the convolution in Eq. [I]. Both the standard model curves and the curves with modified c ( f ) are shown. The time when a typical pulsed ASL measurement is made ( t = 1 s) is indi- cated, along with the time when a measurement is made with continuous labeling using the approach of Alsop and Detre (131, in which a delay is inserted before imaging. For the more conventional contin- uous labeling approach, imaging would occur at the peak of the continuously labeled signal. Because the perfusion estimate is proportional to the signal mag- nitude at these measurement times, the difference between the two curves resulting from different forms of c(t) indicates the magnitude of error in the

Gsnsrcil Kinetic Model for Quantilative Perfusion Imnging wilh ASL 389
0.6 0.5 0.4 0.3 0.2 0.1 0
0 1 2 3 4 5
0.6 0.5 0.4 0.3 0.2 0.1
0 0 1 2 3 4 5
1
0.95
0.9
0.85
0.8 --------- , - - - - - - - ,
I---
0.75 0 1 2 3 4 5
1
0.8
0.6
0.4
0.2
0
signal
0 1 2 3 4 5
0 1 2 3 4 5
0 1 2 3 4 5
0 1 2 3 4 5 0 1 2 3 4 5
Time (sec)
FIG. 3. Effects on the ASL signal curve of relaxing the assumptions about the forms of the delivery function c(t), the residue function r(t), and the magnetization decay function rn(t). Each row illustrates the effect of changing one of these functions. The left panels show the form of the function in the standard ASL kinetic model (Eq. [2]) as a solid curve and the new form as a dashed curve. For the standard model curves, the parameters are: f = 0.8 ml/min-ml, At = 0.5 s, T = 3.5 s, and T, = 1 .O s. The right panel shows how the resulting ASL signal curves are altered, with typical measurement times for pulsed and continuous technique measurements marked with a vertical bar. The measurement time marked “cont.” is the time appropriate for the modification of the continuous technique proposed by Alsop and Detre (1 3); for the original version of continuous ASL, the measurement time is at the peak of the signal curve at 4 s. The first and second rows show that a more rounded input function has little effect on the measured signal for continuous ASL but will lead to errors in the measured slope of the pulsed ASL curve. The third row shows that incomplete extraction of water from the capillary bed has a negligible effect on pulsed ASL but will create a small error with continuous ASL. The fourth row shows that the time when water begins to exchange between blood and tissue is important for both techniques.
estimate of perfusion that will result if c(t) differs from the assumed form. The continuous method is very insensitive to the exact shape of c(t). However, the pulsed method based on measuring the initial
slope is likely to underestimate perfusion (isen, mea- sure a shallower slope) if the earliest portions of the curve are used.
2. Single-compartment kinetics is replaced by a more

390 Buxtoii et al.
trated in Fig. 3 (bottom). In this example, we assumed that exchange of water between blood and tissue does not be- gin until 0.5 s after the water molecule has entered the voxel to allow for a transit time down the vascular tree to the capillary bed. Then, m(t) decays with the relaxation time of blood for the first 0.5 s and with that of tissue thereaf- ter. Although this makes an apparently minor difference in the decay curve, the signal curves are strongly affected, and both ASL techniques will overestimate perfusion by as- suming instantaneous ex- change with tissue. This is still an oversimplified description of water exchange, but more sophisticated models (34) can be included with the proper form of m(t).
EXPERIMENTAL RESULTS
As an initial test of the ade- quacy of the model for describ- ing the kinetics of the pulsed ASL signal, a healthy human subject was imaged with the EPISTAR method, following the guidelines of the commit- tee on clinical investigations and with prior informed con-
FIG. 4. EPISTAR images of a human subject at rest with different delays TI between the inversion pulse and the image acquisition. A high-resolution anatomical image of the slice is in the upper left corner. The EPISTAR signal reflects the delivery of labeled blood to the slice. For short TI, the focal bright spots are likely to be large vessels, but as TI increases, the tagged blood spreads into the brain parenchyma.
complex description of the transit of water through the voxel, described by altering f i t). For this calcu- lation, we included two effects, illustrated in Fig. 3 (middle). First, we included a minimum transit time through the voxel of 1 s to account for the fact that a water molecule must traverse the vascular tree before leaving the voxel by venous flow. Second, we included the effects of incomplete extraction of wa- ter as blood passes through the capillary bed, which has been shown to be a significant effect in rats (33). An extraction fraction of 0.8 was used. To describe these two effects, f i t ) is initially flat at a value of 1 for 1 s, then immediately drops to 0.8, and thereafter decays as in the standard model. This variation in r(t) has essentially no effect on the pulsed ASL signal for times up to the peak but produces a small error in the continuous labeling method at later times.
3 . The oversimplified assumption that the magnetiza- tion begins to decay with the TI of local tissue immediately upon entering the voxel is replaced by a more realistic description of the tissuelblood ex- change of water, described by altering m(t), as illus-
sent. Imaging was performed with a 1.5-T whole-body echo-
planar imaging system [Siemens Medical Systems, Erlan- gen, Germany). The EPISTAR pulse sequence was previ- ously described by Edelman et al. (14). An axial slice through the brain was selected to include the hand motor area. Slice thickness was 1 cm, and a 9-cm-thick arterial inversion band was applied below the slice with a 1-cm gap. A 23-ms hyberbolic secant inversion pulse was used to produce a slice profile with a sharp edge. To balance possible magnetization transfer effects due to the inver- sion pulse, the control image was acquired with an iden- tical inversion pulse applied symmetrically above the imaged slice. Images were acquired with TR = 2.5 s and TE = 16 ms and seven delay times (TI) ranging from 0.2 to 2.2 s. To produce high signal-to-noise ratio subtraction images, 24 averages were done for each TI. Finally, for each TI images were collected while the subject was motionless [the rest image) and while the subject contin- uously performed a right hand finger-tapping exercise (the activation image).
In Fig. 4, the EPISTAR subtracted images (control mi- nus arterial labeling) acquired during rest are shown. The rather focal bright spots on the early delay images are probably due to larger arteries, but as the delay is in-
General Kinetic Model for Quantitative Perfusion Imaging with ASL 391
Eq. 131. varying tho overall am- plitude 2M,,f, the initial tran- sit delay At, and the range of transit times T to minimize the sum of the squared differences between the model and the data. The other parameters were held fixed at Tlb = 1.3 s, an assumed value for blood, and T, = 1.0 s , the value esti- mated from fitting the control images to a saturation recovery curve. For perfusion calcula- tions, only the data points for delays less than or equal to 1.2 s were used, because we expect that the earlier points will have a strong dependence on perfusion but only a weals dependence on the local tissue Tl. Repeated fitting, varying T, to 0.7 s, produced only a 10% change in the best fit am- plitude.
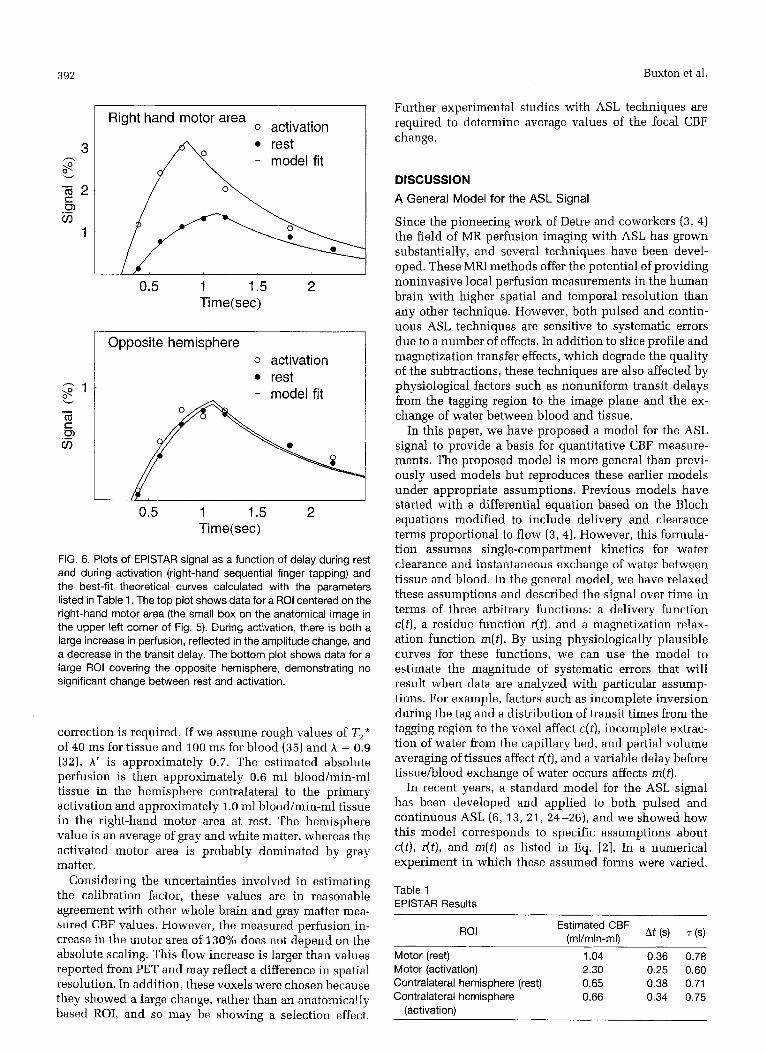
The calculated parameters are listed in Table 1, and the corresponding theoretical curves are plotted along with the data in Fig. 6. For each data set, the model provides a reasonably good fit to the data. The ratio of the best fit amdi- tudes indicates a local in- crease in perfusion in the right-hand motor area by a fac- tor of 2.3 during activation, ac-
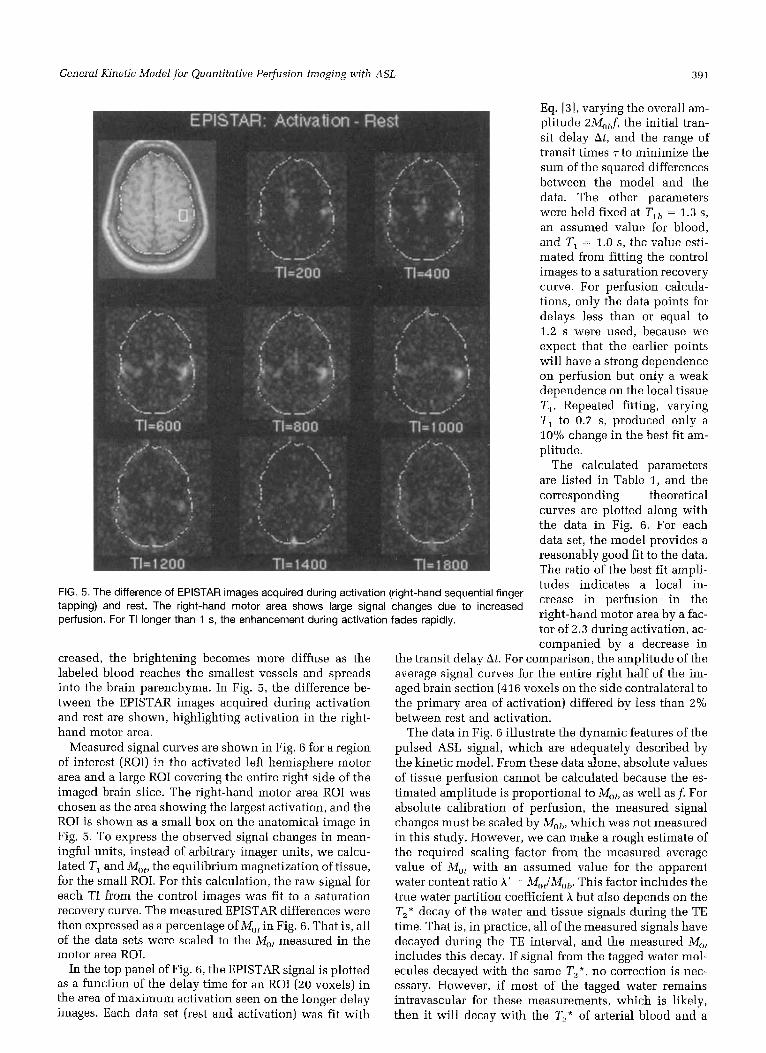
FIG. 5. The difference of EPISTAR images acquired during activation (right-hand sequential finger tapping) and rest. The right-hand motor area shows large signal changes due to increased perfusion. For TI longer than 1 s, the enhancement during activation fades rapidly.
creased, the brightening becomes more diffuse as the labeled blood reaches the smallest vessels and spreads into the brain parenchyma. In Fig. 5 , the difference be- tween the EPISTAR images acquired during activation and rest are shown, highlighting activation in the right- hand motor area.
Measured signal curves are shown in Fig. 6 for a region of interest (ROI) in the activated left hemisphere motor area and a large ROI covering the entire right side of the imaged brain slice. The right-hand motor area ROI was chosen as the area showing the largest activation, and the ROI is shown as a small box on the anatomical image in Fig. 5. To express +he observed signal changes in mean- ingful units, instead of arbitrary imager units, we calcu- lated TI and Mot, the equilibrium magnetization of tissue, for the small ROI. For this calculation, the raw signal for each TI from the control images was fit to a saturation recovery curve. The mcasured EPISTAR differences were then expressed as a percentage of in Fig. 6. That is, all of the data sets were scaled to the M,, measured in the motor area ROI.
In the top panel of Fig. 6, the EPISTAR signal is plotted as a function of the delay time for an ROI (20 voxels) in the area of maximum activation seen on the longer delay images. Each data set (rest and activation) was fit with
companied by a decrease in the transit delay At. For comparison, the amplitudc of the average signal curves for the entire right half of the im- aged brain section (416 voxels on the side contralateral to the primary area of activation) differed by less than 2% between rest and activation.
The data in Fig. 6 illustrate the dynamic features of the pulsed ASL signal, which are adequately described by the kinetic model. From these data alone, absolute values of tissue perfusion cannot be calculated because the es- timated amplitude is proportional to Mot) as well as f . For absolute calibration of perfusion, the measured signal changes must be scaled by M,,, which was not measured in this study. However, we can make a rough estimate of the required scaling factor from the measured average value of M,, with an assumed value for the apparent water content ratio A ’ = M,JMo,. This factor includes the true water partition coefficient A but also depends on the T,* decay of the water and tissue signals during the TE time. That is, in practice, all of the measured signals have decayed during the TE interval, and the measured M,,, includes this decay. If signal from the tagged water mol- ecules decayed with the same T,*, no correction is nec- essary. However, if most of the tagged water remains intravascular for these measurements, which is likely, then it will decay with the TL* of arterial blood and a
392 Buxton et al.
Right hand motor area 0 activation
rest - model fit
0.5 1 1.5 2 Ti me (sec)
0 activation rest
0.5 1 1.5 2 Ti me(sec)
FIG. 6. Plots of EPISTAR signal as a function of delay during rest and during activation (right-hand sequential finger tapping) and the best-fit theoretical curves calculated with the parameters listed in Table 1. The top plot shows data for a ROI centered on the right-hand motor area (the small box on the anatomical image in the upper left corner of Fig. 5). During activation, there is both a large increase in perfusion, reflected in the amplitude change, and a decrease in the transit delay. The bottom plot shows data for a large ROI covering the opposite hemisphere, demonstrating no significant change between rest and activation.
correction is required. If we assume rough values of Tz* of 40 ms for tissue and 100 ms for blood (35) and A = 0.9 (32). A' is approximately 0.7. The estimated absolute perfusion is then approximately 0.6 ml blood/min-ml tissue in the hemisphere contralateral to the primary activation and approximately 1.0 ml bloodimin-ml tissue in the right-hand motor area at rest. The hemisphere value is an average of gray and white matter, whereas the activated motor area is probably dominated by gray matter.
Considering the uncertainties involved in estimating the calibration factor, these values are in reasonable agreement with other whole brain and gray matter mea- sured CBF values. However, the measured perfusion in- crease in the motor area of 130% does not depend on the absolute scaling. This flow increase is larger than values reported from PET and may reflect a difference in spatial resolution. In addition, these voxels were chosen because they showed a large change, rather than an anatomically based ROI, and so may be showing a selection effect.
Further experimental studies with ASL techniques are required to determine average values of the focal CBF change.
DISCUSSION A General Model for the ASL Signal
Since the pioneering work of Detre and coworkers (3, 4) the field of MR perfusion imaging with ASL has grown substantially, and several techniques have been devel- oped. These MRI methods offer the potential of providing noninvasive local perfusion measurements in the human brain with higher spatial and temporal resolution than any other technique. However, both pulsed and contin- uous ASL techniques are sensitive to systematic errors due to a number of effects. In addition to slice profile and magnetization transfer effects, which degrade the quality of the subtractions, these techniques are also affected by physiological factors such as nonuniform transit delays from the tagging region to the image plane and the ex- change of water between blood and tissue.
In this paper, we have proposed a model for the ASL signal to provide a basis for quantitative CBF measure- ments. The proposed model is more general than previ- ously used models but reproduces these earlier models under appropriate assumptions. Previous models have started with a differential equation based on the Bloch equations modified to include delivery and clearance terms proportional to flow (3, 4). However, this formula- tion assumes single-compartment kinetics for water clearance and instantaneous exchange of water between tissue and blood. In the general model, we have relaxed these assumptions and described the signal over time in terms of three arbitrary functions: a delivery function c(t), a residue function r(t). and a magnetization relax- ation function rn(t). By using physiologically plausible curves for these functions, we can use the model to estimate the magnitude of systematic errors that will result when data are analyzed with particular assump- tions. For example, factors such as incomplete inversion during the tag and a distribution of transit times from the tagging region to the voxel affect c(t), incomplete extrac- tion of water from the capillary bed, and partial volume averaging of tissues affect r(t) , and a variable delay before tissue/blood exchange of water occurs affects m(t).
In recent years, a standard model for the ASL signal has been developed and applied to both pulsed and continuous ASL (6 ,13 , 21 , 24-26), and we showed how this model corresponds to specific assumptions about c(t), dt), and m(t) as listed in Eq. [ a ] . In a numerical experiment in which these assumed forms were varied,
Table 1 EPISTAR Results
Estimated CBF (ml/min-ml\ At ('1 ('1 ROI
Motor (rest) 1.04 0.36 0.78 Motor (activation) 2.30 0.25 0.60 Contralateral hemisphere (rest) 0.65 0.38 0.71 Contralateral hemisphere 0.66 0.34 0.75
(activation)

General Kinetic Model for Qucmfitative Perfusion Imaging with A S L 393
the pulsed ASL signal at early times was not sensitive to the exact form of r(t) but depended on the early form of c(t) and somewhat on m(t). The continuous ASL signal was not sensitive to the form of c(t) but did depend on the forms of r(t) and m(t). That is, both methods are sensitive to the time of exchange of tagged water molecules be- tween tissue and blood, continuous ASL is somewhat sensitive to incomplete extraction of water from the cap- illary, and pulsed ASL based on measuring the initial slope is sensitive to the shape of the delivery curve.
In this work, we have defined perfusion f as the vol- ume of arterial blood delivered to a voxel volume per second. This definition is thus voxel-based, which is a natural choice for image-based perfusion measurements. The advantage of this approach is that f is then the average flow within a voxel, and adding several voxel values of f will give an accurate measurement of total flow in the ROI. However, this definition differs slightly from the more common definition of perfusion as volume of blood per gram of tissue per second. To express f in these terms, we must scale it by the local density of the voxel.
Because the quantity we measure is average flow to the voxel, f i s subject to partial volume effects. For example, if a voxel at the edge of the brain is only half filled with tissue, the measured perfusion will be only half as much as that for a voxel filled with tissue. That is, the average perfusion in the voxel is accurately measured, but the true flow per gram of tissue is unknown. Note that this is not a result of our choice of units discussed above but is rather a result of the nature of the measurement. This problem afflicts all image-based perfusion measure- ments, including positron emission tomography. The only way to correct for these partial volume effects is to devise a method for separate measurement of the local density of perfused tissue.
In experiments on a human subject, the standard model provided a good quantitative description of the EPISTAR signal as a function of delay time. According to the model, the ASL signal is proportional to the local CBF but also depends on other local properties of the tissue, as illustrated in Figs. 1 and 2 , and global param- eters related to blood [Mo1, and T,!)). The global parame- ters affect all voxels equally and affect the absolute cali- bration of imager signal intensity in units of CBF. The other local parameters affecting the signal are the transit delay A t from the labeling region to the voxel and the local tissue T,. To calculate a quantitative map of perfu- sion, these other parameters must either he measured and taken into account or their effect on the measured signal must be minimized.
The Role of At
Comparing the steady-state and pulsed ASL methods, the steady-state technique theoretically is more sensitive (i.e., produces a larger signal change for the same perfu- sion and transit time), as has been argued previously (23, 31). However, both techniques potentially suffer from significant systematic errors due to variations in the transit time from the tagging band to the image voxels. To make quantitative perfusion maps, these effects must be
carefully controlled with either method. With the inno- vation proposed by Alsop and Detre (13), the sensitivity to At in continuous ASL is greatly reduced by inserting a time delay after ending the labeling RF pulse before acquiring the image. This approach is highly effective in reducing sensitivity to At, hut the cost is a reduction of the signal due to relaxation in tissues with a transit delay shorter than the inserted delay before imaging.
For pulsed ASL, the form of the standard model sug- gests an imaging strategy for reducing the confounding effects of variable A t and T , using repeated images with delays in the range 0.3-1.2 s. The multiple measurements allow A t to be measured, and for these shorter delay times, the signal depends only weakly on the local TI. In fact, an uncalibrated perfusion map can be constructed from measurements at just two delay times. As long as the first delay is longer than the range of transit delays in the slice and the second occurs before the arrival of the end of the tag, the two measured signals can be used to calculate a slope. Each signal must first be multiplied by a correction factor to account for relaxation in blood, analogous to a correction for radioactive tracer decay in nuclear medicine studies. After this correction, the mea- sured slope is directly proportional to the local perfu- sion. Calculation of the constant of proportionality re- quires an additional measurement of the Mob of blood. However, in clinical studies in which the goal is to iden- tify focal regions of abnormal perfusion rather than global changes, an uncalibrated perfusion map may be sufficient.
Because of the confounding effects of transit delays, conventional pulsed ASL measurements at only a single TI cannot be taken as quantitative measurements of per- fusion. Furthermore, because A t may change with activa- tion, as in the experimental data shown in Fig. 6, the ratio of single TI pulsed ASL signals during activation and rest may not be a reliable quantitative measure of the frac- tional flow change. The strategy of using several TIs is effective in minimizing the confounding effect of transit delays but is costly in terms of required imaging time. Recently, Wong et al. (21, 36, 37) introduced two new variations of pulsed ASL designed to control for the effects of A t while still requiring only a single subtrac- tion. In QUIPSS (quantitative imaging of perfusion using a single subtraction), a standard pulsed ASL pulse se- quence (eg., EPISTAR, FAIR, or PICORE) is modified by the addition of a saturation pulse applied to the image plane after a delay TI, sufficiently long to allow tagged blood to begin to arrive at all of the voxels in the slice (21, 36). The effect is that the tag that has already arrived (i.e., in voxels with a shorter A t ) is destroyed, and after TI,, the tagged blood in the voxel increases in proportion to the local perfusion. The QUIPSS modification of pulsed ASL can be described by the standard model by replacing the tissue-dependent parameter At with the pulse sequence parameter TI,.
An alternative strategy for reducing the effects of A t in pulsed ASL is to image after a delay after the arrival of the end of the tag, analogous to the method used for continuous ASL (13). In Fig, 1, it is shown that the signal is only weakly sensitive to At in the later parts of the curve. However, for pulsed ASL, the signal also depends

394 Buxton et al.
strongly on the duration T of the tag, and T typically is not known and is tissue dependent. In the other single- subtraction technique, QUIPSS 11, a saturation pulse is applied to the tagging band after a delay TI, to cut off the tail end of the tag and produce a bolus of tagged blood with a well-defined duration (21, 37). After a further delay to allow this bolus to reach all of the voxels in the imaging plane, an image is acquired. The QUIPSS 11 signal also can be described by the standard model, with the tissue-dependent parameter 7 replaced by TI,. The QUIPSS techniques are described in more detail in an- other paper (37).
The Role of A and Mob
We have cast our expression for the ASL signal in terms of the equilibrium magnetization of blood, Mob, The par- tition coefficient of water, A , plays a negligible role, en- tering only in the venous clearance term that makes T,’ slightly different from T,, In the original work of Detre el al. ( 3 ) and in later work (13, 23, 251, the equations were cast in terms of Mo, /A , where M,,, is the equilibrium magnetization of tissue. These two formulations are equivalent if the partition coefficient of water A is de- fined as the ratio Mo,/Mob, but there are two good reasons for explicitly specifying that it is the equilibrium magne- tization of blood that matters. First, the overall scaling of the signal by M,, is a global scaling and not a local tissue-dependent scaling. Describing this parameter as M,JA can give the misleading impression that it depends on local tissue properties, since both M,, and A are each local tissue properties. Second, the ratio A ‘ = M,,t/M,,b may not be equal to the classical equilibrium partition coefficient of water A. For example, if there are substan- tial pools of water in tissue that are not visible in a standard MR experiment (e.g., the short T, pools respon- sible for magnetization transfer effects), then A’ may be less than the water partition coefficient A measured with radioactive tracers. Furthermore, A ’ must also take into account that an experimentally measured Mot includes Tz or T,* weighting, which requires an additional scaling correction if blood/tissue exchange is not instantaneous. In this case, estimating Mnh from a measurement of M,, and an assumed literature value of A may lead to substan- tial systematic errors in quantifying flow. For our illus- trative data set, we used this procedure to estimate the global scaling factor, but only as a rough estimate. Abso- lute quantitative measurement of local perfusion requires accurate measurements of arterial Mob, T,?>, and Tz,,*. In short, the local ASL difference signal depends on Mob and not on Mot, so that absolute calibration of perfusion requires a measurement of Mob.
The Role of T,
For pulsed ASL, the early parts of the signal curve are only weakly sensitive to the tissue TI, and as a result, the use of an assumed value for TI is not likely to lead to large errors. In contrast, with the steady-state technique, Tl enters as a multiplicative factor, so the signal is as sensitive to the local TI as it is to perfusion. To control for Tq variations, a map of TI usually is acquired in
addition to the ASL data to produce a quantitative map of perfusion.
However, the standard model likely overestimates the role of tissue T,, because it assumes that the tag begins to decay with the TI of tissue as soon as the labeled water molecules enter the tissue. More realistically, some time must be required for the tagged water to move down the vascular tree and reach the capillary bed. The numerical calculation using the general model (Fig. 3 ) shows that the time of exchange can have a strong effect on the ASL signal. Further work, with more realistic models of water exchange between blood and tissue, is required to define the role of tissue TI in ASL measurements, particularly for the continuous method and for pulsed techniques using QUIPSS 11.
Kwong and coworkers (18, 22, 23, 31) have developed and analyzed an alternative strategy for quantitating per- fusion called the TI method that uses the same data as in the FAIR experiment (images with slice selective and nonselective inversion pulses at several delay times) but a different approach to the analysis. Rather than subtract- ing each pair of images at the same delay, each set of images is instead analyzed as an inversion recovery curve to measure T,. Tho difference in relaxation rates is then interpreted as f /A , based on the expression for the apparent T,’ in Eq. [3]. In effect, these two approaches focus on two different roles of perfusion in affecting the kinetics of water: f controls both delivery and clearance (28). The amount of water delivered is directly propor- tional to f. but the rate at which total tissue water clears from the voxel depends on f lh (i.e., f/A is the fraction of total tissue water leaving per second). In the subtractive approach described in this paper, the goal is to subtract out tissue signal to isolate the blood signal. In this way, f affects the signal through its role in governing the deliv- ery of tagged water to the voxel, and its role in clearance of the tag is negligible compared to relaxation. The Tl method, on the other hand, focuses on the role o f f in clearing tissue water carrying partially inverted magne- tization (and replacing it with fully relaxed water so that the effect of flow is an apparent enhancement of T , decay).
The T, method has the advantage that it is not as sensitive to global scaling factors in the image that differ between the two sets of images, such as an imperfect match of the effects of the selective and nonselective inversion pulses on the imaged slice. In addition, the method can be applied to surface coil measurements in which detector RF coil inhomogeneity complicates the interpretation of the MR signal as a direct measure of water content. However, the disadvantage of this ap- proach is that A is a local tissue property that is not well characterized nor easily measured. With the subtractive approach, it is possible to create perfusion maps that do not depend on A, as discussed above. In addition, as long as the selective inversion slice is wider than the imaged slice, there will be transit delay effects that will intro- duce systematic errors in the T, method. Further work is needed to compare these two different approaches to analyzing ASL experiments.

General Kinetic iModel for Quantitative Perfusion Imaging with ASL 395
Additional Perfusion Quantitation issues
Several issues that are related to perfusion quantitation require further investigation. The model assumes that labeled blood does not contribute to the signal from a voxel until those water molecules have been extracted from the capillary bed and have joined the pool of tissue water. In practice, this is not likely to be true (g), partic- ularly for the short delay times involved in pulsed ASL experiments (26). That is, a significant portion of the spins producing the signal may still be in the vascular space (small arteries, arterioles, and capillaries). How- ever, this fact, in itself, does not compromise the accu- racy of the perfusion measurement as long as all of the vascular spins contributing to the signal are destined to eventually reach a capillary bed within that voxel. Then, those spins are properly counted as contributing to the perfusion of the voxel. The only error that comes in is the assumption that decay after arrival is by the ‘TI of tissue rather than blood.
However, a potentially more serious inaccuracy can arise from additional, unwanted vascular signal (9, 21, 26). Perfusion will be overestimated if there is a signal contribution from large arteries passing through the voxel carrying blood that will be delivered to a cap- illary bed in another voxel. Also, venous blood that is tagged either by the labeling pulse or the control pulse and subsequently moves into the voxel could lead to either an overestimate or underestimate of perfusion, depending on whether the blood entered from the bottom or the top of the slice. These effects will occm in larger vessels and are likely to produce focal spots where per- fusion measurements are inaccurate, which will, in turn, lead to inaccuracies in measurements from large ROIs that include larger vessels.
In practice, the signal from large arteries is typically destroyed in the course of the echo-planar imaging ac- quisition. We could further ensure that the unwanted vascular signal does not contribute by adding bipolar gradient pulses to spoil the signal from flowing blood (9, 21, 38). However, it is not necessary to remove all of the vascular signal. Using strong gradient pulses to spoil the signal in the smaller arterial vessels that lead to capillary beds within the voxel will, in effect, simply delay the appearance of these spins in the signal until they have arrived at the capillary bed. That is, the effect of excessive spoiling would be an increase in the transit delay, with no improvement in the accuracy of the per- fusion measurement.
In addition to these theoretical concerns related to the quantitative meaning of perfusion, several experimental effects can also lead to systematic errors. Any effect that compromises the quality of the image subtractions will introduce errors, because our essential assumption is that the signal difference is due entirely to labeled spins. In pulsed ASL, slice profile effects due to the tagging pulse are potential sources of error (20) , and in continuous labeling, magnetization transfer effects are important (5, 8, 39). In addition, the quality of the subtraction will also depend on the quality of the magnetic field shim, Because the gradient strength used in the slice-selective inversion pulse and the excitation pulse are different, an
inhomogeneous field may shift the location of the inver- sion bands relative to the slice, introducing a sensitivity to the slice profile of the inversion pulse.
In conclusion, dynamic ASL methods show consider- able promise for providing quantitative measurements of perfusion. Kinetic modeling can serve as a guide for interpreting these measurements and designing experi- ments that limit the systematic errors due to the effects of other tissue parameters on the signal.
REFERENCES 1. P. V. Prasad. K. R. Edelman, R. B. Buxton, Magnctic resonance perfu-
sion imaging. lnf. J. Imuging Sjrst. Technol. 6 , 230-237 (1995). 2. K. K. Kwong. Functional magnetic resonance imaging with echo pla-
nar imaging. Magn. Reson. Q. 11, 1-20 (1995). 3. J. A. Detre, J, S. Leigh, D. S . Williams, A. P. Koretsky, Perfiision im-
aging. M a p . Reson. Med. 23, 37-45 (1992). 4. D. S. Williams, J. A. Detre, J. S. Leigh, A. P. Koretsky, Magnetic rcs-
onance imaging of perfusion using spin-inversion of arterial water.
5.
6.
7.
8.
9.
10.
11.
12.
13.
14.
15.
16.
17.
18.
19.
20.
Froc. Natl. &ad. Sci. U. S. A. 89, 212-216 (1992). W. Zhang, D. S. Williams, J. A. Detre, A. P. Koretsky, Measurement of brain perfusion by volume-localized NMR spectroscopy using inver- sion of arterial water spins: accounting for transit time and cross- relaxation. Magn. Reson. &,led. 25, 362-371 (1992). W. Zhang, D. S. Wiliams, A. P. Koretsky, Measurement of rat brain perfusion by NMR using spin labcling of artqial water: in vivo de- Lcrmination of the degree of spin labeling. Magn. Reson. Med. 29, 116-421 (1993). W. Zhang, A. C. Silva, D. S. Williams, A. P. Koretsky, NMR measure- ment of perhsioii using arterial spin laheling without saturation of macromolecular spins. Mugn. Reson. Med. 33, 370-376 (1995). 1. Pekar, P. Jezzard, D. A. Roberts, J. S. Leigh, J. A. Frank, A. C. McLaughlin, Perfusion imaging with compensation 101 asymmetric magnetization transfer effects. Muingn. Rcson. Med. 35, 70-79 (1996). F, Q. Ye, V. S . Matay, 1’. JeLzard, J. A. Frank, D. R. Weinberger, A. C. McLaughlin, Correction for vascular artifacts in cerebral blood flow values measured by using arterial spin tagging techniques. Mugn. Reson. Med. 37, 226-235 (1997). E. G. Walsh, K. Minomatsii, J. Leppo, S. C. Moore. Radioactive mi- crosphere validation of a volume localized continuous saturation perfusion measurement. Magn. Reson. Med. 31, 147-153 (1994). D. A. Roberts, J. A. Detre, L. Bollinger, E. K. Insko, J. S. Leigh, Quan- titative magnetic resonance imaging of human brain perfusion at 1 .5 T using steady-state inversion of arterial water. Pruc. Nad. Acud.
F. Q. Ye, J. J. Pekar, P. Jezzard, J. Tliiyn, J. A. Frank, A. C. McIaughlin, Perfusion imaging of the human brain at 1.5 ‘I using a single-shot EPI spin tagging approach. Mugn. Rcson. Med. 36, 219-224 (3996). 11. C. Alsop, J. A. Detre, Rednced transit-time sensitivity in noninva- sive magnetic resonance imaging of human cerebral blood flow. J. Cereb. Blood FlowMefczb. 16, ‘1236-1249 (1996). R. R. Edelman, B. Siewert, D. G. Darbp, 17. Thangarai, A. C. Nobre, M. M. Mesulam. S. Warach, Qualitative mapping of cerebral blood flow and functional localization with echo-planar MR imaging and signal targeting with alterriating radio frequency (STAR) sequences: applications to MR angiogruphy. Radiology 192, 513-520 (1994). R. K. Edelman, B. Sievert, P. Wielnpolski, J. Pearlman, S. Warach, Noninvasive mapping of cerebral perfusion by using EPISTAK MK angiography [abstract]. J. Magn. Reson. Imagining 4(P), 68 (1994). R. R. Edelman, B. Siewerl, M. Adamis, J. Gaa, G. Lanb, P. Wielopol- ski, Signal targeting with alternating radiofrequency. M a p . Reson. Med. 31, 233-238 (1994). S. J. Wang, D. G. Nishimura, A. Macovski, Fast angiography using selective inversion recovery. Mugn. Reson. Med. 23, 109-121 11992). K. K. Kwong, D. A. Chesler, R. M. Weisskoff, B. R. Rosen, Perfusion MK imaging, in “Proc., SMR, 2nd Annual Meeting, San Francisco, 1994,” p. 1005. S. -G. Kim, Quantifir:ation ur regional cerdihrd blood flow change by flow-sensitive alternating inversion recovery (FAIR) technique: ap- plication to functional mapping. Magn. Reson. Med. 34, 293-301 (1995). L. R. Frank, E. C. Wong, R. B. Buxton, Slice profile effects in adiabatic
(I. S. A. 91, 33-37 (19941.
396 Buxton et al.
inversion: application to multislicc perfusion imaging. Magn. Reson.
21. E. C. Wong, R. B. Buxton, L. R. Frank, Implementation of quantitative perfusion imaging techniqucs for functional brain mapping using pulsed arterial spin labeling. NMR Biomed. 10, 237-249 (1997).
22. K. K. Kwong, J. W. Belliveau, D. A. Chesler, I. B. Goldberg, R. M. Weisskoff, B. P. Poncelet, D. N. Kennedy, B. E. Hoppel, M. S. Cohen, R. Turner, H. -M. Cheng, T. J. Brady, B. R. Rosen, Dynamic magnetic resonance imaging of human brain activity during primary sensory stimulation. PFOC. Nut]. Acad. Sci. U . S . A. 89, 5675-5679 (1992).
23. K. K. Kwong, D. A. Chesler, R. M. Weisskoff, K. M. Donahue, T. I,. Davis, L. Ostergaard, T. A. Campbell, B. R. Rosen, M R perfusion studies with TI-weighted echo planar imaging. Magn. Reson. Med.
24. R. B. Buxton, L. R. Frank, B. Siewert, S. Warach, R. R. Edelman, A quantitative model for EPISTAR perfusion imaging, in “Proc., SMR, 3rd Annual Meeting, Nice, 1995,” p. 132.
2 5 . F. Calamante, K. K. Kwong, S. R. Williams, N. v. Bruggen, R. Turner, Quantification of perfusion in pulsed labeling techniques. in “Proc., SMR, 3rd Annual Meeting, Nice, 1995,” p. 870.
26. R. B. Buxton, E. C. Wong, L. R. Frank, Quantitation issues in perfu- sion measurement with dynamic arterial spin labeling, in “Proc., ISMRM, 4th Meeting, New York, 1996,” p. 10.
27. S. -G. Kim, N. V. Tsckos, Perfusion imaging by a flow-sensitive alter- nating inversion recovery (FAIR] technique: application to functional brain imaging. M a p . Reson. Med. 37, 425-435 (1997).
28. R. B. Biixton, L. R. Frank, P. V. Prasad, Principles of diffusion and perfusion MRI, in “Clinical Magnetic Resonance Imaging” (R. R. Edelman, J. H. Hesselink, M. B. Zlatkin, Eds.), p. 233-270, W.B. Saunders, Philadelphia, 1996.
29. R. G. Bryant, K. Marill, C. Blackmore, C. Francis, Magnetic relaxation in blood and clots. hfugn. Reson. Med. 13, 133-144 (7990).
30. C. Schwarzbaucr, S. P. Morrissey, A. Haase, Quantitative magnetic
Med. 38, 558-564 (1997).
34, 878-887 (1995).
resonance imaging of perfusion using magnetic labeling of water proton spins within the detection slice. iMagn. Reson. M i d . 35, 540- 546 (1996).
31. D. A. Chcsler, K. K. Kwong, An intuitive guide to the TI based per- fusion model. Int. 1. Imaging Syst. Technol. 6 , 171-174 (1995).
32. P. Hcrscovitch, M. E. Raichle, What is the corrcct value for the b r a h blood partition coefficient for water? J. Cereh. Blood Flow Metab. 5, 65-69 (1985).
33. A. C. Silva, W. Zhang, D. S. Williams, A. P. Koretsky, Estimation of water extraction fractions in rat brain using magnetic resomiice mea- suremcnt of perfusion with arterial spin labeling. Mogn. Reson. Med. 35, 58-68 (1997).
34. W. R. Bauer, K. -H. Hiller, F. Roder, E. Rommel, G. Eel, A. Haase, Magnetization exchange in capillaries by microcirculation affects diffusion-controlled spin-relaxation: a model which describes the effect of perfusion on relaxation enhancement by intravascular con- trast agents. Magn. Reson. Med. 35, 43-55 (1996).
35. J , L. Boxerman, P. A. Bandettini, K. K. Kwong, J. R. Baker, T. L. Davis, B. R. Rosen, R. M. Weisskoff, The intravascular contribution to fMRI signal change: Monte Carlo modeling and diffusion-weighted studies in r.ivo. M a p . Reson. Med. 34, 4-10 (19951.
36. B. C. Wong, R. B. Buxton, L. R. Frank, Quantitative imaging of perfu- sion using a single subtraction (QUIPSS). Neuroimage 3, (1996).
37. E. C. Wong, R. B. Buxton, L. R. Frank, Quantitative imaging of perfu- sion using a single subtraction (QUIPSS and QLJPSS 11). M a g .
38. S. -G. Kim, K. Ugurbil, Separation of macro- and micro-vascular components in CBF-based fMRI, in “Proc., ISMRM, 4th Annual Meet- ing, New York, 1996,” p. 289.
39. A. C. McLaughlin, F. Q. Yc, J. J. Pckar, A. K. S. Santha, J. A. Frank, Effect of magnetization transfer on the measuremcnt of cerebral blood flow using steady-state arterial spin tagging approaches: a theoretical investigation. Magn. Reson. Med. 37, 501-510 (1997).
Reson. &fed. 39, 702-708 (1998).