Embed Size (px)
Citation preview

A (g − 2)µ Experiment to ±0.2 ppm Precision
BNL P969
New (g − 2)µ Collaboration: R.M. Carey1, A. Gafarov1, I. Logashenko1, K.R.
Lynch1, J.P. Miller1, B.L. Roberts1, G. Bunce2, W. Meng2, W.M. Morse2, Y.K.
Semertzidis2, D. Grigoriev3, B.I. Khazin3, S.I. Redin3, Yuri M. Shatunov3, E.
Solodov3, Y. Orlov4, P. Debevec5, D.W. Hertzog5, P. Kammel5, R. McNabb5,
F. Mulhauser5, K.L. Giovanetti6, K.P. Jungmann7, C.J.G. Onderwater7, S.
Dhamija8, T.P. Gorringe8, W. Korsch8, F.E. Gray9, B. Lauss9, E.P. Sichtermann9,
P. Cushman10, T. Qian10, P. Shagin10, S. Dhawan11, and F.J.M. Farley11
1Department of Physics, Boston University, Boston, MA 02215
2Brookhaven National Laboratory, Upton, NY 11973
3Budker Institute of Nuclear Physics, Novosibirsk, Russia
4Newman Laboratory, Cornell University, Ithaca, New York 14853
5Department of Physics, University of Illinois, Urbana-Champaign, IL 61801
6Department of Physics, James Madison University, Harrisonburg VA 22807
7Kernfysisch Versneller Instituut, Rijksuniversiteit,
Groningen, NL 9747 AA Groningen, the Netherlands
8Department of Physics, University of Kentucky, Lexington, Kentucky 40506
9University of California, Berkeley and Lawrence Berkeley Laboratory, Berkeley, CA 94720
10Department of Physics, University of Minnesota, Minneapolis, MN 55455
11 Department of Physics, Yale University, New Haven, Connecticut 06520
Fast extracted proton beam to the V-target. 12 or 24 bunches per
AGS cycle, 60 TP per cycle, minimum possible AGS cycle time.
Spokespersons: B. Lee Roberts ([email protected], 617-353-2187)
David W. Hertzog ([email protected], 217-333-3988)
Resident-spokesperson: William M. Morse ([email protected], 631-344-3859)
1

Abstract
The E821 Collaboration measured the muon anomalous magnetic moment aµ to a precision of
0.54 ppm. It differs from standard model theory by 2.4 standard deviations. We propose to carry
out an upgraded effort at the AGS to reach a precision of ±0.2 ppm, a factor of 2.5 improvement.
This step forward will be well matched to anticipated advances in the worldwide effort to
determine the standard model theoretical value for aµ . With the anticipated improved theory
value, the future experiment-theory comparison would have an uncertainty of ≈ 4 − 5 × 10⁻¹⁰,
allowing stringent tests of standard model extensions. The principal feature of the new experiment
is a redesigned pion / muon beamline that will deliver a significantly higher muon flux and
eliminate the hadronic flash at injection. The higher statistical sample will require a new detector,
electronics and data acquisition system and a reduction in the major systematic uncertainties.
This proposal outlines a plan to carry out this experiment—at BNL—making optimum use of the
considerable investment in the E821 storage ring and associated experimental elements. Because
the major changes planned do not require extensive R&D, we can be ready for a commissioning
run two years after approval and funding, and ready for a production run approximately one year
later. We request a period of “pulse on demand” running using fast extraction to the V-line,
followed by 3 weeks of engineering running. A major data collection run of 21 weeks would follow
one year after the engineering run.
2

Contents
I. Executive Summary 5
II. Introduction 6
III. E821 Review 8
IV. The Standard Model Value of the Anomaly 11
A. QED and Weak Contributions 12
B. The Hadronic Contribution 12
C. ahad;LOµ from Hadronic τ decay? 15
D. The Hadronic Light-by-light Contribution 17
E. Summary of the Standard Model Value and Comparison with Experiment 17
F. Expected Improvements in the Standard Model Value 18
G. Physics Beyond the Standard Model 20
V. A New (g − 2) Experiment 22
A. Scientific Goal 22
B. Strategy of a new experiment 23
C. Event rate and beam time calculation 24
D. New beamline 25
E. Increasing the quadrupole density in the FODO section 26
F. New backward-decay beamline concept 27
G. Opening the inflector ends 29
VI. Measurement of the Magnetic Field 30
A. Methods and Techniques 30
B. Past improvements 33
C. Future refinement 34
VII. ωa Measurement 35
A. Overview 35
B. Electromagnetic Calorimeters 37
1. The E821 calorimeters 37
3

2. New segmented calorimeters for P969 39
C. New front scintillator hodoscope–FSH 41
D. Waveform digitizers 41
E. Data Acquisition 43
F. Systematic uncertainties on ωa 45
1. Gain changes and energy-scale stability 46
2. Lost muons 47
3. Pileup 48
4. Coherent Betatron Oscillations 50
5. Electric field and pitch correction 51
6. ωa systematic uncertainty summary 51
VIII. Manpower 53
IX. Resources and Costs 53
X. Timescale 54
XI. Summary of the Request 54
References 55
A. New Beamline Concept 59
a. Quad Doubling 59
b. Backward Decay Beam 61
c. Summary of Design 67
B. Beam Dynamics and Scraping 68
1. The Kicker and Quadrupoles 68
2. Beam Dynamics in the Ring 68
3. Oscillating Dipole Method of Scraping[66] 71
4. Pulsed Octupole Method to Remove the CBO[67] 73
C. The Superconducting Inflector 77
D. New Calorimeters 81
4

I. EXECUTIVE SUMMARY
The E821 experiment achieved a final uncertainty on the measurement of the muon
anomalous magnetic moment aµ of 0.54 ppm. The uncertainty is dominated by the statis-
tical error of 0.46 ppm. This suggests that a further increase in precision is possible if a
higher muon storage rate can be obtained. We propose to measure aµ to an uncertainty of
0.2 ppm, derived from a 0.14 ppm statistical sample and equal total systematic uncertainties
of 0.1 ppm from the measurement of the magnetic field and the extraction of the precession
frequency. Ten times more events compared to E821 are needed. We expect to obtain a
5 times higher muon flux using a redesigned pion / muon beamline, to run for 16 continuous
weeks, and to start our fits earlier because of elimination of the hadronic flash. Segmenting
the detectors, replacing the waveform digitizers, and using a modern data acquisition system
are necessary to handle the higher data rates. Improvements in the field-measuring system
are also required.
The new beamline involves a 5.32 GeV/c front end to collect positive pions, a doubling of
the quadrupole lattice in the decay section, the same 3.094 GeV/c final momentum selection
section, and a new inflector having open ends. With the AGS operating at 60 TP/cycle, a
fivefold increase in stored muons per hour is expected. At this rate, the statistics can be
collected in 1600 h. An additional 500 h are required for setup.
Our planning envisions a development period lasting two years after scientific and fund-
ing approval. During this time, the beamline would be rebuilt and the detectors will be
constructed. The parasitic pulse-on-demand mode can be used to commission the new
beamline, develop final tunes, and debug and calibrate detectors. A 3-week engineering run
is requested to accumulate a data set to study systematic uncertainties. One year later, we
request a 21-week run to carry out the measurement.
5

II. INTRODUCTION
The magnetic dipole moment associated with a charged spin-one-half particle is related
to the anomalous magnetic moment a(
eh2m
)by
�µs = gs
(e
2m
)�s, µ = (1 + a)
eh
2m, a =
g − 2
2. (1)
The large anomaly of the proton (a = 1.79) is a result of its internal structure, whereas the
leptons e, µ and τ have anomalies which are expected to arise only from radiative corrections.
The lowest-order radiative correction gives a = α/2π, which is 0.0011614 · · ·, and dominates
the anomaly of these leptons.
For a lepton, the standard model value of a has contributions from three types of radiative
processes: QED loops containing leptons (e, µ, τ) and photons; hadronic loops containing
hadrons in vacuum polarization loops; and weak loops involving the weak gauge bosons
W,Z, and Higgs. Thus
ae,µ(SM) = ae,µ(QED) + ae,µ(hadronic) + ae,µ(weak).
A difference between the experimental value and the standard model prediction would sig-
nify the presence of new physics beyond the standard model. Examples of such potential
contributions are lepton substructure, extra gauge bosons, anomalous W − γ couplings, or
the existence of supersymmetric partners of the leptons and gauge bosons.[1, 2]
The electron anomaly is now measured and calculated to a relative precision of about
four and seven parts per billion (ppb) respectively,[4] with the theory error dominated by the
uncertainty on the fine-structure constant. The electron anomaly provides one of the real
triumphs of experimental and theoretical physics, especially QED. Because the independent
measurements of α are less precise (7.4 ppb) than the present precision on the electron
anomaly, the measurement of ae has been used to determine the best measurement of the
fine-structure constant.[5] The uncertainty in α is not an issue for aµ because aµ is measured
to 0.5 parts per million (ppm), much less precisely than α.[3]
The relative contributions of heavier particles to aµ compared to ae scales as (mµ/me)2,
so the muon has a sensitivity factor of about 40,000 over the electron to higher mass scale
radiative corrections. Thus muon (g−2) has an overall advantage of two orders of magnitude
in measurable sensitivity to higher mass scales, including new physics. Thus muon (g − 2)
represents an excellent opportunity to search for physics beyond the standard model.
6

The muon (g − 2) experiment, E821 began in the mid 1980s. A formal proposal was
submitted to the Laboratory in fall 1985, and final approval was granted in spring 1988.
The storage ring magnet reached full power in the summer of 1996 and muons were first
stored in the ring in 1997. After engineering runs in 1997 and 1998, we collected large
samples of data in each of three years: 1999 (1 billion e+), 2000 (4 billion e+), and 2001
(4 billion e−), and all results have been published.[3, 6–9] The apparatus is documented in
the literature.[10–19] Assuming CPT symmetry, the combined total relative error on the
muon’s anomalous magnetic moment is ±0.5 ppm, an improvement of a factor of 15 over
the previous CERN experiments.[21]
The motivation for E821 was to observe the electroweak contribution from virtual W and
Z0 bosons, and to search for physics beyond the standard model such as supersymmetry, or
muon substructure.[1, 2] Now that LEP has probed standard model radiative corrections,
including the electroweak loop contributions, the present interest in muon (g − 2) is on
its sensitivity to physics beyond the standard model and its ability to place restrictions on
potential new physics.
With the publication of our paper in 2001, which indicated a 2.6 standard deviation
difference with the standard model,[8] our experiment has generated intense, and contined
interest in the community, and our progress has been followed in both the popular and
scientific press. The final result from E821 differs by ∼ 2.4 standard deviations from the
theoretical prediction using e+e− annihilation into hadrons to determine the lowest order
hadronic contribution.
Simultaneously with our progress in measuring aµ more precisely, the knowledge of the
standard model value of aµ has improved from ± 5 ppm in 1983 to ∼ ±0.7 ppm today.
Further improvements are on the horizon, and will be discussed below.
We propose to measure muon (g− 2) to the limit of the present experimental technique,
which can be achieved at Brookhaven in a reasonable running time. This improvement,
along with the anticipated progress on the theory side will more than double our ability
to constrain, or point to, new physics. The observation of a clear signal indicating physics
beyond the standard model, or the new limits that we will be able to set, will be extremely
important to our field.
7
III. E821 REVIEW
Experimentally we measure the spin precession relative to the momentum vector of a
muon moving in a magnetic storage ring. With the assumption that the velocity is transverse
to the magnetic field, the difference frequency between the spin and momentum precession
in the storage ring, ωa = ωS − ωC , is given by
�ωa = − e
mc
[aµ
�B −(aµ − 1
γ2 − 1
)�β × �E
], (2)
where an electric field does not contribute to the spin motion for γ = 29.3. This value of
γ is called the “magic” γ, and the magic muon momentum is pmagic = 3.094 GeV/c. We
use electrostatic quadrupoles for vertical focusing. The storage ring is operated as a weak
focusing ring, and we ran with field indices of n = 0.142, 0.137 and 0.122 during our three
main periods of data collection.
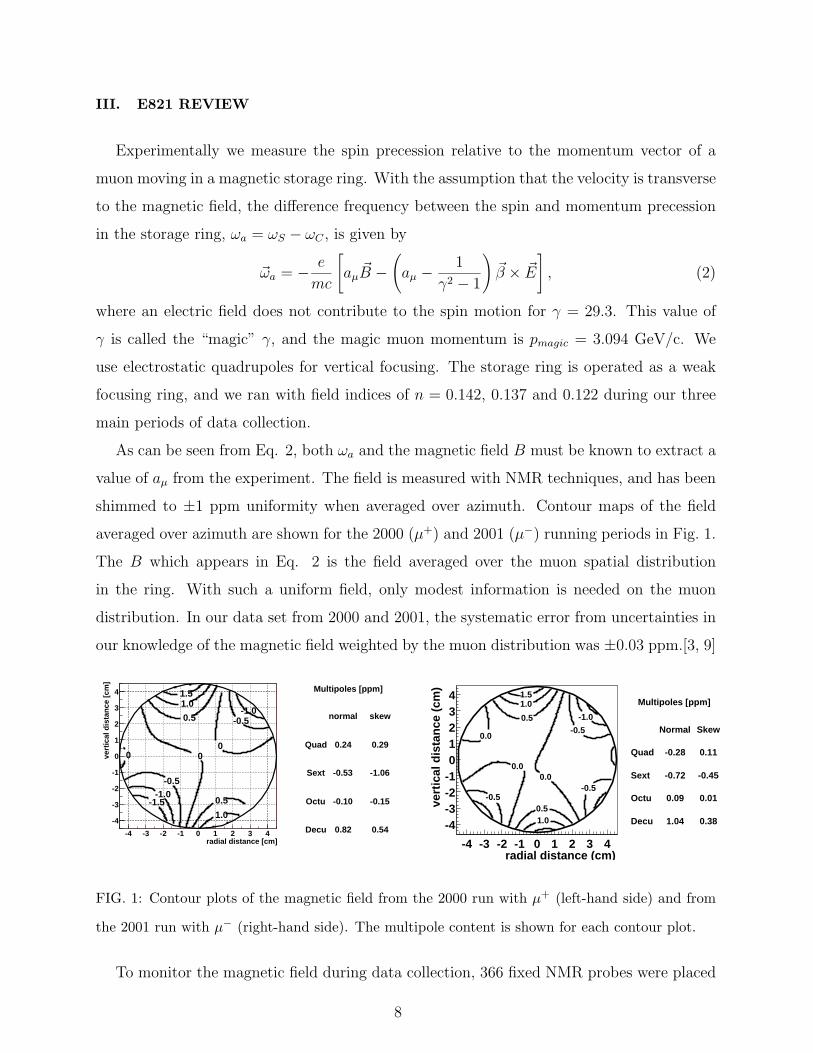
As can be seen from Eq. 2, both ωa and the magnetic field B must be known to extract a
value of aµ from the experiment. The field is measured with NMR techniques, and has been
shimmed to ±1 ppm uniformity when averaged over azimuth. Contour maps of the field
averaged over azimuth are shown for the 2000 (µ+) and 2001 (µ−) running periods in Fig. 1.
The B which appears in Eq. 2 is the field averaged over the muon spatial distribution
in the ring. With such a uniform field, only modest information is needed on the muon
distribution. In our data set from 2000 and 2001, the systematic error from uncertainties in
our knowledge of the magnetic field weighted by the muon distribution was ±0.03 ppm.[3, 9]
Multipoles [ppm]
normal skew
Quad 0.24 0.29
Sext -0.53 -1.06
Octu -0.10 -0.15
Decu 0.82 0.54radial distance [cm]
-4 -3 -2 -1 0 1 2 3 4
vert
ical
dis
tan
ce [
cm]
-4
-3
-2
-1
0
1
2
3
4
-1.5
-1.0
-1.0
-0.5
-0.5
000
0.5
0.5
1.0
1.01.5
Multipoles [ppm]
Normal Skew
Quad -0.28 0.11
Sext -0.72 -0.45
Octu 0.09 0.01
Decu 1.04 0.38
radial distance (cm)-4 -3 -2 -1 0 1 2 3 4
vert
ical
dis
tan
ce (
cm)
-4-3-2-101234
-1.0
-0.5
-0.5-0.5
0.00.0
0.0
0.5
1.01.5
0.51.0
FIG. 1: Contour plots of the magnetic field from the 2000 run with µ+ (left-hand side) and from
the 2001 run with µ− (right-hand side). The multipole content is shown for each contour plot.
To monitor the magnetic field during data collection, 366 fixed NMR probes were placed
8

around the ring and continuous readings from about 150 probes were used to track the field
in time. About twice per week, a trolley with 17 NMR probes was used to map the field in
the storage ring. During muon data collection, the trolley is stored in a garage inside the
vacuum chamber. The trolley probes were calibrated with a special spherical water probe,
which provides a calibration to the free proton spin precession frequency ωp.
Positrons (electrons) from the parity violating decay
µ+(−) → e+(−) + νe(νe) + νµ(νµ) (3)
are detected in lead-scintillating-fiber calorimetors[18] where the energy and arrival time
are measured. The highest energy positrons (electrons) carry the spin information, and the
number of high-energy positrons (electrons) above an energy threshold Eth as a function of
time is given by
N(t) = N0(Eth)e−t/γτ [1 + A(Eth) sin(ωat + φa(Eth))] . (4)
The uncertainty on ωa is given by
σωa
ωa
=
√2
ωaτµ
√NA
(5)
where the energy threshold Eth is chosen to optimize the quantity NA2. In the analysis
of the data, many small effects such as coherent beam motion in the storage ring must be
included.[3, 8] The data from our 2001 run using µ− are shown in Fig. 2. A least squares
fit to the electron(positron) spectrum is used to extract the frequency ωa as discussed in
Ref.[3, 8, 9]
9

s]µs [µTime modulo 1000 20 40 60 80 100
Mill
ion
Eve
nts
per
149
.2n
s
10-3
10-2
10-1
1
10
FIG. 2: The time spectrum of electrons from muon decay obtained in the 2001 running period.
There are 4 × 10⁹ events in the histogram.
Our final results are
aµ+ = 11 659 203(8) × 10−10 (0.7ppm) (6)
aµ− = 11 659 214(8)(3) × 10−10 (0.7 ppm) (7)
aµ = 11 659 208(6) × 10−10 (0.5 ppm), (8)
which will be compared to theory in the next section.
The key to any precision measurement is the systematic errors. The systematic and
statistical errors from our 1999, 2000 and 2001 running periods[3, 8, 9] are given below in
Table I, which shows clearly that E821 was statistics limited.
B-Field (ωp) Spin (ωa) Total Systematic Total Statistical
Data Run Systematic Error Systematic Error Error Error
(ppm) (ppm) (ppm) (ppm)
1999 0.4 0.3 0.5 1.3
2000 0.24 0.31 0.39 0.62
2001 0.17 0.21 0.27 0.66
TABLE I: Systematic and statistical errors from the three major E821 data collection runs.
The details of the systematic errors are given in Table II. Our goal is to improve the
10

systematic error on both ωa and on ωp (the magnetic field) to 0.1 ppm. These improvements
will be discussed in detail in the following sections.
σsyst ωp 1999 2000 2001 σsyst ωa 1999 2000 2001
(ppm) (ppm) (ppm) (ppm) (ppm) (ppm)
Inflector Fringe Field 0.20 - - Pile-Up 0.13 0.13 0.08
Calib. of trolley probes 0.20 0.15 0.09 AGS background 0.10 0.01 ‡Tracking B with time 0.15 0.10 0.07 Lost Muons 0.10 0.10 0.09
Measurement of B0 0.10 0.10 0.05 Timing Shifts 0.10 0.02 ‡µ-distribution 0.12 0.03 0.03 E-field/pitch 0.08 0.03 ‡Absolute calibration 0.05 0.05 0.05 Fitting/Binning 0.07 0.06 ‡Others† 0.15 0.10 0.07 CBO 0.05 0.21 0.07
Beam debunching 0.04 0.04 ‡Gain Changes 0.02 0.13 0.12
Total for ωp 0.4 0.24 0.17 Total for ωa 0.3 0.31 0.21
TABLE II: Systematic Errors from the 1999, 2000 and 2001 data sets.[3, 8, 9] CBO stands for
coherent betatron oscillations. The pitch correction comes from the vertical betatron oscillations,
since �β · �B �= 0. The E-field correction is for the radial electric field seen by muons with pµ �= pmagic.
†Higher multipoles, the trolley frequency, temperature, and voltage response, eddy currents from
the kickers, and time-varying stray fields
‡In 2001 AGS background, timing shifts, E field and vertical oscillations, beam debunch-
ing/randomization, binning and fitting procedure together equaled 0.11 ppm
IV. THE STANDARD MODEL VALUE OF THE ANOMALY
As mentioned above, the standard model value of aµ has three contributions from radia-
tive processes: QED loops containing leptons (e, µ, τ) and photons; hadronic loops contain-
ing hadrons in vacuum polarization loops; and weak loops involving the weak gauge bosons
W,Z, and Higgs. Thus
ae,µ(SM) = ae,µ(QED) + ae,µ(hadronic) + ae,µ(weak).
Each of these contributions is discussed below.
11

A. QED and Weak Contributions
The QED and electroweak contributions to aµ are well understood.[2] The QED contri-
bution to aµ has been calculated through four loops, with the leading five loop contributions
estimated. The present value is
aQEDµ = 11 658 472.07(0.04)(0.1) × 10−10 (9)
where the uncertainties are from the uncertainty on α and the 5-loop QED estimate.[2] The
electroweak contribution from one and two loops is
aEWµ = 15.4(0.1)(0.2) ××10−10 (10)
where the first error comes from hadronic effects in the quark triangle diagrams from the
two-loop electroweak, and the latter comes from the uncertainty on the Higgs mass.[2]
µ νµ
W Wγ
µ
γ
Z0 µ
γ
Z0
f
f-
µ W
νµ νµ
γ
µ
γ G
W G
H
γ
(a) (b) (c) (d) (e)
FIG. 3: Weak contributions to the muon anomalous magnetic moment. Single-loop contributions
from (a) virtual W and (b) virtual Z gauge bosons. These two contributions enter with opposite
sign, and there is a partial cancellation. The two-loop contributions fall into three categories: (c)
fermionic loops which involve the coupling of the gauge bosons to quarks, (d) bosonic loops which
appear as corrections to the one-loop diagrams, and (e) a new class of diagrams involving the
Higgs where G is the longitudinal component of the gauge bosons. See Ref. [23] for details. The
× indicates the virtual photon from the magnetic field.
B. The Hadronic Contribution
The hadronic contribution to aµ is about 60 ppm of the total. With its accuracy of 7.3
ppm, the CERN experiment[21] observed the contribution of hadronic vacuum polarization
12

shown in Fig. 4(a) at the 8 standard deviation level.
µ
γ
Hµ
γ
e Hµ
γ
Hµ
γ
H H
µ
γ
H
(a) (b) (c) (d) (e)
FIG. 4: The hadronic contribution to the muon anomaly, where the dominant contribution comes
from the lowest-order diagram (a). The hadronic light-by-light contribution is shown in (e).
The largest contribution ahad;LOµ comes from Fig. (4;a). The energy scale for the virtual
hadrons is of order mµc2, which means this contribution must be calculated from the disper-
sion relation shown pictorially in Fig. 5. The measured cross sections for e+e− → hadrons
are input for
ahad;LOµ =
(αmµ
3π
)2 ∫ ∞
4m2π
ds
s2K(s)R(s), where R ≡ σtot(e
+e− → hadrons)
σtot(e+e− → µ+µ−), (11)
where K(s) is a kinematic factor. This dispersion relation relates the bare cross section
for electroproduction of hadrons to the hadronic vacuum polarization contribution to aµ.
Because the integrand contains a factor of s−2, the values of R(s) at low energies (the ρ
resonance) dominate the determination of ahad;LOµ .
����������
����������
γ
γ
µh
γ
−e
+e
h
FIG. 5: The “cut” hadronic vacuum polarization diagram and the electroproduction of hadrons.
Because the cross sections at low energies dominates the dispersion relation, until very
recently the hadronic contribution was primarily determined by one experiment, CMD2 at
Novosibirsk.[24, 25] Several authors have used these data along with higher energy data
from other experiments to determine ahad;LOµ .[26, 27] Given the importance of these data to
13

the interpretation of E821, other groups have embarked on separate programs to measure
R. At Frascati, the KLOE collaboration has recently finalized their first measurement of
the hadronic cross section up to the φ using initial state radiation to vary the center of mass
energy.[28, 29] These results agree with the CMD2 data, both for the integral over the ρ in
the dispersion relation, and for the shape of the pion form factor, which can be seen in Fig.
6. The effect of these new data on the standard model value is shown in Fig. 7.
Comparison with CMD-2
we have evaluated thedispersion integral for the channel
in the range 0.35 GeV2 < M 2 < 0.95 GeV2
FedericoFedericoNguyenNguyen
comparison with CMD-2 in the range0.37 GeV2 < M 2 < 0.93 GeV2
0
5
10
15
20
25
30
35
40
45
50
0.3 0.4 0.5 0.6 0.7 0.8 0.9 1
CMD-2KLOE
onlyonly statisticalstatistical
errorserrors areare shownshown
aa = ( 388.7 = ( 388.7 0.80.8statstat 3.53.5systsyst 3.53.5theotheo )) 1010--1010
M 2 (GeV2)
F
KLOE PRELIMINARY
a (375.6 0.8stat 4.9syst+theo) 10-10KLOE
a (378.6 2.7stat 2.3syst+theo) 10-10CMD-2
1.3% Error
0.9% Error
FIG. 6: Data from KLOE compared with CMD2, taken from F. Nguyen’s presentation at the
daφne workshop.[29] Note that the shape of the two data sets above the ρ is identical. These
results are now final.[28]
14

aµ-11 659 000 (10-10)140 150 160 170 180 190 200 210 220 230
EJ95 (e+e-)
DH98 (e+e-+τ+QCD)
DEHZ02 (e+e- based)
HMNT02 (e+e- based)
DEHZ03 (e+e- based)
DEHZ03 (τ based)
BNL-E821 02 µ+
BNL-E821 04 µ-
BNL-E821 04 ave.
186.8±15.7
176.8±7.2
169.3±7.8
166.9±7.4
180.9±8.0
195.6±6.8
203±8
214±8.5
208±6
BN
L-E
821 04e+e- with KLOE
FedericoFederico NguyenNguyendada nene workshop, 6/04workshop, 6/04
FIG. 7: Comparison of theory and experiment[29] (following Davier, et al.,[26]) showing the addi-
tion of the new KLOE results on e+e− → hadrons.[28] Theory values are shown in the top section,
and E821 results are shown in the lower shaded portion. The new point including the final KLOE
result[28] is shown in blue just above the shaded section.
C. ahad;LOµ from Hadronic τ decay?
The value of ahad;LOµ from threshold up to mτ could in principle be obtained from hadronic
τ− decays (See Fig. 4), provided that the necessary isospin corrections are known. This was
first demonstrated by Almany, Davier and Hocker.[30] Hadronic τ decays to an even number
of pions such as τ− → π−π0ντ , can be related to e+e− annihilation into π+π− through the
CVC hypothesis and isospin conservation (see Fig. 8).[26, 30, 31] The τ -data only contain
an isovector piece, and the isoscalar piece present in e+e− annihilation has to be put in “by
hand” to evaluate ahad;LOµ . As discussed below, there are unresolved issues which make it
difficult to use the τ data on an equal footing with the e+e− data.
The e+e− and τ -decay evaluations do not agree on the hadronic contribution to aµ,
the shape of the pion form factor, and if CVC and the e+e− data are used to predict the
15

-ττ
W-
ν
h(b)
+e
-e
γh
(a)
FIG. 8: Electroproduction of hadrons (a), and hadronic τ decay (b).
τ− → π−π0ντ branching ratio, the value obtained is three standard deviations from the
experimental value.[27] It has been speculated that a difference in the charged and neutral
ρ masses could explain this difference.[33] Davier has pointed out that while assuming this
mass difference fixes the shape problem, it causes a shift in normalization of 3.3% between
the two.[34] While the shape difference goes away, this normalization difference moves the
τ -based theory further away from the hadronic contribution obtained from the e+e−-based
analysis. Marciano has argued that a modest mass difference, along with a full treatment
of QED corrections to the width difference will remove part of the discrepancy, but a full
QED calculation has not been carried out.[35]
Recently the KLOE collaboration[36] has measured the mass and width differences of the
charged and neutral ρ. They find: Mρ0 − Mρ± = (0.4 ± 0.7 ± 0.6) MeV, and Γρ0 − Γρ± =
(3.6± 1.8± 1.7) MeV. The mass difference is smaller than that favored by both Ghozzi and
Jegerlehner,[33] or Davier.[34]
As stated by Davier and Marciano[2] in their review article to be published in Annual
Reviews, “On one hand, it is clear that e+e− data are the natural input and that τ data
need additional treatment to cope with isospin breaking corrections. On the other hand,
recent history has taught us that reliability on the input data is an important concern and
therefore redundancy is needed.” The data from CMD2 in Novosibirsk dominate the low-
energy part of the dispersion relation, and until recently there was no independent check
of their data. This check has now been carried out by the KLOE Collaboration (see Figs.
6 and 7).[28] Melnikov has strongly pointed out that the τ -decay data are not on an equal
footing with the e+e− data, and he believes that the discrepancy between the two represents
an unaccounted for isospin effect.[37] For similar reasons, Ghozzi and Jegerlehner also point
out that, “the e+e−-data based evaluations are the more trustworthy ones.”[33] At this
point there is almost general agreement that there are additional corrections which must be
16

included in the τ data before they can be treated on the same footing as the e+e− data in
determining ahad;LOµ .
D. The Hadronic Light-by-light Contribution
The hadronic light-by-light contribution shown in Fig. (4;e) has been the focus of sub-
stantial theoretical investigation.[38, 39] This term must be calculated using a model, since
it cannot be evaluated from data. The most recent calculation by Melnikov and Vain-
shtein obtained 13.6(2.5) × 10−10 (0.22 ppm).[39] In their review,[2] Davier and Marciano
choose to quote a slightly lower value for this contribution, 12(3.5) × 10−10 with an in-
creased uncertainty. As discussed below, two groups are preparing a lattice calculation of
this contribution.
E. Summary of the Standard Model Value and Comparison with Experiment
Davier and Marciano have reviewed the theoretical prediction for the muon anomaly in
a review for the 2004 edition of the Annual Reviews of Nuclear and Particle Physics.[2] We
compare the E821 result with the standard model values from this review. The combined
µ+ µ− value from E821[3] and the e+e−-based standard model value are
aµ(E821) = 11 659 208(6) × 10−10 (0.5 ppm), (12)
aµ(SM) = 11 659 184(8) × 10−10 (0.7 ppm) e+e−−based (13)
which give a difference of
∆aµ(E821 − SM) = (24 ± 10) × 10−10. (14)
Use of the τ -decay data gives ∆aµ of (8± 9)× 10−10. This comparison is shown graphically
in Fig. 7 (taken from the KLOE collaboration), which uses the (slightly higher) standard
model values from Davier, Eidelman, Hocker and Zhang.[27] The new e+e− based evaluation
using both KLOE and Novosibirsk data is presented.
To show the sensitivity of muon (g − 2) to the electroweak gauge bosons, we subtract
off the electroweak contribution given in Eq. 10 and we obtain
∆aµ = (39 ± 10) × 10−10, (15)
17

demonstrating a large sensitivity to virtual W and Z gauge bosons.
The present theoretical error is ∼ ±8 × 10⁻¹⁰ (0.7 ppm) as reported by Davier and
Marciano,[2] who estimate that in the near future this error can be improved to ∼ ±4×10⁻¹⁰
(0.35 ppm).
With the proposed experimental goal of 0.2 ppm uncertainty, the combined uncertainty
for the difference between theory and experiment would be ±4.6× 10⁻¹⁰, less than half that
given above in Eq. 14.
F. Expected Improvements in the Standard Model Value
Much experimental and theoretical work is going on worldwide to refine the hadronic con-
tribution. One reflection of this work is the conference held in Pisa, which brought together
57 participants who are actively working on parts of this problem, and these participants
represented many additional collaborators. The poster for the conference is shown in Fig.
9.
FIG. 9: The poster advertising the workshop held in Pisa on the hadronic contribution to aµ.
There were 57 participants and 33 invited speakers.
18

With the confirmation of the CMD2 data by the KLOE collaboration, and the subsequent
reduction in the error on the dispersion integral, we now discuss the ongoing work to further
improve the e+e− data, and the efforts to use lattice QCD to calculate the strong interaction
piece of aµ. There are four e+e− efforts now underway: at Novosibirsk, at KLOE, at BaBar
and at CLEO. Preliminary work has begun at Belle.
• Novosibirsk: The CMD2 collaboration continues to analyze their data and is ex-
pected to publish additional data covering a wider energy range and with smaller
statistical errors. A modest improvement in ahad;LOµ is expected from this extended
data set, and it will provide an important check of the previously published data.
The CMD2 collaboration is upgrading their detector to CMD3, and the VEPP2M
machine is being upgraded to VEPP-2000. The maximum energy will be increased
from√
s = 1.4 GeV to 2.0 GeV. These upgrades will permit the cross section to be
measured from threshold to 2.0 GeV using an energy scan. These new data will fill
in the energy region between 1.4 GeV where the CMD2 scan ended, up to 2.0 GeV,
which was the lowest energy point reached by the BES collaboration in their mea-
surements. Their goal is to measure R directly to 0.2-0.3% precision in the ρ-meson
energy region. If successful, VEPP-2000 will allow CMD3 to reach a precision below
0.35 ppm (< 4 × 10⁻¹⁰). These results can be expected in 5-8 years from now.
• KLOE: The KLOE collaboration has measured the hadronic cross section using
initial-state radiation (ISR) to lower the CM energy from the φ where daφne op-
erates. They have data over the rho resonance, which are shown in Fig. 6. They have
additional data with systematic errors which are half of those for the data in Figures
6 and 7.[41] Their paper on the first data set has just been submitted[28] and work
has begun on the analysis of the second data set.
• BaBar: The BaBar collaboration is measuring the hadronic cross section using ISR.
Since the CM energy is much higher for BaBar than daφne, the photon is hard, and
easy to detect (in daφne the ISR photon goes down the beam pipe). Furthermore
BaBar can measure R(s) directly, since they also measure muon pairs. They are in
the process of replacing their muon chambers, and over the next two years they will
replace the chambers, and get substantial new data on R(s).[42]
19
• CLEO: The CLEO collaboration has embarked on a measurement of R(s) at higher
energies. They have taken six points with high statistics in the energy range√
s =
7.0 − 10.33 GeV, and 28 points with lower statistics in the energy range√
s =
11.15 − 11.39 GeV. Their hope is to have these data analyzed and written up by the
end of 2004. The data collection during much of the next year will be at 3.77 GeV,
and they will explore the use of ISR to measure R(s) at lower energies.[43]
• Belle: The Novosibirsk collaborators on Belle are exploring the possibility of using
ISR to measure R. This work is in the preliminary stage.[44]
• Calculations on the Lattice - Lowest-Order: With the increased computer power
available for lattice calculations, it may be possible for lattice calculations to contribute
to our knowledge of the lowest order hadronic contribution. Blum has performed a
proof-of-principle quenched calculation on the lattice.[45] He and his collaborators are
continuing this work with an unquenched calculation which looks quite promising.[46,
47]
• Calculations on the Lattice - Hadronic light-by-light: The hadronic light-by-
light contribution has a magnitude of 12 × 10−10, ∼ 1 ppm to aµ, with an estimated
error of about 0.3 ppm.[39] A modest calculation on the lattice would have a large
impact. There are two separate efforts to formulate the hadronic light-by-light calcu-
lation on the lattice. Blum and his collaborators at BNL and RIKEN are working on
the theoretical framework for a lattice calculation of this contribution.[47] A second
effort led by K-F. Liu is beginning to work on an independent calculation of this con-
tribution, and they plan to formulate the calculation for the lattice over the next few
months.[48]
G. Physics Beyond the Standard Model
For many years muon, (g − 2) has played an important role in constraining physics
beyond the standard model.[1, 2, 51] The interest with which our E821 results have been
received by the community shows that this role continues.
If the muon is a composite fermion at some scale Λµ >> mµ then there is a contribution
20

to its magnetic moment
δaµ(Λµ) � m2µ
Λ2µ
(16)
and any deviation from the standard model can be used to place a lower limit on muon
substructure, a limit which is in the few TeV range.[49]
Searches have been carried out for anomalous gauge boson couplings in triple gauge boson
vertices such as the γγW vertex, which appears in the first-order electroweak loop shown in
Fig. (3;a). The W magnetic moment can be parameterized as
µW =e
2mW
(1 + κ + λ) (17)
where in the standard model κ = 1 (gW = 2) and λ = 0. To leading order[1]
aµ(κ, λ) � GF m2µ
4√
2π2
[(κ − 1) ln
Λ2
m2W
− 1
3λ
]. (18)
and the electric quadrupole moment is given by
QW = − e
m2W
(κ − λ) . (19)
LEP2, CDF and D0 have restricted the values of ∆κ and ∆λ, and the present limits
given in the Particle Data Tables[50] restrict a one-standard-deviation discrepancy from a
nonstandard Wγγ coupling to aµ(new physics) <∼ 0.3 ppm. Thus any disagreement which
might have been observed between the standard model value and E821 of the magnitude
shown in Eq. 14 could not be explained by anomalous Wγγ couplings.
Were they to exist, muon (g−2) would have substantial sensitivity to the supersymmetric
partners to the W and Z bosons. The SUSY diagrams for the magnetic dipole moment,
the electric dipole moment, and the lepton-number violating conversion process µ → e in
the field of a nucleus are shown pictorially in Fig. 10. In a generic model with equal SUSY
masses the supersymmetric contribution to aµ is given by[40]
aµ(SUSY) � α(MZ)
8π sin2 θW
m2µ
m2tan β
(1 − 4α
πln
m
mµ
)(20)
� (sgnµ) 130 × 10−11 tan β(
100 GeV
m
)2
(21)
� 1.31 ppm tan β(
100 GeV
m
)2
(22)
(23)
21

which indicates the dependence on tan β (the ratio of the vacuum expectation values of the
two Higgs fields) and the SUSY mass scale. Thus muon (g − 2) is sensitive to any SUSY
model with large tan β. If supersymmetry were to be discovered at the LHC and the SUSY
mass spectrum measured, the value of aµ will continue to be important. In that case, the
value of aµ would provide the best measurement of tan β (at the ∼ 20% level).
⎛⎜⎝
m2ee ∆m2
eµ ∆m2eτ
∆m2µe m2
µµ ∆m2µτ
∆m2τ e ∆m2
τ µ m2τ τ
⎞⎟⎠ µ µ
µ µ~~
B~
µµ ~
e
B
e
~
~
MDMEDMµ e
FIG. 10: The supersymmetric contributions to the anomaly, and to µ → e conversion, showing the
relevant slepton mixing matrix elements. The MDM and EDM give the real and imaginary parts
of the matrix element, respectively. The × indicates a chirality flip.
The anomalous magnetic moment of the muon is sensitive to contributions from a wide
range of models beyond the standard model, and will continue to place stringent restrictions
on them. This unique sensitivity to new physics is what motivates our collaboration to push
forward with a new measurement.
V. A NEW (g − 2) EXPERIMENT
A. Scientific Goal
Our measurement of aµ in BNL Experiment E821 included data from four muon-injection
running periods and one short pion-injection run. A statistical uncertainty of 0.46 ppm,
combined in quadrature with systematic uncertainties from the magnetic field measurement
(0.17 ppm) and spin-precession analysis (0.21 ppm) yields the final overall uncertainty of
0.54 ppm. The result is statistics limited. We believe an improvement by a factor of 2.5—
giving an uncertainty in aµ of 0.2 ppm—is both scientifically compelling and technically
achievable. To do so in a single production run will require an increase in muon flux by a
factor of 5, a reduction in systematics by a factor of 2, and a reduction in background. The
plan described below will achieve these stated goals.
22

The concept of the measurement remains unchanged from E821 but includes both incre-
mental upgrades and qualitative changes. A new injection scheme will increase the muon
flux and eliminate the hadron-induced background. To handle the higher event rates, the
detectors, electronics and data acquisition systems will be replaced. Improvements in the
storage ring field uniformity and its measurement system follow a plan of continuous small
improvements started some years ago. A complementary method of data collection and
analysis, which is immune to pileup, has been identified. It will be pursued in parallel to
our traditional technique. The overall changes do not rely on untested technology nor do
they require lengthy R&D; however, significant beamline design will be required.
B. Strategy of a new experiment
The key to a new measurement is increasing the muon flux. We have identified two
areas where changes will result in a higher stored muon rate. Increasing the number of
quadrupoles in the straight decay section of the beamline by a factor of 2 − 4 results in a
increase in muon flux by the same factor. Ample space exists and the quads are relatively
inexpensive. Muons entering the storage ring pass through an inflector having closed ends.
Scattering and energy loss reduces the stored muon fraction by a factor of 2. We have built
and tested a prototype inflector having an open end; a full-size inflector having both ends
open will be built for the new experiment. An increase in the stored muon fraction by a
factor of 2 is expected. We plan to use a high-momentum front end in our beamline so that
backward-decay muons can be collected rather than forward-decay muons. The front-end
momentum of 5.32 GeV/c produces 180-degree decay muons at exactly the magic momentum
of 3.094 GeV/c. The mismatch in pion and muon momentum is so large that no pions will
make the final bend into the storage ring. The hadron-induced flash will be absent. We
are not yet able to predict a flux increase (or decrease) factor at this time from this major
change. Preliminary Monte Carlo calculations suggest the factor will be close to the current
forward-decay transmission. We adopt a factor of 1 for planning purposes in this proposal.
At this stage, we have confidence that our goal of ×5 more stored muons can be achieved by
a combination of AGS running at 60 TP, increased number of quadrupoles, a new inflector,
and the use of the backward beam. This rate increase is used to establish rates for detectors,
electronics, data acquisition and in the request for run time. The final optimization of the
23

new beamline design will require assistance and consultation with experts from the AGS.
The commissioning plan assumes parasitic operation during one AGS/RHIC running
cycle where “pulse-on-demand” can be used to establish the new beamline tunes and test all
aspects of the experiment. Pulse-on-demand was very effective in the early stages of E821.
A 3-week dedicated period, at the end of this running cycle, is requested to study systematic
errors. A 21-week production run is requested one year later.
C. Event rate and beam time calculation
Our goal of δaµ = ±0.2 ppm is obtained from a statistical uncertainty of 0.14 ppm and
equal systematic uncertainties of 0.1 ppm each for the field and precession analyses. The
required running time at the assumed rate is outlined in Table III. Experience suggests that
5 weeks of setup time with beam available is required before “good” data is obtained.
Table III includes the factors and comments.
TABLE III: Event rate calculation for P969.
Value Factor Comment Note
7 × 10¹⁰ events – Required number of fitted events 1
10.3 × 1010 ×1.47 Corrected to t = 0 2
8.6 × 10¹¹ stored µ ×0.12 Positrons accepted with E > 1.8 GeV 3
7.2 × 10⁷ fills ×(1/12, 000) Stored muons per fill at 60 TP 4
1.7 × 10⁷ fills ×4 Flux increase: quad doubling and new inflector 5
1125 h ×(1/1.6 × 104) Standard AGS 12 fills per 2.7 s cycle 6
1600 h ×(1/0.7) Experiment data-collection uptime (actual) 7
500 h – Setup time before “smooth” data taking 8
2100 h – Total beam hours requested for main run 9
21 weeks ×0.01 Average delivered beam of 100 h/week 10
Notes explaining entries in Table III:
1. Required number of events in the fit. We assume fit start time is 25 µs after injection,
see Eq. 5.
24

2. Projecting back to injection increases the effective required event count by a factor of
1.47.
3. Fraction of decay positrons with energy above 1.8 GeV and detected by the calorime-
ters.
4. The number of storage ring fills required at 12,000 stored muons per fill. The stored
muon number is based on measurements in E821 and an assumed average AGS inten-
sity of 60 TP/cycle.
5. The increase in stored muon flux by a factor of 4 from doubling the number of quads
and replacing the inflector. The final factor will depend on the actual quadrupole
increase and the muon yield using a high-momentum front end.
6. At 12 fills per 2.7 s AGS cycle, this gives the number of hours of continuous data
taking required.
7. Assumes 70% uptime, a value based on our previous experience during smooth pro-
duction running.
8. Standard setup time (as realized in the past) to adjust tunes, optimize stored muon
flux, measure vertical profiles, make final detector calibrations, and other preliminary
steps.
9. Total number of hours requested for the production run.
10. Weeks required, assuming 100 h of delivered beam per week. This may vary depending
on the sharing efficiency with RHIC.
D. New beamline
A central feature of this proposal is a redesign of the pion / muon beamline channel. The
present E821 beamline is optimized for pion production and transport at approximately
3.1 GeV/c. A momentum selection is made at a dispersive focus immediately downstream
of the production target at the K1/K2 collimators and a second momentum selection is
made just upstream of the muon storage ring at the K3/K4 collimators (see Fig. 11). An
25

80 m long straight section exists between these bends. It is sparsely occupied by quadrupoles
tuned in a standard focusing-defocusing (FODO) arrangement (depicted as open circles in
the figure). Muons born from pion decay in this section can be captured and transported
by the line. For muon injection, the first bend selects pions with momenta 3.114 GeV/c and
the second bend selects particles having 3.094 GeV/c (the magic momentum, Pmagic). The
1.7% mismatch in momentum is necessary to remove most of the pions at K3/K4. Still,
a pion (and proton) flux approximately equal to that of the muons is transported into the
storage ring. The vast majority of these hadrons crash into the storage ring steel and or
the detectors and create a prompt “flash” in the detectors. The hadronic interactions also
create neutrons, which thermalize and capture resulting in a continuous soft background.
This background appears as a baseline (pedestal) shift, which decays with a time constant of
tens of microseconds. The prompt and delayed flash are severe enough so that the detectors
must be gated off at injection and turned on some tens of microseconds later. Because the
flash limits the rate at which the experiment can be conducted, reducing or eliminating it
is one of our most important goals.
E. Increasing the quadrupole density in the FODO section
Figure 12a illustrates the beam envelope modelled using the ray-trace program
TRANSPORT [52]. The outer envelope extends into the physical quad structure, particularly
in the top (vertical) panel; particles are lost. By doubling the number of quads, the beam’s
physical envelope is reduced. Conservation of accepted emittance at the storage ring implies
that larger muon decay angles will be accepted. Quad doubling in the FODO section keeps
the entire envelope well contained as shown in Fig. 12b. The Monte-Carlo particle tracking
program DECAY TURTLE [52] was used to model the change. An increase by a factor of 2.1 in
transmitted muons is realized for a tune with a FODO section having twice the number of
quadrupoles. Ample space is available and the relatively low cost of the 4-inch quads used
gives us many options to modify the FODO section. Further studies are in progress to verify
the expected flux increase from tripling or quadrupling the number of quads in this region.
A final optimization will require assistance from AGS experts and a full cost analysis.
26

−
U−V line
������������������
������������������
D5U line
D3,D
4
Q2
Q1
D6
D1,D2
V line
AGS
VD3
VD4
Beam Stop
Inflector
Pion Decay Channel
Pion Production Target
K1−K2
K3−K
4
2 Ringg
FIG. 11: Plan view of the pion/muon beamline.
F. New backward-decay beamline concept
The highest muon flux for a truly forward-decay beam occurs when the pion front end is
tuned 0.5% above Pmagic. However, this slight momentum difference permits a large number
of pions to enter the storage ring. If the pion momentum is higher (leaving the muon
selection section unaltered), both the pion and muon rates are reduced, but the pion rate
drops faster. Acceptable operating conditions—ample flux, tolerable flash—occur when Pπ
is 1.7% above Pmagic. The accepted muons are created slightly off axis from zero degrees.
Raising the pion momentum to 5.32 GeV/c is a logical extension of this argument. At
this momentum, the muons having the magic momentum are emitted at exactly 180 degrees.
The mismatch in momentum at K3/K4 is maximized, implying that no pions (or protons)
will enter the storage ring. The backward muons are transported and injected into the
storage ring as usual (their spin direction is reversed, but their average polarization will be
very close to unity). The hadronic flash will be absent so we expect to be able to avoid
a sophisticated PMT gating circuit in the new detectors. Our phase-space-based studies
suggest that a potential increase in the number of available muons exists, however, only
27

(a) Normal (g − 2) Tune (b) Quad Doubling Tune
FIG. 12: TRANSPORT envelopes for the current beamline and one with double the number of quads
in the FODO decay section. The top panels of each figure represent the vertical beam envelopes;
the bottom panels represent the horizontal envelopes. When the envelope extends into the quad
(depicted as rectangular boxes, particles are lost. The beam envelope is completely contained in
in (b).
preliminary tune design work has been completed and no firm conclusions can yet be made.
We have discussed with key AGS personnel the implications of changing the front end
to transport higher-momentum pions. Modification or replacement of certain elements are
required. The work plan includes:
• Modification of the pole tips on the 18D72 dipoles D1, D3 and D4. Dipole D1 has
been in a high-radiation environment and will likely be replaced. The modification
will enable the dipoles to run at 25 kG.
• The “C”-shaped dipole D2 is a non-standard laboratory magnet designed for a field of
18 kG and open on one side to let the primary proton beam pass. To produce a field
close to 23 kG, it must be replaced with one having significantly more return yoke.
• Quadrupoles Q1/Q2 are already running near maximum field gradient. To capture the
pions at this momentum, Q1 must increase in length by 25% and the target position
must be adjusted upstream by 33 cm.
28

(a) Open End (b) Closed End
FIG. 13: Photos of the open- and closed-end inflector prototype.
G. Opening the inflector ends
The original superconducting inflector design for E821 included two options for the ends:
open or closed, see Fig. 13. Both versions were built in 0.5 m long prototype form, but only
the closed-end version was built at full scale (1.7 m length) and used in the experiment.[10,
11] The closed inflector was selected because of its simpler construction and was thought to
be more stable against Lorentz forces. Further, the closed-end inflector has a smaller fringe
field that could be more easily shielded from the storage ring field seen by the muons. On
the downside, beam transport studies show that multiple scattering and energy loss in the
closed end reduce the transmission by a factor of 2.
The stability of the open-ended coil configuration was demonstrated at full current in a
1.5 T magnetic field. Based on our measurements from E821 [11], the added leakage field
from the open end can be excluded from the storage region by a passive superconducting
sheet.
A factor of 2 increase in muon flux is expected from opening the ends. Much of the
investment in engineering for this device has already been made and custom tooling necessary
to construct the magnet exists. The inflector is discussed in detail in an appendix.
29

VI. MEASUREMENT OF THE MAGNETIC FIELD
We propose to measure the magnetic field in the present experiment to a precision of about
0.11 ppm using the same technique and apparatus which was used in E821. The technique
was developed, implemented, and refined over a period of about twenty years.[16, 54–58]. An
uncertainty of 0.17 ppm had been reached when experiment E821 was stopped (cf. table IV).
A brief overview of the measurement is given in section VI A. Section VI B outlines the
improvements that were made in the course of E821 and which resulted in the gradual
reduction of the uncertainty in the field measurement by a factor of three. In section VI C we
outline our plans for reestablishing the measurement after several years without operation,
and how we foresee a further improvement in uncertainty by about 30% to a projected
0.11 ppm.
A. Methods and Techniques
The measurement of the magnetic field in experiment E821 is based on proton NMR in
water. A field trolley with 17 NMR probes was moved typically 2–3 times per week through-
out the entire muon storage region, thus measuring the field in 17×6 ·103 locations along the
azimuth. The trolley probes were calibrated in situ in dedicated measurements taken before,
during, and after the muon data collection periods. In these calibration measurements, the
field homogeneity at specific calibration locations in the storage region was optimized. The
field was then measured with the NMR probes mounted in the trolley shell, as well as with
a single probe plunged into the storage vacuum and positioned to measure the field val-
ues in the corresponding locations. Drifts of the field during the calibration measurements
were determined by re-measuring the field with the trolley after the measurements with the
plunging probe were completed, and in addition by interpolation of the readings from nearby
NMR probes in the outer top and bottom walls of the vacuum chamber. The difference of
the trolley and plunging probe readings forms an inter-calibration of the trolley probes with
respect to the plunging probe, and hence with respect to each other. The plunging probe, as
well as a subset of the trolley probes, were calibrated with respect to a standard probe[17]
with a 1 cm diameter spherical H2O sample in a similar sequence of measurements in the
storage region, which was opened to air for that purpose. The standard probe is the same as
30

FIG. 14: The NMR frequency measured with the center trolley probe relative to a 61.74 MHz
reference versus the azimuthal position in the storage ring. These data come from one of the
22 measurements taken with the field trolley during the 2001 data collection period. The solid
vertical lines mark the boundaries of the 12 yoke pieces of the storage ring. The dashed vertical
lines indicate the boundaries of the pole pieces.
the one used in the muonium measurements that determine the ratio λ of muon to proton
magnetic moments[53]. The NMR clock and the clock that measured the muon spin preces-
sion period were phase-locked to the same LORAN-C[59] signal. Systematic effects include
the instrument response and were extensively studied. The leading uncertainties in the cal-
ibration procedure resulted from the residual inhomogeneity of the field at the calibration
locations, and from position uncertainties in the active volumes of the NMR probes.
The ring magnet design[12], the inflector design[10, 11], and extensive shimming con-
tributed to the overall uniformity of the field throughout the storage ring. Figure 14 shows
one of the magnetic field measurements with the center NMR probe in the trolley for E821’s
final data collection period in the year 2001. A uniformity of ±100 ppm in the center of
the storage region was achieved for both field polarities and for the full azimuthal range,
in particular also in the region where the inflector magnet is located. Figure 15 shows a
two-dimensional multipole expansion of the azimuthal average of the field in the muon stor-
31

Multipoles [ppm]
Normal Skew
Quad -0.28 0.11
Sext -0.72 -0.45
Octu 0.09 0.01
Decu 1.04 0.38
radial distance [cm]-4 -3 -2 -1 0 1 2 3 4
vert
ical
dis
tan
ce [
cm]
-4-3-2-101234
-1.0
-0.5
-0.5-0.5
0.00.0
0.0
0.5
1.01.5
0.51.0
FIG. 15: A 2-dimensional multipole expansion of the azimuthal average of the field measured with
trolley probes with respect to the central field value of about 1.45 T. The multipole amplitudes are
given at the aperture of the 4.5 cm radius storage aperture.
age region from a typical trolley measurement in 2001. Since the average field is uniform to
within 1.5 ppm over the storage aperture, the field integral encountered by the (analyzed)
muons is rather insensitive to the profile and the precise location of the beam, which was
determined to within a millimeter in both coordinates.
The measurements with the field trolley were used to relate the readings of about 150
(out of 370) NMR fixed probes in the outer top and bottom walls of the storage vacuum
chamber to the field values in the beam region. The fixed NMR probes were read out
continually. Their readings were used to interpolate the field during data collection periods,
when the field trolley was parked in a garage inside of the vacuum chamber. The garage is
located just outside the beam region. The uncertainty in this interpolation was estimated
from redundant measurements with the field trolley within the same magnet-on period.
The field change induced by eddy currents from the pulsed kickers was measured for
a prototype chamber with an optical magnetometer [13]. Time-varying stray fields from
the accelerator were measured in situ with the NMR system [16, 55] and found to con-
tribute negligible uncertainty. Another small uncertainty comes from the off-vertical field
components [15].
32

The total field uncertainty is predominantly systematic, with the largest contribution
coming from the calibration. For all data collection periods, the results and uncertainties
were based on two largely independent analyses.
B. Past improvements
The uncertainty in the field measurement was improved by a factor of three in the course
of experiment E821 and reached a final value of 0.17 ppm for the year 2001 (cf. Table IV).
The superconducting inflector magnet [11] was replaced between the data collection pe-
riods in 1999 and 2000 because of a damaged superconducting shield which permitted stray
magnetic flux to leak into the storage region. This replacement minimized the inflector fringe
field in the storage region in subsequent data collection periods and eliminated the need to
measure the magnetic field with separate trolley settings in the inflector region. Together
with refined shimming with programmable current loops, it improved the field homogeneity
and thus reduced the uncertainty associated with our knowledge of the muon distribution
that existed for our 1998 and 1999 results.
The addition of a plexiglass port and mirror setup to the storage ring before the 2000
data collection started, allowed us to precisely position the trolley shell at the location
of a plunging probe without breaking the vacuum. It thus allowed us to make a relative
calibration of the trolley probes with respect to the plunging probe during the data collection
periods in 2000 and 2001, in addition to the calibrations made before and after each period.
Improvements in the alignment of the trolley rails throughout the storage ring and im-
provements in the trolley drive mechanism allowed us to measure the field with the trolley
more often during the 2000 and 2001 data collection periods. Furthermore, we upgraded the
readout of the trolley position in the storage ring before the data collection period in 2001
to reduce the uncertainty in the measurement of the average central field with the trolley.
Additional study of the trolley frequency, temperature, and voltage response resulted in
sharper limits for our 2000 and 2001 results.
33

TABLE IV: Systematic uncertainties in the measurement of the magnetic field for experiment E821
(1998–2001) and our projections for a future effort. The uncertainty ”Others” groups uncertain-
ties caused by higher multipoles, the trolley frequency, temperature, and voltage response, eddy
currents from the kickers, and time-varying stray fields.
Source of errors Size [ppm]
1998 1999 2000 2001 future
Absolute calibration of standard probe 0.05 0.05 0.05 0.05 0.05
Calibration of trolley probe 0.3 0.20 0.15 0.09 0.06
Trolley measurements of B0 0.1 0.10 0.10 0.05 0.02
Interpolation with fixed probes 0.3 0.15 0.10 0.07 0.06
Inflector fringe field 0.2 0.20 - - -
Uncertainty from muon distribution 0.1 0.12 0.03 0.03 0.02
Others 0.15 0.10 0.10 0.05
Total systematic error on ωp 0.5 0.4 0.24 0.17 0.11
C. Future refinement
The methods and techniques used in E821 are not fully exhausted; modest further refine-
ment is feasible. We would focus our efforts on the following items.
• in situ measurement of the field change from kicker eddy currents [13].
• Extensive measurements with the magnetic field trolley, aiming in particular to better
resolve the position of the active NMR volumes inside the trolley shell and to map
out the response functions to the level where corrections can be applied, rather than
limits be set.
• More frequent measurements of the magnetic field in the storage ring during beam
periods (following mechanical maintenance on the trolley drive and garage).
• Repair and retuning of a number of the fixed NMR probes to improve the sampling
of the storage ring.
• Solve the problem we had with the power supplies for the surface correction coils to
eliminate the occasional data loss caused by oscillating outputs.
34

• Analysis refinements to reduce trolley position uncertainties in the storage ring.
• Temperature control of the environment of the storage ring magnet.
Better knowledge of the muon beam distribution, required by the anomalous precession
measurement, would also benefit the measurement of the average magnetic field.
Continued development of an independent helium-3 based standard probe [60], would
further benefit the field measurement, however, the projected uncertainty of 0.11 ppm does
not rely on it. The same holds for extensive additional shimming of the storage ring.
We are confident that the goal of a field knowledge to a precision of 0.1 ppm can reached
using the existing experience in the field group. The present hardware has the potential to
reach that level with the moderate aforementioned repairs and upgrades.
VII. ωA MEASUREMENT
A. Overview
The stored muon flux, and consequently the rate, is expected to increase by a factor of 5
compared to E821. The existing detectors, electronics and data acquisition system are inade-
quate to handle this increase. As an example, the pileup fraction, which is already a concern
in E821, will increase five fold in a monolithic calorimeter as is used presently. To maintain
the pileup fraction at the current level, the detector must be segmented transversely. We
describe a design below, which satisfies this requirement. The current waveform digitizers
(WFD), operating with dual phase 200 MHz oscillators, store their digitized samples in an
onboard memory, which is already limited in depth at the E821 data rates. We plan to use
a single-phase WFD having a deeper onboard FIFO to avoid these difficulties. The cur-
rent data acquisition system—based on mid-1990’s technology—must be greatly expanded
to match the new electronics, high data rate, and significantly increased total data storage
volume. We will adopt a standard system we are using at the Paul Scherrer Institute (PSI)
in two related muon lifetime efforts—MuLan [62] and MuCap [63]—that closely match the
demands from the new (g − 2) effort. In addition to the the changes in acquiring data,
the data analysis effort will introduce a parallel method similar to that used in high-rate
parity-violating experiments, which we describe below. The balance of two complementary
methods to extract ωa will continue our tradition of having multiple, independent approaches
35

to the data analysis. To do so adds specific data acquisition modifications, which we describe
next.
Because the new (g−2) experiment will feature higher data rates, vulnerability to pileup-
induced uncertainties and rate-dependent gain changes—for the existing detection system—
will increase. To combat this, new segmented calorimeters will be built with segment size
designed to maintain similar individual rates similar to those realized in E821. Naturally,
shower spreading will introduce new challenges to event reconstruction and the gain moni-
toring system will have to be changed in concept to establish energy vs. time stability. The
traditional, or T method, where individual decay-positron “events” are analyzed for time
and energy, remains our primary standard analysis tool. Additionally, we will employ a
complementary and elegant “integration” method, the Q method. This amounts to digitiz-
ing the energy deposited in an entire calorimeter (all segments) vs. time following injection.
No threshold is necessary; all samples are recorded without bias. The method is robust and
intrinsically immune to pileup.
In the T method, positron decays are recorded individually and are sorted by energy and
time. For each positron recorded at time t and having energy greater than Eth, a single
count is incremented in a histogram, such as the one shown in Fig. 2. The asymmetry is
determined by the choice of threshold, and the statistical power is proportional to NA2.
Optimizing this figure-of-merit implies setting Eth between 1.8 and 1.9 GeV. The T method
is well understood by the current Collaboration; we employ it to determine event rates and
running necessary for the goals of this proposal. A slight variant on the T method is an
asymmetry-weighted (or energy-weighted) event mode, a T ′ method. Here, individual events
having energy Ei are weighted by their asymmetry, Ai. This method improves the statistical
power of the T method by about 10 percent at a cost of modestly increased demands on
the gain stability of the detectors. The T ′ method can be derived from the standard data
set and requires no additional hardware or special data-taking procedures. We have used
variants of this method as part of the analysis approaches applied to the 2000 and 2001
data-taking periods in E821.
In contrast, the Q method does not rely on the separate identification or isolation of
positron events. It involves integration of the energy deposited in the entire calorimeter and
plotting the summed energy vs. time. In this simple method, the energy deposited, which
is proportional to the light in the calorimeter, is digitized for the entire fill and the digitized
36

samples are in turn added from fill to fill to produce a final histogram. The histogram
can be fit by the same function used to fit the T method data. The asymmetry is lower
compared to the T method, but since all events are used N is larger. We have performed
a GEANT simulation to compare the T and Q methods. The simulation is based on tracked
muons through the storage ring and features details such as the coherent betatron oscillation,
which modulates the detector acceptance. We ignored that small effect in fitting the data;
the result is a poor χ2/dof , but it otherwise does not affect the comparison. Figure 16 shows
spectra prepared using the T and Q methods, both fit with the five-parameter function:
N exp−t/γτ [1 + A cos ωt + φ].
In the upper panel, the number of events having positron energy greater than Eth = 1.8 GeV
is plotted vs. time after injection. The fit gives an uncertainty on ωa of 59 ppm for this
sample. The bottom panel shows the same simulation, but the plot represents calorimeter
energy vs. time after injection. The uncertainty on ωa is 65 ppm; the Q method is statis-
tically weaker than the T method by about 9 percent, implying an 18 percent longer run
is necessary to obtain the same precision. However, the Q method has an interesting ad-
vantage. There is no pileup correction to be made so the increased rate will not complicate
the analysis algorithm. While the Q method had been recognized as viable during the E821
effort, it was impossible to implement with the existing WFD hardware and unattractive
to use because of the significant hadronic flash, which added a large and slowly decaying
baseline for many of the detectors in the first half of the ring. Our new digitizers will be
capable of storing all the samples from a complete fill so Q-method running can be enabled
as a parallel data stream; the lack of a hadronic flash should keep the pedestal baseline
relatively flat.
B. Electromagnetic Calorimeters
1. The E821 calorimeters
The 24 E821 electromagnetic calorimeters are made of plastic scintillating fibers epoxied
into a grooved lead alloy plate. The material ratio is 52:38:10 lead:scintillator:epoxy, which
gives a 1.15 cm radiation length (X0) and a 2.5 cm Moliere radius (ρM). The compact
15 cm depth avoids a high fraction of side-entering positrons. The system is described in
37

/ ndf 2χ 2280 / 1999Norm 2.5± 1246 Tau 99± 6.404e+04 Asym 0.0018± 0.3947 Omega 85± 1.438e+06 Phi 0.0± -40.4
Time [ns]500 1000 1500 2000 2500 3000
210×
Co
un
ts
0
200
400
600
800
1000
1200
1400
1600
1800 / ndf 2χ 2280 / 1999
Norm 2.5± 1246 Tau 99± 6.404e+04 Asym 0.0018± 0.3947 Omega 85± 1.438e+06 Phi 0.0± -40.4
T method
/ ndf 2χ 2334 / 1999Norm 2.6± 2340 Tau 55± 6.431e+04 Asym 0.0010± 0.2016 Omega 93± 1.438e+06 Phi 0.0± -40.4
Time [ns]500 1000 1500 2000 2500 3000
210×
Des
po
site
d E
ner
gy
Sca
led
0
500
1000
1500
2000
2500
/ ndf 2χ 2334 / 1999Norm 2.6± 2340 Tau 55± 6.431e+04 Asym 0.0010± 0.2016 Omega 93± 1.438e+06 Phi 0.0± -40.4
Q method
FIG. 16: GEANT simulation of events. Upper panel: Data analyzed using the tradition T method
with Eth = 1.8 GeV. Lower panel: Data prepared using Q method, representing energy vs. time.
Note the poor χ2/dof for each plot is because the fits were performed using a simple 5-parameter
function, which ignores the coherent betatron oscillations present in the simulation.
detail in Ref. [18]. The calorimeter stations are placed symmetrically around the inside of
the storage ring immediately adjacent to the vacuum chamber, which has a scalloped shape
to permit decay positrons to exit a flat face cutout just upstream of each calorimeter. The
radially-oriented fiber grid terminates on four lightguides that pipe the light to independent
Hamamatsu R1828 2-inch PMTs. The PMT gains are carefully balanced because the four
analog signals are added prior to sampling by the waveform digitizer. The fractional energy
resolution is approximately 7.0% at 1.9 GeV and scales as 1/√
E. While initial calibration
and quadrant balancing was performed at the BNL test beam, very precise calibration
information is determined in situ from the positron energy spectra. The final calibration
was performed by collecting data for each of the four quadrants separately. Because of the
hadronic flash, all PMTs are gated off prior to injection and are turned back on some tens
of microseconds later, depending on the location around the ring. The switching circuit
38

reverses the bias on dynodes #4 and #7 of the PMT base, thereby effectively truncating
the cascade in midstream. The dynodes can be reset to their normal configuration and
the gain of the PMT re-established to better than 99 percent of its steady-state value in
approximately 1 µs.
A 300 ps UV (337 nm) pulse from a nitrogen laser is directed through a splitter system
into the outside radial end of each of the quadrants of all calorimeters. The UV pulse
is absorbed by a sample of scintillating fibers and is re-emitted following the scintillating
fiber fluorescence spectrum. This signal propagates through the entire optical system, with
a digital readout identical to that produced by an ordinary positron shower. A reference
photodiode and PMT—located away from the beam—also receive a fixed fraction of the
light from the laser pulse. The system is capable of establishing limits on timing shifts of
less than 2 ps; however, gain stability measurements suffer because the current system is
not stable in the ratio of light conveyed to the reference detectors and to the calorimeters
at a level better than about 1 percent. The limitation of accuracy in the gain-stability
determination is in the calibration system, not the detectors. The detectors have a gain
stability of a few tenths of a percent, determined by direct inspection of the average energy
spectrum vs. time. This instability of the calibration system must be corrected to achieve
the accuracy required in this new proposal
2. New segmented calorimeters for P969
In the new experiment, the PMT switching circuit can be avoided because the hadronic
flash will be absent. This change will leave the PMTs at a constant voltage; we believe small
shifts in the gain vs. time are related to the switching circuit. If a modest suppression of
positrons is required, an alternate method is to pulse a grid on the front face of the PMT,
obtaining without difficulty a suppression of about 100 (the E821 suppression was 106). The
calibration system must be re-designed to guarantee internal stability in the ratio of light
distribution. The concept worked quite well with laser pulses injected during special runs,
roughly once per shift. However, the implementation was not as robust as required for our
data analysis demands. This can be improved by having local reference detectors at each
calorimeter station. For the PSI experiments, we are using a new LED system to maintain
calibration; we can adopt this system if it performs at the 0.1 percent level or better.
39

FIG. 17: Plan view of new calorimeters and existing scalloped vacuum chamber region.
The basic material design requirements for a new calorimeter are largely unchanged; it
must be dense and fast. Additionally, the new calorimeter must be segmented transversely
with respect to the incoming positron so that simultaneous events can be distinguished. We
estimate that recognizing simultaneous events 4 out of 5 times is necessary to accommodate
the fivefold increase in positron decay rate, while keeping the uncorrected pileup fraction at
the same level as in E821.
Appendix D includes a more detailed description of a tungsten / scintillating fiber (W-
SciFi) sampling calorimeter that meets these demands. Briefly, it
• is made of alternating flat plates of tungsten and ribbons of scintillating fiber, giving
X0 = 0.7 cm and ρM ≈ 1.7 cm;
• has 20 independent segments read out by individual PMTs located outside of the field
region;
• has a resolution of about 10 percent at 2 GeV, when using layer thicknesses of 0.8 mm;
and
• uses standard 29 mm PMTs having high-rate bases.
The design plans are preliminary and we expect to study variants on this basic design and
then build one or more prototypes in the near future. It is important that the detector fit
within constraints of the ring instrumentation, which protrudes from the vacuum chambers
to accommodate different instrumentation. A plan view of the vacuum chamber and the
detector positioning is shown in Fig. 17, indicating that this design looks promising for the
standard vacuum chamber sections.
40

C. New front scintillator hodoscope–FSH
Each of the present calorimeters is outfitted with a five-fold, vertically segmented scin-
tillator hodoscope—front scintillating detectors (FSD). The FSDs were used to determined
the time-dependent rate of “lost muons” from the storage ring and to give a coarse vertical
profile of positrons on the front face of the calorimeters. The muon loss signal is made from
three consecutive FSD stations in coincidence; lost 3.1 GeV muons penetrate three calorime-
ters with a probability of about 5 percent. FSD vertical profiles were used to measure the
average height of muons in the storage ring; the height was then centered by adjusting the
radial field. Because of deadtime in the FSD readout electronics and the intrinsic coarse
segmentation, the FSDs were not used for pileup rejection.
A proposed new front scintillator hodoscope (FSH) will consist of 10 horizontal scintillator
strips having variable widths inversely proportional to the average rate in each vertical band.
The scintillators will be coupled by a nearly straight acrylic rod to a small PMT. The strips
will define a fiducial entrance window on the face of the calorimeter leaving a 1 cm uncovered
“border” at the top and bottom. The light will be piped to 19-mm (3/4-in) PMTs located
about 1 m away radially. The demands on the PMTs are similar to those for the calorimeter.
An appropriate choice is the Photonis XP-1910. We expect to use standard leading-edge,
updating discriminators having ECL outputs. The discriminated signals will be digitized
using a multi-hit TDC, an example of which is being employed in our PSI experiments.
Additionally, the analog sum signal from the ten PMTs will be digitized by an additional
WFD channel. That signal will provide additional information that can be used in a pileup-
rejection scheme.
D. Waveform digitizers
We are building 100, four-channel, 500 MHz waveform digitizers for our two precision
muon lifetime experiments at PSI. These modules are conceptually very similar to those
used by us in E821, however, there are several important improvements. First the signal is
sampled by an 8 bit, 500 MHz flash ADC (FADC). The output of the FADC is sent to a field
programmable gate array (FPGA), where the data is reformatted, given a time stamp, and
exported to an external first in-first out (FIFO) memory. The modules sit in a VME-64x
41

crate (slightly modified to provide a few non-standard voltages). Data from each of the
modules in a given crate is readout with a Struck PCI-VME interface card at rates up to
80 MB/s. Unlike the E821 WFD, the dual port FIFOs allow the events to be read out while
data taking continues. Not only does the new WFD have more onboard memory, faster
sampling, and higher readout speed, it is also far more flexible than the old E821 WFD.
By reprogramming the FPGA we can reformat the output data as desired. Indeed, we have
defined a number of ”personalities” for the board, each of which can be programmed through
a JTAG interface, to match the needs of the particular data stream. For example, the T
and Q methods will each use WFDs that prepare the process and store the data differently.
The full bank of waveform digitizer modules is scheduled to be delivered and used for the
2005 physics production runs at PSI. We anticipate two years of operation there to complete
those experiments. After that, the WFDs will be free to be used for P969. An additional
150 channels will have to be built for P969.
In parallel with this development, our Collaboration has written the custom software
to readout the new WFDs and is preparing the on-the-fly pulse-fitting software (see DAQ
section below). In the PSI MuLan experiment—for which the WFDs were developed—more
than 2×10¹² events will be recorded. In the new (g−2) experiment the number of events is
lower by a factor of 20 while the number of samples to be recorded is higher by about a factor
of 3. Thus, the two efforts are roughly similar in data-flow and processing requirements.
Our team will have great experience with the use of the new WFDs and their readout and
interpretation.
A time base having 0.01 ppm accuracy and stability over months is not difficult to ob-
tain; vendors such as Precision Test Systems and Agilent can provide synthesizers driven
by ovenized oscillators, which meet that specification. For the MuLan experiment in the
fall of 2003, the system clock was generated with an Agilent E4400 synthesizer. The (ap-
proximately) 200 MHz system clock was mixed with another roughly 200 MHz signal from
a PTS 3100 (which was previously used to drive our E821 clocks). This difference frequency
was stable at 0.5 Hz over several weeks of operation. We also measured the outputs of the
Agilent and PTS clock signals with a recently calibrated and highly stable frequency counter.
The Agilent signal was absolutely accurate to 0.01 ppm while the PTS signal was 0.1 ppm
too high. During the course of operation, no systematic frequency drift was observed on
either clock. When tested again nine months later, the Agilent clock signal drifted by no
42

more than 30 ppb. The same system clock frequency is delivered to the NMR system and to
the electronics that determine the ωa frequency so only the relative stability is important.
We have already built a clock distribution system to fan out clock signals to the WFDs.
This system is based on linear fanouts used in E821 and other precision experiments. The
500 MHz system clock is sent as input to a 1-to-8 splitter/amplifier module and then by six
1-to-16 splitter/amplifier modules. The remaining two copies from the 1-to-8 splitter module
are used to drive a frequency tracking system and a clock divider module. Frequency tracking
during the experiment is done either with a calibrated frequency counter or a mixer system
like that discussed above. An additional modular subsystem performs clock division duties
by means of ECLips logic circuits: various modules can be connected to produce square
wave clock signals at integer submultiples of the system clock frequency, and in a variety of
logic levels (ECL, LVTTL, etc). These derived square wave clocks are used, for instance, to
drive flight simulator and multi-hit TDC hardware.
E. Data Acquisition
In the E821 data, only the summed signal from the four calorimeter segments was recorded
in a WFD, and only pulses with energies greater than approximately 1 GeV were stored,
together with a number of samples in their vicinity. Ideally, to reduce the systematic un-
certainty from overlapping pulses, every sample from each segment would be recorded with
no threshold; then the full energy distribution could be measured as a function of time with
maximum segmentation. Unfortunately, it is not practical to acquire and store this much
data. Instead, as a compromise, the readout scheme will be improved in two complementary
ways:
• Each of the 20 segments of the new calorimeters will be recorded in a separate WFD
channel, rather than only storing their sum. These data would be used for the “stan-
dard” T method analysis.
• The sum of the segments will also be recorded in a WFD with a different “personality”
in which no zero suppression is performed. All samples from each 600 µs fill will be
recorded in an unbiased way, but only for the sum. These waveforms may be used for
the Q method analysis or for an alternate T method analysis.
43

There will be five WFD boards for each calorimeter, each with four channels, to provide
the segmented readout. The threshold will be set, as it was in E821, to correspond to
a 1 GeV positron pulse. To ensure that the threshold remains constant regardless of the
sharing of the energy of the shower among segments, it will be applied to the summed signal
across all segments. The analog signals from all twenty segments will pass through a signal
conditioning board (SCB), which will construct and discriminate their sum. While all of
the WFDs in the segmented readout will always be triggered together, “blank” waveforms
from parts of the calorimeter that were not hit will be filtered out by the frontend software
to reduce the data rate. In each fill, we may expect to record approximately 500 pulses
per detector with energies greater than 1 GeV, storing approximately 32 ADC samples per
segment, and with an average occupancy of about 6.5 segments. There will be twelve fills
per 2.6 s AGS cycle. Consequently, the contribution to the data rate from the segmented
approach may be expected to be about 12 MB/s.
The summed output from the SCB will also be sent to a dedicated WFD channel. The
FPGA “personality” of this WFD will not employ zero suppression, but it will use an al-
gorithm based on standard lossless techniques such as run-length encoding and Huffman
coding [61] to compress the summed waveforms. The duration of each fill will be approxi-
mately 600 µs, so there will be 3 × 10⁵ samples per detector per fill. Consequently, the raw
data rate before compression will be 33 MB/s. Experience with similar problems suggests
that a factor of 3 to 5 reduction in data volume may be expected from lossless compression
of this data, reducing it to at most 11 MB/s. We note that it would also be possible to
simply rebin the ADC samples into 20 ns bins to reduce the data rate by a factor of 10
without the use of compression algorithms. The resulting spectrum could still be used in
the Q method, but would not provide enough resolution to use in an alternate T method
analysis.
The total data flow rate is then expected to be 23 MB/s; it may be somewhat lower if the
online compression is more effective, or slightly higher if more muons per fill are stored. It is
anticipated that there will be twelve VME crates; they will be located in the experimental
hall, adjacent to the detectors. Each will serve a pair of detectors, so the overall rate in
each will only be 2 MB/s. The instantaneous rate in each crate during the extraction part
of the AGS cycle will be 14 MB/s, so it should easily be possible to completely empty
each FIFO memory between fills. The crates will be connected through industry-standard
44

gigabit Ethernet links to an event-builder PC, which will write the data to an LTO-2 tape
drive. LTO-2 tapes hold 200 GB per tape without compression, and they may be written
and read at speeds of up to 35 MB/s. A subset of the data will also be saved on a local
disk array for online and fast-turnaround offline analysis. If we collect data for the entire
proposed 1800 hour run at the projected 23 MB/s, we will amass 150 TB of raw data, filling
750 tapes.
The data acquisition software to be used with the new WFDs will be based on our
experience in the MuLan and MuCap experiments at PSI. It will use MIDAS [64], which
provides a framework for network data transfer, event building, logging to tape or disk, run
control, and both online and offline analysis.
MIDAS also permits slow control and monitoring data to be integrated with the fast data
stream for easy correlation. In addition, it has a mechanism for making history plots and
setting alarms based on the slow control data. A web browser interface is typically used to
view and set slow parameters, but it is also possible to interact with them programmatically
and from scripts. We intend to use these capabilities to bring together the readout from
many of our subsystems.
The “production,” or first-level reduction, of the data will require significant computa-
tional resources, as will subsequent phases of the analysis. The core of the data analysis
system will be a computer farm built of 60 dual-CPU computers, each with a significant
amount of disk storage. The farm will be used for the production of the raw data, for user
analysis of the produced data, and as a distributed disk array. We aim to keep all of the
produced data on disk, which will require about 30 TB of disk space. Each node of the farm
will house 0.5 TB, setting the total number of nodes required at 60. Such a farm should
allow us to produce all of the expected data within one month and to loop over all produced
data within one day.
F. Systematic uncertainties on ωa
The largest systematic uncertainties in the 2001 ωa analysis give a quadrature-combined
total of 0.19 ppm (we assume these are uncorrelated uncertainties)[71] Our goal is a factor
of two reduction, to ≈ 0.1 ppm. We believe we can meet this goal by enlisting a suite
of improvements to the experiment. Here, we address in detail the plan to reduce the
45

largest sources of systematic error: gain changes, lost muons, pileup and coherent betatron
oscillations; the 0.05 ppm systematic uncertainty associated with the electric field and pitch
correction remains unchanged (for now). Table V lists these uncertainties and projections
for improvements. The T method is assumed because uncertainties can be reliably projected
based on our considerable experience in the E821 analysis efforts. The Q method, on the
other hand, is new. Its most attractive feature is pileup immunity; there is no correction
necessary so that systematic uncertainty is absent. However, new Q-specific systematic
issues may arise (we know of none at this time), and we continue to study this method
before venturing to make a meaningful projection of expected systematic uncertainties.
1. Gain changes and energy-scale stability
Typically, the gains of the detectors were determined to be better than ≈0.15% from early
to late times. This limit was established by plotting the average energy in a detector—over
a full (g−2) cycle—versus time after the PMTs were switched on. For a slowly varying gain
compared to the (g− 2) oscillation period having no component that oscillates at frequency
ωa, then a gain shift at this level does not contribute significantly to the uncertainty in ωa.
On the other hand, if the gain oscillates at a frequency ωa, with an amplitude that varies
in time, and with a phase that differs from that of the ωa oscillation of the positron sample,
then a direct error on ωa is produced. The average rate at which energy deposited into the
calorimeters oscillates with frequency ωa, and therefore any rate dependence in the gain of the
detectors produces gain oscillations. We were able to demonstrate that the gain dependence
on rate was small enough that its effect on ωa was typically less than 0.03 ppm. In the new
experiment, the increased beam rates will be offset by increased detector segmentation, and
we expect this effect of rate-dependent gain to remain unchanged.
By far the greatest contribution to the gain systematic error came from artificial gain
oscillations at the ωa frequency, introduced by the data reconstruction software. Whereas
“gain” implies a hardware response, the “energy-scale” stability is related to software recon-
struction of waveforms. We give separate entries for these items in Table V. When a signal
was above the hardware threshold level, indicating the arrival of a high-energy positron, a
pre-arranged minimum number of sequential WFD samples, sufficient to cover the pulse,
were transmitted from the WFD to data storage. These data were fit offline for the peak
46

plus linear background to deduce the energy and time of the positron. If the pulse that
triggered the WFD readout is followed closely by another pulse, then the two peaks are fit
together with a common background term, and the fitting region is longer than for a single
peak. The energy of the positrons was found to depend slightly on the length of the fitting
region. Noting that the data rate oscillates at frequency ωa, and is higher at early than at
late decay times, it follows that the fitting region length will oscillate at ωa and it will be
on average longer at early times than at late times. This produces a small gain oscillation
with frequency ωa whose amplitude decreases with time, leading to a systematic error on
ωa. We expect to simulate this effect in detail and reduce its effect in the new experiment
by a factor of three. The reduced flash will lead to improved data fitting, making such
studies much easier than would have been the case in the past. Additionally, our Q-method
data set will contain all samples, meaning a stream of unbroken islands from which detailed
systematic studies can be made in the event that a correction is necessary due to island
length correlation. We estimate a residual uncertainty in the overall gain and energy of less
than 0.03 ppm.
2. Lost muons
“Lost muons” refers to muons that escape the storage ring before they decay. These
losses are about 1% per lifetime at early decay times and decrease to about 0.1% at later
decay times. One consequence of losses is that, in a fit to the data, the lifetime is not quite
correct. This is a slow change in the spectrum with time, having no ωa frequency component;
therefore the contribution to the error in ωa is negligible.
The stated error in Table V from muon losses comes mainly from the uncertainty in the
difference between the average phases for stored and lost muons. For example, one source
of muons, carrying a different phase and potentially lost at a higher rate, are those created
after the momentum-selecting slit just upstream of the inflector. These muons, born from
pion decay in that short region, have a different phase compared to those captured in the
FODO decay channel (the later muons did not go through the final dipole bend, which
precesses the muon spin). Muons born in the FODO section at large angles carry a different
phase compared to those having a smaller initial angles. If they are lost preferentially early
in the spill, the ensemble muon population phase also shifts. In the new beam method, all
47

muons will be captured in the FODO section and thus all will carry the same initial phase.
Additional quads should improve containment.
Nevertheless, we do not know with certainty which muons are lost, and therefore we
are forced to make a worst-case estimate of the maximum possible phase shift, which we
continue to do here. We plan to reduce losses by a factor of at least two, thereby reducing the
contribution to ωa error by a corresponding factor. This will be achieved by increasing the
scraping of the beam—see Appendix B—at the expense of stored beam flux. We therefore
project an uncertainty of approximately 0.04 ppm. In addition to improved scraping, we
plan to do more extensive spin-tracking simulations of the beamline from the FODO section
directly into the storage ring. At the level of uncertainty associated with the statistics of
E821, this full effort was not warranted; we used an extreme upper limit from simple Monte
Carlo instead. For P969, we will carry out these simulations, which will permit a better
limit to be established regardless of the level of muon loss.
3. Pileup
The error due to pileup scales linearly with rate in each segment of the detectors. The
effective size of the segment depends on the geometric extent of the shower. The improved
tungsten-plate detector system, with more segments and smaller Moliere radius than the
previous Pb/SciFi detectors, provides an effective five-fold reduction in pileup. With no
further improvements, and with the proposed factor of 5 increase in data rate, the pileup
error would remain at the 2001 level of 0.08 ppm. While we could accept this level of error,
some improvement is desirable and achievable.
In the past, in order to reduce the effect of pileup in fits to the time spectrum of positrons,
a pileup spectrum was constructed from individual pulses in the data, then subtracted from
the raw spectrum. In the pileup construction, it is necessary to use pulses with pulse heights
below as well as above the hardware threshold. Those pulses below threshold are only found
by searching during the relatively short period of continuous WFD digitization following the
trigger generated by the presence of a large pulse above threshold; this leads to limitations
on the size of the sample of pulses below threshold available for pileup reconstruction and
can also lead to a slight bias of the pulses since they always follow on the tails of larger
pulses. In the new data acquisition scheme, it will be possible to significantly improve the
48

pileup construction process. Continuous digitization, with local software pulse finding, is
anticipated. Pulses of all heights can be searched for independent of whether there is a
nearby large pulse that fired a hardware trigger; furthermore, in the absence of a flash, it
will be possible to find and include smaller pulses in the pileup construction.
In the previous (g − 2) experiment, signals from four detector segments were combined
before WFD digitization. Any mismatch in the relative timing of these signals can lead to
variation in the pulse shape of the sum. In addition, the scintillator fiber in the calorimeters
was strung radially, causing the pulse shape to depend slightly on the radial entrance position
into the detector. These variations in the pulse shape hampered efforts to handle pileup, both
in the fitting of two nearby peaks, and in the process of constructing the pileup spectrum.
The pulse shape is expected to be more stable in the new design, because each segment will
be individually digitized, the scintillator will be oriented azimuthially, and special efforts
will be made to reduce reflections in the calorimeter scintillator, which can widen the pulses
in a position-dependent way.
The contribution of pileup to the error in ωa can be divided into three components.
The first two are correlated and add linearly. The third is not correlated so it is added in
quadrature to the other two, arriving at a new quoted uncertainty of 0.08 ppm for our 2001
analysis.
1. Pileup efficiency, 0.036 ppm. This is due to an estimated 8% uncertainty in the
amplitude of the constructed pileup spectrum.
2. Pileup phase, 0.038 ppm. This is the error due to the uncertainty in the phase of the
constructed pileup spectrum.
3. Unseen pileup, 0.026 ppm. This is the error due to pulses so small that they cannot
be reconstructed and therefore they are not included in the pileup construction. With
the reduced flash background, we expect to be able to see smaller pulses than before,
with improved fit quality. We will also have the advantage that in our Q-method data
taking, the complete sample of data will be accumulated with no hardware threshold.
We believe that the unseen pileup uncertainty will be reduced by a factor of 2. The pileup
efficiency and phase uncertainty will be lowered slightly because of the much more complete
data stream, which extends to zero energy. The efficiency in particular will be lower because
49

of the inclusion of the highly segmented FSH detector system. However, without extensive
study, we do not yet project these improvements much beyond the current status. We use
an uncertainty of 0.07 ppm as our estimate.
The Q method is complementary to the traditional T method and has different sources
of systematic errors. The most significant difference is the effect of pileup—it vanishes for
the Q method.
4. Coherent Betatron Oscillations
The average position and width of the stored beam can vary as a function of time as
the beam alternately focuses and defocuses in the ring. This imposes an additional time
structure on the decay time spectrum because the acceptance of the detectors depends on
the position and width.
It happens that one of the beat frequencies associated with the horizontal CBO is near
ωa, causing interference with the data fitting procedure and leading to a systematic error.
For the 2001 data-taking period, we choose the electrostatic focusing strength, characterized
by the field index n, such that the CBO beat frequencies was as far as possible from omegaa.
This greatly reduced the CBO systematic uncertainty from the 2000 analysis. We will follow
this tuning strategy again.
In addition, several efforts are underway to reduce the CBO effect even further. They
include:
1. Use active rf schemes at very early decay times to reduce the amplitude of the CBO
(see Appendix B),
2. Use an octupole E or B field at very early decay times to damp out the CBO amplitude
(see Appendix B),
3. Increase the vertical size of the detectors. This reduces losses of positrons passing
above or below the detector, reducing sensitivity of the detector acceptance to beam
position and width.
The combined efforts should reduce the CBO uncertainty by a factor of 2 to 0.04 ppm.
50

5. Electric field and pitch correction
With a vertical magnetic field By and radial electric field Er, the precession frequency is
given by
ωa = −(e/m)[aµBy − (aµ − 1/(γ2 − 1))βEr]. (24)
If By and Er vary with position, the time averages 〈By〉 and 〈Er〉 should be used. At exactly
the magic momentum the effect from Er is zero. Muons of slightly higher momentum δp
have an equilibrium orbit
xe =Ro
1 − n· δp
p.
As they oscillate about this equilibrium orbit they experience a mean electric field 〈Er〉 =
n (βBy/R0) xe and their deviation from the magic momentum is proportional to xe. This
leads to a correction to ωa proportional to x2e. In this experiment n is measured from the
observed horizontal betatron frequency, and the distribution of muons with respect to xe is
found from the modulation of counting rate by the rotation frequency of the muon bunch.
The observed value of < x2e > was confirmed by simulation. The correction is 0.46 ppm.
With electric focusing, the plane in which the muon spin is precessing oscillates vertically,
exactly following the oscillation of the muon momentum. When the orbit is inclined at angle
ψ to the horizontal, ωa is reduced by the factor (1 − 12ψ2). If ψm is the angular amplitude
of the vertical oscillation, the average over the ensemble of muons is (1− 14〈ψ2
m〉) where the
brackets indicate an average over the muon population, 〈ψ2m〉 = n〈y2
m〉/r2o where ym is the
amplitude of the vertical oscillation.
Information on 〈ψ2〉 is obtained by simulation in which a representative set of muons is
tracked round the ring from the inflector exit, via the kicker magnet, for many turns. The
discrete quadrupole structure and aperture defining collimators are included as well as the
calculated deviations from a pure quadrupole field. The pitch correction is +0.29 ppm.
A combined (correlated) electric field and pitch correction uncertainty of 0.05 ppm was
used in E821 and we adopt that number for our future estimates.
6. ωa systematic uncertainty summary
Our plan of data taking and hardware changes address the largest systematic uncertainties
and keeps their combined total at approximately 0.11 ppm, which, at this level of projection,
51

TABLE V: The largest systematic uncertainties for the 2001 ωa analysis and proposed upgrade
actions and projected future uncertainties for data analyzed using the T method.
E821 Error Size Upgrade Plan Goal
[ppm] [ppm]
Gain changes 0.12 Gain: unchanged 0.03
Scale: pulse shape, island length immunity 0.03
Lost muons 0.09 New scraping to reduce losses 0.04
Pileup 0.08 Low-energy samples recorded; segmentation 0.07
CBO 0.07 New scraping / taller calorimeters 0.04
E and pitch 0.05 Remains the same 0.05
Total 0.18 Quadrature sum 0.11
is certainly within our error allotment for ωa. Experience shows that many of the “known”
systematic uncertainties can be addressed in advance and minimized, while other more
subtle uncertainties appear only when the data is being analyzed. Because we have devised
a method to take more complete and complementary data sets, we anticipate the availability
of more tools to diagnose such mysteries should they arise. Table V summarizes this section.
52

VIII. MANPOWER
We have formed a new collaboration to carry out this measurement. Fortunately, much
of the expertise built up in E821 is represented and still available to us. We still have senior
experts in the collaboration who cover all of the different technical areas. New institutions
have also joined the effort including UC-Berkeley and Lawrence Berkeley Laboratory, James
Madison University, and the University of Kentucky. Several other groups are interested
in participating and we expect them to sign on once the project timeline is better defined.
As the experiment develops, we expect additional postdocs and students to sign on. We
are proud that E821 offered a rewarding experience for dozens of postdocs and graduate
students and we intend to welcome young physicists in the new effort.
IX. RESOURCES AND COSTS
While we have developed substantial expertise in our collaboration on beamline related
issues, the final design of the new 5.3 GeV/c front end of the beamline and the cost to
add more quadrupoles to the FODO section will require input by the Laboratory. Obvi-
ously the construction and installation of the new elements will fall under the Laboratory’s
responsibility, aided by the Collaboration.
As before, we will need the support of the CAD Cryogenics group for the operation of
our magnet.
The superconducting inflector will need to be fabricated, either at BNL, or in Japan, if
our Japanese colleagues are interested in building the revised inflector.
One of the issues in the precision field is the lack of temperature control in the hall.
Temperature changes cause the yoke to expand or contract, changing the magnet gap and the
field. For E821 we wrapped the magnet in thermal insulation which reduced the sensitivity
to temperature changes in the hall. In the new experiment we will need to temperature
control the hall to improve the magnetic stability of the storage ring. A design was prepared
for E821, but was never implemented.
We assume that the detectors, electronics, and data acquisition system can be obtained
from our individual funding agencies through the university program and a supplemental
grant. Most of the custom waveform digitizers needed for this experiment will be available
53

from the MuLan effort, once that experiment is complete. We expect the total cost of the
detectors, electronics and DAQ to be close to $1M.
X. TIMESCALE
While scientific approval with highest priority is necessary for us to go forward, it is only
the first step in realizing the goals of this proposal. When we visited the Department of
Energy in March 2004, we were told by the Director of the Office of High Energy Physics to
proceed through the usual proposal process at the Laboratory. If this approval is granted,
then we will need to join with the Laboratory to go back to the agency to obtain support
to carry out this new experiment. While we cannot know the timescale on obtaining the
necessary funding, for the sake of this discussion we will assume that it will take on the
order of one year from approval, or roughly the beginning of FY06.
Once funding is obtained, we believe that it will take two years for the construction of
the new beamline, the new inflector, along with the new detectors and other hardware.
The storage ring magnet would need to be powered for shimming and tests for a sub-
stantial period of time before any running could occur. One possibility would be to cool
the magnet in early FY08, with the period of pulse on demand, followed by a three-week
engineering run in the late spring of 2008. The major data run could then take place in
FY2009.
XI. SUMMARY OF THE REQUEST
We propose to improve the E821 measurement of aµ by a factor of 2.5. Combined with
progress on the theoretical value, a 0.2 ppm result can more than double the sensitivity of
the measurement to standard model extensions. The hint of standard model violation in the
final E821 result may be contradicted, or verified, but whether the new result agrees with
the standard model or not, it will place important constraints on models of new physics.
In this proposal, we have identified a timely and cost-effective extension of the E821
measurement, which makes maximum use of the investment to date in the Brookhaven
muon storage ring and related apparatus. It is a task well matched to our expertise and one
that will provide unique insight into fundamental questions in high-energy physics.
54

[1] An overview of non-standard model physics is given by T. Kinoshita and W.J. Marciano
in Quantum Electrodynamics (Directions in High Energy Physics, Vol. 7), ed. T. Kinoshita,
(World Scientific, Singapore, 1990), p. 419.
[2] M. Davier and W.J. Marciano, Ann. Rev. in press, (2004).
[3] G.W. Bennett, et al., (Muon (g−2) Collaboration), Phys. Rev. Lett. 92, 161802 (2004). Spires
shows that this paper has 35 citations.
[4] R.S. Van Dyck et al., Phys. Rev. Lett., 59, 26(1987) and in Quantum Electrodynamics, (Di-
rections in High Energy Physics Vol. 7) T. Kinoshita ed., World Scientific, 1990, p.322.
[5] T. Kinoshita, Rep. Prog. Phys.59,1459 (1996) which is updated in T. Kinoshita and M. Nio,
Phys. Rev. Lett. 90, 021803-1.
[6] R.M. Carey et al., Phys. Rev. Lett. 82, 1632 (1999).
[7] H.N. Brown et al., (Muon (g − 2) Collaboration), Phys. Rev. D62, 091101 (2000).
[8] H.N. Brown, et al., (Muon (g − 2) Collaboration), Phys. Rev. Lett. 86 2227 (2001). Spires
shows that this paper has 483 citations.
[9] G.W. Bennett, et al., (Muon (g−2) Collaboration), Phys. Rev. Lett. 89, 101804 (2002). Spires
shows that this paper has 233 citations.
[10] F. Krienen, D. Loomba and W. Meng, Nucl. Inst. and Meth. A 283, 5 (1989).
[11] A. Yamamoto, et al., Nucl. Instrum. and Methods Phys. Res. A491 23-40 (2002).
[12] G.T. Danby, et al., Nucl. Instr. and Methods Phys. Res. A 457, 151-174 (2001).
[13] Efstratios Efstathiadis, et al., Nucl. Inst. and Methods Phys. Res. A496 ,8-25 (2002).
[14] Y.K. Semertzidis, Nucl. Instrum. Methods Phys. Res. A503 458-484 (2003)
[15] S.I. Redin, et al., Nucl. Instrum. Methods Phys. Res. A473, 260-268, (2001).
[16] R. Prigl, et al., Nucl. Inst. Methods Phys. Res. A374 118 (1996).
[17] X. Fei, V. Hughes and R. Prigl, Nucl. Inst. Methods Phys. Res. A394, 349 (1997).
[18] S.A. Sedykh et al., Nucl. Inst. Methods Phys. Res. A455 346 (2000)
[19] J. Ouyang et al., Nucl. Instrum. Methods Phys. Res. A374, 215 (1996).
[20] D.W. Hertzog et al., Nucl. Instrum. Methods Phys. Res. A294, 446 (1990).
[21] J. Bailey et al., Nucl. Phys. B150, 1 (1979).
[22] T. Kinoshita and M. Nio, Phys.Rev.Lett.90:021803,2003, and Toichiro Kinoshita and M. Nio,
55

arXiv hep-ph/0402206, Feb 2004.
[23] A. Czarnecki, B. Krause and W.J. Marciano, Phys. Rev. Lett. 76 (1996) 3267.
[24] R.R. Akhmetshin, et al, CMD2 collaboration, Phys. Lett. B 527, 161 (2002).
[25] R.R. Akhmetshin, et al, CMD2 collaboration Phys. Lett. B578 285 (2004).
[26] M. Davier, S. Eidelman, A. Hocker, and Z. Zhang, Eur. Phys J. C 27 497 (2003). See K.
Hagiwara, A.D. Martin, D. Nomura, and T. Teubner Phys. Lett. B557, 69 (2003) for an
independent analysis of the e+e− data.
[27] M. Davier, S. Eidelman, A. Hocker, and Z. Zhang, Eur. Phys. J. C 31, 503 (2003).
[28] A. Aloisio, et al., (KLOE Collaboration) arXiv hep-ex/0407048, July 2004 and submitted to
Phys. Lett.
[29] Federico Nguyen, daφne workshop, Frascati, June 2004,
http://www.lnf.infn.it/conference/2004/dafne04/ and Juliet Lee-Franzini, private communi-
cation, July 2004.
[30] R. Alemany, M. Davier and A. Hocker, Eur.Phys.J. C2 123 (1998).
[31] M. Davier and A. Hocker, Phys. Lett.B435, 427 (1998).
[32] Y. Orlov, C.S. Ozben and Y.K. Semertzidis, Nucl. Instrum. Meth. A482, 767 (2002).
[33] S. Ghozzi and F. Jegerlehner, Phys. Lett. B 583, 222 (2004).
[34] M. Davier, SIGHAD2003, arXiv hep-ex/0312065, (2003)
[35] W. Marciano, Private communication, 2004.
[36] A. Aloisio, et al., Phys. Lett. B561, 55 (2003).
[37] Kirill Melnikov, at From Zero to Z0, FNAL 13 May 2004 and private communication.
[38] Marc Knecht, Andreas Nyffeler, Phys. Rev. D65, 073034 (2002); M. Knecht, A. Nyffeler, M.
Perrottet, E. De Rafael, Phys. Rev. Lett. 88, 071802 (2002), J. Bijnens, E. Pallante, and J.
Prades, Nucl. Phys. B626, 410 (2002); M. Hayakawa and T. Kinoshita arXiv hep-ph/0112102,
(2002), I. Blokland, A. Czarnecki and K. Melinkov Phys. Rev. Lett. 88, 071803 (2002).
[39] K. Melnikov and A. Vainshtein, arXiv hep-ph/0312226, 2003.
[40] Andrzej Czarnecki and William J. Marciano, Phys. Rev. D64 013014 (2001).
[41] Juliet Lee-Franzini, private communication, July 2004.
[42] Vera Luth, private communication, June 2004.
[43] Steve Dytman, private communication, July 2004.
[44] Simon Eidelman, private communication, July 2004.
56
[45] T. Blum, Phys. Rev. Lett. 91, 052001-1 (2003).
[46] T. Blum, Nucl. Phys. Proc. Suppl. 129, 904-906,2004, and arXiv hep-lat/0310064,
[47] T. Blum, private communication, July 2004.
[48] Keh-Fei Liu, private communication, July 2004.
[49] E. Eichten, et al., Phys. Rev. Lett. 45, 225 (1980), K. Lane, arXiv hep-ph/0102131, 2001.
[50] Particle Data Group, Phys. Lett. 592 340 (2004)
[51] The articles listed in the SPIRES citations to Ref. [8] contain many different models beyond
the standard model.
[52] U.Rohrer, PSI GRAPHIC TRANSPORT FRAMEWORK and PSI GRAPHIC TURTLE FRAMEWORK based
on the CERN-SLAC-FERMILAB TRANSPORT and DECAY TURTLE by K.L. Brown et al. CERN
80-04 (1980) and SLAC-246 (1982).
[53] W. Liu et al., Phys. Rev. Lett. 82, 711 (1999).
[54] BNL E821 Design Report, 3rd Edition (B.L. Roberts editor) March 1995.
[55] R. Prigl, PhD Thesis, U. Heidelberg (1994).
[56] A.P. Grossmann, PhD Thesis, U. Heidelberg (1998).
[57] S.I. Redin, PhD Thesis, Yale University (1999).
[58] H. Deng, PhD Thesis, Yale University (2002).
[59] Superintendent of Documents, LORAN-C User’s Handbook, U.S. Government Printing Office
#050-012-00331-9, 1992.
[60] P. Neumayer, Diploma Thesis, U. Heidelberg (1999), and references therein.
[61] D. A. Huffman, Proceedings of the Institute of Radio Engineers 40 1098 (1952); see also
Numerical Recipes section 20.4 and references therein.
[62] Paul Scherrer Instutut Experiment R-99-07, A Precision Measurement of the Positive Muon
Lifetime using a Pulsed Muon Beam and the µLan Detector.
[63] Paul Scherrer Instutut Experiment R-97-05, Precision Measurement of Singlet µp Capture in
Hydrogen.
[64] S. Ritt and P. Amaudruz, “The MIDAS DAQ system,” Proc. of the 10th IEEE Real Time
Conference, pp. 309-312, http://midas.psi.ch.
[65] BTRAF J. Sandweiss et al., BNL Bubble Chamber Group Report H-11 (1962), with additions
by H. N. Brown (1982) and A. S. Carroll (1983).
[66] This section was adapted from Yuri F. Orlov and Yannis K. Semertzidis, Muon (g − 2) Note
57

431, January 21, 2003.
[67] This section was adapted from a preprint by I.A.Koop, A.V.Otboev, E.A.Perevedentsev,
P.Yu.Shatunov and Yu.M.Shatunov of the Budker Institute for Nuclear Physics, Novosibirsk.
[68] L.D.Landau, E.M.Lifshitz, ”Mechanics”, Moscow ”Nauka” (1988)
[69] A.N.Dubrovin, ”MERMAID user guide”, Novosibirsk (1994).
[70] E.A.Perevedentsev et al., Preprint BINP, Novosibirsk (1980)
[71] Note, other small uncertainties raise the total to 0.21 ppm; these uncertainties are limits,
which scale with the size of the data set and thus are not expected to change our projections
significantly.
58

APPENDIX A: NEW BEAMLINE CONCEPT
The conceptual design of the new beamline has been simulated with TRANSPORT and
DECAY TURTLE Ref. [52]. These programs have the functionality of BTRAF Ref. [65], the pro-
gram with which the original beamline was designed. Fig. 18 is a TRANSPORT calculation of
the pion beam envelope and dispersion of the E821 beamline. This result is identical to the
one shown in Figure 6.3.2 of the E821 Design Report. The beamline is comprised of five
sections: the pion collection and pion spectrometer section, the matching section, the decay
channel, the muon spectrometer, and the matching section to the storage ring. A dispersed
focus is produced by the Q1Q2D1D2Q3Q4 at the slits K1K2, and the dispersion is removed
by Q5Q6D3D4. Q7 through Q10 rotate the beam envelope of both planes to produce a dou-
ble waist at the center of Q11. Q11 through Q19 are a simple FODO channel with a phase
advance per cell of 90◦. D5Q20Q21Q22 produce a dispersive focus at the slits K3K4 just up-
stream of Q23, and Q23Q24Q25D6 remove the dispersion. Finally, Q26Q27Q28Q29 reform
the beam envelope for passage through the inflector and then into the storage ring. These
optical constraints determine an essentially unique tune for the beamline. The measured
beam profiles in E821 were in very good agreement with the BTRAF simulation.
The inflector represents the limiting aperture of the beamline. Q26Q27Q28Q29 must be
used to maximize the stored muon beam and not simply be used to maximize the transmitted
flux through the inflector. Since no change in the physical aperture of the inflector is
under consideration, in all simulations of the new beamline the tune of Q26Q27Q28Q29 has
not been changed from the operating point of E821. The working hypothesis is then that
if Q26Q27Q28Q29 are not unchanged in the calculation, then a comparison between the
calculated flux through the inflector in a modified beamline to the calculated flux through
the inflector in the E821 beamline represents a valid estimate of the effectiveness of the
modification. A more detailed studied would include the simulation of muon storage after
passage through the inflector.
a. Quad Doubling
Increasing the number of quadrupoles in the decay channel is one possible modification of
the beamline. The decay channel contains the pion flux. Muons from pion decay are emitted
59

along the decay channel isotropically in the pion rest frame. The laboratory momentum and
angle are governed by two-body decay kinematics and the initial pion momentum and angle.
Only muons in a narrow momentum band near the magic momentum of 3.094 GeV/c are
stored by the ring. In addition, the muons must remain within the admittance of the channel
and storage ring. The maximum number of stored muons is obtained when the mean decay
angle is 0◦, and the pion momentum is 0.5% greater than the magic momentum. The
momentum difference between the pions and muons is, however, too small to be separated
in the muon spectrometer. In E821, to allow effective separation of the pions and muons,
the pion momentum was 1.7% above the magic momentum. The mean decay angle in the
laboratory is approximately 4 mrad, and muons produced by pions far from the axis of the
channel are lost. Fewer muons would be lost if the pion beam envelope were smaller. For
a given emittance, the maximum extent of the beam envelope xmax is proportional to the
square root of the maximum of the beta function of the channel, βmax. For a FODO lattice,
βmax is proportional to the length of the FODO cell having a fixed ratio of focal length f to
cell length L. The ratio f/L determines the phase advance per cell, µ. Thus if the length
of the cell were reduced by a factor of two and µ is not changed, βmax is also reduced by a
factor of two, and xmax is reduced by a factor of√
2. Since this reduction occurs in both
transverse planes, the increase in transmitted flux could be as large as a factor of two.
The decay channel is comprised of nine quadrupoles that form four cells. With 17
quadrupoles, eight cells are formed and the phase advance is still a multiple of 360◦. Fig. 19
shows the TRANSPORT beam envelope when the number of quadrupoles in the decay channel
is doubled. The pion momentum and emittance of the beam is the same as in Fig. 18.
The beam envelope in the channel is smaller. In this simulation the effective length of
the quadrupoles is unchanged, the length of the cell is smaller by a factor of two, and the
magnetic field of the quadrupole, calculated using the standard thick lens transport matrix,
increases from 1.788 kG to 3.671 kG. The transmission through the lattice was simulated
with DECAY TURTLE. For the same beam emittance, apertures, and slit settings, the num-
ber of muons passing through slits K3K4 increases by a factor of 1.97, and the number of
muons exiting the inflector increases by a factor of 2.61. Thus the expectation of a factor
of two increase is verified. Since the calculation does not simulate capture by the storage
ring, the increase above the factor of two needs further examination. Increasing the num-
ber of quadrupoles in the decay channel does increase the muon flux; however, the pion
60

FIG. 18: TRANSPORT calculation of the beam envelope and dispersion of E821 beamline for muon
injection tune. The results of this calculation are very similar to the calculation shown in the E821
Design Report. The top panel represents the vertical envelope of the beam; the bottom is the
horizontal envelope.
contamination remains.
b. Backward Decay Beam
Highly polarized muons can also be produced by backward decays in the pion rest frame.
Pions of 5.324 GeV/c produce muons of the magic momentum in the backward decay, and
magic momentum muons could easily be separated from the higher momentum pions. Mod-
ifications of the E821 beamline to use backward decays are considerably more extensive than
the modifications required of the decay channel. The beamline must transport 5.324 GeV/c
pions to the end of the decay channel. Simultaneously, it must transport 3.094 GeV/c muons
produced in the decay channel. The rigidity of the pions is larger by a factor of 1.689. With
this increase in rigidity and with no change of the bend angles the required fields in D1
through D4 are 25 kG. These fields are large, but they may be possible with limited dipole
apertures. With no change in the optics of the pion capture section, the field required in
61

FIG. 19: TRANSPORT calculation of the beam envelope when the number of quadrupoles in the
decay channel is doubled. The same emittance beam is transported in this calculation as in 18.
The maximum size of the beam is reduced.
the first quadrupole exceeds the 15 kG pole tip field limit. If Q1 were used at this field, the
pion flux that could be captured would be reduced by a large factor, approximately 75%.
Although the conceptual design is not completed, several points have been resolved. It is
possible to transmit effectively the 5.3 GeV/c pions and the 3.1 GeV/c muons in the decay
channel. With a modest change in the length of Q1, a 25% increase, and a modest change in
the distance between Q1 and the target, a 10% increase, approximately 85% of the pion flux
can be be captured with Q1 at its field limit. Doubling the number of quadrupoles in the
decay channel increases the muon flux transmitted by the inflector by a factor of two. The
range of pion momentum accepted by K1K2 can be increased by a factor of three from 0.66%
to 2% with an accompanying increase in the muon flux. The larger momentum bite increases
the size of the beam envelope in some places and requires larger aperture quadrupoles. The
relative flux between backward and forward decays needs further simulation.
In a FODO channel the beta function depends on the particle momentum through the fo-
cal length of the quadrupoles. Fig. 20 shows βmax for both forward and backward momentum
pions as a function of quadrupole field for the cell length of the E821 beamline. Both curves
62

have a shallow minimum. At the operating point of the E821 beamline, a field of 1.788 kG,
βmax for the two momenta differ by only 5.1%. The phase advance for the 3.094 GeV/c
muons is 90◦, and for the 5.324 GeV/c pions it is 43◦. The lower phase advance changes
the ratio of βmax to βmin. This difference is evident in the beam envelope shown in Fig. 21.
This tune simply scales Q1-Q6 and D1-D4 by the ratio of 5.342/3.152. With this scaling,
Q1 exceeds the 15 kG field limit by 40% (21.2 kG). The fields of Q7 through Q10 and
several quadrupole separations have been tuned to rotate the beam ellipse to produce a waist
in the center of Q11. The pions are transmitted through the channel with an acceptable
beam envelope. Recall that the channel also transmits magic momentum muons with an
acceptable beam envelope. The beam envelope after the decay channel should be ignored.
This part of the beamline retains the fields appropriate for 3.094 GeV/c. Fig. 22 shows
the beam envelope when the number of quadrupoles in the channel is doubled. Again the
beam envelope is acceptable. The DECAY TURTLE simulations of these two beamlines shows
that doubling the number of quadrupoles increases the flux transmitted by the inflector by
a factor of 2.1. Again a smaller pion beam in the decay channel has the effect of increase
the number of captured muons.
If Q1 is set to the 15 kG field limit, no acceptable tune is possible with this beam
emittance. The beam is lost in Q2 in the vertical; the focal length of Q1 is too long. The
focal length of Q1 can be decreased by an increase in the length of Q1. Fig. 23 shows the
beam envelope that can be obtained with a longer Q1. This beam envelope is acceptable.
The field limit of Q1 then does not appear to be a crucial factor in the consideration of
backward decays.
63

FIG. 20: Calculation of the maximum of the beta function for a simple FODO lattice as a function
of the field in the quadrupoles. The cell length is the same as in 19. The two curves are for pions of
momenta that produce magic momentum muons by forward and backward decays. The operating
point of the channel is at 1.788 kG. At this field, βmax for the two momenta are within 5%.
64

FIG. 21: TRANSPORT calculation of the beam envelope for pions that produce magic momentum
muons from backward decays. The fields in the elements at the beginning of the beamline have
been scaled from 18. The emittance of the beam is the same as in 18. The beam envelope at the
end of the beamline is not relevant since the fields in this part of the beamline are appropriate for
magic momentum muons.
65

FIG. 22: Similar TRANSPORT calculation to 21 except the number of quadrupoles in the decay
channel is doubled. The beam envelope is smaller in the decay channel than in 19.
FIG. 23: TRANSPORT calculation that demonstrates that an acceptable beam envelope can be
achieved by lengthening Q1 with its field limit.
66

c. Summary of Design
We have described two major changes to the existing E821 beamline. The increase in
stored muon flux that will result is being modelled using the Monte Carlo program DECAY
TURTLE. The new tunes were optimized using TRANSPORT. We find that doubling the quads
in the FODO section essentially doubles the muon flux. Tripling or quadrupling the number
of quads—there is room—may provide additional flux. A backward decay beam is ideal
because it will eliminate the hadron-induced flash. We are beginning to model this beam
and have been successful in developing a tune that can transport up to 2 times more pions
through the end of the FODO section. The beamline then remains the same as it is presently,
optimized to transport magic-momentum muons into the storage ring. Muons created from
the backward decay of the 5.3 GeV/c pions fill a different phase space compared to those
for which our forward decay channel has been optimized to transport. We are presently
developing a tune to efficiently transport these muons into the storage ring. At this time,
we cannot be quantitative on the expected flux. We assume no significant gain or loss in
our rate calculations. At the current level of our understanding, a “safe” factor of 2 can be
assumed from the quad doubling and an additional factor of 2 from the inflector replacement.
Additional gains await more complete beam transport studies.
The hardware implications have been mentioned in the main body of this proposal but
include at least a doubling of the FODO quads, modifying the front-end dipoles, lengthen-
ing Q1, and moving the production target (within the blockhouse). Several quads in the
upstream portion of the beam must be replaced with those having slightly larger apertures.
67

APPENDIX B: BEAM DYNAMICS AND SCRAPING
1. The Kicker and Quadrupoles
The incoming bunched beam from the AGS is kicked on orbit by a fast muon kicker
consisting of three identical pulse-forming networks and kicker magnets.[13] The fast muon
kicker worked adequately during the running period of E821, but there are several mainte-
nance items which must be attended to. The first kicker unit must be repaired to replace a
cracked ceramic insulator, which prevented it from holding full voltage. We are also study-
ing the absolute injection efficiency to see if an additional kicker module might improve the
reliability and efficiency of injection. The rate calculations in this proposal do not assume
any additional factor from the kicker.
The electrostatic quadrupoles, which provide the (weak) vertical focusing in the storage
ring, worked well in E821. We do need to improve the lead geometry inside of the vacuum
chamber to further reduce trapped electrons, as well as improve the lead configuration
outside of the vacuum chamber where the high voltage feed-throughs are located to make
them more reliable. These changes represent modest improvements and will not be discussed
further in this proposal.
2. Beam Dynamics in the Ring
The storage ring is a weak focusing ring, with the field index n < 1.0 determined by the
strength of the electrostatic quadrupole field. In the limit of a continuous quadrupole field,
the stored muons execute simple harmonic motion radially (x) and vertically (y) with the
frequencies given by
fy = fC
√n � 0.37fC ; fx = fC
√1 − n � 0.929fC , (B1)
where fC is the cyclotron frequency. The numerical values are for n = 0.137. The frequencies
in the ring are given in Table VI.
One of the systematic errors which must be improved in the new experiment comes
from muon losses out of the storage ring which result from processes other than muon
decay. In E821 we reduced these losses by scraping off particles on the edge of the storage
volume. Scraping is defined as the creation of a gap of several mm between the beam
68

Quantity Expression Frequency Period
fae
2πmcaµB 0.23 MHz 4.37 µs
fcv
2πR06.7 MHz 149 ns
fx
√1 − nfc 6.23 MHz 160 ns
fy√
nfc 2.48 MHz 402 ns
fCBO fc − fx 0.477 MHz 2.10 µs
fVW fc − 2fy 1.74 MHz 0.574 µs
TABLE VI: Frequencies in the (g − 2) ring. CBO = coherent betatron oscillation; V W =vertical
waist; a, c refer to spin precession ωa and cyclotron frequencies respectively.
and the collimators that will either eliminate altogether or drastically reduce particle losses
during data collection time. This was achieved by asymmetrically powering the electrostatic
quadrupoles during and after injection for 10-15 µs and scraping the beam on collimators
placed around the ring. This asymmetry caused the beam to be lifted and moved sideways
during this scraping time. At the end of the scraping period, the beam was returned to the
equilibrium orbit with a 5 µs time constant. While losses were reduced from 0.6% per muon
lifetime in the ring with no scraping to 0.2% with scraping, we will need to do better in the
new experiment.
Because of the small inflector size relative to the storage volume, shown in Fig. 24, the
phase space in the ring is not uniformly filled. This causes the bunched beam to oscillate
coherently both vertically and horizontally in the storage ring. For a detector at a fixed point
in azimuth, the apparent radial motion of the beam is the difference frequency between the
cyclotron frequency and the horizontal betatron frequency given in Eq. B1. The inflector
image is re-formed every betatron wavelength, so that this “waist” in the beam also moves
around the ring with the difference frequency between the the cyclotron frequency and
twice the radial (vertical) betatron frequency. Since the detector acceptance depends on the
radial position of the muon when it decays, the coherent radial betatron oscillations (CBO)
amplitude-modulate the time spectrum. The modulation effect decreases in the time due to
the ”natural” chromaticity of the betatron oscillations, which slightly mix up phases of the
particle oscillations. In E821 we measured a decoherence time of about 100 µs for the CBO,
69

(a) (b)
FIG. 24: (a) The geometry of the inflector exit and the muon storage volume. (b) The cross section
of the inflector.
and the muon lifetime was 64.4 µs .
In the new experiment we wish to reduce the CBO effects, and to improve the scraping
of the beam. Two approaches to reduce the coherent betatron motion and scrape the beam
have been proposed:
1. Using a RF dipole field during the time immediately after injection to first drive the
coherent betatron oscillations to scrape the beam, and then to reverse the phase to
damp the CBO. This technique would get rid of the main CBO but not the “waist”
motion in the beam.
2. A scheme which causes a fast phase mixing in the betatron tune through the intro-
duction into the machine lattice of a nonlinear focusing element such as an octupole.
Preliminary studies indicate that the CBO modulation can be minimized by applying
this field during less than a hundred turns after injection. This will also serve the
purpose of scraping the beam simultaneously with the CBO decoherence.
70

3. Oscillating Dipole Method of Scraping[66]
In E821 we have estimated the horizontal CBO amplitude at injection both directly and
indirectly. The first method involved the fiber beam monitors (see Fig. 25) which consist of
eight 0.5 mm diameter scintillating fibers which are inserted into the beam to measure the
profile. The signal from a single vertical and single horizontal fiber are shown in Fig. 26
where the beam motion across the fiber is clearly seen. The measured CBO amplitude was
found to � 7 mm with a frequency ωCBO = ωC(1 −√1 − n) � 470 KHz.
x monitor y monitor
calibrate
calibrate
FIG. 25: A sketch of the x and y fiber beam monitors. The fibers are 0.5 mm in diameter. For
calibration, the entire “harp” rotates into the beam so that all fibers see the same beam intensity.
This beam CBO manifested itself, among other ways, as a modulation of the number of
detected positron by the electromagnetic calorimeters with an amplitude of � 1%. Monte
Carlo studies showed that an amplitude of � 7 mm for the CBO would cause that modulation
amplitude. Vertically the CBO amplitude is much smaller but still visible from the data at
early times. With similar beam injection conditions the CBO has a well defined frequency,
amplitude and phase. We propose to use this fact to both scrape the beam and eliminate
the horizontal and vertical CBO of the beam due to the motion of the beam center.
This proposal uses a set of four plates, with l = 1 m long azimuthally and placed in
the configuration of the quadrupole plates in the g-2 ring. We will then apply a voltage
difference between the opposite plates with a frequency equal to the horizontal (horizontal
plates) and vertical (vertical plates) CBO. For scraping the beam we will apply the voltage in
phase with the beam CBO phase to increase the CBO amplitude. To eliminate the CBO the
phase will be opposite. To estimate the voltage needed we will consider here the horizontal
CBO, but the same method can be applied for the vertical CBO. The functional form of the
71

Harp 1 (Horizontal), Fiber 4 ns
a.u.
Harp 2 (Vertical), Fiber 4 ns
a.u.
0
1
2
3
4
5
6
7
8
9
2000 3000 4000 5000 6000 7000 8000 9000 10000
0
10
20
30
40
50
60
2000 3000 4000 5000 6000 7000 8000 9000 10000
FIG. 26: The phototube output from a single x and y fiber. The CBO frequency (horizontal) and
VW frequency (vertical) are clearly seen (see Table VI).
horizontal dipole electric field, Ex(t), is
Ex(t) = Ex0 f(s) cos (ωCBOt + θ0), (B2)
where f(s) = 1 for the space between the plates and 0 outside them. We take as t = 0
the time the muon beams enter the electric plates for the first time. Then the equation of
motion can be written as
x + ωC(1 − n)x = ω2CR
(eEx0
βB
)f(t) cos(ωC(1 =
√1 − nt + θ0)) (B3)
where β ≡ v/c and
f(t) =
⎧⎪⎨⎪⎩
1, T q < t <(Tq + l
ν
), q = 0, 1, · · ·N
0, otherwise(B4)
72

Where T � 149 ns, the cyclotron period of the ring. The exact solution of equation 3
with f(t) given by Eq. B4 is
x = a(t)eiωxt + a∗(t)e−iωxt (B5)
a = a0 − ieiθ0N + 1
4√
1 − n
(Ex0l
βB
)[1 +
ei2θ0 [1 − e−i2ωC(1−√1−nT (N+1))]
N + 1[1 − e−i2ωC(1−√1−n)T ]
]. (B6)
where a0 = (xmax/2)eiα corresponds to t = 0 and defines the electric field phase θ0. After
N + 1 turns we get Eq. B6 which for large N > 10 simplifies to
a = a0 − ieiθ0N + 1
4√
1 − n
(Ex0l
βB
), (B7)
where B is the storage ring dipole magnetic field. For xmax = 0.7 mm, N = 60 (i.e. about
10 µs), n = 0.142, and B = 1.45 T we need Ex0 � 0.9 kV/cm at the CBO frequency of
� 470 KHz. For a plate separation of 10 cm it means a voltage amplitude of � 9 KV across
the opposite plates horizontally driven at 470KHz, which is quite reasonable.
The expected beam losses after scraping the beam are going to be dominated by the
vertical scraping since it is expected that horizontally we wouldn’t need to scrape more than
� 7 mm oscillation of the beam at injection. Horizontally we would therefore just wait of
the order of 5µs for the beam to scrape off the collimators after which we would apply the
voltage estimated above to eliminate it. Vertically we would need to apply a voltage for
about 5 µs after injection in phase with the natural one so that we induce an overall vertical
oscillation of the order of 5 mm after which we will flip the sign of the phase to eliminate it.
The total beam losses induced by this method of scraping for a beam gap of 5 mm vertically
and 7 mm horizontally are estimated to be less than 20%.
4. Pulsed Octupole Method to Remove the CBO[67]
This method effects a fast phase mixing by an introduction of a nonlinear focusing ele-
ment in the machine lattice. The nonlinearity induces a dependence of betatron tunes on
amplitudes of transverse oscillations ( δQδa2 ).[68] The CBO modulation could be minimized
during a few tens of turns in the storage ring. Using a time (up to 100 turns) to apply a
pulsed closed orbit distortion can make the CBO vanish while simultaneously scraping the
beam.
73

The rectangular symmetry of the vacuum chamber permits one to install an octupole coil
inside the vacuum chamber. The coil can be wound around an area of 6 cm radius as shown
in Fig. 27, while the beam has r = 4.5 cm. In a preliminary design, a coil length of 2 m was
chosen, located in a section free from electrostatic focusing and kickers. The field lines have
been calculated by the computer code MERMAID.[69]
FIG. 27: Octupole coil in vacuum chamber and magnetic field lines
Particle tracking was done with electrostatic focusing of the (g − 2) ring for different
octupole field strengths, and for several residual horizontal angles after the kicker. The RING
code was used for the tracking,[70] for 10000 particles. The initial phase-space distributions
were assumed to be uniform in both the vertical and radial directions. The muons were
tracked for 100 turns. The initial and stored phase space distributions are shown in Figs. 28.
During tracking, the amplitude of the CBO was evaluated after each turn by the expres-
sion:
A =
√√√√(1 + α2x)〈x〉2 + 2αxβx〈x〉〈x′〉 + β2
x〈x′〉2βx
+(1 + α2
y)〈y〉2 + 2αyβy〈y〉〈y′〉 + β2y〈y′〉2
βy
,
(B8)
where 〈x〉〈x′〉, 〈x〉2, 〈x〉〈x′〉, 〈x〉2 are average over the ensemble coordinates and angles and
their squared values. α and β — are corresponding Twiss parameters.
Fig. 29 shows the CBO amplitude versus turn number N, for different octupole strengths.
One can see an octupole gradient of 0.8 G/cm2 greatly reduces CBO amplitude by the 30-th
74

FIG. 28: Initial and final phase distributions. (a) Initial vertical distribution. (b) Initial radial
distribution. (c) Stored radial distribution. (d) Stored radial distribution.
turn. The tracking shows that neither this reduction factor, nor the amplitude beating after
the octupole is removed, depend on the residual angle. About 50% of the beam is lost using
this method.
FIG. 29: Behavior of the CBO amplitude as a function of turn number and octupole strength.
75

Calculations show that to provide the optimal octupole gradient of 0.8 G/cm2, a pulse
current of 2.5 kA is needed. This will need to be a pulsed octupole, since the octupole
field, as well as any magnetic fields induced by eddy currents in the vacuum chamber or
other conductors nearby, must be negligible before data collection can begin. Simulations
used both a square (ideal) current pulse and a sinusoidal one, and little difference was found
compared to the rectangular one. The parameters of an LCR pulse generator are, Voltage
V=1.3 kV, Capacitance C≈ 1µF , Period T≈ 10 µsec. The octupole coil can be made from
water-cooled copper pipe of 1 cm in diameter. The energy dissipated in such a coil per pulse
is about 1 J.
An alternative electrostatic octupole is able to do the same, but its realization looks from
practical point of view much more difficult, because of the symmetry imposed by the trolley
rails which go all the way around inside the vacuum chamber with four-fold symmetry.
76

APPENDIX C: THE SUPERCONDUCTING INFLECTOR
There are two possible improvements to the superconducting inflector: (i) open the ends,
(ii) open up the size of the beam channel. In this appendix we describe the inflector and
discuss these options.
In order to inject into the storage ring, it is necessary to bring the beam through a rather
large fringe field to the edge of the precision 1.5 T magnetic field. A separate magnet, called
the inflector magnet, is needed to cancel this fringe field in order to permit the beam to enter
undeflected. The injection geometry is shown in Fig. 30. The beam exiting the inflector is
77 mm from the storage ring center, as is shown in Fig. 31
FIG. 30: A plan view of the storage ring and injection line, showing the location of the supercon-
ducting inflector.
In the CERN experiment[21], a pulsed co-axial device was employed for this purpose.
In E821 it was realized early on that such a pulsed device with the needed repetition rate
would be almost impossible to fabricate. Furthermore, the transient effects from such a
device could potentially spoil the uniform field seen by the stored muons, and thus introduce
serious systematic errors.
The idea of a static superconducting inflector[10] solved these problems, providing that
the field leakage from the inflector magnet could be kept out of the storage ring. This
was done using a passive superconducting shield[11] which traps any stray flux before it
77

FIG. 31: An elevation view of the inflector exit, the magnet pole pieces, and the beam vacuum
chamber.
gets to the storage volume. This idea worked, giving the precision field shown in Fig. 1.
Measurements showed that the superconducting sheet holds off up to 1 kG of field. This
shielding factor gives a factor of five margin over the measured leakage from the open end
prototype.
The inflector is based on a truncated double-cosine theta design, shown in Fig. 32, where
the conductors inside of the “D” carries current in the opposite direction from those in
the shape of a “D”. The flux configuration, along with the cross section, are shown in Fig.
32. When placed in the fringe field of the magnet, the field is (essentially) zero in the
beam channel and 3 T in the return part of the inflector. To reduce the flux density at
the superconductor, the area (hence volume) for the return path of the magnetic circuit is
much larger than in the beam channel region, which can be seen clearly in Fig. 32. The
superconductor in the inner coil has to have a critical current adequate to support the 3 T
field without quenching.
In the inflector used in E821, the superconductor was wound over the beam channel
so that both ends of the inflector were covered with material. The cable is composed of
NbTi:Cu:Al = 1:0.9:3.7, which is equivalent to at total of ∼ 13 mm of Al covering the
entrance and exit of the inflector beam channel. It is possible to increase the amount of
beam stored by opening the inflector ends. Beam transport studies showed a loss in stored
78

0.0 10.0 20.0 30.0 40.0 50.0 60.0 70.0 80.0 90.00.0
5.0
10.0
15.0
20.0
25.0
30.0
35.0
40.0
45.0
50.0
55.0
60.0
65.0
X [mm]
Y [mm]
(a) (b)
FIG. 32: (a) The conceptual design of the inflector showing the flux path for the upper half. The
current in the conductors forming a “D” flows in the opposite direction, from that in the backwards
“C”. The geometry is such that there is minimal flux leakage along the body of the inflector. (b)
The cross section of the inflector.
(a) Open End (b) Closed End
FIG. 33: Photos of the open- and closed-end inflector prototype.
muons from multiple scattering and energy loss by a factor of 1.7 (neglecting the Landau
79

tail) compared to the open-end version. This factor increases to 2 when this tail is included.
While the open end was more complicated to fabricate, during the E821 R&D phase a
0.5 m prototype was built and tested both alone and in an external 1.5 T field.
Nevertheless, we chose the closed end design for E821 since we felt this was a more
conservative design, and the muon transmission through it was thought to be adequate to
reach our design goal of 0.35 ppm relative error. Our concerns at that time were two-fold:
(i) minimizing the stray field at the end of the inflector, and (ii) stability against quenches.
Now that we have experience with the passive superconducting shield, we are confident that
flux leakage into the storage volume will not be a problem. We will revisit the question of
stability, but since the open end prototype worked well in an external field, we are confident
that a working inflector can be made with both ends open.
80

APPENDIX D: NEW CALORIMETERS
The basic material design requirements for a new calorimeter are largely unchanged; it
must be dense and fast. Additionally, the new calorimeter must be segmented transversely
with respect to the incoming positron, so that simultaneous events can be distinguished 4
out of 5 times. Building new Pb/SciFi calorimeters with fibers running longitudinally (i.e.,
rotated by 90 degrees) is one possible solution. The downstream face of the detector would
be a fiber / lead grid that could be readout in small and independent segments. Members
of our Collaboration have built detectors of this type in the past, with incoming photons
nearly co-linear with the fiber direction (see Ref. [20]). This re-oriented Pb/SciFi option
is attractive in principle, but there are two drawbacks. First, the downstream space is
limited by the existing vacuum chamber structures. A denser detector is desired to open
up additional space for the readout system. Second, simple simulations using ρM = 2.5 cm
and the requirement that showers be separated by at least 2ρM , indicate a pileup separation
factor of no better than 3 (the simulation uses the actual distribution of electrons on the
calorimeter face, see Fig. 34). The goal of the new detectors is to separate simultaneous
showers by a factor of about 5. To do so requires the detector to have a smaller Moliere
radius.
A simple detector, which should satisfy our needs, can be assembled from alternating
layers of tungsten (W) and plastic scintillator. The scintillator is envisioned to be made
from ribbons of adjacent 0.8 mm diameter single-clad fibers. The W plates are also 0.8 mm
thick. Each module is 4 × 4 cm and has a length of 11 cm (15X0). The fiber ribbons are
oriented vertically so that the positrons, which are curling inward, must cross W layers and
initiate showers. The individual modules are stacked in a 4 × 5 array to form a detector
that is 16 cm high by 20 cm radially. The increased height compared to the 14 cm high
E821 calorimeters improves overall shower containment and reduces sensitivity to vertical
width fluctuations induced from the coherent betatron modes. The reduced radial dimension
22.5 → 20 cm accepts fewer low-energy positrons, which are the least interesting as they
carry a lower asymmetry.
Figure 35 shows one calorimeter module. A lightguide is made from a tapered section
coupled to a laminated acrylic sheet bundle bent at 90 degrees toward the inside of the ring.
Lightguide extension rods will pipe the light to an array of 20 PMTs located about 1 m away.
81

cm0 2 4 6 8 10 12 14 16 18 20
0
500
1000
1500
2000
2500
3000
3500
4000
4500
cm-8 -6 -4 -2 0 2 4 6 8
0
1000
2000
3000
4000
5000
6000
7000
100
200
300
400
500
cm0 2 4 6 8 10 12 14 16 18 20
cm
-8
-6
-4
-2
0
2
4
6
8
FIG. 34: Right panel: Hit position of positrons on calorimeter front face from from GEANT sim-
ulation. Top left panel: radial distribution; storage ring edge is at large x values. Bottom left:
vertical distribution.
The distance is required to keep the PMTs sufficiently away from the storage ring magnetic
field and to keep the PMT shielding materials sufficiently far away from perturbing field. A
complete calorimeter, including lightguides, is shown in Fig. 36. Its assembly position, with
respect to the existing scalloped vacuum chamber, is shown in Fig. 37. As is evident, the
space is quite tight.
The 29-mm (1-1/8 in) PMTs have not yet been selected but their basic characteristics
are understood and standard. We are using an array of 340 Photonis XP-2982, 11-stage
PMTs for the muon lifetime experiment MuLan at PSI. The similar 10-stage XP-2972 is
more appropriate for P969 because of the high light yield from the calorimeter modules.
Both tubes were carefully evaluated by us and feature similar important characteristics: low
noise, high gain, no detectable after-pulses. We will have to design a robust, rate-dependent
base as the initial rate of up to a few MHz is higher than what can be comfortably handled
by the stock resistor divider network in the simplest Photonis bases.
Preliminary GEANT simulations have been performed to evaluate the performance of the
W-SciFi calorimeter subjected to the decays from muons in our tracking simulations. The
82

FIG. 35: One of the 20 calorimeter segments. Each segment contains 25 layers having a 0.8 mm
tungsten plate and a 25-fiber ribbon of 0.8 mm scintillating fiber. The segment is 4 × 4 × 11 cm.
A schematic lightguide includes a tapered section, followed by a laminate of thin sheets of acrylic,
bent toward the inside of the storage ring.
FIG. 36: Schematic of the segmented calorimeter lightguide arrangement.
83
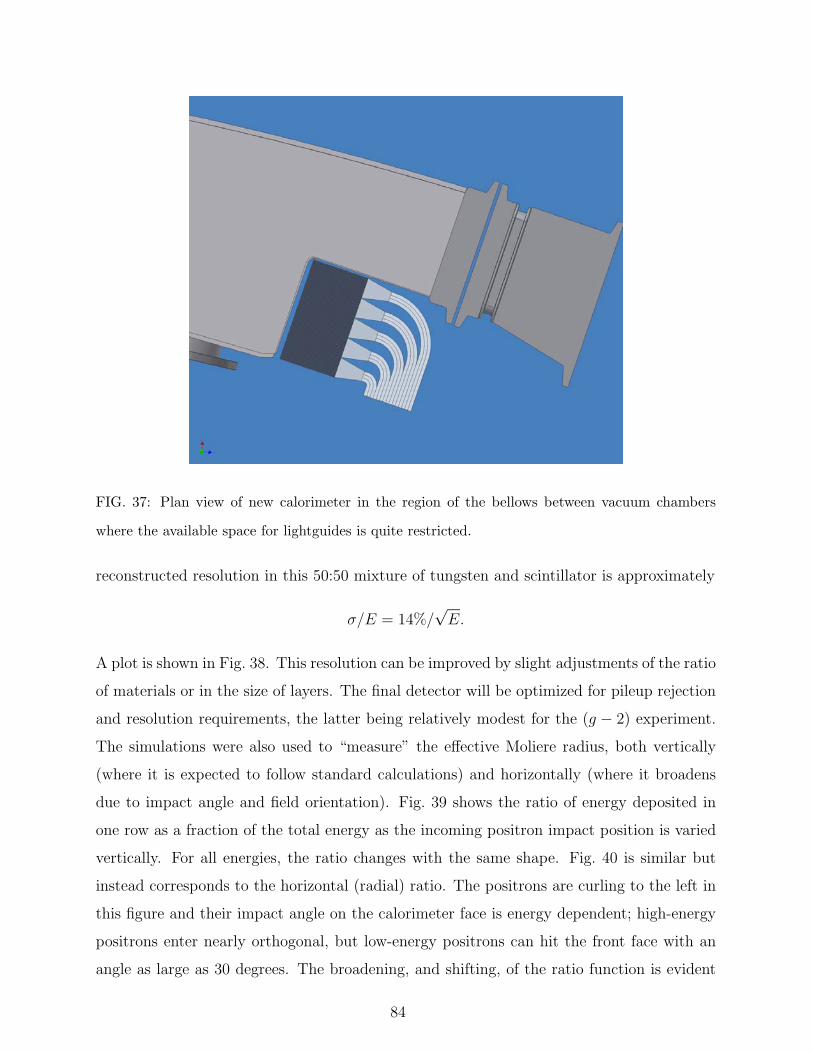
FIG. 37: Plan view of new calorimeter in the region of the bellows between vacuum chambers
where the available space for lightguides is quite restricted.
reconstructed resolution in this 50:50 mixture of tungsten and scintillator is approximately
σ/E = 14%/√
E.
A plot is shown in Fig. 38. This resolution can be improved by slight adjustments of the ratio
of materials or in the size of layers. The final detector will be optimized for pileup rejection
and resolution requirements, the latter being relatively modest for the (g − 2) experiment.
The simulations were also used to “measure” the effective Moliere radius, both vertically
(where it is expected to follow standard calculations) and horizontally (where it broadens
due to impact angle and field orientation). Fig. 39 shows the ratio of energy deposited in
one row as a fraction of the total energy as the incoming positron impact position is varied
vertically. For all energies, the ratio changes with the same shape. Fig. 40 is similar but
instead corresponds to the horizontal (radial) ratio. The positrons are curling to the left in
this figure and their impact angle on the calorimeter face is energy dependent; high-energy
positrons enter nearly orthogonal, but low-energy positrons can hit the front face with an
angle as large as 30 degrees. The broadening, and shifting, of the ratio function is evident
84

htempEntries 1649Mean 0.02038RMS 0.1159
/ ndf 2χ 59.36 / 54Constant 3.13± 98.23 Mean 0.00251± 0.01245 Sigma 0.00196± 0.09826
Measured -- Truth [GeV]-0.4 -0.2 0 0.2 0.4 0.6 0.8
Co
un
ts in
2-2
.1 G
eV r
ang
e
0
20
40
60
80
100
120 htempEntries 1649Mean 0.02038RMS 0.1159
/ ndf 2χ 59.36 / 54Constant 3.13± 98.23 Mean 0.00251± 0.01245 Sigma 0.00196± 0.09826
W-SciFi Calorimeter
FIG. 38: Reconstructed energy vs. actual energy of positrons from GEANT simulation into W-SciFi
sampling calorimeter. A cut is made from 2.0-2.1 GeV; the resolution is approximately 10%.
Hit position vertically [cm]-4 -3 -2 -1 0 1 2 3 4
En
erg
y R
atio
(T
op
/ T
ota
l)
0
0.1
0.2
0.3
0.4
0.5
0.6
0.7
0.8
0.9
1
0-1GeV1-2GeV2-3GeV
Top segmentBottom segment
FIG. 39: Ratio of energy deposited in the top rows vs. the total as a function of vertical impact
position. The green dashed line represents the boundary in the middle of the calorimeter. The
three bands correspond to different positron energies.
in this figure. We are using this detailed simulation to develop algorithms to distinguish
simultaneous events having different energies and impact positions.
85

Horizontal impact position [cm]-4 -3 -2 -1 0 1 2 3 4
En
erg
y R
atio
(R
igh
t / T
ota
l)
0
0.1
0.2
0.3
0.4
0.5
0.6
0.7
0.8
0.9
1
0-1GeV1-2GeV2-3GeV
FIG. 40: Ratio of energy deposited in the ‘one side vs. the total as a function of horizontal
(radial) impact position. The green dashed line represents the center of the calorimeter. The three
bands correspond to different positron energies. Low-energy positrons strike the calorimeter at a
non-negligible impact angle, pointing to the left in this figure.
86


![SOL - Προσοχή M«: 5 / 10 ΦΥΛΛΟ ∆Ε∆ΟΜΕΝΩΝ ΑΣΦΑΛΕΙΑΣ. µ : 2 µ µ : 13 / 4 / 2015 : 28 / 5 / 2012 ENERMIX C3 0203 8. / µ 8.1. µ µ : µ (GR) 8h [ppm]](https://img.dokumen.tips/doc/110x75/60cfd1029143596b0415c29c/sol-f-m-5-10-aaoe-.jpg)


![DDS C ,bc ]^ - NEDO · DDS ˘ˇˆ ... DSBL 3.70 ppm DSBL 1.23 ppm BC 100.00 ppm BC 33.33 ppm BC 11.11 ppm BC 3.70 ppm BC 1.23 ppm DMCBL 100.00 ppm DMCBL 33.33 ppm DMCBL 11.11 ppm](https://img.dokumen.tips/doc/110x75/5ad6c02a7f8b9a6d708e8ad8/dds-c-bc-dsbl-370-ppm-dsbl-123-ppm-bc-10000-ppm-bc-3333-ppm.jpg)


![1. Excel. µ file- µ « . µ µ µ µ µ µ µ µ ; µµ ; µµ µ Excel Word; µ µ µµ ;[ ] µ , µ µ µ](https://img.dokumen.tips/doc/110x75/5e1c0fbb3625a8105f7711f5/1-excel-excel-word-.jpg)


