Embed Size (px)
Citation preview

International Journal of Industrial Engineering & Production Research (2019) 30: 225-239 DOI: 10.22068/ijiepr.30.2.225
International Journal of Industrial Engineering & Production Research, June 2019, Vol. 30, No. 2
A Fuzzy Multi-objective Model for Order Allocation to Suppliers under Shortfall and Quantity Discounts Mojtaba Salehi1* & Haniyeh Rezaei2 Received 03 April 2018; Revised 03 March 2019; Accepted 08 May 2019; Published online 20 June 2019 © Iran University of Science and Technology 2019 ABSTRACT For new strategies of purchase and production process, suppliers play a key role in achieving competitive capabilities for large-sized companies. The selection of suitable suppliers is a critical component of this strategy. The problem of allocating order to suppliers is a multi-objective one that includes fuzzy parameters; in addition, suppliers usually consider discount in the case of different levels of purchase amount. Since there is no multi-objective fuzzy model for order allocation in the literature to consider discount and shortfall simultaneously in the planning horizon of multiple products, this research proposes a new model that includes minimization of costs, delays, and the percentage of defective parts as objective functions. Price, demand, delay, and percentage of defective parts are considered fuzzy parameters. Since the model is NP-hard, the two metaheuristic algorithms, NSGAII and MOPSO, have been used for solving the problem with tuned parameters using Taguchi method. According to the results of numerical problems, the proposed algorithms can provide a good approximation of the optimal solutions. KEYWORDS Supplier selection, Order allocation, Discount, Genetic algorithm, Particle swarm optimization algorithm.
1. Introduction1 In recent decades, many companies have faced the challenge of purchasing management in a supply chain; therefore, the need for accessing a suitable level of global competition in supply chain has increased substantially. Since suppliers have a significant impact on the success or failure of a company, purchasing management, which was almost considered as a merely technical tool, is considered a strategic task (Van der Vlist et al., 1997). The decisions about supplier selection involve answering questions such as (a) what type of a supplier should be selected as a source purchase and (b) how order values should be allocated among the selected suppliers. Among many other issues in the real world, uncertainty is an important part of the supplier selection problem. To make an effective and harmonic configuration of the supply chain, the ambiguity of existing information coming from implicit and explicit factors in suppliers’
Corresponding author: Mojtaba Salehi
*
1. Department of Industrial Engineering, Payame Noor University, Tehran, Iran.
2. Department of Industrial Engineering, Payame Noor University, Tehran, Iran.
selection issue must be considered. Peidro et al. (2009) conducted the classification and a detailed review of qualitative techniques of supply chain planning under uncertainty. In general, the selection of suppliers is expressed in two forms: single-source and multi-source. In the single-source form, a supplier can satisfy all buyers' needs including number, quality, delivery time, etc. In the second type of supplier selection, none of the suppliers will be able to meet all the needs of the buyers. Therefore, some restrictions such as the capacity of the buyer, quality, etc. must be investigated in the supplier selection process. In such terms, management divides his order quantity between different suppliers (Demirtas and Ustun, 2008). In this research, supplier selection and order allocation are considered as the multi-criteria decision-making problems along with uncertain information. Since there are some uncertainties concerning price, demand, delays, and percentage of defective parts, they are considered fuzzy. The approach presented by Jimenez (2007) was used to make these parameters defuzzied. In addition, a comprehensive approach along with three objectives of minimizing price, delays, and defective parts is considered for the proposed model.
RESEARCH PAPER

226 Mojtaba Salehi1* & Haniyeh Rezaei2 A Fuzzy Multi-objective Model for Order Allocation to Suppliers under Shortfall and Quantity Discounts
International Journal of Industrial Engineering & Production Research, June 2019, Vol. 30, No. 2
In the following, first, the respective literature will be reviewed. Then, in Section 3, fuzzy multi-objective supplier selection is described in detail. Then, this model is converted to a deterministic model using Jimenez (2007) approach. In Section 4, NSGAII and MPSO approaches are developed to solve the problem, and the way these parameters are set using the Taguchi approach is described. Finally, in Section 5, the results of the implementation of two algorithms are compared with Epsilon constraints using a numerical example; in this regard, suggestions are recommended for future study.
2. Literature Review The problem of supplier selection is proposed in two forms: single-source and multi-source. An appropriate method to ensure the functionality of
supplyed services by the manufacturer is multiple-supply policy. In this condition, a company buys an item from several suppliers. Even if this choice requires greater flexibility of the company, it is attractive for some reasons such as discount or possible constraints in the field of making capacity, quality, delivery, price, etc., in case the provider fails to meet the customer demands. In this situation, mathematical programming is the best technique for formulating the problem of supplier selection and order allocation. Gaballa was the first author to use this technique for supplier selection in real cases. In 1974, he applied fractional integer programming to formulate the decision-making problem for Australia Post (Ghodsypour and O'Brien, 2001).
Tab. 1. Literature review of supplier selection and order allocation
Solv
ing
met
hod
Inve
ntor
y co
ntro
l
disc
ount
perio
d
prod
ucts
Obj
ectiv
e ty
pe
Prob
lem
type
Yea
r of p
ublic
atio
n
Author(s)
Heu
ristic
exac
t N
o
Yes
With
with
out
Mul
ti-tim
e
Sing
le-ti
me
Mul
ti-pr
oduc
t
Sing
le-p
rodu
ct
Mul
ti-ob
ject
ive
Sing
le-o
bjec
tive
Sele
ctin
g an
d al
loca
ting
orde
r
Sele
ctin
g su
pplie
r
2009 Ebrahimi R. M. et al.
2011 Amid et al.
2011 Kara
2012 Glock, C.H. et al.
2015 Torabi et al.
2015 Moghaddam
2015 Memon et al.
2016 Paydar et al.
2017 Qin et al.
2018 Torabi & Boostani
2018 Ekhtiari et al.
2018 Abdel-Basset et al
Chaudry et al. (1993) used linear programming for both single-source and multiple-source problems to minimize the order cost for
individual items during the horizon time. The authors sought a number of objectives such as establishment of continuity in production capacity, suitable performance of delivery,

227 Mojtaba Salehi1* & Haniyeh Rezaei2 A Fuzzy Multi-objective Model for Order Allocation to Suppliers under Shortfall and Quantity Discounts
International Journal of Industrial Engineering & Production Research, June 2019, Vol. 30, No. 2
quality, and a small discount. To generalize this objective, different models have been proposed. Besides the quantitative and commercial discounts, the third strategy of discount is related to multi-item models. In fact, in this method, the price of each item depends on the quantity order of other items. This problem occurs when two or more related items are sold. Resenthal et al. (1995) were the first researchers to use this method for supplier selection. They applied a linear programming method to minimize the ordering cost and create a continuous chain of supply capacities, customer satisfaction, and product quality and delivery simultaneously. The authors recommended developing and generalizing the export products in the form of EOQ. Literature review of supplier selection and order allocation is presented in Table 1. According to the table, the most recent research studies have focused on supplier selection and order allocation under single-objective and single-product states. In addition, in the multi-objective researches, the discount and deficiency are not considered at the same time in the planning time horizon. Therefore, this study proposes a fuzzy multi-objective model with discount and deficiency policy and uses meta-heuristic methods to solve the model. In this paper, a fuzzy multi-objective and multi-product mathematical model is represented with incremental and volume discounts approaches. Three criteria are considered for supplier selection as follows: the amount of defective parts, the percentage of delay time, and the costs that include the purchase costs based on the volume and incremental discounts. To solve the fuzzy model, constraints and objective function are integrated using Zimmerman method.
3. Mathematical Model In this section, the assumptions, parameters, decision variables, and the proposed model are presented for the supplier selection and orders allocation in the production environment. 3-1. Assumptions
1. Supplier wants to optimize necessary products at various interval times.
2. In this model, the incremental and volume discounts are considered.
3. It is not necessary for the suppliers to provide all products in all time periods
along with a range of discounts and both different types.
4. Fuzzy objective functions and constraints of demand are defined as a triangular fuzzy number. Other constraints are defined as the definitive one.
5. Inventory and shortage are permitted. The imposed cost of the inventory transferred to the next period is only the cost of holding inventory and the cost of shortage that is equivalent to the lost sale per unit of shortage.
3-2. Indices, parameters, and variables i : Supplier’s index n: Total number of suppliers t: Period index m: Total number of periods v: Index of product’s type o: Total number of product’s types k: Index of discount interval 퐏퐢퐭퐯퐤 : The price of the ordered product to supplier i at the time interval t in the range of discounts k for product v (fuzzy) 퐱퐢퐭퐯퐤 : The order numbers of supplier i at time interval t in the range of discounts k for product v 퐲퐢퐭퐯퐤 : If product v is granted to the supplier i at time interval t in discounts k, 푌 = 1 , otherwise 푌 = 0 퐊퐢퐭퐯 : The last discount range of supplier i in time interval t for product v 퐔퐢퐭퐯퐣 : The upper limit of the range discounts of supplier i in time interval t for product v 퐋퐢퐭퐯퐤 : The Lower limit of the range discounts of supplier i in time interval t for product v 퐝퐢퐯 : The defective percentage of supplier i for product v (fuzzy) 퐡퐢퐯 : Supplier delay i for product v (fuzzy) 퐃퐭퐯: Product demand v in time interval t (fuzzy) 퐂퐢퐯 : Supplier production capacity i for product v 퐇퐯: The cost of holding products in the transition of time interval 퐆퐯 : The cost of shortage product v in the transition of time interval 퐈퐭퐯 :The inventory transferred from period t to t + 1 퐒퐭퐯 : Lacking amount of period t 퐥퐢 : If the discount is incremental, it is equal to 1, otherwise, it is 0. 3-3. Problem model The objective functions and constraints of the problem are as follows:

228 Mojtaba Salehi1* & Haniyeh Rezaei2 A Fuzzy Multi-objective Model for Order Allocation to Suppliers under Shortfall and Quantity Discounts
International Journal of Industrial Engineering & Production Research, June 2019, Vol. 30, No. 2
3-3-1. Cost function The developed cost function based on the incremental and volume discount takes into account multi-product and multi-period models, as well as the cost of holding inventory as follows: minZ = ∑ ∑ ∑ ∑ P (x −
y U ( )) + y ∑ P U − U ( ) ∗
l + ∑ ∑ ∑ ∑ P ∗ x ∗ (1 − l ) +∑ ∑ H (I )+ ∑ ∑ G (S ) (1) 3-3-2. Defective parts function Defective parts impose some cost on the buyer including the cost of improper planning, the cost of using low-quality components in the manufacturing and assembly, and the cost of reworking and warranty. The following function can express the objective of the buyer. min Z
= d x (2)
3-3-3. Delay in delivery function Due to the cost of delay in the delivery of the parts for the manufacturer, many companies tend to buy from suppliers who have the minimum delay in delivery of parts. Most of the costs are imposed because of failing to deliver products to the customer on time and, subsequently, due to the delay and the lost sales cost and also invisible costs such as loss of customer and loss of reputation or brand of manufactured product along with the cost of scheduling changes in production line. The following function provides this objective.
min Z = h x (3)
There are several constraints for the proposed model of supplier selection as follows: 3-3-4. Inventory and demand constraints For each product v at each time interval t, there is a demand constraint. This constraint states that the total number of orders v at time interval t per different suppliers plus the transferred inventory from the previous period minus the transferred
inventory to the next period should be equal to demand in each period (D ). In the proposed model, the demand rate for each product in different periods is expressed as a triangular fuzzy number.
x + I( ) − I
+ S = D forallt&v(4) I = 0forall푣 (5)
3-3-5. Range of discounts constraints The number of order to supplier i at time interval t for product v in the range discount k should be between the upper limit and lower limit of the discounts range. L y ≤ x ≤ U y (6) In addition, order is just accrued to supplier i at time interval t for product v.
y ≤ 1∀i = 1,… , n&
t = 1, … ,m&v = 1, …, o.(7) 3-3-6. Capacity constraints It is stated that the number of orders to supplier i for product v must be less than or equal to production capacity of the supplier for product v.
x ≤ C ∀i = 1, … , n&t = 1, …,m&
v = 1, …, o.(8) 3-4. Finalizing the proposed model Fuzziness of the model results from uncertainty in some parameters such as product demand, delay, product quality, price. Constraints and objective functions of the proposed model are defuzzied by changing the structure of the model. This paper uses the method proposed by Jimenez et al. (2007) to defuzzy the parameters. According to this method, the degree that shows a fuzzy number “a” is greater than or equal to number “b”, expressed as follows:

229 Mojtaba Salehi1* & Haniyeh Rezaei2 A Fuzzy Multi-objective Model for Order Allocation to Suppliers under Shortfall and Quantity Discounts
International Journal of Industrial Engineering & Production Research, June 2019, Vol. 30, No. 2
μ =
⎩⎪⎨
⎪⎧ 0ifE − E < 0
E − E
E − E − E − Eif0 ∈ E − E , E − E )
1ifE − E > 0
(9)
where E , E and E , E are the expected intervals of a and b . If 휇 (푎̃, 푏̃) = 0.5 , numbers “a” and “b” will be equal. When 휇 (푎̃, 푏̃) ≥α , a in α degree will be greater than or equal to b, as shown by a ≫ αb. Definition: for a constraint,
a x ≥ αb ,i = 1, … ,m(10) According to the above description, it can be shown that
E − E
E − E +E − E≥ αOR (1 − α)E + αE x ≥ αE + (1 − α)E i = 1,… ,m(11)
Finally, the overall model of objective function is as follows:
minZP + 2P + P
4 (x − y U ( ))
+ yP + 2P + P
4 U − U ( ) ∗ l
+P + 2P + P
4 ∗ x ∗ (1 − l ) + H (I ) + G (S )(12)
min Z =d + 2d + d
4 x (13)
min Z =h + 2h + h
4x (14)
St.
∑ ∑ x − I + I( ) + S = α( ) + (1 − α)( )forallt&v (15)
I = 0forallv(16)
L y ≤ x ≤ U y (17)
y ≤ 1∀i = 1, … , n&t = 1,…, m&v = 1, … , o.(18)
x ≤ C ∀i = 1, … , n&t = 1,… ,m&v = 1,… , o(19)
4. The Proposed Solution Method
In order to solve the problem, two meta-heuristic solution methods have been proposed. The proposed solution methods are described in detail.
4-1. Non-recessive sorting genetic algorithm One of the most efficient and best-known multi-objective optimization algorithms is non-recessive sorting genetic algorithm (NSGA-II), which was proposed by Deb et al. (2002). This

230 Mojtaba Salehi1* & Haniyeh Rezaei2 A Fuzzy Multi-objective Model for Order Allocation to Suppliers under Shortfall and Quantity Discounts
International Journal of Industrial Engineering & Production Research, June 2019, Vol. 30, No. 2
algorithm is one of the fastest and most powerful optimization algorithms that feature less operational complexity than other methods and can obtain Pareto solutions using the dominance principle and congestion distance calculation that have appropriate extent in the changes area of objectives function and allow a user to choose his/her preferred solution through Pareto solutions. NSGA-II can keep elitism and dispersal simultaneously. In this method, a population of children is considered and, by using parents population, the size of the two populations is N. These two populations are merged and classified using the non-recessive sorting; finally, the new population is obtained including the best N members. Any classified population is called a front solution. 4-2. Multi-objective particle swarm optimization algorithm (MOPSO) Particle swarm optimization algorithm was developed by a social psychologist named James Kennedy et al. (1995) for the first time using previous experiences related to modeling of the social behaviors that can be seen in many types of birds (particle). A significant number of these
algorithms attracted researchers at the time; however, these two researchers greatly stressed the significance of models that were created by biologist Frank Heppner. According to Heppner model (a point that was different from the other models), it is possible for birds to have a high incentive to descend rather than stay among the team while descending. In PSO algorithm, members of groups exchange information about the best-found place. In addition, the best-found place in the current stage among a neighborhood of members is exchanged among members of the neighborhood. This information is used to update the position and speed of members in each stage (Kennedy and Eberhart, 2001). Figure 1 shows the structure of the proposed multi-objective PSO algorithm in this study. In fact, since the proposed problem space is in the binary form, binary MOPSO developed by Eberhart and Kennedy was used in the current study. In order to update the archive of Pareto solutions, roulette wheel operator was used. Most evolutionary meta-heuristic methods use a random approach to generate initial solutions. Here, the same approach was adopted to generate original solutions (Benitez et al., 2005).
Pseudo code of MOPSO algorithm 1: 퐴:= ø Initially empty archive 2: {푥 , 푣 , 퐺 , 푃 } ≔ 푖푛푖푡푖푎푙푖푠푒() Random locations and velocities 3: 푓표푟푡:= 1: 퐺 G generations 4: 푓표푟푖:= 1:푁 5: 푓표푟푑:= 1:퐷 Update velocities and positions 6: 푣 (푡) = 푤푣 (푡 − 1) + 푐 푟 (푝 − 푥 (푡 − 1)) + 푐 푟 (푝 − 푥 (푡 − 1)) 7: 푥 (푡) = 푥 (푡 − 1) + 푣 (푡) 8: 푒푛푑 9: 푥 := 퐸푛푓표푟푐푒퐶표푛푠푡푟푎푖푛푡푠(푥 ) 10: 푦 ≔ 푓(푥 ) Evaluate objectives 11: 푖푓푥 ≮ 푢∀푢 ∈ 퐴 Add non-dominated 푥 푡표퐴 12: 퐴 ≔ 푢 ∈ 퐴│푢 ≮ 푥 Remove points dominated by 푥 13: 퐴 ≔ 퐴 ∪ 푥 Add 푥 to A 14: 푒푛푑 15: 푒푛푑 16: 푖푓푥 ≤ 푝 ∨ (푥 ≮ 푝 ⋀푝 ≮ 푥 ) Update personal best 17: 푝 ≔ 푥 18: 푒푛푑 19: 퐺 := 푆푒푙푒푐푡퐺푢푖푑푒(푥 , 퐴)
20: 푒푛푑 Fig. 1. The pseudo-code of the proposed algorithm MOPSO

231 Mojtaba Salehi1* & Haniyeh Rezaei2 A Fuzzy Multi-objective Model for Order Allocation to Suppliers under Shortfall and Quantity Discounts
International Journal of Industrial Engineering & Production Research, June 2019, Vol. 30, No. 2
4-3. Solution code In the proposed model, the model’s solution is composed of two matrices. The first matrix shows volume of products sent from suppliers at different time intervals. This matrix has a number of N rows (suppliers). Further, the number of columns shows the number of time intervals, and the number of the third dimension shows the number of products. As a result, dimensions of this matrix are (N * T * V). Figure 2 shows a flow matrix of products for the problem with 3 suppliers, 2 products, and 4 periods.
Periods Suppliers 1 2 3 4
Product 1 1 1000 0 0 4500 2 0 1500 0 0 3 2000 0 1400 0
Product 2 1 0 0 0 1000 2 0 0 0 0 3 1000 0 1300 0
Fig. 2a. Solution code for 4 periods, 2 products, and 3 distribution centers
Supplier 1 Supplier 2 Supplier 3 Supplier 4
1 0 0 1 Fig. 2b. Coding for suppliers
Here, a sample solution to the first matrix is considered. As is clear, the rows and columns are associated with distribution centers and time intervals, respectively. Further, since the third dimension means that products are of two types, the number of matrixes is 2, in which the first 3 rows and the second 3 rows correspond to the first and second products, respectively. For example, the first supplier in the first period and in the fourth period sends 1000 units and 4500 units for the first product, respectively. In addition, the third supplier of Product 2 sends 1000 and 1300 units in the first and third periods, respectively.
The second part is a matrix in which the number of its cells is equal to that of suppliers. Numbers of each cell are zeros and ones; 1 and 0 show incremental discount and volume discount, respectively. For example, a matrix with 4 suppliers is shown in Figure 2. The first and fourth suppliers use incremental discounts, and the second and third suppliers use volume discounts. 4-4. Initial population For each product, in each period, a random sequence of providers is generated. Then, the product is allocated to suppliers based on their capacity constraint. This process continues until the demand for the product is fully satisfied. Afterwards, the satisfaction of product demand will go to the next period. After allocating products to all periods, we go to the next product, and this process continues for all products. 4-5. Parameter setting To set the parameters of the proposed algorithm, Taguchi method is used. For NSGAII method, 4 factors are considered: initial population (npop), the maximum number (max_it), mutation coefficient (Mutation), and displacement coefficient (Crossover). Pareto solution’s number is considered as a standard criterion, and 3 levels for each factor are presented as follows: Initial population: 20, 30, 50 Maximum iteration: 50, 75, 100 Crossover rate: 0.6, 0.7, 0.8 Mutation rate: 0.2, 0.3, 0.4 In Taguchi method, Signal/Noise (S/N) criterion is used. This criterion shows changes in the response variable. For each factor, the optimum level makes high S/N. Therefore, the second levels (75), (30), (0.7), and (0.3) are the best values for Maximum iteration, Initial population, Crossover rate, and Mutation rate, respectively, according to Fig. 3. Final results of parameters setting are shown in Table 2:
Tab. 2. Results of parameters setting for NSGA2
Maximum iteration Initial population Crossover rate Mutation rate 75 30 0.7 0.3
232 Mojtaba Salehi1* & Haniyeh Rezaei2 A Fuzzy Multi-objective Model for Order Allocation to Suppliers under Shortfall and Quantity Discounts
International Journal of Industrial Engineering & Production Research, June 2019, Vol. 30, No. 2
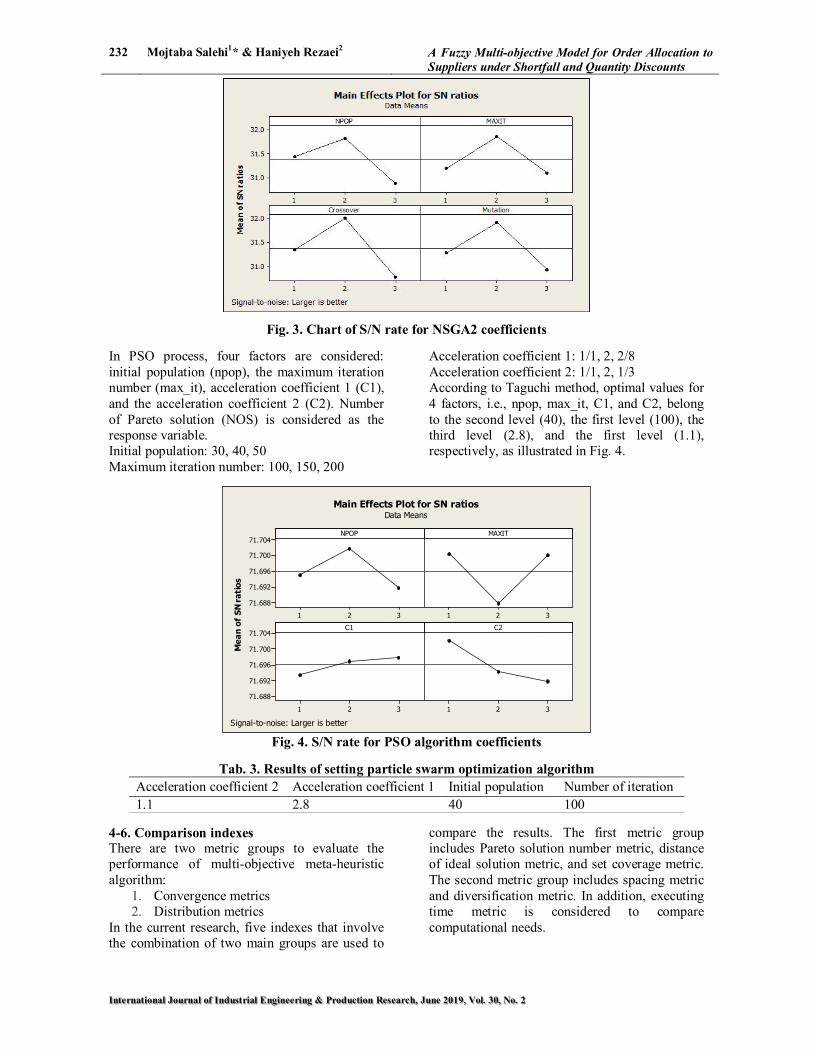
Fig. 3. Chart of S/N rate for NSGA2 coefficients
In PSO process, four factors are considered: initial population (npop), the maximum iteration number (max_it), acceleration coefficient 1 (C1), and the acceleration coefficient 2 (C2). Number of Pareto solution (NOS) is considered as the response variable. Initial population: 30, 40, 50 Maximum iteration number: 100, 150, 200
Acceleration coefficient 1: 1/1, 2, 2/8 Acceleration coefficient 2: 1/1, 2, 1/3 According to Taguchi method, optimal values for 4 factors, i.e., npop, max_it, C1, and C2, belong to the second level (40), the first level (100), the third level (2.8), and the first level (1.1), respectively, as illustrated in Fig. 4.
321
71.704
71.700
71.696
71.692
71.688
321
321
71.704
71.700
71.696
71.692
71.688
321
NPOP
Mea
n of
SN
rati
os
MAXIT
C1 C2
Main Effects Plot for SN ratiosData Means
Signal-to-noise: Larger is better
Fig. 4. S/N rate for PSO algorithm coefficients
Tab. 3. Results of setting particle swarm optimization algorithm Number of iteration Initial population Acceleration coefficient 1 Acceleration coefficient 2 100 40 2.8 1.1
4-6. Comparison indexes There are two metric groups to evaluate the performance of multi-objective meta-heuristic algorithm:
1. Convergence metrics 2. Distribution metrics
In the current research, five indexes that involve the combination of two main groups are used to
compare the results. The first metric group includes Pareto solution number metric, distance of ideal solution metric, and set coverage metric. The second metric group includes spacing metric and diversification metric. In addition, executing time metric is considered to compare computational needs.

233 Mojtaba Salehi1* & Haniyeh Rezaei2 A Fuzzy Multi-objective Model for Order Allocation to Suppliers under Shortfall and Quantity Discounts
International Journal of Industrial Engineering & Production Research, June 2019, Vol. 30, No. 2
4-6-1. Spacing metric This metric proposed by Schott calculates relative distance between consecutive solutions using the following equation.
푺 =ퟏ
퐧 − ퟏ(풅풊 − 풅)ퟐ
풏
풊 ퟏ
(20)
where d = min∈
∑ |f − f |،d = ∑| |
.
The measured spacing corresponds to the minimum sum of absolute difference of objective function values between the ith solution and the final non-recessive solutions. 4-6-2. Number of pareto solution (NOS) NOS metric represents the number of Pareto solutions (NOS) in each algorithm. Figure 5 is represented to calculate NOS metric.
Fig. 5. Parto solutions in multi-objective function
4-6-3. Mean ideal distance (MID) Mean Ideal Distance (MID) is a simple metric that measures the average of distances from an ideal point. This metric is used to calculate the average distance of Pareto solutions from a coordination point. According to the following relation, the less metric there is, the higher the algorithm efficiency can be.
2
1 1
1 NOS m
i i jii j
MID c where c fNOS
(21)
where “f” is the objective function value of each Pareto solution. Since one objective is placed at a minimum distance from the coordination center in Pareto approach of the multi-objective optimization, this metric calculates the distance from the best population (Zitzler and Thiele, 1999). Figure 6 shows MID metric schematically. n is the number of Parto solutions whose mean distance to ideal point (ci) is obtained as MID metric.
Fig. 6. MID for multi-objective optimization
4-6-4. Executing time Executing time is also considered as a quality evaluation criterion of the algorithm. 4-6-5. Diversification metric (DM) This measure calculates the diversity between non-recessive solutions in a set, and its equation is as follows:
D = max( |x − y | )(22)
where |x − y | is the direct distance between non-recessive solutions xi and yi; thus, the more

234 Mojtaba Salehi1* & Haniyeh Rezaei2 A Fuzzy Multi-objective Model for Order Allocation to Suppliers under Shortfall and Quantity Discounts
International Journal of Industrial Engineering & Production Research, June 2019, Vol. 30, No. 2
this criterion and the same lower solutions exist, the greater diversification in solutions will be.
5. Computational Results of The Proposed Algorithm
In this research, 15 problems are used as shown in Table 4. In addition, the problem parameters are considered based on the distribution functions that are presented in Table 5.
Tab. 4. Characteristics of the generated problems item supplier product period 1 2 5 2 2 3 5 2 3 3 10 3 4 4 10 3 5 5 15 4 6 7 15 4 7 8 20 6 8 9 22 7 9 10 25 8 10 10 30 8 11 10 40 10 12 15 50 10 13 20 70 10 15 25 90 12 15 30 100 12
Tab. 5. Distribution functions for making parameters
PARAMETER RANGE PITVK Uniform (30,50) UITVK Litvk + Uniform (700,100) LITVK Uitvk-1+1 DIV Uniform (0.05, 0.25) HIV Uniform (0.5, 2.5) DTV Uniform (200, 400) CIV Uniform (150, 400) HV Uniform (10,50) GV Uniform (50,100)
Before explaining the results of each algorithm, it is noted that the highest values are more appropriate for two metrics: non-recessive solutions (NOS) and diversification criterion. Since the objective function is of minimization
type, a greater value for MID criterion is better. In addition, the lower value for other criteria such as execution time and spacing criterion will be more appropriate. It is shown in Table 6.

235 Mojtaba Salehi1* & Haniyeh Rezaei2 A Fuzzy Multi-objective Model for Order Allocation to Suppliers under Shortfall and Quantity Discounts
International Journal of Industrial Engineering & Production Research, June 2019, Vol. 30, No. 2
Tab. 6. Comparative results of values of NSGA- II and MOPSO
In this research, 15 problems are generated with different sizes of suppliers (2-30), time interval (2-12), and products (5-100). Based on the presented results in columns 2 and 7 of Table 6, the performance of the two is the same for MID metric. The next comparison metric is NOS; in Columns 3 and 8, the performance of NSGAII is better in most sizes. The third metric shows the computational time of two algorithms, and in Columns 4 and 9, the performance of NSGAII is slightly better than that of MOPSO algorithm. The fourth metric is spacing, which, based on Columns 5 and 10 of Table 6, is lower for MOPSO algorithm of all sizes except 3 large sizes. The last metric shows diversification such
that NSGAII has a better performance than MOPSO in all sizes except 3 large sizes. Figure 7 shows the comparison of the values of the first objective function for two algorithms, NSGAII and MOPSO, for 4 problems (1-4). Axis X shows the value of the first objective function and Axis Y shows the number of sample problems and algorithm. This graph shows the maximum, minimum, and average of the first objective function obtained from each algorithm and each problem test. As shown in Figure 7, the value of the first objective function in 4 problems for MOPSO algorithm is more optimized than NSGAII, meaning that the value of the objective function is lower, since this objective function is aimed at minimization.
No
NSGA- II MOPSO
MID
NO
S
Tim
e
SPA
CIN
G
Div
ersif
icat
ion
MID
NO
S
Tim
e
SPA
CIN
G
Div
ersif
icat
ion
1 365.1 35 5.29 0.684 5723.6 1.32 55 4.74 0.397 4938.87
2 1.64 23 4.94 0.656 4661.3 1.29 32 4.81 0.453 4300.77 3 1.45 53 9.67 0.639 13182.9 1.51 26 7.1 0.603 5518.84 4 1.58 44 9.9 0.658 12128.7 1.65 36 10.16 0.423 6903.78 5 1.94 28 17.25 1.107 15781.2 1.78 43 17.6 0.55 11520.49
6 1.74 54 22.98 0.925 19472.0 1.72 35 22.31 0.48 10712.80
7 1.63 63 45.2 0.975 29213.2 1.78 40 47.44 0.44 15620.83 8 1.74 44 61.5 0.96 28284.5 1.9 29 69.13 0.42 15367.5 9 1.89 57 87.6 1.32 37979.7 1.9 27 102.02 0.635 16150.07 10 1.9 42 103.07 1.25 37658.9 1.77 30 115.79 0.624 19721.77 11 1.64 81 168.35 0.93 61848.2 2.01 22 215.38 0.834 21031.57 12 2.03 45 291.9 1.59 55912.9 2.137 19 415.26 0.935 20143.42 13 2.06 27 816.2 0.448 22673.3 1.97 20 732.45 0.874 27823.42
14 2.10 43 1572.3 0.574 36602.8 2.10 20 1515.88 0.739 33051.37
15 2.17 34 2141.7 0.573 27905.9 2.14 24 2065.86 1.16 38508.28

236 Mojtaba Salehi1* & Haniyeh Rezaei2 A Fuzzy Multi-objective Model for Order Allocation to Suppliers under Shortfall and Quantity Discounts
International Journal of Industrial Engineering & Production Research, June 2019, Vol. 30, No. 2
Fig. 7. The value of the first objective function for two algorithms
Figure 8 has compared the value of second objective function for two algorithms NSGAII and MOPSO for 5 problems (1-5). The value of
the second function in 5 problems for MOPSO algorithm is more optimized than that for NSGAII.
Fig. 8. The value of the second objective function for two algorithms
Tab. 7. Results of the comparison between methods of NSGAII and 흐 constraint
RG(Error) NSGA II ∈-Constraint Size
Obj
ect 3
Obj
ect 2
Obj
ect 1
time
Obj
ect 3
Obj
ect 2
Obj
ect 1
time
Obj
ect 3
Obj
ect 2
Obj
ect 1
٠ ٠ 1.5% 5.29 8510 870 1442734 80 8510 870 1421413 1
0.8% 4% 3% 4.94 13666 14446 1539138 230 13558 13891 1494303 2
3.4% 5% 7% 9.67 122420 11593 5071144 435 118395 11041 4739387 3
8% 9% 10.5% 9.9 141174 13366 5147818 705 130717 12263 4658689 4

237 Mojtaba Salehi1* & Haniyeh Rezaei2 A Fuzzy Multi-objective Model for Order Allocation to Suppliers under Shortfall and Quantity Discounts
International Journal of Industrial Engineering & Production Research, June 2019, Vol. 30, No. 2
Tab. 8. Results of the comparison between MOPSO and ɛ-constraint RG (Error) MOPSO ɛ-Constraint Size
Obj
ect 3
Obj
ect 2
Obj
ect 1
time
Obj
ect 3
Obj
ect 2
Obj
ect 1
time
Obj
ect 3
Obj
ect 2
Obj
ect 1
٠ ٠ 0.4% 4.74 8510 870 1427098 80 8510 870 1421413 1
0.2% 0.6% 1% 4.81 13585 13974 1505292 230 13558 13891 1494309 2
1% 2.7% 3% 7.1 119578 11339 4881568 435 118395 11041 4739387 3
4% 6% 7% 10.16 135945 12998 4984765 705 130717 12263 4658695 4
A previously conducted study on the time of problem solution for ∈-constraint with NSGAII and MOPSO shows a great increase in this time for constraint ∈-method. In addition, the highest average errors obtained in three objective functions for NSGAII and MOPSO compared with the exact method are 10%, 9%, 8%, 7%, 6%, and 4%.
6. Conclusions This research presents a mathematical model for supplier prioritization and order allocation considering horizon time and discount. According to the literature review, for the first time, the supplier selection problem has been studied considering cost functions (with discount and lost sale), quality, and on-time delivery with shortfall in a multi-product, multi-period and fuzzy condition simultaneously. This model was solved by NSGA2 and MPSO. According to the complexity of this model, two meta-heuristic algorithms of MOPSO and NSGAII were developed to solve the model. These algorithms can represent a good approximation of efficient optimal solutions for the proposed objectives. According to the results, NSGAII makes more NOS and more diverse Pareto solutions; however, MOPSO makes highly regular and optimized Parto line. For future researches, the option of local and international suppliers that definitely increases the complexity of the model can be added. On the other hand, based on the model, it is assumed that buyer’s demand, delivery rate, and price are definite. For the future, they can be related to market condition and other competitions.
References [1] Abdel-Basset, M., Manogaran, G., Gamal,
A., & Smarandache, F. A hybrid approach of neutrosophic sets and DEMATEL method for developing supplier selection
criteria.Design Automation for Embedded Systems, (2018), pp. 1-22.
[2] Amid, A., Ghodsypour, S.H. and O’Brien,
C. ‘A weighted max-min model for fuzzy multi-objective supplier selection in a supply chain’, International Journal of Production Economics, Vol. 131, No. 1, (2011), pp.139-145.
[3] Benitez A., J. E., Everson, R. M.,
Fieldsend, J. E.: A MOPSO Algorithm Based Exclusively on Pareto Dominance Concepts. In EMO (2005), pp. 459-473.
[4] Chaudry S., Forst F. & Zydiak J. Vendor
selection with price breaks. European Journal of Operational Research Vol. 76, No. 3, (1993), pp. 52-66.
[5] Deb, K., Pratap, A., Agarwal, S., &
Meyarivan, T. A. M. T. A fast and elitist multiobjective genetic algorithm: NSGA-II. IEEE transactions on evolutionary computation,Vol. 6, No. 2, (2002), pp.182-197.
[6] Demirtas E., A., Ustun O. An integrated
multi objective decision making process for supplier selection and order allocation. Omega Vol. 36, (2008), pp. 76-90.
[7] Ebrahim, R.M., Razmi, J. and Haleh, H.
‘Scatter search algorithm for supplier selection and order lot sizing under multiple price discount environment’, Advances in Engineering Software, Vol. 40, No. 9, (2009), pp.766-776.
238 Mojtaba Salehi1* & Haniyeh Rezaei2 A Fuzzy Multi-objective Model for Order Allocation to Suppliers under Shortfall and Quantity Discounts
International Journal of Industrial Engineering & Production Research, June 2019, Vol. 30, No. 2
[8] Ekhtiari, M., Zandieh, M., Alem-Tabriz, A., & Rabieh, M. A nadir compromise programming for supplier selection problem under uncertainty. International Journal of Industrial Engineering & Production Research, Vol. 29, No. 1, (2018), pp. 1-14.
[9] Ghodsypour S. & O’Brien C. The total
cost of logistics in supplier selection, under conditions of multiple sourcing, multiple criteria and capacity constraints , International Journal of Production Economics Vol. 73, (2001), pp. 15-27.
[10] Glock, C.H. ‘Single sourcing versus dual
sourcing under conditions of learning’, Computers & Industrial Engineering, Vol. 62, No. 1, (2012), pp. 318-328.
[11] Jiménez, M., M .Arenas, A .Bilbao, M.
VictoriaRodrı´guez, Linear programming with fuzzy parameters: An interactive method resolution, European Journal of Operational Research, Vol. 177, No. 3, (2007), pp. 1599-1609.
[12] Kara, S. S. Supplier selection with an
integrated methodology in unknown environment. [doi: DOI: 10.1016/j.eswa.2010.07.154]. Expert Systems with Applications, Vol. 38, No. 3, (2011), pp. 2133-2139.
[13] Kennedy J., Russell C. Eberhart. Particle
swarm optimization. In Proceedings of the 1995 IEEE International Conference on Neural Networks, pages 1942–1948, Piscataway, New Jersey, 1995. IEEE Service Center.
[14] Kennedy J., Russell C. Eberhart. Swarm
Intelligence. Morgan Kaufmann Publishers, San Francisco, California, (2001).
[15] Memon, M. S., Lee, Y. H., & Mari, S. I.
Group multi-criteria supplier selection using combined grey systems theory and uncertainty theory. Expert Systems with Applications,Vol. 42, No. 21, (2015), pp. 7951-7959.
[16] Moghaddam K.S. Fuzzy multi-objective model for supplier selection and order allocation in reverse logistics systems under supply and demand uncertainty, Expert Systems with Applications, Vol. 42, Nos. 15-16, (2015), pp. 6237-6254.
[17] Paydar, M. M., Hassanzadeh, Z., & Tajdin,
A. Developing a method for order allocation to suppliers in green supply chain. International Journal of Industrial Engineering & Production Research, Vol. 27, No. 3, (2016), pp. 219-231.
[18] Peidro, D., Mula, J., Poler, R., & Lario, F.
C. Quantitative models for supply chain planning under uncertainty: a review. International Journal of Advanced Manufacturing Technology, Vol. 43, (2009), pp. 400-420.
[19] Qin, J., Liu, X., & Pedrycz, W. An
extended TODIM multi-criteria group decision making method for green supplier selection in interval type-2 fuzzy environment. European Journal of Operational Research, Vol. 258, No. 2, (2017), pp. 626-638.
[20] Resenthal E., Zydiak J. and Chaudry S.
Vendor selection with bundling, Decision Sciences Vol. 26, No. 1, (995), pp. 35-48.
[21] Torabi, S. A., & Boostani, A. Supplier
Selection and Order Allocation under Risk: Iranian Oil and Gas Drilling Companies. International Journal of Industrial Engineering & Production Research, Vol. 29, No. 1, (2018), pp. 35-52.
[22] Torabi S.A., Baghersad M., Mansouri S.A.
Resilient supplier selection and order allocation under operational and disruption risks, Transportation Research Part E: Logistics and Transportation Review, Vol. 79, (2015), pp. 22-48.
[23] Van der Vlist P., Hoppenbrouwers J. E.
M., and Hegge H. M. H. Extending the enterprise through multi-level supply control. International Journal of

239 Mojtaba Salehi1* & Haniyeh Rezaei2 A Fuzzy Multi-objective Model for Order Allocation to Suppliers under Shortfall and Quantity Discounts
International Journal of Industrial Engineering & Production Research, June 2019, Vol. 30, No. 2
Production Economics, Vol. 53, No. 1, (1997), pp. 35-42.
[24] Zitzler, E., & Thiele, L. Multiobjective
evolutionary algorithms: a comparative
case study and the strength Pareto approach. IEEE transactions on Evolutionary Computation, Vol. 3, No. 4, (1999), pp. 257-271.
Follow This Article at The Following Site: Salehi M, Rezaei H. A fuzzy multi-objective model for allocating orders to suppliers under shortfall and price-quantity discounts: An MPSO and NSGA-II with tuned parameters. IJIEPR. 2019; 30 (2) :225-239 URL: http://ijiepr.iust.ac.ir/article-1-731-en.html


![Fuzzy Bi-Objective Production-Distribution Planning ...scm.snu.ac.kr/publication/paper/89.pdf · Fuzzy Bi-Objective Production-Distribution Planning ... emissions. Jaber et al. [7]](https://img.dokumen.tips/doc/110x75/5ff82b7a3b0eff457466847f/fuzzy-bi-objective-production-distribution-planning-scmsnuackrpublicationpaper89pdf.jpg)


![Fuzzy Real-Time Multi-Objective Optimization of a ... · Fuzzy Real-Time Multi-Objective Optimization of a Prosthesis Test Robot Control System Yuriy Kondratenko1[0000-0001-7736-883X],](https://img.dokumen.tips/doc/110x75/5f7af83be9fbbd7855115af3/fuzzy-real-time-multi-objective-optimization-of-a-fuzzy-real-time-multi-objective.jpg)