Embed Size (px)
Citation preview

A FRAMEWORK FOR MONITORING PROGRESS ON MALAWI’S NATIONAL FOREST LANDSCAPE RESTORATION STRATEGY
REPUBLIC OF MALAWIThe Ministry of Natural Resources, Energy and Mining

ii
This report was produced by the Government of Malawi with guidance from the World Resources Institute and support from the United States Agency for International Development (USAID) and the German Federal Ministry for Economic Cooperation and Development (BMZ).

TABLE OF CONTENTS
Acknowledgements iv
Definitions iv
Acronyms and Abbreviations iv
Executive Summary 1
1. Introduction 3
1.1 Background on Forest Landscape Restoration in Malawi 3
1.2 Why Monitoring is Needed 5
1.3 An Overview of Current Monitoring Practices in Malawi 6
2. Methodology for Designing Malawi’s Monitoring Framework 11
2.1 Goals for Monitoring Restoration 11
2.2 Developing Indicators and Metrics 15
3. Proposed Indicators for the National Monitoring Framework 19
3. 1 Core Indicators 19
3.2 Proposed Additional Indicators 25
4. Interpreting Monitoring Data 28
4. 1 Examples of Data Interpretation at the National Level 28
4.2 Examples of Data Interpretation for the Machinga District 30
5. Recommendations and Next Steps 34
References 35
Appendices 36
Appendix A: Policies, Plans, and Strategies Reviewed 36
Appendix B: Baseline Data for Core Indicators 37
Appendix C: Workshop Participants 44

iv
ACKNOWLEDGMENTSThe research team would like to thank the many colleagues who contributed to this report by participating in the workshops and field visits, providing guidance through individual meetings, emails, and conference calls, and reviewing drafts of the report. The research was conducted by Tangu Tumeo and Dr. Clement Chilima of the Department of Forestry, Katie Reytar, Sabin Ray, and Lucas Toh of World Resources Institute (WRI), and Ramzy Kanaan and Blessings Mwale of the USAID/Malawi-funded Protecting Ecosystems and Restoring Forests in Malawi (PERFORM) project. Special thanks to those listed in Appendix C who provided technical inputs during the workshops, as well as Dr. Judith Kamoto of Lilongwe University of Agriculture and Natural Resources, Peaches Phiri of the National Water Board, Gray Tappan of USGS, and Fred Stolle, Kathleen Buckingham, and Florence Landsberg of WRI who provided comments on the drafts. The team is especially thankful for the financial support provided by the USAID/Malawi-funded PERFORM project and the German Federal Ministry for Economic Cooperation and Development (BMZ).
DEFINITIONSIndicator: A measurable variable used to represent change or the attainment of a goal (e.g., increased crop yield). Multiple metrics can address the same indicator.
Metric: The specific criteria used to measure the change in the indicator (e.g., increase in average crop yield per hectare, by crop type).
Monitoring framework: A basic structure that defines and organizes monitoring indicators and metrics.
Monitoring system: The methods, procedures and products that operationalize the monitoring framework. Components of the system include mechanisms for collecting, storing, and analyzing the indicator data, as well as communicating progress toward targets and goals.
National restoration goals: Seven specific development goals emphasized as national priorities in Malawi’s National Forest Landscape Restoration Strategy (improving food security, increasing energy resources, increasing climate resilience, improving water quality and supply, conserving and restoring biodiversity, ensuring gender equity and equality, and alleviating poverty).
Restoration intervention targets: Targets set in Malawi’s National Forest Landscape Restoration Strategy to measure success on Malawi’s five restoration-specific interventions (agricultural technologies, community forest and woodlots, forest management, soil and water conservation, and river- and stream-bank restoration).
ACRONYMS AND ABBREVIATIONSAFR100 African Forest Landscape Restoration
Initiative
APES Agricultural Production Estimates Survey
CA Conservation Agriculture
DoDMA Department of Disaster Management Affairs
FLR Forest Landscape Restoration
FMNR Farmer-managed Natural Regeneration
GHG Greenhouse Gas
Ha Hectares
IHS Integrated Household Survey
LULC Land Use Land Cover
M&E Monitoring and Evaluation
MoU Memorandum of Understanding
NGO Non-governmental Organization
NSO National Statistical Office
NTFP Non-timber Forest Product
PERFORM Protecting Ecosystems and Restoring Forests in Malawi
ROAM Restoration Opportunities Assessment Methodology
UNDP United Nations Development Programme
USAID United States Agency for International Development
USGS United States Geological Survey
WMS Welfare Monitoring Survey
WRI World Resources Institute
PHOTO CREDITS
Cover, pg. 2, 12, 32, 35, 47 Sabin Ray; pg. 7, 11 Katie Reytar; pg. 18 Caroline Gagne.

1Monitoring Progress on Malawi’s National Forest Landscape Restoration Strategy
EXECUTIVE SUMMARY
Highlights ▪ The monitoring framework focuses on
measuring progress toward the goals and interventions outlined in Malawi’s 2017 National Forest Landscape Restoration Strategy.
▪ Thirty indicators were selected for the monitoring framework by analyzing existing data collection systems and ranking relevant indicators based on their relevance to the national restoration goal or intervention target and their reliability of collection, quality, ease of communication, and sensitivity to restoration interventions.
▪ The framework provides the core indicators, metrics, data sources, and baseline data for monitoring progress on FLR in Malawi. Many of the core indicators and metrics are already being regularly collected as part of the National Statistical Office’s Integrated Household Survey.
▪ Key next steps for activating the framework include: securing high-level support from multiple ministries to adopt the framework as the national standard for monitoring restoration, setting benchmarks for measuring progress on each indicator, establishing a multi-sector Monitoring System Task Force, developing a work plan for creating a long-term monitoring system, and developing a communications plan for reporting progress.
SummaryThis report summarizes the results of research and stakeholder consultation in developing a framework for monitoring progress on forest landscape restoration (FLR) as set forth in Malawi’s 2017 National FLR Strategy. The National FLR Strategy is organized around two main pillars: 1) it sets targets for specific FLR interventions to help the Government of Malawi achieve its pledge to restore 4.5 million hectares of degraded and deforested land by 2030; and 2) it outlines seven national restoration goals that can be achieved by accelerating implementation of FLR, specifically: improve food security,
increase energy resources, increase climate resilience, improve water quality and supply, conserve and restore biodiversity, ensure gender equity and equality, and alleviate poverty. The overall objective of this research was to develop a monitoring framework that includes the most useful and relevant indicators that measure progress on FLR against these two pillars.
The process for designing Malawi’s monitoring framework consisted of first carrying out a comprehensive review of Malawi’s existing policies, strategy plans, and surveys related to Malawi’s national restoration goals and interven-tion targets. From these documents, 160 indica-tors were extracted that formed a preliminary list of relevant indicators for further review. These indicators were then systematically assessed and scored against five criteria: 1) relevance to goal or target, 2) reliability of collection, 3) quality, 4) sensitivity to restoration interventions, and 5) ease of communication.
Following this assessment, the preliminary list of 160 indicators was narrowed down to a list of 30 suggested core indicators that form a minimum viable framework for monitoring progress toward Malawi’s national restoration goals and intervention targets. The scoring process prioritized indicators that were already being collected through other monitoring strategies and surveys to avoid duplication of similar efforts and to make the most of limited resources available for monitoring FLR. As such, many of the core indicators and metrics proposed for monitoring progress on FLR are already being regularly collected through the National Statistical Office’s Integrated Household Survey (IHS). These indicators all scored highly during the assessment process for their reliability of collection and quality. Included in the framework is also a list of proposed additional indicators that the research team and stakeholders deemed important for consideration but, for various reasons, they did not score as highly against the criteria.
The framework proposed as part of this study provides the core indicators, metrics, and data sources, as well as some baseline data for

2
monitoring progress on FLR in Malawi. This framework is a first step in developing a robust, long-term monitoring system for FLR in Malawi. The following activities are recommended as key next steps for operationalizing the monitoring framework:
1. Securing high-level ministerial support to adopt the framework as the national standard for monitoring progress on cross-sectoral FLR activities in Malawi.
2. Establishing a multi-sectoral FLR Monitoring System Task Force dedicated to developing the monitoring system, which would include assigning specific responsibilities to task force members, establishing a plan for long-term funding support, and developing a work plan for implementation.
3. Convening stakeholders to agree upon and set measurable, achievable benchmarks for progress on each indicator using the baseline data.
4. Developing and implementing the components of the system for collecting, storing, and analyzing the indicator data.
5. Creating a communications plan for reporting progress toward the achievement of Malawi’s national restoration goals and restoration intervention targets.
Adopting the proposed monitoring framework and investing the resources in mobilizing a long-term monitoring system should help provide reliable evidence to guide the implementation of Malawi’s National FLR Strategy and accelerate positive local successes.
How is this report structured? The report starts with an introduction that high-lights the importance of measuring progress on restoration in Malawi. It provides background on the National FLR Strategy and details the specific goals and intervention targets that form the basis for this monitoring framework. The report then offers an overview of existing monitoring practices in Malawi before launching into the methodology for developing the framework.
The 30 core indicators proposed for the frame-work are detailed in Tables 3 and 4, followed by descriptions of proposed additional indicators that could be considered for inclusion in the framework in Table 5. Using a selection of data from the 30 core indicators, a few examples are provided to demonstrate how Malawi can use the collected monitoring data to offer insights on food security, energy resources, or soil conservation at the national and district levels. Finally, the report includes recommendations on the next steps for activating the monitoring framework.

3Monitoring Progress on Malawi’s National Forest Landscape Restoration Strategy
1. INTRODUCTION
The establishment of a robust monitoring system is important for catalyzing successful forest land-scape restoration (FLR) in Malawi. A monitoring system serves both to document progress toward Malawi’s target to restore 4.5 million hectares of degraded and deforested land by 2030, as well as to provide critical evidence to help adapt FLR implementation strategies and better understand the influence of restoration on Malawi’s develop-ment goals.
This report summarizes the results of research and stakeholder consultation in developing a framework for monitoring progress on FLR as set forth in Malawi’s 2017 National FLR Strat-egy. This assessment sought to determine the most useful and relevant indicators to assess whether the strategy is achieving its objectives, both in terms of catalyzing implementation of FLR activities and impacting targeted social and environmental goals. The specific objectives of this research included:
1. Reviewing information on existing monitoring and data collection activities at various scales in Malawi (national, regional, and district) that are complementary to FLR activities and goals;
2. Consulting with stakeholders to confirm restoration targets, identify potential indica-tors, and review existing monitoring activities and protocols;
3. Identifying a suite of indicators for mea-suring and monitoring progress on FLR, with a focus on leveraging existing data collection activities when available; and
4. Developing a monitoring framework that incorporates a core set of indicators and metrics for monitoring progress on FLR, as well as sources and/or collection methods for compiling the data.
1.1 Background on Forest Landscape Restoration in MalawiIn 2016, the Government of Malawi made a national pledge to the African Forest Landscape Restoration Initiative (AFR100) under the Bonn Challenge to restore 4.5 million hectares of degraded and deforested land by 2030. Malawi made this commitment in acknowledgment of the role that FLR can play in helping Malawi to achieve many of its national development goals related to climate resilience, agricultural and economic security, and sustainable economic development.
To help inform and support this commitment, a National Forest Landscape Restoration Oppor-tunities Assessment for Malawi was initiated in 2016 and completed in 2017. The assessment provided a technical review of the most viable FLR intervention opportunities, maps of where those interventions could be implemented, a cost/benefit analysis of which interventions are the most cost effective, and a policy and institutional analysis of enabling conditions for effectively implementing FLR. National leadership for the assessment was provided by the Department of Forestry, with a multi-sectoral Task Force orga-nized to guide and support the process. Consulta-tions with district authorities and communities formed important components of the assessment.
The results of the National FLR Assessment fed into Malawi’s 2017 National Forest Landscape Restoration Strategy, which outlines an action plan for implementing specific FLR interventions and sets targets for these interventions to help achieve the 4.5-million-hectare restoration goal. The five interventions targeted in the National FLR Strategy are:
▪ Agricultural technologies offer a suite of climate-smart agricultural practices, including conservation agriculture, farmer-managed natural regeneration and agroforestry that serve to increase tree cover on degraded, low-yielding cropland and pastures to improve soil fertility and productivity (estimated area of opportunity: 3,730,790 ha).

4
▪ Community forests and woodlots restore forest cover on degraded customary land and non-arable land to establish local sources of fuel wood and non-timber forest products and take pressure off forest reserves. Implementation techniques include demarcation of new areas, strengthening community by-laws, and protecting against uncontrolled cutting, grazing, and fire (estimated area of opportunity: 753,471 ha).
▪ Forest management restores forest cover and improves management in deforested and degraded forests, including forest reserves, natural forests outside reserves, and plantations (estimated area of opportunity: 3,401,279 ha).
▪ Soil and water conservation stabilizes soils and increases infiltration in areas with high rates of rainfall runoff. It also reduces erosion and prevents downstream
sedimentation to protect croplands, water supplies, and other valuable resources. Implementation techniques include con-structing check dams, gully plugs, dykes, infiltration ditches, and implementing rainwater harvesting and other conservation techniques (estimated area of opportunity: 1,043,768 ha).
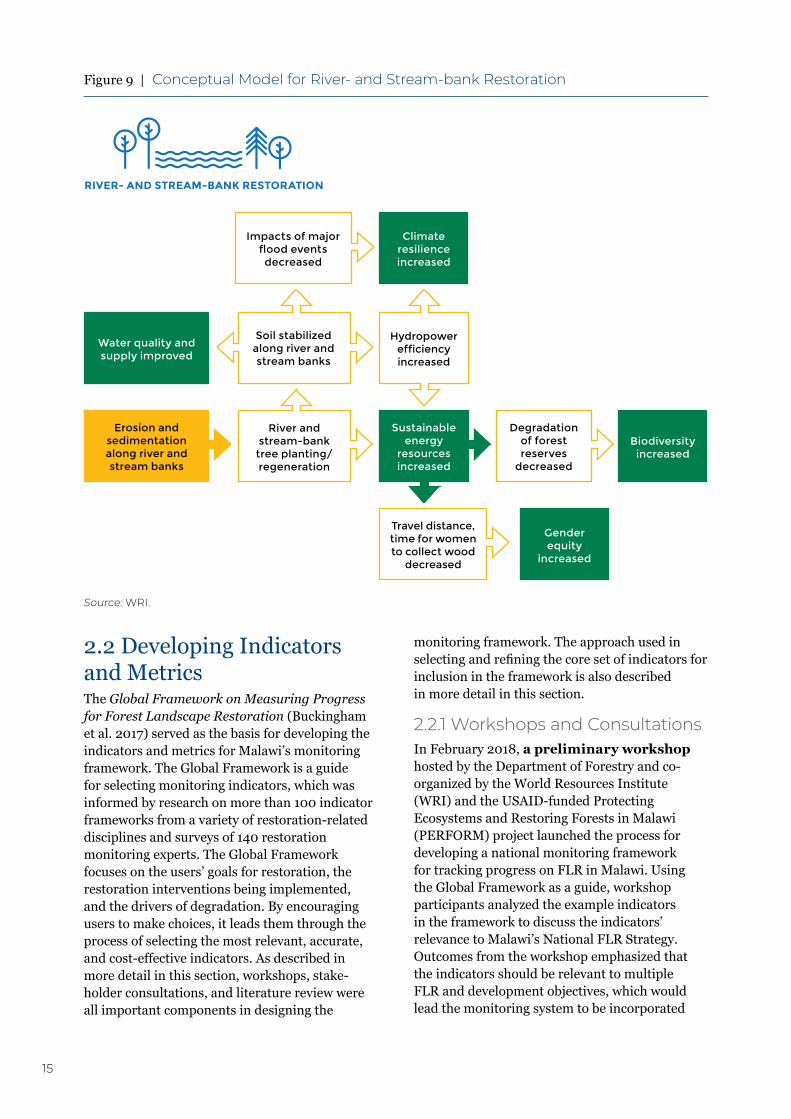
▪ River- and stream-bank restoration increases tree cover in denuded buffer zones of rivers and streams through natural regen-eration and tree planting (estimated area of opportunity: 36,478 ha).
The specific targets set in the National FLR Strategy for each intervention are shown in Figure 1. The National FLR Strategy also outlines seven national restoration goals that can be achieved by accelerating implementation of FLR: improve food security, increase energy resources, increase climate resilience, improve water quality and
WHAT
AGRICULTURAL TECHNOLOGIES
Achieve at least 10% tree cover on 50% of cropland
in Malawi by 2020 and 80% of cropland by 2030
COMMUNITY FORESTS AND WOODLOTS
Increase area of community forests and woodlots to 200,000 ha by 2020 and
600,000 ha by 2030
FOREST MANAGEMENT
Improve protection and management of 2 million ha of natural forest, restore
500,000 ha of degraded forest, and establish 100,000 ha of commercial
plantations by 2030
SOIL AND WATER CONSERVATION
Apply soil and water conservation measures on 250,000 ha and 500,000 ha by 2030
RIVER- AND STREAM-BANK RESTORATION
Regenerate or plant 20 million trees along river- and stream banks by 2020 and 50 million trees by 2030
Figure 1 | Overview of Malawi’s National FLR Strategy
Source: Reproduced from Republic of Malawi’s National Forest Landscape Restoration Strategy (2017).

5Monitoring Progress on Malawi’s National Forest Landscape Restoration Strategy
supply, conserve and restore biodiversity, ensure gender equity and equality, and alleviate poverty. Table 1 provides more detail on how FLR contributes to each of these goals.
1.2 Why Monitoring is NeededThe National FLR Strategy articulates why FLR is important and how it can contribute to prog-ress on development goals. However, to assess the impact of FLR, a system for monitoring and evaluating progress toward specific goals needs to be established. Monitoring FLR is critical to the
continuation of restoration at a larger scale and serves at least five important purposes:
1. To communicate results and outcomes to encourage positive momentum, inspire repli-cation, and allow for transferable results;
2. To guide implementation of restoration and provide feedback, including continuous and collective learning for adaptive management;
3. To ensure transparency and provide evidence of progress, achievements, and impact in rela-tion to specific goals and objectives, including periodic assessments of who benefits and how from restoration interventions;
Table 1 | Goals Targeted by Malawi’s National FLR Strategy
NATIONAL GOAL FLR CONTRIBUTIONS TO NATIONAL GOALS
Improve food security
▪ Reduce soil and nutrient loss, restore soil organic matter content, increase and diversify crop yields and cultivars, enable more efficient use of inorganic inputs
▪ Increase rural access to and availability of food by increasing the production of timber, fuelwood, fodder, honey, mushrooms, and other nontimber forest products that directly or indirectly contribute to the food security of rural communities
Increase energy resources
▪ Increase supplies of locally managed and sustainable sources of fuel wood
▪ Decrease sedimentation in catchments of hydropower infrastructure to boost energy outputs
Increase climate resilience
▪ Restore soil fertility to boost yields, diversify farming systems and facilitate adaptation of farmers to erratic weather patterns
▪ Reduce landslide risks, reduce consequences of flooding/extreme weather events
▪ Support ecosystem-based adaptation
▪ Reduce GHG emissions from agriculture
▪ Increase carbon sequestration
Improve water quality and supply
▪ Control erosion mitigation and reduce sedimentation
▪ Protect source water from sedimentation
Conserve and restore biodiversity
▪ Contribute to more effective protection, accelerated regeneration and ecological restoration of native ecosystems and threatened species across landscapes
▪ Help to restore the health of ecosystems and increase the flow of ecosystem services
Ensure gender equity and equality
▪ Promote women’s access to, ownership and control of productive resources including land, water, and farm inputs
▪ Promote agricultural education and technical training for women
▪ Facilitate access to finance for women in agriculture
Alleviate poverty ▪ Enhance sustainable management of forest resources and their contribution to the national economy
▪ Strengthen linkages between agriculture, forestry, and other sectors to ensure resilient socioeconomic growth
Source: Reproduced from Republic of Malawi’s National Forest Landscape Restoration Strategy (2017).

6
4. To support sharing of evidence to restoration investors to enhance trust and foster addi-tional investments and scaling up; and
5. To support regular reporting on progress in achieving national, regional, and international commitments (AFR100 Working Paper Series 2017).
A robust and well-rounded monitoring system goes beyond reporting on hectares under resto-ration and instead serves to inspire action and provide feedback for adapting management of FLR activities. With these functions in mind, the principal components of a robust monitoring system should include the following:
1. A core set of indicators for monitoring prog-ress toward national restoration goals and restoration intervention targets;
2. Uniform, coordinated methods of collect-ing data and measuring changes in these indicators;
3. An open repository of collected data; and
4. A communications plan for reporting progress toward the achievement of Malawi’s national restoration goals and restoration intervention targets.
The monitoring framework developed as part of this assessment provides recommendations on the first principal component described above, with the expectation that upon adoption of the framework, the remaining components will follow.
1.3 An Overview of Current Monitoring Practices in Malawi1.3.1 Types of MonitoringAt present, the Government of Malawi monitors progress on a variety of development-related indicators at two scales: the national level and the district level. At the national level, each ministry reports on its own strategies and initiatives. For example, the Department of Disaster Manage-ment Affairs (DoDMA) reports on the indicators in the National Resilience Strategy. The minis-tries have some collaborative work or strategic
objectives that cross ministerial boundaries. This approach is becoming more common, especially with donor interest in inter-ministerial work. In addition, the Government of Malawi reports on development indicators to the United Nations, including on global commitments such as the Sustainable Development Goals and Millennium Development Goals. The Government of Malawi also has its own national development strategy, Vision 2020, that highlights the key goals for development, such as improving food security and sustainable resource management.
Source: WRI.
CHITIPA
KARONGA
RUMPHI
MZIMBALIKOMA
NKHOTAKOTA
KASUNGU
MCHINJI
NTCHISI
DOWASALIMA
LILONGWE
DEDZA
MANGOCHI
NTCHEU
BALAKA MACHINGA
NENO ZOMBA
BLANTYREPHALOMBE
CHIRADZULU
THYOLOMULANJE
CHIKWAWA
NSANJE
MWANZA
NKATA BAY
Z A M B I A
M O Z A M B I Q U E
ZIMBABWE20 40 80 KM
TA N Z A N I A
Figure 2 | Districts of Malawi

7Monitoring Progress on Malawi’s National Forest Landscape Restoration Strategy
At the district level, each ministry has a Moni-toring and Evaluation (M&E) representative that reports on district-level indicators directly to the relevant national ministry and to the Ministry of Local Government and Rural Development. For example, the Department of Forestry has a rep-resentative in the Machinga district who focuses only on monitoring forestry indicators. Malawi has 28 districts and each district chooses its own indicators from a selection provided by the Min-istry of Local Government and Rural Develop-ment. This process leads to some indicators being shared across districts and some being unique to specific districts or regions. In the Machinga district, three indicators are officially collected for the Department of Forestry: 1) number of seed-lings planted, 2) percentage of planted seedlings that have survived, and 3) number of hectares regenerated. In Ntchisi, the district chose seven indicators: 1) number of Village Forest Areas established, 2) number of agroforestry seedlings planted, 3) number of trees planted, 4) number of income generating activity groups formed, 5) number of households utilizing alternative energy sources, 6) number of hectares conserved, and 7) hectares under catchment area conserved. Other indicators reported to different ministries, such as the Ministry of Agriculture, Irrigation, and Water Development, are also relevant to restoration monitoring.
Monitoring also occurs as part of the numerous non-governmental organization (NGO) projects operating at a local scale across Malawi. NGO projects often have to report their M&E indicators to their donors and, as a result, care-fully monitor their specific project sites and project activities. For example, in the Machinga district, NGOs are expected to sign a Memoran-dum of Understanding (MoU) with the district officials in areas where they operate, stipulating that NGOs are required to send their M&E reports to the officials. In practice, according to Machinga district officers, NGOs rarely report to the district government. When NGOs do report, the lack of georeferenced data at the district level means that the NGO project work can be difficult to track over time. In addition, there is no specific system to report on NGO project work to the national ministries and the Ministry of Local Govern-ment and Rural Development. As a result, NGO M&E reports often get subsumed into the district reports, making it hard to differentiate between government-led efforts and NGO-led efforts.
In short, many different entities are involved in monitoring in Malawi at varying scales and with varying reporting structures. Many of these initia-tives are government-led and nationally focused, but district-level monitoring and NGO project monitoring also contribute to the country’s diverse monitoring capabilities. Figure 3 offers a visual overview of the different actors associated with monitoring restoration in Malawi, showing the connections between government bodies and their strategies, plans, and initiatives. It similarly highlights how district-level monitoring connects with national-level systems. Figure 3 includes only strategies and plans analyzed for this study that are relevant to FLR specifically, hence the lack of inclusion of all national ministries. The figure is not intended to show all connections and actors involved in restoration, but to offer a snapshot of some of the points discussed in this section.

Figure 3 | Overview of Connections Between Government Bodies, Strategies, and Plans Relevant to Monitoring Restoration in Malawi
Departmentof Disaster
ManagementAffairs
NationalResilienceStrategy
NationalAgriculturalInvestment
Plan
NationalCharcoalStrategy
NationalForest
LandscapeRestoration
Strategy
NationalAgriculture
Policy
NationalClimateChange
InvestmentPlan
WelfareMonitoring
Survey
IntegratedHousehold
Survey
Departmentof Forestry
NationalClimateChangePolicy
NationalBiodiversity
Strategy andAction Plan II
EnvironmentalAffairs
Department
NationalStatistical
Office
DistrictGovernments(28 Districts)
DistrictDevelopmentPlan (28 Plans)
NGO Projects
Ministry ofNatural Resources,
Energy andMining
Ministry ofAgriculture,
Irrigationand Water
Development
Vision 2020
Land ResourcesConservationDepartment
Governmentof Malawi
Office of theVice President
MillenniumDevelopment
Goals
SustainableDevelopment
Goals
Vision 2020
Ministryof Local
Governmentand Rural
Development
Ministry ofFinance, Economic
Planning andDevelopment
Source: WRI.8

9
1.3.2 ChallengesIn conducting the research and stakeholder consultations for this monitoring framework, two notable challenges were consistently identified as barriers to current monitoring efforts: 1) a lack of data quality standards and 2) a lack of avail-able long-term funding. These two challenges are described in more detail in this section.
Data QualityOne of the most significant barriers to monitoring restoration-relevant indicators in Malawi is data quality. The USAID’s report on “Improving Data Collection for Malawi” focuses on data quality within the existing monitoring systems in Malawi. Although the USAID report is primarily focused on greenhouse gas (GHG) emission reporting, the focal areas for GHG monitoring show significant overlap with restoration focal areas (e.g., land use land cover (LULC), energy, and agriculture). The report highlights that promising yearly data on agricultural yield collected by the Ministry of Agriculture, Irrigation and Water Development, known as the Agricultural Production Estimates Survey (APES) has few quality control measures. The APES data remains a combination of quan-titative and qualitative data mostly collected on paper. Specifically, the report argues that “the APES is currently inadequate and scientifically questionable.”
With regards to data quality, data collected by the National Statistical Office (NSO) appears to be the most accurate and technically sound. The NSO’s two flagship surveys, the Integrated Household Survey (IHS) and the Welfare Monitoring Survey (WMS), both have trusted collection methodolo-gies. In addition, both surveys allow ministries
to input on indicators relevant to their priorities (although it can be a lengthy process). The USAID report concludes that the “NSO is the strongest institution when it comes to survey methodology and the logistical planning of surveys.”
Long-term FundingLong-term funding is especially important for restoration monitoring as trees and vegetation grow slowly, requiring a long time-horizon for measuring their impacts at the landscape level. The challenge of securing long-term funding affects the consistency of monitoring in Malawi. Most in-depth, high-quality surveys are dependent on donor funding. For example, the NSO’s IHS is funded by the World Bank and Millennium Challenge Account and the WMS by the Nor-wegian Embassy, the United Nations Children’s Fund (UNICEF), and the United Nations Devel-opment Programme (UNDP). While the IHS has secured additional funding for the next study in 2019/2020, the funding of the next WMS is still uncertain.
Funding for government strategies is even less consistent, with many offering ambitious moni-toring plans without a plan in place to fund the monitoring of each indicator proposed. The DoDMA’s National Resilience Strategy is an example of an ambitious monitoring plan that may not be able to be carried out in full due to funding challenges.
In acknowledgment of these two major chal-lenges, the proposed monitoring framework for FLR sought to prioritize the selection of indica-tors with attention to their quality and reliability for collection, as described in more detail in the section on methodology.

10Monitoring Progress on Malawi’s National Forest Landscape Restoration Strategy

11
The process for designing Malawi’s monitoring framework consisted of first establishing the goals for FLR that are to be monitored, and then devel-oping a set of measurable indicators that capture progress toward these goals. More details on the methods are described in the following sections.
2.1 Goals for Monitoring Restoration The overall goal of Malawi’s FLR monitoring framework is to measure progress on the National FLR Strategy. The National FLR Strategy is composed of five restoration intervention targets and seven national restoration goals, which make up two distinct pillars of the strategy, as shown in Figure 4. The monitoring framework proposed in this report is organized around these two pillars to best capture Malawi’s progress on the National FLR Strategy.
In developing the monitoring framework around these two pillars, it is important to first under-stand the relationship between the restoration interventions and the national goals. Each of the five interventions is connected to the seven national goals via multiple pathways. Conceptual models can help to demonstrate the pathways through which restoration interventions address land degradation issues and help achieve national
2. METHODOLOGY FOR DESIGNING MALAWI’S MONITORING FRAMEWORK
goals. The conceptual models in Figures 5 to 9 show how each of the five restoration interven-tions addresses a key land degradation issue (orange boxes) and the various pathways that lead to achieving the seven national goals (green boxes).
For example, the conceptual model shown in Figure 5 demonstrates how agricultural technolo-gies—including farmer-managed natural regen-eration (FMNR) and conservation agriculture (CA)—address degradation on croplands and the pathways that lead to increased food security, improved water quality, increased climate resil-ience, and poverty alleviation.
The conceptual models demonstrate the impor-tance of developing a system that monitors both the biophysical and social impacts of FLR. Mea-suring progress on interventions (i.e., increases in tree cover) is important to show that FLR interventions are being physically implemented, while measuring progress on the social impacts shows that FLR is being implemented in the right places and with the appropriate techniques to improve the lives of local people and support development goals. By focusing on both interven-tions and goals, Malawi’s monitoring system can more effectively and holistically measure progress on FLR.

12Monitoring Progress on Malawi’s National Forest Landscape Restoration Strategy
Figure 4 | The Two Pillars of Malawi’s FLR Monitoring Framework
Source: WRI.
PROGRESS ON RESTORATION INTERVENTION TARGETS
AGRICULTURAL TECHNOLOGIES
COMMUNITY FORESTS AND WOODLOTS
+ GOVERNMENTBUDGET
ALLOCATION
RIVER- AND STREAM-BANK RESTORATION
FOREST MANAGEMENT
SOIL AND WATER CONSERVATION
NATIONAL RESTORATION GOALS
IMPROVE FOOD SECURITY
INCREASE ENERGY RESOURCES
INCREASE CLIMATE RESILIENCE
IMPROVE WATER QUALITY & SUPPLY
CONSERVE AND RESTORE BIODIVERSITY
ENSURE GENDER EQUITY & EQUALITY
ALLEVIATE POVERTY
RESTORATION

13
Figure 5 | Conceptual Model for Agricultural Technologies
Figure 6 | Conceptual Model for Community Forests and Woodlots
Source: WRI.
Source: WRI.
Bare crop fields have poor nutrient and soil retention
FMNR and/orCA with treesimplemented
Nutrients and soils stabilized
Crop yields increased
Food security increased
Erosion from croplands decreased
Carbon stored in trees and
soils increased
Increased income from surplus crops
Water quality improved
Climate resilience increased
Poverty alleviated
AGRICULTURAL TECHNOLOGIES
Village forest area, community
woodlot established
Travel distance, time for women to collect wood
decreased
Supply of non-timber
forest products increased
Food security increased
Lack of local/sustainable source of fuel wood and forest products
Sustainable energy
resources increased
Degradation of forest reserves
decreased
Biodiversity increased
Gender equity
increased
Potential for income from sale of a surplus wood & NTFP increased
Poverty alleviated
COMMUNITY FORESTS AND WOODLOTS

14Monitoring Progress on Malawi’s National Forest Landscape Restoration Strategy
Figure 7 | Conceptual Model for Forest Management
Figure 8 | Conceptual Model for Soil and Water Conservation
Source: WRI.
Source: WRI.
Degraded and deforested areas
New plantations established
Biodiversity increased
Sustainable energy resources
increased
Poverty alleviation
Food security increased
Climate resilience increased
Water quality and supply improved
Natural forest restored and management
improved
Soils stabilized; erosion decreased
Impacts of major flood events decreased
Supply of non-timber forest products
increased (NTFP)
Income from sale of surplus wood & NTFP
increased
Degradation of forest reserves
decreased
Erosion and sedimentation along slopes
Climate resilience increased
Water quality and supply improved
Food security increased
Soil and water conservation
measures established
Water sources protected
from erosion and
sedimentation
Croplands protected
from erosion
Impacts from major flood events
decreased
Hydropower efficiency increased
FOREST MANAGEMENT
SOIL AND WATER CONSERVATION
15
Figure 9 | Conceptual Model for River- and Stream-bank Restoration
RIVER- AND STREAM-BANK RESTORATION
Source: WRI.
Source: WRI.
River and stream-bank
tree planting/regeneration
Travel distance, time for women to collect wood
decreased
Soil stabilized along river and stream banks
Water quality and supply improved
Erosion and sedimentation along river and stream banks
Sustainable energy
resources increased
Degradation of forest reserves
decreased
Biodiversity increased
Gender equity
increased
Hydropower efficiency increased
Impacts of major flood events decreased
Climate resilience increased
2.2 Developing Indicators and MetricsThe Global Framework on Measuring Progress for Forest Landscape Restoration (Buckingham et al. 2017) served as the basis for developing the indicators and metrics for Malawi’s monitoring framework. The Global Framework is a guide for selecting monitoring indicators, which was informed by research on more than 100 indicator frameworks from a variety of restoration-related disciplines and surveys of 140 restoration monitoring experts. The Global Framework focuses on the users’ goals for restoration, the restoration interventions being implemented, and the drivers of degradation. By encouraging users to make choices, it leads them through the process of selecting the most relevant, accurate, and cost-effective indicators. As described in more detail in this section, workshops, stake-holder consultations, and literature review were all important components in designing the
monitoring framework. The approach used in selecting and refining the core set of indicators for inclusion in the framework is also described in more detail in this section.
2.2.1 Workshops and ConsultationsIn February 2018, a preliminary workshop hosted by the Department of Forestry and co-organized by the World Resources Institute (WRI) and the USAID-funded Protecting Ecosystems and Restoring Forests in Malawi (PERFORM) project launched the process for developing a national monitoring framework for tracking progress on FLR in Malawi. Using the Global Framework as a guide, workshop participants analyzed the example indicators in the framework to discuss the indicators’ relevance to Malawi’s National FLR Strategy. Outcomes from the workshop emphasized that the indicators should be relevant to multiple FLR and development objectives, which would lead the monitoring system to be incorporated

16Monitoring Progress on Malawi’s National Forest Landscape Restoration Strategy
into multiple initiatives among a broad group of ministries. In addition, the workshop highlighted that barriers to effective monitoring should be carefully considered and addressed. And finally, mechanisms for communicating monitoring results back to community members and other stakeholders should not be overlooked.
In addition, as part of the preliminary research into developing the monitoring framework, a team from the Department of Forestry, WRI, and PERFORM visited the Machinga district council to discuss their current monitoring and evaluation (M&E) efforts to obtain a better understanding of the data collected at the district level. District M&E officers from the Ministry of Agriculture, Irrigation and Water Development and the Ministry of Natural Resources, Energy and Mining, among others, shared their insights on how they collect indicators relevant to restoration and what limitations they encounter in reporting. Machinga was chosen as a pilot district for this assessment because of the significant need and opportunity for restoration and the district’s history of engagement on restoration-related activities over the past few years. For example, the Machinga district council has been highly engaged in the development of Malawi’s National FLR Strategy and it served as the country’s pilot landscape for an opportunities assessment using the Restoration Opportunities Assessment Methodology (ROAM). USAID’s PERFORM project also has ongoing restoration-related activities in the area.
Following the preliminary workshop and site visit to Machinga district, the research team reviewed the information collected from stakeholders and began the process of conducting an in-depth literature review and building a list of preliminary indicators for inclusion in the monitoring frame-work. This process is discussed in more detail in the following section. In May 2018, a follow-up workshop was held where the early results of the study and concrete next steps to begin monitoring restoration in Malawi were discussed among stakeholders. The participants supported the proposed structure of the monitoring frame-work and offered feedback on specific indicators that could be added or modified to provide more detailed results. The feedback on these additional indicators is included in Section 3.2 of this report.
Attendees of the two workshops included representatives from many different ministries and departments within the Government of Malawi, as well as representatives from NGOs (see Appendix C). These included:
▪ Ministry of Agriculture, Irrigation and Water Development (Land Resources Conservation Department, Crops Develop-ment Department);
▪ Ministry of Finance, Economic Planning and Development (Economic Planning and Development Department, National Statistical Office);
▪ Department of Disaster Management Affairs;
▪ Ministry of Gender, Children and Community Development;
▪ Ministry of Local Government and Rural Development;
▪ Ministry of Natural Resources, Energy and Mining (Environmental Affairs Department, Department of Forestry);
▪ District-level stakeholders (Machinga); and
▪ Non-governmental and bilateral organizations (PERFORM, WRI, U.S. Geological Survey (USGS), and World Agroforestry Centre (ICRAF)).
As part of the process for developing Malawi’s National Monitoring Framework, the U.S. Geo-logical Survey (USGS) with support from USAID is developing national maps of land use and land cover as well as maps documenting on-farm tree cover for baseline year 2017, the year the National FLR Strategy was launched. These maps will provide data on the biophysical progress of FLR interventions in Malawi (e.g., percent of tree cover), which will serve to set a baseline for monitoring biophysical progress on the agricultural technologies, forest manage-ment, and community forest and woodlot restoration interventions.
2.2.2 Methods for Selecting Core Indicators and MetricsTo build the monitoring framework, the research team carried out a comprehensive review of Malawi’s existing policies, strategy plans, and surveys related to Malawi’s national restoration goals. Policies, plans, and surveys at both the

17
national and district level were included in the review. In particular, the following government entities had relevant and readily-available documents that were included in the review: Land Resources Conservation Department, National Statistical Office, Department of Environmental Affairs, Department of Disaster Management Affairs, Department of Forestry, and the districts of Machinga and Ntchisi. A full list of documents is provided in Appendix A. The review involved analyzing these documents to under-stand ongoing monitoring initiatives by different government bodies, and extracting the indicators related to restoration. USGS was also consulted on what indicators could be derived from their work on mapping land cover. Indicators were categorized according to their relevance to the national restoration goals in the FLR strategy, or how they measured biophysical progress toward restoration intervention targets.
The indicators extracted from this review formed a preliminary list of 160 indicators relevant to Malawi’s national restoration goals. Following the compilation of this list, an assessment was conducted to determine the suitability of these indicators for Malawi’s FLR monitoring system.
The methodology used for this assessment was adapted from Baldera et al., which outlines a step-by-step process for identifying indicators to collectively assess multiple large-scale restoration projects across a landscape. While Baldera et al. applied their assessment to restoration projects in and around the Gulf of Mexico, the principles of their methodology are universal and adaptable to the FLR context in Malawi. With their research as guidance, five criteria were used to assess FLR indicators for Malawi: relevance, reliability, quality, sensitivity, and ease of communication. Descriptions of the five assessment criteria are as follows:
1. Relevance to goal or target. An indicator is relevant if it measures progress on one or more of the national restoration goals or restoration intervention targets in the FLR strategy.Example: The proportion of households that report inadequate consumption of food is a measure of food insecurity that is directly relevant to the goal of improving food security.

18Monitoring Progress on Malawi’s National Forest Landscape Restoration Strategy
2. Reliability of collection. An indicator is reliable if representative data are collected at regular intervals from a consistent source or program. Example: The NSO has regularly conducted its Integrated Household Survey over the past ten years; therefore, the indicators that are based on data from this survey are considered reli-able. Indicators with no record of consistent data collection are unreliable.
3. Quality. An indicator is of good quality if the data collection method and reporting are unambiguous and consistent.Example: If the method of data collection is well established and, in the case of survey data collection, the questions used in the survey are consistent over time, the data can be considered good quality. The NSO’s Integrated Household Survey meets these standards for data quality.
4. Sensitivity to restoration interventions. An indicator is sensitive if progress made on restoration interventions would produce a predictable response in the indicator.Example: The average amount of time per day that a person spends collecting firewood is sensitive to the availability of firewood from a local source. In other words, an increase in the availability of firewood from community forest and woodlot interventions would decrease the amount of time spent collecting firewood.
5. Ease of communication. An indicator is easy to communicate to a broad audience if the conceptual relationship between the indicator and progress toward a restoration goal is easy to understand. Example: The relationship between the abundance and distribution of threatened species and progress toward the goal of con-serving and restoring biodiversity is easy to communicate. An increase in the presence of threatened species indicates an increase in biodiversity.
Each one of the 160 preliminary indicators extracted from the literature review was assigned a score for how well it met each of these five criteria on a scale of zero to three. Definitions of the scoring criteria are provided in Table 2. Indicators with the highest cumulative scores were considered for inclusion in the core list of indicators most suitable for monitoring FLR in Malawi.
Table 2 | Definitions of Scores Assigned to Indicators
SCORE DEFINITIONS
3 Strongly meets criterion; compelling evidence
2 Somewhat meets criterion; partially applicable
1 Marginally meets criterion; limited applicability
0 Does not meet criterion; not applicable
Source: WRI.

19
3.1 Core IndicatorsAfter conducting the indicator assessment described in the previous section, the preliminary list of 160 indicators was narrowed down to a list of 30 suggested core indicators that form a minimum viable framework for monitoring progress toward Malawi’s national restoration goals and restoration intervention targets. These 30 indicators were selected from the 160 preliminary indicators for two reasons. First, they scored highly against the five assessment criteria of relevance, reliability, quality, sensitivity, and ease of communication. Second, each of the 30 indicators measured a unique dimension of progress toward the national restoration goals and restoration intervention targets. These dimensions of progress were identified by examining the specific contributions of FLR to national restoration goals (Table 1) and the causal pathways that connect restoration interventions to goals (Figures 5 to 9).
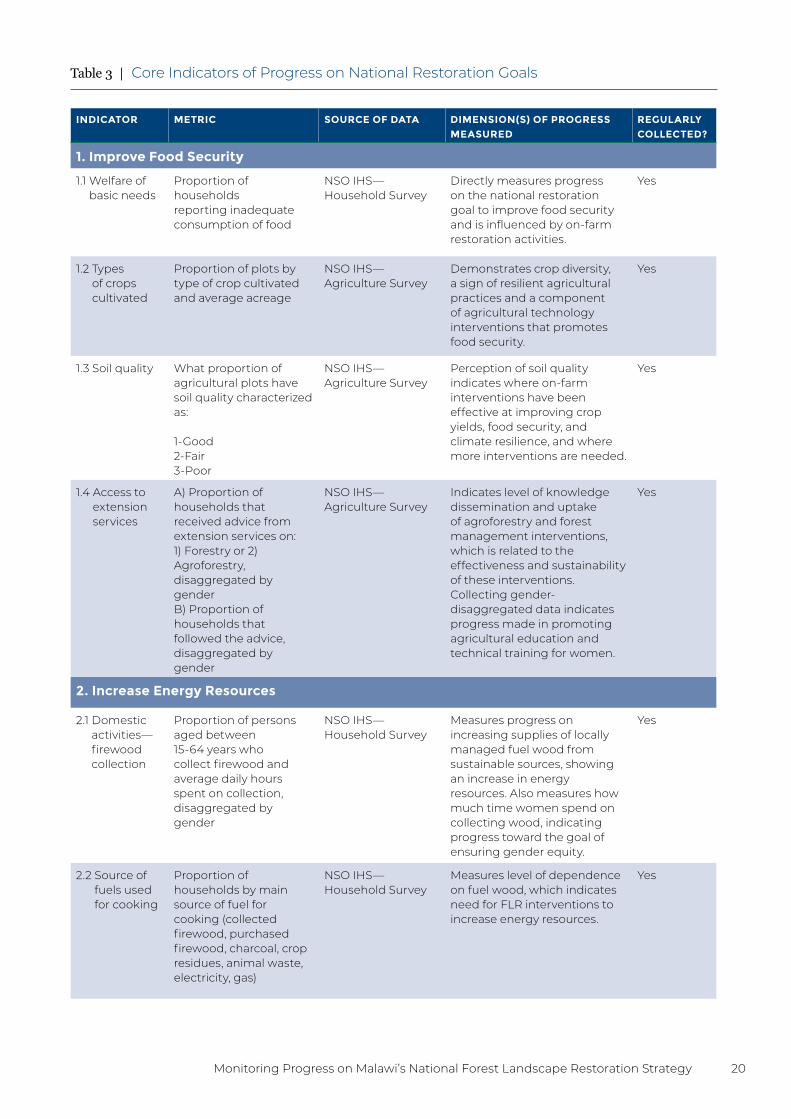
As described in Section 2, the monitoring frame-work sought to include indicators that measure progress on FLR against the two pillars of the National FLR Strategy: national restoration goals (e.g., food security, climate resilience) and restoration intervention targets (e.g., tree cover along rivers and streams). As such, the suggested core indicators are divided by these categories into two tables below: Table 3 includes the indicators that measure progress toward national restoration goals, and Table 4 includes the indicators that measure progress toward restoration intervention targets. The indicators in the tables are organized according to the relevant restoration goal or target, and include information on the metric (i.e., quantitative measure), the source of the data, the dimension of progress measured, and whether they are already being regularly collected.
3. PROPOSED INDICATORS FOR THE NATIONAL MONITORING FRAMEWORK
As shown in the following tables, many of the core indicators and metrics proposed for monitoring progress on FLR are already being regularly collected through the NSO’s Integrated House-hold Survey (IHS), which is conducted every three to five years nationally in Malawi. These indicators all scored highly during the assessment process for their reliability of collection and quality. The indicators selected for the core list also scored highly in terms of their relevance to the restoration goal and sensitivity to restoration interventions. Since the IHS provides such a robust and reliable source of data at minimal additional cost or effort for restoration monitoring, the indicators from this survey constitute the majority of the proposed framework. It should be noted that the indicators and metrics reported by NSO’s IHS are written exactly as they are asked within the survey.
However, some gaps remain in measuring progress on certain FLR goals and targets. For example, all of the indicators related to conserving and restoring biodiversity are not currently being regularly collected, so additional resources would need to be allocated for their collection to ensure that progress toward all goals is being adequately captured in the framework. Furthermore, the indicators sourced from USGS, which include bio-physical mapping and quantification of tree cover toward intervention targets, are being collected for baseline year 2017, but there are no current plans in place to regularly map these indicators at defined intervals.
In two cases, the proposed indicators are essential to monitoring progress on restoration intervention targets but are not being monitored under any existing survey, initiative, or strategy; therefore, a data collection plan would need to be developed and established. Indicators in this circumstance include quantification of river- and stream-bank restoration and government budget allocation toward restoration-related projects.
20Monitoring Progress on Malawi’s National Forest Landscape Restoration Strategy
Table 3 | Core Indicators of Progress on National Restoration Goals
INDICATOR METRIC SOURCE OF DATA DIMENSION(S) OF PROGRESS MEASURED
REGULARLY COLLECTED?
1. Improve Food Security
1.1 Welfare of basic needs
Proportion of households reporting inadequate consumption of food
NSO IHS— Household Survey
Directly measures progress on the national restoration goal to improve food security and is influenced by on-farm restoration activities.
Yes
1.2 Types of crops cultivated
Proportion of plots by type of crop cultivated and average acreage
NSO IHS— Agriculture Survey
Demonstrates crop diversity, a sign of resilient agricultural practices and a component of agricultural technology interventions that promotes food security.
Yes
1.3 Soil quality What proportion of agricultural plots have soil quality characterized as:
1-Good2-Fair3-Poor
NSO IHS— Agriculture Survey
Perception of soil quality indicates where on-farm interventions have been effective at improving crop yields, food security, and climate resilience, and where more interventions are needed.
Yes
1.4 Access to extension services
A) Proportion of households that received advice from extension services on: 1) Forestry or 2) Agroforestry, disaggregated by genderB) Proportion of households that followed the advice, disaggregated by gender
NSO IHS— Agriculture Survey
Indicates level of knowledge dissemination and uptake of agroforestry and forest management interventions, which is related to the effectiveness and sustainability of these interventions. Collecting gender-disaggregated data indicates progress made in promoting agricultural education and technical training for women.
Yes
2. Increase Energy Resources
2.1 Domestic activities— firewood collection
Proportion of persons aged between 15-64 years who collect firewood and average daily hours spent on collection, disaggregated by gender
NSO IHS— Household Survey
Measures progress on increasing supplies of locally managed fuel wood from sustainable sources, showing an increase in energy resources. Also measures how much time women spend on collecting wood, indicating progress toward the goal of ensuring gender equity.
Yes
2.2 Source of fuels used for cooking
Proportion of households by main source of fuel for cooking (collected firewood, purchased firewood, charcoal, crop residues, animal waste, electricity, gas)
NSO IHS—Household Survey
Measures level of dependence on fuel wood, which indicates need for FLR interventions to increase energy resources.
Yes

21
Table 3 | Core Indicators of Progress on National Restoration Goals
INDICATOR METRIC SOURCE OF DATA DIMENSION(S) OF PROGRESS MEASURED
REGULARLY COLLECTED?
2. Increase Energy Resources, continued
2.3 Source of firewood
Proportion of households that collect firewood from:
1. Own woodlot2. Community woodlot3. Forest reserve4. Unfarmed area
of community5. Other (specify)
NSO IHS— Household Survey
Measures progress on specific FLR interventions to increase energy resources and indicates where more interventions are needed to increase supplies of locally sourced fuel wood.
Yes
3. Increase Climate Resilience
3.1 Recent shocks to the household
Proportion of households severely affected by shocks during the last 12 months
NSO IHS— Household Survey
Measures impact of FLR interventions in reducing the consequences of flooding, landslides, and weather events to support increased climate resilience.
Yes
4. Improve Water Quality and Supply
4.1 Access to safe drinking water
Proportion of households with access to safe drinking water
NSO IHS—Household Survey
Measures progress on the national restoration goal of improving water quality and supply.
Yes
4.2 Domestic activities—water collection
Proportion of persons aged between 15–64 years who collected water and average daily hours spent on collection, disaggregated by gender
NSO IHS—Household Survey
Measures progress on the goal of improving water quality and supply at local sources. Also measures how much time women must spend on collecting water, indicating progress toward the goal of ensuring gender equity.
Yes
4.3 Level of erosion
Proportion of agricultural plots with the extent of erosion characterized as:1-No Erosion2-Low3-Moderate4-High
NSO IHS— Agriculture Survey
Perception of erosion on agricultural plots indicates the effectiveness of FLR interventions on mitigating erosion and protecting source water from sedimentation, which measures progress on the national goal of improving water quality and supply.
Yes

22Monitoring Progress on Malawi’s National Forest Landscape Restoration Strategy
Source: WRI.
Table 3 | Core Indicators of Progress on National Restoration Goals
INDICATOR METRIC SOURCE OF DATA DIMENSION(S) OF PROGRESS MEASURED
REGULARLY COLLECTED?
5. Conserve and Restore Biodiversity
5.1 Wildlife corridors created
Number of wildlife corridors created
Department of National Parks and Wildlife (DNPW)
Indicates progress in prioritizing and improving ecosystem protection, contributing to the national goal of conserving and restoring biodiversity.
No
5.2 Trend in abundance and distribution of known threatened species
Number of threatened species for which trend in abundance and distribution is known
Department of National Parks and Wildlife (DNPW)
Indicates effectiveness of FLR interventions in restoring threatened species, which measures progress toward the goal of improving biodiversity.
No
5.3 Indigenous plant species cultivated and protected
Number of indigenous plant species cultivated and protected
Malawi Plant Genetic Resources Centre (MPGRC)
Indicates level of success in diversifying plant cultivation and protecting culturally important species, which measures progress in conserving and restoring biodiversity.
No
6. Ensure Gender Equity and Equality
6.1 Ownership / manage-ment of plots
Primary plot ownership by gender
NSO IHS— Agriculture Survey
Trend in agricultural plot ownership by gender indicates progress in promoting women’s ownership of productive resources and equity in agricultural decision-making.
Yes
7. Alleviate Proverty
7.1 Perception of household current economic well-being
Percentage distributions of household perceived current economic well-being
NSO IHS— Household Survey
Measures progress on the national restoration goal of alleviating poverty.
Yes
7.2 Enterprises engaged in sale of forest-based products
Proportion of enterprises that sell forest-based products and source of the products
NSO IHS—Household Survey
Indicates effectiveness of FLR interventions at enhancing forest resources’ contribution to the national economy.
Yes

23
Table 4 | Core Indicators of Progress on Restoration Intervention Targets
INDICATOR METRIC SOURCE OF DATA DIMENSION(S) OF PROGRESS MEASURED
REGULARLY COLLECTED?
A. Agricultural Technologies
A.1 On-farm tree cover
Number of hectares of cropland with at least 5% tree cover
USGS— Remote Sensing
Indicates progress toward the National FLR Strategy target to achieve increased tree cover on 50% of cropland in Malawi by 2020 and 80% of cropland by 2030.
No
A.2 Agroforestry adoption
Average proportion of households in a community that practice agroforestry
NSO IHS—Community Survey
Indicates extent of adoption at the community level of agroforestry, one of the primary agricultural technology interventions.
Yes
A.3 Legume cover crop adoption
Average proportion of households in a community that plant legume cover crops
NSO IHS—Community Survey
Indicates extent of adoption at the community level of conservation agriculture, one of the primary agricultural technology interventions.
Yes
B. Community Forests and Woodlots
B.1 Community forests / woodlots
Number of hectares of community forests / woodlots
USGS— Remote Sensing
Indicates progress toward the National FLR Strategy target to increase area of community forests and woodlots to 200,000 ha by 2020 and 600,000 ha by 2030.
No
B.2 Community forest proportion
Average proportion of land in a community that is forest and not used for agriculture
NSO IHS—Community Survey
Indicates the extent of commitment of communities toward reserving land for community forest and where additional outreach is needed to improve adoption of interventions.
Yes
C. Forest Management
C.1 Natural forest protection and regeneration
Number of hectares of forest with at least 50% canopy cover
USGS— Remote Sensing
Indicates progress toward the National FLR Strategy target to improve protection and management of two million ha of natural forest and restore 500,000 ha of degraded forest land by 2030.
No
C.2 Plantations Number of hectares of plantations
USGS— Remote Sensing
Indicates progress toward the National FLR Strategy target to establish 100,000 ha of commercial plantations by 2030.
No

24Monitoring Progress on Malawi’s National Forest Landscape Restoration Strategy
Table 4 | Core Indicators of Progress on Restoration Intervention Targets
INDICATOR METRIC SOURCE OF DATA DIMENSION(S) OF PROGRESS MEASURED
REGULARLY COLLECTED?
D. Soil and Water Conservation
D.1 Soil and water conservation interventions
Proportion of agricultural plots that implement erosion control/water harvesting interventions, which include:
1. No erosion control2. Terraces3. Erosion control
bunds4. Gabions / Sandbags5. Vetiver grass6. Tree belts7. Water harvest bunds8. Drainage ditches9. Other
NSO IHS— Agriculture Survey
Indicates level of adoption of specific soil and water conservation interventions toward the National FLR Strategy target to apply interventions on 250,000 ha by 2020 and 500,000 ha by 2030.
Yes
D.2 Barriers to soil and water conservation interventions
Proportion of households that do not invest in conservation structures on any plots owned and/or cultivated by the household for the following reasons:
1. Requires too much labor
2. Materials not available3. Materials too costly4. No soil or water
erosion problems on any plots
5. Too risky/benefits unclear
6. Other
NSO IHS— Agriculture Survey
Reasons that soil and water conservation interventions are not being implemented indicate where more resources need to be invested to adaptively manage intervention techniques and outreach strategies.
Yes
D.3 Bund adoption
Average proportion of households in a community that have earth or stone bunds
NSO IHS—Community Survey
Indicates extent of adoption at the community level of earth or stone bunds toward the National FLR Strategy target to apply soil and water conservation interventions on 250,000 ha by 2020 and 500,000 ha by 2030.
Yes
D.4 Terrace adoption
Average proportion of households in a community that have terraces
NSO IHS—Community Survey
Indicates extent of adoption at the community level of terracing, contributing to the National FLR Strategy target to apply soil and water conservation interventions on 250,000 ha by 2020 and 500,000 ha by 2030.
Yes
Source: WRI.

25
3.2 Proposed Additional IndicatorsAs described in Section 2.2, during the screen-ing process for selecting core indicators, priority was given to indicators that were already being collected through other monitoring strategies and surveys to avoid duplication of similar efforts and to make the most of the limited resources available for monitoring FLR. Such an approach meant, however, that some parts of the frame-work were less robust than others, as existing data collection activities for some goals and interventions remain limited.
During the consultation process, stakeholders identified options for expanding the proposed core indicators beyond those listed in Section 3.1 if additional resources and investment in data col-lection were available. For example, stakeholders suggested that an indicator of soil organic carbon would be valuable for assessing the effectiveness of restoration interventions at improving soil quality and productivity. However, data on soil organic carbon is not adequately or consistently collected in the frameworks of any existing poli-cies, strategies, or surveys and the data collection process tends to be relatively costly and time intensive.
Table 5 includes proposed additional indicators that measure dimensions of progress beyond those covered by the core indicators that would help to make the framework more comprehensive if resources were available to support their col-lection. The indicators in the table were included based on feedback collected during the May 2018 workshop in Lilongwe together with additional research from the team, which included examin-ing the specific contributions of FLR to national restoration goals (Table 1) and the causal path-ways that connect restoration interventions to goals (Figures 5 to 9) to assess any gaps in the proposed framework. Academic studies, grey literature, monitoring frameworks from other countries, and interviews of experts in restora-tion-related fields contributed to the compilation of additional indicators. As with the 30 core indicators, these proposed additional indicators were screened against the five assessment criteria of relevance, reliability, quality, sensitivity, and ease of communication.
As the indicators in Table 5 are not being moni-tored under existing strategies, a data collection plan would need to be developed and established for each indicator. Many of these proposed indicators would be collected through survey methods and could be incorporated into the next Integrated Household Survey, for example. Oth-ers, especially those related to climate resilience, water quality, and energy resources, will require more specialized data collection plans.
Table 4 | Core Indicators of Progress on Restoration Intervention Targets
INDICATOR METRIC SOURCE OF DATA DIMENSION(S) OF PROGRESS MEASURED
REGULARLY COLLECTED?
E. River- and Stream-bank Restoration
E.1 River- and stream-bank restoration
Percent of river and stream banks with tree cover within 30 m
To Be Determined Indicates progress toward the National FLR Strategy target to regenerate or plant 20 million trees along river and stream banks by 2020 and 50 million trees by 2030.
No
F. Budget Allocated to Restoration
F.1 Government allocation of budget toward restoration-related projects
Percent of budget allocation per ministry that is earmarked to fund restoration-related projects
To Be Determined Indicates overall governmental support for National FLR Strategy and the targets it sets.
No

26Monitoring Progress on Malawi’s National Forest Landscape Restoration Strategy
Table 5 | Proposed Additional Indicators of Progress on National Restoration Goals
INDICATOR METRIC DIMENSION(S) OF PROGRESS MEASURED PROPOSED DATA COLLECTION METHOD
1. Improve Food Security
Crop yield Average annual crop yield per household per hectare (kg/ha), by crop type
Trend in crop yield over time indicates effectiveness of FLR interventions at restoring productivity to agricultural lands and improving food security.
NSO IHS— Agriculture Survey
Yield of non-timber forest products
Average annual yield of non-timber forest products (kg) per community, by type (e.g., fruits, medicinal plants, mushrooms, honey)
Trend in supply of non-timber forest products indicates the effectiveness of FLR interventions at providing secondary sources of food and income.
NSO IHS— Community Survey
2. Increase Energy Resources
Sediment in catchments of hydropower infrastructure
Depth of sediment trapped in catchments, or amount dredged from catchments
Depth of sediment or amount of sediment dredged indicates effectiveness of FLR interventions at reducing sedimentation and increasing hydropower efficiency.
Field measurements
3. Increase Climate Resilience
Soil organic carbon
Soil organic carbon concentration (mg/ha)
Soil organic carbon, a proxy for soil organic matter, indicates soil fertility and carbon sequestration on agricultural land, which contribute to increased climate resilience and improved food security.
Field measurements
Application of synthetic fertilizers
Annual application of synthetic fertilizers per household (kg), including information on type of fertilizer (i.e., nitrogen content), and by crop type
Synthetic fertilizers contribute to increased GHG emissions and reduced water quality from runoff. Their application rates also indicate where additional FLR interventions are needed to improve natural fertilization techniques.
NSO IHS— Agriculture Survey
Crop residues Method of management or disposal of crop residues per household (e.g., burning, field application, fodder, biofuels)
Management method for crop residues indicates the adoption level of conservation agriculture techniques. It also indicates their contribution to carbon sequestration (via field application) or GHG emissions (via burning), all of which influence climate resilience.
NSO IHS— Agriculture Survey
4. Improve Water Quality and Supply
Turbidity in surface water
Turbidity in rivers and streams (NTU)
Measure of turbidity demonstrates impact of FLR interventions on preventing sedimentation and erosion and improving water quality. For catchments with hydroelectric power, it indicates effectiveness of upstream FLR interventions at reducing sediment accumulation in downstream reservoirs.
Field measurements

27
Table 5 | Proposed Additional Indicators of Progress on National Restoration Goals
INDICATOR METRIC DIMENSION(S) OF PROGRESS MEASURED PROPOSED DATA COLLECTION METHOD
4. Improve Water Quality and Supply, continued
Drinking water quality
Turbidity (NTU), total dissolved solids (mg/L), and nitrates (mg/L) in drinking water sources
Indicates effectiveness of FLR interventions at limiting inorganic agricultural inputs (source of nitrates) and runoff, and protecting source water from soil erosion (source of turbidity and total dissolved solids)
Field measurements
5. Conserve and Restore Biodiversity
Abundance and distribution of key indicator species
Annual trend in number and geographic distribution of indicator species in forest reserves and other critical habitats
Trend in number of indicator species inventoried indicates effectiveness of forest interventions in protecting habitats. Identified indicator species that are known to be indicative of ecosystem health may be more sensitive to gradual progress toward restored ecosystems than just abundance of threatened species.
Field surveys
6. Ensure Gender Equity and Equality
Decision-making authority for agricultural plots
Primary plot decision-making by gender
Trend in agricultural plot decision-making by gender indicates progress made in promoting women’s control of productive resources, one of the identified FLR contributions to ensuring gender equity.
NSO IHS— Agriculture Survey
7. Alleviate Poverty
Income from sale of surplus crops, timber, and non-timber forest products
Annual income from sale of surplus crops, timber and non-timber forest products per household (MK)
The availability of income from sale of surplus products at market indicates where FLR interventions are increasing yields, which both alleviates poverty and increases food security.
NSO IHS— Household Survey
Source: WRI.

28Monitoring Progress on Malawi’s National Forest Landscape Restoration Strategy
4. INTERPRETING MONITORING DATASince many of the core indicators proposed for the FLR monitoring framework are already being collected by existing surveys and monitoring efforts, some data are immediately available for analyzing trends in indicators over time. This information can be used to plan restoration-related activities that target specific locations where progress on implementation of FLR interventions or national goals has been limited to date, or to identify which goals need the most investment to achieve progress. A full compilation of these available data can be found in Appendix B. The data are sourced primarily from the Inte-grated Household Survey 4 (IHS4) that was con-ducted in 2016–2017. Where available, data from prior surveys such as IHS3 (2010–2011) were also included to show trends. A few examples of key findings from analysis of the data at the national level and for the Machinga district are provided in this section. It is important to note that bench-marks of progress for these indicators have not yet been set for the monitoring framework. As a result, this section presents some examples of how monitoring data could be interpreted to show progress toward goals or provide guidance on adaptively managing FLR implementation, but it does not seek to draw any conclusions on whether specific benchmarks are being met.
4.1 Examples of Data Interpretation at the National Level 4.1.1 Indicator 1.4: Access to Extension ServicesIndicator 1.4 provides information on the pro-portion of households that received advice from extension services on forestry and agroforestry, and the proportion of households that followed the advice (Table 6). The data show that the reach of extension services is still low across Malawi, with forestry services reaching only about eight percent of households and agroforestry reaching only four percent. In terms of following the advice, the uptake of forestry services is higher at nearly 63 percent versus only 50 percent for agroforestry. These results indicate that extension services are being relatively effec-tive at providing advice that households find use-ful and are willing to implement, but significant investment is needed to reach a wider audience. More analysis of the services themselves would likely reveal which factors influence why house-holds are choosing not to implement the advice, and why forestry services are more likely to be implemented than agroforestry.
Table 6 | Proportion of households that received advice from extension services on forestry, agroforestry, and proportion of households that followed the advice (Indicator 1.4)
FORESTRY PROPORTION FOLLOWED AGROFORESTRY PROPORTION FOLLOWED
IHS4 2016–2017
Malawi 7.9 62.7 4.2 50.1
Male 8.4 62.2 4.7 49.4
Female 6.8 64.5 3.1 52.8
Source: Adapted from the National Statistical Office’s Integrated Household Survey 4 (2016–2017).

29
The data on extension services also reveal inter-esting results from a gender perspective. While fewer women than men are receiving either forestry or agroforestry extension services, they are consistently more likely to follow the advice. These results show that the adjustments to the provision of extension services to target a higher proportion of women would also lead to higher proportion of households implementing the advice.
4.1.2 Indicator 3.1: Recent shocks to the householdTo provide insight into restoration’s influence on climate resilience, Indicator 3.1 (Table 7) provides data on the proportion of households severely affected by shocks during the last 12 months. At the national level in Malawi, the high cost of food was the most prevalent shock, followed closely by irregular rains, unusually high cost of
Table 7 | Proportion of households severely affected by shocks during the last 12 months (Indicator 3.1)
DROUGHTIRREGULAR
RAINS FLOODS LANDSLIDES
UNUSUALLY HIGH COST OF
AGRICULTURAL INPUTS
UNUSUALLY HIGH COST OF FOOD
UNUSUALLY LOW PRICE OF
AGRICULTURAL OUTPUTS
IHS4 2016–2017
Malawi 36.2 57.8 4.3 1.5 45.6 68.4 12.5
Male 34.6 54.9 4.5 1.5 43.9 68.2 12.9
Female 39.3 63.3 3.8 1.6 48.7 68.9 11.8
DROUGHT AND IRREGULAR RAINS
FLOODS AND LANDSLIDES
UNUSUALLY HIGH COST OF
AGRICULTURAL INPUTS
UNUSUALLY HIGH COST OF FOOD
UNUSUALLY LOW PRICE OF
AGRICULTURAL OUTPUTS
IHS3 2010–2011
Malawi 37.8 3.5 26.2 24.5 12.2
Male 36.2 3.6 26.1 23.8 12.9
Female 42.8 3.5 26.4 26.5 10.0
Note: In IHS3, the survey defined shocks as “Droughts and Irregular Rains” and “Floods and Landslides.” In IHS4, these shocks were divided into “Droughts,” “Irregular Rains,” “Floods,” and “Landslides.”Source: Adapted from the National Statistical Office’s Integrated Household Survey 4 (2016–2017) and Integrated Household Survey 3 (2010-2011).
agricultural inputs (i.e., fertilizers), and drought. Floods, landslides, and the unusually low price of agricultural outputs were reported at relatively low levels.
These results have important implications that should encourage tailoring of restoration inter-ventions to address these shocks. More invest-ment in interventions such as agroforestry and conservation agriculture, which are proven to enrich soils and decrease reliance on fertilizers, will have a significant influence on increasing households’ resilience to shocks related to the high cost of agricultural inputs. Furthermore, by helping retain nutrients and water in the soil, the interventions will increase resilience to droughts and irregular rains on agricultural plots. Overall, these interventions will help stabilize crop yields, which will in turn stabilize food prices, address-ing the shock most widely reported as a concern across Malawi.

30Monitoring Progress on Malawi’s National Forest Landscape Restoration Strategy
4.1.3 Indicator D.1: Soil and water conservation interventionsIndicator D.1 provides data on the application of soil and water conservation interventions related to the proportion of agricultural plots that have implemented erosion control or water harvest-ing interventions (Table 8). Nationally, nearly 57 percent of Malawi’s agricultural plots are reported to have no erosion control based on data from 2016–2017. The most common type of inter-vention is erosion control bunds, which are applied on 22 percent of plots. At a distant second is vetiver grass (8 percent), followed by drain-age ditches (5 percent), terraces (3 percent), and water harvest bunds (3 percent). These results indicate that more investment in outreach is needed to promote the benefits of these interven-tions for preventing erosion and improving crop yields.
While adoption rates of soil and water conser-vation interventions are low overall, there is modest improvement from the previous data collection period of the IHS in 2010–2011. Data from this period showed that 59 percent of plots had no erosion control measures in place, which indicates lower rates of adoption than the 2016-2017 period. There was also a shift in the types of interventions being implemented, with less implementation of drainage ditches, vetiver grass,
and gabions/sandbags, but slightly more imple-mentation of erosion control bunds, terraces, and water harvest bunds.
The data also reveal interesting trends when comparing implementation by gender. Men consistently adopted all types of soil and water conservation interventions at a higher rate than women during data collection periods. Further exploration into why adoption rates are lower among women would be important to pursue. It is possible that women are not being targeted enough by extension services or NGOs to learn how to implement these types of interventions and understand their benefits.
4.2 Examples of Data Interpretation for the Machinga DistrictProject planning and implementation occurs mainly at the district level in Malawi. As a result, it is important to monitor progress on restoration at this jurisdictional level to understand trends and adapt projects to meet restoration goals. A few examples of how monitoring data across themes of food security and energy resources could be interpreted for the Machinga district are discussed in this section.
Table 8 | Proportion of agricultural plots by erosion control/water harvesting intervention (Indicator D.1)
NO EROSION CONTROL TERRACES
EROSION CONTROL
BUNDSGABIONS/SANDBAGS
VETIVER GRASS
TREE BELTS
WATER HARVEST
BUNDSDRAINAGE
DITCHES OTHER
IHS4 2016–2017
Malawi 56.8 3.4 22.1 1.3 7.7 0.8 2.7 5.1 2.4
Male 55.3 3.4 23.4 1.3 8.0 0.9 3.0 4.8 2.3
Female 60.5 3.2 18.8 1.1 6.9 0.7 2.0 5.9 2.5
IHS3 2010–2011
Malawi 59.4 4.0 25.8 0.5 5.8 0.9 4.5 1.9 0.5
Male 58.5 4.2 25.8 0.5 6.1 0.9 4.5 1.9 0.6
Female 62.4 3.1 24.9 0.4 4.1 0.9 4.3 2.0 0.3
Source: Adapted from the National Statistical Office’s Integrated Household Survey 4 (2016–2017) and Integrated Household Survey 3 (2010-2011).

31
4.2.1 Indicators of Food SecurityGiven the widespread reliance on subsistence agriculture in Machinga, food security is an important issue for restoration to address in the district. In analyzing the indicators of food security for the Machinga district compared to the national average for Malawi (Table 9), Machinga is worse off than the rest of Malawi in terms of households’ inadequate consumption of food. Nearly 85 percent of Machinga households reported inadequate consumption of food, while the national average was 64 percent (Indicator 1.1). In comparing results from several prior IHS surveys (2010–2011 and 2004–2005), Machinga has consistently reported higher rates of food insecurity than the national average, and the number of households that are food insecure has doubled since 2010–2011.
For the proportion of each plot by type of crop cultivated, Machinga households grow more maize proportionally than the national average for Malawi (82 percent versus 76 percent, respec-tively) and significantly more pigeon peas (54 percent vs. 19 percent) and rice (12 percent vs. 3 percent) (Indicator 1.2). Machinga households grow significantly fewer crops of tobacco, beans,
and soya beans, while groundnut cultivation is about the same as the national average. Plant-ing a variety of crops is important for both food security and climate resilience, and Machinga’s above-average numbers for crop variety indicate a positive trend toward improvement for these goals.
In terms of soil quality, households in Mach-inga have consistently reported their soils being of lower quality than the national average for Malawi, where soils are less likely to be rated as “good” as opposed to “fair” or “poor.” On the posi-tive side, more respondents reported their soils being good in 2016–2017 (36 percent) than in 2010–2011 (25 percent), indicating that progress on improving soil quality is being achieved. Regarding the proportion of households that receive extension services on forestry and agro-forestry and whether they followed the advice (Indicator 1.4), in Machinga the results show that households received more extension services than the national average. However, they were much less likely to follow the advice, particularly for agroforestry. These results indicate that more investment in understanding what is causing the lack of uptake of advice from agricultural exten-sion services is critical for increasing the success of interventions and improving the food security situation for Machinga.

32Monitoring Progress on Malawi’s National Forest Landscape Restoration Strategy
Table 9 | Food Security Indicators for the Machinga District Compared to Malawi’s National Average
Indicator 1.1 Proportion of households reporting inadequate consumption of food
SOURCE MALAWI MACHINGA
IHS4 2016–17 63.8 84.8
IHS3 2010–11 38.3 41.3
IHS2 2004–05 56.5 63.6
Indicator 1.2 Proportion of plots by type of crop cultivated
SOURCE REGION MAIZE PIGEON PEAS GROUNDNUTS TOBACCO BEANS RICE SOYA BEANS
IHS4 2016–17
Malawi 75.7 19.3 10.2 4.2 9.3 3.0 6.8
Machinga 82.3 54.0 10.0 0.8 0.2 12.0 0.0
Indicator 1.3 Proportion of agricultural plots by soil quality
SOURCE REGION GOOD FAIR POOR
IHS4 2016–17
Malawi 51.3 36.2 12.5
Machinga 35.9 45.7 18.5
IHS3 2010–11
Malawi 46.6 42.0 11.4
Machinga 25.4 63.5 11.1
Indicator 1.4 Proportion of households that received advice from extension services on forestry, agroforestry, and proportion of households that followed the advice
SOURCE REGION FORESTRY PROPORTION ALLOWED
AGROFORESTRY PROPORTION ALLOWED
IHS4 2016–17
Malawi 7.9 62.7 4.2 50.1
Machinga 15.4 50.9 7.0 26.9
Source: Adapted from the National Statistical Office’s Integrated Household Survey 4 (2016–2017) and Integrated Household Survey 3 (2010-2011).
4.2.2 Indicators of Energy ResourcesIn analyzing the indicators related to energy resources (Table 10), the results show a higher-than-average dependence on firewood for fuel across the district. In Machinga, nearly all households (94 percent) rely on firewood as their source of cooking fuel while the national average is 80 percent. The remaining six percent of house-holds reported using charcoal for cooking and no households in Machinga reported using electricity, which are both below the national average (Indica-tor 2.2). Meanwhile, 34 percent of households col-lect their own firewood while the national average
is only 15 percent. The proportion of households collecting firewood has increased 15 percentage points in Machinga since 2010/2011, while the national average has decreased by four points (Indicator 2.1). Given these statistics, access to sustainable sources of firewood is critical for restoration initiatives to address in the district.
The majority of households are using unfarmed areas of the community and forest reserves as their source of firewood, while adoption of com-munity woodlots is very low compared to the national average. More households utilize private woodlots (6 percent) than community woodlots (3

33
percent) (Indicator 2.3). Thus, there is significant opportunity for investing more resources toward improving the rate of adoption of both private and community woodlots to relieve pressure on forest reserves and community lands, which would also reduce the number of hours spent on firewood collection.
Overall, these results show that Machinga is behind the curve for Malawi when it comes to reducing dependence on firewood in favor of electricity or other alternative energy sources.
Table 10 | Indicators of Energy Resources for the Machinga District Compared to Malawi’s National Average
Indicator2.1Proportionofpersonsagedbetween15-64yearswhocollectfirewoodandaverage daily hours spent on collection
SOURCE REGION PROPORTION COLLECTING AVERAGE HOURS SPENT ON COLLECTION, AMONG THOSE COLLECTING
IHS4 2016–17
Malawi 15.2 1.3
Machinga 34.3 1.3
IHS3 2010–11
Malawi 19.3 1.1
Machinga 20.2 1.5
Source: Adapted from the National Statistical Office’s Integrated Household Survey 4 (2016–2017) and Integrated Household Survey 3 (2010-2011).
Indicator 2.2 Proportion of households by main source of fuel for cooking
SOURCE REGION FIREWOOD CHARCOAL ELECTRICITY
IHS4 2016–17
Malawi 80.5 16.0 1.9
Machinga 94.2 5.8 0.0
IHS3 2010–11
Malawi 87.7 8.9 2.5
Machinga 95.6 3.2 0.0
Indicator2.3Proportionofhouseholdsbycollectionsourceoffirewood
SOURCE REGION OWN WOODLOT COMMUNITY WOODLOT
FOREST RESERVE
UNFARMED AREAS OF
COMMUNITY
OTHER
IHS4 2016–17
Malawi 5.3 14.0 13.2 61.2 6.3
Machinga 6.1 3.6 18.1 61.4 10.8
IHS3 2010–11
Malawi 14.7 16.7 18.7 46.5 3.4
Machinga 11.5 10.9 38.3 39.3 0.0
They also show that there is room to adopt strate-gies for reducing dependence on firewood and to adapt restoration project planning to improve the availability of firewood from sustainable sources. In addition, more resources should be invested in extension services to increase the uptake of agroforestry and forestry interventions within communities.

5. RECOMMENDATIONS AND NEXT STEPSThe framework proposed as part of this study provides the core indicators, metrics, data sources, and some baseline data for monitoring progress on FLR in Malawi. An important next step in developing the monitoring system will be to convene stakeholders to agree upon and set measurable, achievable benchmarks for progress on each indicator using the baseline data. These benchmarks will guide progress on restoration activities and indicate whether these activities are achieving their potential or adjustments need to be made.
The following step will be to develop and implement the components of the system for collecting, storing, and analyzing the indicator data. This system would include establishing an open repository of data and devel-oping a communications plan for reporting progress toward the benchmarks set for restora-tion goals and intervention targets. The latter is particularly important for adapting restoration projects and implementation plans if prog-ress toward restoration goals is not meeting expectations.
In the workshops and consultations conducted for this report, stakeholders have acknowledged that a multi-sectoral approach is critical to the success of the monitoring system, given that so many different government agencies are involved in restoration and have a stake in the progress toward restoration-related goals (see Figure 3, Section 1). The Department of Forestry, given their leadership on FLR activities thus far, has offered to host the monitoring system and lead the next steps on implementation, but they have widely acknowledged that any successful imple-mentation relies on the input and engagement of multiple ministries, particularly the Ministry of Agriculture, Irrigation and Water Development; the Ministry of Finance, Economic Planning and Development; the Ministry of Lands, Housing and Urban Development; the Ministry of Local Gov-ernment and Rural Development; and the Depart-ment of Disaster Management Affairs. Without their input, advisement, and support, the moni-toring system will not be sustainable and progress
on restoration goals would be significantly more difficult to achieve. Therefore, it is recommended that a critical next step is to secure high-level buy-in for the framework from the ministers or permanent secretaries of each of these key ministries that shows their collective support for its implementation.
After achieving this support, it will be important to establish a multi-sectoral FLR Monitoring System Task Force dedicated to developing the FLR monitoring system. The Task Force would be composed of technical staff with directives from their ministries to support activities such as establishing a plan for long-term funding support and developing a work plan for implementing the monitoring system.
While the implementation of the system is outside the scope of this report, this proposed framework provides the blueprint for the monitoring system upon which to build. Furthermore, the process for developing the framework, particularly the stakeholder discussions and consultations, highlighted key insights of what will drive a successful monitoring system in Malawi. Investing in restoration monitoring should help provide reliable evidence to guide the implementation of Malawi’s National FLR Strategy and accelerate positive local successes.

35
REFERENCES
Baldera, A., D. Hanson, and B. Kraft. 2018. “Selecting indicators to monitor outcomes across projects and multiple restoration programs in the Gulf of Mexico.” Ecological Indicators 89: 559–571.
Buckingham, K., S. Ray, F. Stolle, and F. Zoveda. 2017. Measuring Progress for Forest and Landscape Restoration—Working Paper (ver. 1.0, July 2017). Food and Agriculture Organization of the United Nations (FAO): Rome.
“Guiding Principles for Measuring and Monitoring Progress on Forest and Landscape Restoration in Africa.” AFR100 Working Paper Series. 2017. Accessible at: http://afr100.org/content/monitoring-progress.
International Union for Conservation of Nature (IUCN) and World Resources Institute (WRI). 2014. Assessing forest landscape restoration opportunities at the national level: A guide to the Restoration Opportunities Assessment Methodology (ROAM). IUCN: Gland, Switzerland. Accessible at: https://www.iucn.org/theme/forests/our-work/forest-landscape-restoration/restoration-opportunities-assessment-methodology-roam
National Statistical Office. 2016–2017. Integrated Household Survey 4. National Statistical Office: Lilongwe, Malawi. Accessible at: http://www.nsomalawi.mw/images/stories/data_on_line/economics/ihs/IHS4/IHS4%20REPORT.pdf.
National Statistical Office. 2010–2011. Integrated Household Survey 3. National Statistical Office: Lilongwe, Malawi.
National Statistical Office. 2004–2005. Integrated Household Survey 2. National Statistical Office: Lilongwe, Malawi.
Republic of Malawi: Ministry of Natural Resources, Energy and Mining. 2017. Forest Landscape Restoration Opportunities Assessment for Malawi. The Ministry of Natural Resources, Energy and Mining: Lilongwe, Malawi. Accessible at: https://portals.iucn.org/library/sites/library/files/documents/2017-029.pdf.
Republic of Malawi: Ministry of Natural Resources, Energy and Mining. 2017. National Forest Landscape Restoration Strategy. The Ministry of Natural Resources, Energy and Mining: Lilongwe, Malawi. Accessible at: http://afr100.org/sites/default/files/Malawi_NFLR_Strategy_FINALv2.pdf.
Tobin, Richard J. 1999. Malawi’s Environmental Monitoring Program: A Model that Merits Replication? Technical Paper No. 92. Winrock International for the United States Agency for International Development (USAID): Lilongwe, Malawi.
Vika, Stein Terje and Kevin Brown. 2017. Improving Data Collection for Malawi’s Greenhouse Gas Inventory System: A Review of Potential Data Sources. Winrock International for the United States Agency for International Development (USAID): Lilongwe, Malawi.
Walker, Sarah. 2016. Protecting Ecosystems and Restoring Forests in Malawi (PERFORM): Data Gap Assessment for Malawi’s Greenhouse Gas Inventory System. Winrock International for the United States Agency for International Development (USAID): Lilongwe, Malawi.

36Monitoring Progress on Malawi’s National Forest Landscape Restoration Strategy
APPENDIX A: POLICIES, PLANS, AND STRATEGIES REVIEWED
Over 30 policies, plans, and strategies were reviewed to find the most relevant restora-tion indicators. The full list is included below along with the department in charge of each document and the year each document was published. The files are divided into two cat-egories: national-level documents and district-level documents (from the districts of Mach-inga and Ntchisi).
National-level Documents
▪ Department of Disaster Management Affairs with UNEP, National Resilience Strategy (2018–2013): Implementation Plan & Strategy
▪ Environmental Affairs Department, National Bio-diversity Strategy and Action Plan II (2015–2025)
▪ Environmental Affairs Department, National Climate Change Investment Plan (2013–2018)
▪ Environmental Affairs Department, National Climate Change Policy (2012)
▪ Department of Forestry, National Forest and Landscape Restoration Strategy (2017)
▪ Department of Forestry, National Restoration Opportunities Assessment (2017)
▪ Department of Forestry, National Charcoal Strategy (2017)
▪ National Statistical Office, Integrated Household Survey (2016–2017, 2010–2011, 2004–2005)
▪ National Statistical Office, Welfare Monitoring Survey (2014, 2011, 2009)
▪ Land Resources Conservation Department, Malawi National Agriculture Policy (2016, 2010)
▪ Land Resources Conservation Department, Malawi Agricultural Sector Wide Approach (ASWAP) (2011, 2009)
▪ Land Resources Conservation Department, National Agricultural Investment Plan (NAIP) (2018)
▪ Determinants of Adoption of Conservation Agriculture (CA) (2012)
▪ Malawi Vision 2020 (2000)
▪ Malawi State of Environment and Outlook (2010)
▪ Malawi Millennium Development Goal Report (2014)
▪ UNDP Millennium Development Goal Endline Report (2015)
District-level Documents
▪ Machinga District Development Plan (2013-2018)
▪ Machinga District Council M&E Framework (2013-2018)
▪ Machinga District Performance Indicators
▪ Machinga District Project Indicators
▪ Ntchisi District Development Plan (2013-2018)

37
APPENDIX B: BASELINE DATA FOR CORE INDICATORS
Appendix B includes a compilation of data for the core indicators that are already being col-lected through existing surveys and therefore have baseline data available. The indicators in this compilation are organized according to restoration goal and include those indicators sourced from the National Statistical Office’s Integrated Household Survey (IHS). The most recent data are from IHS4, which was con-ducted in 2016–2017. Where available, earlier survey data are included, such as from IHS3
(2010–2011) or IHS2 (2004–2005) for compari-son. Data are included as a national aggregate for Malawi, and also disaggregated by gen-der (male/female) to demonstrate trends in gender equity and social inclusion. Data for all districts are available from the IHS surveys. As the Machinga district was chosen as the case-study district for this report, data unique to the Machinga district are reported in these tables as well.
Table B-1 | Data for Core Indicators by National Restoration Goal
1. Improve Food Security 1.1 Welfare of basic needs: Proportion of households reporting inadequate consumption of food
SOURCE MALAWI MALE FEMALE MACHINGA
IHS4 2016–17 63.8 60.8 71.1 84.8
IHS3 2010–11 38.3 35.8 46.3 41.3
IHS2 2004–05 56.5 54.6 62.9 63.6
Indicator 1.2. Types of crops cultivated: Proportion of plots by type of crop cultivated
SOURCE REGION/GENDER
MAIZE PIGEON PEAS
GROUNDNUTS TOBACCO BEANS RICE SOYA BEANS
IHS4 2016–17
Malawi 75.7 19.3 10.2 4.2 9.3 3.0 6.8
Male 73.0 17.1 10.1 5.4 9.1 3.1 7.3
Female 82.7 24.9 10.4 1.3 9.7 2.6 5.4
Machinga 82.3 54.0 10.0 0.8 0.2 12.0 0.0
IHS3 2010–11
Malawi 70.9 16.4 15.6 8.5 5.7 2.8 4.9
Male 68.0 14.7 15.1 10.4 5.5 2.7 4.3
Female 78.9 21.3 17.0 3.3 6.2 3.1 6.4
Southern Region 86.3 41.2 10.7 3.2 5.4 2.7 12.2
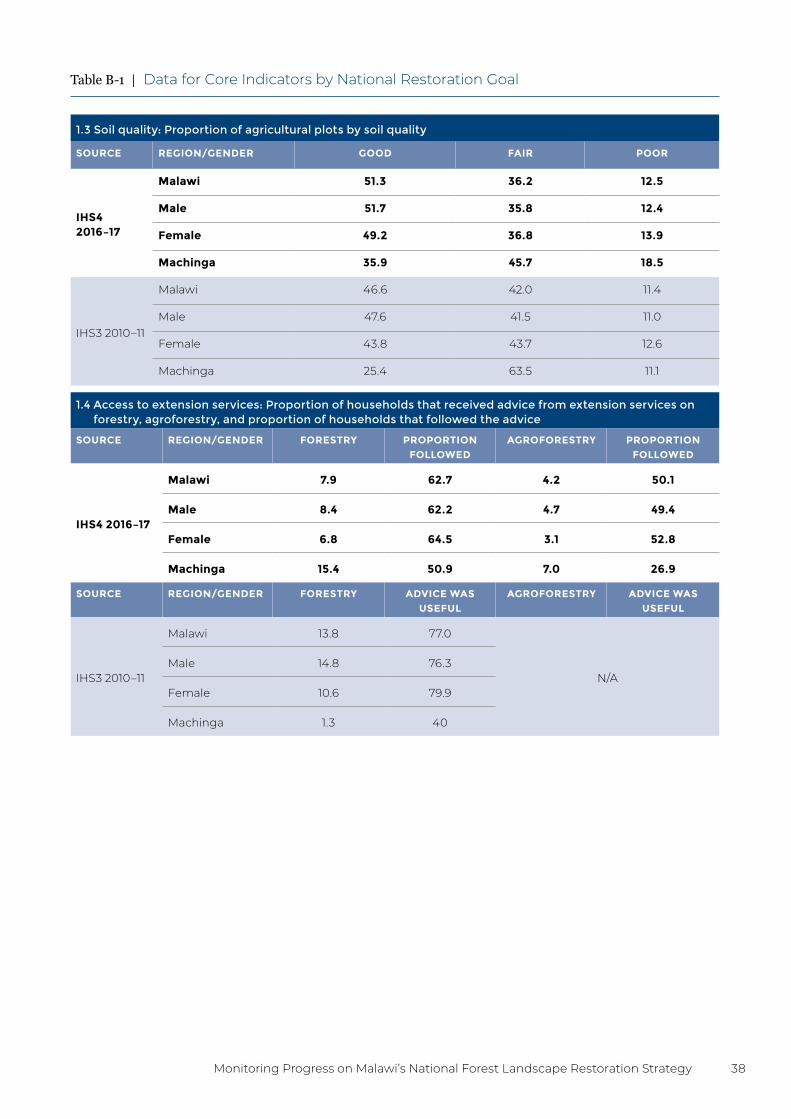
38Monitoring Progress on Malawi’s National Forest Landscape Restoration Strategy
Table B-1 | Data for Core Indicators by National Restoration Goal
1.3 Soil quality: Proportion of agricultural plots by soil quality
SOURCE REGION/GENDER GOOD FAIR POOR
IHS4 2016–17
Malawi 51.3 36.2 12.5
Male 51.7 35.8 12.4
Female 49.2 36.8 13.9
Machinga 35.9 45.7 18.5
IHS3 2010–11
Malawi 46.6 42.0 11.4
Male 47.6 41.5 11.0
Female 43.8 43.7 12.6
Machinga 25.4 63.5 11.1
1.4 Access to extension services: Proportion of households that received advice from extension services on forestry, agroforestry, and proportion of households that followed the advice
SOURCE REGION/GENDER FORESTRY PROPORTION FOLLOWED
AGROFORESTRY PROPORTION FOLLOWED
IHS4 2016–17
Malawi 7.9 62.7 4.2 50.1
Male 8.4 62.2 4.7 49.4
Female 6.8 64.5 3.1 52.8
Machinga 15.4 50.9 7.0 26.9
SOURCE REGION/GENDER FORESTRY ADVICE WAS USEFUL
AGROFORESTRY ADVICE WAS USEFUL
IHS3 2010–11
Malawi 13.8 77.0
N/AMale 14.8 76.3
Female 10.6 79.9
Machinga 1.3 40

39
Table B-1 | Data for Core Indicators by National Restoration Goal
2. Increase Energy Resources 2.1 Proportion of persons aged between 15-64 years who collect firewood and average daily hours spent
on collection
SOURCE REGION/GENDER PROPORTION COLLECTING FIREWOOD
AVERAGE HOURS SPENT ON FIREWOOD COLLECTION AMONG THOSE COLLECTING
IHS4 2016–17
Malawi 15.2 1.3
Male 14.2 1.3
Female 18.6 1.3
Machinga 34.3 1.3
IHS3 2010–11
Malawi 19.3 1.1
Male 18.6 1.1
Female 22.1 1.1
Machinga 20.2 1.5
2.2 Source of fuels used for cooking: Proportion of households by main source of fuel for cooking
SOURCE REGION/GENDER FIREWOOD CHARCOAL ELECTRICITY
IHS4 2016–17
Malawi 80.5 16.0 1.9
Male 78.6 18.0 2.1
Female 85.1 11.2 1.6
Machinga 94.2 5.8 0.0
IHS3 2010–11
Malawi 87.7 8.9 2.5
Male 86.6 9.9 2.6
Female 91.1 5.6 2.0
Machinga 95.6 3.2 0.0
2.3 Source of firewood: Proportion of households by collection source of firewood
SOURCE REGION/GENDER
OWN WOODLOT
COMMUNITY WOODLOT
FOREST RESERVE
UNFARMED AREAS OF COMMUNITY
OTHER
IHS4 2016–17
Malawi 5.3 14.0 13.2 61.2 6.3
Male 5.5 13.9 13.4 60.9 6.3
Female 5.0 14.4 12.6 61.9 6.2
Machinga 6.1 3.6 18.1 61.4 10.8
IHS3 2010–11
Malawi 14.7 16.7 18.7 46.5 3.4
Male 14.8 16.7 18.9 46.1 3.4
Female 14.5 16.8 18.1 47.6 3.1
Machinga 11.5 10.9 38.3 39.3 0.0

40Monitoring Progress on Malawi’s National Forest Landscape Restoration Strategy
Table B-1 | Data for Core Indicators by National Restoration Goal
3. Increase Climate Resilience 3.1 Recent shocks to the household: Proportion of households severely affected by shocks during the last 12
months
DROUGHTIRREGULAR
RAINS FLOODS LANDSLIDES
UNUSUALLY HIGH COST OF
AGRICULTURAL INPUTS
UNUSUALLY HIGH COST OF FOOD
UNUSUALLY LOW PRICE OF
AGRICULTURAL OUTPUTS
IHS4 2016–2017
Malawi 36.2 57.8 4.3 1.5 45.6 68.4 12.5
Male 34.6 54.9 4.5 1.5 43.9 68.2 12.9
Female 39.3 63.3 3.8 1.6 48.7 68.9 11.8
DROUGHT AND IRREGULAR RAINS
FLOODS AND LANDSLIDES
UNUSUALLY HIGH COST OF
AGRICULTURAL INPUTS
UNUSUALLY HIGH COST OF FOOD
UNUSUALLY LOW PRICE OF
AGRICULTURAL OUTPUTS
IHS3 2010–2011
Malawi 37.8 3.5 26.2 24.5 12.2
Male 36.2 3.6 26.1 23.8 12.9
Female 42.8 3.5 26.4 26.5 10.0
4. Improve Water Quality and Supply 4.1 Access to safe drinking water: Proportion of households with access to safe water
SOURCE MALAWI MALE FEMALE MACHINGA
IHS4 2016–17 87.1 87.1 87.3 81.2
IHS3 2010–11 78.7 77.7 82.0 75.8
4.2 Domestic activities—water collection: Proportion of persons aged between 15–64 years who collected water and average daily hours spent on collection
SOURCE REGION/GENDER PROPORTION COLLECTING WATER
AVERAGE HOURS SPENT ON WATER COLLECTION AMONG THOSE COLLECTING
IHS4 2016–17
Malawi 41.0 1.1
Male 38.3 1.1
Female 50.5 1.1
Machinga 53.1 1.3
Malawi 49.5 0.7
IHS3 2010–11 Male 47.0 0.7
Female 60.8 0.7
Machinga 54.9 0.8
Note for Table B-1.3: In IHS3, the survey defined shocks as “Droughts and Irregular Rains” and “Floods and Landslides.” In IHS4, these shocks were divided into “Droughts,” “Irregular Rains,” “Floods,” and “Landslides.

41
Table B-1 | Data for Core Indicators by National Restoration Goal
4.3 Level of erosion: Proportion of agricultural plots by extent of erosion
SOURCE REGION/GENDER
NO EROSION LOW MODERATE HIGH
IHS4 2016–17
Malawi 56.3 29.0 8.4 6.4
Male 56.3 29.3 8.4 6.0
Female 56.3 28.3 8.3 7.1
Machinga 43.2 50.5 3.5 2.7
IHS3 2010–11
Malawi 61.4 26.5 7.2 5.0
Male 61.3 26.5 7.1 5.1
Female 61.7 26.3 7.3 4.7
Machinga 88.4 6.9 4.2 0.5
5. Conserve and Restore Biodiversity No data currently available.
6. Ensure Gender Equity and Equality 6.1 Ownership/management of plots: Primary plot ownership by gender
SOURCE REGION EXCLUSIVELY MALE OWNED
EXCLUSIVELY FEMALE OWNED
MALE AND FEMALE JOINTLY
OWNED
NOT OWNED
IHS4 2016–17Malawi 24.3 34.7 17.5 23.5
Machinga 11.7 39.9 21.0 27.4
IHS3 2010–11 Malawi 34.6 35.1 11.3 19.1
7. Alleviate Poverty 7.1 Perception of household current economic well-being: Percentage distributions of household perceived
current economic well-being
SOURCE REGION/GENDER VERY POOR POOR AVERAGE RICH
IHS4 2016–17
Malawi 35.8 38.5 18.7 7.0
Male 31.8 40.0 20.4 7.8
Female 45.8 34.8 15.5 5.0
Machinga 51.6 34.6 12.9 1.0
IHS3 2010–11
Malawi 33.1 39.7 26.5 0.7
Male 29.2 40.8 29.2 0.8
Female 45.5 36.4 17.8 0.3
Machinga 18.6 34.5 46.0 0.9

42Monitoring Progress on Malawi’s National Forest Landscape Restoration Strategy
Table B-1 | Data for Core Indicators by National Restoration Goal
7.2 Enterprises engaged in sale of forest-based products: Proportion of enterprises that sell forest-based products and source of the products
SOURCE REGION/GENDER
PROPORTION OF ENTERPRISES THAT
SELL FOREST- BASED PRODUCTS
SOURCE OF PRODUCTS
OWN LAND
FOREST/WILD PARK
RESERVE
COMMUNAL LAND
PURCHASED FROM
SOMEONE
OTHER
IHS4 2016–17
Malawi 11.9 4.4 21.9 15.9 53.8 4.0
Male 12.1 4.8 21.0 13.8 57.3 3.1
Female 11.0 3.0 25.1 24.2 40.5 7.3
Machinga 5.7 0.0 33.2 20.0 46.7 0.0
IHS3 2010–11
Malawi 13.2 6.2 25.7 12.7 51.7 3.8
Male 13.9 5.0 23.6 11.9 55.9 3.6
Female 10.0 14.0 39.4 17.5 24.2 4.9
Southern Region 13.4 36.0 22.8 15.1 26.1 0.0
A. Agricultural Technologies A.3 Agroforestry adoption: Average proportion of households in a community that practice agroforestry
SOURCE MALAWI MACHINGA
IHS4 2016–17 10.9 3.4
A.4 Legume cover crop adoption: Average proportion of households in a community that plant legume cover crops
SOURCE MALAWI MACHINGA
IHS4 2016–17 51.1 74.5
B. Community Forests and Woodlots B.2 Community forest interventions: Average proportion of land in a community that is forest and not used
for agriculture
SOURCE MALAWI MACHINGA
IHS4 2016-17 12.0 12.5
IHS3 2010-11 7.8 2.1
C. Forest Management No data currently available.

43
Table B-1 | Data for Core Indicators by National Restoration Goal
D. Soil and Water Conservation D.1 Soil and water conservation interventions: Proportion of agricultural plots by erosion
control/water harvesting intervention
SO
UR
CE
RE
GIO
N/
GE
ND
ER
NO
ER
OS
ION
C
ON
TR
OL
TE
RR
AC
ES
ER
OS
ION
C
ON
TR
OL
BU
ND
S
GA
BIO
NS
/S
AN
DB
AG
S
VE
TIV
ER
G
RA
SS
TR
EE
BE
LTS
WA
TE
R
HA
RV
ES
T
BU
ND
S
DR
AIN
AG
E
DIT
CH
ES
OT
HE
R
IHS4 2016–17
Malawi 56.8 3.4 22.1 1.3 7.7 0.8 2.7 5.1 2.4
Male 55.3 3.4 23.4 1.3 8.0 0.9 3.0 4.8 2.3
Female 60.5 3.2 18.8 1.1 6.9 0.7 2.0 5.9 2.5
Machinga 46.5 9.0 29.0 2.8 1.5 0.7 4.9 6.2 1.7
IHS3 2010–11
Malawi 59.4 4.0 25.8 0.5 5.8 0.9 4.5 1.9 0.5
Male 58.5 4.2 25.8 0.5 6.1 0.9 4.5 1.9 0.6
Female 62.4 3.1 24.9 0.4 4.1 0.9 4.3 2.0 0.3
Machinga 87.4 1.5 8.3 0.6 0.9 0.0 0.2 1.7 0.0
D.2 Barriers to soil and water conservation interventions: Proportion of households by reason for not investing in conservation structures on any plots owned
SOURCE REGION/GENDER
REQUIRES TOO MUCH
LABOR
MATERIALS NOT AVAILABLE
MATERIALS TOO COSTLY
NO SOIL OR WATER EROSION
PROBLEMS ON ANY PLOTS
TOO RISKY/BENEFITS UNCLEAR
OTHER
IHS4 2016–17
Malawi 19.4 7.1 1.5 73.1 2.3 1.8
Male 18.2 7.2 1.5 74.1 2.4 1.7
Female 22.4 6.8 1.7 70.7 1.9 2.0
Machinga 20.5 10.0 4.0 68.3 2.8 1.6
D.3 Bund adoption: Average proportion of households in a community that have earth or stone bunds
SOURCE MALAWI MACHINGA
IHS4 2016–17 10.6 17.0
D.4 Terrace adoption: Average proportion of households in a community that have terraces
SOURCE MALAWI MACHINGA
IHS4 2016–17 5.5 19.3

44Monitoring Progress on Malawi’s National Forest Landscape Restoration Strategy
APPENDIX C: WORKSHOP PARTICIPANTS
Preliminary Workshop to Develop a National Standard for Monitoring Forest Landscape Restoration in Malawi, 8 February 2018, Lilongwe
NAME INSTITUTION
Ben Tonho DPD Machinga
Bertha Kayuni National Statistical Office
Blessings Mwale PERFORM
Chaona Sinalo Economic Planning & Development
Clifford Mkanthama PERFORM
Emily Averna World Resources Institute
F. Sakala / M. Zuze Local Government & Rural Development
Geoffrey Longwe Crops Department
Harry Chalira Machinga DFO
J. Kanyangalazi Land Resources Conservation Department
Joyce Njoloma ICRAF
Judith Kamoto LUANAR
M. Nkhoma Crops Directorate
Marvin Mkondiwa Machinga M&E Officer
Maureen Piyasi PERFORM
Nyuma Muhgohgo Department of Forestry
Ockens Chipeta Disaster and Risk Management
Patrick Ndasauka Gender and Community Development
Ramzy Kanaan PERFORM
Sabin Ray World Resources Institute
Tangu Tumeo Department of Forestry
Tapona Manjolo UNDP

45
APPENDIX C: WORKSHOP PARTICIPANTS
Follow-up Workshop to Develop a National Standard for Monitoring Forest Landscape Restoration in Malawi, 18 May 2018, Lilongwe
NAME INSTITUTION
Austin Tibu LUANAR
Belton Nkosi FAO
Bertha Kayuni National Statistical Office
Blessings Mwale PERFORM
Christopher Katema CGIAR
Dr. Clement Chilima Director, Department of Forestry
Ethel Chilumpha FAO
Gray Tappan USGS
Henry Utila PERFORM
J. Kanyangalazi Land Resources Conservation Department
Jennifer Nkosi Ministry of Agriculture
Dr. Judith Kamoto LUANAR
Kefasi Kamoyo Land Resources Conservation Department
Lilian Chimphepo Environmental Affairs Department
Mathew Cushing USGS
Mphatso Kalemba Environmental Affairs Department
Nyuma Mughogho Deputy Director, Department of Forestry
Ockens Chipeta Disaster and Risk Management
Ramzy Kanaan PERFORM
Sabin Ray World Resources Institute
Sylvester Gawamadzi Local Government & Rural Development
Tangu Tumeo Principal Forestry Officer, Department of Forestry
Teddie Kamoto Deputy Director, Department of Forestry

46Monitoring Progress on Malawi’s National Forest Landscape Restoration Strategy

47