Embed Size (px)
Citation preview

A Framework for Developing Collaborative DERPrograms: Working Tools for Stakeholders
Report of the E2I Distributed Energy ResourcesPublic/Private Partnership
Technical Report
Effective December 6, 2006, this report has been made publicly available in accordance with Section 734.3(b)(3) and published in accordance with Section 734.7 of the U.S. Export Administration Regulations. As a result of this publication, this report is subject to only copyright protection and does not require any license agreement from EPRI. This notice supersedes the export control restrictions and any proprietary licensed material notices embedded in the document prior to publication.

E2I Program Director E. Petrill
E2I, an affiliate of EPRI • 3412 Hillview Avenue, Palo Alto, California 94304 • PO Box 10412, Palo Alto, California 94303 • USA 650.855.2100 • [email protected] • www.e2i.org
A Framework for Developing Collaborative DER Programs: Working Tools for Stakeholders Report of the E2I Distributed Energy Resources Public/Private Partnership
1011026
Final Report, August 2004
Cosponsors California Energy Commission 1516 9th Street, MS 43 Sacramento, CA 95814-5504
Project Manager M. Rawson
New York State Energy Research and Development Authority 17 Columbia Circle Albany, NY 12203
Project Manager N. Patibandia
Tennessee Valley Authority 1101 Market Street, MS MR-2T-C Chattanooga, TN 37402-2801
Project Manager J. Cowart
City Public Service San Antonio, 145 Navarro Street San Antonio, TX 78296-1771
Project Manager V. Harris
Massachusetts Technology Collaborative 75 North Drive Westborough, MA 01581-3340
Project Manager F. Cummings
DISCLAIMER OF WARRANTIES AND LIMITATION OF LIABILITIES
THIS DOCUMENT WAS PREPARED BY THE ORGANIZATION(S) NAMED BELOW AS AN ACCOUNT OF WORK SPONSORED OR COSPONSORED BY THE ELECTRIC POWER RESEARCH INSTITUTE, INC. (EPRI). NEITHER EPRI, ANY MEMBER OF EPRI, ANY COSPONSOR, THE ORGANIZATION(S) BELOW, NOR ANY PERSON ACTING ON BEHALF OF ANY OF THEM:
(A) MAKES ANY WARRANTY OR REPRESENTATION WHATSOEVER, EXPRESS OR IMPLIED, (I) WITH RESPECT TO THE USE OF ANY INFORMATION, APPARATUS, METHOD, PROCESS, OR SIMILAR ITEM DISCLOSED IN THIS DOCUMENT, INCLUDING MERCHANTABILITY AND FITNESS FOR A PARTICULAR PURPOSE, OR (II) THAT SUCH USE DOES NOT INFRINGE ON OR INTERFERE WITH PRIVATELY OWNED RIGHTS, INCLUDING ANY PARTY'S INTELLECTUAL PROPERTY, OR (III) THAT THIS DOCUMENT IS SUITABLE TO ANY PARTICULAR USER'S CIRCUMSTANCE; OR
(B) ASSUMES RESPONSIBILITY FOR ANY DAMAGES OR OTHER LIABILITY WHATSOEVER (INCLUDING ANY CONSEQUENTIAL DAMAGES, EVEN IF EPRI OR ANY EPRI REPRESENTATIVE HAS BEEN ADVISED OF THE POSSIBILITY OF SUCH DAMAGES) RESULTING FROM YOUR SELECTION OR USE OF THIS DOCUMENT OR ANY INFORMATION, APPARATUS, METHOD, PROCESS, OR SIMILAR ITEM DISCLOSED IN THIS DOCUMENT.
ORGANIZATION(S) THAT PREPARED THIS DOCUMENT
John Nimmons & Associates, Inc.
Madison Energy Consultants
Energy and Environmental Economics, Inc.
EPRI
The Regulatory Assistance Project
Copyright © 2004 Electricity Innovation Institute, Inc. All rights reserved.
iii
CITATIONS
This report was prepared by
John Nimmons & Associates, Inc. 175 Elinor Avenue, Suite G Mill Valley, CA 94941
Principal Investigator J. Nimmons
Madison Energy Consultants 21 Ferndale Street Madison, NJ 07940
Principal Investigator J. Torpey
Energy and Environmental Economics, Inc. 353 Sacramento Street, Suite 1700 San Francisco, CA 94111
Principal Investigator S. Price
EPRI 3412 Hillview Avenue Palo Alto, CA 94304-1395
Principal Investigator D. Rastler
The Regulator Assistance Project 50 State Street Montpelier, VT 05602
Principal Investigators R. Weston R. Sedano W. Shirley
This report describes research sponsored by the Electricity Innovation Institute (E2I) and its partners: California Energy Commission, New York State Energy Research and Development Authority, Tennessee Valley Authority, City Public Service, and Massachusetts Technology Collaborative.
The report is a corporate document that should be cited in the literature in the following manner:
A Framework for Developing Collaborative DER Programs: Working Tools for Stakeholders: Report of the E2I Distributed Energy Resources Public/Private Partnership, E2I, Palo Alto, CA: 2004. 1011026.

v
REPORT SUMMARY
The electricity system of the future will have greater reliability, security, and customer flexibility thanks, in part, to distributed energy resources (DER) integrated throughout the system. DER in the form of innovative technologies for power generation, storage, and demand response will be located near the point of use to meet specific customer needs and support the electricity delivery system. While the vision of the future electricity infrastructure is broadly shared, the pathway to the future is not. The integration of DER has lagged far behind expectations. One of the most significant barriers is the manner in which the electricity industry was built and historically operated—central stations generating power that is delivered directly to customers under a heavily regulated, vertically integrated market.
The Electricity Innovation Institute (E2I) formed the Distributed Energy Resources Public/Private Partnership to bring stakeholders together to address the key barriers to DER market integration. A prior scoping study recommended that the Partnership focus on identifying win-win opportunities for DER integration, where multiple stakeholders benefit and no stakeholder is harmed. A win-win DER application may be located at a customer site, providing benefits to the customer as well as benefits to the electricity system. The goals of this phase of the DER Partnership Market Integration Platform were threefold: (1) develop a catalog of actions that utilities and regulators can take to incentivize DER that adds value to the electricity system, (2) examine the costs and benefits of DER and how they can be allocated across stakeholder groups to achieve win-win outcomes, and (3) create a framework for collaborative development of DER pilot programs.
Results & Findings The report provides a catalog of incentives and approaches that states and utilities are already taking to facilitate DER as well as insights on how to develop new and innovative approaches. The project team developed a model to calculate the costs and benefits of DER to each stakeholder group (customer, utility shareholder and other ratepayers, and society). The report describes the model and the costs and benefits from each stakeholder’s perspective and examines approaches for allocating them to achieve win-win outcomes. Finally, the report offers a framework for collaboratively developing innovative DER pilot programs in jurisdictions or states to encourage win-win DER integration.
Challenges & Objectives The challenge of DER is to bring typically adversarial players together as collaborators to create legitimate, accepted, and mutually beneficial results and win-win opportunities. Stakeholders in the electricity enterprise stand to benefit by working together to develop win-win solutions. Utility companies will benefit from expanded opportunities for DER to solve immediate energy problems for customers and to cost-effectively overcome capacity shortages, relieve power delivery congestion, and increase the grid’s reliability.
vi
Energy customers will benefit from greater opportunities to choose DER for reliability, power quality, and energy cost control. Regulators will benefit from providing more opportunities for customer choice and for serving customer and grid needs simultaneously. DER suppliers will see increased market opportunities for their products.
Applications, Values & Use This reference document will help stakeholders collaboratively achieve win-win DER opportunities. The collaborative process ensures legitimacy, acceptance, and mutual benefit. The new tool quantifies DER costs and benefits and can be used to examine ways to allocate the costs and benefits among stakeholders for win-win solutions. The framework will enable creative rate approaches and regulatory incentives that specifically target value-adding DER.
E2I Perspective E2I’s public/private partnership approach draws on stakeholders representing all aspects of the DER arena, including utilities, government and regulatory entities, DER suppliers and manufacturers, customers, and non-governmental organizations. E2I’s role is to assemble these players in a collaborative partnership environment and stimulate the best use of stakeholder and project team resources, knowledge, and skills to achieve new and innovative results. By enabling new ways to optimize benefits for multiple stakeholders, this framework report provides constructive ways to communicate and cooperate among stakeholders. It will lead to innovative departures from business as usual in DER markets.
Partners of the E2I DER Partnership Market Integration Platform include the California Energy Commission, the New York State Energy Research and Development Authority, the Tennessee Valley Authority, City Public Service of San Antonio, and the Massachusetts Technology Collaborative.
Approach The E2I project team researched DER incentives and programs offered in several states. After examining these existing approaches and understanding how utility rates impact DER adoption, the team recommended ways to create new and innovative incentive programs. The team also developed a cost-benefit model to capture the costs and benefits and to demonstrate how each stakeholder may benefit from DER and how benefits may be allocated to create win-win solutions. The project team created the framework for stakeholder collaboration based on an understanding of how stakeholders could partner to achieve more than individuals can achieve on their own.
Keywords Distributed energy resources Distributed generation Market integration
vii
ABSTRACT
Distributed energy resources (DER) will be integrated throughout the electricity system of the future, helping provide greater reliability, security, and customer flexibility. While the vision of the future electricity infrastructure is broadly shared, the integration of DER has lagged far behind expectations. The Electricity Innovation Institute (E2I) formed the Distributed Energy Resources Public/Private Partnership to bring stakeholders together to address the key barriers to DER market integration. A prior scoping study recommended that the Partnership focus on identifying win-win opportunities for DER integration, opportunities where multiple stakeholders benefit and no stakeholder is harmed. The goals of this phase of the DER Partnership Market Integration Platform were threefold: (1) develop a catalog of actions that utilities and regulators can take to incentivize DER that adds value to the electricity system, (2) examine the costs and benefits of DER and how they can be allocated across stakeholder groups to achieve win-win outcomes, and (3) create a framework for collaborative development of DER pilot programs.
To meet these objectives, the E2I project team researched DER incentives and programs existing in several states and developed ways to create new and innovative incentive programs. The team also developed a cost-benefit model to capture the costs and benefits and to demonstrate how each stakeholder may benefit from DER and how benefits may be allocated to create win-win solutions. The project team created a framework for stakeholder collaboration based on an understanding of how stakeholders could partner to achieve more than individuals can achieve on their own. This report catalogs the existing DER programs and recommends innovative ways to create new incentive programs. The report also describes the cost-benefit model, the costs and benefits from each stakeholder’s perspective, and examines approaches for allocating them to achieve win-win outcomes. Finally, the report offers a framework for collaboratively developing innovative DER pilot programs in jurisdictions or states to encourage win-win DER integration.

ix
EXECUTIVE SUMMARY
Distributed energy resources (DER) have the potential to bring multiple benefits to energy users, utilities and their customers, DER providers, and the electricity enterprise as a whole. Some of these benefits include enhanced onsite energy efficiency, reliability, power quality and cost control, more competitive options for customers to acquire energy, more efficient and less costly distribution system operations, more reliable distribution and bulk power functions, and lower and more stable wholesale and congestion prices.
The inability of today’s electricity markets to recognize and account for these benefits where they exist alone or in combination, has led the Electricity Innovation Institute (E2I) and a group of interested stakeholders to reexamine the processes for integrating DER into those markets. The goals of this collaborative effort are to:
• understand DER costs and benefits from various stakeholder perspectives
• create incentives that accurately reflect and fairly allocate these costs and benefits
• facilitate collaboratively-developed pilot programs that can show how to reduce DER costs and monetize benefits, and how to better integrate DER into prevailing electricity markets.
E2I is a non-profit affiliate of EPRI, chartered to conduct strategic research and development through public/private partnerships. E2I initiated the Distributed Energy Resources (DER) Public/Private Partnership to reduce barriers to DER deployment and to enable widespread DER integration where it brings value to the electricity enterprise.
The deployment of DER has lagged far behind the expectations of equipment manufacturers, regulators, and electricity consumers. Viable technologies are available. However, their installation and integration into the power grid is not always straightforward or inexpensive. Questions about environmental impacts add complexity to decisions. Furthermore, market structures and traditional rate of return regulation and rate design do not encourage electric utility companies to support DER deployment, even when there may be benefits to the electric power system. E2I has assembled key public and private partners and stakeholders to work collaboratively to solve these issues. Partners include Ameren, the California Energy Commission, City Public Service, San Antonio, the U.S. Department of Energy, Massachusetts Technology Collaborative, the New York Independent System Operator, the New York Power Authority, the New York State Energy Research and Development Authority, and the Tennessee Valley Authority. Stakeholders include the California Public Utilities Commission, the Ohio Public Utilities Commission, the Oregon Public Utilities Commission, the New York Public Utilities Commission, Southern California Edison, Exelon, RealEnergy, Northern Power Systems, the Silicon Valley Manufacturers Group, Solar Turbines, Cummins, UTC Fuel Cells, STM Power, ASCO, Siemens Westinghouse, the National Association of State Energy Offices (NASEO), and Colorado Office of Energy.
Executive Summary
x
The Partnership comprises two platforms: DER Market Integration to look at market barriers to DER, and DER Environmental Benefits/Impacts to conduct an objective analysis of the environmental impacts of widespread DER. The DER Market Integration work is the subject of this report.
The E2I DER Partnership defines distributed energy resources (DER) as small (usually less than but not limited to 10 MW) energy generation or storage resources located near the load. Technologies may include but are not limited to small gas turbines, microturbines, reciprocating engines, fuel cells, external combustion machines, flywheels, and photovoltaics. DER may also include demand response or reduction in load.
This is the second of two reports prepared by E2I’s DER Partnership and its team of consultants. The first was a scoping study1 performed during the Spring of 2003. Its purpose was to establish a current baseline of DER market conditions in key states; identify the elements of win-win business approaches; and recommend research actions that could lead to more widespread integration of DER into larger electricity markets. The scoping study included interviews with DER stakeholders, a review of recent DER developments in California, New York and New Jersey; and stakeholder-supported research and action recommendations to advance market integration of value-driven DER.
The highest priority recommendations to emerge from that study were:
• to develop a catalog of actions that utilities and regulators can take to incentivize DER that adds value to the electricity enterprise;
• to examine the costs and benefits of DER, and how utility rate structures and incentive approaches affect their allocation among key stakeholders; and
• to develop a framework for flexible, collaborative programs to refine and improve existing incentive approaches and implement new ones in several states.
The work reflected in this report is the next step in that process. Chapter 1 begins by cataloguing some of the approaches and incentives that states and utilities are already taking to facilitate DER (and related demand response) that adds value for electric systems and their customers. The chapter offers insights about what has been tried to date, and starting points for designing the kind of win-win incentives favored by participants in E2I’s DER Partnership, to be implemented through collaborative stakeholder programs proposed for 2004-05.
Chapter 1 organizes current approaches according to the primary interests on which each one focuses. For discussion purposes, these include the interests of the distribution utility, the bulk power utility, the DER customer, and society at large (comprised of non-participating utility customers as well as broader environmental and public interests).
1 Integrating Distributed Energy Resources Into Emerging Electricity Markets: Scoping Study – Report of the
E2I Distributed Energy Resources Public/Private Partnership; E2I, Palo Alto, CA; August 2004. 1011030.
Executive Summary
xi
The report posits that the distribution utility’s central focus is to enhance distribution system reliability through cost-effective asset deployment. Regulators and utilities have tried various approaches to DER in pursuit of these objectives, including:
1. requiring jurisdictional utilities to evaluate DER as an alternative to system upgrades, and to develop or procure DER solutions where they represent least-cost or best-fit solutions;
2. targeting incentives to reflect the value that DER can bring to specific local areas or circuits on the utility grid;
3. using customer-sited equipment to improve grid reliability; and
4. rewarding customers for scheduling their loads to support grid operations.
The bulk power utility’s focus for DER is likely to be mitigating wholesale prices and/or relieving transmission congestion. Approaches pursued by regulators and utilities for these purposes have included:
1. facilitating or installing DER that can be dispatched to relieve pressure on locational marginal prices (where available), or to reduce peak transmission costs as an alternative to firm peaking service;
2. purchasing 25-50 MW or more of DER from third-party aggregators who contract directly with customers to assemble supply and demand resources responsive to utility needs; and
3. paying customers (including retail utilities as well as commercial, industrial and residential users) to curtail their loads at critical times, and dispatching aggregated load control as a system resource.
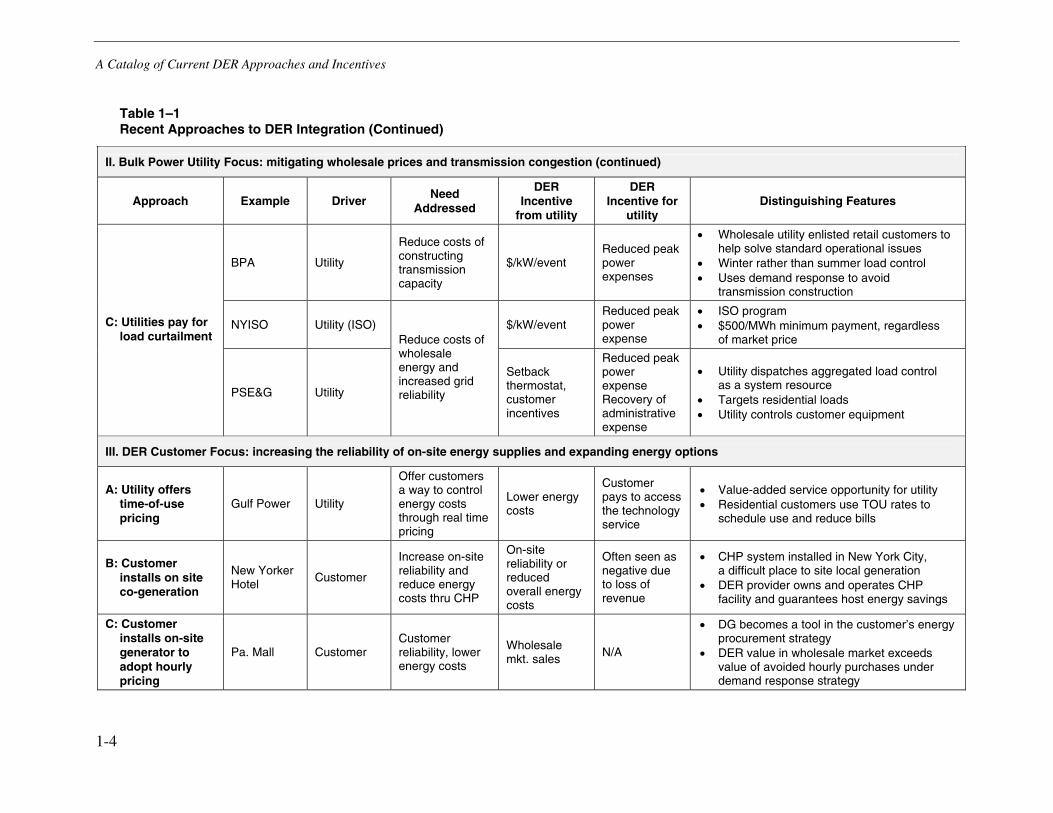
The DER customer’s focus is usually to increase reliability and reduce energy costs through onsite energy supplies, and/or to expand the energy and financial options available to it. Utilities, DER providers and customers have pursued these objectives through approaches such as:
1. value-added time-of-use pricing services that enable customers to schedule their electricity usage to reduce their bills;
2. installation and operation of onsite cogeneration systems with guaranteed savings for the host facility; and
3. adoption of onsite generation that increases site reliability and reduces net energy costs by taking advantage of hourly pricing options to profit from sales into wholesale markets.
Finally, the regulatory and societal focus for DER is to increase the efficiency of energy production, delivery, and use and improve environmental quality. Approaches adopted toward these ends include:
1. customer rebates and equipment buy downs for renewable, ‘ultra-clean’ or highly efficient DER, and/or combined heat and power (CHP) projects meeting specified criteria; and
2. portfolio standards that require utilities and other load-serving entities to acquire some minimum percentage of diversified renewable resources, including distributed renewables.
Executive Summary
xii
Chapter 1 presents specific examples where each of these approaches has been used, describes the programs that have used them and the nature of any incentives employed, and highlights the features that distinguish each example from other similar programs.
Chapter 2 of the report begins to address the next priority recommendation made by E2I’s stakeholders: to examine the costs and benefits of DER, and how utility rate structures and incentive approaches affect their allocation among key stakeholders for purposes of achieving win-win outcomes.
In examining DER costs and benefits, the first step is to recognize that a cost to one stakeholder may be a benefit to another, and to distinguish among different stakeholder perspectives. These perspectives include that of the DER customer, other (‘non-participating’) utility customers, utility shareholders, and society at large.2 To assess the cost-effectiveness3 of various activities from different stakeholder perspectives, regulators employ different tests, summarized as follows:
• the Participant Cost Test (PCT) reveals whether it is worth it to the customer to install DER
• the Ratepayer Impact Measure (RIM) assesses the impact of DER on utility earnings or rates
• the Total Resource Cost Test (TRC) measures the net tangible benefit available to be reallocated in order to produce a win-win solution
• the Societal Cost Test (SCT) identifies any additional societal costs and benefits available from the DER, including externalities (such as reduced pollutant emissions).
The reason to consider all perspectives is to find solutions that can be cost-effective or ‘winners’ for multiple stakeholders. Looking at all perspectives also aids in program design. For example, one possible allocation method is to establish an incentive (say, a locational credit) that the utility pays to the DER provider – i.e., a cost to the utility and a benefit to the DER provider. A win-win program design in this case would set the incentive payment at a level that would make both the utility’s ratepayers and the program participant better off. Stated in terms of the cost-effectiveness tests used by regulators, both the RIM and the PCT benefit/cost ratios are greater than one. Mechanisms that strike such a balance will warrant further consideration.
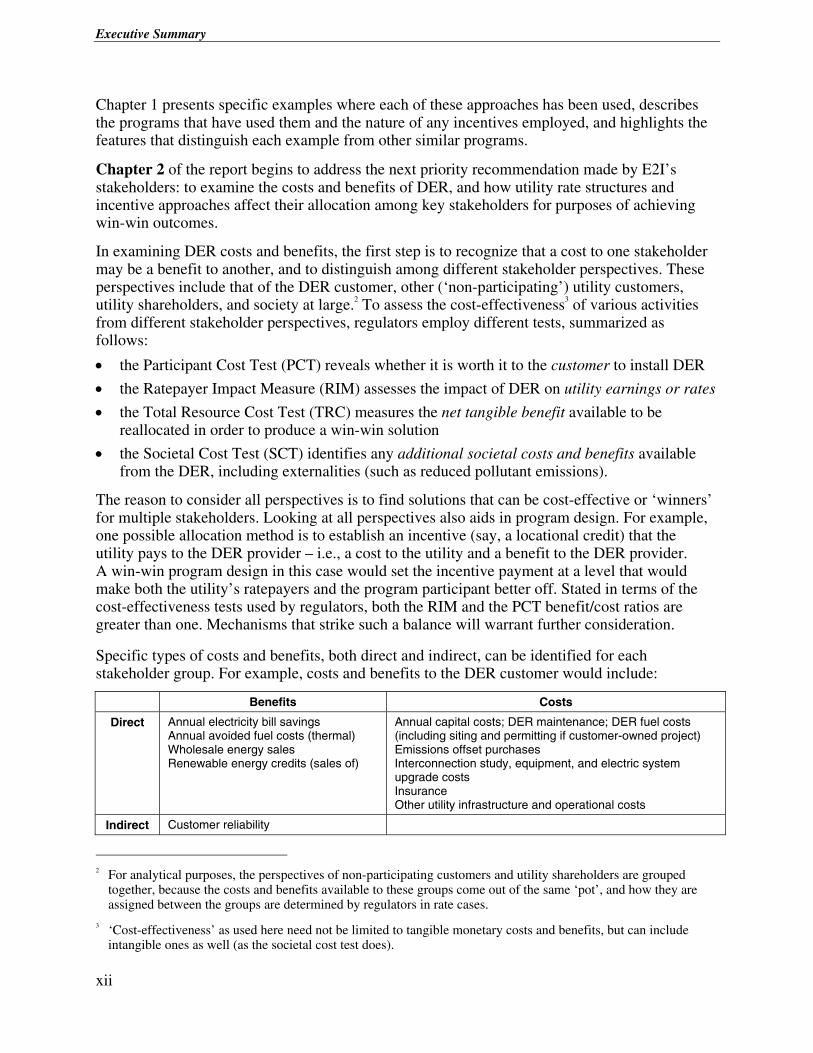
Specific types of costs and benefits, both direct and indirect, can be identified for each stakeholder group. For example, costs and benefits to the DER customer would include:
Benefits Costs
Direct Annual electricity bill savings Annual avoided fuel costs (thermal) Wholesale energy sales Renewable energy credits (sales of)
Annual capital costs; DER maintenance; DER fuel costs (including siting and permitting if customer-owned project) Emissions offset purchases Interconnection study, equipment, and electric system upgrade costs Insurance Other utility infrastructure and operational costs
Indirect Customer reliability
2 For analytical purposes, the perspectives of non-participating customers and utility shareholders are grouped
together, because the costs and benefits available to these groups come out of the same ‘pot’, and how they are assigned between the groups are determined by regulators in rate cases.
3 ‘Cost-effectiveness’ as used here need not be limited to tangible monetary costs and benefits, but can include intangible ones as well (as the societal cost test does).
Executive Summary
xiii
Chapter 2 presents similar benefit/cost tables from the perspectives of other stakeholders (the utility, society, etc.), followed by more detailed descriptions of each cost and benefit category relevant to each stakeholder.
Once a qualitative set of costs and benefits is identified from each stakeholder’s perspective, the next steps are to quantify them, and to determine whether various combinations of them can yield net benefits that might be re-allocated among the stakeholders to achieve outcomes that benefit all or most of them, without harming others. While it is possible to (and Chapter 2 does) identify generic types of costs and benefits related to DER activities, their value to groups of interested stakeholders depends to a great extent on factors specific to each regulatory jurisdiction, each utility and tariff structure, each DER technology and its operational and emissions characteristics, financing strategy, etc. All of these inputs are needed to realistically approximate the quantitative values that any DER project or program (consisting of multiple projects) can generate for groups of stakeholders.4
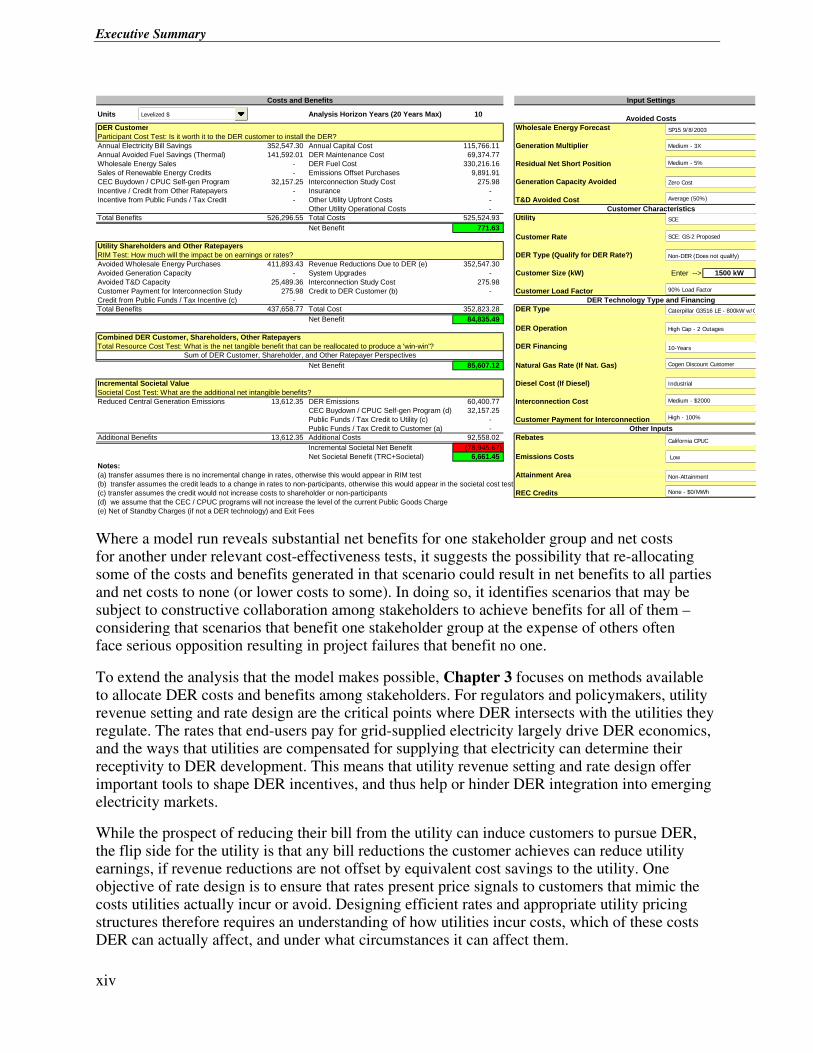
E2I has not attempted to design an analytical model that will accommodate all regulatory jurisdictions, all utility tariffs, or all DER technology and project characteristics. However, its team has developed an Excel spreadsheet model that illustrates an analytical approach that can be adapted to all of these situations. To keep this version of the model manageable and affordable, it focuses on a single jurisdiction (California) and its three major investor-owned utilities (Pacific Gas & Electric, Southern California Edison, and San Diego Gas & Electric). The spreadsheet uses actual rate structures and tariffs now in effect or proposed for these utilities, and actual regulatory incentives in place in California in 2003. For other inputs, such as generation and transmission and distribution (T&D) avoided costs, interconnection costs, generation multiplier, and emissions control costs, it allows users to enter ranges of value (e.g., low, medium or high, each corresponding to a specified dollar amount or numeric multiplier).
The model structure enables users to vary numerous inputs relevant to DER projects to see how they affect the costs and benefits flowing to each of the stakeholder groups identified above. Its output reveals which stakeholders profit and which ones pay for different combinations of DER technologies under differing assumptions concerning energy prices, T&D deferral or ‘generation multiplier’ value, emissions profiles, financing terms, operational characteristics, available incentives, etc. A sample of the model’s output summary, also showing the kinds of input settings available to users, appears on page xiv.
4 Determining these values and their potential for tradeoffs among stakeholders is a very different exercise than
estimating the value of a specific DER project to an individual DER customer, site host or owner/operator. EPRI and others have developed models for that purpose, and their objectives and functions are different from those described here.
Executive Summary
xiv
Costs and Benefits Input Settings
Units Analysis Horizon Years (20 Years Max) 10 Avoided CostsDER Customer Wholesale Energy ForecastParticipant Cost Test: Is it worth it to the DER customer to install the DER?Annual Electricity Bill Savings 352,547.30 Annual Capital Cost 115,766.11 Generation MultiplierAnnual Avoided Fuel Savings (Thermal) 141,592.01 DER Maintenance Cost 69,374.77 Wholesale Energy Sales - DER Fuel Cost 330,216.16 Residual Net Short PositionSales of Renewable Energy Credits - Emissions Offset Purchases 9,891.91 CEC Buydown / CPUC Self-gen Program 32,157.25 Interconnection Study Cost 275.98 Generation Capacity AvoidedIncentive / Credit from Other Ratepayers - Insurance - Incentive from Public Funds / Tax Credit - Other Utility Upfront Costs - T&D Avoided Cost
Other Utility Operational Costs - Customer CharacteristicsTotal Benefits 526,296.55 Total Costs 525,524.93 Utility
Net Benefit 771.63 Customer Rate
Utility Shareholders and Other RatepayersRIM Test: How much will the impact be on earnings or rates? DER Type (Qualify for DER Rate?)Avoided Wholesale Energy Purchases 411,893.43 Revenue Reductions Due to DER (e) 352,547.30 Avoided Generation Capacity - System Upgrades - Customer Size (kW) Enter --> 1500 kWAvoided T&D Capacity 25,489.36 Interconnection Study Cost 275.98 Customer Payment for Interconnection Study 275.98 Credit to DER Customer (b) - Customer Load FactorCredit from Public Funds / Tax Incentive (c) - DER Technology Type and FinancingTotal Benefits 437,658.77 Total Cost 352,823.28 DER Type
Net Benefit 84,835.49 DER Operation
Combined DER Customer, Shareholders, Other RatepayersTotal Resource Cost Test: What is the net tangible benefit that can be reallocated to produce a 'win-win'? DER Financing
Sum of DER Customer, Shareholder, and Other Ratepayer PerspectivesNet Benefit 85,607.12 Natural Gas Rate (If Nat. Gas)
Incremental Societal Value Diesel Cost (If Diesel)Societal Cost Test: What are the additional net intangible benefits?Reduced Central Generation Emissions 13,612.35 DER Emissions 60,400.77 Interconnection Cost
CEC Buydown / CPUC Self-gen Program (d) 32,157.25 Public Funds / Tax Credit to Utility (c) - Customer Payment for InterconnectionPublic Funds / Tax Credit to Customer (a) - Other Inputs
Additional Benefits 13,612.35 Additional Costs 92,558.02 RebatesIncremental Societal Net Benefit (78,945.67) Net Societal Benefit (TRC+Societal) 6,661.45 Emissions Costs
Notes:(a) transfer assumes there is no incremental change in rates, otherwise this would appear in RIM test Attainment Area 2(b) transfer assumes the credit leads to a change in rates to non-participants, otherwise this would appear in the societal cost test(c) transfer assumes the credit would not increase costs to shareholder or non-participants REC Credits(d) we assume that the CEC / CPUC programs will not increase the level of the current Public Goods Charge(e) Net of Standby Charges (if not a DER technology) and Exit Fees
SCE
SP15 9/8/2003
SCE: GS-2 Proposed
Caterpillar G3516 LE - 800kW w/C
Non-DER (Does not qualify)
90% Load Factor
Zero Cost
Average (50%)
10-Years
High Cap - 2 Outages
Cogen Discount Customer
Low
Medium - 3X
Industrial
Medium - 5%
California CPUC
Medium - $2000
High - 100%
None - $0/MWh
Levelized $
Non-Attainment
Where a model run reveals substantial net benefits for one stakeholder group and net costs for another under relevant cost-effectiveness tests, it suggests the possibility that re-allocating some of the costs and benefits generated in that scenario could result in net benefits to all parties and net costs to none (or lower costs to some). In doing so, it identifies scenarios that may be subject to constructive collaboration among stakeholders to achieve benefits for all of them – considering that scenarios that benefit one stakeholder group at the expense of others often face serious opposition resulting in project failures that benefit no one.
To extend the analysis that the model makes possible, Chapter 3 focuses on methods available to allocate DER costs and benefits among stakeholders. For regulators and policymakers, utility revenue setting and rate design are the critical points where DER intersects with the utilities they regulate. The rates that end-users pay for grid-supplied electricity largely drive DER economics, and the ways that utilities are compensated for supplying that electricity can determine their receptivity to DER development. This means that utility revenue setting and rate design offer important tools to shape DER incentives, and thus help or hinder DER integration into emerging electricity markets.
While the prospect of reducing their bill from the utility can induce customers to pursue DER, the flip side for the utility is that any bill reductions the customer achieves can reduce utility earnings, if revenue reductions are not offset by equivalent cost savings to the utility. One objective of rate design is to ensure that rates present price signals to customers that mimic the costs utilities actually incur or avoid. Designing efficient rates and appropriate utility pricing structures therefore requires an understanding of how utilities incur costs, which of these costs DER can actually affect, and under what circumstances it can affect them.
Executive Summary
xv
Table 3-1 in Chapter 3 provides this kind of information. It shows that DER can reduce costs for a subset of the total costs that a utility must recover from its customers. However, utility rates are designed to recover the total costs plus a reasonable return on utility investment. This means that customer bill reductions from DER that are not tied to the subset of costs actually reduced can exceed the true savings available to the utility (especially for “wires-only” utilities that capture no savings from reduced generation capacity and energy). Because mismatches can occur between customer bill reductions and utility cost savings, utilities are sometimes averse or at least disinclined to promote DER. To minimize this source of disincentives, it is important that regulators set policies and design rates that align customer bill savings with utility cost savings, so that utility and customer interests move in the same direction.
Basic rate forms that can make it easier or harder to align these interests include volumetric (energy) charges, fixed charges, and demand charges. Rate designs with high fixed and/or demand charges help ensure utility cost recovery independent of customer energy usage, so they minimize utility financial incentives to oppose DER. On the other hand, these rate forms provide weak price signals or none at all that would induce customers to adopt DER that could benefit the system, the environment or other ratepayers, and they make it difficult or impossible for customers to capture economic benefits from DER, limiting DER deployment to ‘super’ cost-effective resources.
The argument for large fixed-cost rate components rests on the idea that many utility costs (especially for wires-only utilities) do not vary much in the short run, and that short-run marginal delivery costs are often very low, sometimes approaching zero. However, many of those same costs can vary in the long run, and it is important to recognize this in setting fixed charges. One option is to base fixed charges on long-run marginal costs, and to use alternative methods of setting revenues and allocating risks to address concerns about utility revenue collection and stability. These methods can provide strong profit incentives for utilities to maximize their own efficiency as well as that of their customers.
Two such methods discussed in the report include ‘demand subscription’ and non-firm standby options. Both offer alternatives to conventional standby charges that often discourage DER development. Standby rates typically assume that the utility retains its obligation to supply the customer’s load when the customer’s onsite generation is down for maintenance or unscheduled outages. Demand subscription and non-firm rates instead assume that customers should be able to choose the level of standby they need for their operations. For DER customers that do not require firm service or do not value it highly, demand subscription offers a way to pay only for the capacity they do need and value, accepting some level of risk in return for reduced costs. For small DER customers whose back-up requirements would not drive T&D peaks in any case, non-firm service offers a way to secure back-up service for most times of the year, except possibly during periods of utility peak demand. Both alternatives to conventional standby rates also expand DER customer choices, without imposing the costs of these choices on other stakeholders.
A third method that can help align utility and DER customer interests is a ‘two-part’ rate form that protects utility revenues while providing price signals to customers to help control utility costs. This rate form collects the customer’s historical billing, but it also charges for increased usage (or credits reduced usage) at the utility’s marginal cost – i.e., the cost of expanded facilities avoided or deferred through customer DER initiatives.
Executive Summary
xvi
If DER benefits are large enough, these rate innovations can help customer-side DER into the marketplace without prejudicing utility shareholders or non-participating customers. However, the modeling tool described above suggests that, at least using current California rate assumptions and today’s technology costs and benefits, DER may require more leverage to significantly penetrate electricity markets. One way to obtain that leverage is to explicitly recognize additional DER values where they exist.
This can be done in various ways. California now requires utilities to consider DER as an alternative to distribution upgrades, and to take steps to procure it where it appears to offer a least-cost solution. New York requires its utilities to evaluate DER for T&D projects whose costs exceed certain benchmarks, and oversees a pilot program that requires utility RFPs to procure DER where it can defer T&D capacity needs. Costs that utilities incur for prudent DER procurement, including the costs of any incentives needed to direct DER to high-value areas, can be funded from utility transmission or distribution budgets, and capitalized like traditional plant investments to protect utility shareholders.
Another way to capture additional values offered by some DER is to monetize the societal costs of emissions. In that case, benefits accruing from clean DER technologies could be paid for out of ‘public goods’ or ‘system benefit’ surcharges levied on all utility sales in some jurisdictions. Utility shareholders are not harmed because such funds are already earmarked for public interest programs and funded through a dedicated rate component, and utility earnings are unaffected. Other options to capture potential DER benefits include recognition of a ‘generation multiplier’ effect where DER operations can lower market clearing prices for all customers, and provide more efficient market rules for energy, capacity and ancillary service markets. These could encourage transparent markets where DER customers are easily compensated for the societal or system value their resources provide, or assure that a day-ahead bidding system accommodates customer resources.
Chapter 3 closes with a brief discussion of higher-level regulatory changes such as revenue-based/performance-based ratemaking (PBR) that could replace utility incentives to resist DER, with incentives to encourage it where it adds value. It also suggests that there is some room for regulatory experimentation at this stage of DER development, and describes some alternative arrangements to implement DER opportunities that benefit multiple stakeholders.
Chapter 4 addresses the final high priority recommendation of E2I’s stakeholder group, to initiate flexible, collaborative pilot programs in several states to refine and improve existing incentive approaches and implement new ones. Chapter 4 begins that process by offering a framework for developing such programs. The framework builds on the catalog of approaches presented in Chapter 1, the DER cost/benefit descriptions and modeling tool, and the discussion of utility costs and rate designs to outline ways that willing stakeholders can collaborate to develop innovative pilot programs based on these tools.
Depending on the utility system and its customers, these pilot programs might provide anywhere from a few megawatts to a few thousand. They might involve some minimum number of customers, or some threshold level of demand reduction or curtailment. They will likely include multiple individual DER installations employing diverse technologies, which may remain in place and continue to provide benefits long after the formal pilot program ends. By developing solid experience with various forms of DER incentive approaches under real-world conditions,
Executive Summary
xvii
these programs should also serve as thoughtful models that other jurisdictions can cost-effectively replicate, adapt to local conditions, and improve over time. In the end, the approach described in the framework can not only facilitate collaboration on limited pilot programs, but can provide a solid foundation for more wide-ranging DER market integration efforts.
The pilot programs E2I envisions can be much more than DER technology demonstrations. They can also demonstrate:
• the added value that DER can bring to the electricity enterprise
• more constructive ways for DER participants to communicate and cooperate
• new ways to optimize benefits for multiple stakeholders
• creative rate design and other regulatory incentives targeted specifically to encourage DER that adds value beyond conventional electricity supply
• innovative departures from ‘business as usual’ in the DER marketplace
The framework is organized in four parts. The first deals with structuring the collaborative process and defining the program’s scope and objectives. The second introduces basic strategies for participants to consider in developing programs, and outlines the stakeholder needs that each strategy can address. The third part discusses options available to tailor each basic strategy to local conditions. And the final part presents a detailed example showing how the framework approach, the catalog and rate discussion discussed above, and the cost/benefit modeling tool can be combined to evaluate a potential CHP pilot project or program.
Important questions to ask in structuring such a collaborative include the following, all of which are discussed in the report:
• Which stakeholders should participate, and how?
• What are the collaborative’s structure and ground rules, and how can it establish trust among the participants?
• What are the collaborative’s objectives and priorities, and what can it accomplish that the state’s or the utilities’ ongoing DER activities cannot or have not?
• How will the collaborative measure results and evaluate success?
• How can it foster innovation and experimentation?
Once these considerations have been addressed, participating stakeholders can use the framework to outline projects that can meet their defined objectives and advance their priorities, and can form project teams to move forward with actual programs.
The framework outlines three basic strategies for consideration by collaborative participants. These include –
1. Leveraging DER value by recognizing multiple value streams that today’s markets may not;
2. Introducing efficient incentives to facilitate and deploy DER in those situations; and
3. Eliminating barriers to DER that inhibit innovation, but serve little public purpose.

Executive Summary
xviii
Leveraging DER value refers to approaches that capture and allocate among stakeholders multiple value streams that can flow from DER selected, sited, sized, and operated to create value for more than one group of stakeholders. The description of DER costs, benefits and allocation, and the modeling tool described earlier can help participants develop a common understanding of what those value streams are, what they are worth, and what it means to allocate them in different ways. This modeling tool enables participants to tailor their assumptions and analysis until they are comfortable with its objectivity and accuracy, and to assess a variety of impacts easily and with some confidence in the results.
Introducing efficient incentives refers to initiatives that send price signals to utilities, end-users, and DER providers that better reflect the true costs and benefits of DER solutions in specific situations. The review of these issues in Chapter 3 and some of the program examples presented in Chapter 1 should help frame this discussion.
Eliminating barriers here refers to eliminating or reducing obstacles to DER siting, installation, operation, and value recognition in the market. It includes minimizing transactions costs for all participants, from project inception to completion. Examples are presented later in the framework discussion.
These three strategies overlap at times, and are not mutually exclusive. Collaborative programs that incorporate some or all of them should make it easier for utilities to signal where DER adds value to their systems. They should also help end-users adopt DER solutions that supplement and reinforce utility service, while serving their own interests and benefiting other stakeholders.
Chapter 4 provides tables illustrating how the three basic strategies relate to the needs of each key stakeholder group, and where each strategy might be used to shape collaborative programs that meet those needs. Since these strategies are general in nature the discussion also presents more specific options to tailor each of them to local needs, with the hope that participants will be able to address not only the interests of individual stakeholder groups, but the common or complementary interests of all groups.
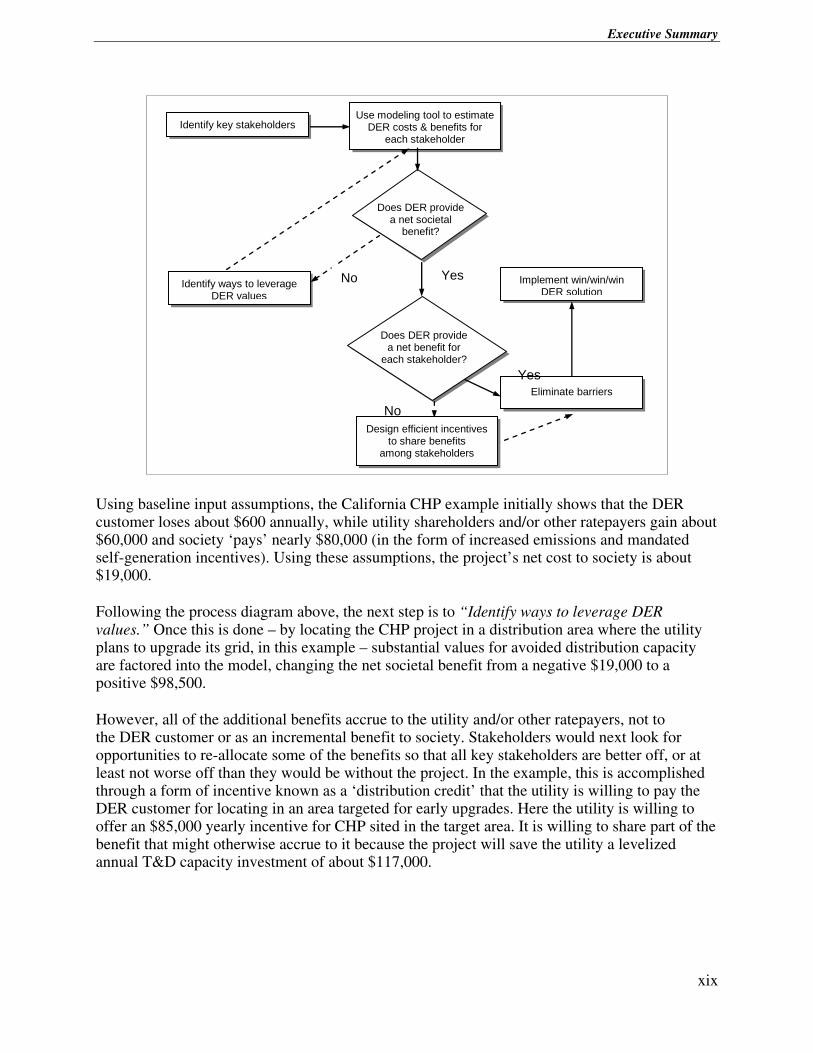
Chapter 4 concludes with a detailed example illustrating how the framework approach can work when applied to a sample combined heat and power (CHP) project in California. The process to identify, leverage and reallocate costs and benefits is shown on page xix.
Executive Summary
xix
No Yes
Identify key stakeholders Use modeling tool to estimate
DER costs & benefits for each stakeholder
Identify ways to leverage DER values
Implement win/win/win DER solution
Does DER provide a net societal
benefit?
Does DER provide a net benefit for
each stakeholder?
Eliminate barriers
Design efficient incentives to share benefits
among stakeholders
No Yes
Using baseline input assumptions, the California CHP example initially shows that the DER customer loses about $600 annually, while utility shareholders and/or other ratepayers gain about $60,000 and society ‘pays’ nearly $80,000 (in the form of increased emissions and mandated self-generation incentives). Using these assumptions, the project’s net cost to society is about $19,000.
Following the process diagram above, the next step is to “Identify ways to leverage DER values.” Once this is done – by locating the CHP project in a distribution area where the utility plans to upgrade its grid, in this example – substantial values for avoided distribution capacity are factored into the model, changing the net societal benefit from a negative $19,000 to a positive $98,500.
However, all of the additional benefits accrue to the utility and/or other ratepayers, not to the DER customer or as an incremental benefit to society. Stakeholders would next look for opportunities to re-allocate some of the benefits so that all key stakeholders are better off, or at least not worse off than they would be without the project. In the example, this is accomplished through a form of incentive known as a ‘distribution credit’ that the utility is willing to pay the DER customer for locating in an area targeted for early upgrades. Here the utility is willing to offer an $85,000 yearly incentive for CHP sited in the target area. It is willing to share part of the benefit that might otherwise accrue to it because the project will save the utility a levelized annual T&D capacity investment of about $117,000.
No
Yes
Executive Summary
xx
Because the project now provides a net benefit for each stakeholder, attention now turns to the third strategy – eliminating barriers – to increase the overall cost effectiveness of the project, possibly by shortening the time it takes to complete the project, reducing processing costs that result from unnecessary barriers, and looking for ways to work through transactional barriers. In this example, the barrier happens to be the disparity in financing periods between customer lease or purchase financing (typically short-term, up to 10 years), and utility financing (typically long-term, often recovered over a 30-year asset life). Increasing the DER financing term for the CHP equipment from 10 to 20 years reduces the customer’s annual equipment cost by nearly $37,000, increasing the net societal benefit by the same amount. If necessary to achieve a win-win outcome, this benefit in the first years of the project could also be re-allocated among other stakeholders whose participation is needed to make the project go forward.
The example discussed is only one of many that could be used to illustrate how the framework can be applied, and how the other elements described in this report – the catalog of approaches, the cost/benefit and allocation discussions, and the modeling tool – can be combined to shape collaborative DER programs.
xxi
CONTENTS
1 A CATALOG OF CURRENT DER APPROACHES AND INCENTIVES................................1-1
Introduction ...........................................................................................................................1-1
Descriptions of Recent Approaches to DER Market Integration ...........................................1-6
2 DER COSTS, BENEFITS, AND ALLOCATION ISSUES.......................................................2-1
Stakeholder Perspectives......................................................................................................2-3
Cost-Effectiveness Tests..................................................................................................2-4
Participant Cost Test....................................................................................................2-4
Rate-payer Impact Measure (RIM) ..............................................................................2-4
Total Resource Cost Test (TRC) .................................................................................2-5
Societal Cost Test........................................................................................................2-5
Cost and Benefit Tables..........................................................................................2-5
Allocation Issues ...................................................................................................................2-7
Incentives/Locational Credits............................................................................................2-7
Utility Rates ......................................................................................................................2-9
Customer Benefits of DER ..................................................................................................2-12
Annual Electricity Bill Savings ........................................................................................2-12
Natural Gas Costs .....................................................................................................2-14
Annual Avoided Fuel Costs ............................................................................................2-14
Wholesale Energy Sales ................................................................................................2-16
Renewable Energy Credits.............................................................................................2-16
Customer Reliability........................................................................................................2-17
Reliability Value for Customers..................................................................................2-18
Customer Costs of DER......................................................................................................2-20
Annual Capital Costs, DER Maintenance, and DER Fuel Costs ....................................2-20
Financing Assumptions..............................................................................................2-21
Emissions Offset Purchases...........................................................................................2-22
Interconnection Study, Equipment, and Electric System Upgrade Costs.......................2-23
xxii
Interconnection Study Costs......................................................................................2-23
Customer Interconnection Costs................................................................................2-23
Utility Upgrade Costs .................................................................................................2-23
Insurance........................................................................................................................2-24
Other Utility Infrastructure Costs and Operational Costs................................................2-24
Utility Benefits of DER.........................................................................................................2-24
Avoided Wholesale Energy Purchases ..........................................................................2-24
Generation Multiplier Effect........................................................................................2-27
Avoided T&D Capacity ...................................................................................................2-28
DER Value at Various Penetration Levels .................................................................2-32
Problems and Costs of Siting Transmission and Distribution ....................................2-34
Key Drivers of Distribution Deferral Value .................................................................2-34
Ideal Target Distribution Planning Area .....................................................................2-35
Realizing Deferral Benefits ........................................................................................2-35
Reduction of Losses ..................................................................................................2-35
Conclusions on Distribution Capacity ........................................................................2-36
Customer Payment for Interconnection Study Costs......................................................2-37
System Reliability ...........................................................................................................2-37
Reliability Value for Utilities........................................................................................2-38
Other T&D System Benefits ...........................................................................................2-40
Voltage Support .........................................................................................................2-40
Voltage Regulation ....................................................................................................2-41
Reactive Power Support ............................................................................................2-41
Equipment Life Extension ..........................................................................................2-41
Reduced Facility Maintenance...................................................................................2-42
Utility Costs of DER.............................................................................................................2-43
Revenue Reduction Due to DER....................................................................................2-43
Interconnection Study and Equipment Costs .................................................................2-43
System Upgrades ...........................................................................................................2-43
Incentives to DER Customers ........................................................................................2-44
Total Resource Benefits of DER (Combining the Utility and DER Customer Perspectives) ......................................................................................................................2-45
Avoided Energy Purchases ............................................................................................2-45
Avoided Fuel Costs ........................................................................................................2-45
T&D Avoided Costs ........................................................................................................2-45
Executive Summary
xxiii
Increased Reliability .......................................................................................................2-45
Total Resource Costs of DER (Combining the Utility and DER Customer Perspectives) ......................................................................................................................2-45
Interconnection Studies, Equipment and Electric System Upgrades .............................2-45
Other Utility Infrastructure Costs and Operational Costs................................................2-45
Society Benefits of DER......................................................................................................2-46
Total Resource Benefit ...................................................................................................2-46
Reduced Central Station Emissions ...............................................................................2-46
Emission Reduction Credit Prices..............................................................................2-47
Abatement Equipment Costs .....................................................................................2-48
Reduced Facility Permitting Costs .............................................................................2-49
Avoided CO2 Emissions .............................................................................................2-49
DER Emissions..........................................................................................................2-50
Society Costs of DER..........................................................................................................2-51
Total Resource Cost.......................................................................................................2-51
DER Emissions...............................................................................................................2-51
Incentives/Locational Credits..........................................................................................2-51
Appendix 2-1: Natural Gas Price Forecasts ........................................................................2-52
Glossary ..............................................................................................................................2-54
3 UTILITY COSTS, RATES, AND REGULATORY INCENTIVES ............................................3-1
Introduction ...........................................................................................................................3-1
Utility Cost Drivers and Rate Design Approaches.................................................................3-2
Volumetric (Energy), Fixed, and Demand Charges...............................................................3-5
Volumetric (Energy) Charge .............................................................................................3-5
Fixed Charges ..................................................................................................................3-6
Demand Charges .............................................................................................................3-6
Short-Run Versus Long-Run Pricing ................................................................................3-6
Demand Subscription and Non-firm Standby ...................................................................3-7
Two-Part Rates .....................................................................................................................3-8
Recognizing Additional DER Benefits ...................................................................................3-8
Utility DER Planning and Area-Specific T&D Capacity Credits ........................................3-8
Monetizing and Incorporating Externality Costs Into Charges or Credits .........................3-9
Recognizing the ‘Generation Multiplier’ Effect..................................................................3-9
Realizing Societal Values of DER through Efficient Market Rules .................................3-10
xxiv
Higher-Level Regulatory Changes .................................................................................3-10
4 A FRAMEWORK FOR COLLABORATIVE DER PROGRAMS.............................................4-1
Introduction ...........................................................................................................................4-1
Structuring the Collaborative Process ...................................................................................4-3
Basic Program Strategies......................................................................................................4-6
Options for Tailoring Basic Strategies to Local Needs ........................................................4-12
Strategy One: Leveraging DER Value............................................................................4-12
Optional Approaches to Leverage DER Value ...............................................................4-13
Strategy Two: Introducing Efficient Incentives................................................................4-14
Optional Approaches to Introduce Efficient Incentives ...................................................4-14
Incentives to Customers and DER Providers to Install DER......................................4-14
Incentives to Utilities to Facilitate DER ......................................................................4-16
Strategy Three: Eliminating Barriers...............................................................................4-16
Addressing Permitting and Interconnection Barriers..................................................4-17
Emissions Permits.................................................................................................4-17
Land Use Permits..................................................................................................4-17
Building Permits ....................................................................................................4-17
Utility Interconnection............................................................................................4-18
Addressing Market Barriers...................................................................................4-18
Addressing Transactional Barriers ........................................................................4-18
Using the Cost Benefit Model to Evaluate a CHP Pilot .......................................................4-19
Step One: Leveraging DER Value..................................................................................4-22
Step Two: Designing Efficient Incentives .......................................................................4-24
Step Three: Eliminating Barriers.....................................................................................4-27
xxv
LIST OF FIGURES
Figure 2-1 Summary Output Sheet from Model .........................................................................2-1 Figure 2-2 Process for Identifying and Developing Win-Win DER Applications.........................2-2 Figure 2-3 Typical Range of Reported Values for Customer Value of Service (VOS) .............2-18 Figure 2-4 Range of Forward Electricity Prices for Delivery to NP15 ......................................2-25 Figure 2-5 Long-Term Forecast of Electricity Prices for Delivery to NP15...............................2-26 Figure 2-6 Historical and Projected Natural Gas Prices (Averaged Over Delivery Month) ......2-27 Figure 2-7 Distribution of MDCC Values for Four Utilities........................................................2-32 Figure 2-8 Range of Achievable MDCC with Significant DER Penetration..............................2-34 Figure 2-9 Representative Performance-Based (PBR) Reliability Incentives ..........................2-39 Figure 2-10 Average California ERC Prices 1999 – 2002 .......................................................2-48 Figure 4-1 Process to Identify, Leverage, and Reallocate DER Costs and Benefits ...............4-20 Figure 4-2 800 kW CHP Costs and Benefits, Before Leveraging or Reallocating ...................4-21 Figure 4-3 800 kW CHP Costs and Benefits, Leveraged with High T&D Value to the
Utility ................................................................................................................................4-24 Figure 4-4 800 kW CHP Costs and Benefits, Leveraged with High T&D Value to the
Utility, Partially Reallocated to the DER Customer through a ‘Distribution Credit’ ..........4-26 Figure 4-5 800 kW CHP Costs and Benefits, Leveraged with high T&D Value to the
Utility, Partially Reallocated to the DER Customer through a ‘Distribution Credit’, with 20-Year Financing ....................................................................................................4-27

xxvii
LIST OF TABLES
Table 1-1 Recent Approaches to DER Integration.....................................................................1-2 Table 1-2 New York Cost Thresholds for DG Distribution Deferrals ..........................................1-7 Table 1-3 Orange & Rockland TBB Incentives Recognizing Regional T&D Benefits ..............1-10 Table 1-4 CEC Emerging Renewables Program Rebates ......................................................1-24 Table 1-5 CPUC/IOU Self-Generation Incentive Program Rebates.........................................1-25 Table 2-1 Customer Costs and Benefits ....................................................................................2-5 Table 2-2 Utility Costs and Benefits...........................................................................................2-6 Table 2-3 Total Resource Costs and Benefits (Combining the Utility and DER Customer
Perspectives) .....................................................................................................................2-6 Table 2-4 Society Costs & Benefits ...........................................................................................2-7 Table 2-5 California IOU Self-Generation Incentive Program....................................................2-9 Table 2-6 Supplemental Standby Rates ..................................................................................2-11 Table 2-7 PG&E and SDG&E Standby Tariffs by Service Voltage Level ...............................2-11 Table 2-8 Fixed Charges .........................................................................................................2-13 Table 2-9 Demand Charge Variations .....................................................................................2-14 Table 2-10 Example Calculation of the Value of Waste Heat ..................................................2-15 Table 2-11 Value of Waste Heat Recovery ($ per kWh Generated)........................................2-15 Table 2-12 Summary of Outage Cost Determinants................................................................2-17 Table 2-13 Mid-Range Customer Value of Service (VOS) Estimates......................................2-19 Table 2-14 Maximum Outage Cost Estimates for Customer Types.........................................2-19 Table 2-15 Average Costs and Operating Characteristics of DER Technologies....................2-21 Table 2-16 BAAQMD Combustion of Fuel Permit Fees...........................................................2-22 Table 2-17 BAAQMD Major Station Source Fees....................................................................2-22 Table 2-18 Plant Cost and Performance Data for a 500 MW Combined Cycle GT .................2-26 Table 2-19 Customer Mix, Residential Rate and kWh Use, and Employment.........................2-29 Table 2-20 Sales, Peak, and Substations................................................................................2-31 Table 2-21 Descriptive Statistics for 1994 MDCC ($/kW) by Utility..........................................2-31 Table 2-22 Descriptive Statistics for 1999 MDCC ($/kW) by Utility..........................................2-31 Table 2-23 Capacity Value as a Function of Penetration for Each Utility.................................2-33 Table 2-24 Summary of Utility Outage Cost Determinants ......................................................2-38 Table 2-25 Expected Rewards/Penalties for a Utility Facing the Schedules in Figure 2-9 ......2-39 Table 2-26 Typical (Non-Toxic) Pollutants Regulated in California for Electric Generators.....2-46
xxviii
Table 2-27 Range of California ERC Prices for 2002 ..............................................................2-47 Table 2-28 Estimated Costs of NOX Abatement Technologies for a 150 MW Facility..............2-48 Table 2-29 Example SCAQMD Permit Fees for Engines ........................................................2-49 Table 2-30 Oregon CO2 Standards for Energy Facilities .........................................................2-50 Table 2-31 Emissions Rates for DG Technologies ..................................................................2-50 Table 3-1 Utility Costs and DER Impacts...................................................................................3-3 Table 4-1 Utility Interests ...........................................................................................................4-8 Table 4-2 DER Provider Interests ..............................................................................................4-9 Table 4-3 Regulatory and Societal Interests............................................................................4-10 Table 4-4 DER Customer Interests..........................................................................................4-11
1-1
1 A CATALOG OF CURRENT DER APPROACHES AND INCENTIVES
Introduction
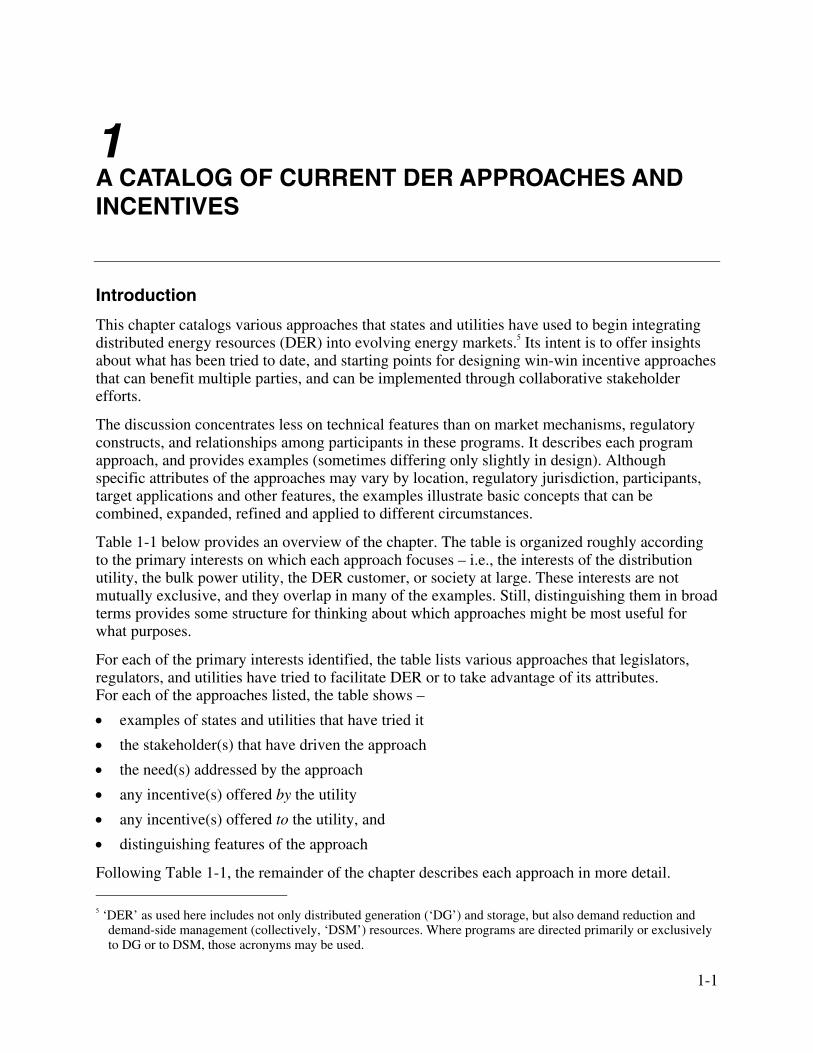
This chapter catalogs various approaches that states and utilities have used to begin integrating distributed energy resources (DER) into evolving energy markets.5 Its intent is to offer insights about what has been tried to date, and starting points for designing win-win incentive approaches that can benefit multiple parties, and can be implemented through collaborative stakeholder efforts.
The discussion concentrates less on technical features than on market mechanisms, regulatory constructs, and relationships among participants in these programs. It describes each program approach, and provides examples (sometimes differing only slightly in design). Although specific attributes of the approaches may vary by location, regulatory jurisdiction, participants, target applications and other features, the examples illustrate basic concepts that can be combined, expanded, refined and applied to different circumstances.
Table 1-1 below provides an overview of the chapter. The table is organized roughly according to the primary interests on which each approach focuses – i.e., the interests of the distribution utility, the bulk power utility, the DER customer, or society at large. These interests are not mutually exclusive, and they overlap in many of the examples. Still, distinguishing them in broad terms provides some structure for thinking about which approaches might be most useful for what purposes.
For each of the primary interests identified, the table lists various approaches that legislators, regulators, and utilities have tried to facilitate DER or to take advantage of its attributes. For each of the approaches listed, the table shows –
• examples of states and utilities that have tried it
• the stakeholder(s) that have driven the approach
• the need(s) addressed by the approach
• any incentive(s) offered by the utility
• any incentive(s) offered to the utility, and
• distinguishing features of the approach
Following Table 1-1, the remainder of the chapter describes each approach in more detail. 5 ‘DER’ as used here includes not only distributed generation (‘DG’) and storage, but also demand reduction and
demand-side management (collectively, ‘DSM’) resources. Where programs are directed primarily or exclusively to DG or to DSM, those acronyms may be used.

A Catalog of Current DER Approaches and Incentives
1-2
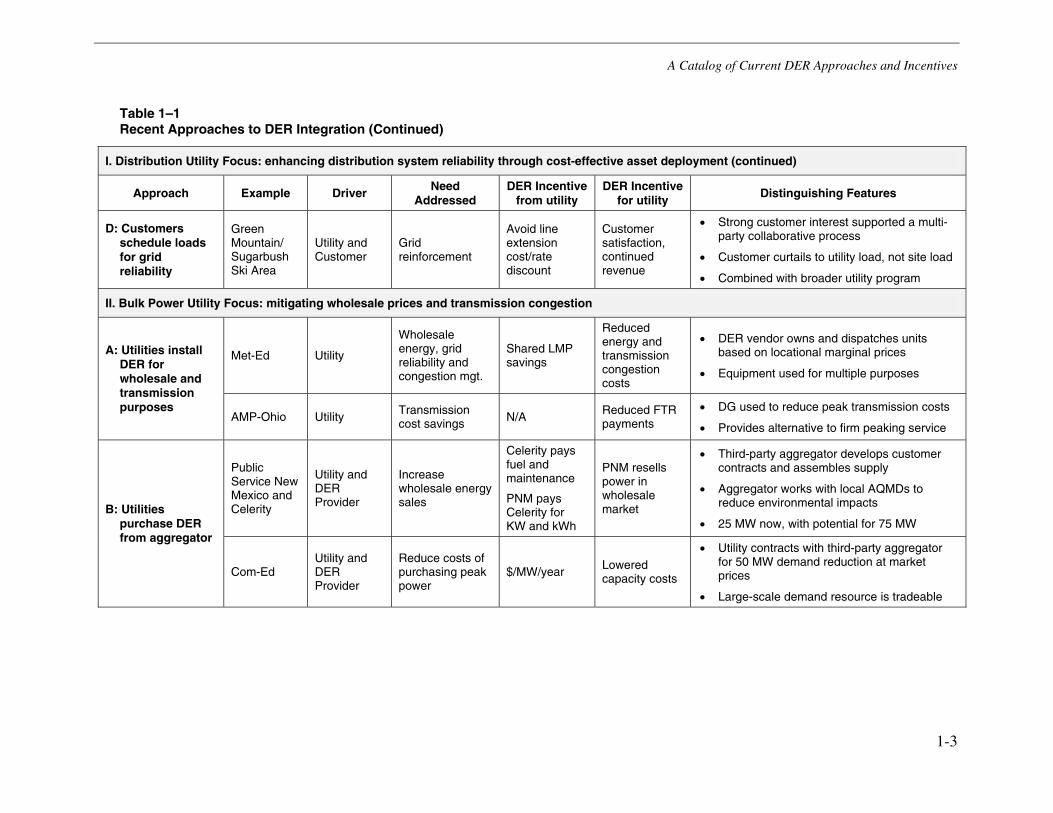
Table 1-1 Recent Approaches to DER Integration
I. Distribution Utility Focus: enhancing distribution system reliability through cost-effective asset deployment
Approach Example Driver Need Addressed
DER Incentive from utility
DER Incentive for utility
Distinguishing Features
New York Utility Commission
Grid reinforcement
$/kW/yr $/kWh/yr
Reduced costs between rate cases
• Required by PSC
• RFQ/RFP process
• First solicitation had little success A: PUCs require
evaluation and acquisition of DG as grid alternative California
Legislature & Utility Commission
Grid reliability and environmental improvement
Deferral value
Reduced costs between rate cases, and ROI
• Result of multi-year proceedings
• Reliance on model contracts
• Utility-specific evaluation methods and procurement approaches
O&R Utility Commission
Area-specific payment and reduced inter- connect cost
• Area-specific payments based on value to local grid
• Reduced interconnection costs B: Utilities offer targeted incentives
Mass Elec. Utility
Grid reinforcement
$/kWh/event
Reduced costs between rate cases • Targeted curtailment to specific circuits
to avoid identified construction project
• ¢/kWh incentive easily understood and administered
PGE Utility
Generator maintenance, payment for interconnection hardware, fuel
Reduced costs between rate cases
• Utility dispatches customer generators as a utility resource.
• Utility assumes O&M responsibility and non-performance risk for non-utility equipment.
C: Utilities use customer equipment for grid reliability
Madison G&E
Utility
Grid reinforcement and customer reliability
Customer receives guaranteed back-up service at fixed cost.
Cost recovery thru lease payments
• Utility designs, installs and owns backup generators at customer locations
• Customer charge is determined through ratemaking process
• Utility bills service on customer’s regular bill
• Customer payment represents a value-added service revenue stream for the utility
A Catalog of Current DER Approaches and Incentives
1-3
Table 1–1 Recent Approaches to DER Integration (Continued)
I. Distribution Utility Focus: enhancing distribution system reliability through cost-effective asset deployment (continued)
Approach Example Driver Need Addressed
DER Incentive from utility
DER Incentive for utility
Distinguishing Features
D: Customers schedule loads for grid reliability
Green Mountain/ Sugarbush Ski Area
Utility and Customer
Grid reinforcement
Avoid line extension cost/rate discount
Customer satisfaction, continued revenue
• Strong customer interest supported a multi-party collaborative process
• Customer curtails to utility load, not site load
• Combined with broader utility program
II. Bulk Power Utility Focus: mitigating wholesale prices and transmission congestion
Met-Ed Utility
Wholesale energy, grid reliability and congestion mgt.
Shared LMP savings
Reduced energy and transmission congestion costs
• DER vendor owns and dispatches units based on locational marginal prices
• Equipment used for multiple purposes
A: Utilities install DER for wholesale and transmission purposes
AMP-Ohio Utility Transmission cost savings N/A
Reduced FTR payments
• DG used to reduce peak transmission costs
• Provides alternative to firm peaking service
Public Service New Mexico and Celerity
Utility and DER Provider
Increase wholesale energy sales
Celerity pays fuel and maintenance
PNM pays Celerity for KW and kWh
PNM resells power in wholesale market
• Third-party aggregator develops customer contracts and assembles supply
• Aggregator works with local AQMDs to reduce environmental impacts
• 25 MW now, with potential for 75 MW B: Utilities
purchase DER from aggregator
Com-Ed Utility and DER Provider
Reduce costs of purchasing peak power
$/MW/year Lowered capacity costs
• Utility contracts with third-party aggregator for 50 MW demand reduction at market prices
• Large-scale demand resource is tradeable
A Catalog of Current DER Approaches and Incentives
1-4
Table 1–1 Recent Approaches to DER Integration (Continued)
II. Bulk Power Utility Focus: mitigating wholesale prices and transmission congestion (continued)
Approach Example Driver Need Addressed
DER Incentive
from utility
DER Incentive for
utility Distinguishing Features
BPA Utility
Reduce costs of constructing transmission capacity
$/kW/event Reduced peak power expenses
• Wholesale utility enlisted retail customers to help solve standard operational issues
• Winter rather than summer load control • Uses demand response to avoid
transmission construction
NYISO Utility (ISO) $/kW/event Reduced peak power expense
• ISO program • $500/MWh minimum payment, regardless
of market price
C: Utilities pay for load curtailment
PSE&G Utility
Reduce costs of wholesale energy and increased grid reliability
Setback thermostat, customer incentives
Reduced peak power expense Recovery of administrative expense
• Utility dispatches aggregated load control as a system resource
• Targets residential loads • Utility controls customer equipment
III. DER Customer Focus: increasing the reliability of on-site energy supplies and expanding energy options
A: Utility offers time-of-use pricing
Gulf Power Utility
Offer customers a way to control energy costs through real time pricing
Lower energy costs
Customer pays to access the technology service
• Value-added service opportunity for utility • Residential customers use TOU rates to
schedule use and reduce bills
B: Customer installs on site co-generation
New Yorker Hotel
Customer
Increase on-site reliability and reduce energy costs thru CHP
On-site reliability or reduced overall energy costs
Often seen as negative due to loss of revenue
• CHP system installed in New York City, a difficult place to site local generation
• DER provider owns and operates CHP facility and guarantees host energy savings
C: Customer installs on-site generator to adopt hourly pricing
Pa. Mall Customer Customer reliability, lower energy costs
Wholesale mkt. sales
N/A
• DG becomes a tool in the customer’s energy procurement strategy
• DER value in wholesale market exceeds value of avoided hourly purchases under demand response strategy
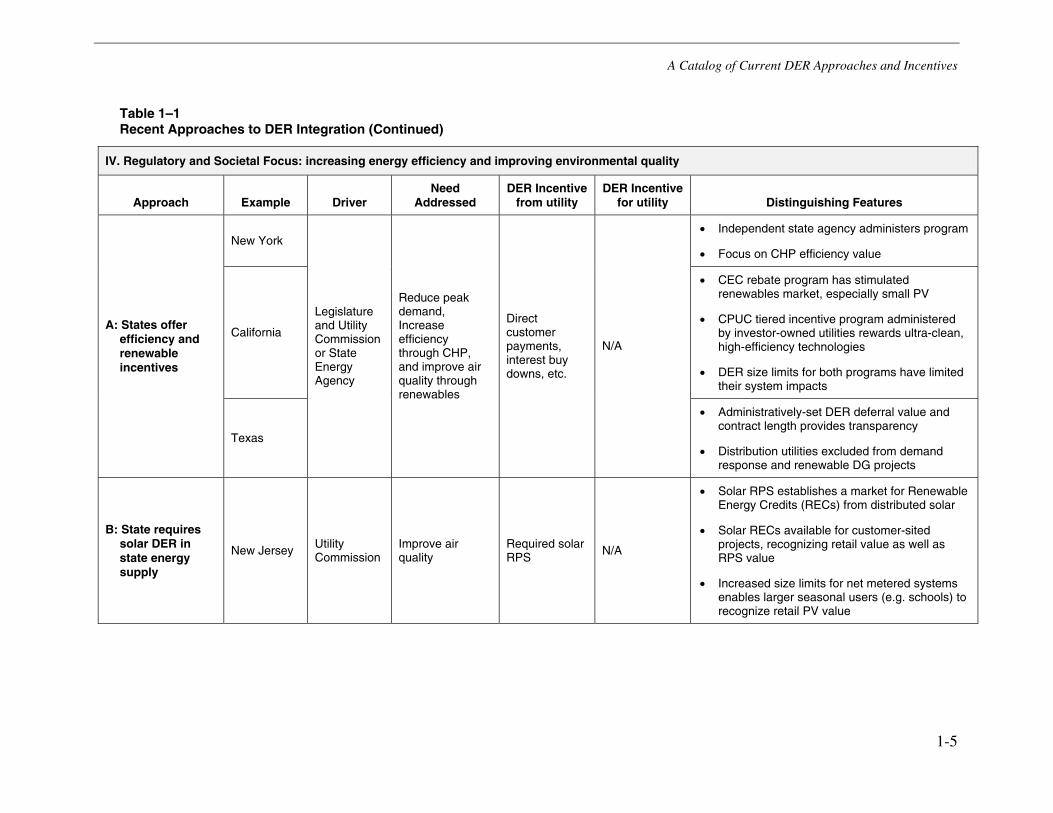
A Catalog of Current DER Approaches and Incentives
1-5
Table 1–1 Recent Approaches to DER Integration (Continued)
IV. Regulatory and Societal Focus: increasing energy efficiency and improving environmental quality
Approach Example Driver Need
Addressed DER Incentive
from utility DER Incentive
for utility Distinguishing Features
New York • Independent state agency administers program
• Focus on CHP efficiency value
California
• CEC rebate program has stimulated renewables market, especially small PV
• CPUC tiered incentive program administered by investor-owned utilities rewards ultra-clean, high-efficiency technologies
• DER size limits for both programs have limited their system impacts
A: States offer efficiency and renewable incentives
Texas
Legislature and Utility Commission or State Energy Agency
Reduce peak demand, Increase efficiency through CHP, and improve air quality through renewables
Direct customer payments, interest buy downs, etc.
N/A
• Administratively-set DER deferral value and contract length provides transparency
• Distribution utilities excluded from demand response and renewable DG projects
B: State requires solar DER in state energy supply
New Jersey Utility Commission
Improve air quality
Required solar RPS
N/A
• Solar RPS establishes a market for Renewable Energy Credits (RECs) from distributed solar
• Solar RECs available for customer-sited projects, recognizing retail value as well as RPS value
• Increased size limits for net metered systems enables larger seasonal users (e.g. schools) to recognize retail PV value
A Catalog of Current DER Approaches and Incentives
1-6
Descriptions of Recent Approaches to DER Market Integration
1. Distribution Utility Focus: Enhancing System Reliability through Cost-Effective Asset Deployment
1.A: New York and California public utility commissions require utilities to evaluate DG as a distribution alternative, and seek to acquire it where it is cost-effective
1.B: Orange & Rockland and Massachusetts Electric target incentives to customers that curtail load or dispatch backup generators to enhance grid reliability.
1.C: Portland General Electric and Madison Gas & Electric contract with customers to use their backup generators to enhance grid reliability.
1.D: Green Mountain Power negotiated an agreement with a large customer that requires the customer to curtail load based on grid reliability criteria.
1.A: New York and California Public Utility Commissions Require Utilities to Evaluate DG as a Distribution Alternative, and Seek to Acquire it where it is Cost-Effective
New York Program Description: Having already adopted standardized interconnection requirements for small generators, in October 2001 the New York State Public Service Commission (NYPSC), established a pilot program to develop policies and procedures to integrate DG into utility distribution planning.6 The program’s objectives are:
• to determine whether distribution system needs can be satisfied on a least-cost basis by creative and competitive means;
• to develop case-specific information on DG costs, benefits, and impacts across a range of distribution system conditions;
• to refine methods for evaluating customer-owned DG proposals against traditional system improvement projects;
• to determine whether a competitive process using requests for proposals (RFPs) is a viable and optimal means of eliciting a market response to the utility’s distribution system needs.7
The program requires New York utilities to develop and issue RFPs for customer-side DG to meet specific capacity needs on their systems. Each utility is responsible to identify system needs that DG projects might meet, and to issue two RFPs in each planning year to potential DG customers or vendors.8 Utilities can meet up to 50% of the needs identified in their RFPs with utility-owned DG. The RFPs must:
• address system needs at least 18 months in the future
6 State of New York Public Service Commission, Opinion No. 01-5, Case 00-E-0005, Proceeding on Motion of the
Commission to Examine Costs, Benefits and Rates Regarding Distributed Generation, p. 8. The Opinion did not address interconnection costs or standby rates, which are the subject of separate cases or orders.
7 Id., pp. 8-9.
8 Except that Consolidated Edison must issue four in the program’s third and final year.
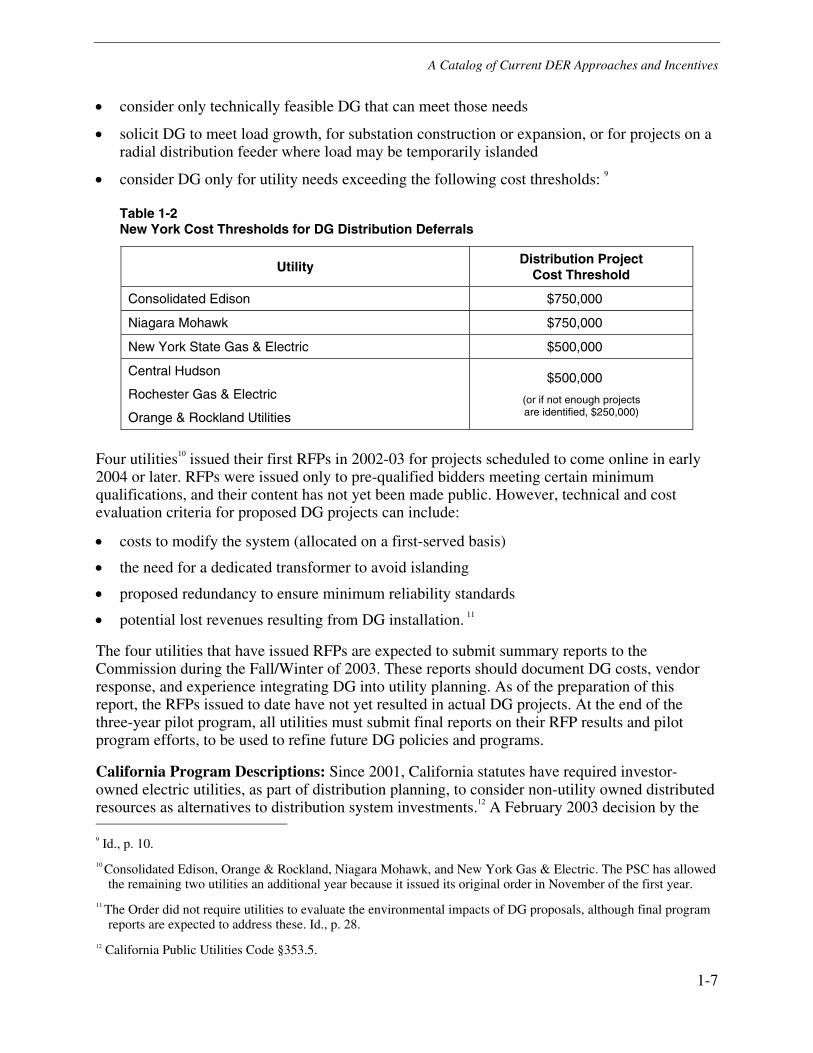
A Catalog of Current DER Approaches and Incentives
1-7
• consider only technically feasible DG that can meet those needs
• solicit DG to meet load growth, for substation construction or expansion, or for projects on a radial distribution feeder where load may be temporarily islanded
• consider DG only for utility needs exceeding the following cost thresholds: 9
Table 1-2 New York Cost Thresholds for DG Distribution Deferrals
Utility Distribution Project Cost Threshold
Consolidated Edison $750,000
Niagara Mohawk $750,000
New York State Gas & Electric $500,000
Central Hudson
Rochester Gas & Electric
Orange & Rockland Utilities
$500,000
(or if not enough projects are identified, $250,000)
Four utilities10 issued their first RFPs in 2002-03 for projects scheduled to come online in early 2004 or later. RFPs were issued only to pre-qualified bidders meeting certain minimum qualifications, and their content has not yet been made public. However, technical and cost evaluation criteria for proposed DG projects can include:
• costs to modify the system (allocated on a first-served basis)
• the need for a dedicated transformer to avoid islanding
• proposed redundancy to ensure minimum reliability standards
• potential lost revenues resulting from DG installation. 11
The four utilities that have issued RFPs are expected to submit summary reports to the Commission during the Fall/Winter of 2003. These reports should document DG costs, vendor response, and experience integrating DG into utility planning. As of the preparation of this report, the RFPs issued to date have not yet resulted in actual DG projects. At the end of the three-year pilot program, all utilities must submit final reports on their RFP results and pilot program efforts, to be used to refine future DG policies and programs.
California Program Descriptions: Since 2001, California statutes have required investor-owned electric utilities, as part of distribution planning, to consider non-utility owned distributed resources as alternatives to distribution system investments.12 A February 2003 decision by the 9 Id., p. 10.
10 Consolidated Edison, Orange & Rockland, Niagara Mohawk, and New York Gas & Electric. The PSC has allowed the remaining two utilities an additional year because it issued its original order in November of the first year.
11 The Order did not require utilities to evaluate the environmental impacts of DG proposals, although final program reports are expected to address these. Id., p. 28.
12 California Public Utilities Code §353.5.
A Catalog of Current DER Approaches and Incentives
1-8
California Public Utilities Commission (CPUC), which also permits utility-owned DG, adopted a similar requirement.13 Among other things, it ordered California IOUs to describe the methodology each would use to evaluate DG as a distribution alternative, and to develop model contracts to acquire DG for that purpose. The decision states that the methodology should:
• establish performance criteria that balance reliability, safety and cost to determine when DG is a viable distribution alternative;
• inform DG providers of these criteria in advance, and of specific locations where DG may be procured;
• procure the DG solution where the utility determines that it is a potential distribution alternative;
• develop model contracts as a starting point for negotiations with nonutility providers;14 and
• pay DG providers who defer distribution upgrades through a bill credit or direct payment.
These credits or payments are to be charged to utility distribution budgets, and cannot exceed the utility’s short-term carrying cost of capital, multiplied by the cost of the planned distribution addition and the number of years of deferral.15 In allowing the utilities to own DG assets, the decision provides that these are to be treated as generation assets, with costs and revenues booked to generation accounts.16
California’s three major electric IOUs have made very similar compliance filings describing their DG evaluation methodologies. Pacific Gas & Electric (PG&E) and Southern California Edison (SCE) described an initial screening of distribution projects and a comparison of wires solutions with an ‘ideal’ DG alternative. Where the DG alternative appears less costly, the utility will analyze it in more detail. If it appears to offer an appropriate distribution alternative, the utility will issue an RFP to acquire it.
Proposals submitted in response to the RFP, along with DG proposals developed internally (at least for SCE) will be screened for technical adequacy. For those that pass, their costs will be compared with the costs of the utility’s wires solution, and the least-cost alternative will be pursued. If that is the DG alternative, the DG provider must execute the utility’s model contract or one similar to it, and assure project completion by a drop-dead date that allows the utility to revert to its wires solution if necessary to meet its required in-service date.
San Diego Gas & Electric’s (SDG&E) process is similar, but includes explicit evaluation guidelines to identify situations that may favor DG. More importantly, SDG&E would substitute its normal equipment procurement process for the RFP approach proposed by the other two utilities, potentially reducing transactions costs for all participants. This process would periodically identify potential DG vendors in advance, and would pre-qualify them based on 13 D. 03-02-068, issued February 27, 2003 in R. 99-10-025. This rulemaking chose to focus on distributed
generation, rather than the broader category of distributed energy resources (which would include conservation, efficiency and load management), so this discussion of California initiatives sometimes refers to ‘DG’ rather than ‘DER’
14 The CPUC does not intend to mandate or adopt specific contract terms. Id., p.20.
15 Id., Order, paragraphs 4 and 5.
16 Id., p. 26 and Ordering paragraph 6.
A Catalog of Current DER Approaches and Incentives
1-9
relevant experience and credit-worthiness. Once potential DG projects are identified, only pre-qualified vendors would be solicited to bid on them.17
These utility DG methodologies to acquire DG as a distribution alternative were filed in May, 2003, and apparently had not resulted in actual DG procurements for that purpose by the end of the year.
Distinguishing Features of the New York and California Examples:
New York:
Requirement that utilities participate in a process to procure DER as an alternative to traditional utility approaches.
Two-stage RFQ/RFP process designed to elicit customer and third-party DG solutions that utilities might not otherwise consider.
Little success so far in stimulating new DER installations, because program design has not yet synchronized utility needs with DER provider needs.
California:
California’s DER planning and procurement approach was one of a number of directives to emerge from a multi-year Commission proceeding involving all major DER stakeholders.
The process contemplates that utilities and DER providers will negotiate bilateral contracts using model provisions submitted to the Commission as a starting point.
The methodology described by SDG&E offers more explicit evaluation guidelines and possibly a more streamlined DG procurement process than the other IOU approaches, but all have yet to be tested in practice.
1.B: Orange & Rockland and Massachusetts Electric Target Incentives to Customers that Curtail Load or Dispatch Backup Generators to Enhance Grid Reliability
Orange and Rockland Description: In 1997, New York’s Orange and Rockland Utilities (ORU), a transmission and distribution (T&D) company, had in place programs to encourage primary and secondary customers to relieve load on its system. Its Curtailable Load (CL) program offered those customers financial incentives in the form of summer bill credits for curtailing their load within four hours of the utility’s request, for up to 75 hours during the summer. Its Temporary Buyback (TBB) program encouraged customers with back-up generation to interconnect, and paid them to deliver 250 kW or more onto ORU’s grid at its request.
17 Apart from procuring DG as a distribution alternative, California IOUs have resumed responsibility for procuring
roughly 10% of their customers’ bundled service power not supplied by the IOUs’ retained nuclear and hydro resources, or under long-term contracts. CPUC rules governing this broader procurement responsibility direct the utilities to explicitly include DG and ‘self-generation’ resources such as CHP in their procurement plans, stressing that these technologies can provide important transmission and grid-support benefits as well as energy and capacity. The Commission also expressly includes customer-side renewable DG among the resources utilities should procure under California’s recently adopted renewable portfolio standard.
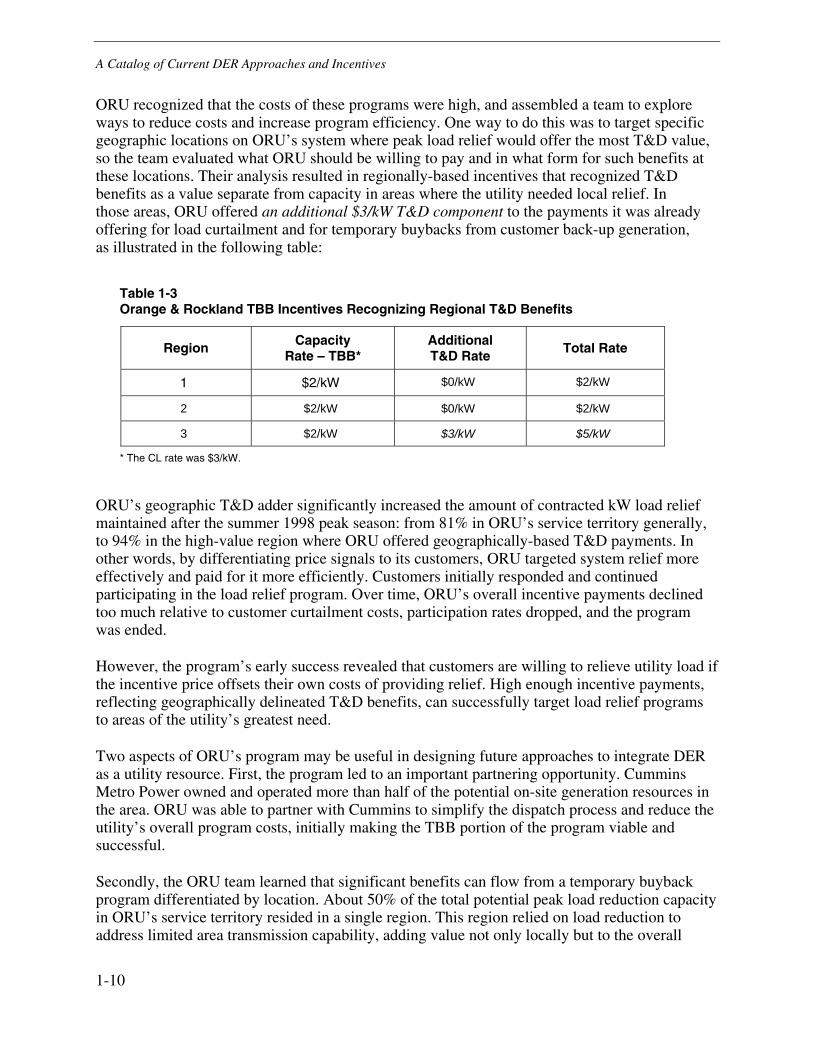
A Catalog of Current DER Approaches and Incentives
1-10
ORU recognized that the costs of these programs were high, and assembled a team to explore ways to reduce costs and increase program efficiency. One way to do this was to target specific geographic locations on ORU’s system where peak load relief would offer the most T&D value, so the team evaluated what ORU should be willing to pay and in what form for such benefits at these locations. Their analysis resulted in regionally-based incentives that recognized T&D benefits as a value separate from capacity in areas where the utility needed local relief. In those areas, ORU offered an additional $3/kW T&D component to the payments it was already offering for load curtailment and for temporary buybacks from customer back-up generation, as illustrated in the following table:
Table 1-3 Orange & Rockland TBB Incentives Recognizing Regional T&D Benefits
Region Capacity Rate – TBB*
Additional T&D Rate
Total Rate
1 $2/kW $0/kW $2/kW
2 $2/kW $0/kW $2/kW
3 $2/kW $3/kW $5/kW
* The CL rate was $3/kW.
ORU’s geographic T&D adder significantly increased the amount of contracted kW load relief maintained after the summer 1998 peak season: from 81% in ORU’s service territory generally, to 94% in the high-value region where ORU offered geographically-based T&D payments. In other words, by differentiating price signals to its customers, ORU targeted system relief more effectively and paid for it more efficiently. Customers initially responded and continued participating in the load relief program. Over time, ORU’s overall incentive payments declined too much relative to customer curtailment costs, participation rates dropped, and the program was ended.
However, the program’s early success revealed that customers are willing to relieve utility load if the incentive price offsets their own costs of providing relief. High enough incentive payments, reflecting geographically delineated T&D benefits, can successfully target load relief programs to areas of the utility’s greatest need.
Two aspects of ORU’s program may be useful in designing future approaches to integrate DER as a utility resource. First, the program led to an important partnering opportunity. Cummins Metro Power owned and operated more than half of the potential on-site generation resources in the area. ORU was able to partner with Cummins to simplify the dispatch process and reduce the utility’s overall program costs, initially making the TBB portion of the program viable and successful.
Secondly, the ORU team learned that significant benefits can flow from a temporary buyback program differentiated by location. About 50% of the total potential peak load reduction capacity in ORU’s service territory resided in a single region. This region relied on load reduction to address limited area transmission capability, adding value not only locally but to the overall
A Catalog of Current DER Approaches and Incentives
1-11
system. If this area were to become overloaded, catastrophic electrical failures could occur throughout the system, so ORU had more incentive to secure adequate load reduction contracts in this region than in the rest of its service territory.
Massachusetts Electric Program Description:18 Massachusetts Electric (Mass Electric), a National Grid company, identified a need to invest $1.2 million to increase capacity at its Belmont Street substation in Brockton, Massachusetts. The need resulted from high loading during relatively few hours of the year.
Mass Electric wanted to determine if it could contract with customers for enough curtailment of load served from the Belmont substation to defer this investment. The utility set up the pilot in summer 2002 to learn whether this approach could work and could be expanded to other areas, and specifically to learn:
1. whether the utility could acquire enough curtailable load from the target area’s larger customers to minimize transaction costs by dealing with fewer customers
2. whether customers would agree to curtail in the event of a multi-day heat spell, and would offer enough capacity on the later days to meet system reliability requirements
3. what minimum incentive would be needed to acquire the necessary capacity, and whether it would exceed $.50/kWh
4. what load management measures customers could implement
5. if the pilot succeeded, how the utility could integrate similar programs into its planning criteria for different locations.
The Brockton area substation had a design capacity of 45 megawatts. Mass Electric estimated that its peak load would need to be reduced by 950 kW by summer 2002. The quickest and most efficient way to do this was to work with larger customers, whose loads exceeded 200 KW. The substation served 25 such customers, of which 10 voluntarily agreed to participate in the program. They offered a potential load reduction estimated at 650-2,300 kW, based on their load profiles and controls expected to be in place by summer.
The utility conducted energy audits and enrolled participants in its existing DSM programs. Seven customers had energy management systems, and three of those were remotely controllable. The other participants relied on local personnel to control equipment manually. All ten were enrolled in the Northeast ISO Load Response Program and eligible for payments under that program in addition to the Mass Electric incentives.
Mass Electric notified these customers of curtailment events by email, giving them 30 minutes to reduce their load to a pre-determined level, and Internet access to view their facility loads in real time during events. For load curtailed during each event, it paid customers a $.50/kWh incentive.
18 Source: “Report on the Load Curtailment Pilot Program in Brockton” by Massachusetts Electric Company,
October 31, 2002; as submitted to the Massachusetts Department of Telecommunications and Energy.
A Catalog of Current DER Approaches and Incentives
1-12
The utility decided to call for curtailment when the area substation experienced a 43 MW load for more than 15 minutes, or grew quickly from 43 to 44 MW. It called four events totaling 17 hours during summer 2002, two in July and two in August. Eight customers participated on three days, and seven participated on the fourth day. Their average load reduction ranged from 675–862 KW/hour, and the maximum reductions for all customers ranged from 1,231–2,300 KW/hour.
Mass Electric achieved its primary goal of keeping the substation load below 45 MW; paid participating customers a total of $6,454; and considered the pilot a success. Lessons learned included the importance of:
1. planning for diversity of curtailable load, so every customer need not curtail for every day of longer-term events;
2. leveraging participation by allowing customers to take advantage of demand response programs offered by others (here, the New England ISO’s program);
3. committing to multi-year customer load response programs, which take longer to implement than installation of utility equipment.
Distinguishing Features of the Orange & Rockland and Mass Electric Examples:
Orange & Rockland:
• Payments to DER providers were based on area-specific analysis of the value of load deferral or curtailment in a specific utility planning region.
• The utility reduced some utility-specific interconnection costs to induce DER providers to site projects where it needed grid support.
Mass Electric:
• This pilot approach was driven by the utility’s desire to defer an identified construction project.
• The $.50/kWh incentive was sufficient to attract customers and easy to understand (no hourly variations or dependence on wholesale market prices).
1.C: Portland General Electric and Madison Gas & Electric contract with Customers to use their Backup Generators to Enhance Grid Reliability
Portland General Electric (PGE) Program Description: PGE contracts with customers with backup generators to allow the utility to operate the units for up to 400 hours annually. In exchange, PGE will:
• upgrade switchgear to permit grid synchronization
• install control and communication hardware
• assume all maintenance, repair and operation costs (including fuel used during utility interruptions)
• provide additional sound attenuation
A Catalog of Current DER Approaches and Incentives
1-13
• add more fuel storage capabilities
• test the system monthly under full load
PGE networks the backup generators into its control center so utility operators can dispatch them as part of its system. The utility outsources maintenance and repair, and guarantees a 4-hour response when the generator is not functioning. Customers served by a competitive supplier can opt to participate in the program. In that case PGE, the customer, and the supplier negotiate an agreement to provide accurate billing and accounting for power used during outages.
Since PGE owns the switchgear, the generator output is considered PGE power. This avoids customer tax liability and FERC jurisdiction over wholesale power sales. Customers must sign a Dispatchable Generation Agreement with early termination penalties.
PGE installs oxidation catalysts on all engine generators in the program to reduce carbon monoxide and hydrocarbon emissions. It is exploring the use of dual-fuel systems that burn natural gas in a diesel engine, displacing 80-90% of the diesel fuel with cleaner natural gas. PGE obtains air permits from the Oregon Department of Environmental Quality for all generators enrolled in the program.
Madison Gas and Electric (MG&E) Program Description: MG&E’S Backup Generation Program is a pilot limited initially to 50 MW of customer load. At a customer’s request, MG&E will install and maintain a natural gas or diesel backup generator at the customer’s facility. The utility reserves the right to operate the unit to enhance grid reliability or to meet other system requirements. The backup service must equal the facility’s highest annual demand. Customers initially pay $1.48/month/KW for new contracts involving diesels, and $3.45/month/KW for new gas generators.
Each customer must sign an agreement with Madison G&E wherein they agree to accept service for a term of three years or pay an early termination penalty. The agreement is automatically renewed after the initial three year term, absent written notice from either party. The monthly charge is guaranteed for the initial three year term, after which it reverts to the tariff rate in effect at the time. The customer must provide a suitable location, a concrete mounting pad, all necessary easements and right of ways and necessary permits. Any non- standard features such as noise abatement or landscaping are billed to the customer as contributions in advance of construction.
Distinguishing Features of Portland General Electric and Madison G&E Examples:
PGE:
• The utility dispatches output from customer generators as a utility resource.
• The utility assumes O&M responsibility and non-performance risk for non-utility equipment.
MG&E:
• The utility designs, installs and owns backup generators at customer locations.
• The customer charge is determined through the ratemaking process.
• The service is billed on the customer’s normal utility bill.
• Customer payments represent value-added service revenues for the utility.
A Catalog of Current DER Approaches and Incentives
1-14
1.D: Green Mountain Power negotiated an agreement with a Large Customer that Requires the Customer to Curtail Load Based on Grid Reliability Criteria
Green Mountain Power Program Description:19 Vermont’s Sugarbush Resort wanted to increase snowmaking capacity at the ski area by 15 MW. Green Mountain Power (GMP) would have needed to charge Sugarbush $5 million for the necessary line extension. The utility, the customer and Vermont’s Public Advocate formed a collaborative team to explore alternatives, and state regulators later approved the approach they developed.
The collaborative solution had two components:
1. A customer-managed interruptible contract under which Sugarbush ensured that the load would not exceed the distribution line’s 30 MW carrying limit, and installed real-time metering and telemetry to read substation loads. Under this arrangement, Sugarbush not only avoids the line extension charge, but receives value for load management in the form of a rate discount for purchased electricity.
2. A concentrated effort by GMP to improve energy efficiency and lower peak demand throughout the entire region. At the Public Advocate’s urging , GMP focused some of its demand-side management programs in the area, including among numerous measures converting electric water and space heaters to alternative fuels.
Distinguishing Features of the Green Mountain Power Example:
A single customer would have borne the line extension costs, providing strong motivation to find alternatives.
The customer’s interest encouraged participation by the utility and the regulatory and public interest community; participants observed that GMP would have been less likely to participate if upgrade costs were socialized through the tariff, regardless of cost-effectiveness.
Key stakeholders participated in a collaborative process that yielded win-win solutions for all parties.
The curtailment contract requires the customer to take into account the load of other substation customers while managing its own load, engaging it in area load management beyond its own facility.
The program combined the immediate needs of one large customer with a broader, longer-term strategy to reduce system demands in surrounding areas.20
19 Based on a report by the Regulatory Assistance Project, “Distributed Resources and Electric System Reliability”,
2001, p. 16-18.
20 A criticism has been that GMP largely abandoned the follow-on DSM work once the reliability challenge was met, suggesting that ground rules for dual-purpose DSM programs must be carefully worked out with regulators or other program advisors.
A Catalog of Current DER Approaches and Incentives
1-15
2. Bulk Power Utility Focus: Mitigate Wholesale Prices and Transmission Congestion
2.A: Metropolitan Edison and AMP Ohio installed distributed generation to provide peaking wholesale power, transmission reliability, and transmission congestion mitigation.
2.B: Public Service of New Mexico and Commonwealth Edison contract with third party aggregators for access to capacity available from customer-sided generators/loads.
2.C: The Bonneville Power Authority, the New York ISO and Public Service Electric and Gas pay customers to reduce their facility energy demand when requested.
2.A: Metropolitan Edison and AMP Ohio Installed DG to Provide Peaking Wholesale Power, Transmission Reliability, and Transmission Congestion Mitigation
Metropolitan Edison Program Description: Metropolitan Edison (Met-Ed), a First Energy company, installed about 100 MW of diesel generators at eight Met-Ed substations in Pennsylvania. The generators were first used in the summer of 2001 as an alternative to purchasing peak energy from the PJM spot market. This resource has also provided system reliability benefits.
Since summer 2001, Met-Ed has leased the gen-sets from Cummins Power. They are connected at 19.9 KV to the Met-Ed distribution system and are physically located within the substation fence. Cummins owns the equipment, and has installed a communication network that allows remote dispatch of the units.
In the first year of operations, Met-Ed system operators dispatched the units to mitigate prices when the Locational Marginal Price (LMP) at PJM’s local pricing point exceeded $80/MWh. They also used the generators to provide contingency transmission support when a lightning strike at a nearby 230 KV substation required redistribution of power in the area, until the substation was repaired. The units were dispatched for about 300 hours in summer 2001.
AMP Ohio Program Description: AMP Ohio is a municipal cooperative with a number of municipalities as members. AMP Ohio provides not only generation but transmission services to its members. They have found that off-peak transmission scheduling and delivery rights within their region are available and affordable. They have entered into a combination of long- and short-term fixed price contracts to ensure the deliverability of the power produced by their plants and contract generation they have purchased. They discovered that peak transmission rights for the same power delivery were significantly more expensive than off-peak transmission rights.
AMP Ohio decided to install sixty 1.8 MW diesel generators and use the generators as an alternative to purchasing firm peaking transmission capacity. By using the distributed generation, the cooperative was able to purchase non-firm transmission rights for their peak needs. In times when transmission constraints existed in the grid, AMP Ohio dispatchers call on the DG units until the transmission constraints are mitigated and non-firm transmission becomes available. The DG has been dispatched from 100-500 hours annually to meet this need.
A Catalog of Current DER Approaches and Incentives
1-16
Distinguishing Features of the Met-Ed and AMP Ohio Examples:
Met-Ed:
• The DER provider owns the equipment, and dispatches it based on LMP prices or utility requests.
• The equipment is used for multiple purposes, including peak power supply, local congestion mitigation, and local grid reliability enhancement.
AMP Ohio:
• A municipal cooperative uses DG assets to reduce peak transmission costs for its members.
• DG serves as an alternative to buying fixed price, firm peaking transmission services.
2.B: Public Service of New Mexico and Commonwealth Edison contract with Third-Party Aggregators for Capacity from Customer-Sited Generators and/or Loads.
Public Service of New Mexico Program Description: Fifteen customers (mainly municipal and government agencies) have signed contracts with energy management company Celerity Energy, allowing Celerity to dispatch their backup generators for up to 400 hours a year (two starts per day maximum, up to eight hours). Celerity aggregates the capacity from these generators and sells it to PNM under a contract that includes capacity and energy components. In return, Celerity agrees to:
• provide free generator maintenance
• upgrade equipment where necessary
• guarantee generator performance
Gen-sets in the program range from 400-2000 kW each. The network’s total capacity is about 25 MW, with potential to increase to 75 MW in the future.
Celerity is responsible for maintaining the generators and managing their day-to-day operation. All the gen-sets are linked with a communication platform supplied by Sixth Dimension. On notification from PNM, Celerity can dispatch some or all of them from a central control station. FERC has granted the network Exempt Wholesale Generator status, allowing its output to be sold into the wholesale market.
The State of New Mexico has issued each gen-set a permit to operate in peak power mode. Depending on its size, age and air emissions profile, each unit is permitted to run for a specified number of hours annually; most can operate up to 400 hours. Celerity has worked with local air permitting agencies to increase the dispatchable hours, by introducing new technologies to reduce NOX and CO emissions from older diesel gen-sets. Dual-fuel technologies to inject natural gas into the diesel cycle during combustion have been investigated, and pilot applications started.
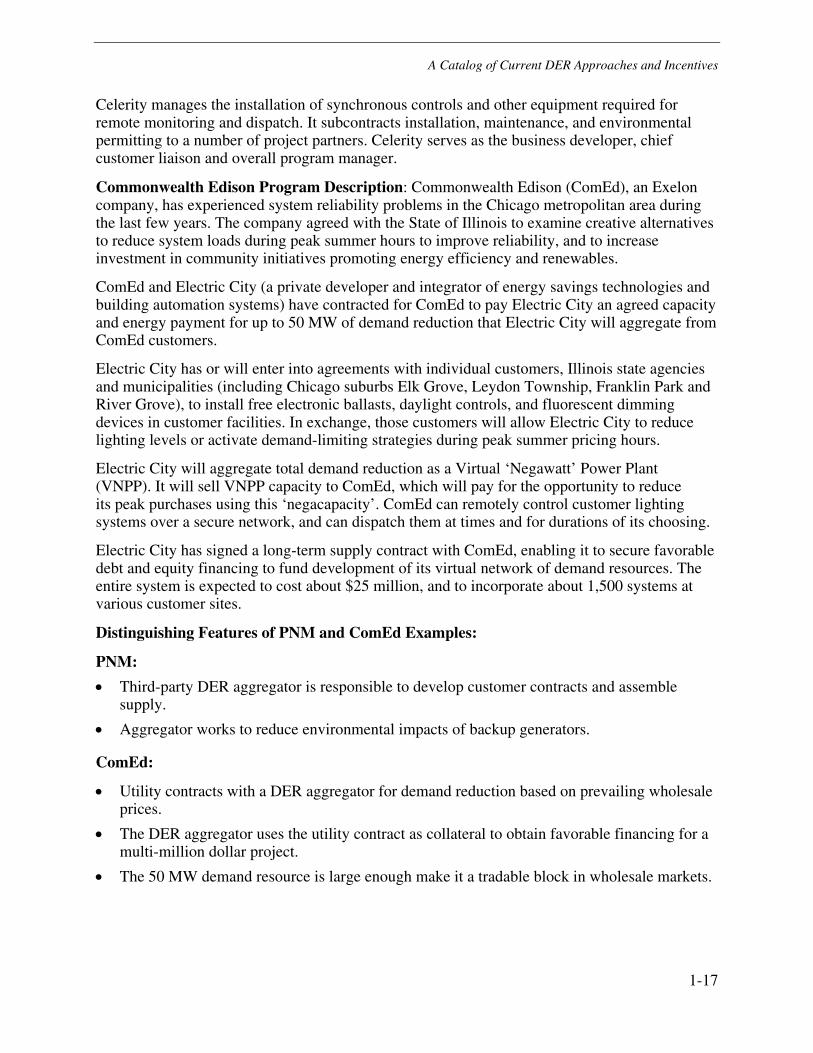
A Catalog of Current DER Approaches and Incentives
1-17
Celerity manages the installation of synchronous controls and other equipment required for remote monitoring and dispatch. It subcontracts installation, maintenance, and environmental permitting to a number of project partners. Celerity serves as the business developer, chief customer liaison and overall program manager.
Commonwealth Edison Program Description: Commonwealth Edison (ComEd), an Exelon company, has experienced system reliability problems in the Chicago metropolitan area during the last few years. The company agreed with the State of Illinois to examine creative alternatives to reduce system loads during peak summer hours to improve reliability, and to increase investment in community initiatives promoting energy efficiency and renewables.
ComEd and Electric City (a private developer and integrator of energy savings technologies and building automation systems) have contracted for ComEd to pay Electric City an agreed capacity and energy payment for up to 50 MW of demand reduction that Electric City will aggregate from ComEd customers.
Electric City has or will enter into agreements with individual customers, Illinois state agencies and municipalities (including Chicago suburbs Elk Grove, Leydon Township, Franklin Park and River Grove), to install free electronic ballasts, daylight controls, and fluorescent dimming devices in customer facilities. In exchange, those customers will allow Electric City to reduce lighting levels or activate demand-limiting strategies during peak summer pricing hours.
Electric City will aggregate total demand reduction as a Virtual ‘Negawatt’ Power Plant (VNPP). It will sell VNPP capacity to ComEd, which will pay for the opportunity to reduce its peak purchases using this ‘negacapacity’. ComEd can remotely control customer lighting systems over a secure network, and can dispatch them at times and for durations of its choosing.
Electric City has signed a long-term supply contract with ComEd, enabling it to secure favorable debt and equity financing to fund development of its virtual network of demand resources. The entire system is expected to cost about $25 million, and to incorporate about 1,500 systems at various customer sites.
Distinguishing Features of PNM and ComEd Examples:
PNM:
• Third-party DER aggregator is responsible to develop customer contracts and assemble supply.
• Aggregator works to reduce environmental impacts of backup generators.
ComEd:
• Utility contracts with a DER aggregator for demand reduction based on prevailing wholesale prices.
• The DER aggregator uses the utility contract as collateral to obtain favorable financing for a multi-million dollar project.
• The 50 MW demand resource is large enough make it a tradable block in wholesale markets.
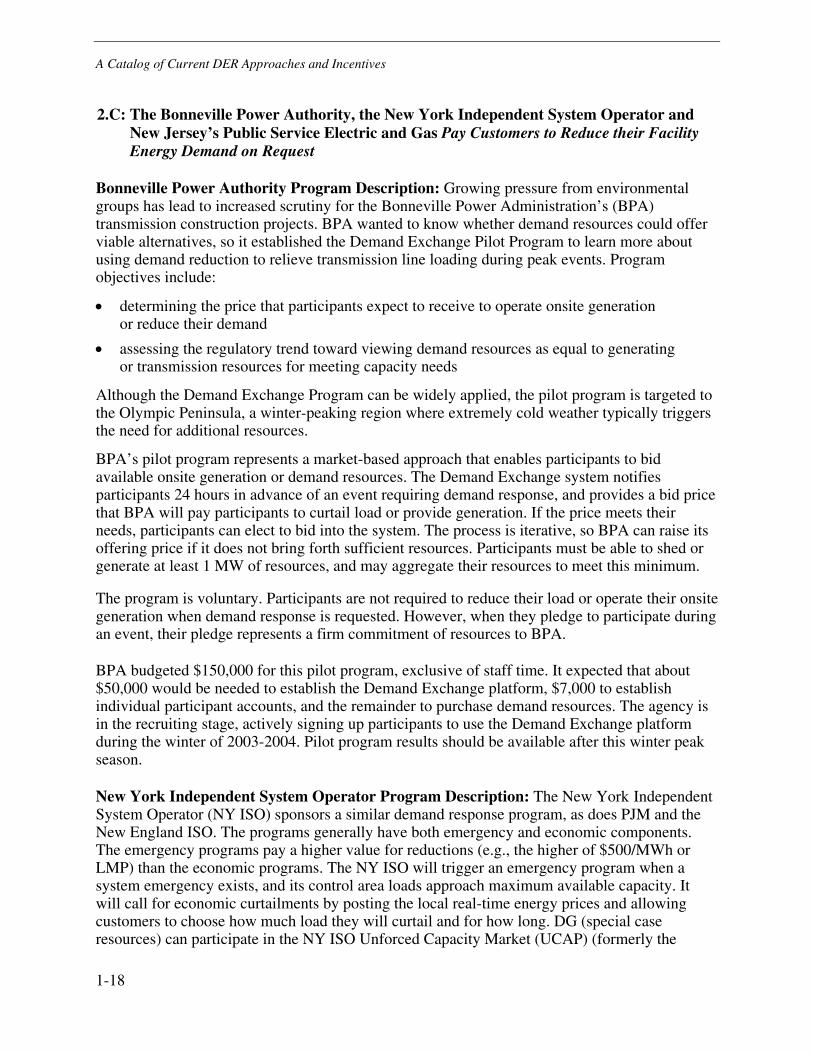
A Catalog of Current DER Approaches and Incentives
1-18
2.C: The Bonneville Power Authority, the New York Independent System Operator and New Jersey’s Public Service Electric and Gas Pay Customers to Reduce their Facility Energy Demand on Request
Bonneville Power Authority Program Description: Growing pressure from environmental groups has lead to increased scrutiny for the Bonneville Power Administration’s (BPA) transmission construction projects. BPA wanted to know whether demand resources could offer viable alternatives, so it established the Demand Exchange Pilot Program to learn more about using demand reduction to relieve transmission line loading during peak events. Program objectives include:
• determining the price that participants expect to receive to operate onsite generation or reduce their demand
• assessing the regulatory trend toward viewing demand resources as equal to generating or transmission resources for meeting capacity needs
Although the Demand Exchange Program can be widely applied, the pilot program is targeted to the Olympic Peninsula, a winter-peaking region where extremely cold weather typically triggers the need for additional resources.
BPA’s pilot program represents a market-based approach that enables participants to bid available onsite generation or demand resources. The Demand Exchange system notifies participants 24 hours in advance of an event requiring demand response, and provides a bid price that BPA will pay participants to curtail load or provide generation. If the price meets their needs, participants can elect to bid into the system. The process is iterative, so BPA can raise its offering price if it does not bring forth sufficient resources. Participants must be able to shed or generate at least 1 MW of resources, and may aggregate their resources to meet this minimum.
The program is voluntary. Participants are not required to reduce their load or operate their onsite generation when demand response is requested. However, when they pledge to participate during an event, their pledge represents a firm commitment of resources to BPA.
BPA budgeted $150,000 for this pilot program, exclusive of staff time. It expected that about $50,000 would be needed to establish the Demand Exchange platform, $7,000 to establish individual participant accounts, and the remainder to purchase demand resources. The agency is in the recruiting stage, actively signing up participants to use the Demand Exchange platform during the winter of 2003-2004. Pilot program results should be available after this winter peak season.
New York Independent System Operator Program Description: The New York Independent System Operator (NY ISO) sponsors a similar demand response program, as does PJM and the New England ISO. The programs generally have both emergency and economic components. The emergency programs pay a higher value for reductions (e.g., the higher of $500/MWh or LMP) than the economic programs. The NY ISO will trigger an emergency program when a system emergency exists, and its control area loads approach maximum available capacity. It will call for economic curtailments by posting the local real-time energy prices and allowing customers to choose how much load they will curtail and for how long. DG (special case resources) can participate in the NY ISO Unforced Capacity Market (UCAP) (formerly the
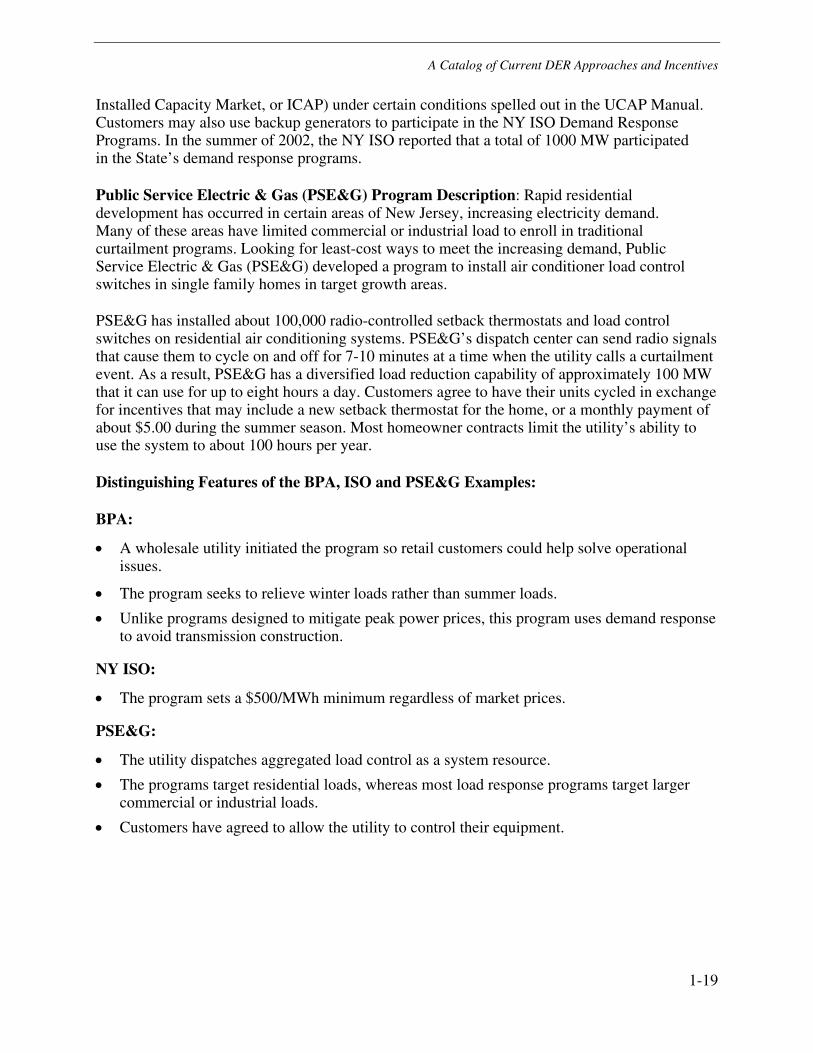
A Catalog of Current DER Approaches and Incentives
1-19
Installed Capacity Market, or ICAP) under certain conditions spelled out in the UCAP Manual. Customers may also use backup generators to participate in the NY ISO Demand Response Programs. In the summer of 2002, the NY ISO reported that a total of 1000 MW participated in the State’s demand response programs.
Public Service Electric & Gas (PSE&G) Program Description: Rapid residential development has occurred in certain areas of New Jersey, increasing electricity demand. Many of these areas have limited commercial or industrial load to enroll in traditional curtailment programs. Looking for least-cost ways to meet the increasing demand, Public Service Electric & Gas (PSE&G) developed a program to install air conditioner load control switches in single family homes in target growth areas.
PSE&G has installed about 100,000 radio-controlled setback thermostats and load control switches on residential air conditioning systems. PSE&G’s dispatch center can send radio signals that cause them to cycle on and off for 7-10 minutes at a time when the utility calls a curtailment event. As a result, PSE&G has a diversified load reduction capability of approximately 100 MW that it can use for up to eight hours a day. Customers agree to have their units cycled in exchange for incentives that may include a new setback thermostat for the home, or a monthly payment of about $5.00 during the summer season. Most homeowner contracts limit the utility’s ability to use the system to about 100 hours per year.
Distinguishing Features of the BPA, ISO and PSE&G Examples:
BPA:
• A wholesale utility initiated the program so retail customers could help solve operational issues.
• The program seeks to relieve winter loads rather than summer loads.
• Unlike programs designed to mitigate peak power prices, this program uses demand response to avoid transmission construction.
NY ISO:
• The program sets a $500/MWh minimum regardless of market prices.
PSE&G:
• The utility dispatches aggregated load control as a system resource.
• The programs target residential loads, whereas most load response programs target larger commercial or industrial loads.
• Customers have agreed to allow the utility to control their equipment.
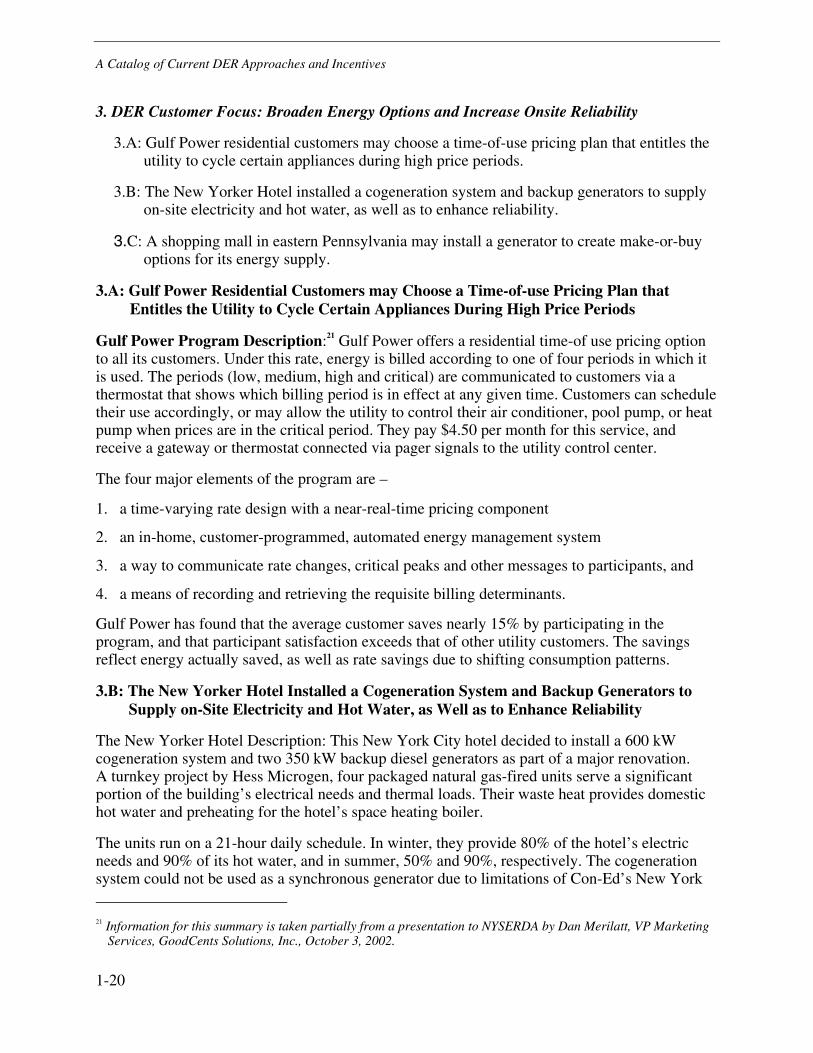
A Catalog of Current DER Approaches and Incentives
1-20
3. DER Customer Focus: Broaden Energy Options and Increase Onsite Reliability
3.A: Gulf Power residential customers may choose a time-of-use pricing plan that entitles the utility to cycle certain appliances during high price periods.
3.B: The New Yorker Hotel installed a cogeneration system and backup generators to supply on-site electricity and hot water, as well as to enhance reliability.
3.C: A shopping mall in eastern Pennsylvania may install a generator to create make-or-buy options for its energy supply.
3.A: Gulf Power Residential Customers may Choose a Time-of-use Pricing Plan that Entitles the Utility to Cycle Certain Appliances During High Price Periods
Gulf Power Program Description:21 Gulf Power offers a residential time-of use pricing option to all its customers. Under this rate, energy is billed according to one of four periods in which it is used. The periods (low, medium, high and critical) are communicated to customers via a thermostat that shows which billing period is in effect at any given time. Customers can schedule their use accordingly, or may allow the utility to control their air conditioner, pool pump, or heat pump when prices are in the critical period. They pay $4.50 per month for this service, and receive a gateway or thermostat connected via pager signals to the utility control center.
The four major elements of the program are –
1. a time-varying rate design with a near-real-time pricing component
2. an in-home, customer-programmed, automated energy management system
3. a way to communicate rate changes, critical peaks and other messages to participants, and
4. a means of recording and retrieving the requisite billing determinants.
Gulf Power has found that the average customer saves nearly 15% by participating in the program, and that participant satisfaction exceeds that of other utility customers. The savings reflect energy actually saved, as well as rate savings due to shifting consumption patterns.
3.B: The New Yorker Hotel Installed a Cogeneration System and Backup Generators to Supply on-Site Electricity and Hot Water, as Well as to Enhance Reliability
The New Yorker Hotel Description: This New York City hotel decided to install a 600 kW cogeneration system and two 350 kW backup diesel generators as part of a major renovation. A turnkey project by Hess Microgen, four packaged natural gas-fired units serve a significant portion of the building’s electrical needs and thermal loads. Their waste heat provides domestic hot water and preheating for the hotel’s space heating boiler.
The units run on a 21-hour daily schedule. In winter, they provide 80% of the hotel’s electric needs and 90% of its hot water, and in summer, 50% and 90%, respectively. The cogeneration system could not be used as a synchronous generator due to limitations of Con-Ed’s New York
21 Information for this summary is taken partially from a presentation to NYSERDA by Dan Merilatt, VP Marketing
Services, GoodCents Solutions, Inc., October 3, 2002.
A Catalog of Current DER Approaches and Incentives
1-21
network grid, so the hotel installed two backup generators for additional reliability in case of a power outage. The system was installed in the hotel’s sub-basement 50 feet below street level to meet customer requirements.
The DER provider designed, installed, owns, operates and maintains the system while guaranteeing $150,000 annual energy savings for the hotel.
3.C: A Shopping Mall in Eastern Pennsylvania may Install a Generator to Create Make-or-Buy Options for its Energy Supply
The Shopping Mall Description: A large regional mall in eastern Pennsylvania receives HVAC services and electricity from a central power plant located on mall property. A new owner of the power plant will be installing load management hardware to aggregate individual store demand response, and on-site generators to serve the mall’s electric needs, or may choose to buy electricity from one of the state’s competitive suppliers.
The value of the on-site generator will be driven by the difference in the market price between a fixed-price, all-requirements contract, and an hourly LMP-based contract for the mall. Competitive suppliers offering fixed price contracts take on the risk of supplying power in the summer when wholesale prices may rise unpredictably based on extreme weather or generating or transmission outages. They add a risk premium to cover these contingencies. By installing an on-site generator, customers can effectively provide a hard asset price hedge or risk mitigation tool.
The mall will purchase an hourly-priced product from a supplier that will fluctuate according to variations within PJM market prices at selected hubs. As long as the price stays below a predetermined strike price of $90/MWh, the mall will buy electricity from the grid. When the local LMP exceeds the strike price, the mall operator will turn on the generators and run them until prices retreat below the strike price.
Distinguishing Features of the Gulf Power, New Yorker and Pennsylvania Mall Examples:
Gulf Power:
• Residential customers have access to a program that lets them control their bills by scheduling their electric usage.
• The utility has positioned the rate as a service offering, with enabling technology that it provides for a fee – possibly an attractive approach for other utilities.
New Yorker Hotel:
• The cogeneration system was installed in New York City, one of the most difficult areas to site local generation.
• The DER provider owns and operates the facility while guaranteeing the host energy savings.
The Mall:
• DG becomes a tool in the customer’s energy procurement strategy.
• The value of DER in the wholesale market is much higher than the sum of the avoided hourly purchases of a demand response strategy.
A Catalog of Current DER Approaches and Incentives
1-22
4. Regulatory and Societal Focus: Increase Energy Efficiency and Improve Environmental Quality
4.A: New York, California and Texas offer incentives to customers that install clean, efficient and/or renewable energy equipment.
4.B: New Jersey requires competitive suppliers in the State to provide a small percentage of distributed solar power in their supply portfolio.
4.A: New York, California, and Texas Offer Incentives to Customers that Install Clean, Efficient and/or Renewable Energy Equipment
New York Program Descriptions: New York utilities collect from their customers in rates about $150 million a year in ‘system benefit charges’ (SBC). These funds are administered by the New York State Energy Research and Development Authority (NYSERDA), which offer incentives to utility customers to install energy efficient equipment, cogeneration systems, and renewable technologies.
As of 2003, NYSERDA has committed $27 million for 57 combined heating and power (CHP) projects, $800,000 for 13 feasibility studies, and $4 million for 11 projects to develop DG technologies. With co-funding, these projects represent about $100 million investment in DG/CHP. NYSERDA also offers a peak load reduction program incentive that pays 70% of the costs of installing interval meters; at least 37,000 such meters have been installed in 300 multifamily buildings.
NYSERDA targets $14 million a year of SBC funding to renewables, with much of that dedicated to large-scale wind development. Eligible customers are New York electric distribution customers of the State’s six investor-owned utilities. This funding also targets distributed PV, with most of the funding awarded through competitive RFPs issued as new programs are developed. Program examples follow:
• New Construction – $3 million of Energy Smart New Construction funds are targeted to building- integrated PV. New York’s Energy Smart Loan Fund also provides interest rate reductions of 4.5% for up to five years on loans for energy efficiency projects and renewable technologies.
• Consumer PV incentives – $2.5 million PV Incentive Program, until December 2005, provides $4-5.00/watt, up to 70% of total system cost, for projects up to 15 kW.
• Larger PV systems – $3 million program provides $5.00/watt, up to $500,000 per site. Eligible buildings are those in SBC utilities’ territory or public buildings in municipal utility areas.
• PV System and Energy Star® Home Demonstration Project – NYSERDA is working with the National Association of Home Builders and Steven Winters Associates to develop and implement a demonstration program and awareness campaign to inform builders, realtors, appraisers, bankers, consumers, and building code officials about the benefits of Energy Star homes and grid-connected PV systems for homes, and to provide incentives for both. Grid-connected PV incentives are up to $20,000 or 100% of system costs on model homes, and 60-75% for additional PV systems in a subdivision.
A Catalog of Current DER Approaches and Incentives
1-23
Long Island Power Authority (LIPA)
Since LIPA is a public entity, its customers are not eligible for NYSERDA-sponsored programs, but LIPA itself has committed $32 million to develop clean energy alternatives. Part of this commitment is its Solar Pioneer Program, a five-year initiative offering rebates of $5 per watt (up to $60,000). Maximum eligible system size is 10 kW. Six percent loan financing is also available.
California Program Descriptions: California offers two direct financial incentive programs to support DER deployment. One, for small renewable resources, is administered by the California Energy Commission (CEC). The other, for some larger technologies including both renewable and non-renewable resources, is administered by California’s investor-owned utilities22 under a legislative mandate interpreted by the California Public Utilities Commission (CPUC). Both programs are summarized below.
CEC Emerging Renewables Program
The CEC began administering the Emerging Renewables Buy-Down Program (ERBP) in 1998. The ERBP provided cash rebates equal to the lesser of $4,500/kW or 50% of system costs, for customers of all classes in IOU service areas who installed eligible renewable generating systems. Through 2002, the ERBP helped fund over 3,800 new installations, most of them solar photovoltaic.
Early in 2003, the CEC renamed this program the Emerging Renewables Program (ERP), and modified some of its eligibility criteria. Eligible technologies now include:
• solar PV
• solar thermal electric systems
• wind turbines up to 50 kW
• fuel cells operating on renewable fuels (digester gas, landfill gas, etc.)23
To qualify for the CEC’s ERP rebates, systems must be new, non-utility owned systems connected to investor-owned utility distribution facilities. They must be sized primarily to offset the customer’s electricity needs at the site, producing no more than 200% of the site’s needs; have at least a five-year warranty; and install meters that measure total energy output.24
The ERP program reduces the rebate levels offered under the earlier ERBP, both initially and over time: 22 In SDG&E’s territory, the program is administered by the nonprofit San Diego Regional Energy Office, to provide
a basis for comparing utility and non-utility program administration.
23 Other technologies may be added to this list by petitioning the CEC and demonstrating that they meet specified criteria (e.g., need for funding to become commercially viable; new generating process; commercially available; demonstrated; warranted for 5 years; 20-year useful life; etc.)
24 For detailed requirements, see the CEC’s Emerging Renewables Program Guidebook adopted February 19, 2003, pp. 4-7,; available at http://www.consumerenergycenter.org/erprebate/forms.html. Additional requirements apply, and higher rebates are available to, affordable housing projects; see Guidebook p.21-22. Practically speaking, another important limitation is that funds remain in the CEC’s Emerging Renewable Resources Account in a given year.
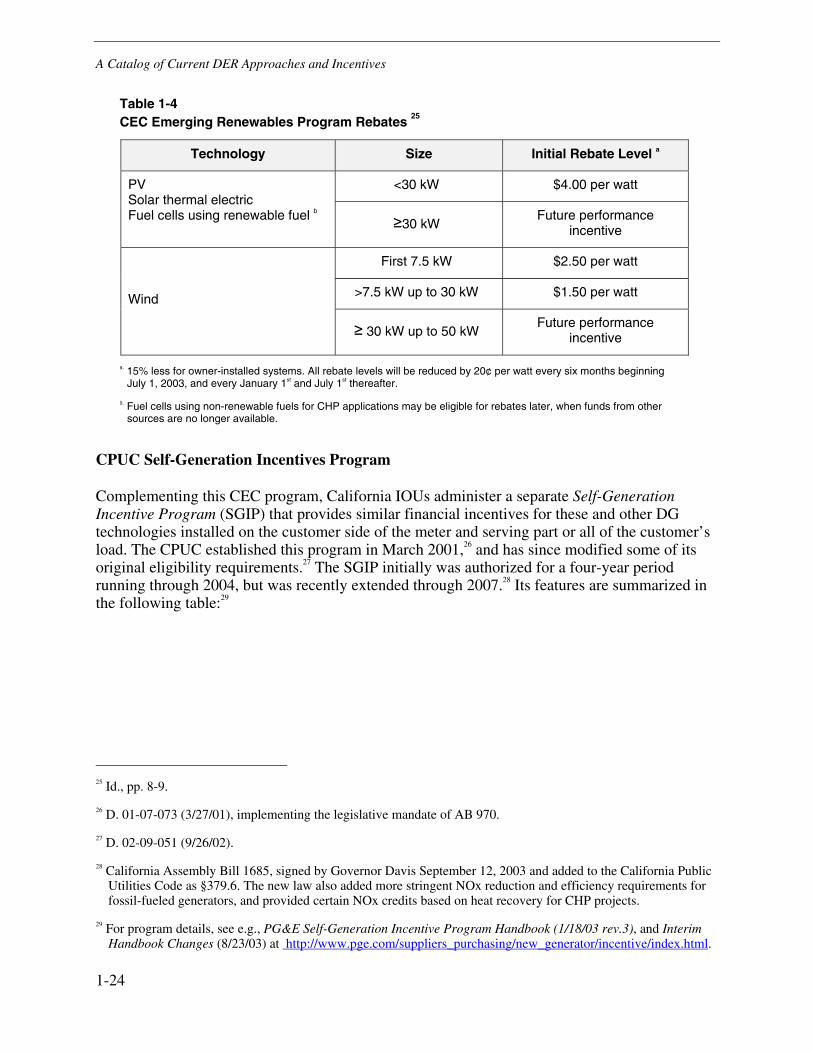
A Catalog of Current DER Approaches and Incentives
1-24
Table 1-4 CEC Emerging Renewables Program Rebates
25
Technology Size Initial Rebate Level a
<30 kW $4.00 per watt PV Solar thermal electric Fuel cells using renewable fuel b ≥30 kW
Future performance incentive
First 7.5 kW $2.50 per watt
>7.5 kW up to 30 kW $1.50 per watt Wind
≥ 30 kW up to 50 kW Future performance
incentive
a. 15% less for owner-installed systems. All rebate levels will be reduced by 20¢ per watt every six months beginning July 1, 2003, and every January 1st and July 1st thereafter.
b. Fuel cells using non-renewable fuels for CHP applications may be eligible for rebates later, when funds from other sources are no longer available.
CPUC Self-Generation Incentives Program
Complementing this CEC program, California IOUs administer a separate Self-Generation Incentive Program (SGIP) that provides similar financial incentives for these and other DG technologies installed on the customer side of the meter and serving part or all of the customer’s load. The CPUC established this program in March 2001,26 and has since modified some of its original eligibility requirements.27 The SGIP initially was authorized for a four-year period running through 2004, but was recently extended through 2007.28 Its features are summarized in the following table:29
25 Id., pp. 8-9.
26 D. 01-07-073 (3/27/01), implementing the legislative mandate of AB 970.
27 D. 02-09-051 (9/26/02).
28 California Assembly Bill 1685, signed by Governor Davis September 12, 2003 and added to the California Public Utilities Code as §379.6. The new law also added more stringent NOx reduction and efficiency requirements for fossil-fueled generators, and provided certain NOx credits based on heat recovery for CHP projects.
29 For program details, see e.g., PG&E Self-Generation Incentive Program Handbook (1/18/03 rev.3), and Interim Handbook Changes (8/23/03) at http://www.pge.com/suppliers_purchasing/new_generator/incentive/index.html.
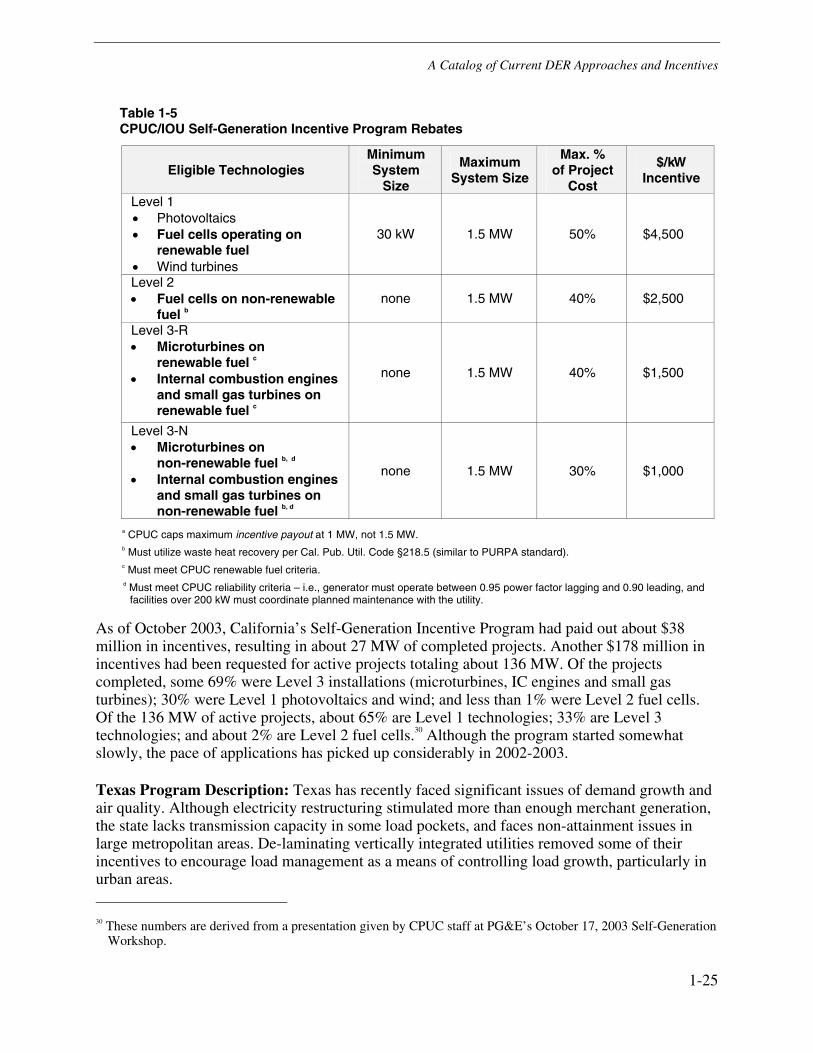
A Catalog of Current DER Approaches and Incentives
1-25
Table 1-5 CPUC/IOU Self-Generation Incentive Program Rebates
Eligible Technologies Minimum System
Size
Maximum System Size
Max. % of Project
Cost
$/kW Incentive
Level 1 • Photovoltaics • Fuel cells operating on
renewable fuel • Wind turbines
30 kW 1.5 MW 50% $4,500
Level 2 • Fuel cells on non-renewable
fuel b none 1.5 MW 40% $2,500
Level 3-R • Microturbines on
renewable fuel c • Internal combustion engines
and small gas turbines on renewable fuel c
none 1.5 MW 40% $1,500
Level 3-N • Microturbines on
non-renewable fuel b, d • Internal combustion engines
and small gas turbines on non-renewable fuel b, d
none 1.5 MW 30% $1,000
a CPUC caps maximum incentive payout at 1 MW, not 1.5 MW. b Must utilize waste heat recovery per Cal. Pub. Util. Code §218.5 (similar to PURPA standard). c Must meet CPUC renewable fuel criteria. d Must meet CPUC reliability criteria – i.e., generator must operate between 0.95 power factor lagging and 0.90 leading, and
facilities over 200 kW must coordinate planned maintenance with the utility.
As of October 2003, California’s Self-Generation Incentive Program had paid out about $38 million in incentives, resulting in about 27 MW of completed projects. Another $178 million in incentives had been requested for active projects totaling about 136 MW. Of the projects completed, some 69% were Level 3 installations (microturbines, IC engines and small gas turbines); 30% were Level 1 photovoltaics and wind; and less than 1% were Level 2 fuel cells. Of the 136 MW of active projects, about 65% are Level 1 technologies; 33% are Level 3 technologies; and about 2% are Level 2 fuel cells.30 Although the program started somewhat slowly, the pace of applications has picked up considerably in 2002-2003.
Texas Program Description: Texas has recently faced significant issues of demand growth and air quality. Although electricity restructuring stimulated more than enough merchant generation, the state lacks transmission capacity in some load pockets, and faces non-attainment issues in large metropolitan areas. De-laminating vertically integrated utilities removed some of their incentives to encourage load management as a means of controlling load growth, particularly in urban areas. 30 These numbers are derived from a presentation given by CPUC staff at PG&E’s October 17, 2003 Self-Generation
Workshop.
A Catalog of Current DER Approaches and Incentives
1-26
As part of its responsibility to ensure that energy supplies are adequate and cost-effective, the Texas Public Utility Commission promulgated rules31 requiring electric utilities to administer energy savings incentive programs. The programs’ goals were to acquire cost-effective energy efficiency savings32 totaling at least 10% of the utility's annual demand growth by January 1, 2004, and each year thereafter.
Under the program, energy efficiency service providers (EESPs) will contract with the local distribution company to deliver targeted load reduction when requested. EESPs may be local or national energy service companies, retail electricity providers, or individual customers – but not Texas distribution utilities, which generally are barred from providing competitive services, including efficiency services.
Eligible efficiency measures include those that place electricity-consuming equipment under the dispatch control of the EESP, an ISO, or another transmission organization. Load reduction must be available within one hour after utility notification, and measured through time-of-use metering.
Project sponsors apply to the local utility administrator with a plan that identifies project sites, proposed demand reduction, estimated incentive payments, and measurement and verification procedures. Approval of the initial application reserves funding for the minimum load reduction requested. Payments are made after auditing the project’s demand reductions.
Utilities pay EESPs through 10-year standard offer contracts for kW and kWh avoided at peak, with payments capped at the theoretical avoided cost of a gas turbine. For 2003, capacity payments have been set at $78.50/KW/year, and energy payments at $.0268/ kWh. Utilities can recover these incentive payments and their administrative costs through their distribution tariffs.
Distinguishing Features of the New York, California, and Texas Examples:
New York:
• An independent state agency (NYSERDA) administers the incentive program, avoiding the appearance of conflict that sometimes arises when utilities are asked to administer such programs.
• The incentive program specifically recognizes the efficiency value of CHP projects.
California:
• The CEC-administered emerging renewables buydown (rebate) program has stimulated substantial increased market activity for small PV systems.
• The CPUC-directed self-generation incentive program, targeted to reduce peak demand,, offers tiered incentives for customer-side distributed generation, with significantly higher payments for cleaner, more efficient technologies.
31 Texas Administrative Code, Tit. 16, Part II, Chapter 25. §25.181; effective January 1, 2003.
32 Projects using self-generation or cogeneration equipment are not eligible for incentives, except for ‘renewable DSM technologies’ – i.e., customer-sited equipment that uses a renewable resource to reduce net kWh and/or kW purchases. Id., §§25.181(i)(6)(D), (c)(28), (j)(2)(M).
A Catalog of Current DER Approaches and Incentives
1-27
• Although the utility-administered self-generation incentive program started slowly it has gained momentum, resulting so far in about 27 MW of self-generation (mostly microturbines, IC engines and small gas turbines), with an additional 136 MW in progress and more expected now that the program has been extended through 2007.
Texas:
• The PUC sets the value of deferred demand and the maximum contract term, so EESPs can determine project economics more transparently than through a multi-step RFP process.
• Distribution utilities cannot participate in demand response or renewable DG projects.
4.B: New Jersey Requires Competitive Suppliers in the State to Provide a Small Percentage of Distributed Solar Power in their Supply Portfolio
New Jersey Program Description: New Jersey opened its electricity market to competition in 1999. Competitive suppliers have not offered lower energy prices than the utilities’ default tariffs, so consumer shopping has been limited. In order to facilitate competitive markets, the New Jersey Board of Public Utilities (BPU) has required all utilities in the state to serve their default loads with energy and capacity purchased through a competitive bidding process called the Basic Generation Service (BGS) auction.
BGS auction winners must furnish a percentage of the power they provide to customers from renewable energy sources, under New Jersey’s Renewable Portfolio Standard (RPS). BPU RPS rules define Class One and Class Two renewables and the percentage of each that must be furnished. The BPU has proposed changes recommended by the Governor’s Renewable Energy Task Force that would increase the Class One and Class Two requirements, and would require competitive suppliers in the state to provide a small percentage of distributed solar power in their supply portfolio. Suppliers can either purchase renewable energy credits (REC) from solar PV projects, or make Alternative Compliance Payments (ACP). To encourage REC purchases, the BPU will administratively set the ACP amounts at a premium over the price of solar RECs in the marketplace.
The proposed rule was published in the New Jersey Register on October 6, 2003, and is expected to take effect around January 2004, before the next BGS auction round scheduled for February 2004. Suppliers will need to purchase solar RECs to cover their obligations for the first program year (June 1, 2004-May 31, 2005). The BPU is also proposing rule changes to further simplify interconnection, and to increase the net metering limit from 100 kW to 2 MW.
Distinguishing features of the New Jersey Example:
• Most RPS programs do not provide incentives specifically for DER. The least-cost renewable resources used to meet RPS requirements are usually wind or landfill gas, often located far from customer loads. New Jersey’s solar REC program will create a market for distributed solar as well.
• Solar RECs will be available for projects located at customer facilities, permitting recognition of DER retail value as well as REC value for the RPS market.
• Increased size limits for net metered systems will enable larger seasonal users (e.g. schools) to recognize PV’s retail value of even if their facility loads are not consistent across the year.

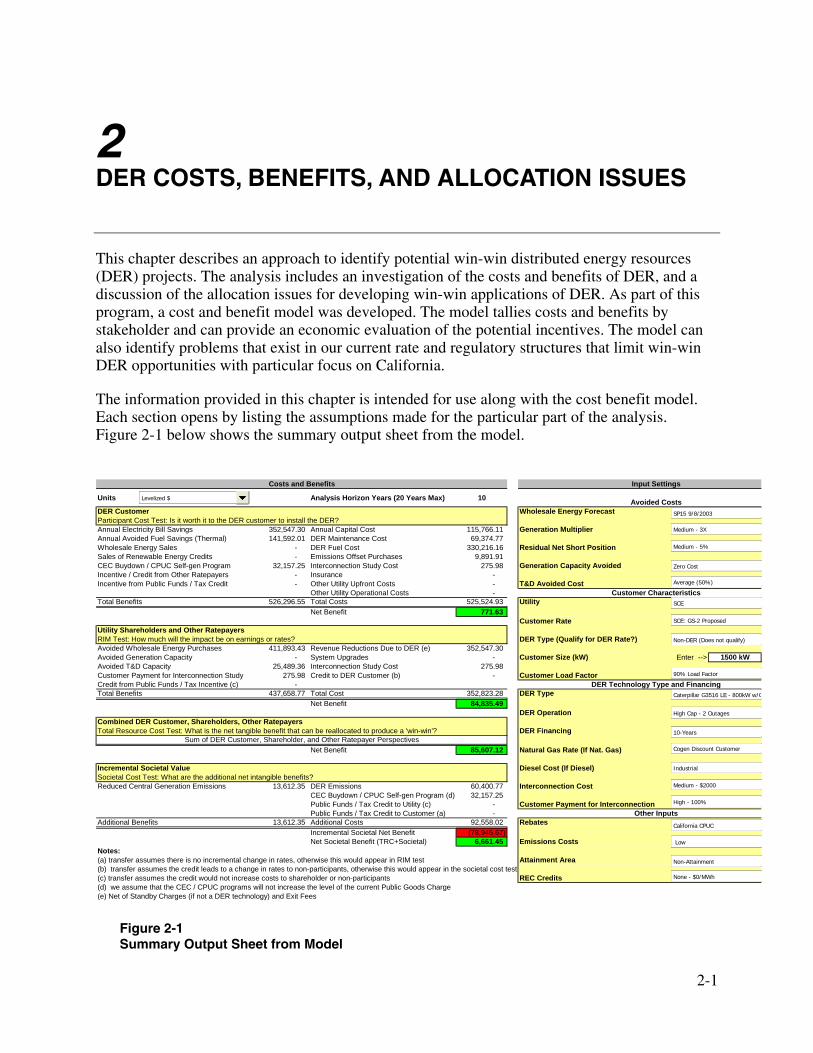
2-1
2 DER COSTS, BENEFITS, AND ALLOCATION ISSUES
This chapter describes an approach to identify potential win-win distributed energy resources (DER) projects. The analysis includes an investigation of the costs and benefits of DER, and a discussion of the allocation issues for developing win-win applications of DER. As part of this program, a cost and benefit model was developed. The model tallies costs and benefits by stakeholder and can provide an economic evaluation of the potential incentives. The model can also identify problems that exist in our current rate and regulatory structures that limit win-win DER opportunities with particular focus on California.
The information provided in this chapter is intended for use along with the cost benefit model. Each section opens by listing the assumptions made for the particular part of the analysis. Figure 2-1 below shows the summary output sheet from the model.
Costs and Benefits Input Settings
Units Analysis Horizon Years (20 Years Max) 10 Avoided CostsDER Customer Wholesale Energy ForecastParticipant Cost Test: Is it worth it to the DER customer to install the DER?Annual Electricity Bill Savings 352,547.30 Annual Capital Cost 115,766.11 Generation MultiplierAnnual Avoided Fuel Savings (Thermal) 141,592.01 DER Maintenance Cost 69,374.77 Wholesale Energy Sales - DER Fuel Cost 330,216.16 Residual Net Short PositionSales of Renewable Energy Credits - Emissions Offset Purchases 9,891.91 CEC Buydown / CPUC Self-gen Program 32,157.25 Interconnection Study Cost 275.98 Generation Capacity AvoidedIncentive / Credit from Other Ratepayers - Insurance - Incentive from Public Funds / Tax Credit - Other Utility Upfront Costs - T&D Avoided Cost
Other Utility Operational Costs - Customer CharacteristicsTotal Benefits 526,296.55 Total Costs 525,524.93 Utility
Net Benefit 771.63 Customer Rate
Utility Shareholders and Other RatepayersRIM Test: How much will the impact be on earnings or rates? DER Type (Qualify for DER Rate?)Avoided Wholesale Energy Purchases 411,893.43 Revenue Reductions Due to DER (e) 352,547.30 Avoided Generation Capacity - System Upgrades - Customer Size (kW) Enter --> 1500 kWAvoided T&D Capacity 25,489.36 Interconnection Study Cost 275.98 Customer Payment for Interconnection Study 275.98 Credit to DER Customer (b) - Customer Load FactorCredit from Public Funds / Tax Incentive (c) - DER Technology Type and FinancingTotal Benefits 437,658.77 Total Cost 352,823.28 DER Type
Net Benefit 84,835.49 DER Operation
Combined DER Customer, Shareholders, Other RatepayersTotal Resource Cost Test: What is the net tangible benefit that can be reallocated to produce a 'win-win'? DER Financing
Sum of DER Customer, Shareholder, and Other Ratepayer PerspectivesNet Benefit 85,607.12 Natural Gas Rate (If Nat. Gas)
Incremental Societal Value Diesel Cost (If Diesel)Societal Cost Test: What are the additional net intangible benefits?Reduced Central Generation Emissions 13,612.35 DER Emissions 60,400.77 Interconnection Cost
CEC Buydown / CPUC Self-gen Program (d) 32,157.25 Public Funds / Tax Credit to Utility (c) - Customer Payment for InterconnectionPublic Funds / Tax Credit to Customer (a) - Other Inputs
Additional Benefits 13,612.35 Additional Costs 92,558.02 RebatesIncremental Societal Net Benefit (78,945.67) Net Societal Benefit (TRC+Societal) 6,661.45 Emissions Costs
Notes:(a) transfer assumes there is no incremental change in rates, otherwise this would appear in RIM test Attainment Area 2(b) transfer assumes the credit leads to a change in rates to non-participants, otherwise this would appear in the societal cost test(c) transfer assumes the credit would not increase costs to shareholder or non-participants REC Credits(d) we assume that the CEC / CPUC programs will not increase the level of the current Public Goods Charge(e) Net of Standby Charges (if not a DER technology) and Exit Fees
SCE
SP15 9/8/2003
SCE: GS-2 Proposed
Caterpillar G3516 LE - 800kW w/C
Non-DER (Does not qualify)
90% Load Factor
Zero Cost
Average (50%)
10-Years
High Cap - 2 Outages
Cogen Discount Customer
Low
Medium - 3X
Industrial
Medium - 5%
California CPUC
Medium - $2000
High - 100%
None - $0/MWh
Levelized $
Non-Attainment
Figure 2-1 Summary Output Sheet from Model
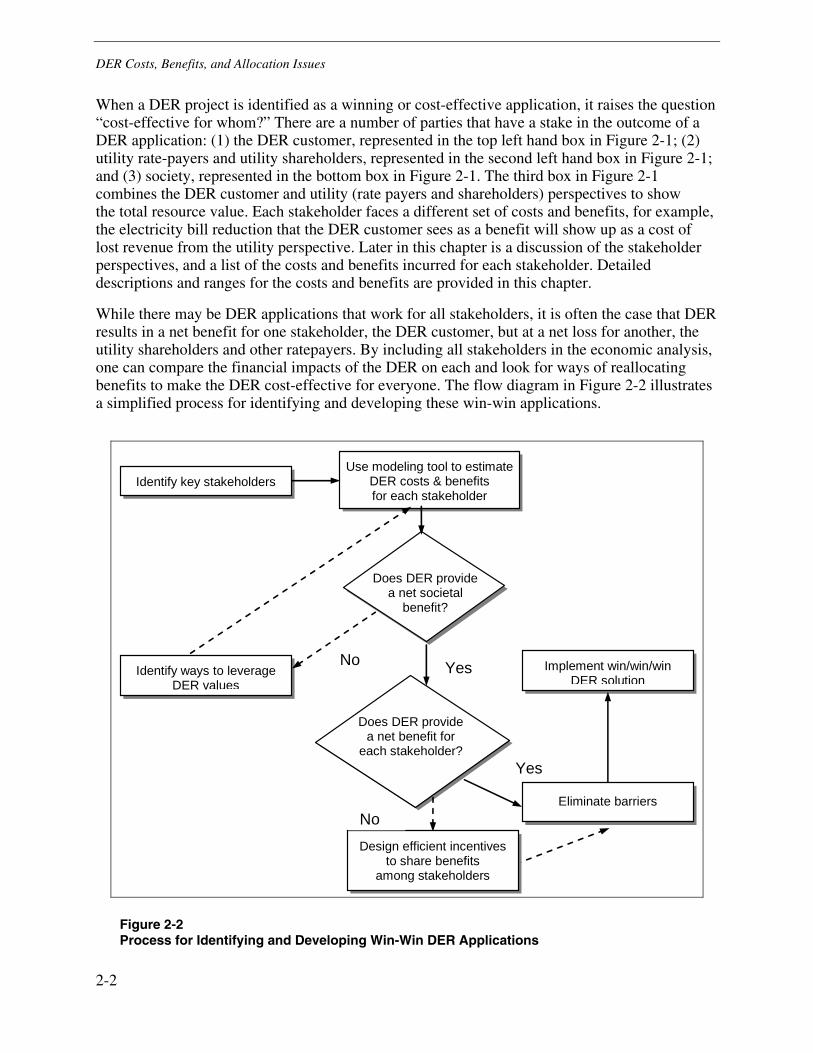
DER Costs, Benefits, and Allocation Issues
2-2
When a DER project is identified as a winning or cost-effective application, it raises the question “cost-effective for whom?” There are a number of parties that have a stake in the outcome of a DER application: (1) the DER customer, represented in the top left hand box in Figure 2-1; (2) utility rate-payers and utility shareholders, represented in the second left hand box in Figure 2-1; and (3) society, represented in the bottom box in Figure 2-1. The third box in Figure 2-1 combines the DER customer and utility (rate payers and shareholders) perspectives to show the total resource value. Each stakeholder faces a different set of costs and benefits, for example, the electricity bill reduction that the DER customer sees as a benefit will show up as a cost of lost revenue from the utility perspective. Later in this chapter is a discussion of the stakeholder perspectives, and a list of the costs and benefits incurred for each stakeholder. Detailed descriptions and ranges for the costs and benefits are provided in this chapter.
While there may be DER applications that work for all stakeholders, it is often the case that DER results in a net benefit for one stakeholder, the DER customer, but at a net loss for another, the utility shareholders and other ratepayers. By including all stakeholders in the economic analysis, one can compare the financial impacts of the DER on each and look for ways of reallocating benefits to make the DER cost-effective for everyone. The flow diagram in Figure 2-2 illustrates a simplified process for identifying and developing these win-win applications.
Identify key stakeholders
Use modeling tool to estimate DER costs & benefits for each stakeholder
Identify ways to leverage DER values
Implement win/win/win DER solution
Does DER provide a net societal
benefit?
Does DER provide a net benefit for
each stakeholder?
Eliminate barriers
Design efficient incentives to share benefits
among stakeholders
Yes
Yes
No
No
Figure 2-2 Process for Identifying and Developing Win-Win DER Applications
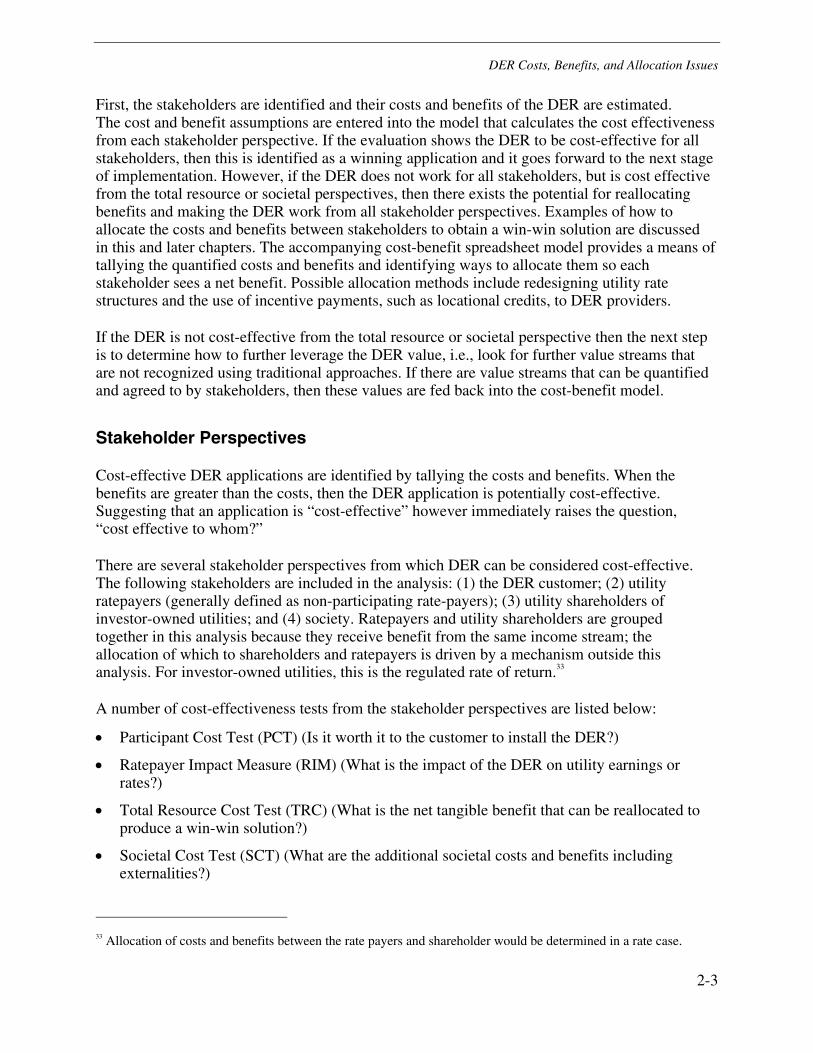
DER Costs, Benefits, and Allocation Issues
2-3
First, the stakeholders are identified and their costs and benefits of the DER are estimated. The cost and benefit assumptions are entered into the model that calculates the cost effectiveness from each stakeholder perspective. If the evaluation shows the DER to be cost-effective for all stakeholders, then this is identified as a winning application and it goes forward to the next stage of implementation. However, if the DER does not work for all stakeholders, but is cost effective from the total resource or societal perspectives, then there exists the potential for reallocating benefits and making the DER work from all stakeholder perspectives. Examples of how to allocate the costs and benefits between stakeholders to obtain a win-win solution are discussed in this and later chapters. The accompanying cost-benefit spreadsheet model provides a means of tallying the quantified costs and benefits and identifying ways to allocate them so each stakeholder sees a net benefit. Possible allocation methods include redesigning utility rate structures and the use of incentive payments, such as locational credits, to DER providers.
If the DER is not cost-effective from the total resource or societal perspective then the next step is to determine how to further leverage the DER value, i.e., look for further value streams that are not recognized using traditional approaches. If there are value streams that can be quantified and agreed to by stakeholders, then these values are fed back into the cost-benefit model.
Stakeholder Perspectives
Cost-effective DER applications are identified by tallying the costs and benefits. When the benefits are greater than the costs, then the DER application is potentially cost-effective. Suggesting that an application is “cost-effective” however immediately raises the question, “cost effective to whom?”
There are several stakeholder perspectives from which DER can be considered cost-effective. The following stakeholders are included in the analysis: (1) the DER customer; (2) utility ratepayers (generally defined as non-participating rate-payers); (3) utility shareholders of investor-owned utilities; and (4) society. Ratepayers and utility shareholders are grouped together in this analysis because they receive benefit from the same income stream; the allocation of which to shareholders and ratepayers is driven by a mechanism outside this analysis. For investor-owned utilities, this is the regulated rate of return.33
A number of cost-effectiveness tests from the stakeholder perspectives are listed below:
• Participant Cost Test (PCT) (Is it worth it to the customer to install the DER?)
• Ratepayer Impact Measure (RIM) (What is the impact of the DER on utility earnings or rates?)
• Total Resource Cost Test (TRC) (What is the net tangible benefit that can be reallocated to produce a win-win solution?)
• Societal Cost Test (SCT) (What are the additional societal costs and benefits including externalities?)
33 Allocation of costs and benefits between the rate payers and shareholder would be determined in a rate case.
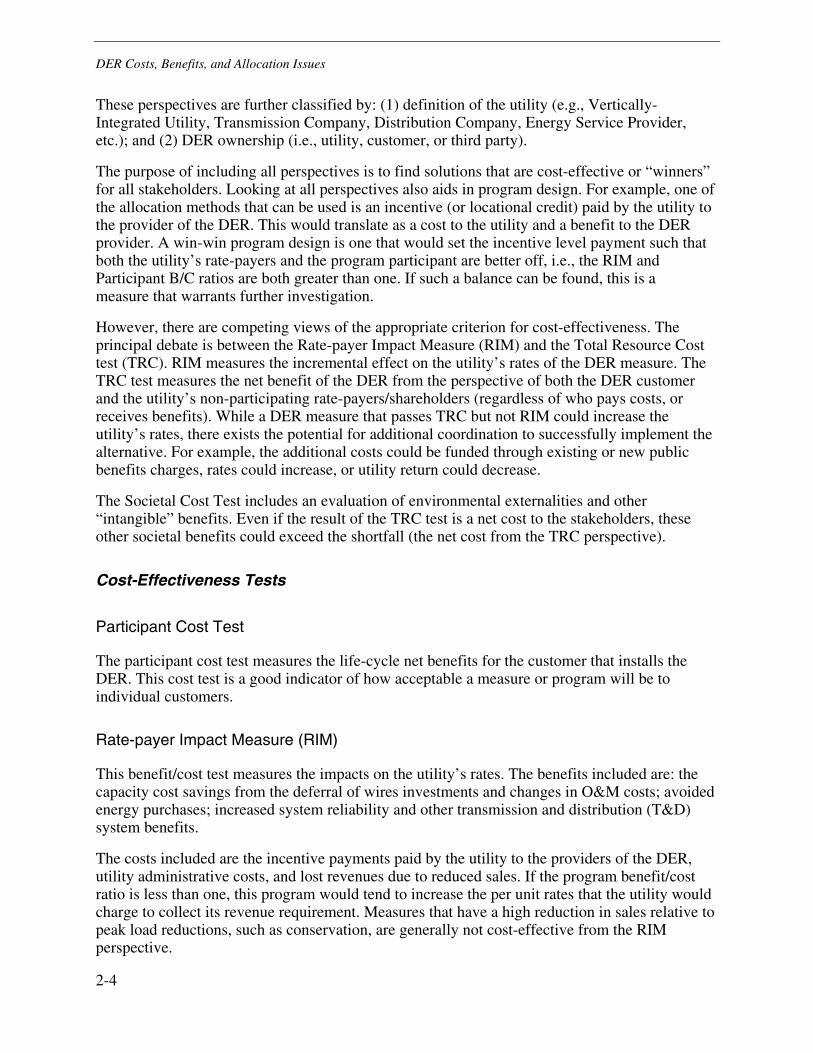
DER Costs, Benefits, and Allocation Issues
2-4
These perspectives are further classified by: (1) definition of the utility (e.g., Vertically-Integrated Utility, Transmission Company, Distribution Company, Energy Service Provider, etc.); and (2) DER ownership (i.e., utility, customer, or third party).
The purpose of including all perspectives is to find solutions that are cost-effective or “winners” for all stakeholders. Looking at all perspectives also aids in program design. For example, one of the allocation methods that can be used is an incentive (or locational credit) paid by the utility to the provider of the DER. This would translate as a cost to the utility and a benefit to the DER provider. A win-win program design is one that would set the incentive level payment such that both the utility’s rate-payers and the program participant are better off, i.e., the RIM and Participant B/C ratios are both greater than one. If such a balance can be found, this is a measure that warrants further investigation.
However, there are competing views of the appropriate criterion for cost-effectiveness. The principal debate is between the Rate-payer Impact Measure (RIM) and the Total Resource Cost test (TRC). RIM measures the incremental effect on the utility’s rates of the DER measure. The TRC test measures the net benefit of the DER from the perspective of both the DER customer and the utility’s non-participating rate-payers/shareholders (regardless of who pays costs, or receives benefits). While a DER measure that passes TRC but not RIM could increase the utility’s rates, there exists the potential for additional coordination to successfully implement the alternative. For example, the additional costs could be funded through existing or new public benefits charges, rates could increase, or utility return could decrease.
The Societal Cost Test includes an evaluation of environmental externalities and other “intangible” benefits. Even if the result of the TRC test is a net cost to the stakeholders, these other societal benefits could exceed the shortfall (the net cost from the TRC perspective).
Cost-Effectiveness Tests
Participant Cost Test
The participant cost test measures the life-cycle net benefits for the customer that installs the DER. This cost test is a good indicator of how acceptable a measure or program will be to individual customers.
Rate-payer Impact Measure (RIM)
This benefit/cost test measures the impacts on the utility’s rates. The benefits included are: the capacity cost savings from the deferral of wires investments and changes in O&M costs; avoided energy purchases; increased system reliability and other transmission and distribution (T&D) system benefits.
The costs included are the incentive payments paid by the utility to the providers of the DER, utility administrative costs, and lost revenues due to reduced sales. If the program benefit/cost ratio is less than one, this program would tend to increase the per unit rates that the utility would charge to collect its revenue requirement. Measures that have a high reduction in sales relative to peak load reductions, such as conservation, are generally not cost-effective from the RIM perspective.
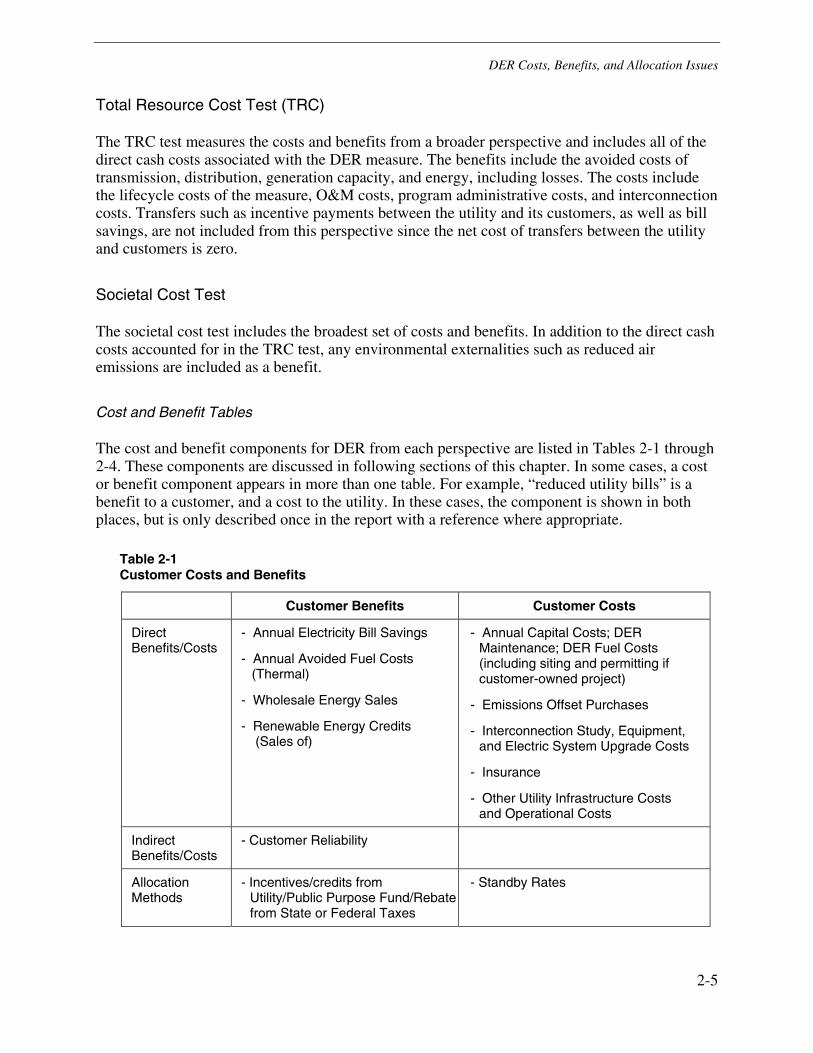
DER Costs, Benefits, and Allocation Issues
2-5
Total Resource Cost Test (TRC)
The TRC test measures the costs and benefits from a broader perspective and includes all of the direct cash costs associated with the DER measure. The benefits include the avoided costs of transmission, distribution, generation capacity, and energy, including losses. The costs include the lifecycle costs of the measure, O&M costs, program administrative costs, and interconnection costs. Transfers such as incentive payments between the utility and its customers, as well as bill savings, are not included from this perspective since the net cost of transfers between the utility and customers is zero.
Societal Cost Test
The societal cost test includes the broadest set of costs and benefits. In addition to the direct cash costs accounted for in the TRC test, any environmental externalities such as reduced air emissions are included as a benefit.
Cost and Benefit Tables
The cost and benefit components for DER from each perspective are listed in Tables 2-1 through 2-4. These components are discussed in following sections of this chapter. In some cases, a cost or benefit component appears in more than one table. For example, “reduced utility bills” is a benefit to a customer, and a cost to the utility. In these cases, the component is shown in both places, but is only described once in the report with a reference where appropriate.
Table 2-1 Customer Costs and Benefits
Customer Benefits Customer Costs
Direct Benefits/Costs
- Annual Electricity Bill Savings
- Annual Avoided Fuel Costs (Thermal)
- Wholesale Energy Sales
- Renewable Energy Credits (Sales of)
- Annual Capital Costs; DER Maintenance; DER Fuel Costs (including siting and permitting if customer-owned project)
- Emissions Offset Purchases
- Interconnection Study, Equipment, and Electric System Upgrade Costs
- Insurance
- Other Utility Infrastructure Costs and Operational Costs
Indirect Benefits/Costs
- Customer Reliability
Allocation Methods
- Incentives/credits from Utility/Public Purpose Fund/Rebate from State or Federal Taxes
- Standby Rates
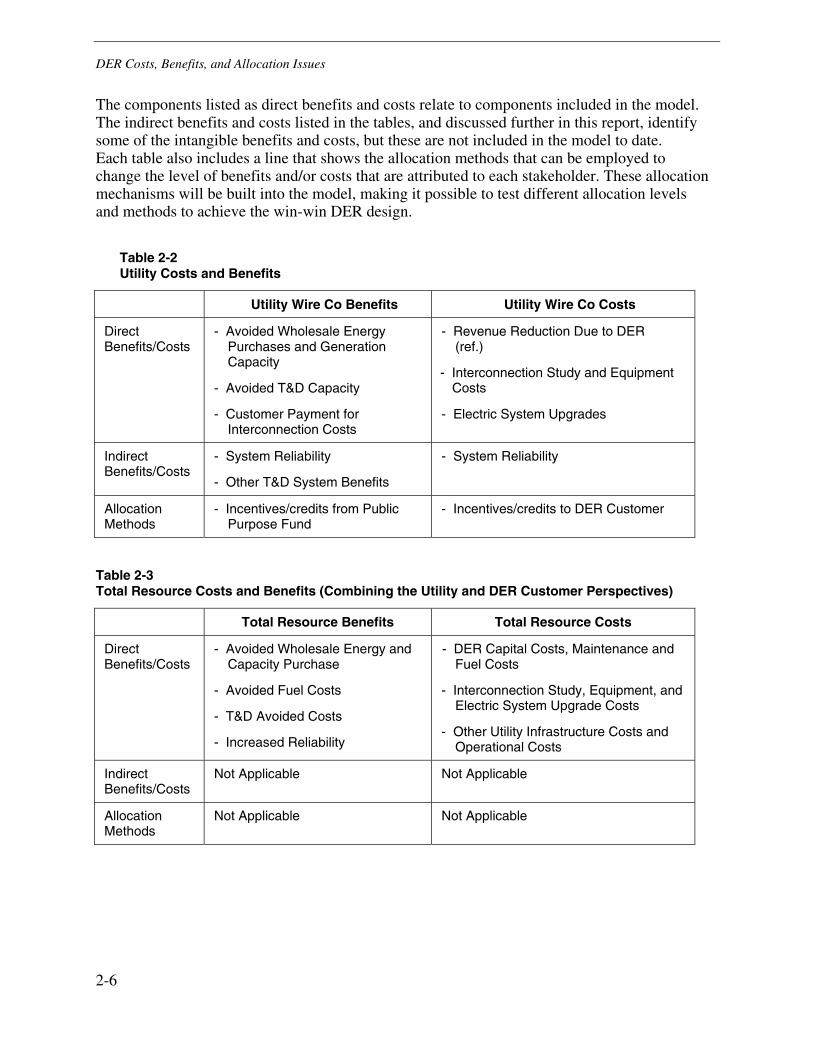
DER Costs, Benefits, and Allocation Issues
2-6
The components listed as direct benefits and costs relate to components included in the model. The indirect benefits and costs listed in the tables, and discussed further in this report, identify some of the intangible benefits and costs, but these are not included in the model to date. Each table also includes a line that shows the allocation methods that can be employed to change the level of benefits and/or costs that are attributed to each stakeholder. These allocation mechanisms will be built into the model, making it possible to test different allocation levels and methods to achieve the win-win DER design.
Table 2-2 Utility Costs and Benefits
Utility Wire Co Benefits Utility Wire Co Costs
Direct Benefits/Costs
- Avoided Wholesale Energy Purchases and Generation Capacity
- Avoided T&D Capacity
- Customer Payment for Interconnection Costs
- Revenue Reduction Due to DER (ref.)
- Interconnection Study and Equipment Costs
- Electric System Upgrades
Indirect Benefits/Costs
- System Reliability
- Other T&D System Benefits
- System Reliability
Allocation Methods
- Incentives/credits from Public Purpose Fund
- Incentives/credits to DER Customer
Table 2-3 Total Resource Costs and Benefits (Combining the Utility and DER Customer Perspectives)
Total Resource Benefits Total Resource Costs
Direct Benefits/Costs
- Avoided Wholesale Energy and Capacity Purchase
- Avoided Fuel Costs
- T&D Avoided Costs
- Increased Reliability
- DER Capital Costs, Maintenance and Fuel Costs
- Interconnection Study, Equipment, and Electric System Upgrade Costs
- Other Utility Infrastructure Costs and Operational Costs
Indirect Benefits/Costs
Not Applicable Not Applicable
Allocation Methods
Not Applicable Not Applicable
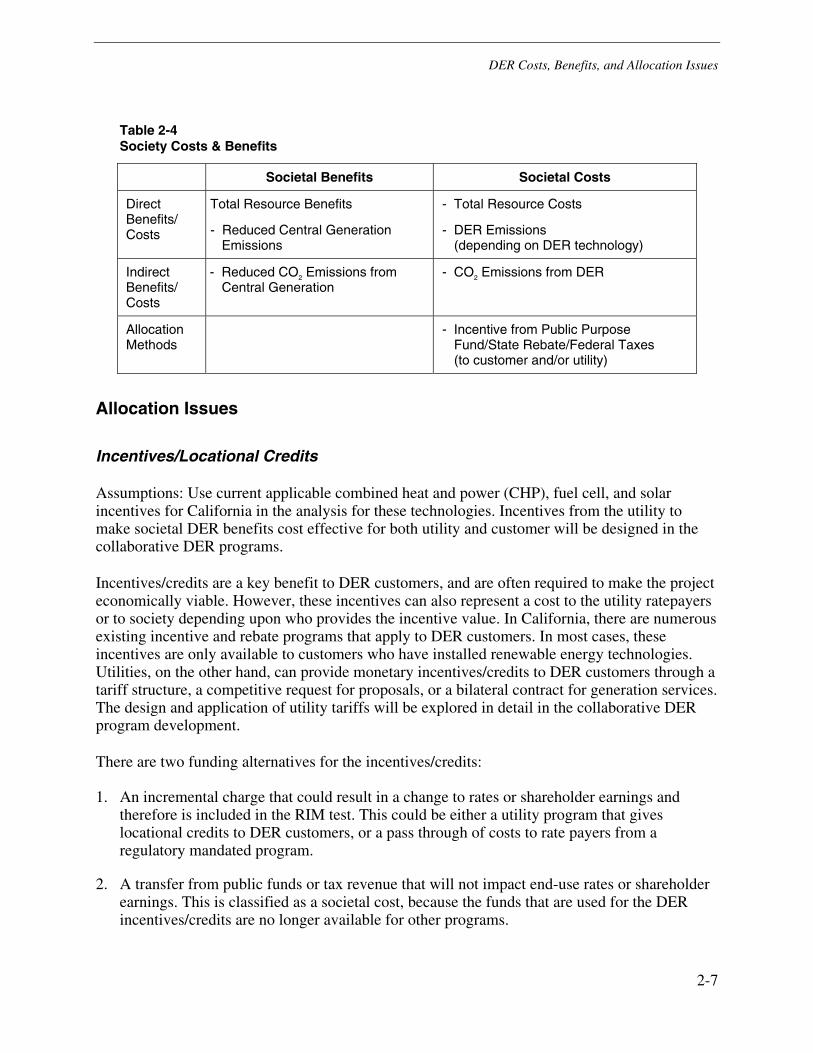
DER Costs, Benefits, and Allocation Issues
2-7
Table 2-4 Society Costs & Benefits
Societal Benefits Societal Costs
Direct Benefits/ Costs
Total Resource Benefits
- Reduced Central Generation Emissions
- Total Resource Costs
- DER Emissions (depending on DER technology)
Indirect Benefits/ Costs
- Reduced CO2 Emissions from Central Generation
- CO2 Emissions from DER
Allocation Methods
- Incentive from Public Purpose Fund/State Rebate/Federal Taxes (to customer and/or utility)
Allocation Issues
Incentives/Locational Credits
Assumptions: Use current applicable combined heat and power (CHP), fuel cell, and solar incentives for California in the analysis for these technologies. Incentives from the utility to make societal DER benefits cost effective for both utility and customer will be designed in the collaborative DER programs.
Incentives/credits are a key benefit to DER customers, and are often required to make the project economically viable. However, these incentives can also represent a cost to the utility ratepayers or to society depending upon who provides the incentive value. In California, there are numerous existing incentive and rebate programs that apply to DER customers. In most cases, these incentives are only available to customers who have installed renewable energy technologies. Utilities, on the other hand, can provide monetary incentives/credits to DER customers through a tariff structure, a competitive request for proposals, or a bilateral contract for generation services. The design and application of utility tariffs will be explored in detail in the collaborative DER program development.
There are two funding alternatives for the incentives/credits:
1. An incremental charge that could result in a change to rates or shareholder earnings and therefore is included in the RIM test. This could be either a utility program that gives locational credits to DER customers, or a pass through of costs to rate payers from a regulatory mandated program.
2. A transfer from public funds or tax revenue that will not impact end-use rates or shareholder earnings. This is classified as a societal cost, because the funds that are used for the DER incentives/credits are no longer available for other programs.

DER Costs, Benefits, and Allocation Issues
2-8
For some time now, the California Energy Commission (CEC) has offered the Emerging Renewables Buy-Down Program. This program is ratepayer funded through the Public Purpose Program and provides cash rebates of $4,500 per kW or 50% of system costs (whichever is less) for customers of all classes in investor-owned utility (IOU) service areas who install eligible renewable generating systems. This is defined as a societal cost in the model because it is assumed that the level of the Public Purpose Charge does not increase to fund the Buy-Down Program. Therefore, there is no incremental impact on ratepayers, but the funds allocated to the Buy-Down program are not available for other purposes. Eligible systems include the following, so long as they are grid-connected, operate in parallel, and produce no more than 200% of the site’s electricity needs:34
• solar photovoltaics (PV)
• solar thermal electric systems
• wind turbines up to 10 kW, or
• fuel cells operating on renewable fuels (digester gas, landfill gas etc.)
Complementing this CEC program, California investor-owned utilities (IOUs) administer a separate Self-Generation Incentive Program (SGIP) that provides similar financial incentives for these and other DER technologies installed on the customer side. Table 2-5 identifies the levels of these incentives.
The California Public Utilities Commission (CPUC) established the SGIP in March 2001,35 and recently modified some of its original eligibility requirements.36 The SGIP is currently authorized for a four-year period, running only through 2004. The program could be extended, but has not yet been. It is not clear how the SGIP will be funded, it may be through the Public Purpose Program or an incremental utility charge. The SGIP is currently treated as a societal cost, which assumes that it will be funded through the current level of Public Purpose funds. This assumption can be altered when the source of funding is clarified.
34 Size limitations are described in the CEC’s Emerging Renewable Resources Account Guidebook, Vol 3., 9th Ed,
(September 25, 2002, at pp. 13 et seq; available at http://www.energy.ca.gov/renewables/documents/index.html#greengrid) The Guidebook (p.6) indicates an effort to coordinate the size of projects eligible under the CEC program with those available under IOU-administered self-generation incentive programs, and CEC staff has advised us that a new version of the handbook due out shortly will contain an explicit maximum limit of 30 kW per project, corresponding to the lower limit of IOU-administered programs for the same resources.. Practically speaking, another important limitation is that funds remain in the CEC’s Emerging Renewable Resources Account in a given year.
35 D. 01-07-073 (3/27/01), implementing the legislative mandate of AB 970.
36 D. 02-09-051 (9/26/02)
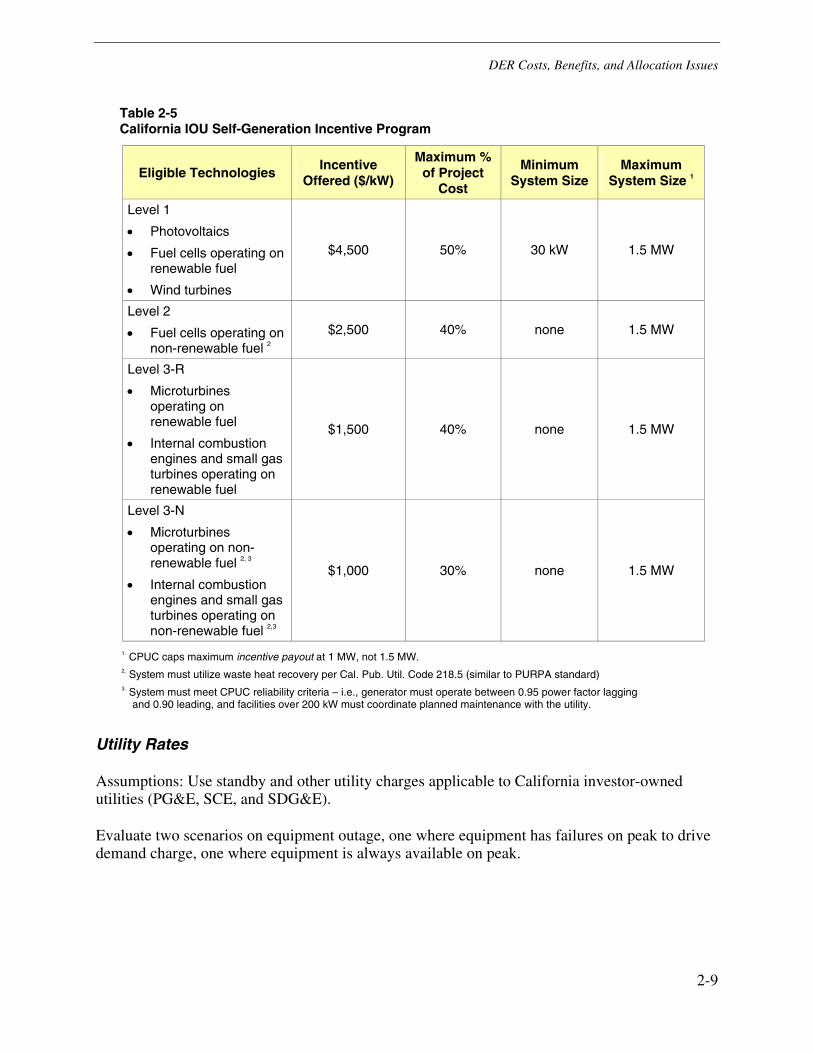
DER Costs, Benefits, and Allocation Issues
2-9
Table 2-5 California IOU Self-Generation Incentive Program
Eligible Technologies Incentive
Offered ($/kW)
Maximum % of Project
Cost
Minimum System Size
Maximum System Size 1
Level 1
• Photovoltaics
• Fuel cells operating on renewable fuel
• Wind turbines
$4,500 50% 30 kW 1.5 MW
Level 2
• Fuel cells operating on non-renewable fuel 2
$2,500 40% none 1.5 MW
Level 3-R
• Microturbines operating on renewable fuel
• Internal combustion engines and small gas turbines operating on renewable fuel
$1,500 40% none 1.5 MW
Level 3-N
• Microturbines operating on non-renewable fuel 2, 3
• Internal combustion engines and small gas turbines operating on non-renewable fuel 2,3
$1,000 30% none 1.5 MW
1. CPUC caps maximum incentive payout at 1 MW, not 1.5 MW. 2. System must utilize waste heat recovery per Cal. Pub. Util. Code 218.5 (similar to PURPA standard) 3. System must meet CPUC reliability criteria – i.e., generator must operate between 0.95 power factor lagging
and 0.90 leading, and facilities over 200 kW must coordinate planned maintenance with the utility.
Utility Rates
Assumptions: Use standby and other utility charges applicable to California investor-owned utilities (PG&E, SCE, and SDG&E).
Evaluate two scenarios on equipment outage, one where equipment has failures on peak to drive demand charge, one where equipment is always available on peak.
DER Costs, Benefits, and Allocation Issues
2-10
Utilities impose standby rates on customers that require the utility to provide back-up power when their on-site generation or third-party supply is non-operational. The more firm37 the standby requirements, the higher the standby charges. The justification used by utilities for imposing this special rate is that the cost to provide firm standby service is significantly different from the cost to provide service to other customers. Specifically, firm standby service has a high demand for capacity, but little energy usage. The infrequent usage also leads to difficulties in determining the amount of peak capacity that might be required for shared facilities, such as transmission. Customers do have the option to provide their own reliability through the construction of redundant facilities, and disconnect from the grid to avoid standby charges. Standalone power, however, is rarely a cost-effective option, and could be subject to exit fees (discussed below).
Standard practice was to charge customers with DER standby charges in addition to their otherwise applicable tariff. The standby charge is typically based on a “reserved” or ratcheted amount of capacity, although some are usage-based. To avoid double counting demand when a customer actually requires standby power, the standby usage is typically subtracted from the billing demand under the otherwise applicable tariff.
Standby charges can vary by voltage level, with the highest charges at the distribution voltage level. The reason for the higher charges at the lower voltage level is twofold: 1) the lower delivery voltage implies that relatively more utility infrastructure is required to support that customer; and 2) at lower voltages, the distribution equipment becomes more “dedicated” to the customer, so the distribution capacity cost reduction from a customer installing on-site generation is lower.
Typical standby charges are shown below in Table 2-6. Note that residential and small commercial customers that qualify for net metering can typically avoid any standby charges. The net metering qualifying customers are typically renewable resource projects such as small solar photovoltaic projects.
Table 2-7 below shows the PG&E and SDG&E standby tariffs that can be applied to a customer’s entire load (no need for the otherwise applicable tariff). For PG&E, industrial customers (in excess of 500kW maximum demand) may elect to use supplemental standby power, in which case, the customer’s normal usage is billed under the OAS, and only the backup power is billed under the standby rates. For SDG&E the tariffs shown below only apply to qualifying DER facilities.
37 Firm service refers to the customer having a reasonable expectation of the utility being able to meet their energy
usage 100% of the time, allowing for infrequent outages for facility failures (car pole incidents, lightning strikes etc). Nonfirm service is a lower level of reliability provided to customers in exchange for lower rates. The concept is that utilities will not have to build facilities to meet the peak demands of nonfirm customers, and those savings are passed to those customers through rate discounts or incentive payments. To the extent that standby customers were to elect nonfirm standby service, the cost of that service would be significantly lower (possibly zero) than firm standby service.
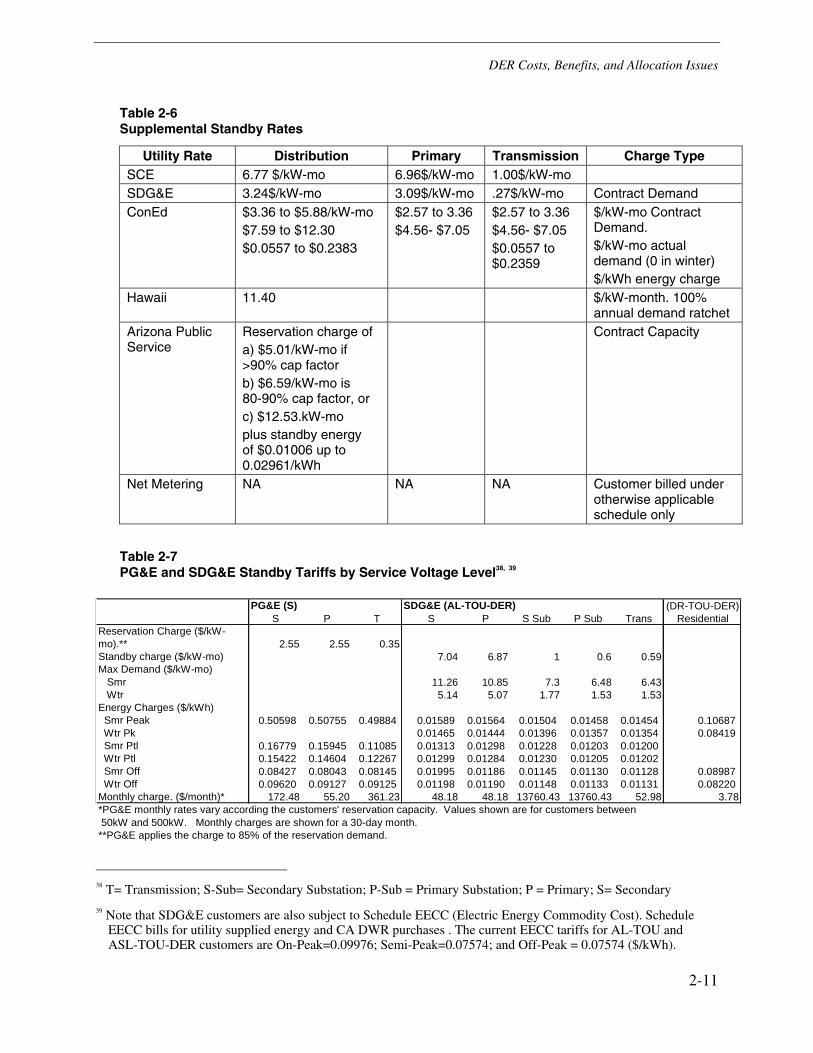
DER Costs, Benefits, and Allocation Issues
2-11
Table 2-6 Supplemental Standby Rates
Utility Rate Distribution Primary Transmission Charge Type SCE 6.77 $/kW-mo 6.96$/kW-mo 1.00$/kW-mo SDG&E 3.24$/kW-mo 3.09$/kW-mo .27$/kW-mo Contract Demand ConEd $3.36 to $5.88/kW-mo
$7.59 to $12.30 $0.0557 to $0.2383
$2.57 to 3.36 $4.56- $7.05
$2.57 to 3.36 $4.56- $7.05 $0.0557 to $0.2359
$/kW-mo Contract Demand. $/kW-mo actual demand (0 in winter) $/kWh energy charge
Hawaii 11.40 $/kW-month. 100% annual demand ratchet
Arizona Public Service
Reservation charge of a) $5.01/kW-mo if >90% cap factor b) $6.59/kW-mo is 80-90% cap factor, or c) $12.53.kW-mo plus standby energy of $0.01006 up to 0.02961/kWh
Contract Capacity
Net Metering NA NA NA Customer billed under otherwise applicable schedule only
Table 2-7 PG&E and SDG&E Standby Tariffs by Service Voltage Level38, 39
PG&E (S) SDG&E (AL-TOU-DER) (DR-TOU-DER)S P T S P S Sub P Sub Trans Residential
Reservation Charge ($/kW- mo).** 2.55 2.55 0.35Standby charge ($/kW-mo) 7.04 6.87 1 0.6 0.59Max Demand ($/kW-mo) Smr 11.26 10.85 7.3 6.48 6.43 Wtr 5.14 5.07 1.77 1.53 1.53Energy Charges ($/kWh) Smr Peak 0.50598 0.50755 0.49884 0.01589 0.01564 0.01504 0.01458 0.01454 0.10687 Wtr Pk 0.01465 0.01444 0.01396 0.01357 0.01354 0.08419 Smr Ptl 0.16779 0.15945 0.11085 0.01313 0.01298 0.01228 0.01203 0.01200 Wtr Ptl 0.15422 0.14604 0.12267 0.01299 0.01284 0.01230 0.01205 0.01202 Smr Off 0.08427 0.08043 0.08145 0.01995 0.01186 0.01145 0.01130 0.01128 0.08987 Wtr Off 0.09620 0.09127 0.09125 0.01198 0.01190 0.01148 0.01133 0.01131 0.08220Monthly charge. ($/month)* 172.48 55.20 361.23 48.18 48.18 13760.43 13760.43 52.98 3.78*PG&E monthly rates vary according the customers' reservation capacity. Values shown are for customers between 50kW and 500kW. Monthly charges are shown for a 30-day month.**PG&E applies the charge to 85% of the reservation demand.
38 T= Transmission; S-Sub= Secondary Substation; P-Sub = Primary Substation; P = Primary; S= Secondary
39 Note that SDG&E customers are also subject to Schedule EECC (Electric Energy Commodity Cost). Schedule EECC bills for utility supplied energy and CA DWR purchases . The current EECC tariffs for AL-TOU and ASL-TOU-DER customers are On-Peak=0.09976; Semi-Peak=0.07574; and Off-Peak = 0.07574 ($/kWh).
DER Costs, Benefits, and Allocation Issues
2-12
PG&E and SDG&E take two fundamentally different approaches to the standby customer rate design. PG&E imposes a small reservation charge and high energy charges. The energy charges are significantly higher than the tariff rates for the otherwise applicable rate schedules. For qualifying DER facilities, PG&E waives the reservation charge. SDG&E’s Schedule AL-TOU-DER rates are the same as their Schedule AL-TOU rates (non-residential time of use rates). Qualifying DER customers are billed the same as regular AL-TOU customers, with no adjustment for any higher cost of service. Similarly, qualifying residential DER customers pay the same rates as all other residential customers on TOU rates. The authors expect that if DER were to become a significant portion of SDG&E’s customer base, then SDG&E would revise its rate design to reflect the cost characteristics of the DER customers.
The scenario analysis will incorporate the range of charge levels and charge types identified above for the evaluation of fossil fuel DER technologies. Renewable technologies will be evaluated with zero standby charges, as well as the full range of costs used for the fossil fuel technologies.
Exit Fees
Exit fees have been a significant issue in the past for departing customer load. While it has largely gone out of favor by Commissions, the effort by utilities to classify more of their systems as being “connection-related” rather than “usage-related” could provide a stronger basis for utilities to assign infrastructure costs to individual customers. Exit fee risk increases with the size of the customer relative to the neighboring businesses and industries: the larger the contributor-to-area-peak-load, the stronger the utility argument for exit fees. Conversely, this could also increase the value to the utility for the customer to depart the system. Of course, while utilities are quick to assess exit fees, utilities are not offering exit payments for customers to depart and thereby reduce peak demand in capacity constrained areas. For this study, the focus is on DER for customers that remain grid-connected, so zero exit fees are assumed. However, the cost effectiveness analyses do estimate the value of peak load reductions, so the value of peak demand reduction is assessed, even if those costs are not currently signaled or passed on to customers.
Customer Benefits of DER
Annual Electricity Bill Savings
Assumptions: Calculate the electricity and gas bill for the customer with the original rate assuming a set of billing determinants. The range for this benefit will vary dependent upon the level of customer demand and the utility territory the customer operates within.
The structure of the utility rates affects the bill savings that a customer could attain through the installation of “behind the meter” DER technologies. The larger the fixed charge, the less bill savings potential for DER. In most cases, fixed charges are a small portion of a customer’s monthly bill. The small fixed charge is a result of rate design decisions that have viewed large fixed charges as inequitable toward customers with lower levels of electricity usage. Generally, volumetric (per kWh) charges have been viewed as a “fairer” way to charge for electric service. However, many utilities are trying to shift more of the customer bill into fixed charges. The argument used by utilities for the shift is that much of the electric delivery infrastructure costs
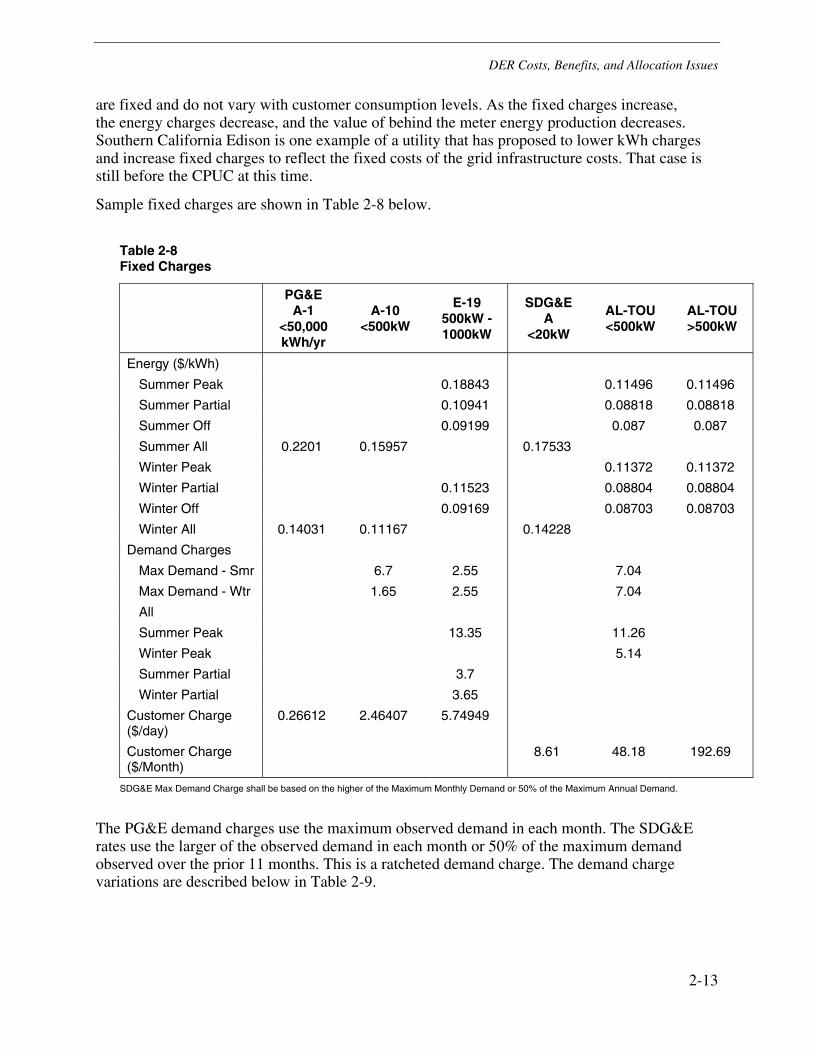
DER Costs, Benefits, and Allocation Issues
2-13
are fixed and do not vary with customer consumption levels. As the fixed charges increase, the energy charges decrease, and the value of behind the meter energy production decreases. Southern California Edison is one example of a utility that has proposed to lower kWh charges and increase fixed charges to reflect the fixed costs of the grid infrastructure costs. That case is still before the CPUC at this time.
Sample fixed charges are shown in Table 2-8 below.
Table 2-8 Fixed Charges
PG&E A-1
<50,000 kWh/yr
A-10 <500kW
E-19 500kW - 1000kW
SDG&E A
<20kW
AL-TOU <500kW
AL-TOU >500kW
Energy ($/kWh)
Summer Peak 0.18843 0.11496 0.11496
Summer Partial 0.10941 0.08818 0.08818
Summer Off 0.09199 0.087 0.087
Summer All 0.2201 0.15957 0.17533
Winter Peak 0.11372 0.11372
Winter Partial 0.11523 0.08804 0.08804
Winter Off 0.09169 0.08703 0.08703
Winter All 0.14031 0.11167 0.14228
Demand Charges
Max Demand - Smr 6.7 2.55 7.04
Max Demand - Wtr 1.65 2.55 7.04
All
Summer Peak 13.35 11.26
Winter Peak 5.14
Summer Partial 3.7
Winter Partial 3.65
Customer Charge ($/day)
0.26612 2.46407 5.74949
Customer Charge ($/Month)
8.61 48.18 192.69
SDG&E Max Demand Charge shall be based on the higher of the Maximum Monthly Demand or 50% of the Maximum Annual Demand.
The PG&E demand charges use the maximum observed demand in each month. The SDG&E rates use the larger of the observed demand in each month or 50% of the maximum demand observed over the prior 11 months. This is a ratcheted demand charge. The demand charge variations are described below in Table 2-9.
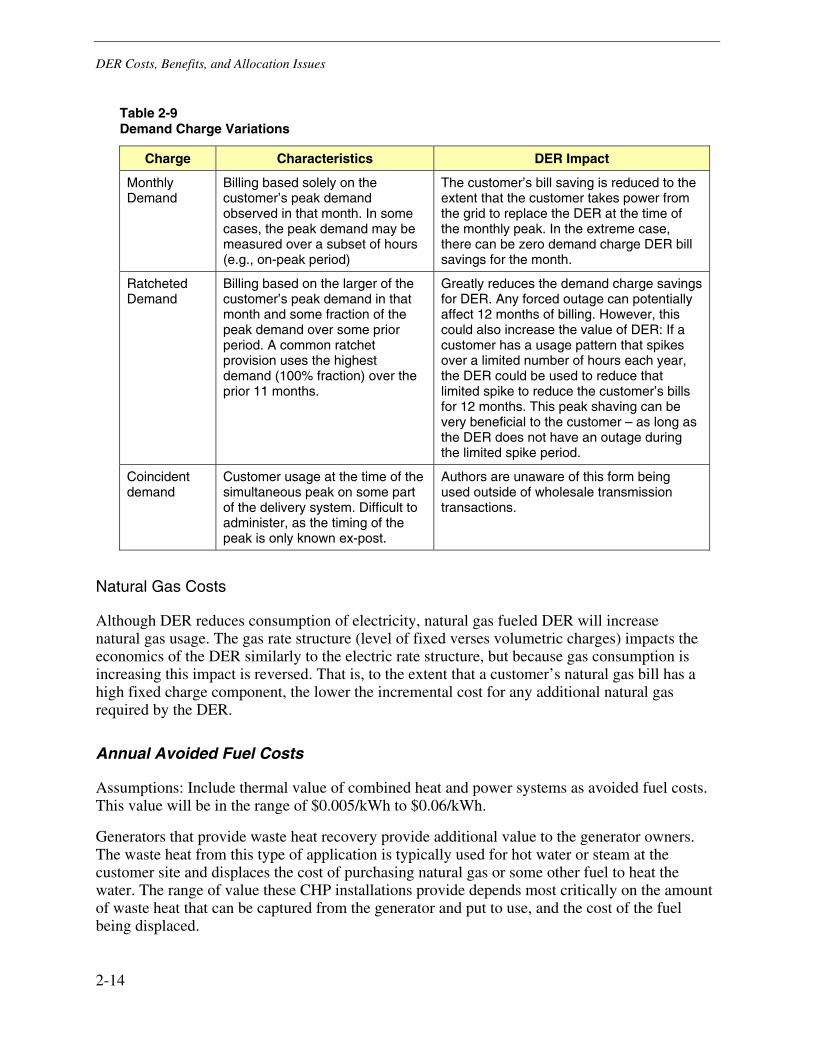
DER Costs, Benefits, and Allocation Issues
2-14
Table 2-9 Demand Charge Variations
Charge Characteristics DER Impact
Monthly Demand
Billing based solely on the customer’s peak demand observed in that month. In some cases, the peak demand may be measured over a subset of hours (e.g., on-peak period)
The customer’s bill saving is reduced to the extent that the customer takes power from the grid to replace the DER at the time of the monthly peak. In the extreme case, there can be zero demand charge DER bill savings for the month.
Ratcheted Demand
Billing based on the larger of the customer’s peak demand in that month and some fraction of the peak demand over some prior period. A common ratchet provision uses the highest demand (100% fraction) over the prior 11 months.
Greatly reduces the demand charge savings for DER. Any forced outage can potentially affect 12 months of billing. However, this could also increase the value of DER: If a customer has a usage pattern that spikes over a limited number of hours each year, the DER could be used to reduce that limited spike to reduce the customer’s bills for 12 months. This peak shaving can be very beneficial to the customer – as long as the DER does not have an outage during the limited spike period.
Coincident demand
Customer usage at the time of the simultaneous peak on some part of the delivery system. Difficult to administer, as the timing of the peak is only known ex-post.
Authors are unaware of this form being used outside of wholesale transmission transactions.
Natural Gas Costs
Although DER reduces consumption of electricity, natural gas fueled DER will increase natural gas usage. The gas rate structure (level of fixed verses volumetric charges) impacts the economics of the DER similarly to the electric rate structure, but because gas consumption is increasing this impact is reversed. That is, to the extent that a customer’s natural gas bill has a high fixed charge component, the lower the incremental cost for any additional natural gas required by the DER.
Annual Avoided Fuel Costs
Assumptions: Include thermal value of combined heat and power systems as avoided fuel costs. This value will be in the range of $0.005/kWh to $0.06/kWh.
Generators that provide waste heat recovery provide additional value to the generator owners. The waste heat from this type of application is typically used for hot water or steam at the customer site and displaces the cost of purchasing natural gas or some other fuel to heat the water. The range of value these CHP installations provide depends most critically on the amount of waste heat that can be captured from the generator and put to use, and the cost of the fuel being displaced.
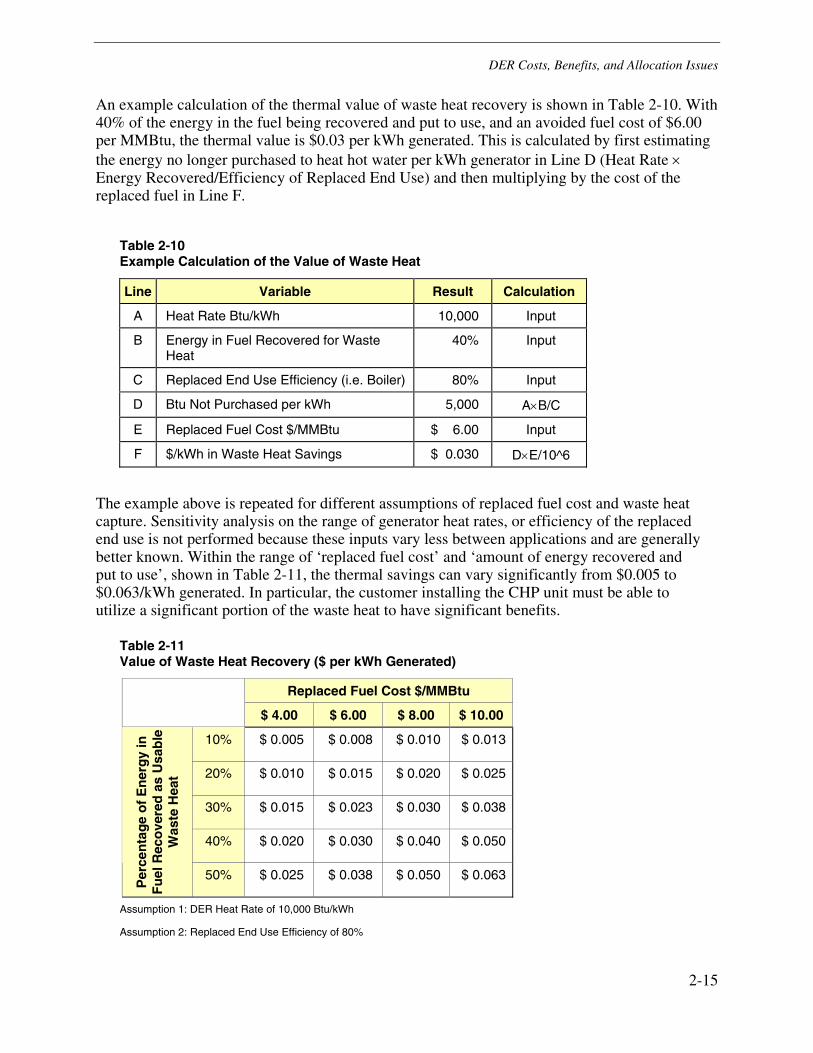
DER Costs, Benefits, and Allocation Issues
2-15
An example calculation of the thermal value of waste heat recovery is shown in Table 2-10. With 40% of the energy in the fuel being recovered and put to use, and an avoided fuel cost of $6.00 per MMBtu, the thermal value is $0.03 per kWh generated. This is calculated by first estimating the energy no longer purchased to heat hot water per kWh generator in Line D (Heat Rate × Energy Recovered/Efficiency of Replaced End Use) and then multiplying by the cost of the replaced fuel in Line F.
Table 2-10 Example Calculation of the Value of Waste Heat
Line Variable Result Calculation
A Heat Rate Btu/kWh 10,000 Input
B Energy in Fuel Recovered for Waste Heat
40% Input
C Replaced End Use Efficiency (i.e. Boiler) 80% Input
D Btu Not Purchased per kWh 5,000 A×B/C
E Replaced Fuel Cost $/MMBtu $ 6.00 Input
F $/kWh in Waste Heat Savings $ 0.030 D×E/10^6
The example above is repeated for different assumptions of replaced fuel cost and waste heat capture. Sensitivity analysis on the range of generator heat rates, or efficiency of the replaced end use is not performed because these inputs vary less between applications and are generally better known. Within the range of ‘replaced fuel cost’ and ‘amount of energy recovered and put to use’, shown in Table 2-11, the thermal savings can vary significantly from $0.005 to $0.063/kWh generated. In particular, the customer installing the CHP unit must be able to utilize a significant portion of the waste heat to have significant benefits.
Table 2-11 Value of Waste Heat Recovery ($ per kWh Generated)
Replaced Fuel Cost $/MMBtu
$ 4.00 $ 6.00 $ 8.00 $ 10.00
10% $ 0.005 $ 0.008 $ 0.010 $ 0.013
20% $ 0.010 $ 0.015 $ 0.020 $ 0.025
30% $ 0.015 $ 0.023 $ 0.030 $ 0.038
40% $ 0.020 $ 0.030 $ 0.040 $ 0.050
Per
cen
tag
e o
f E
ner
gy
in
Fu
el R
eco
vere
d a
s U
sab
le
Was
te H
eat
50% $ 0.025 $ 0.038 $ 0.050 $ 0.063
Assumption 1: DER Heat Rate of 10,000 Btu/kWh
Assumption 2: Replaced End Use Efficiency of 80%
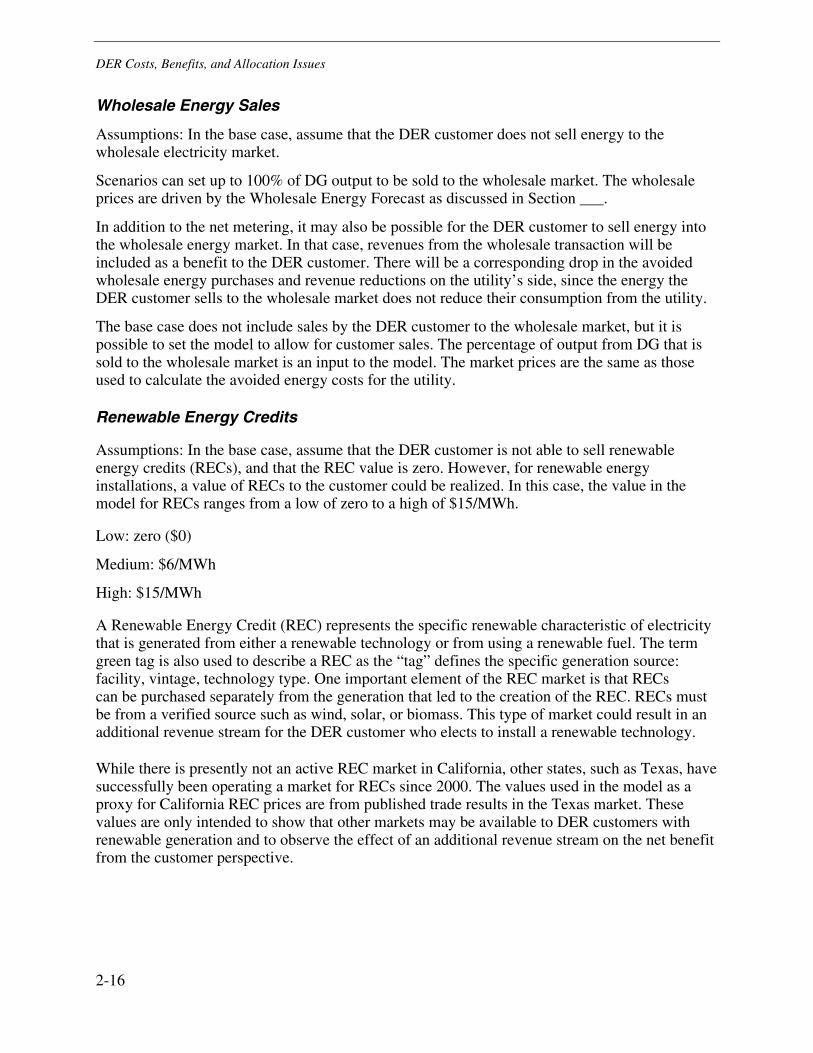
DER Costs, Benefits, and Allocation Issues
2-16
Wholesale Energy Sales
Assumptions: In the base case, assume that the DER customer does not sell energy to the wholesale electricity market.
Scenarios can set up to 100% of DG output to be sold to the wholesale market. The wholesale prices are driven by the Wholesale Energy Forecast as discussed in Section ___.
In addition to the net metering, it may also be possible for the DER customer to sell energy into the wholesale energy market. In that case, revenues from the wholesale transaction will be included as a benefit to the DER customer. There will be a corresponding drop in the avoided wholesale energy purchases and revenue reductions on the utility’s side, since the energy the DER customer sells to the wholesale market does not reduce their consumption from the utility.
The base case does not include sales by the DER customer to the wholesale market, but it is possible to set the model to allow for customer sales. The percentage of output from DG that is sold to the wholesale market is an input to the model. The market prices are the same as those used to calculate the avoided energy costs for the utility.
Renewable Energy Credits
Assumptions: In the base case, assume that the DER customer is not able to sell renewable energy credits (RECs), and that the REC value is zero. However, for renewable energy installations, a value of RECs to the customer could be realized. In this case, the value in the model for RECs ranges from a low of zero to a high of $15/MWh.
Low: zero ($0)
Medium: $6/MWh
High: $15/MWh
A Renewable Energy Credit (REC) represents the specific renewable characteristic of electricity that is generated from either a renewable technology or from using a renewable fuel. The term green tag is also used to describe a REC as the “tag” defines the specific generation source: facility, vintage, technology type. One important element of the REC market is that RECs can be purchased separately from the generation that led to the creation of the REC. RECs must be from a verified source such as wind, solar, or biomass. This type of market could result in an additional revenue stream for the DER customer who elects to install a renewable technology.
While there is presently not an active REC market in California, other states, such as Texas, have successfully been operating a market for RECs since 2000. The values used in the model as a proxy for California REC prices are from published trade results in the Texas market. These values are only intended to show that other markets may be available to DER customers with renewable generation and to observe the effect of an additional revenue stream on the net benefit from the customer perspective.
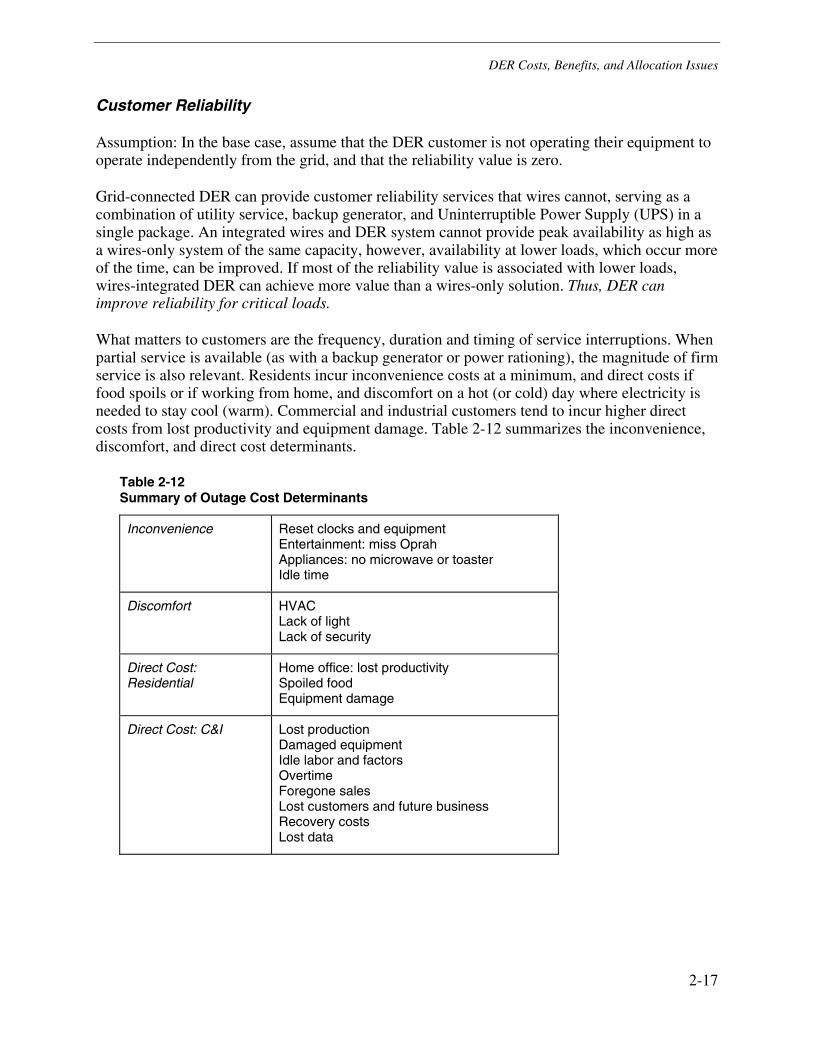
DER Costs, Benefits, and Allocation Issues
2-17
Customer Reliability
Assumption: In the base case, assume that the DER customer is not operating their equipment to operate independently from the grid, and that the reliability value is zero.
Grid-connected DER can provide customer reliability services that wires cannot, serving as a combination of utility service, backup generator, and Uninterruptible Power Supply (UPS) in a single package. An integrated wires and DER system cannot provide peak availability as high as a wires-only system of the same capacity, however, availability at lower loads, which occur more of the time, can be improved. If most of the reliability value is associated with lower loads, wires-integrated DER can achieve more value than a wires-only solution. Thus, DER can improve reliability for critical loads.
What matters to customers are the frequency, duration and timing of service interruptions. When partial service is available (as with a backup generator or power rationing), the magnitude of firm service is also relevant. Residents incur inconvenience costs at a minimum, and direct costs if food spoils or if working from home, and discomfort on a hot (or cold) day where electricity is needed to stay cool (warm). Commercial and industrial customers tend to incur higher direct costs from lost productivity and equipment damage. Table 2-12 summarizes the inconvenience, discomfort, and direct cost determinants.
Table 2-12 Summary of Outage Cost Determinants
Inconvenience Reset clocks and equipment Entertainment: miss Oprah Appliances: no microwave or toaster Idle time
Discomfort HVAC Lack of light Lack of security
Direct Cost: Residential
Home office: lost productivity Spoiled food Equipment damage
Direct Cost: C&I Lost production Damaged equipment Idle labor and factors Overtime Foregone sales Lost customers and future business Recovery costs Lost data
DER Costs, Benefits, and Allocation Issues
2-18
Reliability Value for Customers
Numerous studies have explored the value of reliable service, or cost of unreliable service, through surveys of willingness to pay to avoid interruption, willingness to accept payment to compensate for interruption, direct costs incurred, revealed preference through participation in curtailable rate programs or investment in standby generation and uninterruptible power supplies, conjoint analysis, etc.40
Costs of interruption vary by customer class. Outage costs to commercial and industrial customers include lost sales, reduced manufacturing output, spoiled inventory, damaged equipment, extra maintenance, and overtime. Costs imposed to residential customers include spoiled frozen foods, substitute heating and lighting costs, and inconvenience. Some customers have a high per-outage cost, where even a brief interruption causes large problems, such as a semiconductor fabrication plant or a stockbroker, while others may have few problems until the outage lasts long enough, such as an ice cream factory or plastic molder.
Reported outage costs vary tremendously. One common approach is to normalize outage cost on a per kWh basis of energy not supplied. A range of values from the literature is illustrated in Figure 2-3 for several residential, commercial, industrial, and combined commercial and industrial surveys. Estimates typically range by an order of magnitude.
$0
$1
$10
$100
Residential Commercial Industrial C&I
Cus
tom
er V
alue
of S
ervi
ce, $
/kW
h U
nser
ved
Figure 2-3 Typical Range of Reported Values for Customer Value of Service (VOS)
40 Customer outage costs estimates are surveyed in Woo, C.K. and R.L. Pupp (1992) “Costs of Service Disruptions
to Electricity Customers”, Energy, v12n2, 109-126. Recent information is also presented in a recent report from SCE, Customer Value of Service Reliability Study, March 1999. A survey of power disturbance costs to digital economy companies are presented in The Cost of Power Disturbances to Industrial & Digital Economy Companies, A Report of the Consortium for Electric Infrastructure to Support a Digital Society (CEIDS), EPRI/E2I, Palo Alto, CA, June 2001. 1006274.
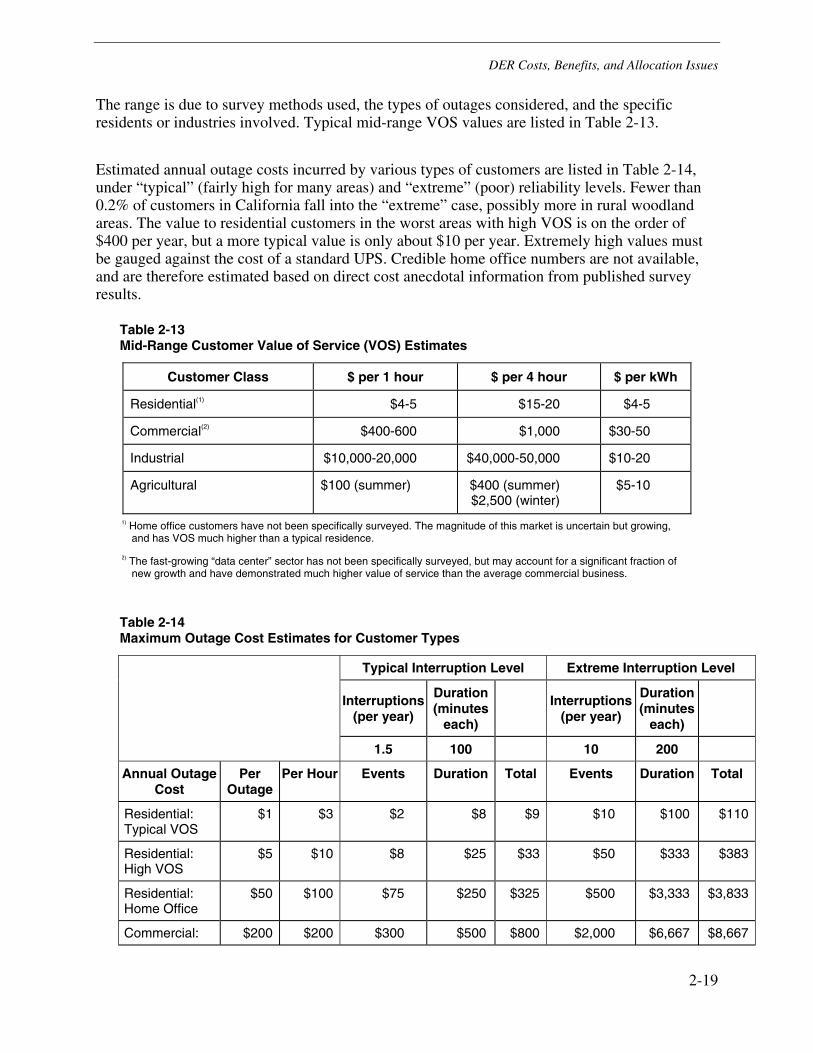
DER Costs, Benefits, and Allocation Issues
2-19
The range is due to survey methods used, the types of outages considered, and the specific residents or industries involved. Typical mid-range VOS values are listed in Table 2-13.
Estimated annual outage costs incurred by various types of customers are listed in Table 2-14, under “typical” (fairly high for many areas) and “extreme” (poor) reliability levels. Fewer than 0.2% of customers in California fall into the “extreme” case, possibly more in rural woodland areas. The value to residential customers in the worst areas with high VOS is on the order of $400 per year, but a more typical value is only about $10 per year. Extremely high values must be gauged against the cost of a standard UPS. Credible home office numbers are not available, and are therefore estimated based on direct cost anecdotal information from published survey results.
Table 2-13 Mid-Range Customer Value of Service (VOS) Estimates
Customer Class $ per 1 hour $ per 4 hour $ per kWh
Residential(1) $4-5 $15-20 $4-5
Commercial(2) $400-600 $1,000 $30-50
Industrial $10,000-20,000 $40,000-50,000 $10-20
Agricultural $100 (summer) $400 (summer) $2,500 (winter)
$5-10
1) Home office customers have not been specifically surveyed. The magnitude of this market is uncertain but growing, and has VOS much higher than a typical residence.
2) The fast-growing “data center” sector has not been specifically surveyed, but may account for a significant fraction of new growth and have demonstrated much higher value of service than the average commercial business.
Table 2-14 Maximum Outage Cost Estimates for Customer Types
Typical Interruption Level Extreme Interruption Level
Interruptions (per year)
Duration (minutes
each) Interruptions
(per year)
Duration (minutes
each)
1.5 100 10 200
Annual Outage Cost
Per Outage
Per Hour Events Duration Total Events Duration Total
Residential: Typical VOS
$1 $3 $2 $8 $9 $10 $100 $110
Residential: High VOS
$5 $10 $8 $25 $33 $50 $333 $383
Residential: Home Office
$50 $100 $75 $250 $325 $500 $3,333 $3,833
Commercial: $200 $200 $300 $500 $800 $2,000 $6,667 $8,667
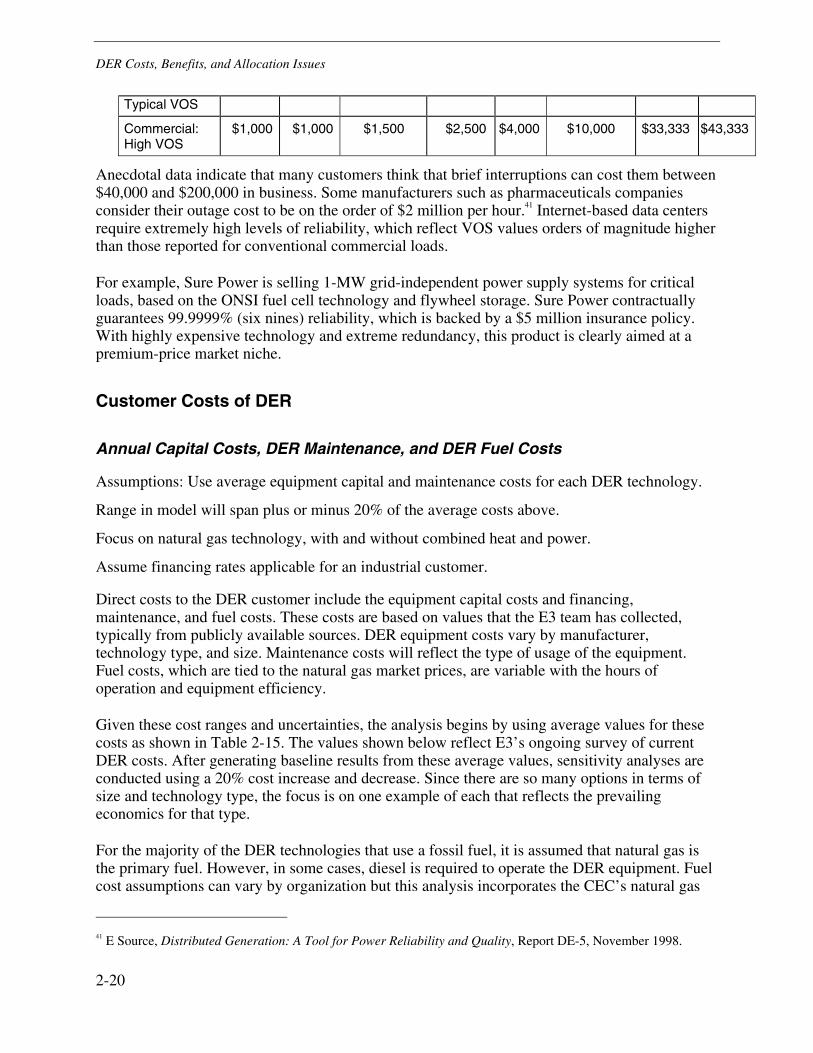
DER Costs, Benefits, and Allocation Issues
2-20
Typical VOS
Commercial: High VOS
$1,000 $1,000 $1,500 $2,500 $4,000 $10,000 $33,333 $43,333
Anecdotal data indicate that many customers think that brief interruptions can cost them between $40,000 and $200,000 in business. Some manufacturers such as pharmaceuticals companies consider their outage cost to be on the order of $2 million per hour.41 Internet-based data centers require extremely high levels of reliability, which reflect VOS values orders of magnitude higher than those reported for conventional commercial loads.
For example, Sure Power is selling 1-MW grid-independent power supply systems for critical loads, based on the ONSI fuel cell technology and flywheel storage. Sure Power contractually guarantees 99.9999% (six nines) reliability, which is backed by a $5 million insurance policy. With highly expensive technology and extreme redundancy, this product is clearly aimed at a premium-price market niche.
Customer Costs of DER
Annual Capital Costs, DER Maintenance, and DER Fuel Costs
Assumptions: Use average equipment capital and maintenance costs for each DER technology.
Range in model will span plus or minus 20% of the average costs above.
Focus on natural gas technology, with and without combined heat and power.
Assume financing rates applicable for an industrial customer.
Direct costs to the DER customer include the equipment capital costs and financing, maintenance, and fuel costs. These costs are based on values that the E3 team has collected, typically from publicly available sources. DER equipment costs vary by manufacturer, technology type, and size. Maintenance costs will reflect the type of usage of the equipment. Fuel costs, which are tied to the natural gas market prices, are variable with the hours of operation and equipment efficiency.
Given these cost ranges and uncertainties, the analysis begins by using average values for these costs as shown in Table 2-15. The values shown below reflect E3’s ongoing survey of current DER costs. After generating baseline results from these average values, sensitivity analyses are conducted using a 20% cost increase and decrease. Since there are so many options in terms of size and technology type, the focus is on one example of each that reflects the prevailing economics for that type.
For the majority of the DER technologies that use a fossil fuel, it is assumed that natural gas is the primary fuel. However, in some cases, diesel is required to operate the DER equipment. Fuel cost assumptions can vary by organization but this analysis incorporates the CEC’s natural gas
41 E Source, Distributed Generation: A Tool for Power Reliability and Quality, Report DE-5, November 1998.
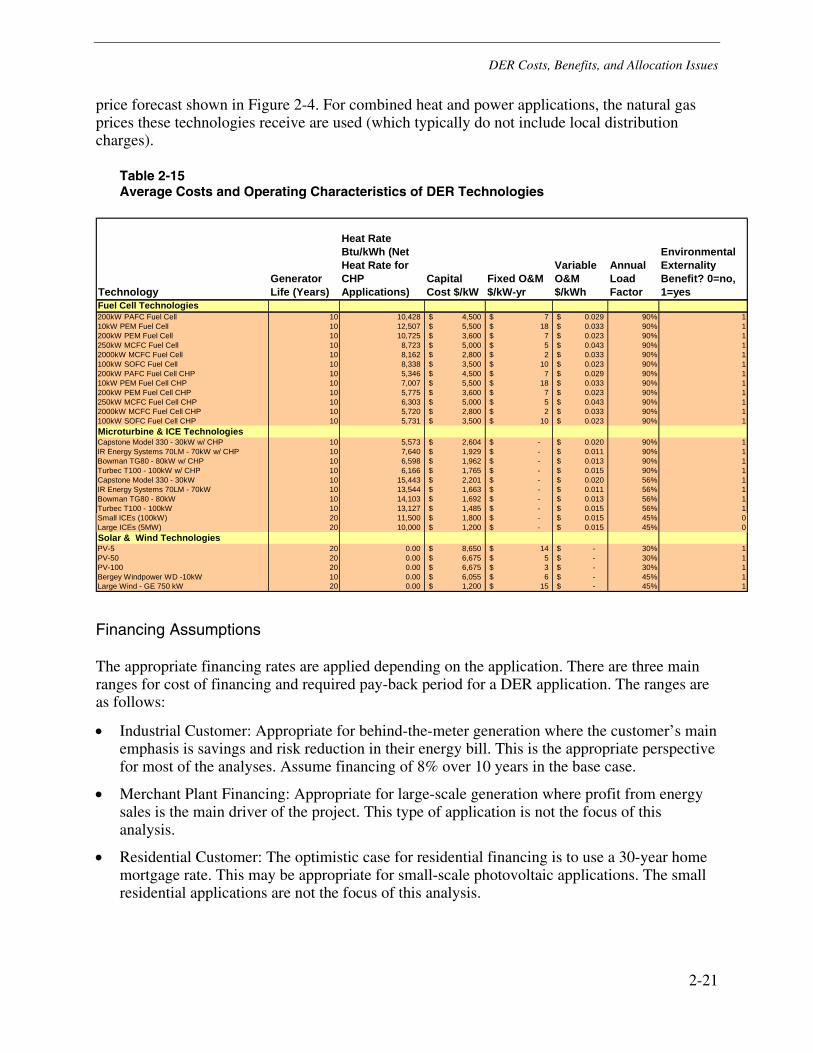
DER Costs, Benefits, and Allocation Issues
2-21
price forecast shown in Figure 2-4. For combined heat and power applications, the natural gas prices these technologies receive are used (which typically do not include local distribution charges).
Table 2-15 Average Costs and Operating Characteristics of DER Technologies
TechnologyGenerator Life (Years)
Heat Rate Btu/kWh (Net Heat Rate for CHP Applications)
Capital Cost $/kW
Fixed O&M $/kW-yr
Variable O&M $/kWh
Annual Load Factor
Environmental Externality Benefit? 0=no, 1=yes
Fuel Cell Technologies 200kW PAFC Fuel Cell 10 10,428 4,500$ 7$ 0.029$ 90% 110kW PEM Fuel Cell 10 12,507 5,500$ 18$ 0.033$ 90% 1200kW PEM Fuel Cell 10 10,725 3,600$ 7$ 0.023$ 90% 1250kW MCFC Fuel Cell 10 8,723 5,000$ 5$ 0.043$ 90% 12000kW MCFC Fuel Cell 10 8,162 2,800$ 2$ 0.033$ 90% 1100kW SOFC Fuel Cell 10 8,338 3,500$ 10$ 0.023$ 90% 1200kW PAFC Fuel Cell CHP 10 5,346 4,500$ 7$ 0.029$ 90% 110kW PEM Fuel Cell CHP 10 7,007 5,500$ 18$ 0.033$ 90% 1200kW PEM Fuel Cell CHP 10 5,775 3,600$ 7$ 0.023$ 90% 1250kW MCFC Fuel Cell CHP 10 6,303 5,000$ 5$ 0.043$ 90% 12000kW MCFC Fuel Cell CHP 10 5,720 2,800$ 2$ 0.033$ 90% 1100kW SOFC Fuel Cell CHP 10 5,731 3,500$ 10$ 0.023$ 90% 1Microturbine & ICE Technologies Capstone Model 330 - 30kW w/ CHP 10 5,573 2,604$ -$ 0.020$ 90% 1IR Energy Systems 70LM - 70kW w/ CHP 10 7,640 1,929$ -$ 0.011$ 90% 1Bowman TG80 - 80kW w/ CHP 10 6,598 1,962$ -$ 0.013$ 90% 1Turbec T100 - 100kW w/ CHP 10 6,166 1,765$ -$ 0.015$ 90% 1Capstone Model 330 - 30kW 10 15,443 2,201$ -$ 0.020$ 56% 1IR Energy Systems 70LM - 70kW 10 13,544 1,663$ -$ 0.011$ 56% 1Bowman TG80 - 80kW 10 14,103 1,692$ -$ 0.013$ 56% 1Turbec T100 - 100kW 10 13,127 1,485$ -$ 0.015$ 56% 1Small ICEs (100kW) 20 11,500 1,800$ -$ 0.015$ 45% 0Large ICEs (5MW) 20 10,000 1,200$ -$ 0.015$ 45% 0Solar & Wind Technologies PV-5 20 0.00 8,650$ 14$ -$ 30% 1PV-50 20 0.00 6,675$ 5$ -$ 30% 1PV-100 20 0.00 6,675$ 3$ -$ 30% 1Bergey Windpower WD -10kW 10 0.00 6,055$ 6$ -$ 45% 1Large Wind - GE 750 kW 20 0.00 1,200$ 15$ -$ 45% 1
Financing Assumptions
The appropriate financing rates are applied depending on the application. There are three main ranges for cost of financing and required pay-back period for a DER application. The ranges are as follows:
• Industrial Customer: Appropriate for behind-the-meter generation where the customer’s main emphasis is savings and risk reduction in their energy bill. This is the appropriate perspective for most of the analyses. Assume financing of 8% over 10 years in the base case.
• Merchant Plant Financing: Appropriate for large-scale generation where profit from energy sales is the main driver of the project. This type of application is not the focus of this analysis.
• Residential Customer: The optimistic case for residential financing is to use a 30-year home mortgage rate. This may be appropriate for small-scale photovoltaic applications. The small residential applications are not the focus of this analysis.
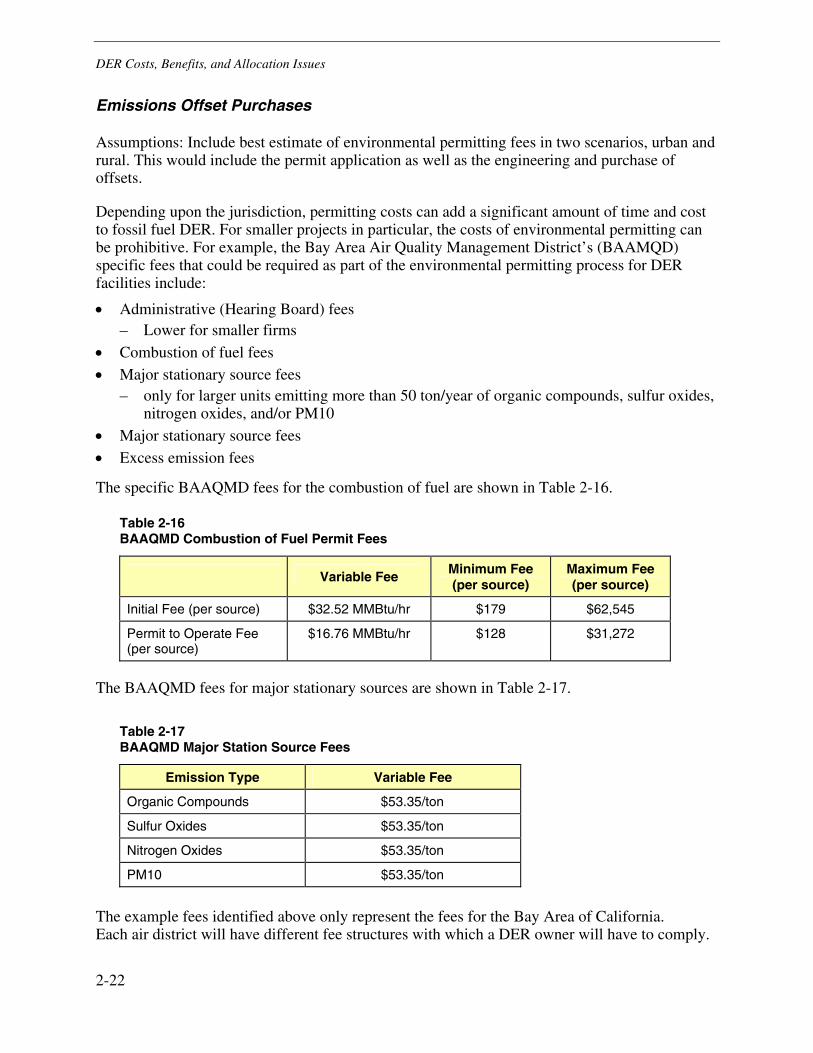
DER Costs, Benefits, and Allocation Issues
2-22
Emissions Offset Purchases
Assumptions: Include best estimate of environmental permitting fees in two scenarios, urban and rural. This would include the permit application as well as the engineering and purchase of offsets.
Depending upon the jurisdiction, permitting costs can add a significant amount of time and cost to fossil fuel DER. For smaller projects in particular, the costs of environmental permitting can be prohibitive. For example, the Bay Area Air Quality Management District’s (BAAMQD) specific fees that could be required as part of the environmental permitting process for DER facilities include:
• Administrative (Hearing Board) fees – Lower for smaller firms
• Combustion of fuel fees • Major stationary source fees
– only for larger units emitting more than 50 ton/year of organic compounds, sulfur oxides, nitrogen oxides, and/or PM10
• Major stationary source fees • Excess emission fees
The specific BAAQMD fees for the combustion of fuel are shown in Table 2-16.
Table 2-16 BAAQMD Combustion of Fuel Permit Fees
Variable Fee Minimum Fee (per source)
Maximum Fee (per source)
Initial Fee (per source) $32.52 MMBtu/hr $179 $62,545
Permit to Operate Fee (per source)
$16.76 MMBtu/hr $128 $31,272
The BAAQMD fees for major stationary sources are shown in Table 2-17.
Table 2-17 BAAQMD Major Station Source Fees
Emission Type Variable Fee
Organic Compounds $53.35/ton
Sulfur Oxides $53.35/ton
Nitrogen Oxides $53.35/ton
PM10 $53.35/ton
The example fees identified above only represent the fees for the Bay Area of California. Each air district will have different fee structures with which a DER owner will have to comply.
DER Costs, Benefits, and Allocation Issues
2-23
Additionally, the list of potential fees described does not include the time and resources required from the generation owner to complete the necessary permit paperwork for the managing air district. As this process can be lengthy and require significant resources, the overall cost of environmental permitting for fossil fuel burning DG is considerable. The permitting costs can be identified for specific DG technologies and an assumed resource factor can be added to the direct permit costs to appropriately model the impact of permitting on DG cost-effectiveness.
Interconnection Study, Equipment, and Electric System Upgrade Costs
Assumptions: Include base case cost of $2,000 for interconnection. This includes study and basic customer interconnection equipment. Assume a zero cost in the base case for electric system upgrade costs.
Range of interconnection study and customer costs span from zero to $30,000 per DER installation.
Actual electrical system upgrade costs to interconnect DER are very location-dependent.
Interconnection Study Costs
Prior to the passage of Assembly Bill (AB) x1-29 in April 2001, customers making generation requests were responsible for the engineering study costs. However, ABx1-29 reduces customer responsibility for study costs by raising the cost exemption limit from 10 kilowatt (kW) to 1,000 kW for renewable (e.g., solar and wind) self-generation metered by reversible flow meters and covered under the E-net (net energy metering service) rate schedule. The effect of ABx1-29 is that utilities (and potentially other customers) will now bear the study costs for eligible self-generation projects. PG&E estimates that the average engineering study cost is $800.
Customer Interconnection Costs
Interconnection costs are the incremental costs to safely connect DER to the utility grid. Typically they are defined as the non-refundable fees that the DER customer pays to the utility to facilitate connection to the utility grid. The utility fees can cover: 1) any equipment that the utility must install in order for the DER customer to connect safely to the grid; 2) engineering costs borne by the utility to evaluate the DER installation, such as the identification of necessary protection scheme modifications; 3) switching; 4) metering; and 5) administrative costs. Interconnection costs can also include customer payments to third parties such as the DER provider. Because most DER projects are small, interconnection costs can add a significant percentage to the total installed cost of a project. Efforts have been underway in the DER community to reduce interconnection costs through the establishment of uniform national standards and “pre-certified” DER with integrated protection devices.
Utility Upgrade Costs
Refer to section on Utility Costs of DER.
DER Costs, Benefits, and Allocation Issues
2-24
Insurance
Assumption: This cost is relatively small in comparison with the other customer costs so in the base case, it is assumed that insurance costs are zero. Although this can be adjusted for specific cases, it is assumed that in all scenarios the incremental cost of insurance is zero.
Some jurisdictions allow utilities to require that DER customers provide insurance and indemnification naming the utility as the payee. In some cases, the amount of required coverage is limited by the Public Utility Commissions (PUC). As an alternative, the NY Public Service Commission removed the requirement for a separate insurance coverage for DER and instead merely required that homeowners prove at least $100,000 in homeowner’s policy coverage.
Other Utility Infrastructure Costs and Operational Costs
Assumptions: The base case assumption is that there will be no significant upgrade requirements for utilities other than the electric utility. It is also assumed in the base case that there are no additional operational costs. These assumptions will be updated during the pilot studies when more location-specific information is available.
Only the electric utility is included as a stakeholder in the current version of the model. The interconnection study and equipment costs discussed in the Customer Cost of DER section refer to the upgrades required to connect to the electrical system. However, the DER application may necessitate upgrades to other utility systems, for example natural gas pipeline compression. Investigation of the occurrence and level of such costs is beyond the scope of this study, but there are placeholders in the model to add other utility costs as when they are identified in the course of the pilot studies. The base case assumption is that the DER will be situated where there is sufficient natural gas delivery capacity.
Similarly there may be on-going (non-electric) operational costs that are not included in the specifications of the DER technologies. An example is a high level of water usage for certain fuel cells. Again, a field study of the operating characteristics of all the technologies included in the model is beyond the scope of this study, but there are placeholders to add other operational costs as they are identified in a more detailed pilot study. The base case assumption is that there are no significant operational costs other than those listed in the technology specifications.
Utility Benefits of DER
Avoided Wholesale Energy Purchases
Assumptions: In the base case, use E3’s internal forecast for forward energy prices as avoided utility costs in the base case.
In testing the scenarios, this forecast will be compared with CEC forecasts and/or utility data (if available).
In jurisdictions where there is an active wholesale market, such as California, current quotes for forward electricity contracts are used to generate short-term (0-3 years) forecasts of power prices. For long-term forecasts (>3 years) there are a number of alternatives.
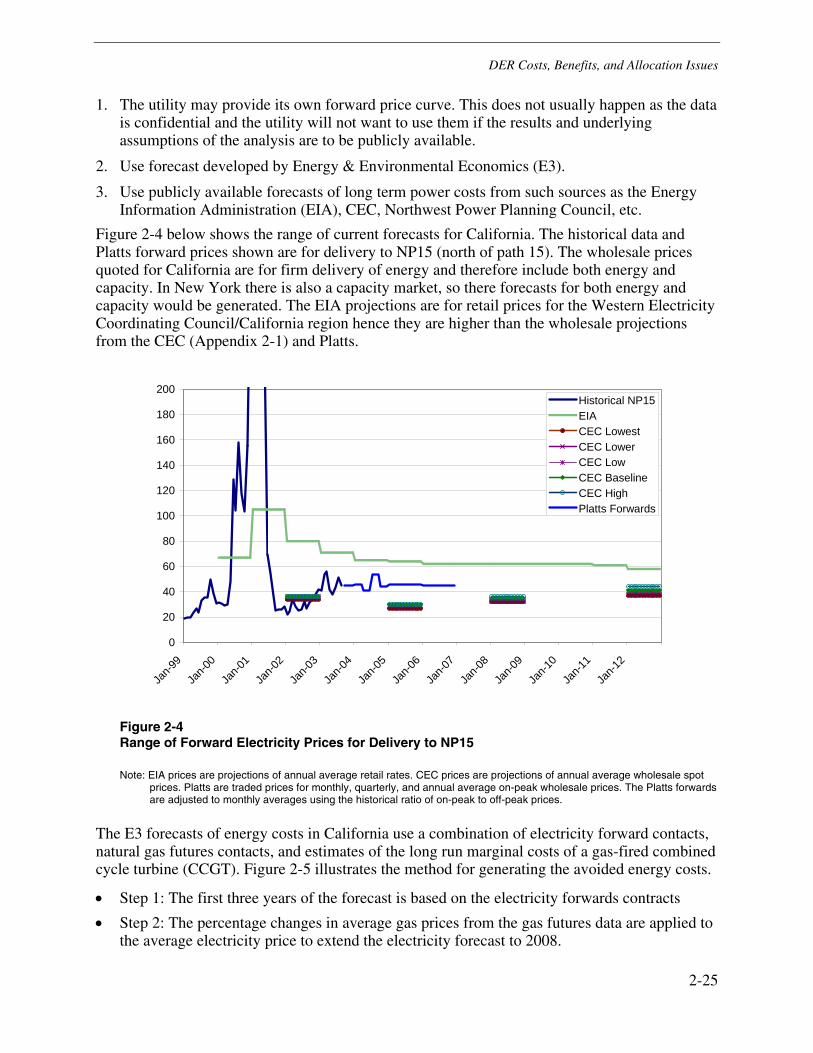
DER Costs, Benefits, and Allocation Issues
2-25
1. The utility may provide its own forward price curve. This does not usually happen as the data is confidential and the utility will not want to use them if the results and underlying assumptions of the analysis are to be publicly available.
2. Use forecast developed by Energy & Environmental Economics (E3).
3. Use publicly available forecasts of long term power costs from such sources as the Energy Information Administration (EIA), CEC, Northwest Power Planning Council, etc.
Figure 2-4 below shows the range of current forecasts for California. The historical data and Platts forward prices shown are for delivery to NP15 (north of path 15). The wholesale prices quoted for California are for firm delivery of energy and therefore include both energy and capacity. In New York there is also a capacity market, so there forecasts for both energy and capacity would be generated. The EIA projections are for retail prices for the Western Electricity Coordinating Council/California region hence they are higher than the wholesale projections from the CEC (Appendix 2-1) and Platts.
0
20
40
60
80
100
120
140
160
180
200
Jan-9
9
Jan-0
0
Jan-0
1
Jan-0
2
Jan-0
3
Jan-0
4
Jan-0
5
Jan-0
6
Jan-0
7
Jan-0
8
Jan-0
9
Jan-1
0
Jan-1
1
Jan-1
2
Historical NP15EIACEC LowestCEC LowerCEC LowCEC BaselineCEC HighPlatts Forwards
Figure 2-4 Range of Forward Electricity Prices for Delivery to NP15
Note: EIA prices are projections of annual average retail rates. CEC prices are projections of annual average wholesale spot prices. Platts are traded prices for monthly, quarterly, and annual average on-peak wholesale prices. The Platts forwards are adjusted to monthly averages using the historical ratio of on-peak to off-peak prices.
The E3 forecasts of energy costs in California use a combination of electricity forward contacts, natural gas futures contacts, and estimates of the long run marginal costs of a gas-fired combined cycle turbine (CCGT). Figure 2-5 illustrates the method for generating the avoided energy costs.
• Step 1: The first three years of the forecast is based on the electricity forwards contracts
• Step 2: The percentage changes in average gas prices from the gas futures data are applied to the average electricity price to extend the electricity forecast to 2008.
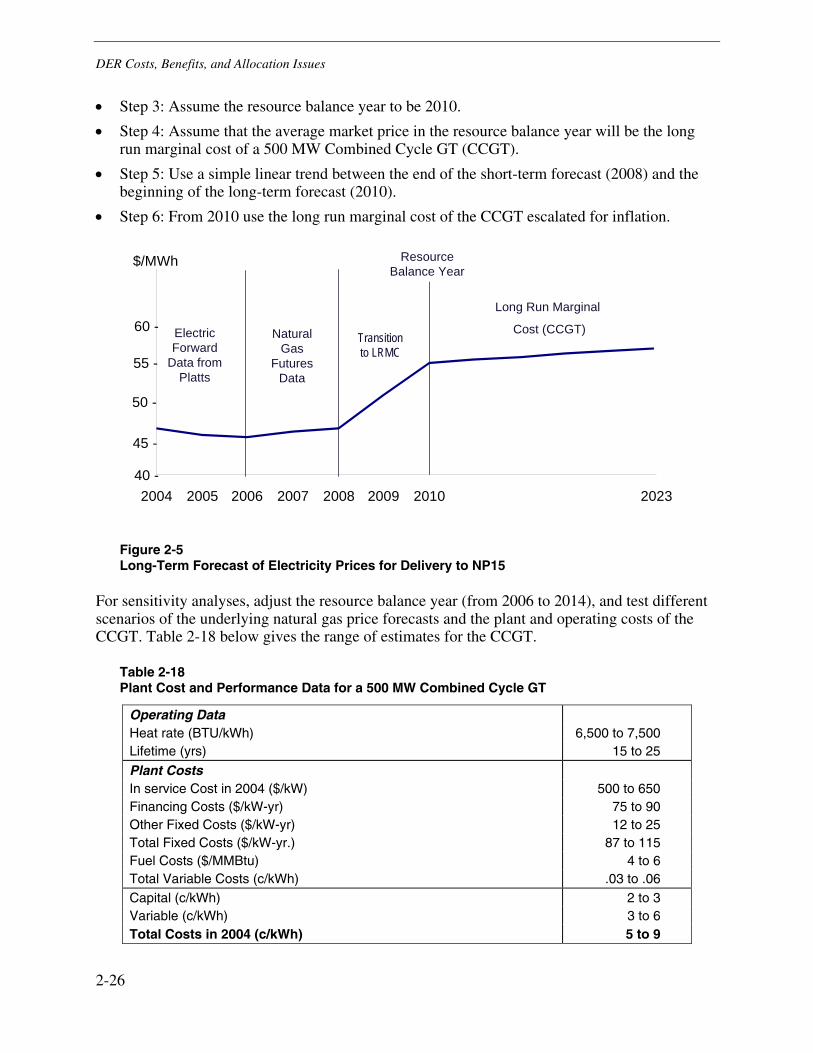
DER Costs, Benefits, and Allocation Issues
2-26
• Step 3: Assume the resource balance year to be 2010.
• Step 4: Assume that the average market price in the resource balance year will be the long run marginal cost of a 500 MW Combined Cycle GT (CCGT).
• Step 5: Use a simple linear trend between the end of the short-term forecast (2008) and the beginning of the long-term forecast (2010).
• Step 6: From 2010 use the long run marginal cost of the CCGT escalated for inflation.
2004 2005 2006 2007 2008 2009 2010 2023
ResourceBalance Year
Long Run Marginal
Cost (CCGT)ElectricForward
Data fromPlatts
Transitionto LRMC
45 -
50 -
40 -
55 -
60 -
$/MWh
NaturalGas
FuturesData
Figure 2-5 Long-Term Forecast of Electricity Prices for Delivery to NP15
For sensitivity analyses, adjust the resource balance year (from 2006 to 2014), and test different scenarios of the underlying natural gas price forecasts and the plant and operating costs of the CCGT. Table 2-18 below gives the range of estimates for the CCGT.
Table 2-18 Plant Cost and Performance Data for a 500 MW Combined Cycle GT
Operating Data Heat rate (BTU/kWh) 6,500 to 7,500 Lifetime (yrs) 15 to 25
Plant Costs In service Cost in 2004 ($/kW) 500 to 650 Financing Costs ($/kW-yr) 75 to 90 Other Fixed Costs ($/kW-yr) 12 to 25 Total Fixed Costs ($/kW-yr.) 87 to 115 Fuel Costs ($/MMBtu) 4 to 6 Total Variable Costs (c/kWh) .03 to .06 Capital (c/kWh) 2 to 3 Variable (c/kWh) 3 to 6 Total Costs in 2004 (c/kWh) 5 to 9

DER Costs, Benefits, and Allocation Issues
2-27
The NYMEX Henry Hub future contracts are used to forecast the natural gas prices used in the short-term electricity price forecasts. The futures prices are adjusted for basis differential to the relevant market. The NYMEX contracts are traded 72 months in advance giving five years of market data. As with electricity prices there are alternative sources of gas price projections for long-term forecasts. Figure 2-6 below shows a current range of forecasts for natural gas delivery to California (So Cal Gas and PG&E Citygate).
0
2
4
6
8
10
12
Jul-1
996
Jul-1
998
Jul-2
000
Jul-2
002
Jul-2
004
Jul-2
006
Jul-2
008
Jul-2
010
Jul-2
012
Jul-2
014
Jul-2
016
Jul-2
018
Jul-2
020
Jul-2
022
Nom
inal
$/M
MB
tu
PG&E Citygate SoCal GasHenry Hub Spot NYMEXEIA CEC
Figure 2-6 Historical and Projected Natural Gas Prices (Averaged Over Delivery Month)
Generation Multiplier Effect
Assumptions: In the base case, assume a generation multiplier effect of 1.0 (no effect). In the scenarios test the following range of values:
Low Effect: 1
Medium Effect: 3
High Effect: 5
A system-wide benefit DER can provide is the reduction of market prices. This benefit applies to all customers in the region, including the DER owner as well as stakeholders purchasing energy from the market. Economic intuition suggests that implementation of distributed generation reduces the electricity demand of program participants and shifts the market demand curve downwards along a given market supply curve, thus effecting a price reduction that can benefit all electricity consumers.

DER Costs, Benefits, and Allocation Issues
2-28
A system demand reduction can decrease market prices in three specific and important ways. First, it reduces the output from units with high marginal production cost that drives the price offers of those units. Second, it can mitigate capacity shortages, thus diminishing the above-marginal-cost markup (i.e., shortage cost) required to balance system demand and supply. Third, it can counter energy sellers’ market power, the ability to raise market prices through capacity withholding.
The benefit to an electricity consumer is his/her gain in consumer surplus (CS). This CS gain consists of (1) the bill saving directly attributable to the price drop, and (2) the benefit from incremental consumption induced by the price drop. When the consumer's individual demand is highly price insensitive, the incremental consumption (and therefore its ensuing benefit) is small, close to zero. In this case, the CS gain is mostly bill savings.42
The California Measurement Advisory Committee (CALMAC) acknowledges the importance of the price effect of a system demand reduction.43 It affirms the use of escalators for the purpose of quantifying the system benefit of a load reduction. This practice is further supported by the assigned Administrative Law Judge’s 10/25/2000 ruling (ALJ Ruling) on Applications 99-09-049, 99-09-050, 99-09-057 and 99-09-058, which states that “[t]he escalators are determined by looking at the “load reduction value” or “consumer surplus” relative to the market price and taking a ratio. The escalators are multiplied by the market price – either during peak or off-peak – to arrive at system value.” (p.13).
The CALMAC report opined that the size of the on-peak escalator is 5X as long as market power is exercised and drops to 2.5X after market power conditions are mitigated. See CALMAC (2000) Avoided Cost, Report on Public Workshops on PY 2001 Energy Efficiency Programs, 09/12/00 – 09/21/00 and 09/26/00, California Measurement Advisory Committee (CA: San Diego), pp.21-22.
Avoided T&D Capacity
Assumptions: T&D value is extremely area and time specific. Use three scenarios based on the E3 analysis of the PG&E system in 1994 (looking forward to 1999); $0/kW, $289/kW, and $1330/kW for 20 years.
Include reduction of utility loss savings due to DER in estimation of avoided energy (9% losses assumed) and marginal distribution capacity costs (MDCC) costs (12% losses assumed).
Include in the evaluation a consideration of DG reliability (redundancy) requirements to provide ‘firm’ capacity.
42 Woo, C.K. (1984) “A Note on Measuring Household Welfare Effects of Time-of-Use Pricing,” Energy
Journal, 5:3, 171-181.
43 CALMAC (2000) Avoided Cost, Report on Public Workshops on PY 2001 Energy Efficiency Programs, 09/12/00 – 09/21/00 and 09/26/00, California Measurement Advisory Committee (CA: San Diego).
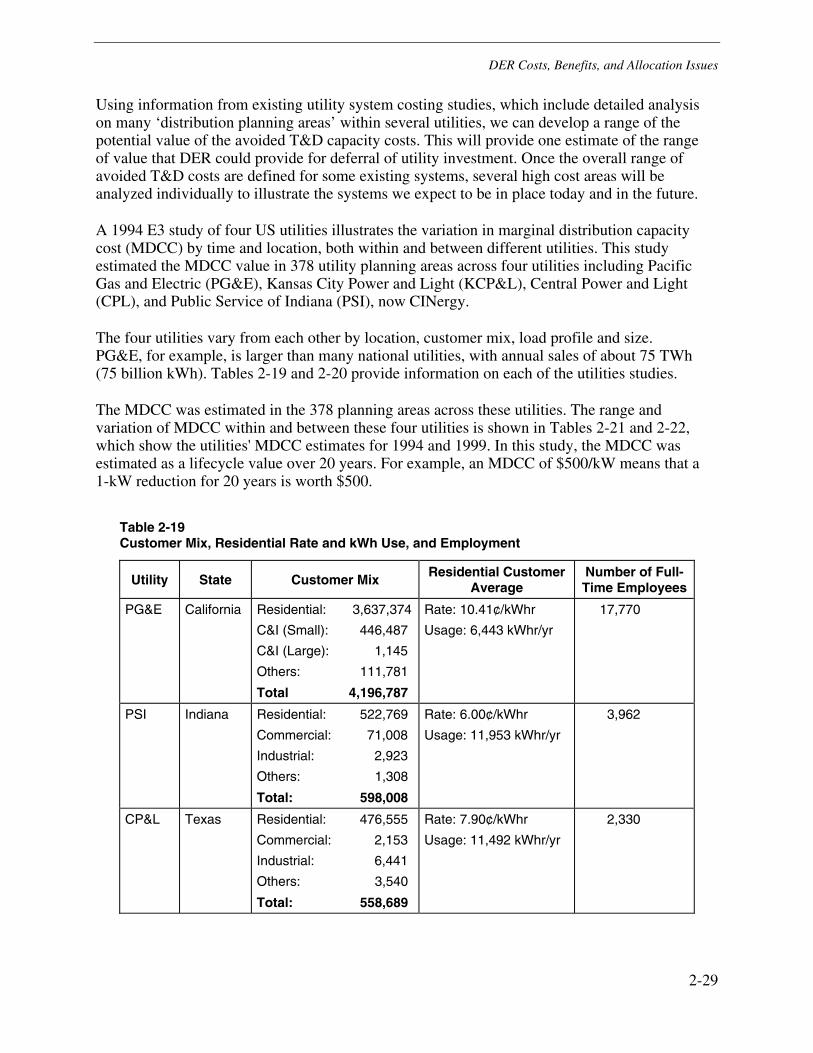
DER Costs, Benefits, and Allocation Issues
2-29
Using information from existing utility system costing studies, which include detailed analysis on many ‘distribution planning areas’ within several utilities, we can develop a range of the potential value of the avoided T&D capacity costs. This will provide one estimate of the range of value that DER could provide for deferral of utility investment. Once the overall range of avoided T&D costs are defined for some existing systems, several high cost areas will be analyzed individually to illustrate the systems we expect to be in place today and in the future.
A 1994 E3 study of four US utilities illustrates the variation in marginal distribution capacity cost (MDCC) by time and location, both within and between different utilities. This study estimated the MDCC value in 378 utility planning areas across four utilities including Pacific Gas and Electric (PG&E), Kansas City Power and Light (KCP&L), Central Power and Light (CPL), and Public Service of Indiana (PSI), now CINergy.
The four utilities vary from each other by location, customer mix, load profile and size. PG&E, for example, is larger than many national utilities, with annual sales of about 75 TWh (75 billion kWh). Tables 2-19 and 2-20 provide information on each of the utilities studies.
The MDCC was estimated in the 378 planning areas across these utilities. The range and variation of MDCC within and between these four utilities is shown in Tables 2-21 and 2-22, which show the utilities' MDCC estimates for 1994 and 1999. In this study, the MDCC was estimated as a lifecycle value over 20 years. For example, an MDCC of $500/kW means that a 1-kW reduction for 20 years is worth $500.
Table 2-19 Customer Mix, Residential Rate and kWh Use, and Employment
Utility State Customer Mix Residential Customer
Average Number of Full-Time Employees
PG&E California Residential: 3,637,374
C&I (Small): 446,487
C&I (Large): 1,145
Others: 111,781
Total 4,196,787
Rate: 10.41¢/kWhr
Usage: 6,443 kWhr/yr
17,770
PSI Indiana Residential: 522,769
Commercial: 71,008
Industrial: 2,923
Others: 1,308
Total: 598,008
Rate: 6.00¢/kWhr
Usage: 11,953 kWhr/yr
3,962
CP&L Texas Residential: 476,555
Commercial: 2,153
Industrial: 6,441
Others: 3,540
Total: 558,689
Rate: 7.90¢/kWhr
Usage: 11,492 kWhr/yr
2,330
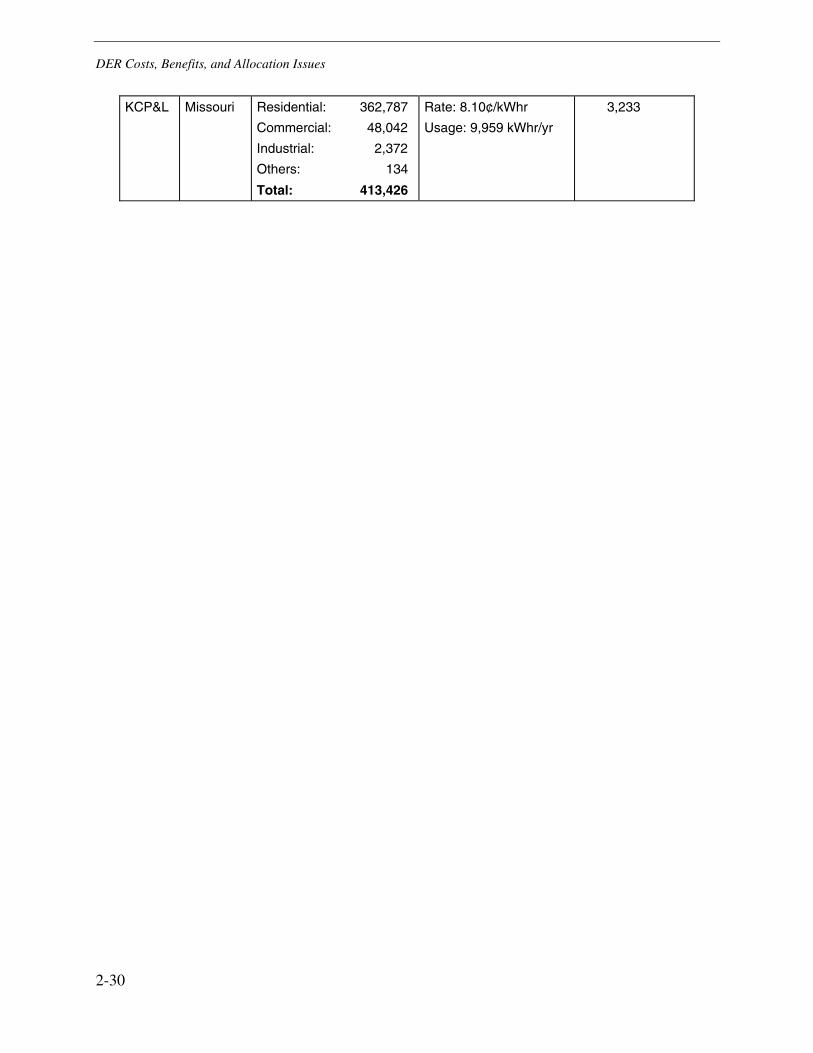
DER Costs, Benefits, and Allocation Issues
2-30
KCP&L Missouri Residential: 362,787
Commercial: 48,042
Industrial: 2,372
Others: 134
Total: 413,426
Rate: 8.10¢/kWhr
Usage: 9,959 kWhr/yr
3,233
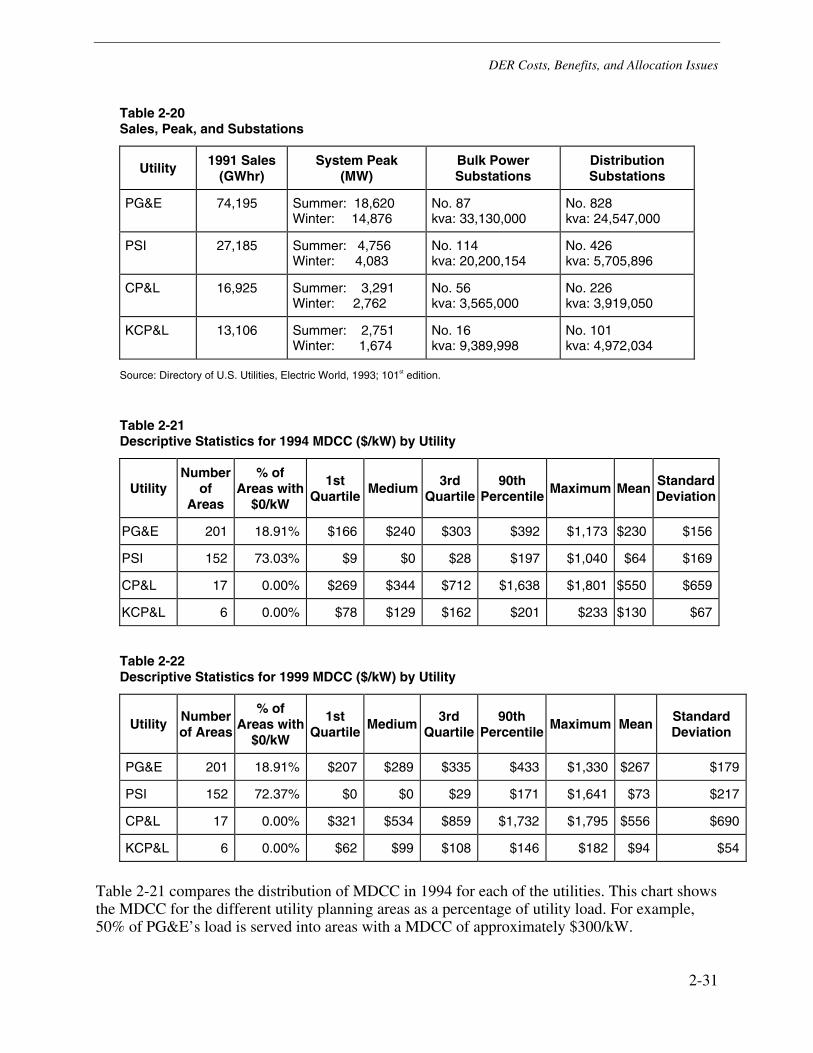
DER Costs, Benefits, and Allocation Issues
2-31
Table 2-20 Sales, Peak, and Substations
Utility 1991 Sales (GWhr)
System Peak (MW)
Bulk Power Substations
Distribution Substations
PG&E 74,195 Summer: 18,620 Winter: 14,876
No. 87 kva: 33,130,000
No. 828 kva: 24,547,000
PSI 27,185 Summer: 4,756 Winter: 4,083
No. 114 kva: 20,200,154
No. 426 kva: 5,705,896
CP&L 16,925 Summer: 3,291 Winter: 2,762
No. 56 kva: 3,565,000
No. 226 kva: 3,919,050
KCP&L 13,106 Summer: 2,751 Winter: 1,674
No. 16 kva: 9,389,998
No. 101 kva: 4,972,034
Source: Directory of U.S. Utilities, Electric World, 1993; 101st edition.
Table 2-21 Descriptive Statistics for 1994 MDCC ($/kW) by Utility
Utility Number
of Areas
% of Areas with
$0/kW
1st Quartile
Medium 3rd Quartile
90th Percentile
Maximum Mean Standard Deviation
PG&E 201 18.91% $166 $240 $303 $392 $1,173 $230 $156
PSI 152 73.03% $9 $0 $28 $197 $1,040 $64 $169
CP&L 17 0.00% $269 $344 $712 $1,638 $1,801 $550 $659
KCP&L 6 0.00% $78 $129 $162 $201 $233 $130 $67
Table 2-22 Descriptive Statistics for 1999 MDCC ($/kW) by Utility
Utility Number of Areas
% of Areas with
$0/kW
1st Quartile
Medium 3rd Quartile
90th Percentile
Maximum Mean Standard Deviation
PG&E 201 18.91% $207 $289 $335 $433 $1,330 $267 $179
PSI 152 72.37% $0 $0 $29 $171 $1,641 $73 $217
CP&L 17 0.00% $321 $534 $859 $1,732 $1,795 $556 $690
KCP&L 6 0.00% $62 $99 $108 $146 $182 $94 $54
Table 2-21 compares the distribution of MDCC in 1994 for each of the utilities. This chart shows the MDCC for the different utility planning areas as a percentage of utility load. For example, 50% of PG&E’s load is served into areas with a MDCC of approximately $300/kW.
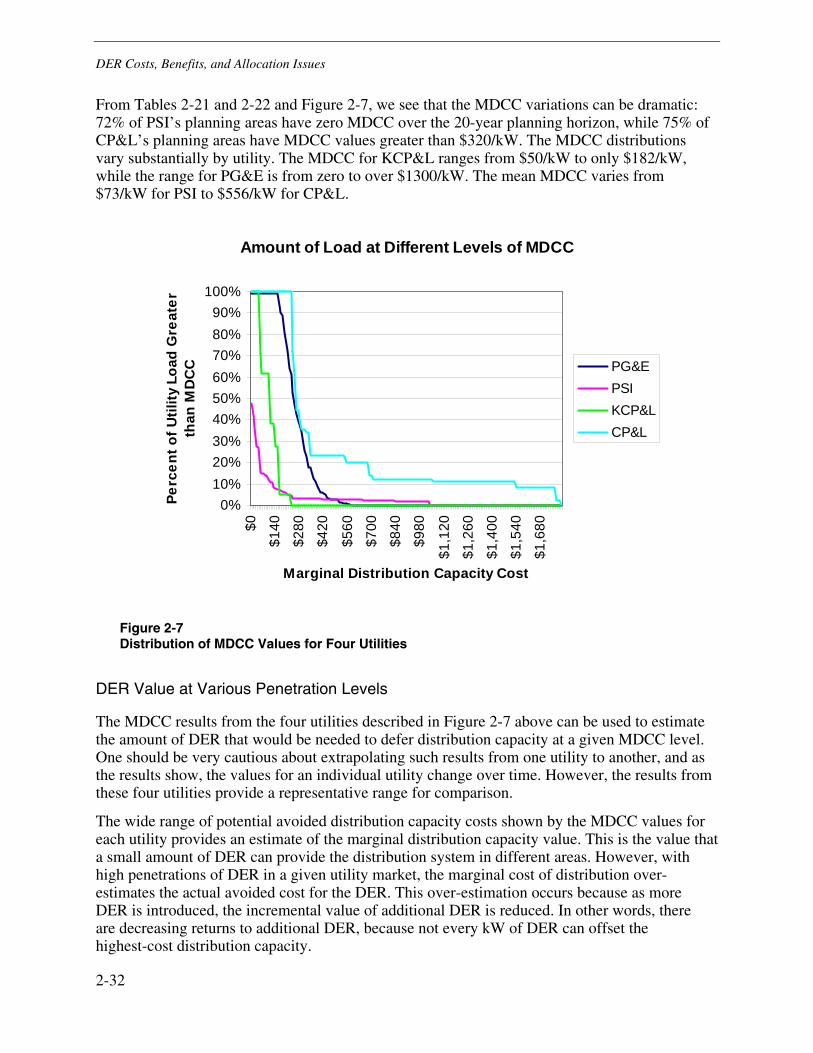
DER Costs, Benefits, and Allocation Issues
2-32
From Tables 2-21 and 2-22 and Figure 2-7, we see that the MDCC variations can be dramatic: 72% of PSI’s planning areas have zero MDCC over the 20-year planning horizon, while 75% of CP&L’s planning areas have MDCC values greater than $320/kW. The MDCC distributions vary substantially by utility. The MDCC for KCP&L ranges from $50/kW to only $182/kW, while the range for PG&E is from zero to over $1300/kW. The mean MDCC varies from $73/kW for PSI to $556/kW for CP&L.
Amount of Load at Different Levels of MDCC
0%10%20%30%40%50%60%70%80%90%
100%
$0
$140
$280
$420
$560
$700
$840
$980
$1,1
20
$1,2
60
$1,4
00
$1,5
40
$1,6
80
Marginal Distribution Capacity Cost
Perc
ent o
f Util
ity L
oad
Gre
ater
th
an M
DC
C PG&EPSIKCP&LCP&L
Figure 2-7 Distribution of MDCC Values for Four Utilities
DER Value at Various Penetration Levels
The MDCC results from the four utilities described in Figure 2-7 above can be used to estimate the amount of DER that would be needed to defer distribution capacity at a given MDCC level. One should be very cautious about extrapolating such results from one utility to another, and as the results show, the values for an individual utility change over time. However, the results from these four utilities provide a representative range for comparison.
The wide range of potential avoided distribution capacity costs shown by the MDCC values for each utility provides an estimate of the marginal distribution capacity value. This is the value that a small amount of DER can provide the distribution system in different areas. However, with high penetrations of DER in a given utility market, the marginal cost of distribution over-estimates the actual avoided cost for the DER. This over-estimation occurs because as more DER is introduced, the incremental value of additional DER is reduced. In other words, there are decreasing returns to additional DER, because not every kW of DER can offset the highest-cost distribution capacity.
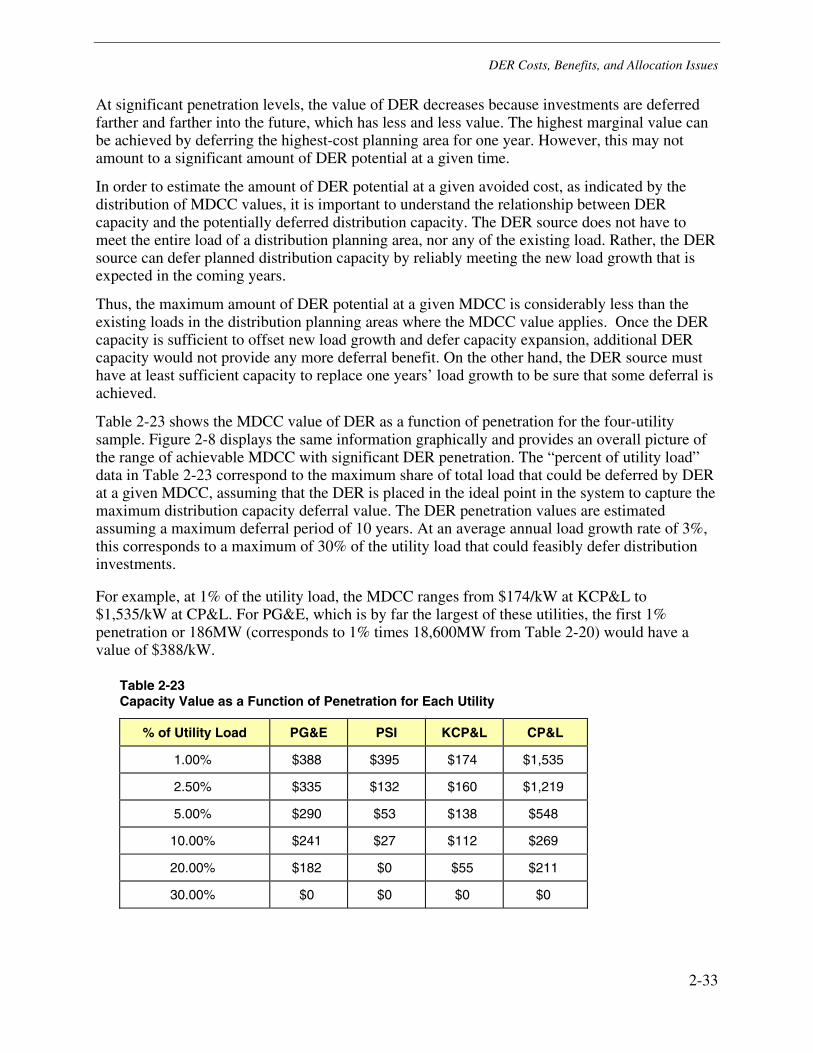
DER Costs, Benefits, and Allocation Issues
2-33
At significant penetration levels, the value of DER decreases because investments are deferred farther and farther into the future, which has less and less value. The highest marginal value can be achieved by deferring the highest-cost planning area for one year. However, this may not amount to a significant amount of DER potential at a given time.
In order to estimate the amount of DER potential at a given avoided cost, as indicated by the distribution of MDCC values, it is important to understand the relationship between DER capacity and the potentially deferred distribution capacity. The DER source does not have to meet the entire load of a distribution planning area, nor any of the existing load. Rather, the DER source can defer planned distribution capacity by reliably meeting the new load growth that is expected in the coming years.
Thus, the maximum amount of DER potential at a given MDCC is considerably less than the existing loads in the distribution planning areas where the MDCC value applies. Once the DER capacity is sufficient to offset new load growth and defer capacity expansion, additional DER capacity would not provide any more deferral benefit. On the other hand, the DER source must have at least sufficient capacity to replace one years’ load growth to be sure that some deferral is achieved.
Table 2-23 shows the MDCC value of DER as a function of penetration for the four-utility sample. Figure 2-8 displays the same information graphically and provides an overall picture of the range of achievable MDCC with significant DER penetration. The “percent of utility load” data in Table 2-23 correspond to the maximum share of total load that could be deferred by DER at a given MDCC, assuming that the DER is placed in the ideal point in the system to capture the maximum distribution capacity deferral value. The DER penetration values are estimated assuming a maximum deferral period of 10 years. At an average annual load growth rate of 3%, this corresponds to a maximum of 30% of the utility load that could feasibly defer distribution investments.
For example, at 1% of the utility load, the MDCC ranges from $174/kW at KCP&L to $1,535/kW at CP&L. For PG&E, which is by far the largest of these utilities, the first 1% penetration or 186MW (corresponds to 1% times 18,600MW from Table 2-20) would have a value of $388/kW.
Table 2-23 Capacity Value as a Function of Penetration for Each Utility
% of Utility Load PG&E PSI KCP&L CP&L
1.00% $388 $395 $174 $1,535
2.50% $335 $132 $160 $1,219
5.00% $290 $53 $138 $548
10.00% $241 $27 $112 $269
20.00% $182 $0 $55 $211
30.00% $0 $0 $0 $0
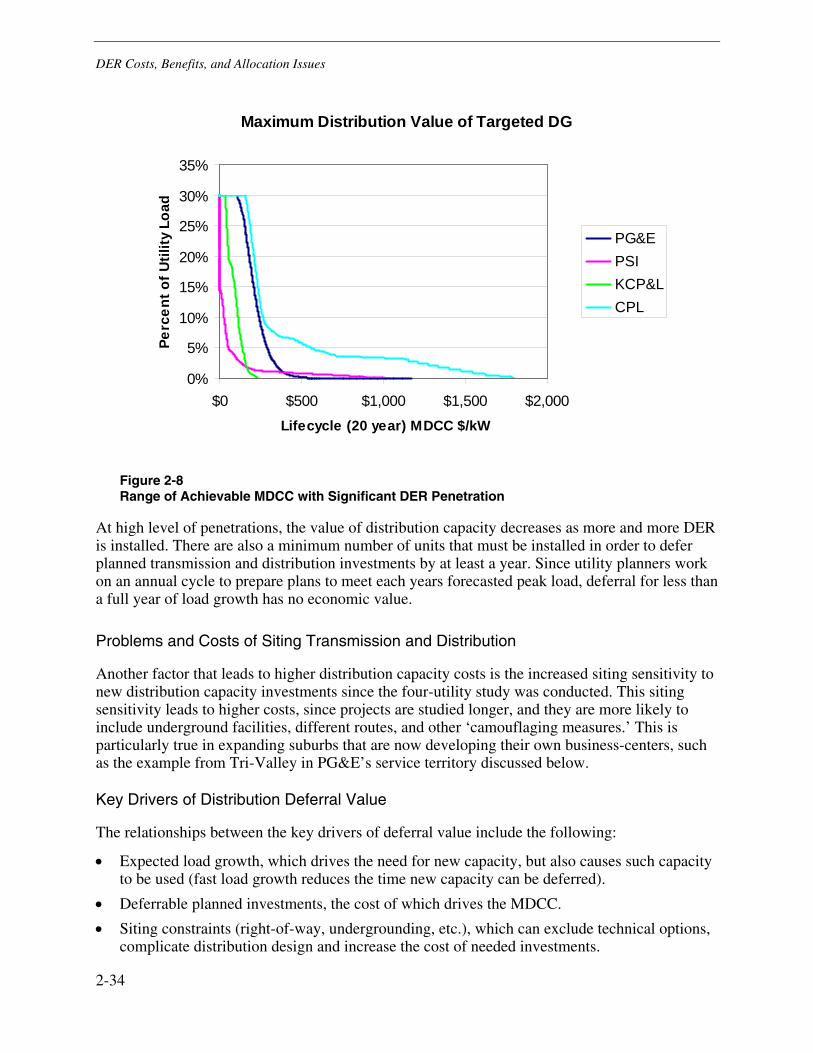
DER Costs, Benefits, and Allocation Issues
2-34
Maximum Distribution Value of Targeted DG
0%
5%
10%
15%
20%
25%
30%
35%
$0 $500 $1,000 $1,500 $2,000Lifecycle (20 year) MDCC $/kW
Perc
ent o
f Util
ity L
oad
PG&EPSIKCP&LCPL
Figure 2-8 Range of Achievable MDCC with Significant DER Penetration
At high level of penetrations, the value of distribution capacity decreases as more and more DER is installed. There are also a minimum number of units that must be installed in order to defer planned transmission and distribution investments by at least a year. Since utility planners work on an annual cycle to prepare plans to meet each years forecasted peak load, deferral for less than a full year of load growth has no economic value.
Problems and Costs of Siting Transmission and Distribution
Another factor that leads to higher distribution capacity costs is the increased siting sensitivity to new distribution capacity investments since the four-utility study was conducted. This siting sensitivity leads to higher costs, since projects are studied longer, and they are more likely to include underground facilities, different routes, and other ‘camouflaging measures.’ This is particularly true in expanding suburbs that are now developing their own business-centers, such as the example from Tri-Valley in PG&E’s service territory discussed below.
Key Drivers of Distribution Deferral Value
The relationships between the key drivers of deferral value include the following:
• Expected load growth, which drives the need for new capacity, but also causes such capacity to be used (fast load growth reduces the time new capacity can be deferred).
• Deferrable planned investments, the cost of which drives the MDCC.
• Siting constraints (right-of-way, undergrounding, etc.), which can exclude technical options, complicate distribution design and increase the cost of needed investments.
DER Costs, Benefits, and Allocation Issues
2-35
For the most part, the effects of load growth and siting constraints are captured in the distribution capacity investments that are called for in the expansion plan. The costs of these deferrable investments drive the MDCC value and indicate the utility cost savings that can be achieved by DER.
Ideal Target Distribution Planning Area
The ideal distribution planning area for DER is the one with high MDCC, which represents a high avoided utility cost for potential DER investments. Such an area usually has a need for new distribution utility investment, and a moderate level of load growth. In such an area, it may be possible to defer the investment for several years with only a few MW of on-peak capacity load reduction.
Contrary to popular belief, the area with the most concentrated utility investment is not necessarily the area with the highest value. These areas have high costs for potential deferral, but they usually also have very high load growths. Fast growth makes it difficult to defer capacity expansion for very long, or requires large peak load reductions (from DER, for example) to do so. Therefore, the value of reducing load per kW is not necessarily high even though there are a lot of dollars at stake.
Realizing Deferral Benefits
To defer the distribution investment, one of the following has to apply:
1. DER must have reliability at least as good as the conventional wires solution, OR:
2. DER must meet the same minimum reliability standards as the conventional wires solution.
The subtle difference can have a large impact because of the discrete or “lumpy” nature of system failures and capacity. A wires solution may result in 99.99% availability in order to meet a minimum standard of 99.9%, because the next best solution may only be 99.8%. There is clearly a large difference for the DER system to meet a 99.99% versus 99.9% target.
The second point of tension is which metric or metrics are to be used to judge “equivalence.” Availability at peak load is a metric familiar to distribution system planners, but so are expected unserved energy (EUE), annual expected outage time and expected number of outages per year. It is possible (and not uncommon) for potential solutions to rank in one order in terms of availability and the reverse order for EUE.
Reduction of Losses
Utility distribution companies (UDCs) try to limit energy losses on their systems. Reduced losses can improve the overall efficiency of the distribution system and allow the UDC to purchase less energy to meet the same customer demand. Cases in which high losses are a problem are usually solved by upgrading conductors on a long circuit, or by providing reactive power support where reactive power losses are high.
DER Costs, Benefits, and Allocation Issues
2-36
DER can also reduce system losses by reducing the current flow from the transmission system through the transformers and conductors on the distribution system. Because losses are proportional to the square of the current load (I2), the effect of DER on losses is most pronounced during times of peak loading. The presence of DER in the right location can possibly defer or eliminate the need to re-conductor specific feeder segments, although this is usually not a major component of the MDCC. The effect of DER on reducing losses in the system is quantifiable in energy savings to the utility, with some limited capital savings.
A secondary benefit that DER-based loss reduction provides to the UDC is the reduction of the UDC’s total installed capacity as seen by the transmission system and Independent System Operator (ISO). Capacity payments and ancillary services charged by the ISO to each UDC are allocated in part by total load, including losses. Therefore, incremental loss reductions provided by DER can help reduce these payments from the UDC.
Conclusions on Distribution Capacity
The value of deferring distribution capacity investments, indicated by the MDCC values, varies widely by area. The relatively low mean MDCC values imply that little DER would be cost-effective, if implemented at the same time system wide, at PG&E and especially at PSI, unless system-level (generation and transmission) avoided costs were large, which is unlikely because these utilities had excess generating capacity and slow system-wide load growth at the time of the study (but not now).
The individual area-specific MDCC values also fluctuate considerably over time, although the system-wide MDCC estimates were similar in 1999 compared to 1994. Few of the high-cost areas in 1994 continued to be high-cost areas in 1999; rather they were replaced by other planning areas that become high-cost areas as a result of imminent distribution capacity expansion. Similarly, some of the high-cost areas in 1999 may continue to be high-cost areas in 2001 and beyond, but others will be replaced by other planning areas where distribution capacity expansion is planned.
Tables 2-21 and 2-22 illustrate the importance of MDCC information to evaluating the cost-effectiveness of potential DER sites. For example, based on the 1999 results, a DER unit with a cost of $320/kW would be cost effective in more than 75% of CP&L’s planning areas on the basis of MDCC alone, while it would only be justified in about half of PG&E's areas, less than 10% of PSI's areas, and not at all for KCP&L. A DER application with a cost of $500/kW would be cost-effective in more than half of CP&L’s planning areas but in less than 10% of the other three utilities’ areas.
In addition to the area- and time-specific variations in the MDCC values, the deferral value of DER decreases at high penetration levels, for the following reasons:
• As more DER is introduced, the incremental value of additional DER is reduced.
• Distribution investments are deferred farther into the future, reducing their value.
• Once the DER capacity is sufficient to offset new load growth and defer capacity expansion, additional DER capacity provides no more deferral benefit.
DER Costs, Benefits, and Allocation Issues
2-37
The four-utility study is a few years old, as it was performed looking forward from 1994 to 1999 and beyond. However, the fundamentals of utility planning and growth, costs, and technology that drive the costs of increasing capacity have not changed significantly. Therefore, the level and ranges of the marginal capacity costs across utility planning areas in 1999 should be fairly representative of the current distribution of costs.
Assuming the highest growth areas have been the first priority for distribution investments, the remaining areas that have not yet been upgraded are likely to have high marginal costs looking forward. Simply put, there are probably more high-cost areas with planned distribution expansion projects now than there were in the 1994 study cited above.
Customer Payment for Interconnection Study Costs
Refer to Customer Costs of DER: Interconnection Study Costs.
System Reliability
Assumptions: In the base case that utility reliability metrics remain unchanged due to DER. In a high DER penetration case, we can estimate an improvement.
Reliability of electrical service refers to the adequacy and security of the distribution system. It generally means whether electric service is available or not, and if not, then how often, when, for how long, losing how much load, and affecting how many customers?
Power quality refers in general to waveform specifics such as voltage or frequency abnormalities, power factor, harmonic distortion, or aberrations from an ideal sinusoidal AC wave shape.
Outages and shortages affect utilities, even when they do not lead to service interruptions. For example, a blown transformer in a substation with extra or redundant capacity still requires repair even if no customers are affected. Likewise, a shortage initiates costs of implementing load curtailment programs and (depending on the grid configuration and market structure) scheduling and balancing headaches and price volatility.
Utility outage costs, summarized in Table 2-24, include loss of revenue from customers not served, loss of customer goodwill, loss of future potential sales due to adverse reaction, and increased expenditure due to maintenance and repair. Reliability is generally treated as a constraint in engineering design practices rather than considered explicitly as a cost, requiring that the system meet specific availability, loss-of-load probability (LOLP) or other reliability index criteria.
What matters to the utility is the cost associated with repair, lost revenue due to unserved energy, public perception and goodwill, penalties or foregone performance incentives, manning call centers, and in some extreme cases civil penalties and related legal costs. In the longer term, reliability problems could prompt customers with the greatest sensitivity to simply bypass the utility system altogether.
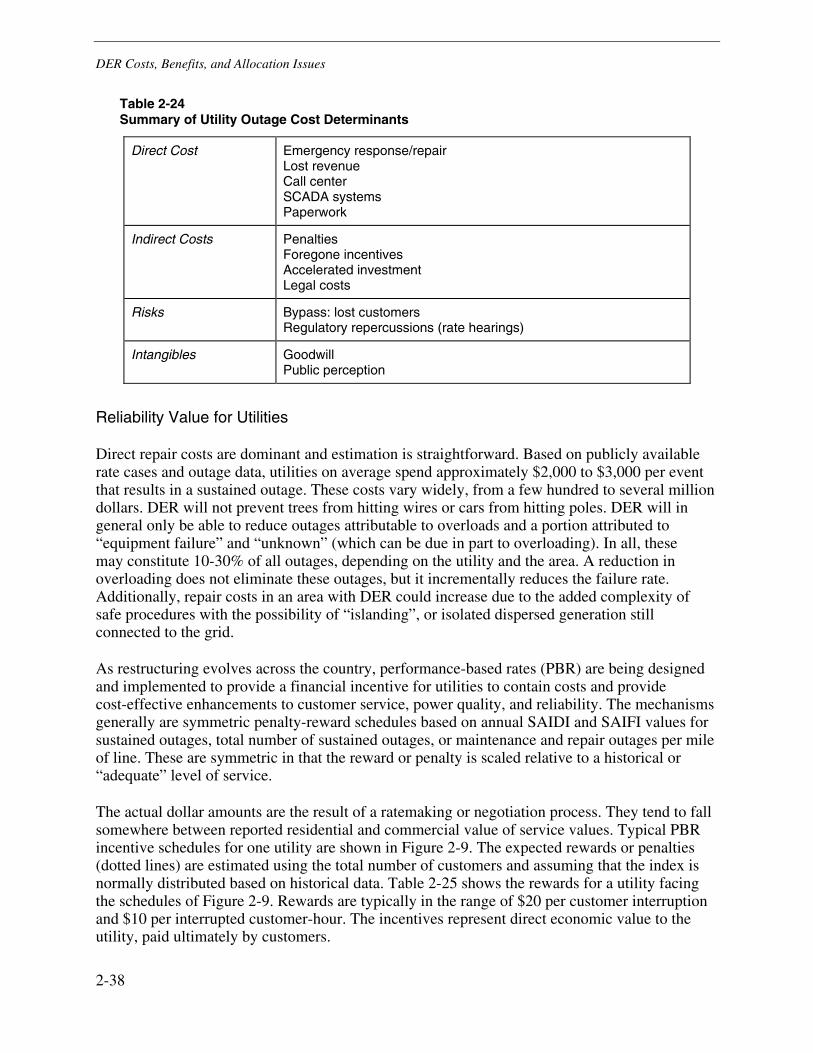
DER Costs, Benefits, and Allocation Issues
2-38
Table 2-24 Summary of Utility Outage Cost Determinants
Direct Cost Emergency response/repair Lost revenue Call center SCADA systems Paperwork
Indirect Costs Penalties Foregone incentives Accelerated investment Legal costs
Risks Bypass: lost customers Regulatory repercussions (rate hearings)
Intangibles Goodwill Public perception
Reliability Value for Utilities
Direct repair costs are dominant and estimation is straightforward. Based on publicly available rate cases and outage data, utilities on average spend approximately $2,000 to $3,000 per event that results in a sustained outage. These costs vary widely, from a few hundred to several million dollars. DER will not prevent trees from hitting wires or cars from hitting poles. DER will in general only be able to reduce outages attributable to overloads and a portion attributed to “equipment failure” and “unknown” (which can be due in part to overloading). In all, these may constitute 10-30% of all outages, depending on the utility and the area. A reduction in overloading does not eliminate these outages, but it incrementally reduces the failure rate. Additionally, repair costs in an area with DER could increase due to the added complexity of safe procedures with the possibility of “islanding”, or isolated dispersed generation still connected to the grid.
As restructuring evolves across the country, performance-based rates (PBR) are being designed and implemented to provide a financial incentive for utilities to contain costs and provide cost-effective enhancements to customer service, power quality, and reliability. The mechanisms generally are symmetric penalty-reward schedules based on annual SAIDI and SAIFI values for sustained outages, total number of sustained outages, or maintenance and repair outages per mile of line. These are symmetric in that the reward or penalty is scaled relative to a historical or “adequate” level of service.
The actual dollar amounts are the result of a ratemaking or negotiation process. They tend to fall somewhere between reported residential and commercial value of service values. Typical PBR incentive schedules for one utility are shown in Figure 2-9. The expected rewards or penalties (dotted lines) are estimated using the total number of customers and assuming that the index is normally distributed based on historical data. Table 2-25 shows the rewards for a utility facing the schedules of Figure 2-9. Rewards are typically in the range of $20 per customer interruption and $10 per interrupted customer-hour. The incentives represent direct economic value to the utility, paid ultimately by customers.
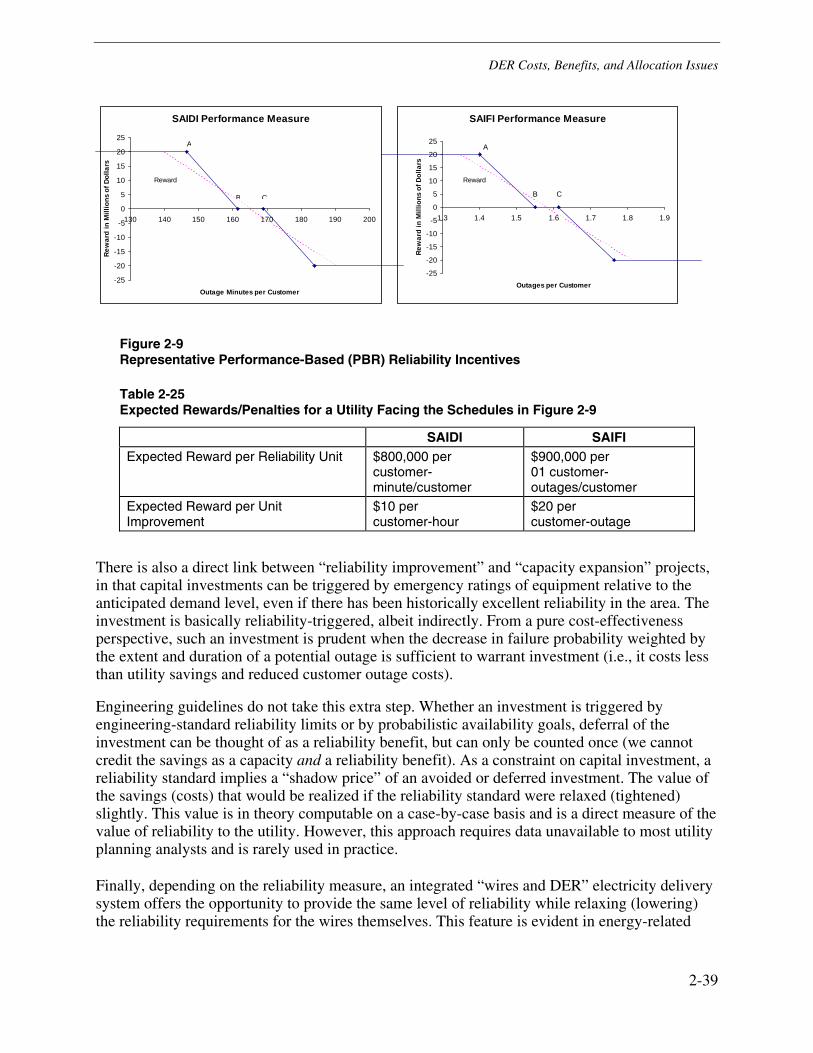
DER Costs, Benefits, and Allocation Issues
2-39
Figure 2-9 Representative Performance-Based (PBR) Reliability Incentives
Table 2-25 Expected Rewards/Penalties for a Utility Facing the Schedules in Figure 2-9
SAIDI SAIFI Expected Reward per Reliability Unit $800,000 per
customer-minute/customer
$900,000 per 01 customer-outages/customer
Expected Reward per Unit Improvement
$10 per customer-hour
$20 per customer-outage
There is also a direct link between “reliability improvement” and “capacity expansion” projects, in that capital investments can be triggered by emergency ratings of equipment relative to the anticipated demand level, even if there has been historically excellent reliability in the area. The investment is basically reliability-triggered, albeit indirectly. From a pure cost-effectiveness perspective, such an investment is prudent when the decrease in failure probability weighted by the extent and duration of a potential outage is sufficient to warrant investment (i.e., it costs less than utility savings and reduced customer outage costs).
Engineering guidelines do not take this extra step. Whether an investment is triggered by engineering-standard reliability limits or by probabilistic availability goals, deferral of the investment can be thought of as a reliability benefit, but can only be counted once (we cannot credit the savings as a capacity and a reliability benefit). As a constraint on capital investment, a reliability standard implies a “shadow price” of an avoided or deferred investment. The value of the savings (costs) that would be realized if the reliability standard were relaxed (tightened) slightly. This value is in theory computable on a case-by-case basis and is a direct measure of the value of reliability to the utility. However, this approach requires data unavailable to most utility planning analysts and is rarely used in practice.
Finally, depending on the reliability measure, an integrated “wires and DER” electricity delivery system offers the opportunity to provide the same level of reliability while relaxing (lowering) the reliability requirements for the wires themselves. This feature is evident in energy-related
SAIFI Performance Measure
-25
-20
-15
-10
-5
0
5
10
15
20
25
1.3 1.4 1.5 1.6 1.7 1.8 1.9
Outages per Customer
Rew
ard
in M
illio
ns o
f Dol
lars
A
B C
Reward
SAIDI Performance Measure
-25
-20
-15
-10
-5
0
5
10
15
20
25
130 140 150 160 170 180 190 200
Outage Minutes per Customer
Rew
ard
in M
illio
ns o
f Dol
lars
A
B C
Reward
DER Costs, Benefits, and Allocation Issues
2-40
measures such as expected unserved energy (EUE) or in partial-peak measures such as availability at 50% of peak or at average load.
The resulting improvement (in EUE, for example) is due to greater weight applied to low load periods, which constitute a high percentage of time and total energy consumed for low load-factor (loads with sharp peaks) customers. The magnitude of the potential cost savings has not yet been studied and is likely modest in most cases, but not all.
Other T&D System Benefits
Assumptions: Include reduction of utility loss savings due to DER in estimation of avoided energy (9% losses assumed) and MDCC costs (12% on-peak losses assumed).
In the base case, assume zero value for other engineering benefit categories.
DER can provide additional economic value beyond capital deferral and improved reliability. Although these value parameters are implicit in the engineering assumptions used to design distribution capacity expansion, they are typically not analyzed explicitly in terms of economic value. As a result, significant economic savings can often be realized by designing a DER-based solution to a specific distribution problem, without wholesale capacity expansion.
This section describes a variety of services that DER is capable of providing, and gives a detailed example showing how such savings can be quantified. The example illustrates the response of a UDC to various operational issues, and the conventional measures that would ordinarily be applied to correct them. A scenario with significant DER penetration is then analyzed to evaluate the ability of DER to provide comparable engineering benefits and to quantify the potential UDC cost savings.
The example also demonstrates how the potential DER benefits are highly case-specific. The results suggest that it is more important to develop a generalized approach for quickly determining the DER benefits in a specific case than to seek a generalized DER benefit value. The last section of this report will address issues surrounding the actual treatment of these savings from an institutional and regulatory perspective.
Voltage Support
A UDC defines criteria for maintaining voltage within prescribed tolerances throughout the system. These criteria require the UDC to take measures to prevent voltage from being either too high or too low under normal or contingency conditions. The greater concern is typically keeping the voltage above minimum limits, because voltage drops are more precipitous during peak load periods.
Conventional measures used to provide voltage support include the installation of voltage regulators (essentially series transformers with variable output settings), or capacitors, boosters, and in some cases upgraded line segments. (An inadequately sized line can exacerbate a voltage drop problem because of its higher impedance). Reactive power (VAR) support has a powerful impact on supporting voltage, as there is a more direct relationship between voltage and reactive power flow than with real power flow. Thus, capacitors that provide VAR support are often preferred over regulators.
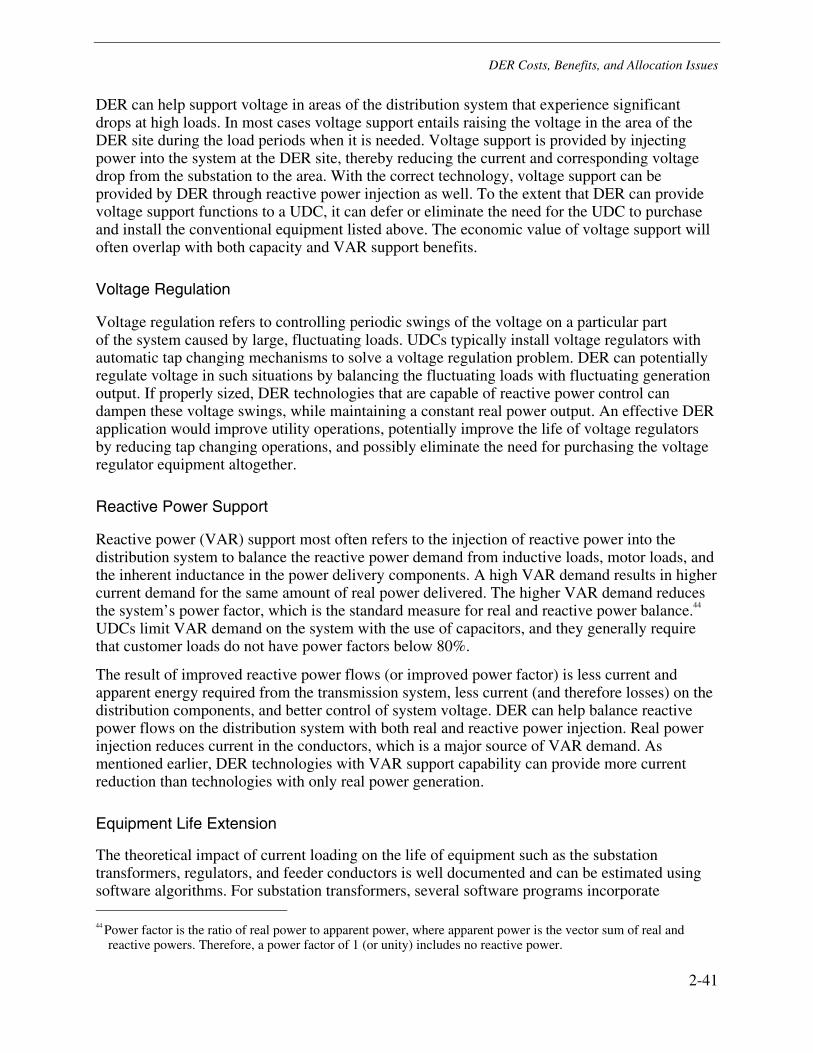
DER Costs, Benefits, and Allocation Issues
2-41
DER can help support voltage in areas of the distribution system that experience significant drops at high loads. In most cases voltage support entails raising the voltage in the area of the DER site during the load periods when it is needed. Voltage support is provided by injecting power into the system at the DER site, thereby reducing the current and corresponding voltage drop from the substation to the area. With the correct technology, voltage support can be provided by DER through reactive power injection as well. To the extent that DER can provide voltage support functions to a UDC, it can defer or eliminate the need for the UDC to purchase and install the conventional equipment listed above. The economic value of voltage support will often overlap with both capacity and VAR support benefits.
Voltage Regulation
Voltage regulation refers to controlling periodic swings of the voltage on a particular part of the system caused by large, fluctuating loads. UDCs typically install voltage regulators with automatic tap changing mechanisms to solve a voltage regulation problem. DER can potentially regulate voltage in such situations by balancing the fluctuating loads with fluctuating generation output. If properly sized, DER technologies that are capable of reactive power control can dampen these voltage swings, while maintaining a constant real power output. An effective DER application would improve utility operations, potentially improve the life of voltage regulators by reducing tap changing operations, and possibly eliminate the need for purchasing the voltage regulator equipment altogether.
Reactive Power Support
Reactive power (VAR) support most often refers to the injection of reactive power into the distribution system to balance the reactive power demand from inductive loads, motor loads, and the inherent inductance in the power delivery components. A high VAR demand results in higher current demand for the same amount of real power delivered. The higher VAR demand reduces the system’s power factor, which is the standard measure for real and reactive power balance.44 UDCs limit VAR demand on the system with the use of capacitors, and they generally require that customer loads do not have power factors below 80%.
The result of improved reactive power flows (or improved power factor) is less current and apparent energy required from the transmission system, less current (and therefore losses) on the distribution components, and better control of system voltage. DER can help balance reactive power flows on the distribution system with both real and reactive power injection. Real power injection reduces current in the conductors, which is a major source of VAR demand. As mentioned earlier, DER technologies with VAR support capability can provide more current reduction than technologies with only real power generation.
Equipment Life Extension
The theoretical impact of current loading on the life of equipment such as the substation transformers, regulators, and feeder conductors is well documented and can be estimated using software algorithms. For substation transformers, several software programs incorporate 44 Power factor is the ratio of real power to apparent power, where apparent power is the vector sum of real and
reactive powers. Therefore, a power factor of 1 (or unity) includes no reactive power.
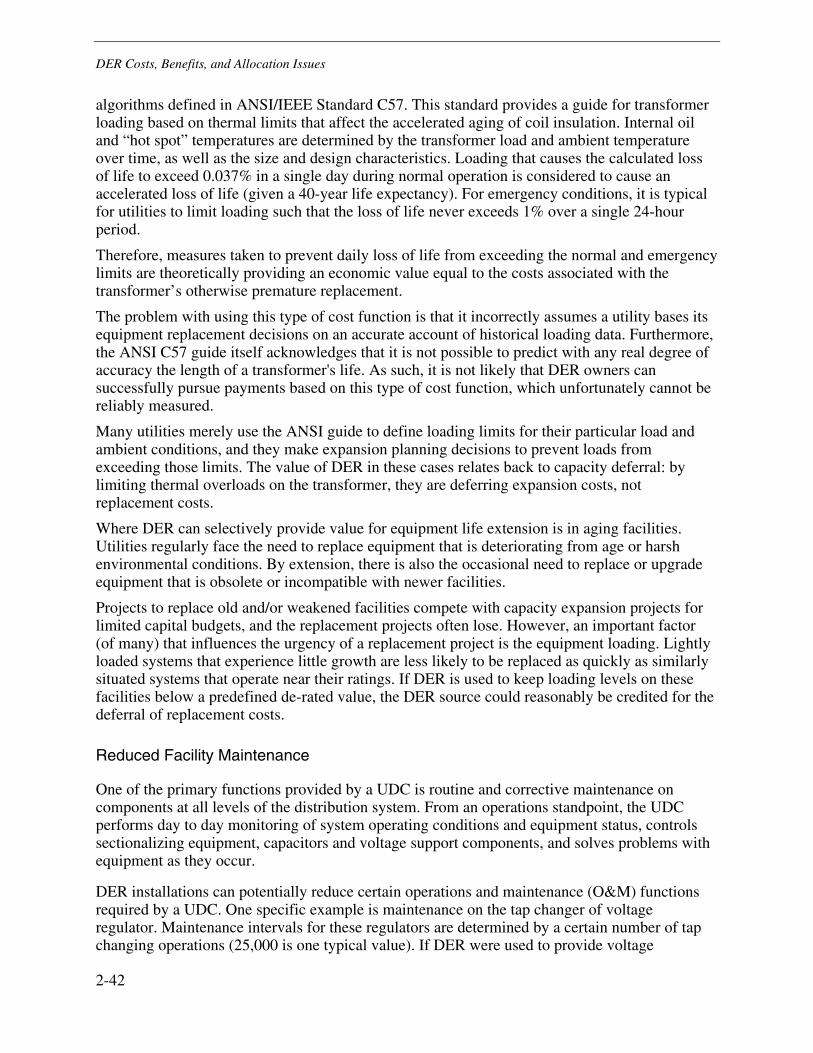
DER Costs, Benefits, and Allocation Issues
2-42
algorithms defined in ANSI/IEEE Standard C57. This standard provides a guide for transformer loading based on thermal limits that affect the accelerated aging of coil insulation. Internal oil and “hot spot” temperatures are determined by the transformer load and ambient temperature over time, as well as the size and design characteristics. Loading that causes the calculated loss of life to exceed 0.037% in a single day during normal operation is considered to cause an accelerated loss of life (given a 40-year life expectancy). For emergency conditions, it is typical for utilities to limit loading such that the loss of life never exceeds 1% over a single 24-hour period.
Therefore, measures taken to prevent daily loss of life from exceeding the normal and emergency limits are theoretically providing an economic value equal to the costs associated with the transformer’s otherwise premature replacement.
The problem with using this type of cost function is that it incorrectly assumes a utility bases its equipment replacement decisions on an accurate account of historical loading data. Furthermore, the ANSI C57 guide itself acknowledges that it is not possible to predict with any real degree of accuracy the length of a transformer's life. As such, it is not likely that DER owners can successfully pursue payments based on this type of cost function, which unfortunately cannot be reliably measured.
Many utilities merely use the ANSI guide to define loading limits for their particular load and ambient conditions, and they make expansion planning decisions to prevent loads from exceeding those limits. The value of DER in these cases relates back to capacity deferral: by limiting thermal overloads on the transformer, they are deferring expansion costs, not replacement costs.
Where DER can selectively provide value for equipment life extension is in aging facilities. Utilities regularly face the need to replace equipment that is deteriorating from age or harsh environmental conditions. By extension, there is also the occasional need to replace or upgrade equipment that is obsolete or incompatible with newer facilities.
Projects to replace old and/or weakened facilities compete with capacity expansion projects for limited capital budgets, and the replacement projects often lose. However, an important factor (of many) that influences the urgency of a replacement project is the equipment loading. Lightly loaded systems that experience little growth are less likely to be replaced as quickly as similarly situated systems that operate near their ratings. If DER is used to keep loading levels on these facilities below a predefined de-rated value, the DER source could reasonably be credited for the deferral of replacement costs.
Reduced Facility Maintenance
One of the primary functions provided by a UDC is routine and corrective maintenance on components at all levels of the distribution system. From an operations standpoint, the UDC performs day to day monitoring of system operating conditions and equipment status, controls sectionalizing equipment, capacitors and voltage support components, and solves problems with equipment as they occur.
DER installations can potentially reduce certain operations and maintenance (O&M) functions required by a UDC. One specific example is maintenance on the tap changer of voltage regulator. Maintenance intervals for these regulators are determined by a certain number of tap changing operations (25,000 is one typical value). If DER were used to provide voltage
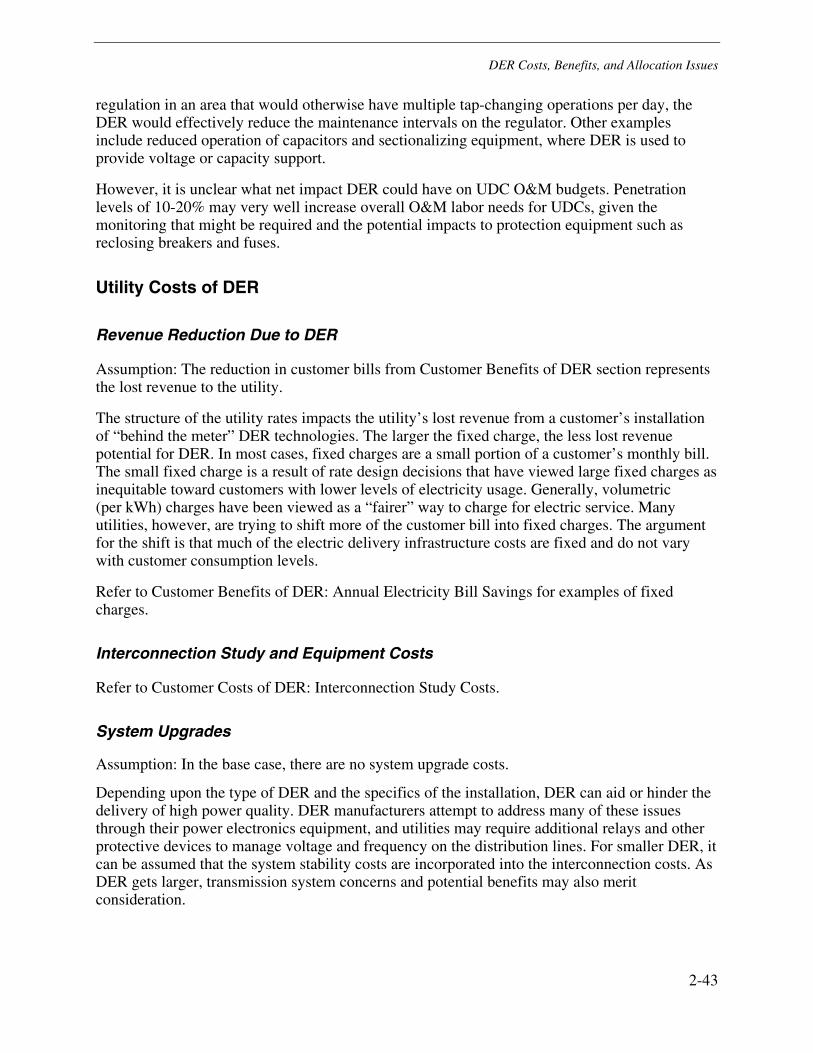
DER Costs, Benefits, and Allocation Issues
2-43
regulation in an area that would otherwise have multiple tap-changing operations per day, the DER would effectively reduce the maintenance intervals on the regulator. Other examples include reduced operation of capacitors and sectionalizing equipment, where DER is used to provide voltage or capacity support.
However, it is unclear what net impact DER could have on UDC O&M budgets. Penetration levels of 10-20% may very well increase overall O&M labor needs for UDCs, given the monitoring that might be required and the potential impacts to protection equipment such as reclosing breakers and fuses.
Utility Costs of DER
Revenue Reduction Due to DER
Assumption: The reduction in customer bills from Customer Benefits of DER section represents the lost revenue to the utility.
The structure of the utility rates impacts the utility’s lost revenue from a customer’s installation of “behind the meter” DER technologies. The larger the fixed charge, the less lost revenue potential for DER. In most cases, fixed charges are a small portion of a customer’s monthly bill. The small fixed charge is a result of rate design decisions that have viewed large fixed charges as inequitable toward customers with lower levels of electricity usage. Generally, volumetric (per kWh) charges have been viewed as a “fairer” way to charge for electric service. Many utilities, however, are trying to shift more of the customer bill into fixed charges. The argument for the shift is that much of the electric delivery infrastructure costs are fixed and do not vary with customer consumption levels.
Refer to Customer Benefits of DER: Annual Electricity Bill Savings for examples of fixed charges.
Interconnection Study and Equipment Costs
Refer to Customer Costs of DER: Interconnection Study Costs.
System Upgrades
Assumption: In the base case, there are no system upgrade costs.
Depending upon the type of DER and the specifics of the installation, DER can aid or hinder the delivery of high power quality. DER manufacturers attempt to address many of these issues through their power electronics equipment, and utilities may require additional relays and other protective devices to manage voltage and frequency on the distribution lines. For smaller DER, it can be assumed that the system stability costs are incorporated into the interconnection costs. As DER gets larger, transmission system concerns and potential benefits may also merit consideration.
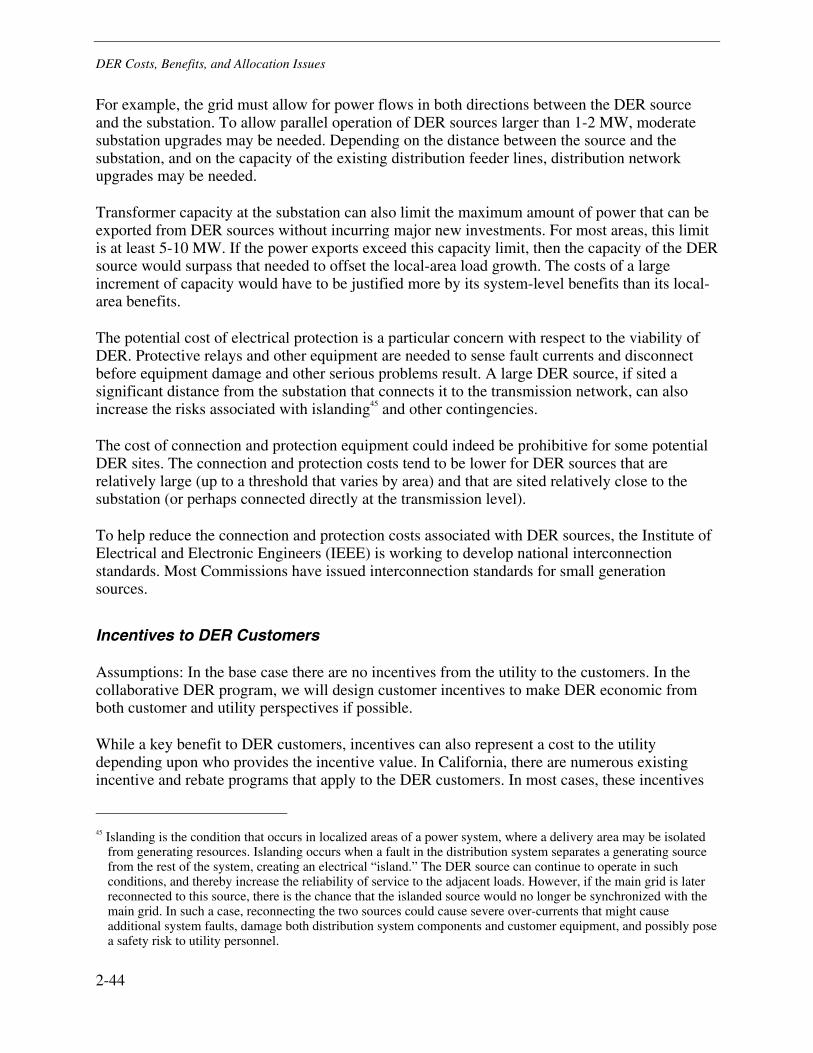
DER Costs, Benefits, and Allocation Issues
2-44
For example, the grid must allow for power flows in both directions between the DER source and the substation. To allow parallel operation of DER sources larger than 1-2 MW, moderate substation upgrades may be needed. Depending on the distance between the source and the substation, and on the capacity of the existing distribution feeder lines, distribution network upgrades may be needed.
Transformer capacity at the substation can also limit the maximum amount of power that can be exported from DER sources without incurring major new investments. For most areas, this limit is at least 5-10 MW. If the power exports exceed this capacity limit, then the capacity of the DER source would surpass that needed to offset the local-area load growth. The costs of a large increment of capacity would have to be justified more by its system-level benefits than its local-area benefits.
The potential cost of electrical protection is a particular concern with respect to the viability of DER. Protective relays and other equipment are needed to sense fault currents and disconnect before equipment damage and other serious problems result. A large DER source, if sited a significant distance from the substation that connects it to the transmission network, can also increase the risks associated with islanding45 and other contingencies.
The cost of connection and protection equipment could indeed be prohibitive for some potential DER sites. The connection and protection costs tend to be lower for DER sources that are relatively large (up to a threshold that varies by area) and that are sited relatively close to the substation (or perhaps connected directly at the transmission level).
To help reduce the connection and protection costs associated with DER sources, the Institute of Electrical and Electronic Engineers (IEEE) is working to develop national interconnection standards. Most Commissions have issued interconnection standards for small generation sources.
Incentives to DER Customers
Assumptions: In the base case there are no incentives from the utility to the customers. In the collaborative DER program, we will design customer incentives to make DER economic from both customer and utility perspectives if possible.
While a key benefit to DER customers, incentives can also represent a cost to the utility depending upon who provides the incentive value. In California, there are numerous existing incentive and rebate programs that apply to the DER customers. In most cases, these incentives
45 Islanding is the condition that occurs in localized areas of a power system, where a delivery area may be isolated
from generating resources. Islanding occurs when a fault in the distribution system separates a generating source from the rest of the system, creating an electrical “island.” The DER source can continue to operate in such conditions, and thereby increase the reliability of service to the adjacent loads. However, if the main grid is later reconnected to this source, there is the chance that the islanded source would no longer be synchronized with the main grid. In such a case, reconnecting the two sources could cause severe over-currents that might cause additional system faults, damage both distribution system components and customer equipment, and possibly pose a safety risk to utility personnel.
DER Costs, Benefits, and Allocation Issues
2-45
are only available to customers who have installed renewable DER technologies. Utilities, on the other hand, can provide monetary incentives to DER customers through a tariff structure, a competitive request for proposals, or a bilateral contract for generation services.
Refer to Allocation Issues: Incentives/Locational Credits for ranges of incentive payments
Total Resource Benefits of DER (Combining the Utility and DER Customer Perspectives)
Avoided Energy Purchases
Refer to Utility Benefits of DER: Avoided Wholesale Energy Purchases.
Avoided Fuel Costs
Refer to Customer Benefits of DER: Annual Avoided Fuel Costs.
T&D Avoided Costs
Refer to Utility Benefits of DER: Avoided T&D Capacity.
Increased Reliability
Refer to Customer Benefits of DER: Customer Reliability and Utility Benefits of DER: System Reliability.
Total Resource Costs of DER (Combining the Utility and DER Customer Perspectives)
DER Equipment, Maintenance, and Fuel Costs
Refer to Customer Costs of DER: Annual Capital Costs, DER Maintenance, and DER Fuel Costs.
Interconnection Studies, Equipment and Electric System Upgrades
Refer to Customer Costs of DER and Utility Costs of DER.
Other Utility Infrastructure Costs and Operational Costs
Refer to Utility Costs of DER.
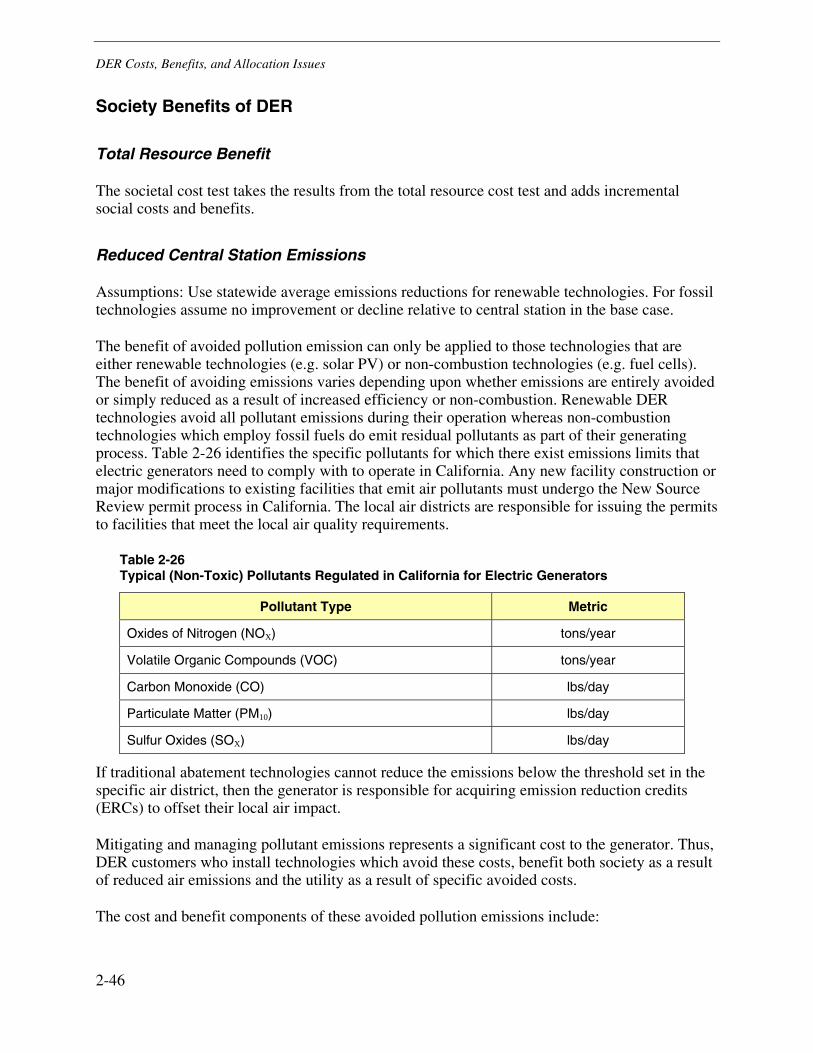
DER Costs, Benefits, and Allocation Issues
2-46
Society Benefits of DER
Total Resource Benefit
The societal cost test takes the results from the total resource cost test and adds incremental social costs and benefits.
Reduced Central Station Emissions
Assumptions: Use statewide average emissions reductions for renewable technologies. For fossil technologies assume no improvement or decline relative to central station in the base case.
The benefit of avoided pollution emission can only be applied to those technologies that are either renewable technologies (e.g. solar PV) or non-combustion technologies (e.g. fuel cells). The benefit of avoiding emissions varies depending upon whether emissions are entirely avoided or simply reduced as a result of increased efficiency or non-combustion. Renewable DER technologies avoid all pollutant emissions during their operation whereas non-combustion technologies which employ fossil fuels do emit residual pollutants as part of their generating process. Table 2-26 identifies the specific pollutants for which there exist emissions limits that electric generators need to comply with to operate in California. Any new facility construction or major modifications to existing facilities that emit air pollutants must undergo the New Source Review permit process in California. The local air districts are responsible for issuing the permits to facilities that meet the local air quality requirements.
Table 2-26 Typical (Non-Toxic) Pollutants Regulated in California for Electric Generators
Pollutant Type Metric
Oxides of Nitrogen (NOX) tons/year
Volatile Organic Compounds (VOC) tons/year
Carbon Monoxide (CO) lbs/day
Particulate Matter (PM10) lbs/day
Sulfur Oxides (SOX) lbs/day
If traditional abatement technologies cannot reduce the emissions below the threshold set in the specific air district, then the generator is responsible for acquiring emission reduction credits (ERCs) to offset their local air impact.
Mitigating and managing pollutant emissions represents a significant cost to the generator. Thus, DER customers who install technologies which avoid these costs, benefit both society as a result of reduced air emissions and the utility as a result of specific avoided costs.
The cost and benefit components of these avoided pollution emissions include:
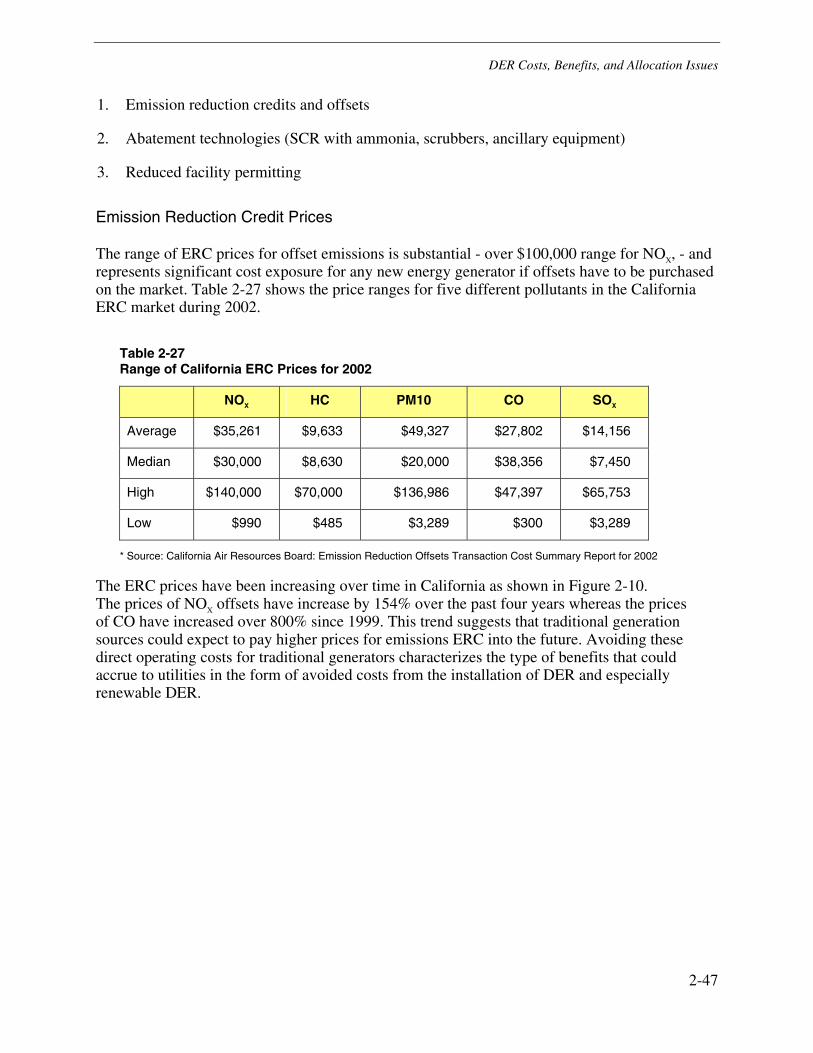
DER Costs, Benefits, and Allocation Issues
2-47
1. Emission reduction credits and offsets
2. Abatement technologies (SCR with ammonia, scrubbers, ancillary equipment)
3. Reduced facility permitting
Emission Reduction Credit Prices
The range of ERC prices for offset emissions is substantial - over $100,000 range for NOX, - and represents significant cost exposure for any new energy generator if offsets have to be purchased on the market. Table 2-27 shows the price ranges for five different pollutants in the California ERC market during 2002.
Table 2-27 Range of California ERC Prices for 2002
NOX HC PM10 CO SOX
Average $35,261 $9,633 $49,327 $27,802 $14,156
Median $30,000 $8,630 $20,000 $38,356 $7,450
High $140,000 $70,000 $136,986 $47,397 $65,753
Low $990 $485 $3,289 $300 $3,289
* Source: California Air Resources Board: Emission Reduction Offsets Transaction Cost Summary Report for 2002
The ERC prices have been increasing over time in California as shown in Figure 2-10. The prices of NOX offsets have increase by 154% over the past four years whereas the prices of CO have increased over 800% since 1999. This trend suggests that traditional generation sources could expect to pay higher prices for emissions ERC into the future. Avoiding these direct operating costs for traditional generators characterizes the type of benefits that could accrue to utilities in the form of avoided costs from the installation of DER and especially renewable DER.
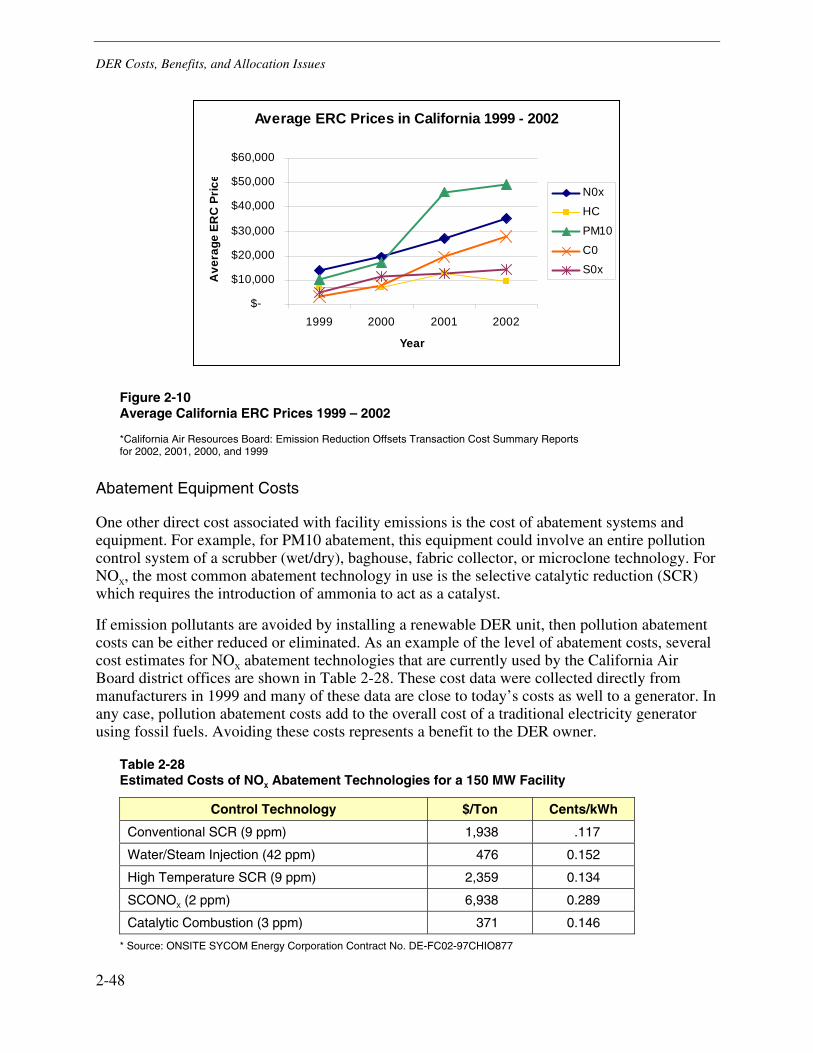
DER Costs, Benefits, and Allocation Issues
2-48
Average ERC Prices in California 1999 - 2002
$-
$10,000
$20,000
$30,000
$40,000
$50,000
$60,000
1999 2000 2001 2002
Year
Ave
rage
ER
C P
rice
N0x
HC
PM10
C0S0x
Figure 2-10 Average California ERC Prices 1999 – 2002
*California Air Resources Board: Emission Reduction Offsets Transaction Cost Summary Reports for 2002, 2001, 2000, and 1999
Abatement Equipment Costs
One other direct cost associated with facility emissions is the cost of abatement systems and equipment. For example, for PM10 abatement, this equipment could involve an entire pollution control system of a scrubber (wet/dry), baghouse, fabric collector, or microclone technology. For NOX, the most common abatement technology in use is the selective catalytic reduction (SCR) which requires the introduction of ammonia to act as a catalyst.
If emission pollutants are avoided by installing a renewable DER unit, then pollution abatement costs can be either reduced or eliminated. As an example of the level of abatement costs, several cost estimates for NOX abatement technologies that are currently used by the California Air Board district offices are shown in Table 2-28. These cost data were collected directly from manufacturers in 1999 and many of these data are close to today’s costs as well to a generator. In any case, pollution abatement costs add to the overall cost of a traditional electricity generator using fossil fuels. Avoiding these costs represents a benefit to the DER owner.
Table 2-28 Estimated Costs of NOX Abatement Technologies for a 150 MW Facility
Control Technology $/Ton Cents/kWh
Conventional SCR (9 ppm) 1,938 .117
Water/Steam Injection (42 ppm) 476 0.152
High Temperature SCR (9 ppm) 2,359 0.134
SCONOX (2 ppm) 6,938 0.289
Catalytic Combustion (3 ppm) 371 0.146
* Source: ONSITE SYCOM Energy Corporation Contract No. DE-FC02-97CHIO877
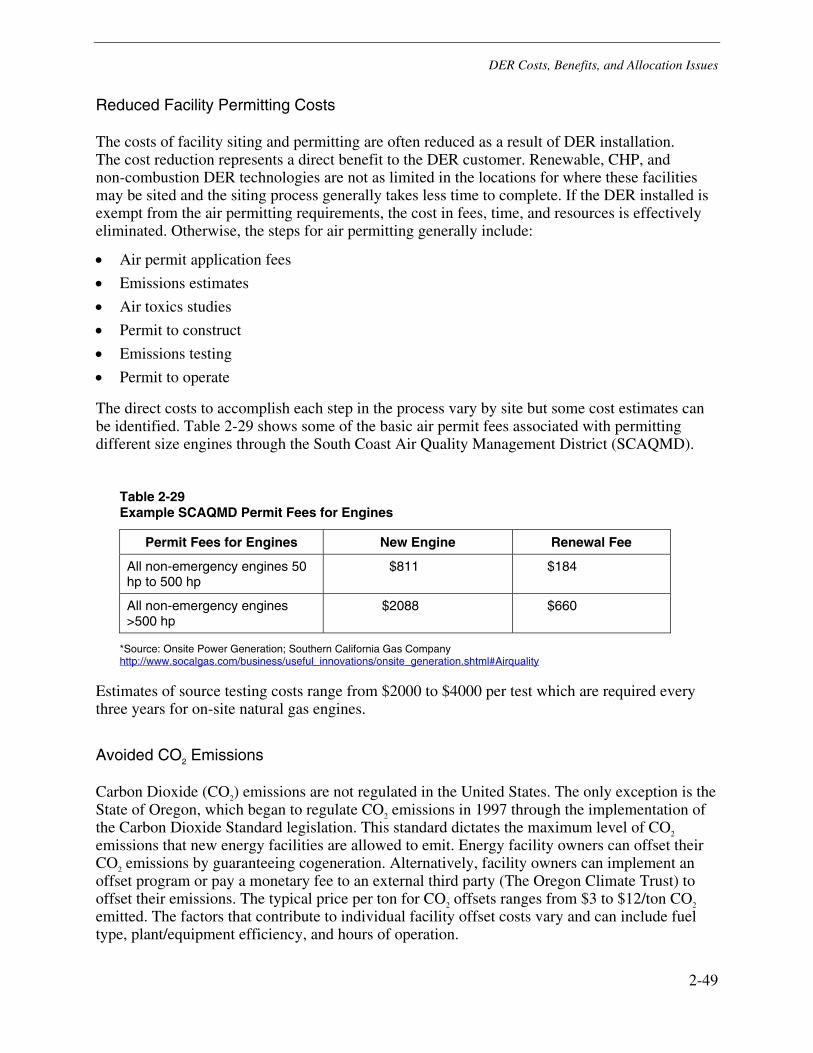
DER Costs, Benefits, and Allocation Issues
2-49
Reduced Facility Permitting Costs
The costs of facility siting and permitting are often reduced as a result of DER installation. The cost reduction represents a direct benefit to the DER customer. Renewable, CHP, and non-combustion DER technologies are not as limited in the locations for where these facilities may be sited and the siting process generally takes less time to complete. If the DER installed is exempt from the air permitting requirements, the cost in fees, time, and resources is effectively eliminated. Otherwise, the steps for air permitting generally include:
• Air permit application fees
• Emissions estimates
• Air toxics studies
• Permit to construct
• Emissions testing
• Permit to operate
The direct costs to accomplish each step in the process vary by site but some cost estimates can be identified. Table 2-29 shows some of the basic air permit fees associated with permitting different size engines through the South Coast Air Quality Management District (SCAQMD).
Table 2-29 Example SCAQMD Permit Fees for Engines
Permit Fees for Engines New Engine Renewal Fee
All non-emergency engines 50 hp to 500 hp
$811 $184
All non-emergency engines >500 hp
$2088 $660
*Source: Onsite Power Generation; Southern California Gas Company http://www.socalgas.com/business/useful_innovations/onsite_generation.shtml#Airquality
Estimates of source testing costs range from $2000 to $4000 per test which are required every three years for on-site natural gas engines.
Avoided CO2 Emissions
Carbon Dioxide (CO2) emissions are not regulated in the United States. The only exception is the State of Oregon, which began to regulate CO2 emissions in 1997 through the implementation of the Carbon Dioxide Standard legislation. This standard dictates the maximum level of CO2 emissions that new energy facilities are allowed to emit. Energy facility owners can offset their CO2 emissions by guaranteeing cogeneration. Alternatively, facility owners can implement an offset program or pay a monetary fee to an external third party (The Oregon Climate Trust) to offset their emissions. The typical price per ton for CO2 offsets ranges from $3 to $12/ton CO2 emitted. The factors that contribute to individual facility offset costs vary and can include fuel type, plant/equipment efficiency, and hours of operation.
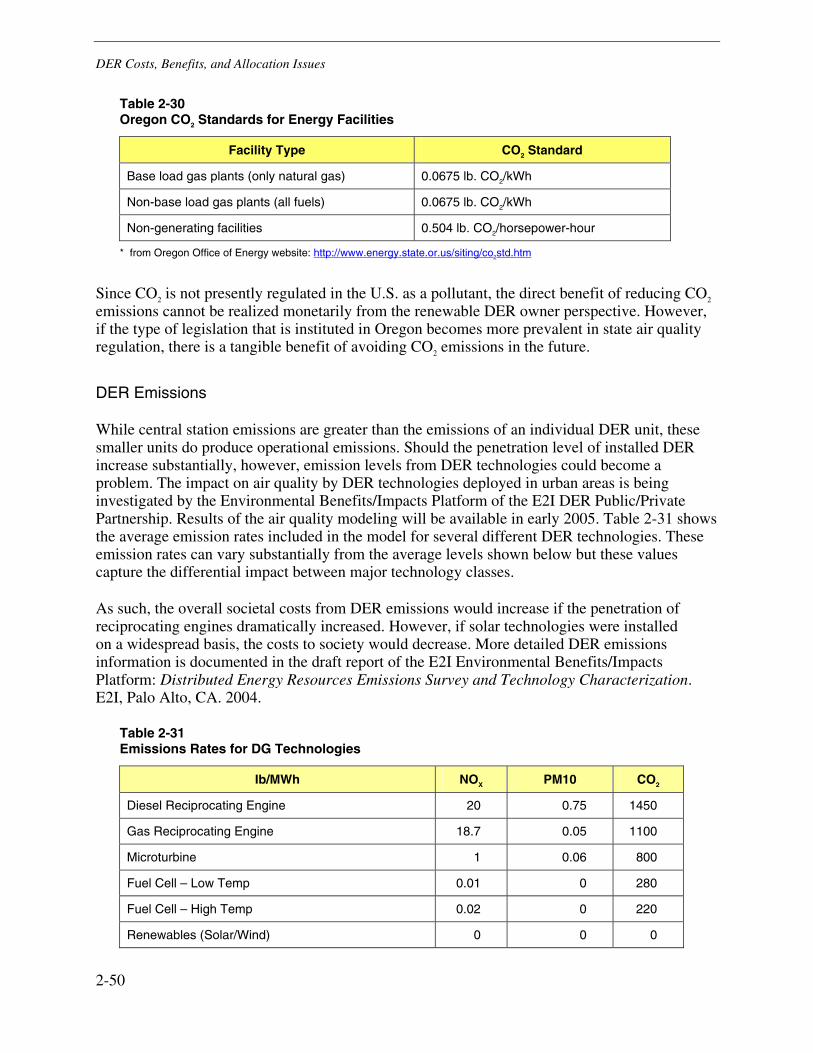
DER Costs, Benefits, and Allocation Issues
2-50
Table 2-30 Oregon CO2 Standards for Energy Facilities
Facility Type CO2 Standard
Base load gas plants (only natural gas) 0.0675 lb. CO2/kWh
Non-base load gas plants (all fuels) 0.0675 lb. CO2/kWh
Non-generating facilities 0.504 lb. CO2/horsepower-hour
* from Oregon Office of Energy website: http://www.energy.state.or.us/siting/co2std.htm
Since CO2 is not presently regulated in the U.S. as a pollutant, the direct benefit of reducing CO2 emissions cannot be realized monetarily from the renewable DER owner perspective. However, if the type of legislation that is instituted in Oregon becomes more prevalent in state air quality regulation, there is a tangible benefit of avoiding CO2 emissions in the future.
DER Emissions
While central station emissions are greater than the emissions of an individual DER unit, these smaller units do produce operational emissions. Should the penetration level of installed DER increase substantially, however, emission levels from DER technologies could become a problem. The impact on air quality by DER technologies deployed in urban areas is being investigated by the Environmental Benefits/Impacts Platform of the E2I DER Public/Private Partnership. Results of the air quality modeling will be available in early 2005. Table 2-31 shows the average emission rates included in the model for several different DER technologies. These emission rates can vary substantially from the average levels shown below but these values capture the differential impact between major technology classes.
As such, the overall societal costs from DER emissions would increase if the penetration of reciprocating engines dramatically increased. However, if solar technologies were installed on a widespread basis, the costs to society would decrease. More detailed DER emissions information is documented in the draft report of the E2I Environmental Benefits/Impacts Platform: Distributed Energy Resources Emissions Survey and Technology Characterization. E2I, Palo Alto, CA. 2004.
Table 2-31 Emissions Rates for DG Technologies
Ib/MWh NOX PM10 CO2
Diesel Reciprocating Engine 20 0.75 1450
Gas Reciprocating Engine 18.7 0.05 1100
Microturbine 1 0.06 800
Fuel Cell – Low Temp 0.01 0 280
Fuel Cell – High Temp 0.02 0 220
Renewables (Solar/Wind) 0 0 0

DER Costs, Benefits, and Allocation Issues
2-51
Society Costs of DER
Total Resource Cost
The societal cost test takes the results from the total resource cost test and adds incremental social costs and benefits.
DER Emissions
Refer to previous section.
Incentives/Locational Credits
Refer to Allocation Issues and Utility Costs of DER: Incentives to DER Customers.
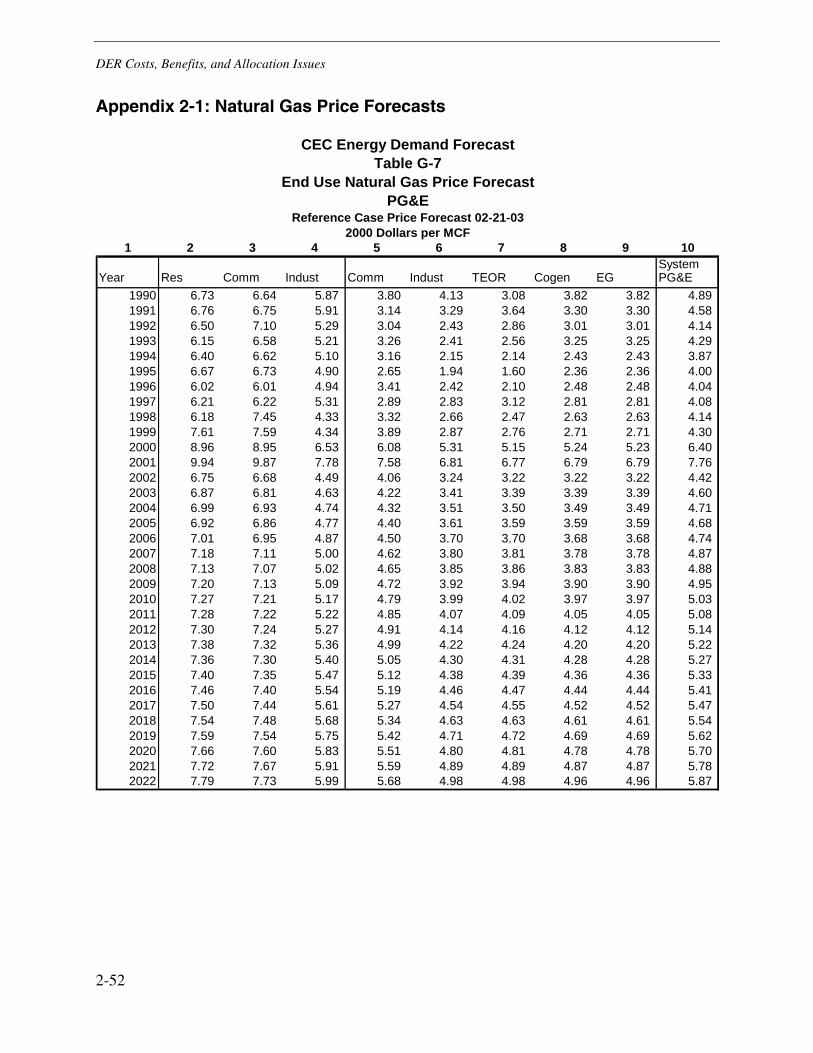
DER Costs, Benefits, and Allocation Issues
2-52
Appendix 2-1: Natural Gas Price Forecasts
1 2 3 4 5 6 7 8 9 10System
Year Res Comm Indust Comm Indust TEOR Cogen EG PG&E1990 6.73 6.64 5.87 3.80 4.13 3.08 3.82 3.82 4.89 1991 6.76 6.75 5.91 3.14 3.29 3.64 3.30 3.30 4.58 1992 6.50 7.10 5.29 3.04 2.43 2.86 3.01 3.01 4.14 1993 6.15 6.58 5.21 3.26 2.41 2.56 3.25 3.25 4.29 1994 6.40 6.62 5.10 3.16 2.15 2.14 2.43 2.43 3.87 1995 6.67 6.73 4.90 2.65 1.94 1.60 2.36 2.36 4.00 1996 6.02 6.01 4.94 3.41 2.42 2.10 2.48 2.48 4.04 1997 6.21 6.22 5.31 2.89 2.83 3.12 2.81 2.81 4.08 1998 6.18 7.45 4.33 3.32 2.66 2.47 2.63 2.63 4.14 1999 7.61 7.59 4.34 3.89 2.87 2.76 2.71 2.71 4.30 2000 8.96 8.95 6.53 6.08 5.31 5.15 5.24 5.23 6.40 2001 9.94 9.87 7.78 7.58 6.81 6.77 6.79 6.79 7.76 2002 6.75 6.68 4.49 4.06 3.24 3.22 3.22 3.22 4.42 2003 6.87 6.81 4.63 4.22 3.41 3.39 3.39 3.39 4.60 2004 6.99 6.93 4.74 4.32 3.51 3.50 3.49 3.49 4.71 2005 6.92 6.86 4.77 4.40 3.61 3.59 3.59 3.59 4.68 2006 7.01 6.95 4.87 4.50 3.70 3.70 3.68 3.68 4.74 2007 7.18 7.11 5.00 4.62 3.80 3.81 3.78 3.78 4.87 2008 7.13 7.07 5.02 4.65 3.85 3.86 3.83 3.83 4.88 2009 7.20 7.13 5.09 4.72 3.92 3.94 3.90 3.90 4.95 2010 7.27 7.21 5.17 4.79 3.99 4.02 3.97 3.97 5.03 2011 7.28 7.22 5.22 4.85 4.07 4.09 4.05 4.05 5.08 2012 7.30 7.24 5.27 4.91 4.14 4.16 4.12 4.12 5.14 2013 7.38 7.32 5.36 4.99 4.22 4.24 4.20 4.20 5.22 2014 7.36 7.30 5.40 5.05 4.30 4.31 4.28 4.28 5.27 2015 7.40 7.35 5.47 5.12 4.38 4.39 4.36 4.36 5.33 2016 7.46 7.40 5.54 5.19 4.46 4.47 4.44 4.44 5.41 2017 7.50 7.44 5.61 5.27 4.54 4.55 4.52 4.52 5.47 2018 7.54 7.48 5.68 5.34 4.63 4.63 4.61 4.61 5.54 2019 7.59 7.54 5.75 5.42 4.71 4.72 4.69 4.69 5.62 2020 7.66 7.60 5.83 5.51 4.80 4.81 4.78 4.78 5.70 2021 7.72 7.67 5.91 5.59 4.89 4.89 4.87 4.87 5.78 2022 7.79 7.73 5.99 5.68 4.98 4.98 4.96 4.96 5.87
CEC Energy Demand ForecastTable G-7
End Use Natural Gas Price ForecastPG&E
Reference Case Price Forecast 02-21-032000 Dollars per MCF
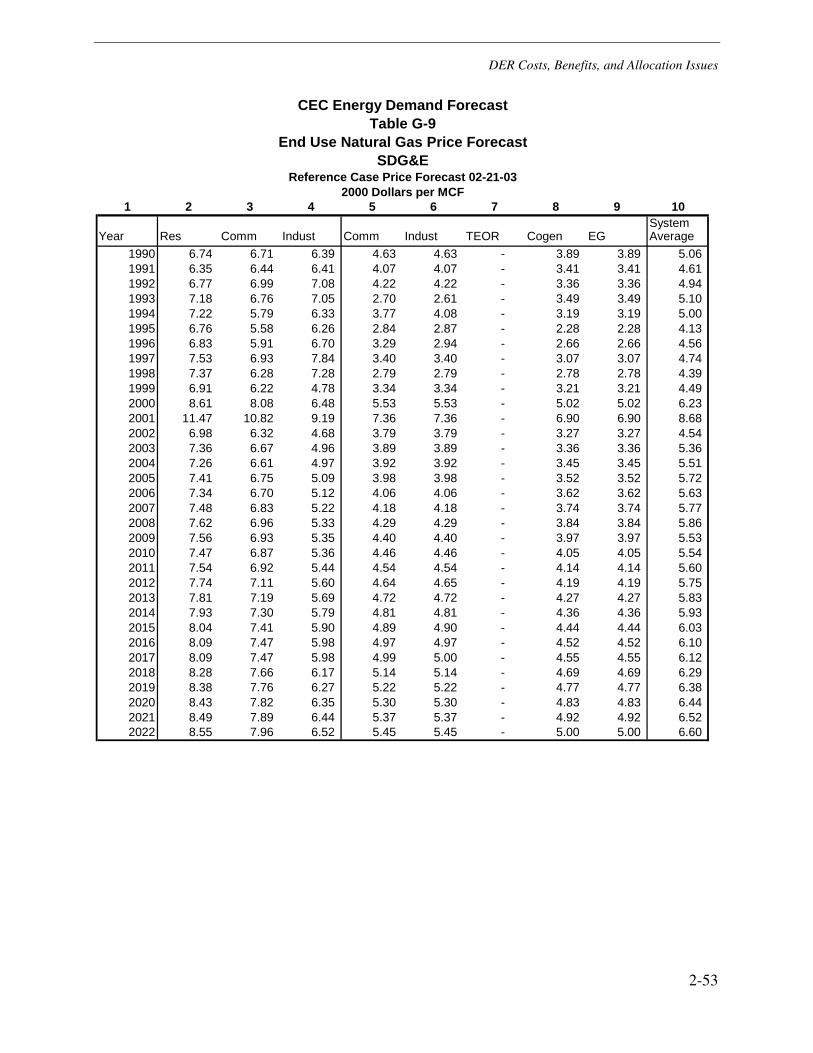
DER Costs, Benefits, and Allocation Issues
2-53
1 2 3 4 5 6 7 8 9 10System
Year Res Comm Indust Comm Indust TEOR Cogen EG Average1990 6.74 6.71 6.39 4.63 4.63 - 3.89 3.89 5.06 1991 6.35 6.44 6.41 4.07 4.07 - 3.41 3.41 4.61 1992 6.77 6.99 7.08 4.22 4.22 - 3.36 3.36 4.94 1993 7.18 6.76 7.05 2.70 2.61 - 3.49 3.49 5.10 1994 7.22 5.79 6.33 3.77 4.08 - 3.19 3.19 5.00 1995 6.76 5.58 6.26 2.84 2.87 - 2.28 2.28 4.13 1996 6.83 5.91 6.70 3.29 2.94 - 2.66 2.66 4.56 1997 7.53 6.93 7.84 3.40 3.40 - 3.07 3.07 4.74 1998 7.37 6.28 7.28 2.79 2.79 - 2.78 2.78 4.39 1999 6.91 6.22 4.78 3.34 3.34 - 3.21 3.21 4.49 2000 8.61 8.08 6.48 5.53 5.53 - 5.02 5.02 6.23 2001 11.47 10.82 9.19 7.36 7.36 - 6.90 6.90 8.68 2002 6.98 6.32 4.68 3.79 3.79 - 3.27 3.27 4.54 2003 7.36 6.67 4.96 3.89 3.89 - 3.36 3.36 5.36 2004 7.26 6.61 4.97 3.92 3.92 - 3.45 3.45 5.51 2005 7.41 6.75 5.09 3.98 3.98 - 3.52 3.52 5.72 2006 7.34 6.70 5.12 4.06 4.06 - 3.62 3.62 5.63 2007 7.48 6.83 5.22 4.18 4.18 - 3.74 3.74 5.77 2008 7.62 6.96 5.33 4.29 4.29 - 3.84 3.84 5.86 2009 7.56 6.93 5.35 4.40 4.40 - 3.97 3.97 5.53 2010 7.47 6.87 5.36 4.46 4.46 - 4.05 4.05 5.54 2011 7.54 6.92 5.44 4.54 4.54 - 4.14 4.14 5.60 2012 7.74 7.11 5.60 4.64 4.65 - 4.19 4.19 5.75 2013 7.81 7.19 5.69 4.72 4.72 - 4.27 4.27 5.83 2014 7.93 7.30 5.79 4.81 4.81 - 4.36 4.36 5.93 2015 8.04 7.41 5.90 4.89 4.90 - 4.44 4.44 6.03 2016 8.09 7.47 5.98 4.97 4.97 - 4.52 4.52 6.10 2017 8.09 7.47 5.98 4.99 5.00 - 4.55 4.55 6.12 2018 8.28 7.66 6.17 5.14 5.14 - 4.69 4.69 6.29 2019 8.38 7.76 6.27 5.22 5.22 - 4.77 4.77 6.38 2020 8.43 7.82 6.35 5.30 5.30 - 4.83 4.83 6.44 2021 8.49 7.89 6.44 5.37 5.37 - 4.92 4.92 6.52 2022 8.55 7.96 6.52 5.45 5.45 - 5.00 5.00 6.60
CEC Energy Demand ForecastTable G-9
End Use Natural Gas Price ForecastSDG&E
Reference Case Price Forecast 02-21-032000 Dollars per MCF
DER Costs, Benefits, and Allocation Issues
2-54
Glossary
B/C Ratio Benefit/Cost Ratio
CALMAC California Measurement Advisory Committee
CEC California Energy Commission
CHP Combined Heat and Power
CPUC California Public Utilities Commission
DER Distributed Energy Resources
EIA Energy Information Administration
EUE Expected Unserved Energy
HVAC Heating Ventilation and Air Conditioning
IOU Investor Owned Utility
MDCC Marginal Distribution Capacity Cost
NP15 North of Path 15
PG&E Pacific Gas and Electric
PUC Public Utilities Commission
REC Renewable Energy Credits
RIM Rate-payer Impact Measure
SAIDI System Average Interruption Duration Index
SAIFI System Average Interruption Frequency Index
SCADA Supervisory Control and Data Acquisition
SDG&E San Diego Gas and Electric
SCE Southern California Edison
SGIP Self-Generation Incentive Program
SP15 South of Path 15
T&D Transmission and Distribution
TRC Total Resource Cost
UDC Utility Distribution Company
UPS Uninterruptible Power Supply
3-1
3 UTILITY COSTS, RATES, AND REGULATORY INCENTIVES
Introduction
For the regulator and policymaker, the principal intersection of DER with regulated utilities is ratemaking – both revenue setting and rate design. Together, the level and design of rates have been the regulator’s central concern, and she has been guided by sometimes competing objectives: equity, economic efficiency, stability, and simplicity, among others.46 The rates that end-users pay for grid-supplied electricity largely drive DER economics, and utility receptivity toward DER depends partly on how utilities are compensated for that electricity.
For utilities, the location of DER relative to the customer’s meter is critical. Located on the customer side of the meter, DER raises concerns about lost revenue, control, and consistency of load profile. On the utility side of the meter, it raises none of these concerns, motivating regulators, utilities and other stakeholders to consider what role the utility should play on its own side of the meter. However, most DER installations to date are on the customer side, so the following discussion of rate and regulatory structures focuses on that more problematic situation.
For customers locating DER on their side of the meter, a major benefit is often the prospect of reducing their bill from their utility. For the utility, however, customer bill reductions can directly reduce utility earnings, to the extent that lower revenues are not offset by equivalent cost savings. Economic theory counsels that a profit-maximizing firm in a perfectly competitive market should set prices equal to the marginal cost of production: in that case any change in demand, and thus revenues, would be perfectly matched by a change in costs. For example, if demand declined, the resulting revenue reduction would be offset by an equal cost reduction, there would be no net revenue loss, and neither customer nor utility would be financially harmed. However, applying this principle to the pricing of monopoly electric services can prove controversial and challenging, given the capital intensity and long-term nature of such investment.
The difficulty revolves around the question of cost causation. Economists would argue that in terms of economic efficiency objectives, the best rate designs present price signals to customers that mimic the costs that utilities actually incur. This means that designing efficient rates and appropriate utility pricing structures requires an understanding of utility costs. Table 3-1 in the next section identifies relevant categories of utility costs and their key drivers, and indicates which of these costs DER may be able to reduce, under what circumstances. The discussion
46 See Bonbright, James C., The Principles of Public Utility Rates, Columbia University Press (New York: 1961).
Utility Costs, Rates, And Regulatory Incentives
3-2
following the table then addresses rate design and complementary rate-setting policies that can be used to better align utility costs and customer bills – i.e., to help ensure that customer bills reasonably reflect changes in utility costs, so that utility and customer interests move in the same direction.
However, customer bills alone do not capture all of DER’s positive or negative impacts. There are also non-monetized benefits and costs, such as reduced central station or increased local air emissions; and impacts that extend beyond the individual customer, such as reduced spot market prices. The third section considers how these kinds of impacts can be recognized in evaluating and encouraging DER.
Finally, this chapter will touch on higher-level regulatory changes that could replace utility incentives to resist DER, with incentives to encourage it where it adds value. The discussion will suggest a pragmatic context in which to view DER’s potential impact on customers today, and will close with a brief look at alternative arrangements that can help correct for historical biases and oversights and help implement DER opportunities that benefit multiple stakeholders.
Utility Cost Drivers and Rate Design Approaches
In order to evaluate rate designs that would better align customer and utility costs, it is important to understand how utilities incur costs. The table below lists the major components of utility costs, and the conditions under which DER may be able to reduce those costs.
The preceding table illustrates that DER can reduce costs for a subset of the total costs that a utility must recover from its customers. Rates are designed to recover the total costs plus a reasonable return on utility investment, so customer bill reductions not tied to the subset of costs actually reduced can often exceed the true savings available to the utility. This is especially true for “wires-only” utilities that capture no savings from reduced generation capacity and energy. Because there is no necessary relation between bill reductions and cost savings, and mismatches can occur, many utilities have been averse or at least disinclined to promote DER. The rate structures below discuss alternatives to align utility costs and customer bill savings, and thus remove some disincentives for utility DER support.
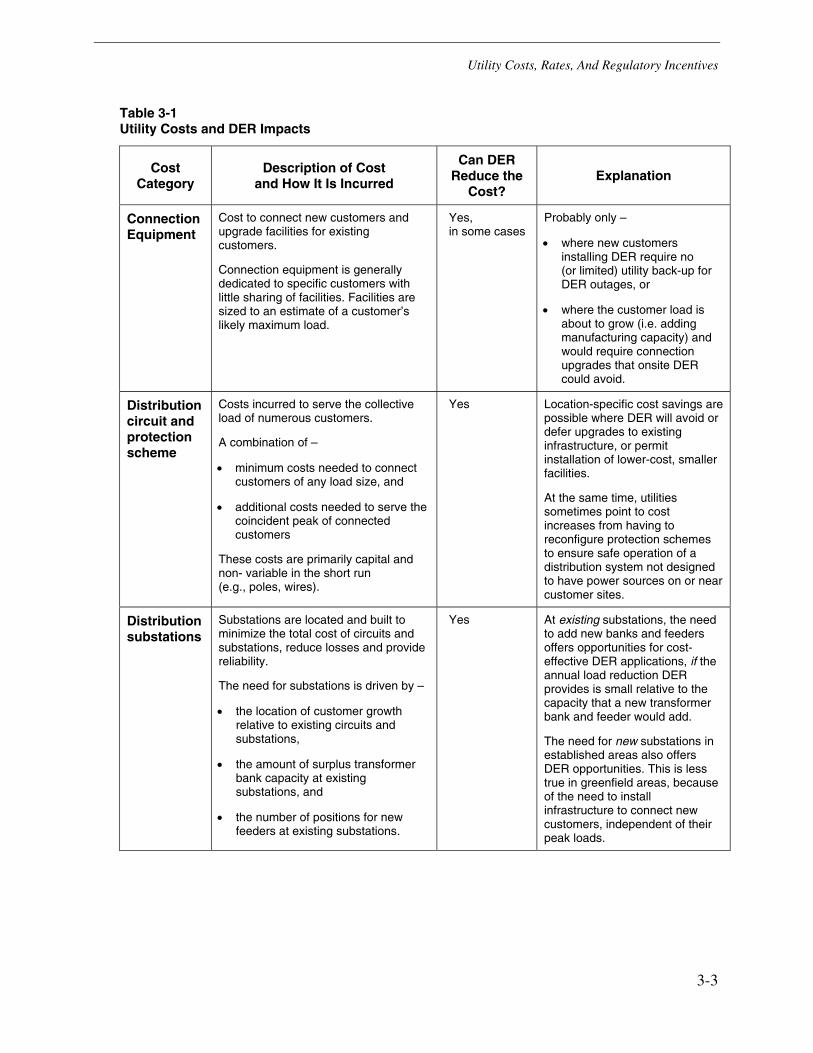
Utility Costs, Rates, And Regulatory Incentives
3-3
Table 3-1 Utility Costs and DER Impacts
Cost Category
Description of Cost and How It Is Incurred
Can DER Reduce the
Cost? Explanation
Connection Equipment
Cost to connect new customers and upgrade facilities for existing customers.
Connection equipment is generally dedicated to specific customers with little sharing of facilities. Facilities are sized to an estimate of a customer’s likely maximum load.
Yes, in some cases
Probably only –
• where new customers installing DER require no (or limited) utility back-up for DER outages, or
• where the customer load is about to grow (i.e. adding manufacturing capacity) and would require connection upgrades that onsite DER could avoid.
Distribution circuit and protection scheme
Costs incurred to serve the collective load of numerous customers.
A combination of –
• minimum costs needed to connect customers of any load size, and
• additional costs needed to serve the coincident peak of connected customers
These costs are primarily capital and non- variable in the short run (e.g., poles, wires).
Yes Location-specific cost savings are possible where DER will avoid or defer upgrades to existing infrastructure, or permit installation of lower-cost, smaller facilities.
At the same time, utilities sometimes point to cost increases from having to reconfigure protection schemes to ensure safe operation of a distribution system not designed to have power sources on or near customer sites.
Distribution substations
Substations are located and built to minimize the total cost of circuits and substations, reduce losses and provide reliability.
The need for substations is driven by –
• the location of customer growth relative to existing circuits and substations,
• the amount of surplus transformer bank capacity at existing substations, and
• the number of positions for new feeders at existing substations.
Yes At existing substations, the need to add new banks and feeders offers opportunities for cost-effective DER applications, if the annual load reduction DER provides is small relative to the capacity that a new transformer bank and feeder would add.
The need for new substations in established areas also offers DER opportunities. This is less true in greenfield areas, because of the need to install infrastructure to connect new customers, independent of their peak loads.
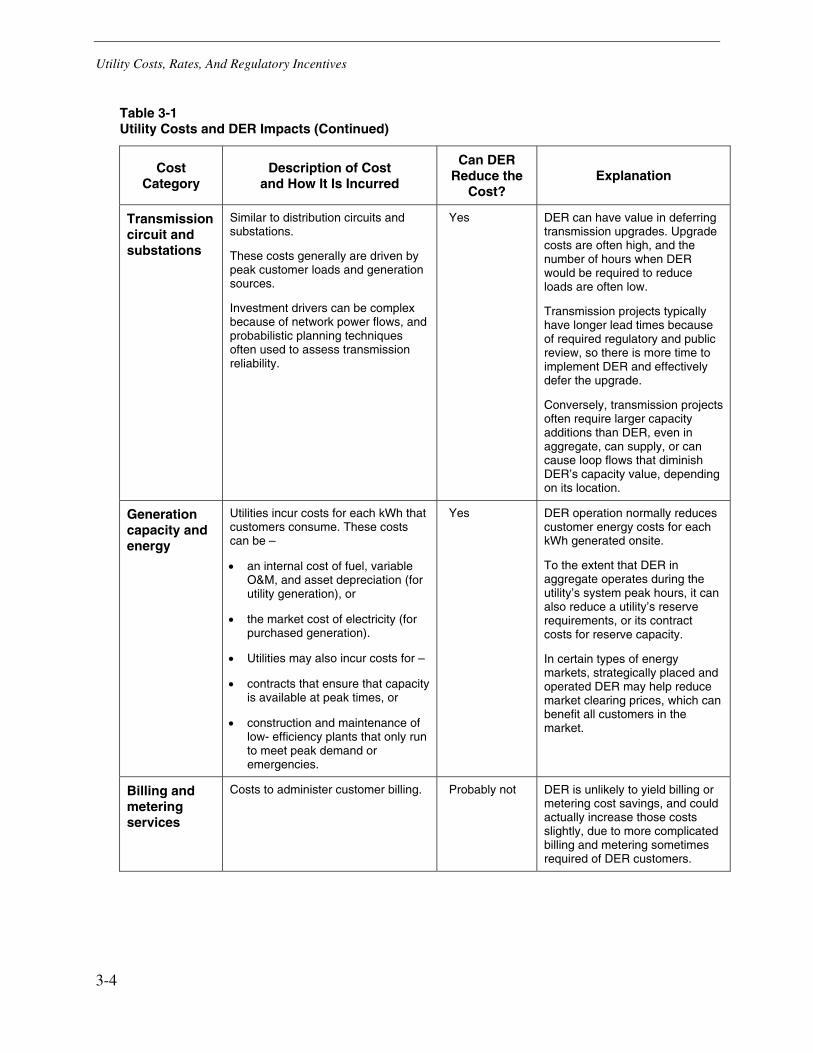
Utility Costs, Rates, And Regulatory Incentives
3-4
Table 3-1 Utility Costs and DER Impacts (Continued)
Cost Category
Description of Cost and How It Is Incurred
Can DER Reduce the
Cost? Explanation
Transmission circuit and substations
Similar to distribution circuits and substations.
These costs generally are driven by peak customer loads and generation sources.
Investment drivers can be complex because of network power flows, and probabilistic planning techniques often used to assess transmission reliability.
Yes DER can have value in deferring transmission upgrades. Upgrade costs are often high, and the number of hours when DER would be required to reduce loads are often low.
Transmission projects typically have longer lead times because of required regulatory and public review, so there is more time to implement DER and effectively defer the upgrade.
Conversely, transmission projects often require larger capacity additions than DER, even in aggregate, can supply, or can cause loop flows that diminish DER’s capacity value, depending on its location.
Generation capacity and energy
Utilities incur costs for each kWh that customers consume. These costs can be –
• an internal cost of fuel, variable O&M, and asset depreciation (for utility generation), or
• the market cost of electricity (for purchased generation).
• Utilities may also incur costs for –
• contracts that ensure that capacity is available at peak times, or
• construction and maintenance of low- efficiency plants that only run to meet peak demand or emergencies.
Yes DER operation normally reduces customer energy costs for each kWh generated onsite.
To the extent that DER in aggregate operates during the utility’s system peak hours, it can also reduce a utility’s reserve requirements, or its contract costs for reserve capacity.
In certain types of energy markets, strategically placed and operated DER may help reduce market clearing prices, which can benefit all customers in the market.
Billing and metering services
Costs to administer customer billing. Probably not DER is unlikely to yield billing or metering cost savings, and could actually increase those costs slightly, due to more complicated billing and metering sometimes required of DER customers.
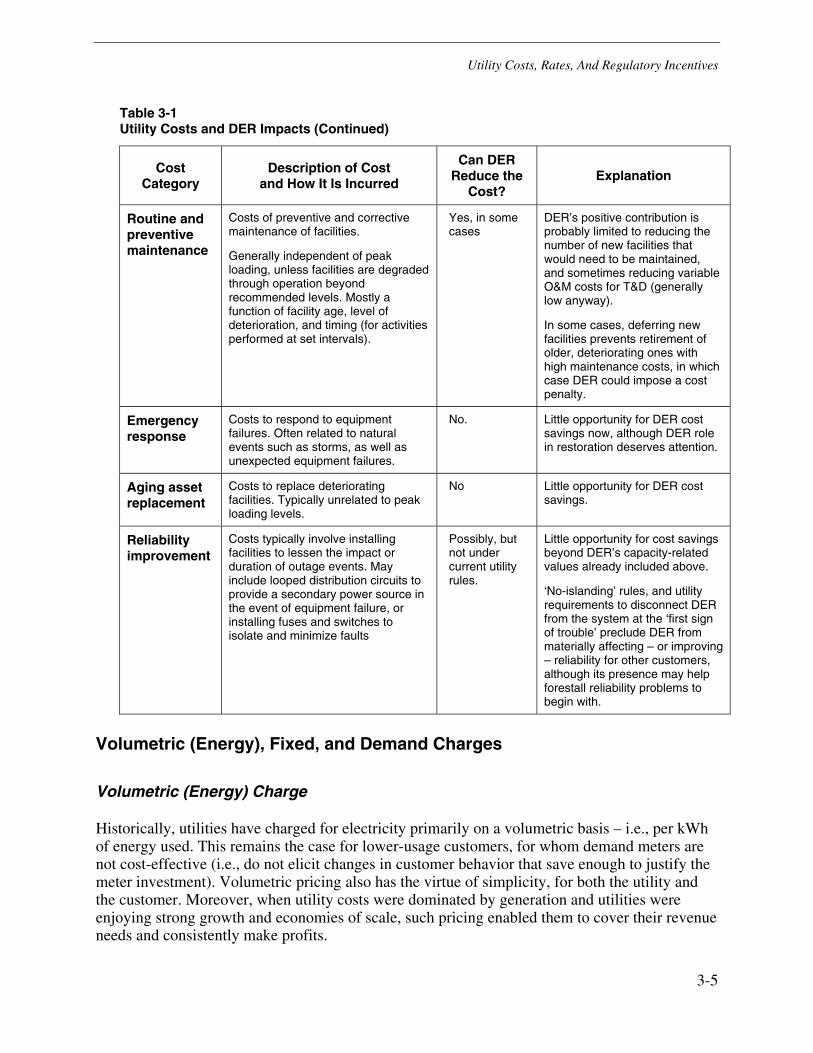
Utility Costs, Rates, And Regulatory Incentives
3-5
Table 3-1 Utility Costs and DER Impacts (Continued)
Cost Category
Description of Cost and How It Is Incurred
Can DER Reduce the
Cost? Explanation
Routine and preventive maintenance
Costs of preventive and corrective maintenance of facilities.
Generally independent of peak loading, unless facilities are degraded through operation beyond recommended levels. Mostly a function of facility age, level of deterioration, and timing (for activities performed at set intervals).
Yes, in some cases
DER’s positive contribution is probably limited to reducing the number of new facilities that would need to be maintained, and sometimes reducing variable O&M costs for T&D (generally low anyway).
In some cases, deferring new facilities prevents retirement of older, deteriorating ones with high maintenance costs, in which case DER could impose a cost penalty.
Emergency response
Costs to respond to equipment failures. Often related to natural events such as storms, as well as unexpected equipment failures.
No. Little opportunity for DER cost savings now, although DER role in restoration deserves attention.
Aging asset replacement
Costs to replace deteriorating facilities. Typically unrelated to peak loading levels.
No Little opportunity for DER cost savings.
Reliability improvement
Costs typically involve installing facilities to lessen the impact or duration of outage events. May include looped distribution circuits to provide a secondary power source in the event of equipment failure, or installing fuses and switches to isolate and minimize faults
Possibly, but not under current utility rules.
Little opportunity for cost savings beyond DER’s capacity-related values already included above.
‘No-islanding’ rules, and utility requirements to disconnect DER from the system at the ‘first sign of trouble’ preclude DER from materially affecting – or improving – reliability for other customers, although its presence may help forestall reliability problems to begin with.
Volumetric (Energy), Fixed, and Demand Charges
Volumetric (Energy) Charge
Historically, utilities have charged for electricity primarily on a volumetric basis – i.e., per kWh of energy used. This remains the case for lower-usage customers, for whom demand meters are not cost-effective (i.e., do not elicit changes in customer behavior that save enough to justify the meter investment). Volumetric pricing also has the virtue of simplicity, for both the utility and the customer. Moreover, when utility costs were dominated by generation and utilities were enjoying strong growth and economies of scale, such pricing enabled them to cover their revenue needs and consistently make profits.
Utility Costs, Rates, And Regulatory Incentives
3-6
Today, however, energy charges are losing their appeal to many utilities, as they distance themselves from generation development and become ‘wires only’ transmission and distribution companies. This is so because energy usage no longer accurately reflects the way that utilities (especially wires-only utilities) incur many of their costs, and because energy charges afford utilities the least revenue stability among common rate design alternatives.
Fixed Charges
In the short run, most costs incurred by wires companies are fixed – i.e., they do not vary with customer usage levels. For this reason, some utilities argue that their rates should be comprised predominantly of fixed charges. In the extreme, this would call for fixed recurring charges for delivery service, the same for everyone regardless of the amount of energy taken, differentiated only by customer class, voltage levels, and perhaps some measure of customer size such as annual peak usage.
Demand Charges
The third common rate form is a charge based on the customer’s peak demand. This ‘demand charge’ focuses on the customer’s maximum usage over some short period of time (e.g., 5, 15, 30, or 60 minutes) during the billing cycle. Thus a customer that uses 1 kW of electricity for one hour of the month, would have the same demand charge as a customer that uses 1kW for 720 hours of the month.
Utilities assert that for some parts of their T&D system, the cost to serve customers is driven solely by that peak kW of usage, so that these two very different customers should receive similar bills. Peak demand generally varies less than energy usage, so demand charges yield greater revenue stability for the utility than ‘per kWh’ charges. Unlike the fixed charge discussed above, the demand charge does not depend on costs being invariate, but rather on the premise that costs are driven by peak demand instead of total energy usage.
By ensuring utility cost recovery independent of customer energy usage, rate designs with high fixed and/or demand charges remove the financial incentive for some utilities to oppose DER. However, they undermine the customer’s ability to capture large economic benefits from DER, forcing DER to be “super” cost-effective in order to be deployed.
Short-Run Versus Long-Run Pricing
The argument for large fixed-cost rate components is predicated on the fact that many utility costs (especially for wires-only utilities) are invariant in the short run. In most instances and on average, the marginal costs of energy delivery are very low, almost zero, in the short run. Many of those same costs, however, can be variable in the long run, so high fixed-price signals can hamper efficient long-run resource decisions. This is the problem of reconciling short-term and long-term cost impacts, and many regulators have elected to base rates on long-run marginal costs.47
47 See Bonbright at 317-336 (Chapter XVII) and Kahn, Alfred, The Economics of Regulation: Principles and
Institutions, Vol. I, John Wiley and Sons (New York:1970), pp. 83-86.
Utility Costs, Rates, And Regulatory Incentives
3-7
In setting fixed charges, care should be taken to recognize that some costs that are fixed in the short run are variable in the long run. One option to address this is to base fixed charges on long-run costs, and to use alternative methods of setting revenues and allocating risks to address concerns about utility revenue collection and stability. These methods, described below, can give the utilities strong profit incentives to maximize both their own efficiency, and that of their customers.
Demand Subscription and Non-firm Standby
Both demand subscription and non-firm services offer alternatives to conventional standby charges that often discourage DER development. Standby charges are designed to protect utilities and non-participants from the negative financial impacts that self-generation customers can impose on them (through reduced payments not offset by other loads). The larger the generator, the more any outage will drive peak demand on utility facilities, and the more valid the standby charge. For small generators, however, the arguments for special standby charges lose force because the variations that small generators can cause for the T&D system may be well within normal operating variations that utilities plan for and have always accommodated.
Conventional standby rates typically assume that the utility retains its obligation to supply the customer’s load when the customer’s onsite generation is down for maintenance or unscheduled outages. Demand subscription and non-firm rates do not assume that – i.e., they do not assume that the utility must stand ready to provide back-up for all DER outages, but rather that customers can chose the level of standby they need for their operations.
For DER customers that do not require firm service, or that do not value it sufficiently to pay high standby charges needed to support utility facilities that would supply it, demand subscription offers a way to pay only for the capacity they need and value, accepting some level of risk in return for reduced costs.
For other DER customers small enough that their back-up requirements would not drive T&D peaks in any case, non-firm service offers the option to obtain back-up service for most times of the year, exposing them to curtailment risk only during utility peak demand periods.48
Both alternatives to conventional standby rates also expand the choices DER customers have to meet their individual reliability and security needs, without imposing the costs of these choices on utility shareholders or other ratepayers.
48 Alternatively, it may be worth exploring separate rate classes for DER customers, and for customers participating
in emergency demand response programs. These customers typically have distinctly different load profiles than other customers. Assigning them to distinct classes could smooth out any disturbances caused by individual onsite resource failures, and developing a standby rate based on the class contribution to utility costs would be consistent with conventional rate design approaches.
Utility Costs, Rates, And Regulatory Incentives
3-8
Two-Part Rates
As used here, the two-part rate does not refer to the traditional distinction between energy (kWh) and demand (kW) charges. It refers instead to an innovative structure that protects utility revenues while providing price signals to customers to help control utility costs. It does this through a ‘first part’ rate that collects the customer’s historical billing, coupled with a ‘second part’ rate that charges for increased usage, or credits reduced usage, at the utility’s marginal cost – i.e., the cost of expanded facilities avoided or deferred through customer DER initiatives. This type of rate levels the playing field for customers that increase or decrease loads (unlike standby rates, which some view as punishing reduced consumption).49
An issue for each of the rate options just outlined is that the very thing that makes them attractive to utilities – smaller bill reductions for consumption reductions – makes them less attractive to customers and conservation advocates, who typically favor the strongest possible price signals to enable and encourage reduced usage. If DER benefits are large enough, these types of rate innovations can help customer-side DER into the marketplace without prejudicing utility shareholders or non-participating customers. However, the modeling tool developed in the course of this work suggests that, at least using current California rate assumptions and today’s technology costs and benefits, most DER will require more leverage to significantly penetrate electricity markets. The following incentive methods can provide that leverage by explicitly recognizing additional DER value where it exists.
Recognizing Additional DER Benefits
Utility DER Planning and Area-Specific T&D Capacity Credits
One frequently cited source of additional DER benefits is the potential to defer or avoid costs the utility would otherwise incur to upgrade T&D capacity. Published papers 50 on this topic indicate that the economic value can be substantial in some cases but is highly area-specific, and that in many distribution planning areas DER offers little or no deferral value at a given moment in time. Moreover, typical utility planning processes rarely identify, publicize, or offer benefit-sharing mechanisms to induce customers or DER providers to locate projects in high-value areas.
In order to determine where DER can provide locational benefits, wires company and ISO planners must be looking for these benefits and considering DER as a potential solution. Utility
49 Georgia Power Company has had particular success with this rate design for more than 1,600 of its largest
customers under a real-time pricing tariff. See O’Sheasy, Michael T., “How to Buy Low and Sell High,” The Electricity Journal, January/February 1998, Vol. 11, No. 1. For additional analysis, see Woo, Chi-Keung, P. Chow, and I. Horowitz (1996) “Optional Real-Time Pricing of Electricity for Industrial Firms”, Pacific Economic Review 1:1 pp. 79-92.
50 Woo, C.K., R. Orans, B. Horii, R. Pupp and G. Heffner (1994) "Area- and Time-Specific Marginal Capacity Costs of Electricity Distribution," Energy - The International Journal, 19:12, 1213-1218. Swisher, J. and R. Orans (1996) “The Use of Area-Specific Utility Costs to Target Intensive DSM Campaigns,” Utility Policy 5:3/4, 185-197. Heffner, G., C.K. Woo, B. Horii and D. Lloyd-Zannetti (1998) “Variations in Area- and Time-Specific Marginal Capacity Costs of Electricity Distribution,” IEEE Transactions on Power Systems, PE-493-PWRS-012-1997, 13:2, 560-567.
Utility Costs, Rates, And Regulatory Incentives
3-9
planning efforts do focus on targeting system weaknesses, but do not typically consider DER as a potential solution to the problem. Rather, most planning processes identify conventional wires solutions and set out to implement them without identifying or evaluating DER alternatives. By altering the planning process to identify where DER can solve grid problems, utilities can identify investments that benefit the DER host, the utility and its customers.
Some jurisdictions have begun to address these shortcomings. As discussed in Chapter 1, California now requires utilities to consider DER as an alternative to distribution upgrades, and to take steps to procure it where it appears to offer a least-cost solution. New York requires its utilities to evaluate DER for T&D projects whose costs exceed certain benchmarks, and is engaged in a pilot program that requires utility RFPs to procure DER where it can defer or displace needed T&D capacity.
Costs that utilities incur for prudent DER procurement, including any incentives needed to ensure its development in high-value areas or within critical time frames, can be funded from utility transmission or distribution budgets, and can be capitalized to permit utilities to earn a return of and on such funds comparable to traditional plant investments, keeping utility shareholders whole.
Monetizing and Incorporating Externality Costs Into Charges or Credits
Some emissions costs are monetized through markets for tradable emissions rights, or by internalizing the costs of pollution control technology. However, the literature suggests that these often understate the total costs that emissions (including residual emissions) impose on society. If these costs were fully monetized, certain clean DER technologies could merit significant benefits. These benefits can be paid for out of a general ‘public goods’ or ‘system benefit’ surcharge levied on all utility sales.51 Under this approach, utility shareholders as such are not harmed because the funds are already earmarked for programs to enhance the public interest and funded through the dedicated rate component; utility earnings are unaffected by the amount of benefit payments.
Recognizing the ‘Generation Multiplier’ Effect
For utilities that participate in single-price markets, targeted demand reductions can lower market clearing prices. Lower clearing prices confer benefits far beyond the individual customer or provider that reduced its demand.
51 The California Energy Commission’s renewable energy rebate program described in Chapter 1 is one example of
such an approach.
Utility Costs, Rates, And Regulatory Incentives
3-10
A ‘generation multiplier’ recognizes this wider benefit, and can allocate some portion of it as an incentive to parties to relieve system demand through efficiency measures and/or DER. Research on this topic has led to the adoption of a factor of four multiplier for summer on-peak energy reductions in California.52 That means that each summer on-peak kWh reduction is credited with a cost reduction of four times the actual summer on-peak marker price. The additional three-fold value reflects lower generation prices passed along to all customers through the reduced market clearing price effected by that kWh reduction. Like the environmental externality funding described above, payments recognizing this generation multiplier effect can reasonably be funded through a public goods surcharge.
Realizing Societal Values of DER through Efficient Market Rules
Regional energy, capacity and ancillary service market rules are being upgraded throughout the U.S. to make trading of these commodities more efficient. These rules can be designed to account for the valuable attributes that DER can offer under specifiable conditions. Assuring that a day-ahead bidding system can accommodate customer resources is one way to move toward this objective. Assuring that DER attributes that yield these values can actually receive credit for them is another way. A transparent market, where customers can readily be compensated for the value their DER resources provide to the system or society, would help customers make decisions to invest in those resources.
Higher-Level Regulatory Changes
In the New York proceedings and elsewhere (as in earlier efforts to increase demand-side efficiency), parties have suggested decoupling utility margin from kWh sales to help remove the perceived disincentive for utilities to encourage, or at least accommodate DER. Decoupling can occur in two primary ways. The first is to make the revenues that the utility receives from its customers more fixed, and less variable with changes in customer usage.53 The second approach is to adopt a revenue-based performance ratemaking (PBR) mechanism. Revenue-based PBR would substitute for traditional cost-of- service ratemaking an approach that sets utility rates to recover a predetermined level of revenues (usually with some allowance for customer growth). This form of PBR removes the utility incentive to promote sales, and rewards utility shareholders if the utility reduces its costs – even if that means reduced sales.
52 Woo. C.K. and D. Lloyd (2001) Assessment of the Peak Benefit Multiplier Effect: (a) Economic Theory and
Statistical Specification; and (b) Theory, Estimation and Results, report submitted to Pacific Gas and Electric Company. CALMAC (2000) Avoided Cost, Report on Public Workshops on PY 2001 Energy Efficiency Programs, 09/12/00 – 09/21/00 and 09/26/00, California Measurement Advisory Committee (CA Avoided Costs and Externality Adders, January 8, 2004. California Public U: San Diego). A Forecast of Cost Effectiveness Avoided Costs and Externality Adders, January 8, 2004. California Public Utilities Commission, Energy Efficiency Rulemaking Proceeding (R.01-08-028).
53 See e.g., rate designs proposed by Southern California Edison in Application No. 00-01-009, Ex. SCE-5, January 2000.
Utility Costs, Rates, And Regulatory Incentives
3-11
While some favor the first approach, for reasons discussed earlier it is not likely to facilitate DER implementation. Moreover, the impact of high fixed charges on low-use and low-income customers limits regulatory acceptance of such a rate form. DER proponents, as well as conservation and efficiency advocates and customers, more often favor the second approach because of its strong incentives for efficiency. It represents a significant change from traditional ratemaking, with implications for many aspects of utility operations beyond those related specifically to DER. Although well-designed PBR mechanisms could help level the playing field, many observers would acknowledge that a wholesale shift to PBR to encourage DER at this stage of its development could be the tail wagging the dog.
As indicated by Table 3-1, and in Chapter 2 and the cost-benefit spreadsheet model developed for this program, DER today appears to offer significant win-win opportunities in specific but fairly limited situations. For this reason, even if promoting DER were to shift some costs to non-participants or shareholders, any near-term impact is likely to be small, and certainly manageable by regulators.
On the other hand, many argue that the potential value from near-term incentives could be large. They observe that DER is comparable in many ways to energy efficiency measures 20 years ago. At early stages of their development, programs that make sense for society as a whole may fail the utility cost test. Just as some efficiency measures that are commonplace today that might not have achieved the critical mass they needed to succeed without the early incentive programs, some DER technologies have the potential to support viable, cost-effective industries and to add real value to the electricity enterprise over time. In that sense, the cost to promote DER now can be considered the cost of an option for the future.
One market adjustment regulators can make is to dedicate a small percentage of utility revenues to address market barriers to DER, and promote their deployment where they add demonstrable value for multiple stakeholders or society at large. This can be done through utility-run efforts that resemble energy efficiency programs, state-run initiatives that have the advantage of consistency across multiple utility service areas, or statewide efforts out-sourced to a dedicated program manager.
As described in Chapter 1 another device is a portfolio standard, already made available through legislation in more than a dozen states. Such standards typically require utilities and other load-serving entities to include a defined percentage of qualifying energy in their offerings, assuring some minimum level of diversification into qualifying energy sources. Such sources usually include specified renewables, but can also include ultra-clean and/or highly efficient DER (as part of an existing portfolio category or as a separate category).
Utility Costs, Rates, And Regulatory Incentives
3-12
To the extent that DER offer societal values beyond the benefits that accrue directly to their owner/operators, allocating some of these societal values as monetary benefits to resource providers requires a connection to the electricity market. DER should be able to participate in these markets, even if that means overcoming existing technical and administrative barriers. Whether capturing fair value for occasional excess customer generation, or for planned and bid responses to curtail load, mechanisms to engage with the market are essential for DER providers to share in any benefits they contribute to the system.
DER offers both existing and potential future benefits. Those benefits can be fully realized only if regulators and policymakers take an affirmative interest in making the changes needed to capture and allocate values not recognized by today’s electricity market structures. Some of those changes could have impacts considerably beyond DER, so policymakers clearly need to weigh the potential benefits of wider DER deployment against the potential unintended consequences as well as implementation costs those changes would entail. At a minimum, however, they should consider adopting DER incentives that compensate for DER benefits that cannot be realized because of unintended regulatory barriers or market imperfections. The final chapter suggests a framework for developing collaborative approaches to these tasks.

4-1
4 A FRAMEWORK FOR COLLABORATIVE DER PROGRAMS
Introduction
This chapter builds on the catalog of approaches, the DER cost/benefit descriptions and modeling tool, and the discussion of utility costs and rate designs. It presents a framework that willing groups of stakeholders can use to design collaborative programs that build on earlier approaches to DER market integration, and that pioneer new ones.
This chapter focuses on pilot programs, not as an end in themselves, but as a means to advance toward the overall goal of integrating DER seamlessly into the larger electricity enterprise. The premise is that well-designed pilots, using the information and tools presented here, and implemented in different utility service areas under different regulatory regimes, will yield better than general information on actual in-service DER costs and benefits for regulators, utilities, and customers. Pilots can be structured to encourage innovation and experimentation, and to deliver valuable feedback on the efficacy of alternative incentive approaches. They will result in the deployment and integration of DER that adds value for multiple stakeholders during the pilot period, and in some cases well beyond it. And they will systematically demonstrate cooperative rather than adversarial approaches to advance stakeholder interests, including the public interest in more flexible, more robust options for affordable, reliable, and secure energy.
Although the approach described here builds on approaches described in the catalog, it can take advantage of the DER cost/benefit and allocation methodology developed here to refine them and to develop new, more precisely targeted DER programs. The framework approach also differs from many previous efforts because it focuses on collaborative stakeholder actions to ensure legitimacy, acceptance and mutual benefit; it is explicitly designed to yield win-win outcomes that more traditional regulatory approaches often neglect.
‘Collaborative’ programs here means programs whose objectives, scope, incentive mechanisms, and other characteristics are developed through the voluntary, cooperative efforts of committed participants, working together toward mutually beneficial outcomes.54 Key participants include regulators, utilities, customers, ratepayer and environmental representatives, DER providers and others. These programs offer opportunities to try innovative incentive forms designed to better align stakeholder interests, and to provide comfort to regulators that a ‘win’ for some need not be a loss for others whose interests they safeguard. 54 Once a program is designed through this kind of process, a state public utility commission or other regulatory
agency may need to authorize jurisdictional utilities to implement it in order to achieve the energy, environmental, economic or other goals agreed to by stakeholders (as in Green Mountain Power’s arrangement with Sugarbush Ski Resort, described in the catalog). This discussion focuses on the collaborative process and potential program elements, rather than on any formal approval process that may be required once stakeholders agree on a program.
A Framework for Collaborative DER Programs
4-2
DER stakeholders’ underlying interests are often more compatible than the positions they advocate in formal regulatory proceedings – positions that often proceed from incomplete understanding of other parties’ needs, desires and business constraints. Regulatory litigation typically is not designed to produce consensus or compromise, but to yield a decision that parties can act on (or challenge, as the case may be). This framework, on the other hand, is intended to help structure non-adversarial exchange of ideas and constructive cooperation among stakeholders to find solutions that benefit as many as possible, as much as possible, with as little prejudice to others as possible.
Programs designed through this process will be ‘pilots’ in the sense that they pioneer innovative strategies to integrate DER into existing electricity markets, and test new approaches to help stakeholders learn what works best. Pilots may be limited in time and scope to encourage participation, and to allay stakeholder concerns about previously untested approaches. But stakeholders may also choose to pursue longer-term programs that yield significant, measurable results for a utility system or planning area, and/or for participating customers or customer classes.
Depending on the utility system and its customers, this could mean programs providing anywhere from a few megawatts to a few thousand, or involving some minimum number of customers, or some threshold level of demand reduction or curtailment. Pilot programs can include multiple individual DER installations employing diverse technologies. Installations may remain in place and continue to provide benefits long after the formal pilot program ends. By developing solid experience with various forms of DER incentive approaches under real-world conditions, these programs should also serve as thoughtful models that other jurisdictions can cost-effectively replicate, adapt to local conditions, and improve over time. In other words: the approach described here can not only facilitate collaboration on limited pilot programs, but can provide a solid foundation for more wide-ranging DER market integration efforts.
Each pilot program is expected to develop its own specific objectives through the stakeholder collaboration process. In general, however, these programs can be much more than DER technology demonstrations. They can also demonstrate:
• more constructive ways for DER participants to communicate and cooperate
• new ways to optimize benefits for multiple stakeholders
• creative rate design and other regulatory incentives targeted specifically to encourage DER that adds value beyond conventional electricity supply
• innovative departures from ‘business as usual’ in the DER marketplace
The framework described below is organized in four parts. The first part deals briefly with structuring the collaborative process and defining the program’s scope and objectives. The second part introduces three basic strategies that participants may want to consider in their programs, and presents tables suggesting the kinds of stakeholder needs that each strategy can address. The third part outlines some options available to tailor each of the basic strategies to local needs. Finally, the fourth part presents a detailed example showing how the process outlined here, the catalog and rate discussion presented earlier, and the cost/benefit modeling tool can be combined to evaluate a potential CHP pilot project or program.
A Framework for Collaborative DER Programs
4-3
Structuring the Collaborative Process
How does a group of interested stakeholders collaborate to create real-world DER pilot programs that benefit multiple stakeholders? The following outlines important questions to address and steps that can be taken toward this end.
A. Which stakeholders should participate?
The E2I team can work with state, regional and local interests to identify an initial group of DER stakeholders open to pursuing a collaborative pilot program (CPP). Unlike formal regulatory proceedings involving tens or scores of parties who interact through formal adversarial hearings and written filings by counsel, collaborative efforts will be more productive with a small and manageable core group of entities and individuals, supported as needed by topical experts in their organizations. Participants will need to coordinate busy schedules for regular meetings; engage in in-depth discussions of complex issues; and maintain continuity over a period of weeks or months. Experience suggests that coordination, communication and continuity are difficult to maintain with a large core group (e.g., more than ten or twelve regular participants), although others certainly can offer specialized support as needed.
The initiating members will need to decide on the minimum set of stakeholders needed to move the CPP process forward. These will almost certainly include a local utility with something to gain from encouraging DER in the region covered by the CPP. They will likely include a state utility commission and/or other state energy agency, since many of the initiatives discussed here will ultimately benefit from (if not require) regulatory support. And they will need the perspectives of DER providers (e.g., equipment vendors or project developers), and of prospective DER customers (including individual customers and/or interested trade associations). Depending on how these key interest groups view the objectives of the CPP, they may identify other stakeholders whose input will be essential to move the program forward.
Once there is agreement on the list of essential participants, each entity will need to designate one or more individuals as its principal representative(s) in the collaboration. The key to success will be the commitment and ability of each participating entity – and of each individual representative – to work collaboratively and flexibly with other stakeholders to develop mutually beneficial approaches, and to put aside the adversarial relationships that typically characterize formal regulatory proceedings. Old habits die hard, so an organization’s most forceful regulatory advocates may not be its most constructive collaborators.
B. What are the collaborative’s structure and ground rules?
The first order of business for this core group will be to decide how the collaborative will function – how it will govern itself, and how it will make decisions. Will it elect a ‘neutral’ leader or coordinator, or will a stakeholder representative serve that function? Will it need to establish working groups? Will decisions be made by consensus, majority vote, or something else? Answers to some of these questions may emerge as the group sorts out its objectives and priorities, discussed below.
A Framework for Collaborative DER Programs
4-4
A critical early step is to create a safe environment for exchanging ideas and discussing what may be sensitive business information to some participants. For example, it may be important to agree that what is said during collaborative discussions will not be introduced as evidence in any commission proceeding or other formal venue. Participants may also want to agree to treat collaborative discussions as confidential within the group and by the principals represented, and not to disclose them to the public or the press without the group’s consent. Or they may want to acknowledge explicitly that proposals or agreements reached within the group will be subject to good faith approval by their principals. In some cases, participants may want to look to formal settlement rules adopted by the utility commission or other state agencies for guidance, whether or not they would technically apply to the collaborative’s activities.
C. What are the collaborative’s objectives and priorities?
Participants will need to clearly identify the needs that their effort can serve – i.e., what can a collaborative approach accomplish that the state’s ongoing DER activities cannot, or have not?
Each stakeholder group will have its own interests in participating in the CPP. For example, a utility’s overriding interest may be to address system constraints, retain customers, take advantage of regulatory incentives, evaluate new business opportunities, preserve existing ones, or something else. Customers’ interests may be to control and stabilize energy costs, hedge risks, ensure supply, reliability and power quality, take advantage of regulatory and financial incentives, etc. Regulators may be especially interested in costs, resource adequacy, ratepayer protection, utility financial health, equitable allocation of costs and benefits, environmental issues, etc. Whatever motivates an entity’s participation, its interests should be explicitly identified and brought forward to the group, since the overall objective will be to advance as many of them as possible, and to reconcile any that seem to be in opposition.
In identifying and prioritizing possible program goals and objectives, collaborative participants should try to understand how achieving their own priorities will impact other stakeholders, and how different stakeholder priorities will be reconciled to agree on a direction. Each jurisdiction’s pilot design will depend on how collaborators answer the following kinds of questions:
• Will projects be designed primarily to benefit the grid? Will benefits to individual customers be incidental to the ultimate success of the collaborative?
• Conversely, should projects primarily benefit individual customers, with grid benefits incidental?
• Will the collaborative focus on projects that add specific value to the grid, or to DER customers, or will it require both?
• Is it enough to facilitate customer installations that benefit the DER customer and generally keep non-participants neutral or better, whether or not the project yields immediate and specific grid benefits?
Other goals for collaborative members to prioritize might include the following:
• eliminating specific, identified barrier(s) to DER penetration.
• installing some minimum number of MW, or reducing demand by some minimum amount.
A Framework for Collaborative DER Programs
4-5
• testing the impacts of innovative incentive mechanisms or rate designs on DER customers and non-participating ratepayers.
• developing DER planning, procurement and contracting templates for use by others.
• demonstrating the impact or usefulness of specific attributes claimed for DER – e.g., local capacity cost deferral, congestion relief, cost and pricing impacts, specific grid support functions (reactive power, etc.).
• demonstrating DER/grid interfaces, protocols, etc., or streamlining procedures to integrate DER with grid operations.
• advancing and testing mutually agreeable tools to compare DER to grid solutions.
• demonstrating DER environmental effects.
• demonstrating cost-effectiveness of various DER approaches, technologies, etc.
• creating models for effective collaboration among DER stakeholders, and developing institutional mechanisms for sustainable relationships linking utilities, customers, regulators, DER providers and other stakeholders.
• producing results with widespread application, replicable by others.
D. How will the collaborative measure results and evaluate success?
Based on the goals and objectives it chooses to pursue, the collaborative should decide upfront how it will measure results and evaluate program success. Will it measure success in terms of capital investment deferred, megawatts of DER installed, megawatt-hours of usage reduced, tons of NOX or CO2 emissions avoided, lack of prejudice to non-participating utility customers, replicability of results, or other criteria?
Once they decide on measurement and evaluation criteria, program participants should develop a program evaluation process. Such a process would periodically track the advancement of pilot projects, the usefulness of any incentives, progress in removing barriers, etc., to learn what works well and what doesn’t under various circumstances, and to help refine future approaches.
E. How can the collaborative foster innovation and experimentation?
Since the intent of the CPP is to test new and untried concepts for market integration, participants might expect that some innovations will work well, and some may not. In order to provide freedom to experiment and yet protect stakeholders from unforeseen consequences, participants may want to restrict the size and/or duration of the pilots; constrain their application to certain customer classes; limit their precedential effect for future activities; or establish other boundaries that encourage flexibility but confine the risks of failure.
Once these considerations have been addressed, participating stakeholders can use the remaining sections of this framework to outline possible projects that will meet their defined objectives and advance their priorities, and project teams can begin to develop actual projects.
A Framework for Collaborative DER Programs
4-6
Basic Program Strategies
This section outlines three basic strategies that may offer a useful starting point for collaborative efforts by DER stakeholders to build on the best features of recent DER initiatives, and to shape new ones that better integrate DER into larger electricity markets. These strategies can help stakeholders structure programs that encourage and facilitate DER where it offers real, identifiable benefits, and that remove unnecessary barriers to deployment in those situations. The strategies can be viewed as generic categories around which to structure DER pilot programs. The next section will offer examples of more specific options available to tailor these strategies to local needs.
Program participants’ interests vary widely, as do regional, state, and local markets, so individual programs may look quite different in California, for example, than they do in New York. State-specific pilots will recognize these differences, as well as differences in state law and regulation and in the kinds of economic, environmental or system problems that demand attention locally or regionally. Thus the generic strategies can help address identified stakeholder needs, and the options can suggest ways to implement these strategies that may be more or less appropriate under differing program conditions.
The programs that E2I envisions would not promote DER for its own sake, or subsidize DER projects into markets where they do not contribute to broader energy and environmental policy goals. Rather, these programs would aim to meet stakeholder needs for new arrangements that –
1. Leverage DER value by recognizing multiple value streams that today’s markets may not;
2. Introduce efficient incentives to facilitate and deploy DER in those situations; and
3. Eliminate barriers to DER that inhibit innovation, but on balance serve little public purpose.
Leveraging DER value refers to approaches that capture and allocate among stakeholders multiple value streams that can flow from DER selected, sited, sized, and operated to create value for more than one group of stakeholders. These approaches might, for example, take the form of tariff terms applicable to broad customer classes, model provisions for use in bilateral or multi-party contracts, reallocation of interconnection charges depending on the project’s value to the grid, etc.
Collaborative efforts to capture and allocate DER value streams will require some common understanding of what those value streams are, what they are worth, and what it means to allocate them among stakeholders in different ways. The cost/benefit and allocation modeling tool is intended to help collaborative participants see where and to what extent DER adds value or imposes costs beyond traditional approaches; to objectively assess impacts on different stakeholders; and to identify possible re-allocations or project configurations that could create benefits or reduce costs for other stakeholders. This analytical tool enables participants to tailor their assumptions and analysis until they are comfortable with its objectivity and accuracy, and to assess a variety of impacts easily and with some confidence in the results.
A Framework for Collaborative DER Programs
4-7
Introducing efficient incentives refers to initiatives that send price signals to utilities, end-users, and DER providers that better reflect the true costs and benefits of DER solutions in specific situations. Examples include area- and time-specific credits or other customer incentives, rebates and equipment buy-downs for preferred technologies, utility rate designs, etc..
Eliminating barriers here refers to eliminating or reducing obstacles to DER siting, installation, operation, and value recognition in the market. It includes minimizing transactions costs for all participants, from project inception to completion.
These three strategies overlap at times, and are not mutually exclusive. Collaborative programs that incorporate some or all of them should make it easier for utilities to signal where DER adds value to their systems. They should also help end-users adopt DER solutions that supplement and reinforce utility service, while serving their own interests and benefiting other stakeholders. Much of the thinking around DER issues regards end-users as passive recipients of energy and services. Utility service is overwhelmingly the default, and usually only large customers and projects can absorb the transactions costs of onsite energy projects. A more active approach to market integration (at least for customer-side DER) views end-users not just as utility customers, but as potential system contributors and problem-solvers when empowered to act in their own interests. This collaborative framework approach supports that view.
Pilot programs structured using this framework can be flexible and limited in scope and time, without necessarily committing to long-term, system-wide changes until experience demonstrates their soundness. This should facilitate negotiated solutions that streamline the process, for at least long enough to see which solutions offer real promise.
Tables 4-1 through 4-4 below illustrate how the three basic strategies relate to the needs of each key stakeholder group: utilities, DER providers, DER customers, and regulators representing societal interests. The tables show how each strategy might be used to shape collaborative programs to meet those needs. The first column in each table focuses on the needs of a key stakeholder group that DER may be able to help meet. For each need identified, columns 2-4 describe barriers to its fulfillment; current approaches to overcoming those barriers; and new DER approaches that might be more successful. The last column in each table suggests one or more framework strategies that can address the particular need, lower the barriers to meeting it, and support new approaches that stakeholders can pursue cooperatively.
Since these strategies are general in nature, the text following the tables presents more specific options to tailor each of them to local needs – i.e., ways to leverage DER value, to efficiently incentivize action, and/or to eliminate remaining barriers. By systematically considering which strategies are relevant to meeting particular stakeholder needs and what specific options might be employed toward that end, the hope is that collaborative participants can devise initiatives that address not only the interests of individual stakeholder groups, but more importantly, the common or complementary interests of all groups. The intent is to help structure the collaborative process, and to guide it toward solutions that benefit multiple stakeholders without prejudicing others.
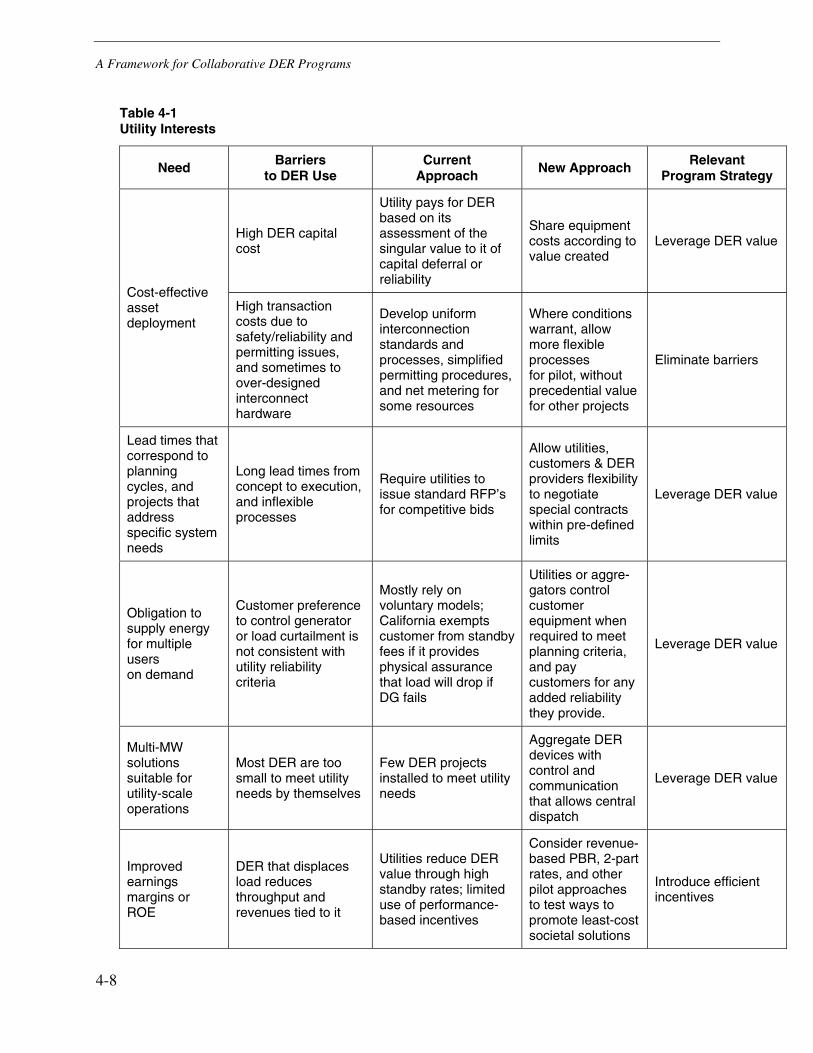
A Framework for Collaborative DER Programs
4-8
Table 4-1 Utility Interests
Need Barriers to DER Use
Current Approach
New Approach Relevant Program Strategy
High DER capital cost
Utility pays for DER based on its assessment of the singular value to it of capital deferral or reliability
Share equipment costs according to value created
Leverage DER value
Cost-effective asset deployment
High transaction costs due to safety/reliability and permitting issues, and sometimes to over-designed interconnect hardware
Develop uniform interconnection standards and processes, simplified permitting procedures, and net metering for some resources
Where conditions warrant, allow more flexible processes for pilot, without precedential value for other projects
Eliminate barriers
Lead times that correspond to planning cycles, and projects that address specific system needs
Long lead times from concept to execution, and inflexible processes
Require utilities to issue standard RFP’s for competitive bids
Allow utilities, customers & DER providers flexibility to negotiate special contracts within pre-defined limits
Leverage DER value
Obligation to supply energy for multiple users on demand
Customer preference to control generator or load curtailment is not consistent with utility reliability criteria
Mostly rely on voluntary models; California exempts customer from standby fees if it provides physical assurance that load will drop if DG fails
Utilities or aggre-gators control customer equipment when required to meet planning criteria, and pay customers for any added reliability they provide.
Leverage DER value
Multi-MW solutions suitable for utility-scale operations
Most DER are too small to meet utility needs by themselves
Few DER projects installed to meet utility needs
Aggregate DER devices with control and communication that allows central dispatch
Leverage DER value
Improved earnings margins or ROE
DER that displaces load reduces throughput and revenues tied to it
Utilities reduce DER value through high standby rates; limited use of performance-based incentives
Consider revenue-based PBR, 2-part rates, and other pilot approaches to test ways to promote least-cost societal solutions
Introduce efficient incentives
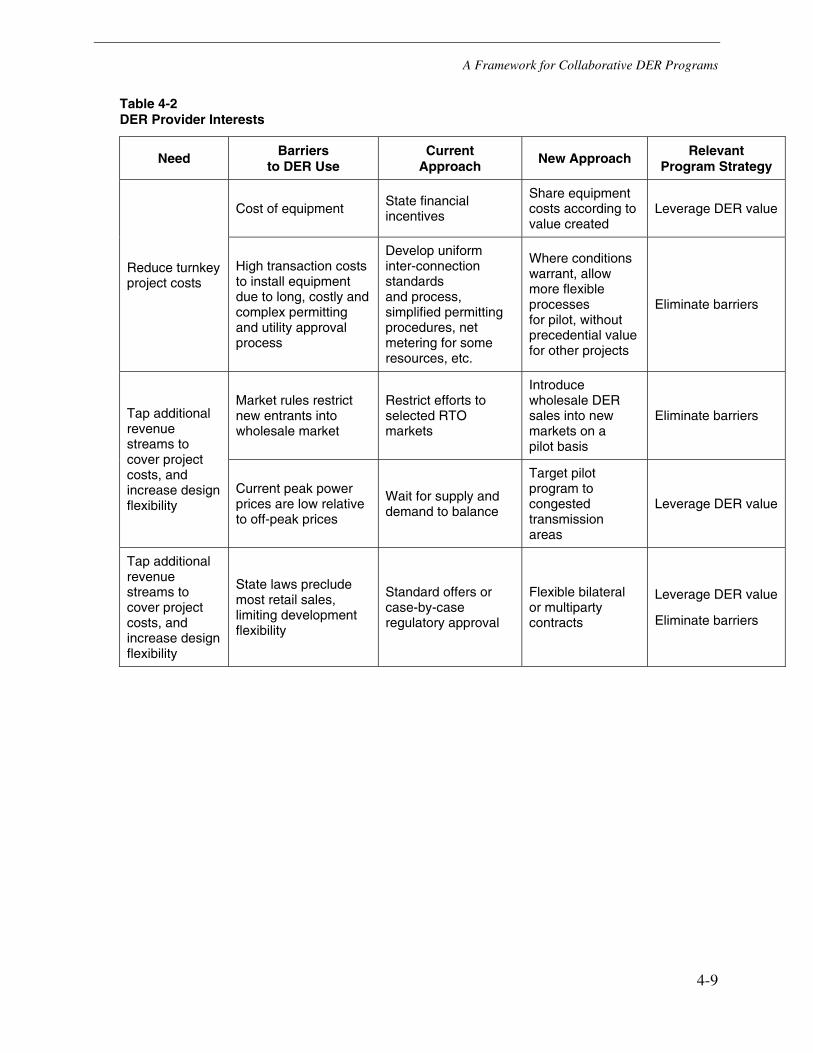
A Framework for Collaborative DER Programs
4-9
Table 4-2 DER Provider Interests
Need Barriers to DER Use
Current Approach
New Approach Relevant Program Strategy
Cost of equipment State financial incentives
Share equipment costs according to value created
Leverage DER value
Reduce turnkey project costs
High transaction costs to install equipment due to long, costly and complex permitting and utility approval process
Develop uniform inter-connection standards and process, simplified permitting procedures, net metering for some resources, etc.
Where conditions warrant, allow more flexible processes for pilot, without precedential value for other projects
Eliminate barriers
Market rules restrict new entrants into wholesale market
Restrict efforts to selected RTO markets
Introduce wholesale DER sales into new markets on a pilot basis
Eliminate barriers Tap additional revenue streams to cover project costs, and increase design flexibility
Current peak power prices are low relative to off-peak prices
Wait for supply and demand to balance
Target pilot program to congested transmission areas
Leverage DER value
Tap additional revenue streams to cover project costs, and increase design flexibility
State laws preclude most retail sales, limiting development flexibility
Standard offers or case-by-case regulatory approval
Flexible bilateral or multiparty contracts
Leverage DER value
Eliminate barriers
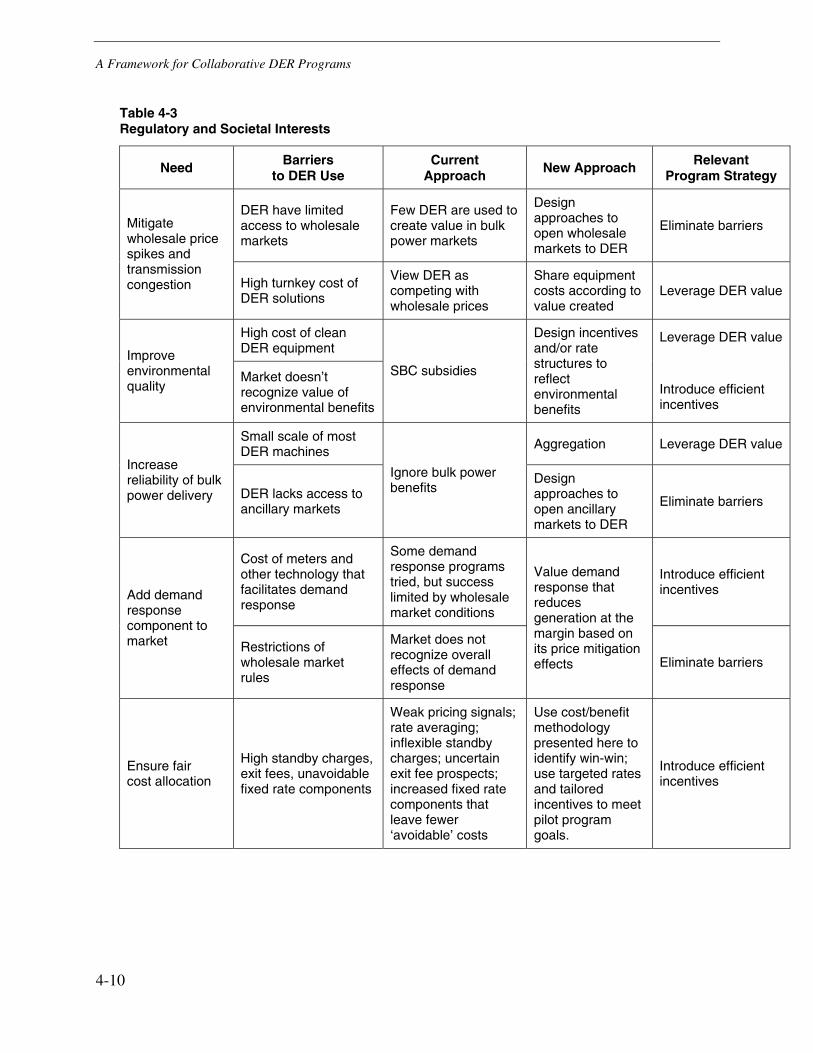
A Framework for Collaborative DER Programs
4-10
Table 4-3 Regulatory and Societal Interests
Need Barriers to DER Use
Current Approach
New Approach Relevant Program Strategy
DER have limited access to wholesale markets
Few DER are used to create value in bulk power markets
Design approaches to open wholesale markets to DER
Eliminate barriers Mitigate wholesale price spikes and transmission congestion High turnkey cost of
DER solutions
View DER as competing with wholesale prices
Share equipment costs according to value created
Leverage DER value
High cost of clean DER equipment Improve
environmental quality
Market doesn’t recognize value of environmental benefits
SBC subsidies
Design incentives and/or rate structures to reflect environmental benefits
Leverage DER value
Introduce efficient incentives
Small scale of most DER machines Aggregation Leverage DER value
Increase reliability of bulk power delivery DER lacks access to
ancillary markets
Ignore bulk power benefits
Design approaches to open ancillary markets to DER
Eliminate barriers
Cost of meters and other technology that facilitates demand response
Some demand response programs tried, but success limited by wholesale market conditions
Introduce efficient incentives Add demand
response component to market Restrictions of
wholesale market rules
Market does not recognize overall effects of demand response
Value demand response that reduces generation at the margin based on its price mitigation effects Eliminate barriers
Ensure fair cost allocation
High standby charges, exit fees, unavoidable fixed rate components
Weak pricing signals; rate averaging; inflexible standby charges; uncertain exit fee prospects; increased fixed rate components that leave fewer ‘avoidable’ costs
Use cost/benefit methodology presented here to identify win-win; use targeted rates and tailored incentives to meet pilot program goals.
Introduce efficient incentives
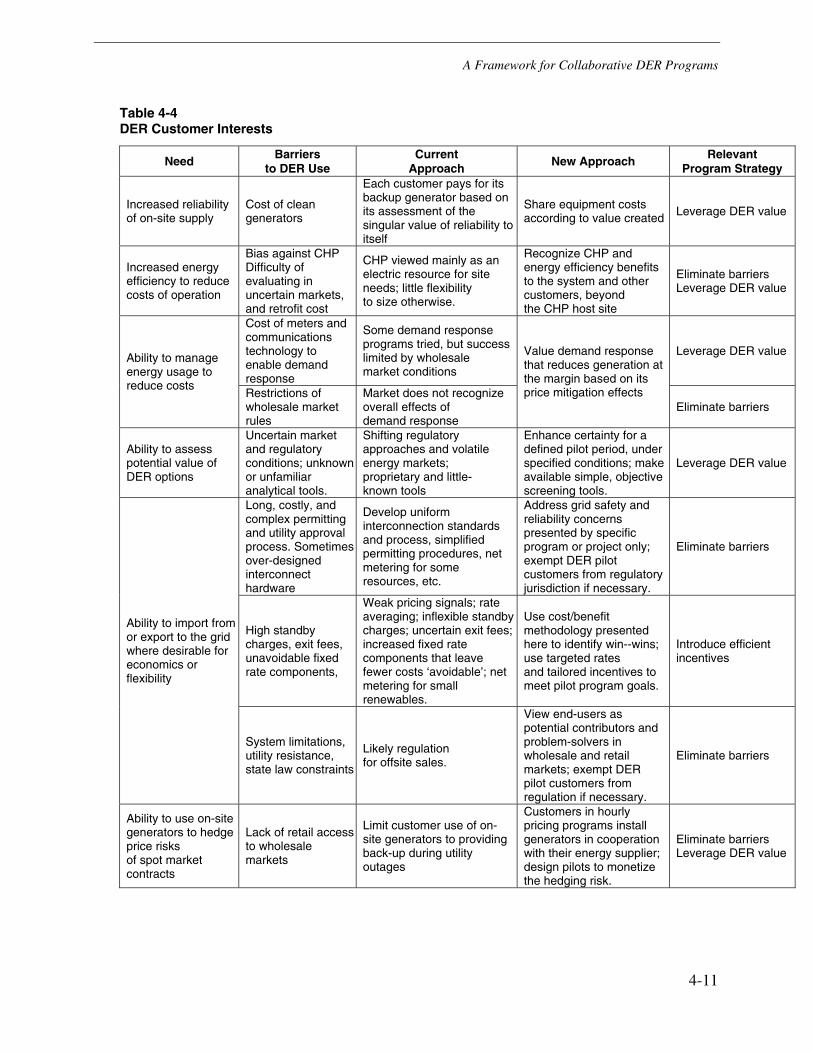
A Framework for Collaborative DER Programs
4-11
Table 4-4 DER Customer Interests
Need Barriers to DER Use
Current Approach
New Approach Relevant Program Strategy
Increased reliability of on-site supply
Cost of clean generators
Each customer pays for its backup generator based on its assessment of the singular value of reliability to itself
Share equipment costs according to value created Leverage DER value
Increased energy efficiency to reduce costs of operation
Bias against CHP Difficulty of evaluating in uncertain markets, and retrofit cost
CHP viewed mainly as an electric resource for site needs; little flexibility to size otherwise.
Recognize CHP and energy efficiency benefits to the system and other customers, beyond the CHP host site
Eliminate barriers Leverage DER value
Cost of meters and communications technology to enable demand response
Some demand response programs tried, but success limited by wholesale market conditions
Leverage DER value Ability to manage energy usage to reduce costs
Restrictions of wholesale market rules
Market does not recognize overall effects of demand response
Value demand response that reduces generation at the margin based on its price mitigation effects
Eliminate barriers
Ability to assess potential value of DER options
Uncertain market and regulatory conditions; unknown or unfamiliar analytical tools.
Shifting regulatory approaches and volatile energy markets; proprietary and little- known tools
Enhance certainty for a defined pilot period, under specified conditions; make available simple, objective screening tools.
Leverage DER value
Long, costly, and complex permitting and utility approval process. Sometimes over-designed interconnect hardware
Develop uniform interconnection standards and process, simplified permitting procedures, net metering for some resources, etc.
Address grid safety and reliability concerns presented by specific program or project only; exempt DER pilot customers from regulatory jurisdiction if necessary.
Eliminate barriers
High standby charges, exit fees, unavoidable fixed rate components,
Weak pricing signals; rate averaging; inflexible standby charges; uncertain exit fees; increased fixed rate components that leave fewer costs ‘avoidable’; net metering for small renewables.
Use cost/benefit methodology presented here to identify win--wins; use targeted rates and tailored incentives to meet pilot program goals.
Introduce efficient incentives
Ability to import from or export to the grid where desirable for economics or flexibility
System limitations, utility resistance, state law constraints
Likely regulation for offsite sales.
View end-users as potential contributors and problem-solvers in wholesale and retail markets; exempt DER pilot customers from regulation if necessary.
Eliminate barriers
Ability to use on-site generators to hedge price risks of spot market contracts
Lack of retail access to wholesale markets
Limit customer use of on-site generators to providing back-up during utility outages
Customers in hourly pricing programs install generators in cooperation with their energy supplier; design pilots to monetize the hedging risk.
Eliminate barriers Leverage DER value
A Framework for Collaborative DER Programs
4-12
Options for Tailoring Basic Strategies to Local Needs
Strategy One: Leveraging DER Value
As indicated above, leveraging DER value refers to approaches that capture and allocate among stakeholders multiple DER value streams – i.e., value streams created when DER is selected, sited, sized and operated optimally, providing value to more than a single stakeholder. These approaches can be implemented through mechanisms such as tariffs that apply to broad customer classes, model contract provisions between parties to DER transactions, or rebate or credit programs.
As noted earlier, collaborative efforts to capture and allocate DER value streams require some common understanding of what they are, how they can be created, what they are worth, and who benefits or pays if they are re-allocated in various ways. The cost/benefit modeling tool enables collaborative participants to develop that understanding, by analyzing various DER technologies and applications under a range of conditions that affect each type of value stream, and comparing the results from different stakeholder perspectives. Participants may wish to modify parts of the analysis, and will need to tailor input assumptions (e.g., price forecasts, rate structures, technology characteristics, and incentives) to reflect local conditions. Once that is done, the tool can help determine which costs and benefits drive the outcome, and where they might be allocated creatively to support win-win programs.
The following list recaps potential sources of DER value. Most of these are illustrated in the catalog and/or accounted for in the modeling tool. Those not included in this version of the model but which could be incorporated in future versions are indicated in brackets:
1. for DER Customers –
• electricity bill savings
• savings from avoided fuel costs (with CHP)
• sales of renewable energy credits (in some jurisdictions)
• equipment buy downs and project rebates (in some jurisdictions)
• other incentive payments (e.g., locational credits)
• increased reliability and security of supply
• [participation in hourly energy markets with a physical price hedge]
• [participation in demand response programs] 55
55 The model does not include hourly dispatch or demand response because these have not yet been widely
implemented in California, whose pricing and rate structures are used as examples in the current version of the model. In other states where they have been implemented future versions of the model can incorporate them, although they do add complexity to the basic screening tool ‘template’ presented here. In any case, the current model does allow users to input a ‘market multiplier’ where the market design is such that generators operating during critical periods can actually reduce overall market prices for that period (e.g., in a transmission-constrained local area subject to an hourly marginal price clearing market, such as PJM).
A Framework for Collaborative DER Programs
4-13
2. for Utility Shareholders and/or Other Ratepayers –
• avoided or reduced wholesale energy purchase costs (from unpurchased energy, or peak price mitigation where transmission rights or congestion pricing are established)
• avoided or deferred generation capacity cost
• avoided or deferred transmission and/or distribution capacity cost
• [increased capacity factor for utility generation (assuming sufficient DER penetration)]
• [service to remote off-grid loads]
• [distribution engineering benefits (line loss reduction, voltage support, voltage regulation, reactive power support, equipment life extension, reduced facility maintenance, etc.)]
3. for Society Generally –
• reduced emissions (where load management or low/no-emission DER offsets dirtier generation)
• [increased network reliability from siting energy sources closer to loads] 56
Even with all these potential value streams, DER have had limited success in penetrating U.S. electricity markets. An important reason is that many of these value streams, taken alone, cannot overcome the initial cost barriers of current technologies, or the transactions costs of deploying them in energy markets designed for large central station supply. A missing element needed to enable successful DER deployment and widespread market penetration – and a key challenge for collaborative members designing pilot programs – is the ability to capture more than one DER value stream.
Optional Approaches to Leverage DER Value
The following lists optional approaches that can improve overall economics by recognizing multiple DER values. Some of the individual options have been tried in some form (as described in the catalog), and some are being proposed for trial by E2I’s project team. They include DER deployments where:
1. Customers use on-site resources to create value in wholesale energy markets by –
a. running onsite generators to reduce load for demand response programs
b. running onsite generators to hedge hourly pricing contracts
c. curtailing load to participate in demand response programs
56 Network reliability improvements, like distribution engineering benefits, are difficult to quantify, both in terms of
how much reliability may improve and how much any improvement is worth to society. The current version of the model does not include any reliability value beyond the avoided cost of system upgrades to meet prevailing reliability standards.

A Framework for Collaborative DER Programs
4-14
2. Customers contribute to societal needs for efficiency and environmental improvement by –
a. installing energy efficiency improvements that reduce their costs while improving societal resource efficiency
b. installing CHP systems that reduce their energy bills while improving societal resource efficiency
c. installing clean energy systems that reduce their utility bills while enabling other generators to reduce pollutant emissions
3. Distribution utilities reduce their costs to upgrade or expand the grid to meet growing demand by –
a. using customer resources (efficiency improvements, CHP, clean baseload generation, etc.) to reduce energy use
b. using customer demand response resources (air conditioner controls, backup generation, operating limitations, etc.), to limit peak demand
4. Utilities install DER to address multiple needs (i.e. wholesale price mitigation, transmission congestion mitigation, and grid reliability)
Strategy Two: Introducing Efficient Incentives
Again, introducing efficient incentives refers to initiatives that send price signals to utilities, end-users, and DER providers that better reflect the true costs and benefits of DER solutions in particular situations. Examples include customer credits, rebates, equipment buy-downs, and utility rate designs.
Optional Approaches to Introduce Efficient Incentives
The following lists sample approaches to providing incentives that reflect the value of DER solutions, to encourage customers and DER providers to install and utilities to facilitate DER:
Incentives to Customers and DER Providers to Install DER
1. Utility tariffs that pay customers fixed amounts for load reduction, including reductions –
a. delivered over a period of time (kWh/yr.), or
b. delivered at the utility’s request ($/kW/mo. or $/kW/event)
Customers may need to meet siting and reliability criteria, or reduce load in specific planning areas.
A Framework for Collaborative DER Programs
4-15
2. Bilateral contracts between utilities (or DER aggregators) and customers with onsite generation, whereby the utility (or aggregator) –
a. may dispatch the generator whenever it is not needed to respond to an outage; and
b. pays for generator maintenance, interconnection upgrades, fuel expenses, and/or a percentage of any wholesale revenues.
3. Utility discounts on electricity charges to customers who commit to use DER to reduce the utility’s cost to serve load on a substation or circuit (e.g., by deferring upgrade investments).
4. Utility waivers or discounts on standby fees to customers who physically assure that their loads –
a. will not exceed agreed limits at any time, or at certain times; or
b. will drop off the utility’s system if their onsite generation fails.
This provides the most value where the utility centrally controls the load-limiting device, and only when the customer load will cause the utility’s circuit or substation to exceed design limits.
5. Utility or third party (e.g., an emissions trading entity) rewards DER owners for environmental attributes provided by clean DER systems at customer sites.
Values may be driven by portfolio standards that mandate renewables purchases, and recognized through either payments or credits. Onsite generation may represent a small share of these markets, which are typically driven by large wind turbine installations.
6. Utility or RTO payments or credits to customers who agree to limit usage on request, or when pool prices exceed a specified threshold.
7. Utility discounts on gas rates to customers with high-efficiency, high load factor onsite generation (e.g., true cogeneration or high-temperature fuel cells).
8. ‘Public goods’ or ‘system benefit’ charges collected from utility customers under some restructuring schemes, and paid to those who install clean and/or high-efficiency DER.
9. Hourly pricing contracts with energy suppliers that enable DER customers to benefit from low spot market prices, yet operate their own generators during high price periods as a physical hedge against price volatility.
10. ISO or RTO contracts with customers to pay for ancillary services they deliver to wholesale markets.
11. Federal and state government RD&D and economic development programs, private research and trade organizations, or others pay or rebate all or part of the costs of customer DER installations.
A Framework for Collaborative DER Programs
4-16
Incentives to Utilities to Facilitate DER
1. Regulatory assurance that utilities will recover –
a. costs prudently incurred to administer DER acquisition programs; and/or
b. part or all of any extraordinary revenue loss that demonstrably results from energy efficiency or other DER programs that utilities are required to facilitate; and/or
c. usage-based charges equivalent to fixed charges traditionally approved for system investments whose long-term marginal cost is greater than zero.
2. Regulatory authorization for utilities to –
a. provide customers with advanced communication devices and real-time price signals that enable them to schedule their energy usage during the utility’s low-cost periods
b. automatically cycle customer equipment (e.g., air conditioners, pool pumps, and other non-critical loads) during the utility’s high-cost periods.
Prices can be offered are in several blocks, some lower than otherwise applicable tariffs. By scheduling loads to maximize usage in low-cost periods, customers can reduce their overall bills.
3. A higher authorized return on equity for –
a. utility investment in specified DER programs (e.g., cost-effective solar, energy efficiency or demand response, high-efficiency fuel cells); and/or
b. achieving pre-defined efficiency or cost goals.
Such incentives can also take the form of penalties for non-performance or failure to meet goals.
4. Decoupling some portion of utility profits from capital investment and utility revenues from kWh throughput, and basing utility profitability on efficient asset use, effective cost control, increased reliability, and customer satisfaction.
Strategy Three: Eliminating Barriers
Eliminating barriers here refers to eliminating or reducing obstacles to DER siting, installation, operation, and value recognition in the market. It includes minimizing transactions costs for all participants from project inception to completion.
For DER pilots (and wider DER deployment) to succeed, at least three types of barriers may need to be addressed. The first is permitting and interconnection issues that delay and add (sometimes unnecessary) costs to projects. The second are market structure barriers, such as those that preclude DER from participating in wholesale markets (because load-side resources
A Framework for Collaborative DER Programs
4-17
historically have been considered different from large generating resources). The third are transactional barriers: DER projects are often site- or situation-specific, so the parties need flexibility to negotiate and structure agreements tailored to individual situations, while keeping transactions costs reasonable for small projects. To achieve this may require overcoming both legal and cultural obstacles.
The following suggests some sample approaches for addressing each type of barrier. Pilot participants can consider these as starting points, but will need to identify and address barriers specific to their particular locales, markets and regulatory regimes.
Addressing Permitting and Interconnection Barriers
Emissions Permits
1. To reduce the high cost of permitting each individual generating unit, enable permitting agencies to pre-qualify classes of clean generating units and establish blanket exemptions for those (as California is doing).
2. To reflect that environmental impacts depend partly on the duty cycles of DER equipment, develop a special permitting process for emergency generators that would focus on their annual, rather than instantaneous, emissions profile (as New York has done for generators including those used in the NY ISO Demand Response Program).
3. To recognize efficiency benefits, establish a special category of permitting for CHP applications that would focuses on total net emissions, taking into account, for example, boiler emissions offset by the CHP installation.
Land Use Permits
To reduce the time and expense of obtaining zoning permits for DER facilities, establish local exemptions or expedited review for generating equipment that meets pre-established standards. Certain California municipalities have expedited renewable energy installations as a way to avoid a proposed utility transmission line through their areas – permitting a solar project, for example, in only three days, an unprecedented fast-track for a zoning permit.
Building Permits
Building permits are sometimes delayed because inspectors are unfamiliar with DER equipment, and costs increase because multiple permits are required for jobs that cross normal trade boundaries. Building, plumbing, electrical, fire, and other inspectors often oversee even relatively small DER projects. Local and state training to familiarize building and code inspectors with DER equipment and connections is one approach to reduce these delays and costs.

A Framework for Collaborative DER Programs
4-18
Utility Interconnection
States and utilities increasingly are adopting model standards to simplify the interconnection process for smaller resources. This is necessary but not sufficient to make projects happen quickly. Pilot programs could –
1. Designate technical contact people in each participating organization (DER provider, customer, utility) whose specific responsibility is to expedite action as issues arise.
2. Encourage innovation by reducing concerns that a solution appropriate for the immediate situation might tie the parties’ hands in future cases with different circumstances, by adopting a ‘super-expedited’ process explicitly focusing only on grid safety and reliability concerns presented by the specific program or project, and expressly recognizing that any solution adopted need not set a precedent for future projects.
3. Cooperatively address insurance and indemnification requirements in interconnection agreements in advance to ensure that they are fair and reasonable, and will not present surprise obstacles as projects proceed.
Addressing Market Barriers
To afford DER developers and customers added flexibility and incentive to design win-win projects –
1. Work with ISOs and RTOs to allow DER sales into wholesale markets; to ensure transparent wholesale price signals; and to encourage DER that can mitigate transmission congestion.
2. Where time-of-use retail rates that reflect time-varying costs and benefits are not available, or not adequately differentiated by time or location, introduce or refine them to signal customers and DER providers where and when DER can provide value to the system.
3. For DER projects involving offsite transactions that might otherwise trigger state commission jurisdiction under traditional legal definitions, establish exemptions up to some agreed limit for certain types or numbers of projects needed to test promising DER approaches or configurations.
Addressing Transactional Barriers
Transactional barriers take many forms, but DER stakeholders most often complain about utilities’ perceived lack of flexibility to enter into agreements tailored to individual customer and developer needs, and about unnecessarily complex and time-consuming contracting procedures whose costs can exceed the benefits offered by smaller DER projects. To address these barriers, pilot participants may be able to:
A Framework for Collaborative DER Programs
4-19
1. Examine any legal issues related to ‘special contracts’ or ‘undue discrimination’ as defined by statute or the state commission, and establish terms or boundaries (e.g., dollar amounts, numbers or classes of customers, length of contract, geographic area, etc.) within which utilities are free to conclude pilot agreements with assured cost recovery and without ex post commission approval.
2. Ensure the flexibility needed to capture and allocate multiple DER value streams and share costs accordingly, by allowing willing parties (i.e., a utility and a customer, developer or aggregator) to structure bi- or multilateral contracts that create value for themselves and the public, so long as they do not unreasonably prejudice other utility customers.
3. Develop model contract provisions to reduce transactions costs (analogous to pre-qualifying equipment to expedite permitting), at least for contract elements likely to recur on multiple DER projects. Model provisions will need to be adapted to actual project conditions, but participants may be able to save time and money by starting with some thoughtfully crafted options for addressing common or recurring issues. As they gain experience implementing different kinds of projects, they can refine and expand the model provisions available for future participants.
Smaller DER projects often encounter financing barriers as well. Various forms of financing are available to create value for multiple participants, and different parties can access different, sometimes innovative financing options that can benefit the project as a whole. Examples include:
1. Customer internal capital budget financing
2. DER provider financing
3. Lease financing
4. Government-backed public financing (where public benefits are significant)
5. Equity markets financing
6. Rate-supported financing (where other utility customers stand to benefit)
These examples represent only a few of the avenues that pilot participants can consider, but they illustrate the kinds of approaches available under the framework’s rubric of reducing or eliminating barriers. Each pilot program may encounter some of the barriers identified here, and will certainly confront others peculiar to the locality, the participants, the utility system, the technologies, and/or the need being addressed.
Using the Cost Benefit Model to Evaluate a CHP Pilot
The process chart below was introduced earlier as a guide for implementing pilot projects using the collaborative approach described in this Framework document.
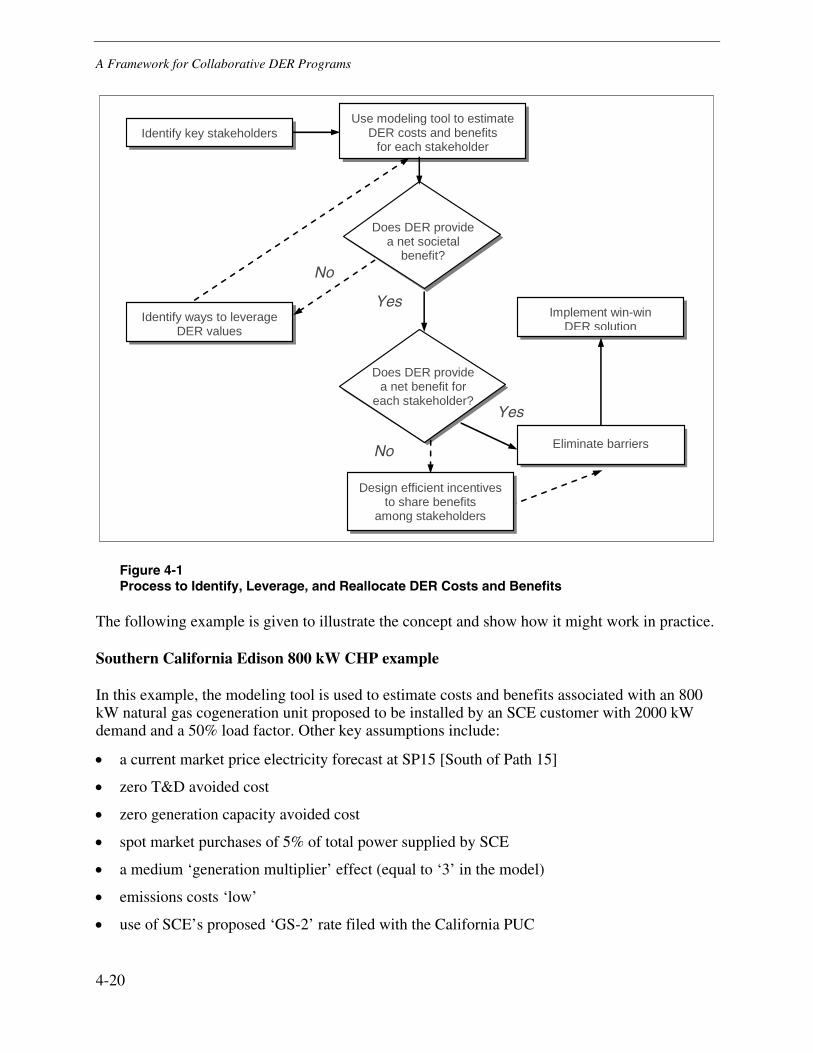
A Framework for Collaborative DER Programs
4-20
Identify key stakeholders
Use modeling tool to estimate DER costs and benefits
for each stakeholder
Identify ways to leverage DER values
Implement win-win DER solution
Does DER provide a net societal
benefit?
Does DER provide a net benefit for
each stakeholder?
No
Yes
Eliminate barriers
Design efficient incentives to share benefits
among stakeholders
Yes
No
Figure 4-1 Process to Identify, Leverage, and Reallocate DER Costs and Benefits
The following example is given to illustrate the concept and show how it might work in practice.
Southern California Edison 800 kW CHP example
In this example, the modeling tool is used to estimate costs and benefits associated with an 800 kW natural gas cogeneration unit proposed to be installed by an SCE customer with 2000 kW demand and a 50% load factor. Other key assumptions include:
• a current market price electricity forecast at SP15 [South of Path 15]
• zero T&D avoided cost
• zero generation capacity avoided cost
• spot market purchases of 5% of total power supplied by SCE
• a medium ‘generation multiplier’ effect (equal to ‘3’ in the model)
• emissions costs ‘low’
• use of SCE’s proposed ‘GS-2’ rate filed with the California PUC
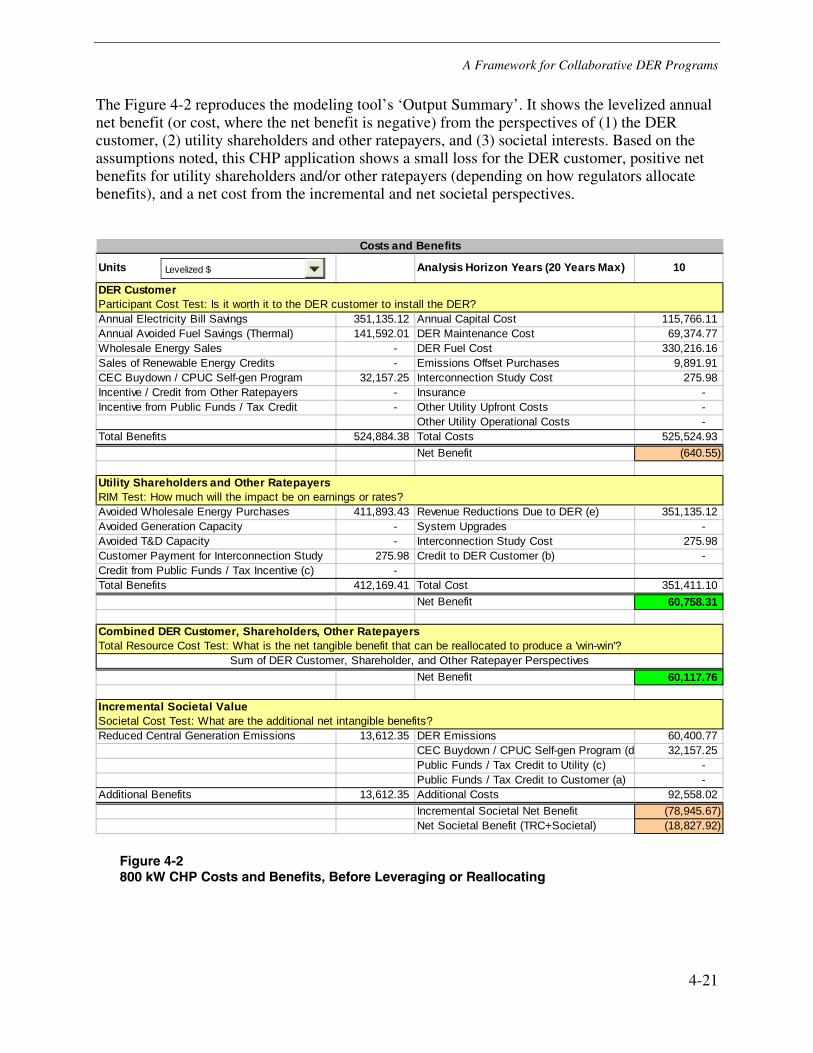
A Framework for Collaborative DER Programs
4-21
The Figure 4-2 reproduces the modeling tool’s ‘Output Summary’. It shows the levelized annual net benefit (or cost, where the net benefit is negative) from the perspectives of (1) the DER customer, (2) utility shareholders and other ratepayers, and (3) societal interests. Based on the assumptions noted, this CHP application shows a small loss for the DER customer, positive net benefits for utility shareholders and/or other ratepayers (depending on how regulators allocate benefits), and a net cost from the incremental and net societal perspectives.
Costs and Benefits
Units Analysis Horizon Years (20 Years Max) 10
DER CustomerParticipant Cost Test: Is it worth it to the DER customer to install the DER?Annual Electricity Bill Savings 351,135.12 Annual Capital Cost 115,766.11 Annual Avoided Fuel Savings (Thermal) 141,592.01 DER Maintenance Cost 69,374.77 Wholesale Energy Sales - DER Fuel Cost 330,216.16 Sales of Renewable Energy Credits - Emissions Offset Purchases 9,891.91 CEC Buydown / CPUC Self-gen Program 32,157.25 Interconnection Study Cost 275.98 Incentive / Credit from Other Ratepayers - Insurance - Incentive from Public Funds / Tax Credit - Other Utility Upfront Costs -
Other Utility Operational Costs - Total Benefits 524,884.38 Total Costs 525,524.93
Net Benefit (640.55)
Utility Shareholders and Other RatepayersRIM Test: How much will the impact be on earnings or rates?Avoided Wholesale Energy Purchases 411,893.43 Revenue Reductions Due to DER (e) 351,135.12 Avoided Generation Capacity - System Upgrades - Avoided T&D Capacity - Interconnection Study Cost 275.98 Customer Payment for Interconnection Study 275.98 Credit to DER Customer (b) - Credit from Public Funds / Tax Incentive (c) - Total Benefits 412,169.41 Total Cost 351,411.10
Net Benefit 60,758.31
Combined DER Customer, Shareholders, Other RatepayersTotal Resource Cost Test: What is the net tangible benefit that can be reallocated to produce a 'win-win'?
Sum of DER Customer, Shareholder, and Other Ratepayer PerspectivesNet Benefit 60,117.76
Incremental Societal ValueSocietal Cost Test: What are the additional net intangible benefits?Reduced Central Generation Emissions 13,612.35 DER Emissions 60,400.77
CEC Buydown / CPUC Self-gen Program (d 32,157.25 Public Funds / Tax Credit to Utility (c) - Public Funds / Tax Credit to Customer (a) -
Additional Benefits 13,612.35 Additional Costs 92,558.02 Incremental Societal Net Benefit (78,945.67) Net Societal Benefit (TRC+Societal) (18,827.92)
Levelized $
Figure 4-2 800 kW CHP Costs and Benefits, Before Leveraging or Reallocating
A Framework for Collaborative DER Programs
4-22
In this California CHP example, the customer loses $641 annually. Utility shareholders and/or other ratepayers gain about $61,000 annually, while society ‘pays’ nearly $79,000 (in the form of increased emissions and mandated self-generation incentives). Netting out the utility benefits, the cost to society is about $18,800. In terms of the process diagram on page 17, the question “Does DER provide a net societal benefit?” must be answered “no” for this example – unless strategies are available to leverage some CHP benefits. Continuing with the process diagram, then, the next step is to “Identify ways to leverage DER values.”
Step One: Leveraging DER Value
The model’s Output Summary in Figure 4-2 shows that, of the sources of value (or benefits) potentially available to the utility and other ratepayers from this CHP project, only two have been recognized: substantial avoided wholesale energy purchases, and a nominal customer payment for an interconnection study. In particular, no benefit has been identified for either avoided generation or T&D capacity.
For collaborative participants interested in shaping a successful pilot, the next step would be to determine whether any of the strategies or options outlined earlier in the framework (or others similar to them) can usefully be applied to the proposed CHP application. If any of them can yield additional, monetizable benefits for the DER customer, the utility and/or other ratepayers, or society, then the participants need to explore how this CHP project can bring them to fruition. Once that is done, they can include the additional (leveraged) benefits in another iteration of the spreadsheet analysis, and recalculate a new set of costs and benefits for each stakeholder.
In this CHP example, it may be worth considering options 1 and 3 identified on page 123, i.e.:
1. Customers use on-site resources to create value in wholesale energy markets by –
a. running onsite generators to reduce load for demand response programs
b. running onsite generators to hedge hourly pricing contracts
c. curtailing load to participate in demand response programs …
2. Distribution utilities reduce their costs to upgrade or expand the grid to meet growing demand by –
a. using customer resources (efficiency improvements, CHP, clean baseload generation, etc.) to reduce energy use
b. using customer demand response resources (air conditioner controls, backup generation, operating limitations, etc.), to limit peak demand
Option 1 is available for CHP only if (a) the onsite generation capacity exceeds the electric and thermal requirements of the CHP application, and (b) the generation is available at times when wholesale power prices exceed the retail price. Here the opportunity would be to oversize the generator relative to the site’s thermal load, and to use it as an incremental resource (Options 1.a. or b.).
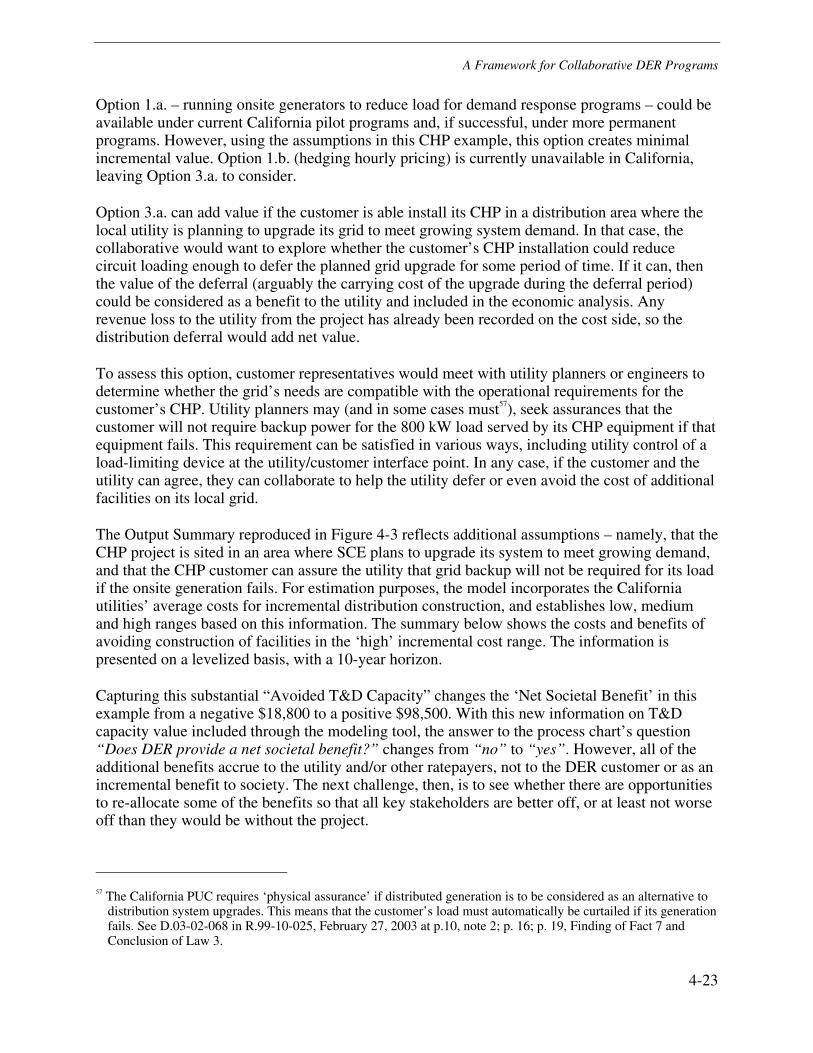
A Framework for Collaborative DER Programs
4-23
Option 1.a. – running onsite generators to reduce load for demand response programs – could be available under current California pilot programs and, if successful, under more permanent programs. However, using the assumptions in this CHP example, this option creates minimal incremental value. Option 1.b. (hedging hourly pricing) is currently unavailable in California, leaving Option 3.a. to consider.
Option 3.a. can add value if the customer is able install its CHP in a distribution area where the local utility is planning to upgrade its grid to meet growing system demand. In that case, the collaborative would want to explore whether the customer’s CHP installation could reduce circuit loading enough to defer the planned grid upgrade for some period of time. If it can, then the value of the deferral (arguably the carrying cost of the upgrade during the deferral period) could be considered as a benefit to the utility and included in the economic analysis. Any revenue loss to the utility from the project has already been recorded on the cost side, so the distribution deferral would add net value.
To assess this option, customer representatives would meet with utility planners or engineers to determine whether the grid’s needs are compatible with the operational requirements for the customer’s CHP. Utility planners may (and in some cases must57), seek assurances that the customer will not require backup power for the 800 kW load served by its CHP equipment if that equipment fails. This requirement can be satisfied in various ways, including utility control of a load-limiting device at the utility/customer interface point. In any case, if the customer and the utility can agree, they can collaborate to help the utility defer or even avoid the cost of additional facilities on its local grid.
The Output Summary reproduced in Figure 4-3 reflects additional assumptions – namely, that the CHP project is sited in an area where SCE plans to upgrade its system to meet growing demand, and that the CHP customer can assure the utility that grid backup will not be required for its load if the onsite generation fails. For estimation purposes, the model incorporates the California utilities’ average costs for incremental distribution construction, and establishes low, medium and high ranges based on this information. The summary below shows the costs and benefits of avoiding construction of facilities in the ‘high’ incremental cost range. The information is presented on a levelized basis, with a 10-year horizon.
Capturing this substantial “Avoided T&D Capacity” changes the ‘Net Societal Benefit’ in this example from a negative $18,800 to a positive $98,500. With this new information on T&D capacity value included through the modeling tool, the answer to the process chart’s question “Does DER provide a net societal benefit?” changes from “no” to “yes”. However, all of the additional benefits accrue to the utility and/or other ratepayers, not to the DER customer or as an incremental benefit to society. The next challenge, then, is to see whether there are opportunities to re-allocate some of the benefits so that all key stakeholders are better off, or at least not worse off than they would be without the project.
57 The California PUC requires ‘physical assurance’ if distributed generation is to be considered as an alternative to
distribution system upgrades. This means that the customer’s load must automatically be curtailed if its generation fails. See D.03-02-068 in R.99-10-025, February 27, 2003 at p.10, note 2; p. 16; p. 19, Finding of Fact 7 and Conclusion of Law 3.
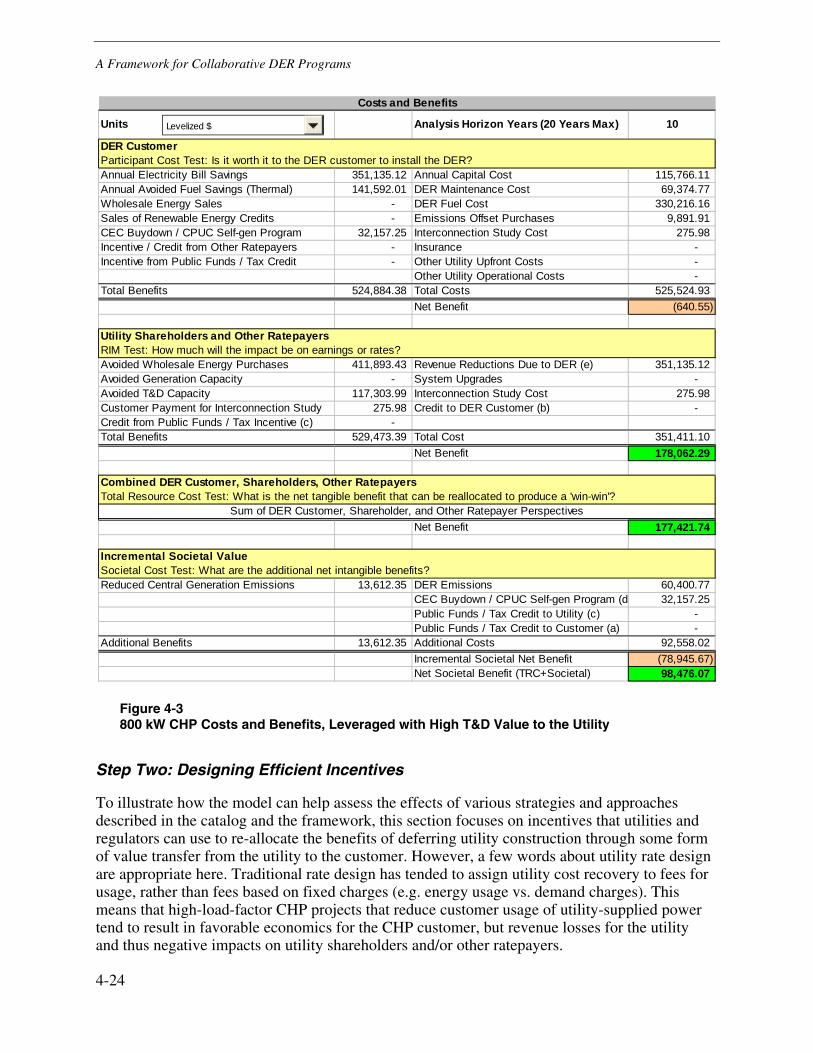
A Framework for Collaborative DER Programs
4-24
Costs and Benefits
Units Analysis Horizon Years (20 Years Max) 10
DER CustomerParticipant Cost Test: Is it worth it to the DER customer to install the DER?Annual Electricity Bill Savings 351,135.12 Annual Capital Cost 115,766.11 Annual Avoided Fuel Savings (Thermal) 141,592.01 DER Maintenance Cost 69,374.77 Wholesale Energy Sales - DER Fuel Cost 330,216.16 Sales of Renewable Energy Credits - Emissions Offset Purchases 9,891.91 CEC Buydown / CPUC Self-gen Program 32,157.25 Interconnection Study Cost 275.98 Incentive / Credit from Other Ratepayers - Insurance - Incentive from Public Funds / Tax Credit - Other Utility Upfront Costs -
Other Utility Operational Costs - Total Benefits 524,884.38 Total Costs 525,524.93
Net Benefit (640.55)
Utility Shareholders and Other RatepayersRIM Test: How much will the impact be on earnings or rates?Avoided Wholesale Energy Purchases 411,893.43 Revenue Reductions Due to DER (e) 351,135.12 Avoided Generation Capacity - System Upgrades - Avoided T&D Capacity 117,303.99 Interconnection Study Cost 275.98 Customer Payment for Interconnection Study 275.98 Credit to DER Customer (b) - Credit from Public Funds / Tax Incentive (c) - Total Benefits 529,473.39 Total Cost 351,411.10
Net Benefit 178,062.29
Combined DER Customer, Shareholders, Other RatepayersTotal Resource Cost Test: What is the net tangible benefit that can be reallocated to produce a 'win-win'?
Sum of DER Customer, Shareholder, and Other Ratepayer PerspectivesNet Benefit 177,421.74
Incremental Societal ValueSocietal Cost Test: What are the additional net intangible benefits?Reduced Central Generation Emissions 13,612.35 DER Emissions 60,400.77
CEC Buydown / CPUC Self-gen Program (d 32,157.25 Public Funds / Tax Credit to Utility (c) - Public Funds / Tax Credit to Customer (a) -
Additional Benefits 13,612.35 Additional Costs 92,558.02 Incremental Societal Net Benefit (78,945.67) Net Societal Benefit (TRC+Societal) 98,476.07
Levelized $
Figure 4-3 800 kW CHP Costs and Benefits, Leveraged with High T&D Value to the Utility
Step Two: Designing Efficient Incentives
To illustrate how the model can help assess the effects of various strategies and approaches described in the catalog and the framework, this section focuses on incentives that utilities and regulators can use to re-allocate the benefits of deferring utility construction through some form of value transfer from the utility to the customer. However, a few words about utility rate design are appropriate here. Traditional rate design has tended to assign utility cost recovery to fees for usage, rather than fees based on fixed charges (e.g. energy usage vs. demand charges). This means that high-load-factor CHP projects that reduce customer usage of utility-supplied power tend to result in favorable economics for the CHP customer, but revenue losses for the utility and thus negative impacts on utility shareholders and/or other ratepayers.
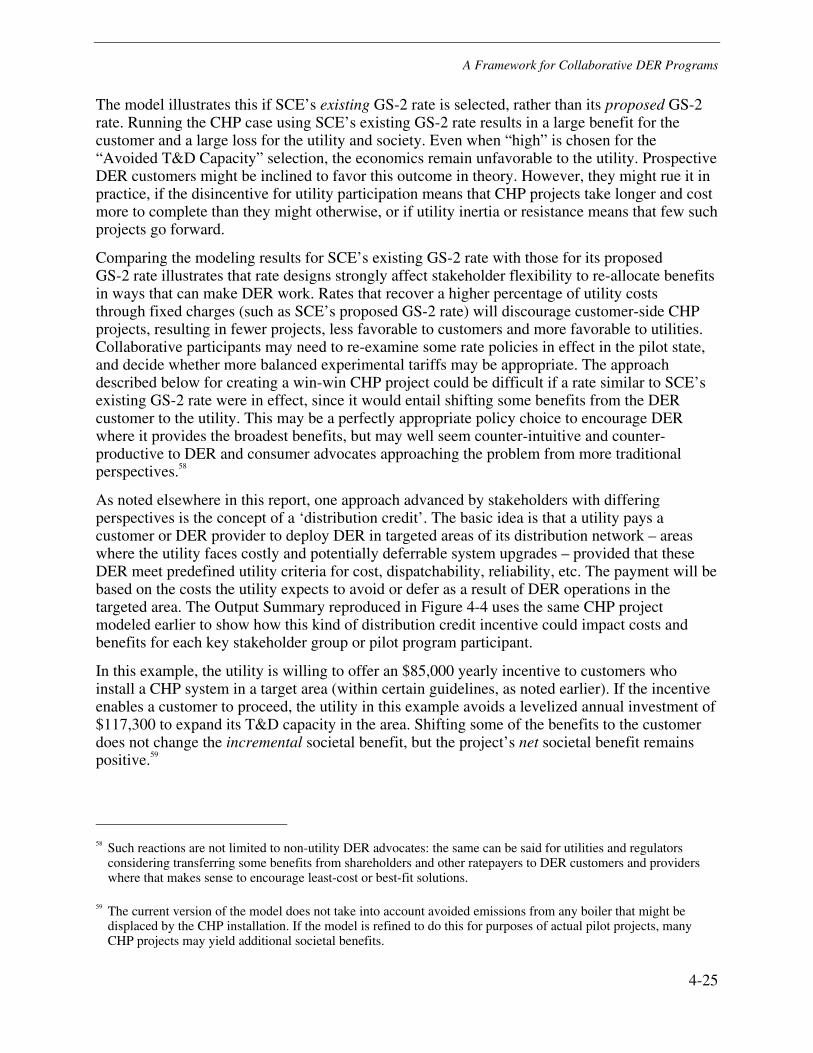
A Framework for Collaborative DER Programs
4-25
The model illustrates this if SCE’s existing GS-2 rate is selected, rather than its proposed GS-2 rate. Running the CHP case using SCE’s existing GS-2 rate results in a large benefit for the customer and a large loss for the utility and society. Even when “high” is chosen for the “Avoided T&D Capacity” selection, the economics remain unfavorable to the utility. Prospective DER customers might be inclined to favor this outcome in theory. However, they might rue it in practice, if the disincentive for utility participation means that CHP projects take longer and cost more to complete than they might otherwise, or if utility inertia or resistance means that few such projects go forward.
Comparing the modeling results for SCE’s existing GS-2 rate with those for its proposed GS-2 rate illustrates that rate designs strongly affect stakeholder flexibility to re-allocate benefits in ways that can make DER work. Rates that recover a higher percentage of utility costs through fixed charges (such as SCE’s proposed GS-2 rate) will discourage customer-side CHP projects, resulting in fewer projects, less favorable to customers and more favorable to utilities. Collaborative participants may need to re-examine some rate policies in effect in the pilot state, and decide whether more balanced experimental tariffs may be appropriate. The approach described below for creating a win-win CHP project could be difficult if a rate similar to SCE’s existing GS-2 rate were in effect, since it would entail shifting some benefits from the DER customer to the utility. This may be a perfectly appropriate policy choice to encourage DER where it provides the broadest benefits, but may well seem counter-intuitive and counter-productive to DER and consumer advocates approaching the problem from more traditional perspectives.58
As noted elsewhere in this report, one approach advanced by stakeholders with differing perspectives is the concept of a ‘distribution credit’. The basic idea is that a utility pays a customer or DER provider to deploy DER in targeted areas of its distribution network – areas where the utility faces costly and potentially deferrable system upgrades – provided that these DER meet predefined utility criteria for cost, dispatchability, reliability, etc. The payment will be based on the costs the utility expects to avoid or defer as a result of DER operations in the targeted area. The Output Summary reproduced in Figure 4-4 uses the same CHP project modeled earlier to show how this kind of distribution credit incentive could impact costs and benefits for each key stakeholder group or pilot program participant.
In this example, the utility is willing to offer an $85,000 yearly incentive to customers who install a CHP system in a target area (within certain guidelines, as noted earlier). If the incentive enables a customer to proceed, the utility in this example avoids a levelized annual investment of $117,300 to expand its T&D capacity in the area. Shifting some of the benefits to the customer does not change the incremental societal benefit, but the project’s net societal benefit remains positive.59
58 Such reactions are not limited to non-utility DER advocates: the same can be said for utilities and regulators
considering transferring some benefits from shareholders and other ratepayers to DER customers and providers where that makes sense to encourage least-cost or best-fit solutions.
59 The current version of the model does not take into account avoided emissions from any boiler that might be displaced by the CHP installation. If the model is refined to do this for purposes of actual pilot projects, many CHP projects may yield additional societal benefits.
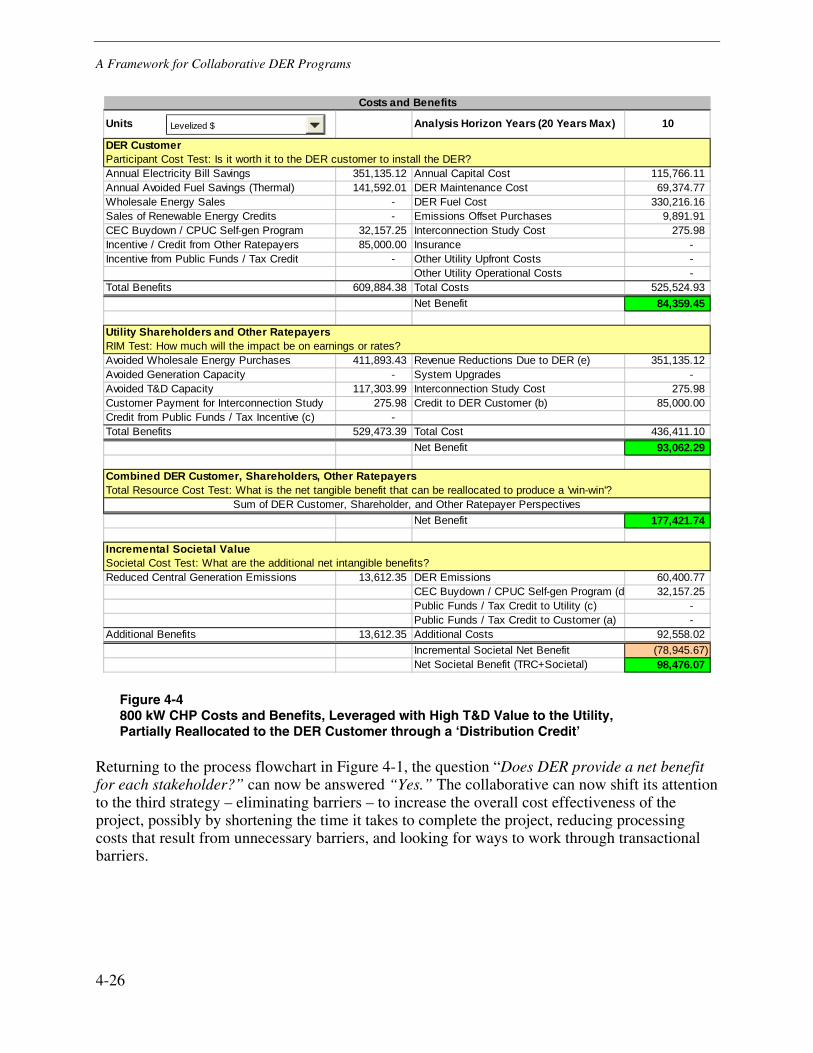
A Framework for Collaborative DER Programs
4-26
Costs and Benefits
Units Analysis Horizon Years (20 Years Max) 10
DER CustomerParticipant Cost Test: Is it worth it to the DER customer to install the DER?Annual Electricity Bill Savings 351,135.12 Annual Capital Cost 115,766.11 Annual Avoided Fuel Savings (Thermal) 141,592.01 DER Maintenance Cost 69,374.77 Wholesale Energy Sales - DER Fuel Cost 330,216.16 Sales of Renewable Energy Credits - Emissions Offset Purchases 9,891.91 CEC Buydown / CPUC Self-gen Program 32,157.25 Interconnection Study Cost 275.98 Incentive / Credit from Other Ratepayers 85,000.00 Insurance - Incentive from Public Funds / Tax Credit - Other Utility Upfront Costs -
Other Utility Operational Costs - Total Benefits 609,884.38 Total Costs 525,524.93
Net Benefit 84,359.45
Utility Shareholders and Other RatepayersRIM Test: How much will the impact be on earnings or rates?Avoided Wholesale Energy Purchases 411,893.43 Revenue Reductions Due to DER (e) 351,135.12 Avoided Generation Capacity - System Upgrades - Avoided T&D Capacity 117,303.99 Interconnection Study Cost 275.98 Customer Payment for Interconnection Study 275.98 Credit to DER Customer (b) 85,000.00 Credit from Public Funds / Tax Incentive (c) - Total Benefits 529,473.39 Total Cost 436,411.10
Net Benefit 93,062.29
Combined DER Customer, Shareholders, Other RatepayersTotal Resource Cost Test: What is the net tangible benefit that can be reallocated to produce a 'win-win'?
Sum of DER Customer, Shareholder, and Other Ratepayer PerspectivesNet Benefit 177,421.74
Incremental Societal ValueSocietal Cost Test: What are the additional net intangible benefits?Reduced Central Generation Emissions 13,612.35 DER Emissions 60,400.77
CEC Buydown / CPUC Self-gen Program (d 32,157.25 Public Funds / Tax Credit to Utility (c) - Public Funds / Tax Credit to Customer (a) -
Additional Benefits 13,612.35 Additional Costs 92,558.02 Incremental Societal Net Benefit (78,945.67) Net Societal Benefit (TRC+Societal) 98,476.07
Levelized $
Figure 4-4 800 kW CHP Costs and Benefits, Leveraged with High T&D Value to the Utility, Partially Reallocated to the DER Customer through a ‘Distribution Credit’
Returning to the process flowchart in Figure 4-1, the question “Does DER provide a net benefit for each stakeholder?” can now be answered “Yes.” The collaborative can now shift its attention to the third strategy – eliminating barriers – to increase the overall cost effectiveness of the project, possibly by shortening the time it takes to complete the project, reducing processing costs that result from unnecessary barriers, and looking for ways to work through transactional barriers.
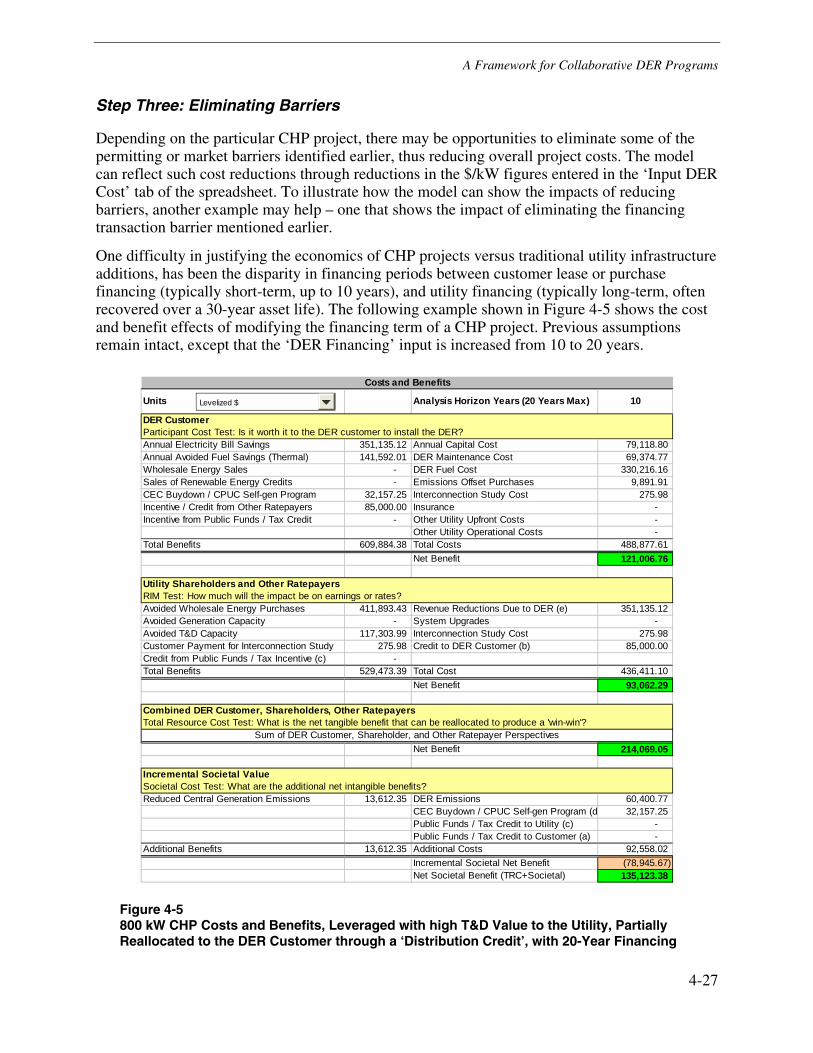
A Framework for Collaborative DER Programs
4-27
Step Three: Eliminating Barriers
Depending on the particular CHP project, there may be opportunities to eliminate some of the permitting or market barriers identified earlier, thus reducing overall project costs. The model can reflect such cost reductions through reductions in the $/kW figures entered in the ‘Input DER Cost’ tab of the spreadsheet. To illustrate how the model can show the impacts of reducing barriers, another example may help – one that shows the impact of eliminating the financing transaction barrier mentioned earlier.
One difficulty in justifying the economics of CHP projects versus traditional utility infrastructure additions, has been the disparity in financing periods between customer lease or purchase financing (typically short-term, up to 10 years), and utility financing (typically long-term, often recovered over a 30-year asset life). The following example shown in Figure 4-5 shows the cost and benefit effects of modifying the financing term of a CHP project. Previous assumptions remain intact, except that the ‘DER Financing’ input is increased from 10 to 20 years.
Costs and Benefits
Units Analysis Horizon Years (20 Years Max) 10
DER CustomerParticipant Cost Test: Is it worth it to the DER customer to install the DER?Annual Electricity Bill Savings 351,135.12 Annual Capital Cost 79,118.80 Annual Avoided Fuel Savings (Thermal) 141,592.01 DER Maintenance Cost 69,374.77 Wholesale Energy Sales - DER Fuel Cost 330,216.16 Sales of Renewable Energy Credits - Emissions Offset Purchases 9,891.91 CEC Buydown / CPUC Self-gen Program 32,157.25 Interconnection Study Cost 275.98 Incentive / Credit from Other Ratepayers 85,000.00 Insurance - Incentive from Public Funds / Tax Credit - Other Utility Upfront Costs -
Other Utility Operational Costs - Total Benefits 609,884.38 Total Costs 488,877.61
Net Benefit 121,006.76
Utility Shareholders and Other RatepayersRIM Test: How much will the impact be on earnings or rates?Avoided Wholesale Energy Purchases 411,893.43 Revenue Reductions Due to DER (e) 351,135.12 Avoided Generation Capacity - System Upgrades - Avoided T&D Capacity 117,303.99 Interconnection Study Cost 275.98 Customer Payment for Interconnection Study 275.98 Credit to DER Customer (b) 85,000.00 Credit from Public Funds / Tax Incentive (c) - Total Benefits 529,473.39 Total Cost 436,411.10
Net Benefit 93,062.29
Combined DER Customer, Shareholders, Other RatepayersTotal Resource Cost Test: What is the net tangible benefit that can be reallocated to produce a 'win-win'?
Sum of DER Customer, Shareholder, and Other Ratepayer PerspectivesNet Benefit 214,069.05
Incremental Societal ValueSocietal Cost Test: What are the additional net intangible benefits?Reduced Central Generation Emissions 13,612.35 DER Emissions 60,400.77
CEC Buydown / CPUC Self-gen Program (d 32,157.25 Public Funds / Tax Credit to Utility (c) - Public Funds / Tax Credit to Customer (a) -
Additional Benefits 13,612.35 Additional Costs 92,558.02 Incremental Societal Net Benefit (78,945.67) Net Societal Benefit (TRC+Societal) 135,123.38
Levelized $
Figure 4-5 800 kW CHP Costs and Benefits, Leveraged with high T&D Value to the Utility, Partially Reallocated to the DER Customer through a ‘Distribution Credit’, with 20-Year Financing
A Framework for Collaborative DER Programs
4-28
Increasing the model’s ‘DER Finance’ term for the CHP equipment from 10 to 20 years reduces the annual cost of the equipment to the customer by nearly $37,000. In this example, this increases the ‘Net Societal Benefit’ dollar-for-dollar, by the same $37,000.60 This benefit in the first years of the project can be re-allocated among project participants if necessary to support a win-win outcome.
The CHP case described above illustrates a process that collaborative stakeholders can use to pursue the strategies and implementation options outlined in this framework. The cost-benefit model provides a template that all stakeholders can work with and refine, and a common tool they can use to gauge the impacts of various program and project choices. Although stakeholders will need to adapt it to different locales and expand it to accommodate other types of information unique to their situation, the tool will be enhanced in each case by combining it with lessons learned from the catalog; rate design and other considerations discussed in Chapter 3; and process suggestions, value leveraging strategies and incentive approaches outlined here.
60 Although this particular example used a 20-year financing term, it also used a 10-year analysis horizon,
effectively ignoring project capital costs beyond the tenth year. Depending on the project this may or may not significantly skew the results, which are presented here only to illustrate how the modeling tool can be used, and not to justify any particular project.

© 2004 Electricity Innovation Institute (E2I). All rights reserved.Electricity Innovation Institute and E21 are registered service marks of the Electric Power Research Institute, Inc.EPRI. ELECTRIFY THE WORLD is a service mark of the ElectricPower Research Institute, Inc.
Printed on recycled paper in the United States of America
1011026
E2I Corporate Headquarters—an affiliate of EPRI• 3412 Hillview Avenue, Palo Alto, California 94304PO Box 10414, Palo Alto, California 94303 • USA650.855.2100 • Fax: 650.855.2110 • www.E2I.org
About E2I
The Electricity Innovation Institute (E2I) is a recently
created non-profit, public-benefit organization
designed to conduct strategic, breakthrough R&D in
electricity-related science and technology. It is
affiliated with, and draws upon the technical
expertise of EPRI, which has 30 years of experience
conducting research on the electric generation and
delivery system.Through the creation of
public/private partnerships (including industry,
federal and state governments, and foundations), E2I
in collaboration with stakeholders, supports and
directs science and technology innovation in
electricity supply, delivery, and utilization.
EPRI. Electrify the World