Embed Size (px)
Citation preview

A Framework for 3PL Service Provider
Appraisement using Fuzzy AHP
Presented by :
Nitin Kumar Sahu
Ph.D Scholar
Department of Mechanical Engineering
National Institute of Technology, Rourkela-769008

Outlines
Introduction
Size & return percentage on Reverse Logistic
Why Reverse Logistics take place
Scope and activities
Methodology Adopted
Results and Discussions
Conclusions
References

Definitions
Logistics (Forward)
“Process of planning, implementing and controlling the efficient, cost-effective
flow of raw materials, in-process inventory, finished goods and related
information from the point of origin to the point of consumption for the purpose
of conforming to customer requirements”
- Council of Logistics, 1988
Reverse Logistics
“Process of planning, implementing and controlling the efficient, cost-effective
flow of raw materials, in-process inventory, finished goods and related
information from the point of consumption to the point of origin for the purpose
of recapturing value or proper disposal”
- Rogers and Tibben-Lembke

Products that have failed, but can be repaired or reused.
Products that are obsolete but still have value.
Unsold products from retailers.
Recalled products.
Parts repaired in the field that still have value.
Items that have secondary usage, i.e. items that have another usage after
they have exhausted their original use.
Waste that must be accounted for and disposed of or used for energy
production.
Containers that must be returned to their origin
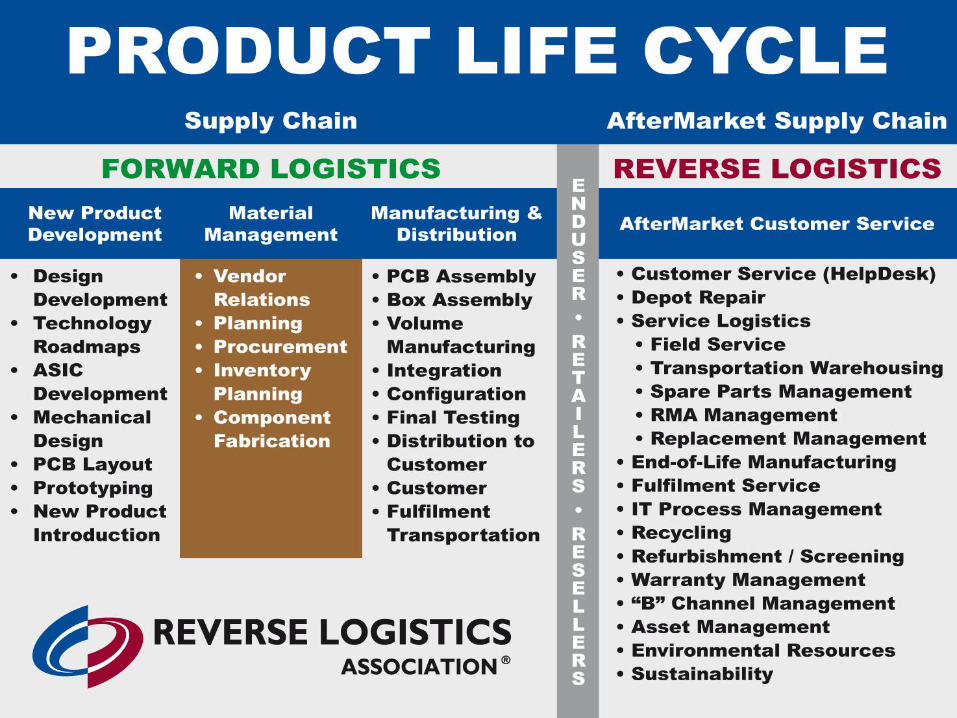
WHY REVERSE LOGISTICS
TAKE PLACE…..

SCOPE…..
Helping The Customer
Warehouse Operations
Refund, Restock, Refurbish, Refilling
Recycling and waste disposal
Product recall
Remanufacturing

Reverse Logistics Activities
Handling of returned merchandise
Damage
Seasonal inventory
Resell via outlet
Salvage of outdated products
Stock–balancing returns
Recycling and reuse
Material reuse
Remanufacturing / refurbishing
Hazardous materials disposition

Size of Reverse Logistics
“Reverse logistics costs in the United States are estimated to be approximately 4% of total
U.S. logistics costs”
- ROGERS, D., Reverse Logistics Challenges, 2002
- Roughly $47 billions in 2006
“It is estimated that reverse logistics costs account for almost 1% of the total United States
gross domestic product”
-MOORE, R., Reverse logistics: The least used differentiator, 2006.
- Roughly $132 billions in 2006
“The Center for Logistics Management at the University of Nevada conservatively estimates
that 6% of all goods may be returned, but concedes that the true number may be closer to
8%”
- MOORE, R., Reverse logistics: The least used differentiator, 2006.

Return Percentages
Industry Percent
Magazine Publishing 50 %
Book Publishers 20-30 %
Book Distributors 10-20 %
Greeting Cards 20-30 %
Catalogue Retailers 18-35 %
Electronic Distributors 10-12 %
Computers Manufactures 10-20 %
CD ROMs 18-25 %
Printers 4-8 %
Mail Order Computer Manufactures 2-5 %
Mass Merchandisers 4-15 %
Auto Industry (Parts) 4-6 %
Consumer Electronics 4-5 %
House Hold Chemicals 2-3 %

Forward vs. Reverse Logistics

PROPOSED EVALUATION MODEL: CASE STUDY
The reverse logistics performance evaluation index platform adapted in this paper
has been shown in Table 1.
The 2-level hierarchical model consists of various indices: Attributes and Sub
Attributes. Cost of Service, Reputation of the 3PL, Long-term Relationships,
Finance, Service level, Infrastructure, Third party logistics services, Reverse
logistics function, Organizational role, User satisfaction and IT Applications have
been considered as the 1st level indices (called Attributes) followed by 2nd level
indices which encompass a number of reverse logistics Sub Attributes.
An approach based on Fuzzy Analytic hierarchy process (FAHP) with Triangular
Fuzzy Numbers Set (TFNS) has been used to evaluate an overall performance
index. This method has been found fruitful for solving the group decision-making
problem under uncertain environment due to vagueness, inconsistency and
incompleteness associated with decision-makers‘ subjective evaluation. The
proposed evaluation index platform has been explored by the reverse supply chain
of an Indian automobile part manufacturing company at eastern part of India.

12
Proposed Supplier Appraisement Platform: Procedural
Hierarchy and Case Study
Step 1: The value of fuzzy synthetic extent with respect to the object is
defined as:
Step 2: Since and are two triangular fuzzy
numbers, the degree of possibility defined as:
A committee of Three decision-makers express their subjective preferences (priority
importance) in linguistic terms (Tables 2).
m
j
n
i
m
j
j
g
j
gi iiMMS
1
1
1 1
)1.......(....................
111
~
1 ,, umlM222
~
2 ,, umlM
21 MM
yxMMV MMyx
21,minsup2
~
1
~
dMMhgtMMV M22
~
1
~
1
~
2
~
,
,
,
,0
,1
21
12
1122
21 otherwise
ulif
mmif
lmum
ul)2.(....................

Step 3: The degree possibility for a convex fuzzy number to be greater than
convex fuzzy numbers can be defined by;
Step 4: Assume that for .
Then, the weight vector is given by
13
kiM i ,.....,2,1k
kMMMMV ,.....,, 21
kMMandandMMandMMV ...........21
......,,2,1,min kiMMV i)3.......(..........
kii SSVXd min iknk ;,.....,2,1
T
nXdXdXdW ,......,, 21)4......(..........
nnX i ,,.........2,1Where; are elements

Step 5: Via normalization, the normalized weight
vectors are:
T
nXdXdXdW ,......,, 21)5......(..........
Where; is a non-fuzzy number that gives the priority weights of one criterion over another.
The normalized weight vectors are calculated as:
W
i
ii
W
WWN )6.....(..........

Consistency of pair-wise comparison matrix (Saaty, 1980, Alonso and Lamata, 2006, Ramik, and Korviny, 2010):
In classical AHP we consider an pair-wise comparison matrix with positiveelements such that
nn A
1
1
1
21
221
112
nn
n
n
aa
aa
aa
A )7.....(..........
This matrix is reciprocal, if for each We say that is consistent if ji
ija
a1
nji,1 A
ikjkij aaa
for each
)8.....(..........
nk j,i,1

k j,i,
A
99
1ija nji,1
A
nCI
If for some Equation (15) does not hold, than is said to be inconsistent. In
analytic hierarchy process (AHP), it is assumed that for all Saaty,
1991. The inconsistency of is measured by the consistency index as
1
max
n
nCIn
)9.....(..........
Where is the principle eigen value of . It holds max A 0nCI
In practical decision situations inconsistency is “acceptable” if 1.0CR
Saaty defined the consistency ratio as :CR
RI
CICR )10.....(..........
Where is the average value of for random matrices using the (Saaty, 1980,) given
scale.RI CI
1 2 3 4 5 6 7 8 9 10 11 12 13 14 15
0.00 0.00 0.58 0.90 1.12 1.24 1.32 1.41 1.45 1.49 1.51 1.48 1.56 1.57 1.59

Evaluation
and
Selection of
3 PL
provider
Attributes Sub-attributes
Cost of Service
Freight Price
Terms of Payment
Extra Costs
IT capability
Size and quality of fixed assets
Delivery performance
Employee satisfaction level
Flexibility in operations and delivery
Reputation of
the 3PL
Market share
Geographic spread and access to retailers
Market knowledge
Experience in similar products
Long-term
Relationships
Information sharing
Willingness to use logistics manpower
Trust and fairness
Benefit and risk sharing
Quality of management
Compatibility
Cost of relationship
FinanceLogistics costs
Financial stability
Service level
Reliability and timeliness
Quality of service
Flexibility and responsiveness
Infrastructure IT/IS capability
Logistics manpower
Table 1: 3PL supplier evaluation criterionsAttributes Sub-attributes
Third party
logistics
services
Inventory replenishment
Warehouse management
Shipment consolidation
Carrier selection
Direct transportation services
Reverse
logistics
function
Collection
Packing
Storage
Sorting
Transitional processing
Delivery
Organizational
role
Reclaim
Recycle
Remanufacture
Re use
Disposal
User
satisfaction
Effective communication
Service improvement
Cost saving
Overall working relations
IT Applications
Warehouse management
Order management
Supply chain planning
Shipment and tracking
Freight payment

Verbal judgment Triangular
Fuzzy
number
Triangular Fuzzy
number
(fraction form)
Reverse
Triangular
Fuzzy
number
Reverse
Triangular
Fuzzy number
(fraction form)
Just equal ( JE) (1, 1, 1) (1.00, 1.00, 1.00) (1, 1, 1) (1.00, 1.00, 1.00)
Equally important (EI) (1/2, 1, 3/2) (0.50, 1.00, 1.50) (2/3, 1, 2) (0.67, 1.00, 2.00)
Weakly important (WI) (1, 3/2, 2) (1.00, 1.50, 2.00) (1/2, 2/3, 1) (0.50, 0.67, 1.00)
Strongly more important (SMI) (3/2, 2, 5/2) (1.50, 2.00, 2.50) (2/5, 1/2, 2/3) (0.40, 0.50, 0.67)
Very strongly more important (VSMI) (2, 5/2, 3) (2.00, 2.50, 3.00) (1/3, 2/5, 1/2) (0.33, 0.40, 0.50)
Absolutely more important (AMI) (5/2, 3, 7/2) (2.50, 3.00, 3.50) (2/7, 1/3, 2/5) (0.29, 0.33, 0.40)
Table 2: Fuzzy Importance scale with Triangular Fuzzy
Number for Criteria and Sub-Criteria

Cri
teri
ons
C1 C2 C3 C4 C5 C6 C7 C8 C9 C10 C11
C1(1,1,1) (1/3,2/5,1/2) (2/3,1,2) (1/2,2/3,1) (2/5,1/2,2/3) (1/3,2/5,1/2) (1/2,2/3,1) (2/5,1/2,2/3) (1/3,2/5,1/2) (2/3,1,2) (2/5,1/2,2/3)
C2(2,5/2,3) (1,1,1) (3/2,2,5/2) (1/2,1,3/2) (5/2,3,7/2) (3/2,2,5/2) (1/2,1,3/2) (2,5/2,3) (3/2,2,5/2) (1/2,1,3/2) (2,5/2,3)
C3(1/2,1,3/2) (2/5,1/2,2/3) (1,1,1) (3/2,2,5/2) (3/2,2,5/2) (1/3,2/5,1/2) (1,3/2,2) (3/2,2,5/2) (1,3/2,2) (1/3,2/5,1/2) (3/2,2,5/2)
C4(1,3/2,2) (2/3,1,2) (2/5,1/2,2/3) (1,1,1) (5/2,3,7/2) (1/2,2/3,1) (2,5/2,3) (2/3,1,2) (1/2,2/3,1) (5/2,3,7/2) (2/3,1,2)
C5(3/2,2,5/2) (2/7,1/3,2/5) (2/5,1/2,2/3) (2/7,1/3,2/5) (1,1,1) (1/2,2/3,1) (2/3,1,2) (1/2,2/3,1) (2,5/2,3) (2/3,1,2) (2,5/2,3)
C6(2,5/2,3) (2/5,1/2,2/3) (2,5/2,3) (1,3/2,2) (1,3/2,2) (1,1,1) (2/3,1,2) (5/2,3,7/2) (2/3,1,2) (2/5,1/2,2/3) (5/2,3,7/2)
C7(1,3/2,2) (2/3,1,2) (1/2,2/3,1) (1/3,2/5,1/2) (1/2,1,3/2) (1/2,1,3/2) (1,1,1) (2/3,1,2) (2/7,1/3,2/5) (2/3,1,2) (2/7,1/3,2/5)
C8(3/2,2,5/2) (1/3,2/5,1/2) (2/5,1/2,2/3) (1/2,1,3/2) (1,3/2,2) (2/7,1/3,2/5) (1/2,1,3/2) (1,1,1) (1/3,2/5,1/2) (1/2,2/3,1) (1/2,1,3/2)
C9(2,5/2,3) (2/5,1/2,2/3) (1/2,2/3,1) (1,3/2,2) (1/3,2/5,1/2) (1/2,1,3/2) (5/2,3,7/2) (2,5/2,3) (1,1,1) (2,5/2,3) (2/5,1/2,2/3)
C101/2,1,3/2) (2/3,1,2) (2,5/2,3) (2/7,1/3,2/5) (1/2,1,3/2) (3/2,2,5/2) (1/2,1,3/2) (1,3/2,2) (1/3,2/5,1/2) (1,1,1) (1/3,2/5,1/2)
C11(3/2,2,5/2) 1/3,2/5,1/2) (3/2,2,5/2) (1/2,1,3/2) (1/3,2/5,1/2) (2/7,1/3,2/5) 5/2,3,7/2) (2/3,1,2) (3/2,2,5/2) (2,5/2,3) (1,1,1)
Table 3: Fuzzy Pairwise Comparison matrix at Criteria level

By applying Equation (1), the value of fuzzy synthetic extent with respect to the goal were
calculated:
S1 (Cost of Service) = (0.028, 0.047, 0.092) S2 (Reputation of the 3PL) = (0.078, 0.136, 0.223)
S3 (Long-term Relationships) = (0.053, 0.095, 0.159) S4 (Finance) = (0.062, 0.105, 0.189)
S5 (Service level) = (0.049, 0.083, 0.148) S6 (Infrastructure) = (0.071, 0.119, 0.204)
S8 (Reverse logistics function) = (0.034, 0.065, 0.114) S9 (Organizational role) = (0.063, 0.106, 0.173)
S10 (User satisfaction) = (0.043, 0.080, 0.143) S11 (IT Applications) = (0.061, 0.104, 0.174)
S7 (Third party logistics services) = (0.032, 0.061, 0.125)
These synthetic values were compared by using Equation (2), and the same is given in Table 15.
With the help of equations (3), (4) and (5), the minimum degree of possibility of superiority of each
criterion over another is obtained. This further decides the weight vectors of the criteria. Therefore, the
weight vector is given as:
W’ = (0.136, 1.000, 0.663, 0.783, 0.571, 0.884, 0.387, 0.339, 0.765, 0.542, 0.749)
The normalized value of this vector decides the priority weights of each criterion over another. The
normalized weight vectors are calculated using the Equation (6) and the same is given in Table 16.

Sub-
criteria
C11 C12 C13 C14 C15 C16 C17 C18
C11 (1,1,1) (1/2, 2/3, 1) (2/5, 1/2, 2/3) (1/2, 2/3, 1) (2/7, 1/3, 2/5) (2/5, 1/2, 2/3) (1/3, 2/5, 1/2) (2/5, 1/2, 2/3)
C12 (1, 3/2, 2) (1,1,1) (5/2, 3, 7/2) (2, 5/2, 3) (1, 3/2, 2) (5/2, 3, 7/2) (2, 5/2, 3) (1, 3/2, 2)
C13 (3/2, 2, 5/2) (2/7, 1/3, 2/5) (1,1,1) (2/3, 1, 2) (3/2, 2, 5/2) (5/2, 3, 7/2) (2/3, 1, 2) (3/2, 2, 5/2)
C14 (1, 3/2, 2) (1/3, 2/5, 1/2) (1/2, 1, 3/2) (1,1,1) (2/7, 1/3, 2/5) (1/2, 2/3, 1) (2/7, 1/3, 2/5) (1/2, 2/3, 1)
C15 (5/2, 3, 7/2) (1/2, 2/3, 1) (2/5, 1/2, 2/3) (5/2, 3, 7/2) (1,1,1) (1/2, 1, 3/2) (1/2, 2/3, 1) (1/2, 1, 3/2)
C16 (3/2, 2, 5/2) (2/7, 1/3, 2/5) (2/7, 1/3, 2/5) (1, 3/2, 2) (2/3, 1, 2) (1,1,1) (1, 3/2, 2) (5/2, 3, 7/2)
C17 (2, 5/2, 3) (1/3, 2/5, 1/2) (1/2, 1, 3/2) (5/2, 3, 7/2) (1, 3/2, 2) (1/2, 2/3, 1) (1,1,1) (2, 5/2, 3)
C18 (3/2, 2, 5/2) (1/2, 2/3, 1) (2/5, 1/2, 2/3) (1, 3/2, 2) (2/3, 1, 2) (2/7, 1/3, 2/5) (1/3, 2/5, 1/2) (1,1,1)
Table 4: Fuzzy Pair-wise Comparison matrix at Sub-criteria level for (C1)

Sub-criteria C21 C22 C23 C24
C21 (1,1,1) (2/5, 1/2, 2/3) (1/3, 2/5, 1/2) (2/5, 1/2, 2/3)
C22 (3/2, 2, 5/2) (1,1,1) (1, 3/2, 2) (1/2, 1, 3/2)
C23 (2, 5/2, 3) (1/2, 2/3, 1) (1,1,1) (1, 3/2, 2)
C24 (3/2, 2, 5/2) (2/3, 1, 2) (1/2, 2/3, 1) (1,1,1)
Table 5: Fuzzy Pair-wise Comparison matrix at Sub-criteria level for (C2)

Sub-
criteriaC31 C32 C33 C34 C35 C36 C37
C31 (1,1,1) (3/2, 2, 5/2) (5/2, 3, 7/2) (2/3, 1, 2) (3/2, 2, 5/2) (1/2, 1, 3/2) (5/2, 3, 7/2)
C32 (2/5, 1/2, 2/3) (1,1,1) (1, 1, 1) (3/2, 2, 5/2) (1/2, 1, 3/2) (1, 1, 1) (1/2, 1, 3/2)
C33 (2/7, 1/3, 2/5) (1, 1, 1) (1,1,1) (1, 3/2, 2) (1/3, 2/5, 1/2) (2/5, 1/2, 2/3) (1/3, 2/5, 1/2)
C34 (1/2, 1, 3/2) (2/5, 1/2, 2/3) (1/2, 2/3, 1) (1,1,1) (2/3, 1, 2) (1/2, 1, 3/2) (2, 5/2, 3)
C35 (2/5, 1/2, 2/3) (2/3, 1, 2) (2, 5/2, 3) (1/2, 1, 3/2) (1,1,1) (2/3, 1, 2) (2/7, 1/3, 2/5)
C36 (2/3, 1, 2) (1, 1, 1) (3/2, 2, 5/2) (2/3, 1, 2) (1/2, 1, 3/2) (1,1,1) (1, 3/2, 2)
C37 (2/7, 1/3, 2/5) (2/3, 1, 2) (2, 5/2, 3) (1/3, 2/5, 1/2) (5/2, 3, 7/2) (1/2, 2/3, 1) (1,1,1)
Table 6: Fuzzy Pair-wise Comparison matrix at Sub-criteria level for (C3)

Sub-criteria C41 C42
C41 (1,1,1) (1/3, 2/5, 1/2)
C42 (2, 5/2, 3) (1,1,1)
Sub-criteria C51 C52 C53
C51 (1,1,1) (2, 5/2, 3) (2, 5/2, 3)
C52 (1/3, 2/5, 1/2) (1,1,1) (2/3, 1, 2)
C53 (1/3, 2/5, 1/2) (1/2, 1, 3/2) (1,1,1)
Sub-criteria C61 C62
C61 (1,1,1) (2/5, 1/2, 2/3)
C62 (3/2, 2, 5/2) (1,1,1)
Table 7: Fuzzy Pair-wise Comparison matrix at Sub-criteria level for (C4)
Table 8: Fuzzy Pair-wise Comparison matrix at Sub-criteria level for (C5)
Table 9: Fuzzy Pair-wise Comparison matrix at Sub-criteria level for (C6)

Sub-criteria C71 C72 C73 C74 C75
C71 (1,1,1) (1/2, 1, 3/2) (2, 5/2, 3) (1/2, 1, 3/2) (2, 5/2, 3)
C72 (2/3, 1, 2) (1,1,1) (1/3, 2/5, 1/2) (1/2, 1, 3/2) (1/3, 2/5, 1/2)
C73 (1/3, 2/5, 1/2) (2, 5/2, 3) (1,1,1) (3/2, 2, 5/2) (1, 1, 1)
C74 (2/3, 1, 2) (2/3, 1, 2) (2/5, 1/2, 2/3) (1,1,1) (1/3, 2/5, 1/2)
C75 (1/3, 2/5, 1/2) (2, 5/2, 3) (1, 1, 1) (2, 5/2, 3) (1,1,1)
Sub-criteria C81 C82 C83 C84 C85 C86
C81 (1,1,1) (1, 3/2, 2) (1/2, 2/3, 1) (5/2, 3, 7/2) (1, 1, 1) (1/2, 2/3, 1)
C82 (1/2, 2/3, 1) (1,1,1) (1/2, 1, 3/2) (2, 5/2, 3) (1/2, 1, 3/2) (1, 1, 1)
C83 (1, 3/2, 2) (2/3, 1, 2) (1,1,1) (5/2, 3, 7/2) (1/2, 2/3, 1) (5/2, 3, 7/2)
C84 (2/7, 1/3, 2/5) (1/3, 2/5, 1/2) (2/7, 1/3, 2/5) (1,1,1) (2, 5/2, 3) (3/2, 2, 5/2)
C85 (1, 1, 1) (2/3, 1, 2) (1, 3/2, 2) (1/3, 2/5, 1/2) (1,1,1) (1, 1, 1)
C86 (1, 3/2, 2) (1, 1, 1) (2/7, 1/3, 2/5) (2/5, 1/2, 2/3) (1, 1, 1) (1,1,1)
Table 10: Fuzzy Pair-wise Comparison matrix at Sub-criteria level for (C7)
Table 11: Fuzzy Pair-wise Comparison matrix at Sub-criteria level for (C8)

Sub-criteria C91 C92 C93 C94 C95
C91 (1,1,1) (3/2, 2, 5/2) (2/3, 1, 2) (3/2, 2, 5/2) (2/3, 1, 2)
C92 (2/5, 1/2, 2/3) (1,1,1) (2/3, 1, 2) (1/2, 2/3, 1) (5/2, 3, 7/2)
C93 (1/2, 1, 3/2) (1/2, 1, 3/2) (1,1,1) (2/3, 1, 2) (2/5, 1/2, 2/3)
C94 (2/5, 1/2, 2/3) (1, 3/2, 2) (1/2, 1, 3/2) (1,1,1) (3/2, 2, 5/2)
C95 (1/2, 1, 3/2) (2/7, 1/3, 2/5) (3/2, 2, 5/2) (2/5, 1/2, 2/3) (1,1,1)
Sub-criteria C101 C102 C103 C104
C101 (1,1,1) (5/2, 3, 7/2) (1/2, 2/3, 1) (1/2, 2/3, 1)
C102 (2/7, 1/3, 2/5) (1,1,1) (2/3, 1, 2) (2, 5/2, 3)
C103 (1, 3/2, 2) (1/2, 1, 3/2) (1,1,1) (1/2, 1, 3/2)
C104 (1, 3/2, 2) (1/3, 2/5, 1/2) (2/3, 1, 2) (1,1,1)
Table 12: Fuzzy Pair-wise Comparison matrix at Sub-criteria level for (C9)
Table 13: Fuzzy Pair-wise Comparison matrix at Sub-criteria level for (C10)

Sub-criteria C111 C112 C113 C114 C115
C111 (1,1,1) (1, 1, 1) (1, 3/2, 2) (2/5, 1/2, 2/3) (5/2, 3, 7/2)
C112 (1, 1, 1) (1,1,1) (2/7, 1/3, 2/5) (1, 1, 1) (3/2, 2, 5/2)
C113 (1/2, 2/3, 1) (5/2, 3, 7/2) (1,1,1) (1/2, 1, 3/2) (3/2, 2, 5/2)
C114 (3/2, 2, 5/2) (1, 1, 1) (2/3, 1, 2) (1,1,1) (2/3, 1, 2)
C115 (2/7, 1/3, 2/5) (2/5, 1/2, 2/3) (2/5, 1/2, 2/3) (1/2, 1, 3/2) (1,1,1)
Table 14: Fuzzy Pair-wise Comparison matrix at Sub-criteria level for (C11)

V(S1>S2) 0.136 V(S2>S1) 1.000 V(S3>S1) 1.000 V(S4>S1) 1.000 V(S5>S1) 1.000 V(S11>S1) 1.000
V(S1>S3) 0.446 V(S2>S3) 1.000 V(S3>S2) 0.663 V(S4>S2) 0.783 V(S5>S2) 0.571 V(S11>S2) 0.749
V(S1>S4) 0.336 V(S2>S4) 1.000 V(S3>S4) 0.905 V(S4>S3) 1.000 V(S5>S3) 0.889 V(S11>S3) 1.000
V(S1>S5) 0.540 V(S2>S5) 1.000 V(S3>S5) 1.000 V(S4>S5) 1.000 V(S5>S4) 0.796 V(S11>S4) 0.988
V(S1>S6) 0.223 V(S2>S6) 1.000 V(S3>S6) 0.782 V(S4>S6) 0.892 V(S5>S6) 0.680 V(S11>S5) 1.000
V(S1>S7) 0.804 V(S2>S7) 1.000 V(S3>S7) 1.000 V(S4>S7) 1.000 V(S5>S7) 1.000 V(S11>S6) 0.868
V(S1>S8) 0.758 V(S2>S8) 1.000 V(S3>S8) 1.000 V(S4>S8) 1.000 V(S5>S8) 1.000 V(S11>S7) 1.000
V(S1>S9) 0.322 V(S2>S9) 1.000 V(S3>S9) 0.891 V(S4>S9) 1.000 V(S5>S9) 0.782 V(S11>S8) 1.000
V(S1>S10) 0.589 V(S2>S10) 1.000 V(S3>S10) 1.000 V(S4>S10) 1.000 V(S5>S10) 1.000 V(S11>S9) 0.975
V(S1>S11) 0.352 V(S2>S11) 1.000 V(S3>S11) 0.917 V(S4>S11) 1.000 V(S5>S11) 0.808 V(S11>S10) 1.000
V(S6>S1) 1.000 V(S7>S1) 1.000 V(S8>S1) 1.000 V(S9>S1) 1.000 V(S10>S1) 1.000
V(S6>S2) 0.884 V(S7>S2) 0.387 V(S8>S2) 0.339 V(S9>S2) 0.765 V(S10>S2) 0.542
V(S6>S3) 1.000 V(S7>S3) 0.682 V(S8>S3) 0.672 V(S9>S3) 1.000 V(S10>S3) 0.863
V(S6>S4) 1.000 V(S7>S4) 0.589 V(S8>S4) 0.565 V(S9>S4) 1.000 V(S10>S4) 0.768
V(S6>S5) 1.000 V(S7>S5) 0.778 V(S8>S5) 0.784 V(S9>S5) 1.000 V(S10>S5) 0.975
V(S6>S7) 1.000 V(S7>S6) 0.482 V(S8>S6) 0.443 V(S9>S6) 0.889 V(S10>S6) 0.651
V(S6>S8) 1.000 V(S7>S8) 0.960 V(S8>S7) 1.000 V(S9>S7) 1.000 V(S10>S7) 1.000
V(S6>S9) 1.000 V(S7>S9) 0.576 V(S8>S9) 0.550 V(S9>S8) 1.000 V(S10>S8) 1.000
V(S6>S10) 1.000 V(S7>S10) 0.810 V(S8>S10) 0.821 V(S9>S10) 1.000 V(S10>S9) 0.754
V(S6>S11) 1.000 V(S7>S11) 0.602 V(S8>S11) 0.580 V(S9>S11) 1.000 V(S10>S11) 0.781
Table 15: The degree of possibility of main criteria

By following the same procedure, the pair-wise comparison matrix for sub criteria is constructed
with the help of expert team and the same is shown in Table 4–14, and the priority weights of
sub-criteria were calculated as given in Table 17.
The global composite priority weights given in Table 18 were calculated by multiplying the
priority weights of sub-criteria with those of their corresponding main criteria in the next higher
level of the hierarchy, indicating the ranking order of sub attribute / criteria. This indicates that
Logistics manpower (0.129618) is the most important sub criteria in selecting a 3PL provider,
followed by various other sub criteria.

Main Criterions Priority Weight
Cost of Service 0.0199
Reputation of the 3PL 0.1466
Long-term Relationships 0.0973
Finance 0.1148
Service level 0.0837
Infrastructure 0.1296
Third party logistics services (3PLS) 0.0568
Reverse logistics function (RLFs) 0.0498
Organizational role (OR) 0.1122
User satisfaction (US) 0.0795
IT Applications (IT) 0.1098
Table 16: The normalized priority weight vectors of the main criteria

Sub criterions Priority Weight Sub criterions Priority Weight
Freight Price 0.00000 Inventory replenishment (3PLS1) 0.28637
Terms of Payment 0.26376 Warehouse management (3PLS2) 0.09665
Extra Costs 0.19055 Shipment consolidation (3PLS3) 0.23681
IT capability 0.00000 Carrier selection (3PLS4) 0.12032
Size and quality of fixed assets 0.14885 Direct transportation services (3PLS5) 0.25985
Delivery performance 0.14846 Collection (RLF1) 0.21104
Employee satisfaction level 0.18761 Packing (RLF2) 0.18356
Flexibility in operations and delivery 0.06078 Storage (RLF3) 0.31072
Market share 0.01013 Sorting (RLF4) 0.13778
Geographic spread and access to retailers 0.34335 Transitional processing (RLF5) 0.11487
Market knowledge 0.35392 Delivery (RLF6) 0.04202
Experience in similar products 0.29260 Reclaim (OR1) 0.24589
Information sharing 0.26796 Recycle (OR2) 0.21925
Willingness to use logistics manpower 0.11385 Remanufacture (OR3) 0.16253
Trust and fairness 0.00257 Re use (OR4) 0.21172
Benefit and risk sharing 0.14177 Disposal (OR5) 0.16062
Quality of management 0.13627 Effective communication (US1) 0.28899
Compatibility 0.16918 Service improvement (US2) 0.26171
Cost of relationship 0.16840 Cost saving (US3) 0.24193
Logistics costs 0.00000 Overall working relations (US4) 0.20737
Financial stability 1.00000 Warehouse management (IT1) 0.27488
Reliability and timeliness 0.50000 Order management (IT2) 0.15537
Quality of service 0.00000 Supply chain planning (IT3) 0.31088
Flexibility and responsiveness 0.50000 Shipment and tracking (IT4) 0.23854
IT/IS capability 0.00000 Freight payment (IT5) 0.02032
Logistics manpower 1.00000
Table 17: The normalized priority weight vectors of the Sub criterions

GoalAttributes
(Level 1)
Priority Weight
(Level 1)
Sub-attributes
(Level 2)
Priority Weight
(Level 2)
Overall Priority
WeightRanking
Evaluation and
Selection
of 3 PL provider
(C1) 0.0199
C11 0.00000 0.000000 46
C12 0.26376 0.005251 36
C13 0.19055 0.003794 37
C14 0.00000 0.000000 46
C15 0.14885 0.002963 39
C16 0.14846 0.002956 40
C17 0.18761 0.003735 38
C18 0.06078 0.001210 44
(C2) 0.1466
C21 0.01013 0.001485 43
C22 0.34335 0.050349 4
C23 0.35392 0.051901 3
C24 0.29260 0.042908 5
(C3) 0.0973
C31 0.26796 0.026070 11
C32 0.11385 0.011076 29
C33 0.00257 0.000251 45
C34 0.14177 0.013793 26
C35 0.13627 0.013258 28
C36 0.16918 0.016459 21
C37 0.16840 0.016384 22
(C4) 0.1148C41 0.00000 0.000000 46
C42 1.00000 0.114818 2
(C5) 0.0837
C51 0.50000 0.041854 6
C52 0.00000 0.000000 46
C53 0.50000 0.041854 6
(C6) 0.1296C61 0.00000 0.000000 46
C62 1.00000 0.129618 1
Table 18: Overall ranking of sub criteria for
Evaluation and Selection of 3PL providerCONTD……...

GoalAttributes
(Level 1)
Priority Weight
(Level 1)
Sub-attributes
(Level 2)
Priority Weight
(Level 2)
Overall Priority
WeightRanking
Evaluation and
Selection
of 3 PL provider
(C7) 0.0568
C71 0.28637 0.016269 23
C72 0.09665 0.005491 35
C73 0.23681 0.013453 27
C74 0.12032 0.006835 33
C75 0.25985 0.014762 25
(C8) 0.0498
C81 0.21104 0.010506 30
C82 0.18356 0.009138 31
C83 0.31072 0.015468 24
C84 0.13778 0.006859 32
C85 0.11487 0.005719 34
C86 0.04202 0.002092 42
(C9)0.1122
C91 0.24589 0.027579 9
C92 0.21925 0.024591 12
C93 0.16253 0.018229 17
C94 0.21172 0.023747 13
C95 0.16062 0.018015 18
(C10) 0.0795
C101 0.28899 0.022961 14
C102 0.26171 0.020794 15
C103 0.24193 0.019222 16
C104 0.20737 0.016476 20
(C11) 0.1098
C111 0.27488 0.030184 8
C112 0.15537 0.017061 19
C113 0.31088 0.034137 7
C114 0.23854 0.026193 10
C115 0.02032 0.002232 41

Sub
criteria
Outstan
ding
Excell
ent
Very
Good
Above
Average
Aver
age
Below
AverageFair Poor
Very
Poor
Relative
vector
Idealized
vector
Out-
standing1 2 3 4 5 6 7 8 9 0.3245 1.0000
Ex-
cellent1/2 1 2 3 4 5 6 7 8 0.1822 0.5616
Very
Good1/3 1/2 1 2 3 4 5 6 7 0.1653 0.5095
Above
Average1/4 1/3 1/2 1 2 3 4 5 6 0.1142 0.3519
Average 1/5 1/4 1/3 1/2 1 2 3 4 5 0.0782 0.2411
Below
Average1/6 1/5 1/4 1/3 1/2 1 2 3 4 0.0536 0.1652
Fair 1/7 1/6 1/5 1/4 1/3 1/2 1 2 3 0.0370 0.1141
Poor 1/8 1/7 1/6 1/5 1/4 1/3 1/2 1 2 0.0260 0.0802
Very
Poor1/9 1/8 1/7 1/6 1/5 1/4 1/3 1/2 1 0.0189 0.0581
Table 19: Pairwise comparison judgment matrix for Nine-point rating scale
The Consistency Index for a matrix is calculated from Equation (9), as and, since for this matrix, the is
0.03499.
Using Equation (10), Consistency Ratio, 0.03499/1.45=0.02413. According to Saaty argues, In practical
decision situations inconsistency is “acceptable” if CR > 0.1

Criteria / Sub-criteria
Local
Weight
(LW)
Global
Weight
(GW)
3PL (A) 3PL (B) 3PL (C) 3PL (D)
Rating
scoresX GW
Rating
scoresX GW
Rating
scoresX GW
Rating
scoresX GW
Cost of Service (C1) 0.01991
Freight Price 0.00000 0.000000 0.5095 0.00000 0.3519 0.00000 0.1652 0.00000 0.3519 0.00000
Terms of Payment 0.26376 0.005251 0.5616 0.00295 1.0000 0.00525 0.5095 0.00268 0.5095 0.00268
Extra Costs 0.19055 0.003794 0.1141 0.00043 0.5095 0.00193 0.5616 0.00213 0.1652 0.00063
IT capability 0.00000 0.000000 1.0000 0.00000 0.1141 0.00000 0.3519 0.00000 0.1141 0.00000
Size and quality of fixed assets 0.14885 0.002963 0.1141 0.00034 0.5095 0.00151 0.2411 0.00071 0.5095 0.00151
Delivery performance 0.14846 0.002956 0.3519 0.00104 0.1141 0.00034 0.1652 0.00049 0.5616 0.00166
Employee satisfaction level 0.18761 0.003735 0.2411 0.00090 0.3519 0.00131 0.5095 0.00190 0.1141 0.00043
Flexibility in operations and delivery 0.06078 0.001210 0.5095 0.00062 0.1652 0.00020 0.1652 0.00020 0.5095 0.00062
Reputation of the 3PL (C2) 0.14664
Market share 0.01013 0.001485 0.1652 0.00025 0.5095 0.00076 0.5616 0.00083 0.1652 0.00025
Geographic spread and access to retailers 0.34335 0.050349 0.1652 0.00832 0.5616 0.02828 0.1652 0.00832 0.3519 0.01772
Market knowledge 0.35392 0.051901 0.5616 0.02915 0.1141 0.00592 0.5095 0.02644 0.1141 0.00592
Experience in similar products 0.29260 0.042908 0.1141 0.00490 0.2411 0.01035 0.1652 0.00709 0.5095 0.02186
Table 20: Overall scores of 3PL providers

Criteria / Sub-criteria
Local
Weight
(LW)
Global
Weight
(GW)
3PL (A) 3PL (B) 3PL (C) 3PL (D)
Rating
scores
X GW
Rating
scores
X GW
Rating
scores
X GW
Rating
scores
X GW
Long-term Relationships (C3) 0.09729
Information sharing 0.26796 0.026070 0.1652 0.00431 0.5095 0.01328 0.3519 0.00917 0.1141 0.00297
Willingness to use logistics manpower 0.11385 0.011076 0.5095 0.00564 0.1141 0.00126 0.2411 0.00267 0.2411 0.00267
Trust and fairness 0.00257 0.000251 0.1652 0.00004 0.1652 0.00004 0.5095 0.00013 0.5095 0.00013
Benefit and risk sharing 0.14177 0.013793 0.3519 0.00485 0.5616 0.00775 0.5616 0.00775 0.5616 0.00775
Quality of management 0.13627 0.013258 0.5616 0.00745 0.1652 0.00219 0.1652 0.00219 0.1652 0.00219
Compatibility 0.16918 0.016459 0.2411 0.00397 0.3519 0.00579 0.1141 0.00188 0.1141 0.00188
Cost of relationship 0.16840 0.016384 0.5095 0.00835 0.2411 0.00395 0.5095 0.00835 0.5095 0.00835
Finance (C4) 0.11482
Logistics costs 0.00000 0.000000 0.1141 0.00000 0.5095 0.00000 0.1141 0.00000 0.3519 0.00000
Financial stability 1.00000 0.114818 0.3519 0.04040 0.5616 0.06448 0.2411 0.02769 0.2411 0.02769
Service level (C5) 0.08371
Reliability and timeliness 0.50000 0.041854 0.5095 0.02133 0.3519 0.01473 0.3519 0.01473 0.5616 0.02350
Quality of service 0.00000 0.000000 1.0000 0.00000 0.1141 0.00000 0.5616 0.00000 0.1141 0.00000
Flexibility and responsiveness 0.50000 0.041854 0.5616 0.02350 0.5095 0.02133 0.1141 0.00478 0.5095 0.02133

Criteria / Sub-criteria
Local
Weight
(LW)
Global
Weight
(GW)
3PL (A) 3PL (B) 3PL (C) 3PL (D)
Rating
scores
X GW
Rating
scores
X GW
Rating
scores
X GW
Rating
scores
X GW
Infrastructure (C6) 0.12962
IT/IS capability 0.00000 0.000000 0.1652 0.00000 0.1141 0.00000 0.5095 0.00000 0.1141 0.00000
Logistics manpower 1.00000 0.129618 0.5095 0.06604 0.5616 0.07279 0.1652 0.02142 0.1652 0.02142
Third party logistics services (C7) 0.05681
Inventory replenishment 0.28637 0.016269 0.1141 0.00186 1.0000 0.01627 0.1141 0.00186 0.5616 0.00914
Warehouse management 0.09665 0.005491 0.5616 0.00308 0.1652 0.00091 0.5095 0.00280 0.2411 0.00132
Shipment consolidation 0.23681 0.013453 0.1141 0.00154 0.1141 0.00154 0.1652 0.00222 0.5095 0.00685
Carrier selection 0.12032 0.006835 0.5616 0.00384 0.3519 0.00241 1.0000 0.00684 0.1141 0.00078
Direct transportation services 0.25985 0.014762 0.3519 0.00519 0.5095 0.00752 0.5095 0.00752 1.0000 0.01476
Reverse logistics function (C8) 0.04978
Collection 0.21104 0.010506 0.2411 0.00253 0.1141 0.00120 0.2411 0.00253 0.1652 0.00174
Packing 0.18356 0.009138 0.1652 0.00151 0.5616 0.00513 0.1141 0.00104 0.5095 0.00466
Storage 0.31072 0.015468 0.5095 0.00788 0.1141 0.00177 0.5616 0.00869 0.5616 0.00869
Sorting 0.13778 0.006859 1.0000 0.00686 0.1652 0.00113 0.1652 0.00113 0.1141 0.00078
Transitional processing 0.11487 0.005719 0.1652 0.00094 0.5095 0.00291 0.1652 0.00094 0.3519 0.00201
Delivery 0.04202 0.002092 0.1141 0.00024 0.1652 0.00035 0.5095 0.00107 0.1141 0.00024
Criteria / Sub-criteria
Local
Weight
(LW)
Global
Weight
(GW)
3PL (A) 3PL (B) 3PL (C) 3PL (D)
Rating
scoresX GW
Rating
scoresX GW
Rating
scoresX GW
Rating
scoresX GW
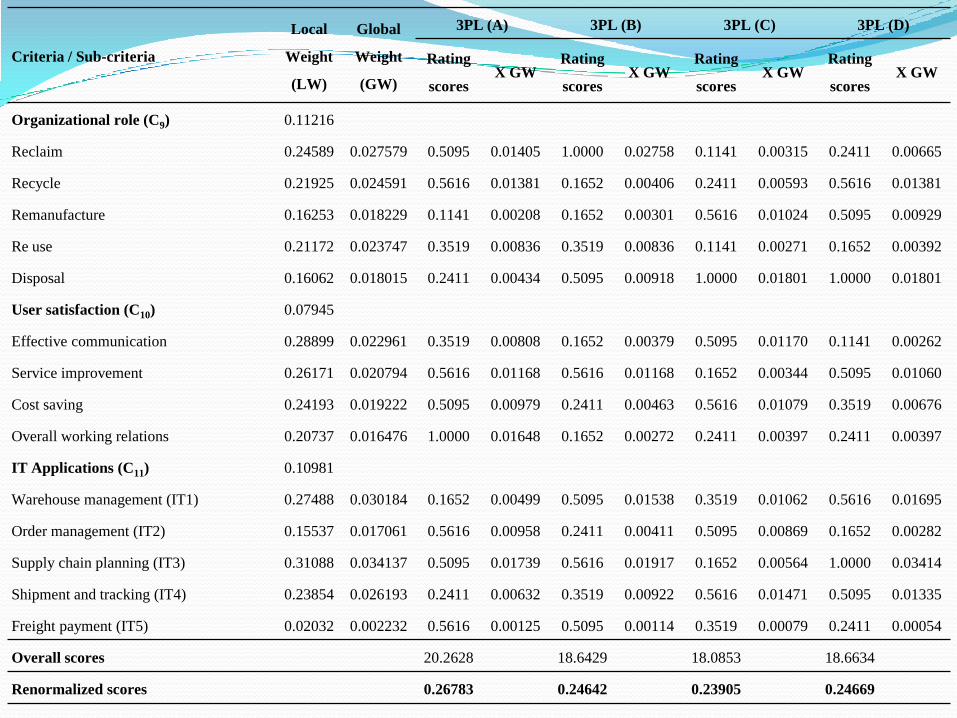
Organizational role (C9) 0.11216
Reclaim 0.24589 0.027579 0.5095 0.01405 1.0000 0.02758 0.1141 0.00315 0.2411 0.00665
Recycle 0.21925 0.024591 0.5616 0.01381 0.1652 0.00406 0.2411 0.00593 0.5616 0.01381
Remanufacture 0.16253 0.018229 0.1141 0.00208 0.1652 0.00301 0.5616 0.01024 0.5095 0.00929
Re use 0.21172 0.023747 0.3519 0.00836 0.3519 0.00836 0.1141 0.00271 0.1652 0.00392
Disposal 0.16062 0.018015 0.2411 0.00434 0.5095 0.00918 1.0000 0.01801 1.0000 0.01801
User satisfaction (C10) 0.07945
Effective communication 0.28899 0.022961 0.3519 0.00808 0.1652 0.00379 0.5095 0.01170 0.1141 0.00262
Service improvement 0.26171 0.020794 0.5616 0.01168 0.5616 0.01168 0.1652 0.00344 0.5095 0.01060
Cost saving 0.24193 0.019222 0.5095 0.00979 0.2411 0.00463 0.5616 0.01079 0.3519 0.00676
Overall working relations 0.20737 0.016476 1.0000 0.01648 0.1652 0.00272 0.2411 0.00397 0.2411 0.00397
IT Applications (C11) 0.10981
Warehouse management (IT1) 0.27488 0.030184 0.1652 0.00499 0.5095 0.01538 0.3519 0.01062 0.5616 0.01695
Order management (IT2) 0.15537 0.017061 0.5616 0.00958 0.2411 0.00411 0.5095 0.00869 0.1652 0.00282
Supply chain planning (IT3) 0.31088 0.034137 0.5095 0.01739 0.5616 0.01917 0.1652 0.00564 1.0000 0.03414
Shipment and tracking (IT4) 0.23854 0.026193 0.2411 0.00632 0.3519 0.00922 0.5616 0.01471 0.5095 0.01335
Freight payment (IT5) 0.02032 0.002232 0.5616 0.00125 0.5095 0.00114 0.3519 0.00079 0.2411 0.00054
Overall scores 20.2628 18.6429 18.0853 18.6634
Renormalized scores 0.26783 0.24642 0.23905 0.24669

After renormalizing the overall scores in Table 20, S1 was determined to be the most
suitable alternative amongst all four Third party logistics Service Provider because it had the
highest overall score (0.26783) among the four alternatives. Hence, Alternative sorting is as
following
S1 > S4 > S2 > S3
It means that S1 is the best Third party logistics Service Provider.

Aforesaid work delivers a structured, methodological framework for multi-criteria
decision support model in evaluating and selecting the best 3PL provider as
selecting appropriate and desirable 3PL providers has become a critical strategic
decision. The proposed methodology is easy to implement and quite reliable for
ranking the alternatives. Applicability of the proposed approach has been shown
in an automobile company for the selection of the third party logistic provider.
The technique can also be applied effectively to help any managerial decision-
making. The findings provide valuable insights for logistics practitioners,
academicians and educators, as well as policy makers and also integrates selection
criteria and sub-criteria under the global supply chain environment. For further
research, other multi-criteria evaluation methods that have been recently proposed
in a fuzzy environment like fuzzy TOPSIS or fuzzy outranking methods can be
used and the obtained results can be compared with the ones found in this paper.
CONCLUSION

1.0 Jianyuan Yan, Peggy E. Chaudhry and Sohail S. Chaudhry (2003) ‗A model of a decision support
system based on case-based reasoning for third-party logistics evaluation‘, Expert Systems, Vol. 20,
No. 4, pp. 196-207.
2.0 He Zhang, Xiu Li, Wenhuang Liu, Bing LI, Zhihong Zhang (2004) ‗An Application of the AHP in
3PL Vendor Selection of a 4PL System‘, IEEE International Conference on Systems, Man and
Cybernetics, pp. 1255-1260.
3.0 Soon-hoo So, JaeJon Kim, KiJu Cheong, Geon Cho (2006) ‗Evaluating The Service Quality Of Third
party Logistics Service Providers Using The Analytic Hierarchy Process‘, Journal of Information
Systems and Technology Management, Vol. 3, No. 3, pp. 261-270.
4.0 Hasan Karagul, M. Murat Albayrakoglu (2007) ‗Selecting A Third-Party Logistics Provider for An
Automotive Company: An Analytic Hieararchy Process Model‘, ISAHP 2007, Viña Del Mar, Chile,
August 3-6, 2007.
5.0 Konstantinos Selviaridis and Martin Spring (2007) ‗Third party logistics: a literature review and
research agenda‘, The International Journal of Logistics Management, Vol. 18 No. 1, pp. 125-150.
REFERENCES

Cont……
6.0 Transport Intelligence (2004), European Logistics Strategies 2004, Transport
Intelligence Ltd, Brinkworth.
7.0 Işiklar G, Alptekin E, Büyüközkan G (2007) ‗Application of a hybrid intelligent decision
support model in logistics outsourcing‘, Computers and Operations Research, Vol. 34,
(2007) pp. 3701 – 3714.
8.0 Hakan Göl, Bülent Çatay, (2007) ‗Third-party logistics provider selection: insights from
a Turkish automotive company‘, Supply Chain Management: An International Journal,
Vol. 12, No. 6, pp. 379 – 384.
9.0 Forrest B. Green, Will Turner, Stephanie Roberts, Ashwini Nagendra, Eric Wininger
(2008) ‗A Practitioner‘s Perspective On The Role Of A Third-Party Logistics Provider‘,
Journal of Business & Economics Research,Vol. 6, No. 6, pp. 9-14.
10.0 Amer Hamdan, K.J. (Jamie) Rogers (2008) ‗Evaluating the efficiency of 3PL logistics
operations‘, International Journal of Production Economics, Vol. 113, pp. 235–244.

11.0 Jao-Hong Cheng, Shiuann-Shuoh Chen, Yu-Wei Chuang (2008) ‗Using Fuzzy Multiple Criterion
Methods for Fourth Party Logistics Criteria Selection‘, 7th WSEAS Int. Conf. on Artificial
Intelligence, Knowledge Engineering and Data Bases (AIKED'08), University of Cambridge, UK,
Feb 20-22, 2008, pp. 282-288.
12.0 Selçuk Perçin, (2009), ‗Evaluation of third-party logistics (3PL) providers by using a two-phase
AHP and TOPSIS methodology‘, Benchmarking: An International Journal, Vol. 16, No. 5 pp. 588 –
604.
13.0 Erdal Çakir, Hakan Tozan, Ozalp Vayvay (2009) ‗A Method For Selecting Third Party Logistic
Service Provider Using Fuzzy AHP‘, Journal of Naval Science and Engineering, Vol. 5, No.3, pp.
38-54.
14.0 Shuang Liu and Zhongmin Fang (2009) ‗Study on the Relationship between Customer Satisfaction
and 3PL Costs‘, International Journal of Business and Management, Vol. 4, No. 6, pp. 23-28.
15.0 G. Kannan, (2009) ‗Fuzzy approach for the selection of third party reverse logistics provider‘, Asia
Pacific Journal of Marketing and Logistics, Vol. 21, No. 3, pp. 397 – 416.
16.0 Rajbir Singh Bhatti, Pradeep Kumar and Dinesh Kumar (2010) ‗Analytical modeling of third party
service provider selection in lead logistics provider environments‘, Journal of Modelling in
Management,Vol. 5, No. 3, pp. 275-286.
Cont……

17.0 Reza Farzipoor Saen, (2010) ‗A New Model for Ranking 3PL Providers‘, Australian
Journal of Basic and Applied Sciences, Vol. 4, No. 8, pp. 3762-3769.
18.0 Reza Farzipoor Saen (2010) ‗A new model for selecting third-party reverse logistics
providers in the presence of multiple dual-role factors‘, International Journal of
Advanced Manufacturing Technology, Vol. 46, pp. 405–410.
19.0 SoonHu Soh (2010) ‗A decision model for evaluating third-party logistics providers using
fuzzy analytic hierarchy process‘, African Journal of Business Management, Vol. 4, No.
3, pp. 339-349.
20.0 Rajesh Gupta, Anish Sachdeva, Arvind Bhardwaj (2010) ‗Selection of 3pl Service
Provider using Integrated Fuzzy Delphi and Fuzzy TOPSIS‘, Proceedings of the World
Congress on Engineering and Computer Science 2010 (WCECS 2010), October 20-22,
2010, San Francisco, USA, Vol. 2, pp. 1092-1097.
Cont……

21.0 Kai-Ying Chen and Wan-Ting Wu (2011) ‗Applying Analytic Network Process In Logistics Service
Provider Selection– A Case Study Of The Industry Investing In Southeast Asia‘, International
Journal of Electronic Business Management, Vol. 9, No. 1, pp. 24-36.
22.0 Ji-Feng Ding and Chien-Chang Chou (2011) ‗Middle managers selection for third-party logistics
service providers‘, International Journal of the Physical Sciences, Vol. 6, No. 3, pp. 610-619.
23.0 Ezutah Udoncy Olugu and Kuan Yew Wong (2011) ‗Fuzzy logic evaluation of reverse logistics
performance in the automotive industry‘, Scientific Research and Essays, Vol. 6, No. 7, pp. 1639-
1649.
24.0 Rajesh Gupta, Anish Sachdeva, Arvind Bhardwaj (2011) ‗Criteria of Selecting 3pl Provider: A
Literature Review‘, World Academy of Science, Engineering and Technology, Vol. 59, pp. 2020-
2024.
25.0 Ozden Bayazit (2012) ‗An Application of The AHP In Selection of A Third Party Logistics
Provider‘, The 2012 Orlando International Academic Conference, Orlando, Florida, USA, pp. 315-
317.
Cont……

26.0 Jui-Tsung Wong (2012) ‗DSS for 3PL provider selection in global supply chain: combining the
multi-objective optimization model with experts‘ opinions‘, Journal of Intelligent Manufacturing,
Vol. 23, pp. 599–614.
27.0 Fachao Lin, Ling Li, Chenxia Jin, Ruijiang Wanga, Hong Wange, LiliYang (2012) ‗A 3PL supplier
selection model based on fuzzy sets‘, Computers and Operations Research, Vol. 39, pp. 1879–1884.
28.0 Lu Shan (2012) ‗Research on Green Logistics Service Providers Selection Based on Intuitionistic
Language Fuzzy Entropy‘, Journal Of Computers, Vol. 7, No. 2, pp. 540-546.
29.0 Luo D. An eigenvector method for grey decision-making. System Engineering — Theory &
Practice, 2005, 25(4): 67–71.
30.0 Luo D. Analysis Method for Grey Decision-making Problems. Zhengzhou: Yellow River Water
Conservation Press, 2005.
31.0 Liu S F, Dang Y G, Fang Z G. Grey System Theory and Application. Beijing: Science Press, 2005.
32.0 Bu G Z, Zhang Y W. Grey fuzzy comprehension evaluation method based on interval numbers of
three parameters. System Engineering and Electronics, 2001, (23)9: 43–62.
33.0 Luo D, Liu S F. Grey incidence decision-making with incomplete information. Journal of Applied
Sciences, 2005(4): 408–412.
Cont……

34.0 Luo D (2009) Decision-making methods with three-parameter interval grey number, Systems
Engineering-Theory & Practice, Vol. 29, Issue 1, pp. 124-130.
35.0 Dang Luo, Xia Wang (2012) The multi-attribute grey target decision method for attribute value
within three-parameter interval grey number, Applied Mathematical Modelling 36 (2012) 1957–
1963.
36.0 Rajesh Gupta, Anish Sachdeva, Arvind Bhardwaj (2010) ‗Selection of 3pl Service Provider using
Integrated Fuzzy Delphi and Fuzzy TOPSIS‘, Proceedings of the World Congress on Engineering
and Computer Science 2010 (WCECS 2010), October 20-22, 2010, San Francisco, USA, Vol. 2, pp.
1092-1097.
37.0 Hao Tien Liu, Wei-Kai Wang (2009), ‗An integrated fuzzy approach for provider evaluation and
selection in third-party logistics‘, Expert Systems with Applications, Vol. 36, pp. 4387–4398.
38.0 Koh S.C.L., Z. Tan (2005), ‗Using e-commerce to gain a competitive advantage in 3PL enterprises
in China‘, International Journal of Logistics Systems and Management, Vol. 1, No. 2/3, pp.187-210.
39.0 Qureshi M. N., Kumar Pradeep, Kumar Dinesh (2009a), ‗Selection of 3PL service providers: a
combined approach of AHP and Graph theory‘, International Journal of Services Technology and
Management, Vol. 12, No. 1, pp. 35 – 60.
Cont……

40.0 Qureshi M. N., Kumar Pradeep, Kumar Dinesh (2009b), ‗Framework for benchmarking logistics
performance using fuzzy AHP‘, International Journal of Business Performance and Supply Chain
Modelling (IJBPSCM), Vol. 1, No. 1, pp. 82 - 98.
41.0 Vinay V.P., Kannan Govindan, Sasikumar P. (2009), ‗Conceptual study on 3PL/4PL/ new trends for
service industry‘, International Journal of Services Technology and Management, Vol.12, No.1, pp.3
-22.
42.0 R. Rajesh, S. Pugazhendhi, K. Ganesh (2010), ‗A survey of literature on selection of third party
logistics service provider‘, International Journal of Business Performance and Supply Chain
Modelling (IJBPSCM), Vol. 2, No. 2, pp.146 – 170.
43.0 Wang, Q., Zantow, K., Lai, F. and Wang, X. (2006), ‗Strategic postures of third party logistics
providers in Mainland China‘, International Journal of Physical Distribution & Logistics
Management, Vol. 36, No. 10, pp. 793-819.
44.0 Zhou, G., Min, H., Xu, C. and Cao, Z. (2008), ‗Evaluating the comparative efficiency of Chinese
third-party logistics providers using data envelopment analysis‘, International Journal of Physical
Distribution & Logistics Management, Vol. 38, No. 4, pp. 262-79.
Cont……

45.0 Hsiao, H.I., Kemp, R.G.M., van der Vorst, J.G.A.J. and Omta, S.W.F. (2010), ―A classification of
logistics outsourcing levels and their impact on service performance: evidence from the food
processing industry‖, International Journal of Production Economics, Vol. 124, pp. 75-86.
46.0 Alonso, J. A., Lamata, M. T., (2006), ‗Consistency in the Analytic Hierarchy Process: A new
approach‘, International Journal of Uncertainty, Fuzziness and Knowledge based systems, Vol. 14,
No. 4, pp. 445-459.
47.0 Ramik, J., Korviny, P., (2010), ‗Inconsistency of pairwise comparison matrix with fuzzy elements
based on geometric mean‘, Fuzzy Sets and Systems, Vol. 161, pp.1604–1613.
48.0 Saaty, T.L., (1980), ‗The Analytic Hierarchy Process‘, New York.
49.0 Saaty, T.L., (1991), ‗Multicriteria Decision Making: The Analytical Hierarchy Process‘, RWS
Publications, Pittsburgh, Vol. 1.
50.0 Saaty, T.L., (1994), ‗Fundamentals of Decision Making and Priority Theory with the Analytic
Hierarchy Process‘, RWS Publications Pittsburgh
51.0 Noci, G., & Toletti, G., (2000), ‗Selecting quality-based programmes in small firms: A comparison
between the fuzzy linguistic approach and the analytic hierarchy process‘, International Journal of
Production Economics, Vol. 67, pp. 113–133.
Cont……

52.0 Zaim, S., Sevkli, M. and Tarim, M., (2003), ‗Fuzzy Analytic Hierarchy Based Approach for Supplier
Selection‘, Journal of Euro marketing, Vol 12, pp. 147–176.
53.0 Govindan, K., Murugesan, P., (2011), ‗Selection of third-party reverse logistics provider using fuzzy
extent analysis‘, Benchmarking: An International Journal, Vol. 18, No. 1, pp. 149-167.
54.0 Kahraman, C., Cebeci, U., Ulukan, Z.(2003), ‗Multi-criteria supplier selection using fuzzy AHP‘,
Logistics Information Management, Vol. 16, No. 6, pp. 382- 394.
55.0 Chang, Da-Yong (1996), ‗Application of the extent analysis method on fuzzy AHP‘, European
Journal of Operational Research, Vol. 65, pp. 649-655.
56.0 Cakir, E., Tozan, H., Vayvay, O., (2009), ‗A method for selecting third party logistic service provider
using fuzzy AHP‘, Journal of Naval Science and Engineering, Vol. 5, No.3, pp. 38-54.
57.0 Rabinovich, E., Windle, R., Dresner, M., & Corsi, T. (1999) ‗Outsourcing of integrated logistics
functions: An examination of industry practices‘, International Journal of Physical Distribution and
Logistics Management,Vol. 29, No. 6, pp. 353–373.
58.0 [Source: http://logistics.about.com/od/strategicsupplychain/a/select_3PL.htm].
Cont……