Embed Size (px)
Citation preview

U.S. Department of Transportation National Highway Traffic Safety Administration
People Saving People http://www.nhtsa.dot.gov
A Florida Validation Study of the
Standardized Field Sobriety Test (S.F.S.T.)
Battery
Marcelline Burns, Ph.D.
Southern California Research Institute Los Angeles, California
Teresa Dioquino, Sergeant Pinellas County Sheriff s Office
Largo, Florida

This research project was prepared for the State Safety Office, Department of Transportation, State of Florida in cooperation with the National Highway Traffic Safety Administration, U.S. Department of Transportation and/or Federal Highway (under project number AL-97-05-14-01). The conclusions and opinions expressed in these reports are those of the subgrantee and do not necessarily represent those of the State of Florida, Department of Transportation, State Safety Office, the U.S. Department of Transportation or any other agency of the State or Federal Government.

PROJECT STAFF
Institute of Police Technology and Management University of North Florida
Russell Arend Director Contractor
Pinellas County Sheriff s Office
Teresa R. Dioquino Sergeant Project Manager
Southern California Research Institute
Marcelline Burns, Ph.D. Dary Fiorentino, M.A. Theresa Brown Shana Nguyen Cindy Seymour
InvestigatorGraphics
ConsultantSenior Data
ProcessorData ProcessorData Processor

TABLE OF CONTENTS
I. INTRODUCTION II. STUDY BACKGROUND AND RATIONALE III. STUDY DESIGN IV. METHOD
A. SFST Standardization B. Data Integrity
C. Data Completeness
D. Data Analysis V. RESULTS
A. Total Sample and Measured BACs 1. Arrested Drivers 2. Released Drivers 3. Drivers with Suspended/Revoked Licenses
4. Refusals B. Officers Decisions
1. Officers Correct and Incorrect Decisions for Drivers with Measured BACs
2. Officers Decisions When Other Tests Were Used in Addition to the SFSTs C. Field Sobriety Tests
1. Horizontal Gaze Nystagmus (HGN) 2. Walk-and-Turn Test (WAT) 3. One-Leg Stand (OLS)
D. Officers
E. Observers F. Drivers
1. Gender 2. Ages 3. Ethnicity 4. Employment Status
5. Vehicles G. Conditions and Circumstances of Stops
1. Day of Week and Time of Day 2. Weather, Roadway and Test-surface Conditions 3. Reason for Stop
H. Reasons for Vehicle Stop, by BAC VI. SUMMARY AND DISCUSSION REFERENCES

APPENDICES
I Demographics of Pinellas County, Florida The Pinellas County Sheriff s Office
II Florida Statute, Driving Under the Influence
III Study Forms
IV Case Logs
V Drugs Reported by Drivers
VI "Iguana Driving"

TABLE OF TABLES
TABLE
1 Participating Pinellas County Sheriff Deputies Ranked by Years of Law Enforcement Experience
2 Participating Pinellas County Sheriff Deputies Ranked by Estimated Number of DUI Arrests
3 Disposition of 379 Cases
4 Mean SFST Scores, BACs, and Ages by Case Disposition
5 Observers
6 Driver Ages
7 Driver Ethnicity
8 Driver Employment Status
9 Reasons for Stops, by BAC Groups

TABLE OF FIGURES
FIGURE
1 Decision Matrix
2 Study Hypothesis
3 Case Disposition
4 Measured Positive BACs
5 Decision Matrix, 256 Cases with BAC Measurements
6 Officer Decisions (N = 256)
7 Decision Matrix, 41 Cases with Measured BAC and Use of Other Tests
8 Officer Decisions with Tests in Addition to SFSTs (N = 41)
9 BAC Distribution-One Leg Stand
10 Officer Experience in Law Enforcement
11 Officers DUI Arrests
12 Driver Ages

I. INTRODUCTION
During the years 1975 - 1981, a battery of field sobriety tests was developed under funding by the National Highway Traffic Safety Administration (NHTSA), U.S. Department of Transportation (Burns and Moskowitz, 1977; Tharp, Burns, and Moskowitz, 1981). The tests include Walk-and-Turn (WAT), One-Leg Stand (OLS), and Horizontal Gaze Nystagmus (HGN). NHTSA subsequently developed a training curriculum for the three-test battery, and initiated training programs nationwide. Traffic officers in all 50 states now have been trained to administer the Standardized Field Sobriety Tests (SFSTs) to individuals suspected of impaired driving and to score their performance of the tests.
At the time the SFSTs were developed, the statutory blood alcohol concentration (BAC) for driving was 0.10% throughout the United States. The limit now has been lowered in a number of states to 0.08% for the general driving population. “Zero tolerance” is in effect in some jurisdictions for drivers under age 21, and commercial drivers risk losing their licenses at a BAC of 0.04.% It is likely that additional states will enact stricter statutory limits for driving. In light of these changes, a re-examination of the battery was undertaken by McKnight et al. (1995). They reported that the test battery is valid for detection of low BACs and that no other measures or observations offer greater validity for BACs of 0.08% and higher.
The three tests have been incorporated into Drug Influence Evaluations (DIEs) which are conducted by certified Drug Recognition Experts (DREs) whenever an individual is suspected of being drug-impaired. As part of a DRE evaluation, the SFSTs provide important evidence of drug impairment and contribute to the DRE’s three-part opinion:
Is the individual impaired by a drug or drugs? If yes, is the impairment drug-related? If yes, what category or categories of drug account for the impairment?
A study was conducted in Colorado to examine the validity of the SFSTs when used by experienced officers in the field (Burns and Anderson, 1995). The design of the study insured that roadside testing was limited to the three-test battery, and that officers’ decisions were not influenced either by the driver’s performance of other behavioral tests or by measurement of BAC with a preliminary breath tester (PBT). The obtained data demonstrated that more than 90% of the officers’ decisions to arrest drivers were confirmed by analysis of breath and blood specimens.
A recently-reported NHTSA-funded study was conducted by Anacapa Sciences, Inc. in collaboration with the San Diego Police Department to examine the validity of the SFSTs for both 0.08% and 0.04% (Stuster and Burns, 1997). Officers’ estimates of whether a driver’s BAC was above or below 0.08% or 0.04% were found to be more than 90% correct.
The Colorado and California studies provide relevant and current field data. The validity of the tests when they are administered in the context of drug evaluations was examined

in a retrospective analysis of the records of the Phoenix (DRE Unit (Adler and Burns, 1994). It was found that a suspect’s performance of the tests provides valid cues of drug impairment.
The study reported here was conducted in collaboration with the Pinellas County Sheriff’s Office (PCSO) and expands the examination of the SFSTs to the State of Florida. An overview of PCSO and the demographics for Pinellas County can be found in Appendix I.
II. STUDY BACKGROUND AND RATIONALE
During the early years of SFST use by law enforcement, legal challenges were relatively infrequent. For more than a decade now, however, defense counsel in many jurisdictions has sought to prevent the admission of testimony about a defendant’s performance of the three tests. The objections, which continue to be persistent and vigorous in 1997, typically focus on test validity and reliability as demonstrated in the original laboratory research. It is entirely appropriate to inquire whether that early research to identify a best set of sobriety tests was conducted with scientific rigor. Beyond that inquiry, however, the data, which were obtained in a laboratory setting and now are more than twenty years old, are of little interest. Certainly, they are only marginally relevant to current roadside use of the tests. The question which begs to be addressed in 1997 is whether the tests are valid and reliable indices of the presence of alcohol when they are used at roadside under present day traffic and law enforcement conditions.
Experience and confidence have a direct bearing on an officer’s skill with roadside tests. In this regard, note that the officers who participated in the early SCRI studies had been only recently and briefly (4 hrs) trained to administer the test battery. There had been no time for them to use the tests in the field where they might have developed confidence in decisions based on them. Nonetheless, their decisions were 76% correct in the first study and 81% correct in the second study.
At this point in time, many traffic officers have had ten or more years’ experience with the test battery and many report that they confidently rely on them. Since it seems unlikely in the extreme that they would continue to rely on tests which repeatedly lead to decision errors, it is a reasonable assumption that more often than not their roadside decisions to arrest are supported by measured BACs. Whether their decisions to release are correct is largely unknown since the released driver’s BAC generally is not measured.
Traffic officers are charged with the detection and arrest of impaired drivers. Although their roadside duties are central to roadway safety, recognition of alcohol-impaired drivers can be difficult and is, therefore, subject to error. If officers are to effectively meet this particular enforcement responsibility, they need to augment their general observations of suspects with sensitive, accurate sobriety tests. The tests not only aid in the removal of dangerously impaired drivers from the roadway, they also protect the driver who is not alcohol or drug impaired from being improperly detained. Thus, rigorous examinations of the SFSTs are important to traffic safety.

Whether an officer’s decision about a suspected DUI driver is correct or incorrect is determined by measurement of BAC and the jurisdiction’s statute. The Florida statute (Appendix II) states that a person is guilty of driving under the influence of alcohol if he1 “has a blood-alcohol level of 0.08 or more grams of alcohol per 100 milliliters of blood” or the equivalent measure “a breath-alcohol level of 0.08 or more grams of alcohol per 210 liters of breath”. In commonly-used nomenclature, a driver in the State of Florida is subject to arrest if he is operating a motor vehicle when his BAC is 0.08% or higher.
Roadside decisions may be correct or incorrect, each under two different circumstances as illustrated in Figure 1. An arrest is “correct” and is tallied in Cell 1 when a breath test confirms that the suspect’s BAC is at or above the statutory limit of 0.08%. Similarly, a release is “correct” and is tallied in Cell 4 when the driver’s BAC is below 0.08.’
An incorrect arrest has occurred if the BAC of a driver taken into custody for DUI is found to be less than 0.08% (Cell 3). An incorrect release has occurred if the released driver’s BAC is equal to or greater than 0.08% (Cell 2).
In this context, the cell labels “Correct” and “Incorrect” refer only to the BAC criterion, and an incorrect decision occurs when the measured BAC does not support the officer’s decision. In the broader sense of impairment, the labels may or may not accurately reflect correctness or error. It is important to understand that a driver incorrectly-arrested in terms of the BAC standard of 0.08% may have been dangerously impaired by a lower BAC or by some other drug or condition.
FIGURE 1 Decision Matrix
Decisions to arrest for DUI (Cells 1 and 3) can be readily evaluated. Unless a driver refuses to provide a specimen for BAC measurement, the question of accuracy is quickly resolved. Information typically is not available, however, to determine whether non-arrested drivers were correctly released. Because BAC data for released drivers are difficult to obtain, they rarely appear in assessments of officer performance, but a validation study of the SFSTs requires information to fill all four cells of the matrix.
1 In the interest of brevity and readability, the male gender will be used throughout this report. The authors expressly acknowledge, however, that many traffic officers are female and recognize that many impaired drivers are female.

III. STUDY DESIGN
The hypothesis of this study appears below.
FIGURE 2 Study Hypothesis
The design of the study was dictated by the need to insure:
standardization of SFST administration and interpretation, data integrity, and data completeness
The compromise of any of these requirements would have made interpretation of the obtained data both difficult and subject to question.
Note that the study drivers were a subset drawn from the total population of drivers. The inclusion and exclusion criteria were determined by the primary study objective; i.e., an assessment of the accuracy of officers’ arrest and release decisions based on the SFSTs. Thus, throughout the study period, drivers on the roadways within Pinellas County (who were not involved in a traffic crash) were included in the study if 1) they were detained at roadside and 2) due to evidence of impairment they were asked to perform the SFSTs.
There undoubtedly were alcohol-impaired drivers on Pinellas County roadways during the study period who entirely escaped detection. It is also possible that impaired drivers were stopped, but their impaired states were not recognized and they were not asked to perform the SFSTs. That can occur when the driver is a chronic, heavy drinker who has developed a tolerance to the effects of alcohol and does not display obvious symptoms. Although those individuals are germane to an examination of DUI enforcement overall, they properly were not part of this study, which was strictly defined as a validation study of SFSTs. It was limited to drivers who were asked to perform the tests.

IV. METHOD
A. SFST Standardization
To examine the validity of the SFSTs the study assessed the correctness of officers’ arrest and release decisions, which were based on suspects’ test performance. The proper execution of the study depended on the officers in the field. It was essential for them to strictly adhere to standardized testing since deviations in instructions and demonstrations would have yielded study findings only marginally relevant to standardized methods.
Participating officers were PCSO deputies with specialized training in DUI enforcement, including SFST training. They fully met all study criteria, and all were assigned to the PCSO Selective Traffic Enforcement Program (STEP). During a pre-study orientation and training session attended by deputies and observers, the study design and objectives were presented by the Study Investigator. The Project Manager, who is a certified SFST instructor, provided refresher training by reviewing and demonstrating standardized administration of the tests. Questions and comments from the individuals in attendance appeared to stem from genuine interest and commitment to the study objectives.
The deputies were asked to complete an Officer Information form (Appendix III). The data obtained with the form have been used to rank the officers by years of law enforcement experience (Table 1). In Table 2 they are ranked by the estimates made by each deputy of the total number of DUI arrests he had made up to the time of the study.
TABLE 1 Participating Pinellas County Sheriff Deputies
Ranked by Years of Law Enforcement Experience
Rank Badge Name Yrs-Mos. SFST Training
No. DUI Arrests
1 52626 Frank Fleming 19 yrs 1990 400 DUI Instructor
2 52610 Timothy W. Pelella 10 yrs 6 mos 1988 250 DUI Instructor
3 53708 Eric J. Osborne 9 yrs 6 mos 1987 200 DUI Instructor
4 52864 Richard C. Nalven 9 yrs 4 mos 1988 340 DUI Instructor DRE DRE Instructor
5 52863 Howard E. Skaggs 9 yrs 3 mos 1988 430 DUI Instructor DRE
6 53081 Tommy G. Craft 7 yrs 7 mos 1994 300 DUI Instructor
7 53241 Frank Arena 7 yrs 6 mos 1994 425 DUI Instructor DRE
8 53478 Robert V. Haimes 6 yrs 4 mos 1993 720 DUI Instructor DRE

TABLE 2 Participating Pinellas County Sheriff Deputies Ranked by Estimated Number of DUI Arrests
Rank Badge Name Yrs-Mos. SFST Training
No. DUI Arrests
1 53478 Robert V. Haimes
6 yrs 4 mos 1993 720 DUI Instructor DRE
2 52863 Howard E. Skaggs
9 yrs 3 mos 1988 430 DUI Instructor DRE
3 53241 Frank Arena 7 yrs 6 mos 1994 425 DUI Instructor DRE
4 52626 Frank M. Fleming 19 yrs 1990 400 DUI Instructor
5 52864 Richard C. Nalven
9 yrs 4 mos 1988 340 DUI Instructor DRE DRE Instructor
6 53081 Tommy G. Craft 7 yrs 7 mos 1994 300 DUI Instructor
7 52610 Timothy W. Pelella
10 yrs 6 mos 1988 250 DUI Instructor
8 53708 Eric J. Osborne 9 yrs 6 mos 1987 200 DUI Instructor
B. Data Integrity
Control of data collection is difficult but essential in a field study. Although the expression., “garbage in - garbage out” lacks elegance, it does aptly describe the consequences of a failure to control what goes on in the field. This issue was emphasized during the pre-study orientation session. Following a discussion of the underlying principles of data collection, the participants seemed to fully understand and agree with the requirements.
The study objective, an examination of all arrest and release decisions, which were based solely on the SFSTs together with roadside observations, dictated the data to be obtained. It was essential to receive for analysis the records of all roadside stops during which Walk-and-Turn, One-Leg Stand, and Horizontal Gaze Nystagmus were administered.
On some roadside stops during the study, officers used tests in addition to the SFSTs. The records were submitted as part of the total data set, but they have been excluded from the primary analysis. Since the additional tests contributed to the officers’ decisions in some unknown measure, it was not possible to assign the associated decisions solely to the SFSTs. As a matter of general interest, the records have been examined separately and are commented on in the Results section.
Trained observers were present during the contact with 242 suspected DUI drivers or 64‰ of all stops. Their contribution to the project was threefold:

They monitored test administration and recorded any observed error or omission
in standardized methods. They confirmed whether or not the deputies used other tests. They asked released drivers to provide a breath specimen for BAC measurement
by PBT.
Whenever a driver is judged by an officer not to be impaired and is released at roadside, an evidential breath test cannot be obtained. During the study, the deputies did not have access to PBTs. That condition was necessary to insure that their decisions were based solely on general observations and the SFSTs. Observers did have PBTs, and they obtained the data for Cells 2 and 4 of Figure 1.
Drivers who were asked by the Observers for breath specimens were told in advance that if they were found to be at an impairing alcohol level, there would be no penalty if they accepted alternate transportation. They were also told that if they attempted to drive away from the scene after they had been found to be impaired, they would be subject to arrest. Whenever a driver agreed to provide a breath specimen, he was offered an Informed Consent document for signature (Appendix III).
C. Data Completeness
Because there is risk of a systematic but unknown bias if a data set is incomplete, this study was designed to obtain the entire work product of the participating officers during the study period. Work product is defined as the reports associated with every administration of the SFSTs. In addition to daily monitoring of field activities by the Project Manager, a CAD numbering system allowed accurate tracking of records. Also, at the conclusion of data collection, the officers signed certifications that all records of all contacts with SFST-tested drivers had been submitted (Appendix III).
The total set of records for the study includes the following:
Officer Information
• Law enforcement experience • SFST training • DUI arrest experience
Arrest documents, including SFST report
Breath test report (evidential)
Officer’s Checklist
Observer’s Checklist, including BACs measured with a PBT
Consent for roadside breath testing

The Officers’ Checklist (Appendix III) obtained information about the reasons for stopping motorists who were examined with the SFSTs. Also, information was obtained about light conditions, weather, the roadway, and other environment characteristics at the time and place of the stop. There was an interest in determining whether any of these variables are related to the occurrence of alcohol-impaired driving and the detection of impairment.
Observers used a Checklist (Appendix III) to record the following information about SFST administration:
Were instructions given correctly? Was the test administered correctly? If the test was not given, what was the reason? If the test was not observed, what was the reason? BAC by PBT
Study documents were received from the officers and observers by the Project Manager, who verified their completeness and legibility. The documents were copied and sent by mail on a weekly basis to the Investigator at the Southern California Research Institute (SCRI). Strict confidentiality procedures at SCRI insured that the copies were accessible only to project staff.
The data were entered into a computer data base. Printouts of the data were checked against the documents by the Investigator and other project staff. Errors were corrected and printouts again were checked. The process continued until the Investigator concluded that data entry was as nearly correct as possible.
D. Data Analysis
Data processing and analysis were carried out with NIDABASE software, which was developed under funding from the National Institute on Drug Abuse (Burns, 1990). The software was developed initially for the purpose of analyzing data obtained from Drug Impairment Evaluations (DIEs) by Drug Recognition Experts (DREs). Since the SFSTs are a core component of DIEs, the original NIDABASE and an ADDON component (for checklist information) were used to analyze the data obtained during this project.
The FOXBASE structure of NIDABASE provides a powerful analytic tool. Data screening and summary are accomplished with simple keystroke commands. Analysis proceeds with data base queries in logical-statement format.
The primary question for this study was, “Using measured BAC as the criterion, what proportion of officers’ arrest and release decisions was correct?” As can be seen in the Results Section, multiple, additional questions of interest were explored during a comprehensive analysis. Some statistical analyses were carried out with the spreadsheet program Quattro Pro.

V. RESULTS
The first record in the data base is for an arrest which occurred on June 1, 1997, and the last record is dated September 4, 1997. During the study period, 379 records were submitted for the study. Figure 3 graphs the total number of records by month. As expected, the initial activities generated enthusiasm among participants, and the largest number of citizen contacts occurred during the first project month. Although available time of participating officers was affected during July and August by scheduled training days and vacations, and although it typically is difficult to sustain the initial high interest level, the actual decline in arrests over the extended project period was not large. The final month is not comparable, since data collection extended only a few days into September.
FIGURE 3 SFST Records by Month
A. Total Sample and Measured BACs
Table 3 summarizes the disposition of 379 records obtained during this study. As can be seen in the table and in Figure 4, the BACs of 256 drivers were measured. Thus, BACs are available for 81.8‰ of the 313 cases entered into an analysis of officers’ decisions. Evidential testing at the booking facility accounts for 210 of the BACs. Forty-six were obtained with a Preliminary Breath Testing (PBT) device. A log of all cases appears in Appendix IV.

TABLE 3 Disposition of 379 Cases
STUDY CASES No.
Contacts with citizens 379
SFSTs not administered 13
Other tests used 53
Records excluded -66
Records used in analysis 313
Drivers who refused breath test 57
Measured BACs 256
FIGURE 3 Case Disposition N= 379

Thirteen records have been excluded from the analysis. In those cases, the suspects entirely refused to cooperate with roadside procedures. Since the officers were unable to administer any test from the 3-test SFST battery, the records contain no information relevant to this study.
An additional subset of 53 records could not be used to examine the validity of the SFSTs, because the officers administered other tests in addition to or instead of the three standardized tests. Typically, the additional tests were Finger-to-Nose and Romberg. Although the cases have been excluded from the primary analysis, the influence of other tests on decisions to arrest or release is an issue of interest which will be addressed separately.
Observers obtained BACs (mean = 0.110%) from three arrested drivers who refused to provide a breath specimen for an evidential test and 43 BACs (mean = 0.047%, std. dev. .036%, range 0.000% to .151%) from drivers who were not charged with DUI. Although most were released, in some cases the drivers were not charged with DUI but were charged with other offenses, including drug influence and driving without a valid license. In total, BAC data are not available for 57 of the 313 drivers.
Evidential tests require two breath specimens, and the two measured BACs must not differ by more than 0.02%. If they do, a third specimen is required. Since only one BAC could be entered into the data base, the means for the first and second specimens were compared. They were found to differ by only 0.002%. It is unlikely that the small difference could affect the analysis in any significant way, and arbitrarily the first-obtained BAC has been used. The only exceptions are those cases where the officer noted that the first test was a “low blow” and where only the second measurement was 0.08% or higher. The BACs are graphed in Figure 5.
1. Arrested Drivers
The mean BAC of 206 arrested drivers was 0.150% (median 0.147%), which is a severely impairing alcohol level. No one with a BAC of 0.30% or higher was found in this sample of impaired drivers, but it is a matter of serious concern for traffic safety that 37 drivers were on Florida roadways with BACs in the range 0.200% - 0.284%. Such high BACs are produced by very large amounts of alcohol. For example, if a man of average body size and build (e.g., 5’10”, 165 lbs) had been drinking 80-proof spirits and was found to have a BAC in this range, 10 to 16 oz of the spirits were in his body. Since alcohol is toxic, most light-to-moderate drinkers are unable to consume such large amounts without nausea and other adverse consequences. It can be assumed, therefore, that alcohol consumers who are found driving with extremely high BACs are chronic, heavy drinkers.

FIGURE 4 Measured Positive BACs
2. Released Drivers
The mean BAC of 41 drivers who correctly were not arrested for DUI was 0.031%. The mean BAC of nine incorrectly-released drivers was 0.115% (range 0.08-0.155%). These nine BACs were obtained by PBT.
3. Drivers with Suspended/Revoked Licenses
Drivers who persist in committing traffic offenses, including DUI, despite repeated sanctions are a difficult problem for law enforcement and traffic safety. It is of particular relevance, therefore, to examine the characteristics of 50 drivers who did not have valid driver licenses. Interestingly, men and women were represented in this group in exactly the same proportions as the total sample; i.e., 80% men, 20% women.
Seven of these drivers entirely refused to cooperate with the officers and neither performed the SFSTs nor provided breath specimens. Sixteen others (2 women, 14 men) cooperated with roadside testing but then refused the breath test. Although there obviously can be no certainty about BACs in these cases, partial and complete refusals do strongly suggest that the refusees believed their performance of the tests and/or breath specimens would confirm their violation of the alcohol statutes.
In ten cases, the officer used other tests in addition to the SFSTs. Retrospectively, it is not possible to understand why the officers felt it necessary to augment the three-test battery, but measured BACs possibly provide some insight. If an officer observed minimal impairment of the OLS and WAT tests, for example, but observed HGN consistent with a high BAC, he may have sought confirmation by using other tests.
In total, 26 positive BACs (mean 0.147%) were measured for drivers who had no valid license. Four were below the 0.08% statutory limit, but the finding that more than half were at high BACs (range 0.15%- 0.233%) suggests that some of these suspended-license drivers likely are chronic alcohol abusers. Men (64% of the high BAC group) and women (36% of the high BAC group) both had mean BACs just over 0.19%, but on average the women were younger (mean age 28.8 years) than the men (mean age 40.1 years). Assuming that a high BAC reflects problem drinking, the age difference is not unexpected. If women are going to advance to alcohol problems, it typically occurs more rapidly than for men.
4. Refusals
Although refusal to provide a specimen for BAC measurement results in license suspension, 57 individuals did refuse. The officers recorded the maximum possible HGN score (6 points) for 51 of those drivers and 4 HGN points (the cutoff score for 0.08% BAC) for two. In four cases HGN scores were not reported, but the drivers performed poorly on WAT and OLS. Thus, the SFST scores, coupled with a willingness to accept license suspension, provide evidence that the drivers who refused to provide specimens for BAC testing did so because they were impaired by alcohol.
B. Officers’ Decisions
1. Officers’ Correct and Incorrect Decisions for Drivers with Measured BACs Figure 6 and Figure 7 are generated by the officers’ decisions about 256 drivers with known BACs. In reviewing the table, keep in mind that the assignments to “correct” or “incorrect” have been made strictly in terms of BAC. The labels do not take into account the possibility, and in some cases the indications, that the drivers were impaired by other substances or conditions. On occasion, officers suspected drugs and obtained urine specimens for screening. Drivers sometimes acknowledged use of potentially impairing drugs, both licit and illicit, but the amount of drug and the time of use are not known and an analysis of possible influence is not possible. The drugs reported by drivers have been tabled in Appendix V as a matter of interest.

FIGURE 5 Decision Matrix
256 Cases with BAC Measurements
Overall the roadside decisions made by PCSO deputies during this study were highly accurate. More than 95% of their decisions to arrest were correct. That is, 197 arrested drivers had measured BACs of 0.08% or higher, whereas the BACs of only nine arrested drivers were lower than 0.08%.
By the same standard, 82% of release decisions were correct. Although this data set shows relatively few officer errors (7% total), it is of interest that a larger proportion of the releases (18%) than of the arrests (4.4%) were not supported by suspects’ BACs. This parallels the finding from the Burns and Anderson Study (1995). In general, officers are more likely to err by releasing a driver who is impaired than by arresting one who is not.
The BACs of Five of the nine cases in Cell 3 of Figure 6 were between 0.05% and 0.08% (0.063%, 0.065%, 0.069%, 0.070%, 0.070%). Although they have been tabled under Incorrect Arrests, it should be noted that drivers at those BACs are subject to prosecution under Florida’s presumptive statute.
2. Officers’ Decisions When Other Tests Were Used in Addition to the SFSTs On 53 occasions officers administered roadside tests which are not part of the standardized battery. On about one-third of those occasions, the other tests seem to have been substituted when the complete three-test battery could not be administered. Incomplete testing appears to have been due to the fact that the drivers were obviously impaired, physically disabled, or elderly. Whenever an individual is seriously at risk of harm from falling as they attempt to walk and balance, officers do not administer WAT and OLS.
The BACs of 12 drivers in this group are unknown. Nine arrested drivers refused to provide evidential breath specimens. After being released at roadside by the officer, one suspect refused the observer’s request for a specimen, and two were released when an observer was not present. Two drivers did provide breath specimens upon the observer’s request. Thus, 41 BACs are known. Figure 8 and Figure 9 graph these data.

FIGURE 6 Officer Decisions (N=256)
FIGURE 7 Decision Matrix
41 Cases with Measured BACs and Use of Other Tests

FIGURE 8 Officer Decisions with Tests in Addition to SFSTs (N=41)
The smaller proportion of correct arrest decisions (89.5%), in comparison to arrests when only the SFSTs were administered, suggests that other tests may have been used not only when it was not possible to administer some of the SFSTs but also when assessment of impairment was particularly difficult. Decisions about alcohol-tolerant drinking drivers, even at high BACs, and more moderate drinkers at borderline BACs, can be problematic. It is not possible to determine from these data whether additional tests were of value to the officers’ decisions.
C. Field Sobriety Tests
The standardized battery includes three tests: Horizontal Gaze Nystagmus, Walk and Turn, and One Leg Stand. It is instructive to examine the means for scores assigned to each test (Table 4), not only in relation to the officers’ correct decisions and errors but also to shed light on cases where the driver refused a breath test or the officer administered additional tests.
1. Horizontal Gaze Nystagmus (HGN) To conduct an HGN examination, an officer instructs the driver to hold his head still and to follow the movement of a stimulus with his eyes. The examination for three signs in each eye yields a possible total score of six. The three signs are:

1 Lack of smooth pursuit
The eyes do not smoothly pursue the moving stimulus but instead move in a jerky manner.
2 Nystagmus at maximum deviation A distinct jerking occurs when the eyes are deviated as far as possible in the horizontal plane.
3 Onset of the jerking movement prior to 45 degrees Nystagmus occurs and persists at an angle of gaze less than 45 degrees.
These data support the confidence in HGN which many SFST-trained officers express. With only four exceptions, the maximum score of six HGN signs was recorded for arrested drivers whose BACs subsequently were found to be 0.08% and above. Correct arrests also included three drivers with HGN scores of five and BACs of 0.081, 0.081, and 0.082%, and one driver with an HGN score of four and a BAC of 0.102%.
It is believed to be of particular significance that six HGN signs were observed in the eyes of all drivers who later refused to provide breath specimens. A reasonable assumption is that the uniformly high HGN scores accurately reflect the presence of impairing levels of alcohol and that many, if not all, refusals occurred because the individuals knew or feared their measured BACs would be above the statutory limit.
Correctly-released drivers had been given low HGN scores. Half of the scores are zero or two. Two individuals given HGN scores of six who were not charged with being under the influence of alcohol were suspected of being under the influence of other drugs (DUID).
It appears possible that officers’ observations of HGN contributed to false positive errors; i.e., arrests which were not supported by a measured BAC. In six of the nine cases, the officers recorded the maximum number of points. Although it is possible that the officers erred in their observations, it is noteworthy that in at least two of those cases, the drivers were believed to be driving under the influence of drugs (DUID). HGN occurs not only in the presence of alcohol, but also in the presence of other impairing substances (other CNS depressants, inhalants, and phencyclidine).

TABLE 4 Mean SFST Scores, BACs, and Ages
by Case Disposition
Case Disposition No. BAC (%)
Age (yrs)
SFSTs HGN WAT OLS
HITS Arrests supported by BACs
197 0.155 34.4 5.9 4.8 2.8
CORRECT REJECTIONS Releases supported by BACs
41 0.031 36.2 2.7 2.4 1.0
FALSE POSITIVES Arrests not supported by BACs
9 0.046 37.0 5.2 3.6 2.0
FALSE NEGATIVES Releases not supported by BACs
9 0.103 36.0 **
3.8 1.8 1.2
REFUSALS. 57 34.7 6.0 5.2 3.2
313 * Ages known for 20 drivers ** Ages known for 2 drivers.
Failures to arrest alcohol-impaired drivers included individuals who were able to perform the WAT and OLS tests with few signs of impairment. These incorrect releases included one person with a nystagmus score of six, one with a score of five, and five with a score of four. Why these individuals were released is unknown, but possibly the officers were misled by the lack of psychomotor impairment. The failure to observe any nystagmus signs in one individual whose BAC was 0.080% most likely was officer error.
2. Walk-and-Turn Test (WAT)
A suspect is given detailed, standardized instructions for walking nine heel-to-toe steps along a line, turning, and returning along the line with nine heel-to-toe steps. A WAT score reflects an individual’s ability to attend to and remember very specific instructions as well as to balance and walk. PCSO officers record errors with the following checklist.
Loses balance during instructions
Starts before instructions are finished
Stops while walking
Doesn’t touch heel-to-toe
Steps off line
Uses arms for balance
Loses balance while turning/incorrect turn
Can’t perform test

Scores for correctly arrested drivers who performed WAT (n=190) ranged from only one error to a maximum score of eight. Their mean BAC was 0.156%, and the correlation of WAT scores with BAC is significant (r = 0.506, p<.01), but arrest/release decisions and WAT scores are not entirely congruent. Certainly, it is not possible to identify all variables that influenced decisions, but the data strongly suggest that some correct decisions were the result of giving less weight to WAT than to HGN. In assessing differences between tests, keep in mind that unlike psychomotor skills HGN is not subject to voluntary control and cannot be practiced or learned.
The WAT criterion for arrest is two or more errors, but five drivers who made only one WAT error were correctly arrested (mean BAC 0.114%). In all of those cases, six HGN signs were recorded. In 14 cases with a mean BAC of 0.121% and two WAT errors, the officers recorded six HGN signs for 13 of the drivers and five signs for one.
Thirty-three drivers who were correctly released (mean BAC 0.033%) had been given the WAT test. If the decisions had been based solely on WAT, only ten of those drivers would have been released. It is likely that the officers not only heeded HGN scores but that they also took into account variables other than alcohol which can affect the ability to balance and walk (e.g., physical disability, age, obesity).
WAT scores account in part for what appear to be nine incorrect arrests; i.e., arrests not supported by measured BACs. Although no driver in this group was given a maximum WAT score, the officers recorded 2 errors (n=3), 4 errors (n=4), and 5 errors (n=2). It is possible, of course, that the WAT scores accurately reflected impairment since drug use was suspected for five of the drivers.
An incongruence can be seen between WAT scores and nine incorrect release decisions (mean BAC 0.103%). Although one of these drivers performed the test without error and another made only one error, seven were released despite having scores which met the criterion for arrest. Since the officers also reported four or more HGN signs, it is unclear what the basis for the release decisions might have been.
3. One-Leg Stand (OLS)
This balance test requires the individual to stand with his arms at his side and to lift one leg approximately six inches off the ground. He is instructed to look at the raised foot and to maintain the stance while counting “one thousand-one, one thousand-two, one thousand-three, etc.” until told to stop. The test is timed for 30 seconds and scored as shown below. The criterion for arrest is two points.
Sways while balancing
Uses arms for balance
Hopping
Puts foot down
Can’t perform test

As expected, given that variables other than alcohol can affect balance, officers’ decisions to arrest or release did not always parallel OLS performance. For example, 19% of the individuals who did this test and who were correctly arrested made only one error. Since the criterion for arrest is two errors, it can be assumed that the decisions to arrest were based on other signs of impairment.
FIGURE 9 BAC Distribution - One Leg Stand
Figure 10 graphs the BAC distributions of OLS scores 0 to 4 for correctly arrested drivers. Notice that all score groups include BACs as low as 0.08% and higher than 0.20%. This overlap is believed to reflect tolerance to alcohol, unusual sensitivity to alcohol, and combinations of impairing variables. Experienced drinkers may show relatively little impairment of balance at high BACs. On the other hand more moderate BACs can be associated with maximum scores for a variety of reasons. For example, an individual may normally have poor balance, which then is exacerbated by almost any amount of alcohol.

Alcohol in even small amounts may drastically impair balance when combined with other substances or conditions.
OLS scores met the arrest criterion for seven drivers who were incorrectly arrested. Since these individuals also had maximum HGN scores, it is possible they were impaired by some substance other than alcohol. Both the OLS scores and the HGN scores met arrest criteria for two incorrectly released drivers. Nine correctly released drivers would have been arrested if the officers had observed only OLS.
As was seen with the WAT test, the OLS test is both less specific and, with some individuals, less sensitive to alcohol impairment than HGN. These data demonstrate, however, that standardized tests of psychomotor skills do contribute to correct decisions.
D. Officers
FIGURE 10 Officers Experience in Law Enforcement
The least experienced officer had been a sworn officer for less than seven years whereas the most experienced officer had 19 years’ service (Table 1, Figure 11). The total number of DUI arrests by the officers varied from 200 to more than 700 (Table 2, Figure 12). All were not able to participate in the project for the same number of shifts, and it was not unexpected that the number of records submitted ranged from 10 to more than 100. The largest number of records was submitted by the officer with the fewest years in law enforcement.

FIGURE 11 Officers’ DUI Arrests
E. Observers
Seventeen individuals served the project as Observers. They were non-sworn employees of PCSO, and all attended the project training session. The individuals listed in Table 5 were present to observe roadside activities on approximately two-thirds of the contacts. Using AlcoSensors, they obtained BACs from 46 drivers.
The checklists submitted by the Observers indicated whether the SFSTs were given, and listed the reason when they were not given (e.g., refusal, physical inability of suspect, etc.). No significant errors or omissions in SFST instructions and demonstrations by the officers were reported. At the conclusion of data collection, the Observers certified that they had submitted all records of their observations of SFST administrations.
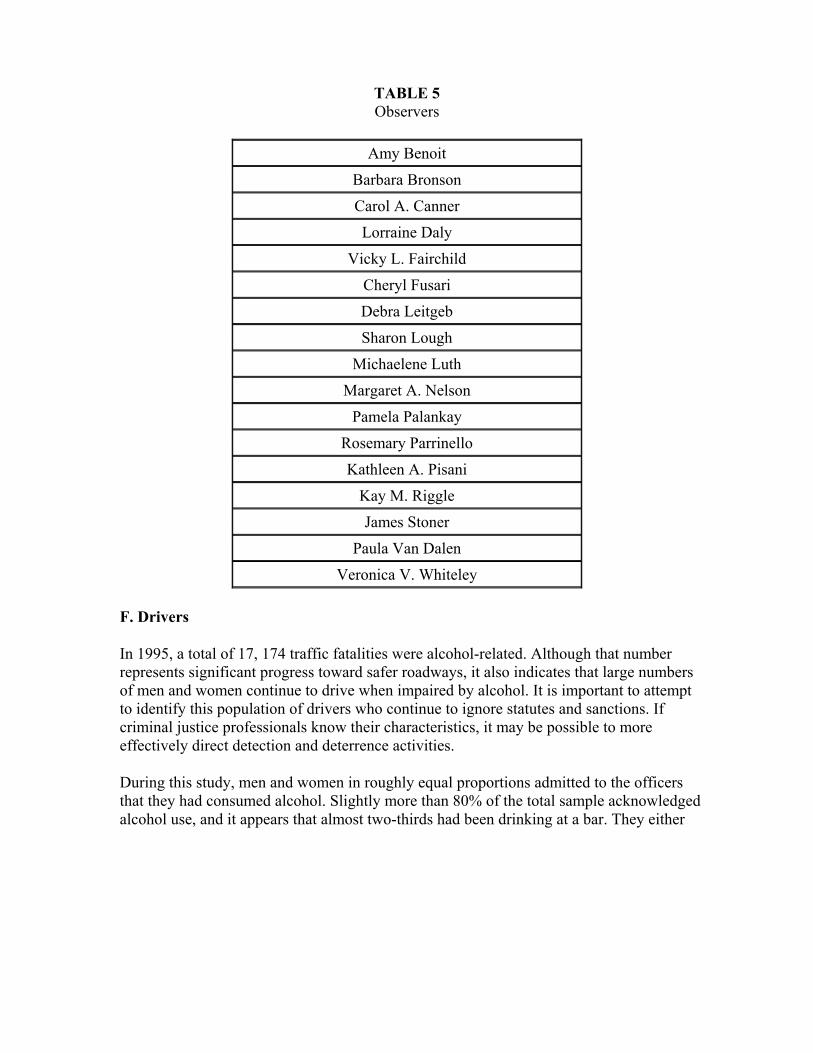
TABLE 5 Observers
Amy Benoit
Barbara Bronson
Carol A. Canner
Lorraine Daly
Vicky L. Fairchild
Cheryl Fusari
Debra Leitgeb
Sharon Lough
Michaelene Luth
Margaret A. Nelson
Pamela Palankay
Rosemary Parrinello
Kathleen A. Pisani
Kay M. Riggle
James Stoner
Paula Van Dalen
Veronica V. Whiteley
F. Drivers
In 1995, a total of 17, 174 traffic fatalities were alcohol-related. Although that number represents significant progress toward safer roadways, it also indicates that large numbers of men and women continue to drive when impaired by alcohol. It is important to attempt to identify this population of drivers who continue to ignore statutes and sanctions. If criminal justice professionals know their characteristics, it may be possible to more effectively direct detection and deterrence activities.
During this study, men and women in roughly equal proportions admitted to the officers that they had consumed alcohol. Slightly more than 80% of the total sample acknowledged alcohol use, and it appears that almost two-thirds had been drinking at a bar. They either

reported doing so and/or were stopped in the vicinity of a bar. Seven men told the officers that they had smoked marijuana, and 15 drivers (11 men, 4 women) admitted narcotics use. In view of the current popularity of cocaine and methamphetamine, it is slightly surprising that only two cases of stimulant use are noted in the records. It is possible that the low number reflects regional drug preferences or the availability and price of stimulants during the study period. It is also possible that some stimulant use was not detected since the signs and symptoms of low to moderate amounts can be very difficult to recognize.
1. Gender
The total number of drivers contacted during the study was 379. Three hundred (79%) were men and 79 (21%) were women.
2. Ages
The drivers of this study are largely young and middle age individuals (Table 6, Figure 14). Ages were not recorded for all suspects but of 343 known ages, more than 70% are in the range 21-40 years, and there are few individuals at the extremes of the age continuum. Only 2.6% are over age 60 and 1.5% are under age 21. This age distribution closely parallels that reported from other studies of DUI drivers.
TABLE 6 Driver Ages
Age (years) Women (number)
Men (number) Total
Unknown 8 28 36
Under 21 1 4 5
21 - 30 18 84 102
31 - 40 34 109 143
41 - 50 15 47 62
51 - 60 2 20 22
61 - 70 0 7 7
71 - 80 1 1 2
79 300 379
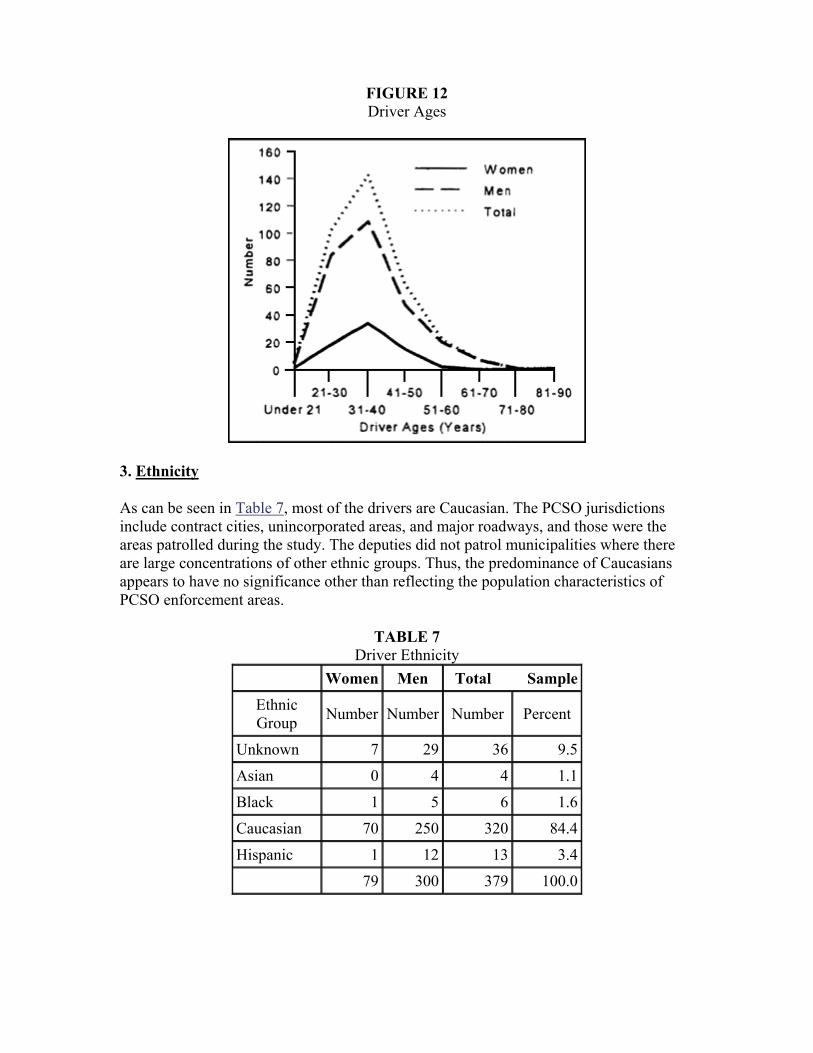
FIGURE 12 Driver Ages
3. Ethnicity
As can be seen in Table 7, most of the drivers are Caucasian. The PCSO jurisdictions include contract cities, unincorporated areas, and major roadways, and those were the areas patrolled during the study. The deputies did not patrol municipalities where there are large concentrations of other ethnic groups. Thus, the predominance of Caucasians appears to have no significance other than reflecting the population characteristics of PCSO enforcement areas.
TABLE 7 Driver Ethnicity
Women Men Total Sample
Ethnic Group Number Number Number Percent
Unknown 7 29 36 9.5
Asian 0 4 4 1.1
Black 1 5 6 1.6
Caucasian 70 250 320 84.4
Hispanic 1 12 13 3.4
79 300 379 100.0

4. Employment Status
Slightly more than 20% of the records did not indicate employment status. The balance of the drivers have been assigned to an employment category based on their reports to the officers. The data are of considerable interest, but they should be interpreted with caution since there is no certainty that the assignments are entirely correct (Table 8). For example, company types (roofing, insurance, etc.) sometimes appear in the records, and it is unclear what specific kind of jobs the individuals held within the businesses. Also, the category “business owner/self employed” is over-broad and includes highly diverse activities (restaurant owner, lawn maintenance, handyman, etc.). In some instances, the recorded driver’s age as well as the age of his vehicle suggests that his own characterization of employment might not have been entirely accurate.
TABLE 8 Driver Employment Status
Women Men Total Sample
Job Category Number Number Number Percent
Unknown 22 62 84 22.2
Unemployed 7 16 23 6.1
Unskilled 6 29 35 9.2
Semiskilled 22 77 99 26.1
Skilled 13 52 65 17.1
Professional 5 11 16 4.2
Business Owner, Self-employed
2 35 37 9.8
Student, Military 1 11 12 3.2
Retired, Disabled 1 7 8 2.1
79 300 379 100.0
5. Vehicles
Most of the suspected offenders were driving a standard passenger car (65%) with pickup trucks being the second most frequent vehicle type (19%). Four motorcyclists and two bicyclists were detained.

G. Conditions and Circumstances of Stops
1. Day of Week and Time of Day Although alcohol-impaired drivers can be found on the roadway at any hour, their numbers begin to increase during the early evening hours. As a result of both the incidence of impaired driving and the hours when the DUI team patrolled, most stops were made during hours of darkness. They were made most often on city streets where there was some lighting. Also, as expected, most stops occurred on weekend nights. The frequencies of stops by day of the week are rank ordered in the following table.
Rank SATURDAY 1
FRIDAY 2
SUNDAY 3
THURSDAY 4
WEDNESDAY 5
TUESDAY 6
MONDAY 7
2. Weather, Roadway and Test-surface Conditions Given that this study was conducted in Florida, beginning in June and ending in early September, it is not surprising that almost no inclement weather was reported. There was a light rain at the time of nine stops and occasionally the deputies noted in their checklists that there was a light wind or a few clouds. As a consequence of prevailing good weather, the roadways and testing surfaces almost always were dry. On 16 occasions the testing surface had a slight slope. No relationship between any of these conditions and SFST results could be discerned.
3. Reason for Stop Although light and moderate drinkers may begin to have difficulty steering their vehicles at fairly low BACs, any drinker’s ability to control the path of his vehicle will be impaired at high BACs. Not surprisingly, given that the mean BAC of arrested drivers was 0.15%, an observed loss of car control was the most frequently-reported reason the deputies made vehicle stops. The cues with the highest frequency were “failure to maintain a single lane” and “weaving within a lane”. Driver errors also included running a stop sign or signal, illegal turns, tailgating, driving on the wrong side of the road, eluding an officer, failure to turn on headlights and miscellaneous others, including “iguana driving” (Appendix VI).
H. Reasons for Vehicle Stop, by BAC
The data obtained during this study permitted an analysis which is peripheral to the study objective but is of considerable importance to law enforcement, namely as an identification of the detection cues associated with 0.08% BAC. Observable deterioration of car control skills, which occurs at high BACs, may not occur at lower but nonetheless impairing and illegal BACs. What then do officers observe which causes them to stop drivers who subsequently are found to have BACs at or near the 0.08% limit?
The distribution of positive BACs in this study (Figure 5) does not parallel the BAC distribution of drivers on the roadway. Many more drivers in the total population have BACs in the 0.08 - 0.10% range than 0.15% and higher. Although higher BAC drivers are likely to be easier to detect, and although no one can fault officers for removing them from the roadway, there is a serious problem if many people drive at and near the statutory limit without being detected. This issue assumes new importance in view of current recommendations to further lower the statutory limit. Although data from laboratory studies demonstrate impairment at low BACs and support lower limits, there are important questions of enforceability. The questioning can begin appropriately with this set of data and with current laws. Since many drivers at 0.08% BAC may not commit easily observable, gross car control errors, what detection cues will reliably alert officers to the impairment of these drivers?
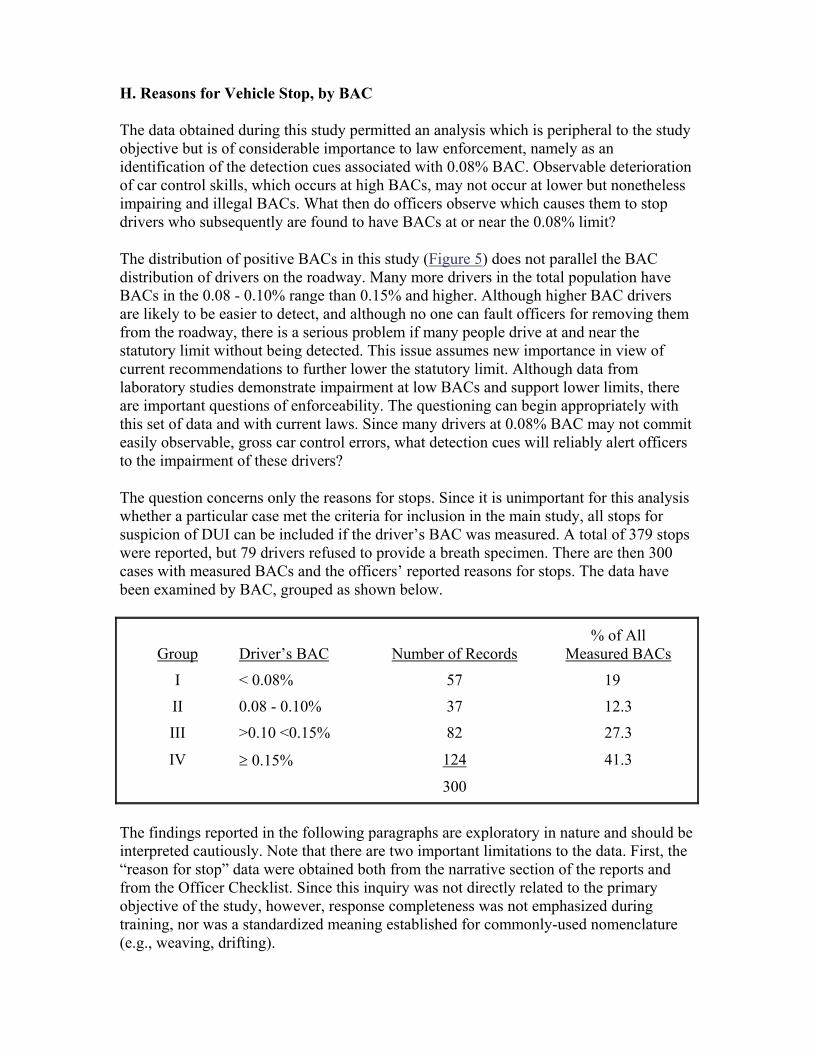
The question concerns only the reasons for stops. Since it is unimportant for this analysis whether a particular case met the criteria for inclusion in the main study, all stops for suspicion of DUI can be included if the driver’s BAC was measured. A total of 379 stops were reported, but 79 drivers refused to provide a breath specimen. There are then 300 cases with measured BACs and the officers’ reported reasons for stops. The data have been examined by BAC, grouped as shown below.
Group Driver’s BAC Number of Records % of All
Measured BACs
I < 0.08% 57 19
II 0.08 - 0.10% 37 12.3
III >0.10 <0.15% 82 27.3
IV ≥ 0.15% 124 41.3
300
The findings reported in the following paragraphs are exploratory in nature and should be interpreted cautiously. Note that there are two important limitations to the data. First, the “reason for stop” data were obtained both from the narrative section of the reports and from the Officer Checklist. Since this inquiry was not directly related to the primary objective of the study, however, response completeness was not emphasized during training, nor was a standardized meaning established for commonly-used nomenclature (e.g., weaving, drifting).

The second data limitation has to do with the arbitrary use in the analysis of a single reason for a stop, despite the fact that multiple reasons often were given. The reason for the stop that appeared to have been primary, judged by both the narrative and the checklist, was used. It is possible both that error was made in that regard and that analysis of a single reason obscured important aspects of the data. Unfortunately, examination of multiple reasons would have been a more complex analysis than possible within the scope of this study. Despite the limitations of the analysis, the differences between BAC groups which can be seen in Table 9 are of interest.
TABLE 9 Reasons for Stops, by BAC Groups
Group Equipment Violations
Speed (high or low)
Misc.* Drifting Weaving
FTMSL **
I N = 49 ***
Mean BAC 0.015% 0.036% 0.038% 0.035% 0.040%
% of Group 10.2 28.6 32.7 20.4 8.2
II N = 37
Mean BAC 0.089% 0.086% 0.091% 0.092% 0.095%
% of Group 10.8 29.7 16.2 16.2 27.0
III N = 82
Mean BAC 0.130% 0.126% 0.124% 0.125% 0.131%
% of Group 9.8 12.2 25.6 31.7 20.7
IV N = 124
Mean BAC 0.184% 0.193% 0.194% 0.190% 0.200%
% of Group 3.2 11.3 18.5 36 37.9 * e.g., running stop or signal, failure to yield, eluding officer, skidding to stop, headlights not on, ** FTMSL = Failure to maintain a single lane ***Eight cases were eliminated from the analysis of Group I, because they involve admitted or suspected use of drugs.
As expected, with BACs of 0.10% and higher (Groups III and IV), the officers most often reported observations of loss of car control (i.e., weaving or drifting within a lane and failing to maintain a single lane) as reasons for the stops. At BACs of 0.10% - <0.15%, these reasons account for more than half the stops, and at BACs of 0.15% and higher, they account for almost three-quarters of the stops.

Although observations of weaving, driving, and failure to maintain a single lane were observed at the lower BACs of Groups I and II, they account for fewer of the stops (29% and 43%, respectively), and speed violations assume greater importance. There is little doubt that drivers at lower BACs are better able to steer their vehicles than high BAC drivers. It appears that if they avoid speeding, they may avoid detection. Also, notice that although equipment violations initially draw the officers’ attention to about ten percent of drivers whose BACs are below 0.15%, they are relatively unimportant in the stops of high BAC drivers.
Two interrelated suggestions can be offered on the basis of these very preliminary findings. First, a carefully designed and rigorously executed field study could answer some critical questions.
What are the driving cues, identified precisely, that currently alert officers to 0.08% drivers?
What cues could alert officers to 0.05% drivers (if that should become the statutory limit?
How many 0.08% BAC drivers, who are actually observed by traffic officers, are not recognized as impaired?
The information to be gained would aid traffic officers and would serve the decision makers who must establish DUI enforcement policies. Second, issues of enforceability should be given serious consideration by legislators, activist groups, and safety-minded citizens as they consider appropriate statutory limits. Although these are stated as two suggestions, they actually cannot be separated. The BAC limits that will most effectively impact traffic safety are closely linked to how and how effectively officers can detect lower BACs, which are in turn linked to policies, in particular enforcement methods and use of new technologies.
VI. SUMMARY AND DISCUSSION
Legislators have lowered the limits for alcohol levels in drivers from 0.15%, which was the very early standard, to 0.10% or 0.08%. The lower statutory limits are soundly based in data from scientific experiments and from epidemiology and are an important step toward safer roadways. Whether their full potential for reducing alcohol-involved crashes can be reached, however, depends on effective enforcement. Failure to enforce a statute, whatever the reason for the failure, weakens that statute and may actually render it counterproductive to some degree.
Traffic officers are the first link in the series of events that brings a DUI driver into the criminal justice system. Unless officers are able to detect and arrest impaired drivers, those drivers will not experience the sanctions which are intended to deter impaired driving. Although there are many aspects to effective DUI enforcement, certainly it is crucial for officers to be proficient in assessing the alcohol impairment of drivers they detain at roadside.
As an aid to their roadside decisions, officers rely upon a battery of tests, the SFSTs, to augment their general observations of a driver. At this point in time, no other tests have been shown to better discriminate between impaired and unimpaired drivers. Nonetheless, the battery, and in particular Horizontal Gaze Nystagmus, frequently is attacked vigorously during court proceedings. Thus, the examination of officers’ decisions, based on the SFSTs, is of considerable interest.
If it can be shown that officers’ reliance on the tests is misplaced, causing them frequently to err, then the officers, the courts, and the driving public need to be aware that the tests are not valid and that DUI laws are not being properly enforced. If, on the other hand, it can be shown that officers typically make correct decisions, based on the SFSTs, perhaps the legal controversy that has centered on them for more than a decade can be diffused and court time can be devoted to more substantive issues.
The data obtained during this study demonstrate that 95% of the officers’ decisions to arrest drivers were correct decisions. Furthermore, 82% of their decisions to release drivers were correct. It is concluded that the SFSTs not only aid police officers in meeting their responsibility to remove alcohol-impaired drivers from the roadway, they also protect the rights of the unimpaired driver. These data validate the SFSTs as used in the State of Florida by Pinellas County Sheriff’s deputies who have been trained under NHTSA guidelines. SFST validity now has been demonstrated in Florida, California (1997) and Colorado (1995). There appears to be little basis for continuing legal challenge.
References
Burns, M. (1990) Development and Pilot Test of a Computer Data Base of Drug Evaluations of Impaired Drivers. No. 90M079578301D.
Burns, M. and Adler, E. V. (1994) Drug Recognition Expert (DRE) Validation Study. Final Report, E0072023, Governor’s Office of Highway Safety, State of Arizona
Burns, M. and Anderson, E. (1995) A Colorado Validation Study of the Standardized Field Sobriety Test (SFST) Battery. Final Report, Colorado Department of Transportation.
Burns, M. And Moskowitz, H. (1977) Psychophysical Tests for DWI Arrest. Final Report, DOT-HS-802 424, NHTSA, U.S. Department of Transportation.
McKnight, A. J., Langston, E.A., Lange, J.E., and McKnight, A.S. (1995) Development of Standardized Field Sobriety Test for Lower BAC Limits (SFST-LL), Final Report, DTNH22-92-07000, NHTSA, U.S. Dept. of Transportation.
Stuster, J. and Burns, M. (1977) Validation of the Standardized Field Sobriety Test Battery at BACs Below 0.10 Percent. Final Report, DTNH22-95-C-05192, NHTSA, U.S. Dept. of Transportation.
Tharp, V., Burns, M. and Moskowitz, H. (1981) Development and Field Test of Psychophysical Tests for DWI Arrests. Final Report, DOT-HS-805-864, NHTSA, U.S. Dept. of Transportation.