Embed Size (px)
Citation preview

DEPARTMENT OF CHEMICAL ENGINEERING, LUND UNIVERSITY, FACULTY OF ENGINEERING
Integrated Biorefinery Based on Algal Biomass
A Feasibility Study
Final Report
2010-06-03
Authors: Tutors: Johan Bergqvist Christian Hulteberg, Lund University Kristina Henriksson Hans T Karlsson, Lund University Karolina Johansson Børre Tore Børresen, Statoil ASA Marcus Svensson Oscar Tenfält

i
Disclaimer This study was performed as a project in the course Feasibility Studies on Industrial Plants (KET050) at the Department of Chemical Engineering, Faculty of Engineering, Lund University, Sweden in co-operation with Statoil ASA New Energy and New Ideas. Neither Lund University nor the authors of this report or Statoil ASA may be held responsible for the effect following from using the information in this report. Neither the authors, Lund University nor Statoil ASA make any warranty, expressed or implied, or assume any legal liability or responsibility for the accuracy or completeness of this information.
Acknowledgements The authors would like to thank all the persons who have contributed to the completion of this report. Firstly, we would like to thank our tutors, Hans T Karlsson and Christian Hulteberg at the Department of Chemical Engineering at Lund University and Børre Tore Børresen at Statoil ASA for their support. Christian Hulteberg has contributed with most of the information about the Biofuel-Solution process, some information about prices for chemicals, with estimations and with good advice. Hans T Karlsson has performed calculations regarding enzyme consumption and capital cost for the transesterification process, given advice on capital cost estimates and given many valuable tips. At our first meeting with Børre Tore Børresen, he gave a fine description of the project and of the R&D concerning renewable energy sources at Statoil ASA and he has given us interesting tips during the work with the feasibility study. Secondly, we would like to thank the following persons at the Department of Chemical Engineering at Lund University. Prof. Guido Zacchi has answered answered numerous questions about ethanol pro-duction and given good advice regarding calculation methods. Ola Wallberg (PhD) helped us with the simulations in Aspen Plus each time there was a problem. Additional help and tips regarding Aspen Plus were given by Mats Galbe (PhD). The membrane filtration gave rise to many questions but Prof. Ann-Sofi Jönsson always had a good answer or a suitable approximation that saved the day. Since information about how fermentation by-products can be recovered from the stillage is scarce, it is thanks to Prof. Bernt Nilsson that the method involving ion exchange chromatography came to our knowledge. Prof. Stig Stenström guided us among the vast number of books in the department library to suitable sources of physical data. Regarding the composition of the algae and the salt tolerance of yeast, Prof. Gunnar Lidén provided valuable literature. Ass. Prof. Lovisa Björnsson and PhD-student Nges Ivo Achu, both at the Department of Biotechnology, has contributed with important information regarding biogas production. Profs. Olle Holst, at the Department of Biotechnology, and Peter Råd-ström, at Applied Microbiology, gave important advice about how to find the composition of the al-gae. Thirdly, we would like to thank all persons outside the university, from different companies who have answered our questions regarding different products and process solutions. Per Munk Nielsen at No-vozymes A/S has provided much valuable information about enzymes for transesterification and suit-able process design for the same. Christina Bång at SinChriJo gave information on the price of and sent much practical information about the usage of molecular sieves from Zeochem. A correct price for fermentation yeast, based on the consumption at the biorefinery, was supplied without delay by Pierre Basuyaux at Fermentis. Mattias F. Nilsson at Alfa Laval gave us tips and information about membrane filtration for our application.

ii
Abstract A feasibility study on a biorefinery, based on biomass from microalgae, has been performed by a group of students at the Department of Chemical Engineering at Lund University, Faculty of Engi-neering by the order of Statoil ASA. The main product is pre-defined as biodiesel, in this case an ethyl ester of algal oil. Microalgae of the species Nannochloropsis salina are to be cultivated outdoors in photobioreactors and harvested by flocculation followed by gravity sedimentation. The algal oil will be recovered by phase separation in a stirring settling tank after the cells have been ruptured by cavitation. Degumming will be used for removal of phospholipids. The degummed oil is to be transesterified with ethanol to bio-diesel in an enzymatic process. The glycerol produced in the transesterification will be converted to the valuable co-product n-propanol. Ethanol for the transesterification will be produced by fermentation of the carbohydrates in the algal residues, the algal flour, in an SSF (simultaneous saccharification and fermentation) process. Separa-tion of the ethanol is to be performed by distillation. The surplus ethanol that is to be sold, and a minor part of the ethanol required for the transesterification, will be dehydrated to fuel-grade quality. Dehy-dration of the ethanol will be performed in a column with molecular sieves. The stillage is to be an-aerobically digested to biogas, which can be combusted in a boiler, thus generating heat and power for the plant. Some fermentation by-products, i.e. organic acids and glycerol will be recovered from the stillage by centrifugation and evaporation. The glycerol will be used for production of n-propanol and the acids will be separated by ion exchange chromatography. Residues from the biogas production, i.e. primarily ammonia, will be returned to the algae cultivation as nutrients. Carbon dioxide from the fermentation will be supplied to the algae cultivation. Since the algae are of marine origin, cultivation in salt water is required. The yeast used for fermentation is not halotolerant and therefore most of the salt will be removed by diafiltration before the SSF. The products to be sold, apart from the main product biodiesel, will be fuel ethanol, n-propanol, buta-nediol, acetic acid, propionic acid and succinic acid. Almost all energy required will be produced on site by combustion of the biogas. The final production price for the biodiesel will be €1.03/l. Since the capital cost of the photobioreactors and the cost of the enzymes for transesterification contribute most to this, a reduction of one or both could lower the production price substantially.

iii
Contents 1 Introduction ..................................................................................................................................... 1 2 Background ..................................................................................................................................... 2
2.1 Algae Cultivation .................................................................................................................... 2 2.1.1 Nannochloropsis salina .................................................................................................... 2
2.2 Oil Recovery, Oil Pre-treatment and Transesterification ........................................................ 4 2.3 Plant Location .......................................................................................................................... 5 2.4 Adjustment of the Process ....................................................................................................... 5
3 Biodiesel Production ....................................................................................................................... 5 3.1 Chemical Catalysis .................................................................................................................. 5 3.2 Enzymatic Catalysis ................................................................................................................ 6
3.2.1 Enzymatic Transesterification Process ............................................................................ 6 3.3 Recommendations ................................................................................................................... 7
4 Glycerol Processing ......................................................................................................................... 8 4.1 The Biofuel-Solution Process .................................................................................................. 8
4.1.1 Hydrogen Source ............................................................................................................. 9 4.2 Recommendations ................................................................................................................... 9
5 Algal Flour Processing .................................................................................................................... 9 5.1 Filtration ................................................................................................................................ 10
5.1.1 Membrane filtration ....................................................................................................... 11 5.1.2 Recommendations ......................................................................................................... 12
5.2 Ethanol Production ................................................................................................................ 13 5.2.1 Hydrolysis ..................................................................................................................... 13 5.2.2 Fermentation .................................................................................................................. 14 5.2.3 Separation and Purification of the Ethanol .................................................................... 16 5.2.4 Recommendations ......................................................................................................... 18
5.3 Fermentation By-Products ..................................................................................................... 19 5.3.1 Recovery of Glycerol .................................................................................................... 20 5.3.2 Recovery of the Acids in the Stillage ............................................................................ 20 5.3.3 Recommendations ......................................................................................................... 21
5.4 Biogas Production ................................................................................................................. 22 5.4.1 The Substrate ................................................................................................................. 22 5.4.2 The Reactors .................................................................................................................. 22 5.4.3 The Coupling of Reactors .............................................................................................. 22 5.4.4 Nitrogen Inhibition ........................................................................................................ 22 5.4.5 The Temperature of the Process .................................................................................... 22 5.4.6 The Residues ................................................................................................................. 23 5.4.7 The Energy Production .................................................................................................. 23
iv
5.4.8 Recommendations ......................................................................................................... 23 6 Process Description ....................................................................................................................... 24 7 Mass and Energy Calculations ...................................................................................................... 26
7.1 Flows by Mass and Volume .................................................................................................. 26 7.1.1 Transesterification ......................................................................................................... 26 7.1.2 Algae Cultivation, Oil Separation and Oil Pre-Treatment ............................................. 27 7.1.3 SSF ................................................................................................................................ 27 7.1.4 Membrane Filtration ...................................................................................................... 28 7.1.5 Distillation and Dehydration ......................................................................................... 29 7.1.6 Fermentation By-Product Recovery .............................................................................. 29 7.1.7 Biofuel-Solution Process ............................................................................................... 29 7.1.8 Anaerobic Digestion ...................................................................................................... 30 7.1.9 Summary of the Results................................................................................................. 30
7.2 Energy Calculations .............................................................................................................. 31 7.2.1 Energy Demand ............................................................................................................. 31 7.2.2 Heating and Cooling System ......................................................................................... 33
8 Cost Estimates ............................................................................................................................... 34 8.1 Assumptions .......................................................................................................................... 35 8.2 Capital Costs .......................................................................................................................... 35
8.2.1 Add on Factors .............................................................................................................. 35 8.2.2 Algal Oil Production Facility ........................................................................................ 35 8.2.3 Biodiesel Production Facility ........................................................................................ 36
8.3 Operating Costs ..................................................................................................................... 37 8.3.1 Costs for Chemicals Used in the Algal Oil Production Facility .................................... 37 8.3.2 Costs for Chemicals in the Biodiesel Production Facility ............................................. 38 8.3.3 Labor Costs .................................................................................................................... 39 8.3.4 Energy Costs .................................................................................................................. 39
8.4 Total Production Costs .......................................................................................................... 40 8.5 Sensitivity Analysis ............................................................................................................... 41
9 Conclusions ................................................................................................................................... 42 10 References ................................................................................................................................. 42 A Appendix A ...................................................................................................................................... I B Appendix B....................................................................................................................................... I C Appendix C....................................................................................................................................... I D Appendix D ...................................................................................................................................... I E Appendix E ....................................................................................................................................... I F Appendix F ....................................................................................................................................... I G Appendix G ...................................................................................................................................... I
G.1 Capital Cost for the Filtration Units ......................................................................................... I

v
G.2 Capital Cost for the Molecular Sieves and the Dehydration Columns ..................................... I G.3 Capital Cost for the Distillation Units ..................................................................................... II
H Appendix H ...................................................................................................................................... I I Appendix I ........................................................................................................................................ I J Appendix J ........................................................................................................................................ I K Appendix K ...................................................................................................................................... I
K.1 Yeast Consumption .................................................................................................................. I K.2 Consumption of Enzymes for Ethanol Production ................................................................... I
L Appendix L ....................................................................................................................................... I

1
1 Introduction One of today’s most important topics of the climate debate is the demand on replacements of fossil fuels. The renewable fuel must be carbon dioxide neutral and sustainable as well as profitable. Bio-diesel from vegetable oils can be used as fuel undiluted or mixed into diesel and there are already vegetable alternatives available from crops such as oilseed rape and soybean. Compared to other vege-table oils, the oil produced from algae has a high productivity per surface area and otherwise arid land can be used. In contrast to soybeans, which produce 59,000 l of oil per km2, algae generate 2,500,000 l of oil per km2 at medium productivity. (1) However the production of biodiesel from algae oil is struggling with adjusting the process to be cost efficient and thereby increase the competitiveness to-wards fossil fuels. The economy can be improved by refining the by-products to added-value products. As a student’s assignment a feasibility study of an integrated biorefinery from algae has been per-formed at the Department of Chemical Engineering at Lund University for the international energy company Statoil ASA. The focus has been on the use of by-products in the biorefinery, such as glyc-erol and algal flour, and on refining of these into value-added products. The main product is specified as biodiesel. Requests specified in the project description are the use of an enzymatic transesterifica-tion process (e.g. Novozymes) and production of ethanol, which can be used for the transesterification, from the algal flour. An overview of the processes that the biorefinery is composed of is given below in Figure 1.1.
Algae Cultivation Algal Oil Biodiesel Process Biodiesel
Glycerol
Biofuel-Solution Process
Algal Flour
Ethanol Process
Stillage
Biogas Process Energy
Ethanol
NutrientsCO2
Sunlight
n-Propanol
Hydrogen
Ethanol
GlycerolAcids
Acids
Butanediol
Figure 1.1: A simplified process flowsheet in which the major processes and streams are included. The starting point for the work is the report Biodiesel Production from Microalgae –A Feasibility Study (2) performed by students at Lund University 2008. The study focused on the algae cultivation and pre-treatment of the algal oil. This feasibility study is a further development of this study com-plementing the plant with a biorefinery.

2
The report begins with a brief description of the process suggested in the former study and the adjust-ments made in this process e.g. to facilitate further processing of the by-products. After that, different alternatives for the processes to be added are presented. Each section covers a certain product, with suggestions for production methods and recommendations regarding the choice of method. The trans-esterification of the algal oil and the refining of the glycerol formed are discoursed first. Algal flour processing, i.e. fermentation into ethanol and anaerobic digestion into biogas, is treated next. When the chosen total process has been described, heat and mass balance calculations follow. Estimates of capital and production costs are summarised in the subsequent section. The report is concluded with a summary of the results and a discussion regarding the same.
2 Background A short summary of the methods chosen for algae cultivation, oil recovery, oil pre-treatment and transesterification in the former study is given below. For details, the actual report Lassing, Merit – Mårtensson, Peter – Olsson, Erik – Svensson, Marcus (May 16, 2008), Biodiesel Production from Microalgae – A Feasibility Study, Department of Chemical Engineering, Lund University, Faculty of Engineering (2) is recommended. Some changes in this process have been made to better suit the sub-sequent processing of oil and by-products, i.e. not all of the methods described in Background are to be used in the proposed biorefinery. The changes, e.g. the substitution of the base catalysed esterifica-tion process for an enzymatically catalysed process, are described last in this section.
2.1 Algae Cultivation The algae are to be cultivated in tubular closed photobioreactors from the Dutch company AlgaeLink which focuses on equipment for algae production (2) (3). This equipment is considerably more expen-sive than open ponds but the cultivation conditions can be better controlled, the productivity is higher and the risk of contamination by other microorganisms is very low. The chosen algae species is Nan-nochloropsis salina which is described below; together with the difficulties of finding information about its chemical composition. N. salina is the algae species that AlgaeLink uses for biodiesel pur-poses and since information for the former study was received from the company, it was a suitable choice of algae species. Other advantages are reported high lipid content and the fact that it is an alga that lives in salt water, thus the need for fresh water in the process is significantly lowered. (2) Harvesting of the algae is performed in two steps – flocculation followed by gravity sedimentation. Flocculation is achieved by addition of potassium hydroxide which increases the pH to 11. This influ-ences the ionisation of components on the surface of the cell walls, which in turn leads to flocculation. It is estimated that 85% of the algae can be recovered by this process and the remaining solution is neutralised by nitric acid and subsequently returned to the bioreactor. The potassium nitrate formed will function as an additional source of nutrients. Some kind of neutralisation is most likely needed after sedimentation but this is not mentioned. Flocculation is applied due to the small size of the algae which leads to slow sedimentation. Sedimentation was chosen for its low cost and because alternative methods have relatively high energy demands. (2)
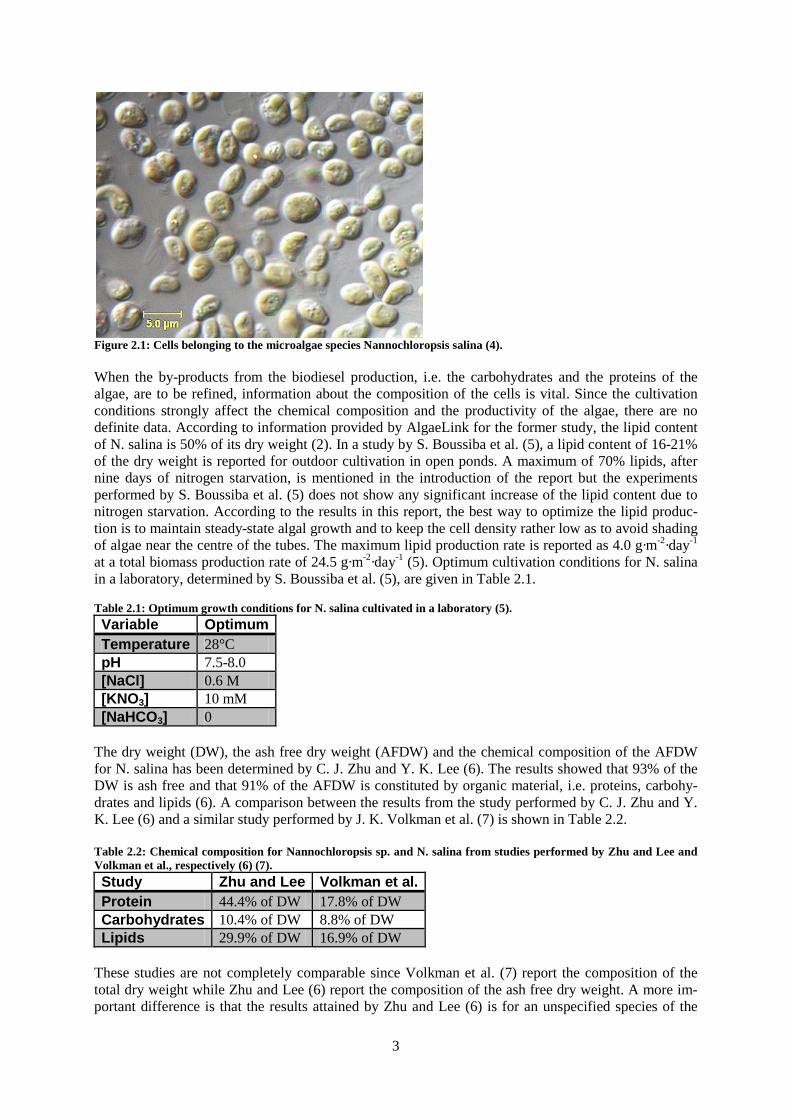
2.1.1 Nannochloropsis salina N. salina is a yellow-green unicellular microalga of the class Eustigmatophyceae. The cells are ellip-soid and only a few micrometers across. A photograph of some algae of the species N. salina is shown in Figure 2.1. (2)
3
Figure 2.1: Cells belonging to the microalgae species Nannochloropsis salina (4). When the by-products from the biodiesel production, i.e. the carbohydrates and the proteins of the algae, are to be refined, information about the composition of the cells is vital. Since the cultivation conditions strongly affect the chemical composition and the productivity of the algae, there are no definite data. According to information provided by AlgaeLink for the former study, the lipid content of N. salina is 50% of its dry weight (2). In a study by S. Boussiba et al. (5), a lipid content of 16-21% of the dry weight is reported for outdoor cultivation in open ponds. A maximum of 70% lipids, after nine days of nitrogen starvation, is mentioned in the introduction of the report but the experiments performed by S. Boussiba et al. (5) does not show any significant increase of the lipid content due to nitrogen starvation. According to the results in this report, the best way to optimize the lipid produc-tion is to maintain steady-state algal growth and to keep the cell density rather low as to avoid shading of algae near the centre of the tubes. The maximum lipid production rate is reported as 4.0 g·m-2·day-1 at a total biomass production rate of 24.5 g·m-2·day-1 (5). Optimum cultivation conditions for N. salina in a laboratory, determined by S. Boussiba et al. (5), are given in Table 2.1. Table 2.1: Optimum growth conditions for N. salina cultivated in a laboratory (5). Variable Optimum Temperature 28°C pH 7.5-8.0 [NaCl] 0.6 M [KNO3] 10 mM [NaHCO3] 0
The dry weight (DW), the ash free dry weight (AFDW) and the chemical composition of the AFDW for N. salina has been determined by C. J. Zhu and Y. K. Lee (6). The results showed that 93% of the DW is ash free and that 91% of the AFDW is constituted by organic material, i.e. proteins, carbohy-drates and lipids (6). A comparison between the results from the study performed by C. J. Zhu and Y. K. Lee (6) and a similar study performed by J. K. Volkman et al. (7) is shown in Table 2.2. Table 2.2: Chemical composition for Nannochloropsis sp. and N. salina from studies performed by Zhu and Lee and Volkman et al., respectively (6) (7). Study Zhu and Lee Volkman et al. Protein 44.4% of DW 17.8% of DW Carbohydrates 10.4% of DW 8.8% of DW Lipids 29.9% of DW 16.9% of DW
These studies are not completely comparable since Volkman et al. (7) report the composition of the total dry weight while Zhu and Lee (6) report the composition of the ash free dry weight. A more im-portant difference is that the results attained by Zhu and Lee (6) is for an unspecified species of the

4
genus Nannochloropsis while the results attained by Volkman et al. (7) are specific for N. salina. In the study performed by Zhu and Lee (6), all of the AFDW is analysed. The study performed by Volk-man et al. (7) focuses on the suitability of N. salina as feed for maricultures and, as indicated by the following quote from the report, some of the organic material is missed due to the analytical methods used. Volkman et al. (7) wrote: “These methods provide data on readily hydrolysable carbohydrates rather than structural carbohydrates such as cellulose.” (7). The conclusion is that there are no definite values for the chemical composition of N. salina since the results depend on the analytical methods used at the same time as the composition can vary drastically with the growth conditions. Therefore, a chemical composition is assumed for the calculations to be made. 40% of the dry weight of N. salina is assumed to be constituted by lipids while the cell wall, which is assumed to be practically pure cellulose, is assumed to account for 30% of the dry weight. The rest of the dry weight is assumed to be divided equally between proteins and carbohydrates other than cellulose, i.e. starch and sugar, thus giving 15% proteins and 15% readily hydrolysable carbohy-drates. These values are uncertain and probably constitute the most important source of error in the feasibility study. Table 2.3 summarises the assumptions described above. Table 2.3: Summary of the assumptions made regarding the chemical composition of N. salina. Component Share of DW Protein 15% Lipids 40% Carbohydrates 45%
Cellulose 30% Starch or sugars 15%
2.2 Oil Recovery, Oil Pre-treatment and Transesterification After harvesting, the oil must be extracted from the algae. Hydrodynamic cavitation will be used for disruption of the cell walls and the oil is to be recovered from the resulting slurry by phase separation in a stirred settling tank followed by centrifugation. The use of a bead mill instead of cavitation is given as a possible alternative but this method was rejected due to lack of information. The advantage of hydrodynamic cavitation is that no solvent is needed which reduces both the operating costs and the environmental impact. (2) Algal oil contains phospholipids which must be removed since it disturbs the further processing by formation of emulsions and since it lowers the efficiency of the catalytic converters in diesel vehicles. Removal of phospholipids is called degumming and is performed in two steps. First, the phospholipids are coagulated by addition of water, dilute acid or a dilute salt-solution at 80°C. Subsequent centrifu-gation removes most of the phospholipids. The rest of the phospholipids are removed in the second degumming step, where precipitation is induced by addition of a small amount of phosphoric acid. Separation is followed by neutralisation with sodium hydroxide in a neutralisation column. Soap resi-dues are washed out with a dilute water solution of citric acid. After drying, the formed citrate is re-moved by bleaching. (2) In the former study, Biodiesel Production from Microalgae – A Feasibility Study (2), the transesterifi-cation of the algal oil was to be performed with methanol and a base catalyst, e.g. sodium hydroxide or potassium hydroxide. The presence of free fatty acids (FFA) in the algal oil is a problem when base catalysed transesterification is to be performed since the FFAs form soap together with the cation of the base. Esterification of the FFAs with methanol using a heterogenic acid catalyst, e.g. WO3/ZrO2, was suggested for elimination of FFAs. (2)
5
2.3 Plant Location South Africa is recommended as a suitable plant location since the number of sun hours is high but not too high. 25°C is the optimal growth temperature for most algae species while 30°C is too warm for them. Therefore, the plant should preferably be located near the coast so that sea water can be used for cooling. Carbon dioxide might be supplied by one of many coal power plants or by the local chemical industry. (2)
2.4 Adjustment of the Process Some adjustments of the algal cultivation and the oil pre-treatment presented in Biodiesel Production from Microalgae –A Feasibility Study have been made to suit the following process steps better. As mentioned in Introduction, the base catalysed transesterification process has been replaced by an en-zymatic process described in Enzymatic Transesterification Process under Biodiesel Production. The alcohol used for transesterification of the algal oil, as well as esterification of the FFAs, will be changed to ethanol instead of methanol. Separation of free fatty acids, FFA, as described in the former study is not needed since a high level of FFA can be transesterified in the enzymatic process (8). The flocculation method with addition of potassium hydroxide is not yet replaced but might not be suitable since the cellulose, of which the algal cell membranes are primarily constituted, can be more or less hydrolysed at pH 11 (9). Thereby, the cell contents would be spread throughout the water, giving a dilute slurry from which recovery of the biomass components would be very difficult. Membrane filtration could be more suitable for water removal in this step. Additional sources of carbon dioxide for the algae cultivation could be the fer-mentation and the raw biogas.
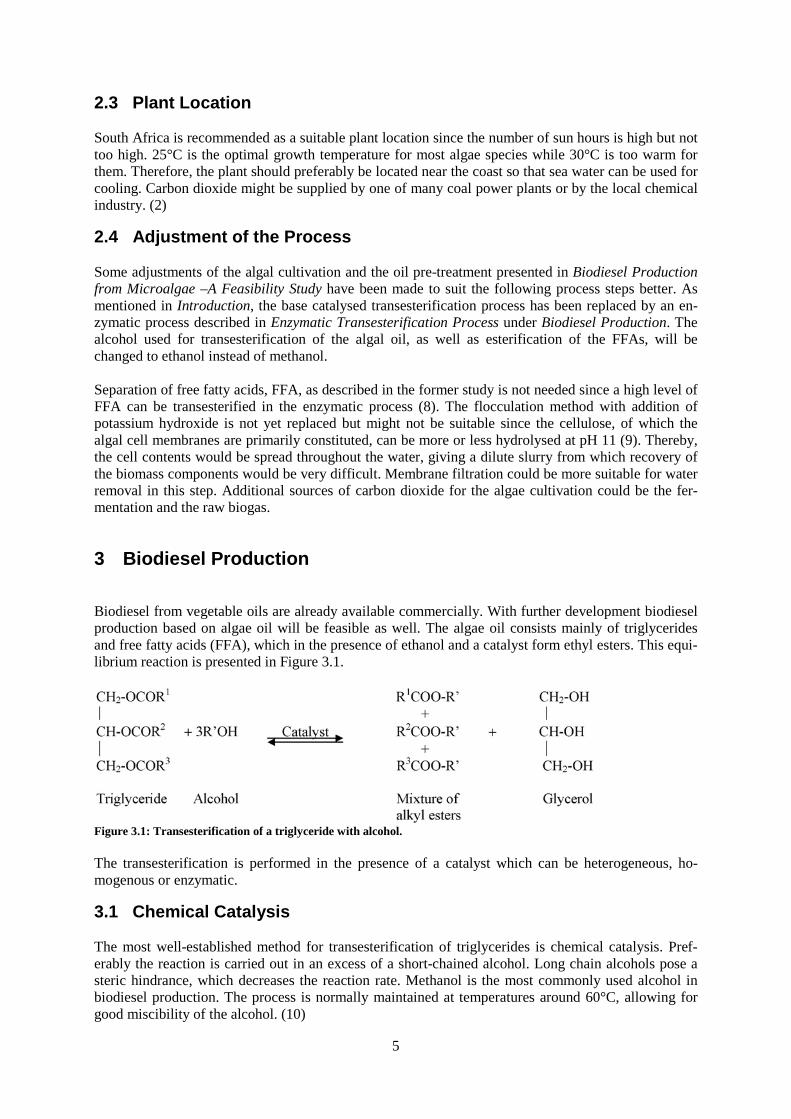
3 Biodiesel Production Biodiesel from vegetable oils are already available commercially. With further development biodiesel production based on algae oil will be feasible as well. The algae oil consists mainly of triglycerides and free fatty acids (FFA), which in the presence of ethanol and a catalyst form ethyl esters. This equi-librium reaction is presented in Figure 3.1.
Figure 3.1: Transesterification of a triglyceride with alcohol. The transesterification is performed in the presence of a catalyst which can be heterogeneous, ho-mogenous or enzymatic.
3.1 Chemical Catalysis The most well-established method for transesterification of triglycerides is chemical catalysis. Pref-erably the reaction is carried out in an excess of a short-chained alcohol. Long chain alcohols pose a steric hindrance, which decreases the reaction rate. Methanol is the most commonly used alcohol in biodiesel production. The process is normally maintained at temperatures around 60°C, allowing for good miscibility of the alcohol. (10)

6
An issue with a chemically catalyzed process is the water content. The reason is that the most com-monly used catalyst is sodium methoxylate, which will give rise to saponification in contact with wa-ter. Another effect of water could be a poor conversion of triglycerides and free fatty acids. For a well-functioning process, the use of absolute alcohol is required. With respect to this, methanol has an ad-vantage over ethanol since ethanol forms an azeotrope with water and thus needs further purification. In addition to this methanol is at present an inexpensive reactant. Another important aspect is the lev-els of alcohol in the process. In his master thesis, Grauslund, A. (10) suggests the use of six moles of alcohol per mole of triglyceride, thus twice as much alcohol as indicated by the stoichiometry of the reaction, Figure 3.1. (10) The addition of excess alcohol shifts the equilibrium of the transesterifica-tion reaction towards the products, thus yielding a higher production of methyl (or ethyl) fatty acid esters (11). Although effective, a chemically catalyzed transesterification process has its drawbacks, of which some have already been highlighted. Non-aqueous solutions must be used in order to avoid saponifica-tion and the temperature required is higher than for the enzymatic process. Furthermore, by-products such as glycerol are difficult to separate. The separation involves settling of the glycerol and introduc-tion of water and air. Another difficulty is the removal of catalyst from the glycerol produced. (12)
3.2 Enzymatic Catalysis An option to the chemical process is a process catalyzed by one or several enzymes, usually from the lipase group. Such a process can be run at rather low temperatures, typically in the range of 35°C - 40°C. This is beneficial in the sense of energy consumption. Another advantage with using enzymes is that pure alcohol is not a requirement. Saponification will not occur if water is present in an enzymatic process. This, together with the specificity of enzymes, facilitates the use of ethanol for enzymatic transesterification. (10) One of the negative sides of today’s commercially available enzymes is the high costs. This cannot be ignored since a high loading of enzymes is required. The reason for this is that the reaction rate and the yield of esters are low in an enzymatic process. However, the enzymes can be immobilized on a carrier material, which allows for easy recovery and reusability in other process steps. Another way of mak-ing the process more effective is by regeneration of enzymes through washing. It seems like the pre-requisite for an enzymatic process to be economically feasible is that the enzymes can be reused in the process a high number of times. As in a chemical process, an excess of alcohol gives a higher ester yield. Lipases are, however, not stable in the presence of excessive quantities of short chained alco-hols. Overexposure will cause inactivation due to alcohol poisoning. (10) Despite the problems associated with high enzyme costs, low product yields and sensitivity to excess amounts of alcohol, the enzymatic process has potential. Oil with high free fatty acid content may be used in the process and it is easy to recover the glycerol that is produced. As the enzymatic process is rather new compared to its chemical counterpart there is a lot of room for development. Research is in progress and the overall opinion about the enzymatic process is that it could be economically feasible in the future. (8)
3.2.1 Enzymatic Transesterification Process In order to achieve a high yield of ethyl esters, Novozymes© suggests a three-step process with batch-wise addition of ethanol, Figure 3.2 (10). A combination of the enzymes Lipozyme® TL IM (lipase from Thermomyces lanuginosus) and Novozym® CalB (lipase B from Candida Antarctica) is used to catalyze the transesterification reaction (13). According to experiments Lipozyme® TL IM has the highest reaction rate at lower ethanol concentrations, thus should be utilized in step 1 and 2 of the process. At higher ethanol concentrations, the use of Novozym® 435 (lipase also from Candida Anarc-tica) has proved to be more suitable. (14) Novozym® 435 and Novozym® CalB are derived from the same microorganism so their functionality is assumed to be quite the same. Thereby, Novozym® CalB is regarded as a suitable catalyst for step 3, to which anhydrous ethanol is added. (10)

7
Step 1 Step 2
Step 3
Centrifuge
Flash
Glycerol
abs EtOH
Oil96% EtOH
EtOH/Water
20-25% conv.Lipozyme TL IM
35°C
90% conv.Lipozyme TL IM
35°C
98% conv.Novozym CalB
35°C
OilEthyl esters
Flash
Centrifuge
Glycerol
Ethyl esters
EtOH
Ethyl estersEtOH surplus
Glycerol
96% EtOH
Washing Washing
Washing
Figure 3.2: Process flow sheet for Novozymes’ transesterification process, where the conversion of fatty acids is pro-gressing throughout the process. The conversions are assumed to be based on the amount of oil remaining after the preceding step. This means that the total conversion of the process is expected to be about 99.8%. In addition to that the enzymes have reaction-rate optimums at different ethanol concentrations, they differ in their specificity for fatty acids. Lipozyme® TL IM is better at catalyzing conversion of longer fatty acids while Novozym® CalB is better at catalyzing conversion of shorter ones. Thus, they com-plement each other in this process. (10) Step 3 of the process requires dehydrated ethanol in order to maximize the conversion of fatty acids, why water has to be removed from the process. This is done by flashing after step 2. A centrifuge is then used to recover glycerol, which is piped to a process for production of propionaldehyde. The removal of glycerol combined with the use of absolute ethanol, shifts the equilibrium of the transesterification reaction towards the products. Up to 99.8% fatty acid conversion should be possible to achieve with this process. Finally, the biodiesel (ethyl esters) is puri-fied from the surplus ethanol and glycerol, like after step 2 of the process. The 96% ethanol as well as the pure ethanol that is flashed off should be recycled and reused earlier in the process.
3.2.1.1 Regenerating Washing Process With time, a layer of oil and biodiesel is formed on the enzyme surface, limiting substrate and product diffusion. The result from this is a loss in enzymatic activity, thus a lower effectiveness of the trans-esterification process. In order to extend the lifetime of the enzyme, the layer of oil and biodiesel can be removed by washing. (11) Both Lipozyme® TL IM and Novozym® CalB are immobilized on a car-rier material of silica making them easy to recover and wash (10). Ethanol, propanol and n-hexane are some of the solvents that could be used in a washing process. Of these, n-hexane has shown the highest potential to preserve enzymatic activity. This appears to be because the oil/biodiesel mixture as well as n-hexane is non-polar. (11) By integrating washing steps with the suggested transesterification process, the enzymatic activity may be kept high for a longer period of time. This will have a significantly positive effect on the process economy as the additional loading of enzymes that is needed to maintain a high reaction rate in the process is lowered.
3.3 Recommendations The overall goal is to run an environmentally friendly biodiesel process based on alcoholysis with ethanol produced from algae flour. For this reason, an enzymatically catalyzed process is chosen. En-zymes are more selective than an acid or base catalyst, yielding a more effective transesterification. Besides, the risk of saponification in the process is eliminated. This means that an azeotropic alcohol

8
such as ethanol can be used without complications. Despite more expensive than methanol with to-day’s prices, ethanol is likely to be more economically feasible if produced on-site. In addition, the higher molar weight of ethanol due to its extra carbon atom will result in more biodiesel per molecule of crude algae oil. As touched upon, enzymatic transesterification might not be feasible at the present situation. It is, however, more energy efficient than heterogeneous or homogenous transesterification and it is possi-ble to implement a process for production of added value products, e.g. propionaldehyde from glyc-erol. When using enzymes for the transesterification, the resulting glycerol is easily separated. Enzy-matic catalysis is regarded as a potent and environmentally friendly method that could compete on the market in the future. Still further development of the method and utilization of co-products are re-quired. This study aims on determining the possibilities of using an enzymatic method in an integrated biorefinery for commercial production of biodiesel.
4 Glycerol Processing With the increasing production of biodiesel, the world market price for glycerol has dropped. Food grade glycerol can be used in various applications, e.g. in cosmetics and in pharmaceuticals. Since the 1970s and until the first years of the 21st century, the world market price has been stable between $1200 and $1800 per tonne. A few years ago, around 2006, the market price dropped to approximately $600 per tonne. (15) The price has continued falling and today it is €200-300 per tonne (16). With this in mind, the production of biodiesel generates a large amount of glycerol for which both the market value and the market demand are negligible. Transforming glycerol to more valuable compounds will hopefully increase the profitability of the plant. Glycerol can be converted to fuel or to chemical substances used in the chemical industry, such as propane, propene or propanol (17). The Swedish company Biofuel-Solution has developed a proc-ess in which glycerol is transformed to propionaldehyde which in turn is converted to either n-propanol or propionic acid. This process is described below.
4.1 The Biofuel-Solution Process The conversion of glycerol to propionaldehyde in the Biofuel-Solution process is a two-step reaction, each performed in a fixed-bed reactor. Before entering the first reactor, the glycerol is mixed with water and this mixture is subsequently boiled and compressed. In the reactor, glycerol is dehydrated to acrylic aldehyde at 10 bar and 280-300ºC. This main reaction has a molar conversion of +90% while the rest of the glycerol forms the by-product propionic acid. In the next reactor acrolein is hydrogen-ated to propionaldehyde at 180-200ºC. The reaction formulas are given below. (16) First reactor – main reaction: C3H5(OH)3 (g) → 2 H2O (g) + C2H3CHO (g) First reactor – secondary reaction: C3H5(OH)3 (g) → H2O (g) + C2H5COOH (g) Second reactor: C2H3CHO (g) + H2 (g) → C2H5CHO (g) Propionaldehyde forms an azeotrope with water. 99.9 wt% of the propionaldehyde can be recovered by distillation at atmospheric pressure, in a mixture containing 2.4 wt% water. All of the propionic acid ends up in the bottom product together with most of the water. Complete dehydration of the propionaldehyde requires adsorption on e.g. zeolites. (18) The propionaldehyde has a very low boiling point which makes transport and storage rather complicated. Therefore, the propionaldehyde is con-verted into a product that is manageable. There are two principal products, n-propanol and propionic acid. Hydrogenation gives the alcohol and oxidation gives the acid, as shown below. (16) Hydrogenation: C2H5CHO (g) + H2 (g) → C3H7OH (g) Oxidation: C2H5CHO (g) + ½O2 (g) → C2H5COOH (g)

9
4.1.1 Hydrogen Source The hydrogen used in the process can either be bought or produced at the plant. Hydrogen can be pro-duced industrially either by steam reforming of methane followed by the water-gas shift reaction or by electrolysis of water. Steam reforming and the water-gas shift reaction can also be performed with ethanol as a raw material. If there is surplus of ethanol after fermentation, steam reforming of ethanol or glycerol for that matter, can be considered. Steam reforming of methane to synthesis gas and the consecutive water-gas shift reaction are de-scribed below. Steam reforming: CH4 (g) + H2O (g) → CO (g) + 3 H2 (g) Water-gas shift reaction: CO (g) + H2O (g) → CO2 (g) + H2 (g)
4.2 Recommendations The Biofuel-Solution process was suggested in the project description as a suitable process for conver-sion of glycerol to a more valuable product. Since one of the tutors for this project is the founder of Biofuel-Solution, information about the process described has been readily available. These are the reasons for the choice of process. Since the market price of n-propanol is 1200 € per tonne, compared to 1000 € per tonne for propionic acid, it is more profitable to produce the first-mentioned product. The propionic acid obtained as a by-product can be recovered by e.g. ion exchange chromatography or sent to the anaerobic digestion. The process flow sheet for the chosen process design is shown in Fig-ure 4.1. Small-scale hydrogen production is generally not economical and therefore, the hydrogen required for glycerol processing will be bought instead of produced on-site.
Dehydration
Hydrogenation
GlycerolSteam
Acrylic aldehydeSteam
Propionic acid
PropionaldehydeHydrogen
SteamPropionic acid
Hydrogen
WaterPropionic acid
PropionaldehydeHydrogen
Steam
Hydrogenation
PropanolWater
Hydrogen
Distillation
Degasser
Hydrogen
PropanolWater
V-1Hydrogen
Ion ExchangeChromatography
Water
Propionic Acid
Figure 4.1: The Biofuel-Solution process for conversion of glycerol to propionaldehyde, followed by hydrogenation to n-propanol.
5 Algal Flour Processing In order for the biodiesel production to be profitable, the remains of the algae, the algal flour, has to be transformed into useful by-products. As described in Nannochloropsis salina under Background, the algal flour is primarily constituted of cellulose from the cell walls and proteins, polysaccharides and different types of sugar from inside the cells. Considering suitable by-products, there are four main alternatives – manure, animal fodder, ethanol or biogas. After a reduction of the water content, the

10
material could also be burnt for energy production. This alternative must however be seen as a last resort since the value of the energy produced will be less than that of the potential by-products. The two first by-product alternatives are the simplest ones since they theoretically only require drying of the material. On the other hand, this is an energy-consuming process since the dry matter content is low. It is also unclear whether or not the algal flour contains the necessary nutrients. The third and most important disadvantage with these alternatives is that both manure and animal fodder are low-value products. (16) If the carbohydrate content of the algal flour is fermented to ethanol, this can be used for the trans-esterification of the algal oil, as mentioned in Biodiesel Production. Since there will be a surplus of ethanol this can be sold as a fuel (anhydrous) or for technical use (96 vol%). During fermentation, small quantities of by-products, e.g. succinic acid and glycerol, are formed (19). Succinic acid is a valuable chemical, used as food additives, starting material for polymer production, as components in cosmetics, etc (20). The economy of the whole biorefinery might be substantially improved if some of the by-products can be recovered, purified and sold. Instead of producing excess ethanol, part of the algal flour could be fermented to succinic acid since this product is more valuable than ethanol (21). After fermentation, the residues are primarily composed of proteins and carbohydrate residues. By anaerobic digestion, this material can be converted into biogas which can subsequentially be sold, used for hydrogen production (see Glycerol Processing) or burnt for production of heat and electricity at the plant. If it is more economical to buy ethanol than to produce it from the algal flour, all of the algal residues can be used for biogas production. Another possible field of application for the proteins is functional foods, provided that the algal proteins are of the right type and that the market demand is sufficiently high (22). Since the hygienic demands for food processing are very high and since data regarding the type of proteins in N. salina are difficult to find, this possibility will not be further inves-tigated in this study. Before the algal flour is further processed after the separation of the oil, the dry matter content has to be increased significantly. Furthermore, the salt concentration must be reduced since many microor-ganisms, as yeasts for fermentation and bacteria for anaerobic digestion, do not tolerate the high salin-ity of sea water (23). In a study performed by T: Modig et al. (24), it is shown that the rate of glucose conversion by S. cerevisiae is significantly reduced when the yeast cells are exposed to 40 g/l NaCl. The time for complete glucose conversion was increased by a factor 4 when the fermentation was con-ducted in the saline environment. The by-product yield is increased considerably with almost twice as high formation of acetate, pyruvate and glycerol as for fermentation under non-saline conditions. An 83% decrease in specific growth rate was observed for Baker’s yeast. (24) The salinity used in this study is very close to the salinity of sea water which is 35 g/l. Fresh water is, by definition, water whose salinity is below 1 g/l. (25) The water content can be reduced by some kind of membrane filtra-tion method but it is important that the sugars, the starch, the cellulose and the proteins are not lost with the water. Salt can also be removed by membrane filtration or by ion exchange. Since both the water content and the salt concentration can be reduced by membrane filtration, this method will be used. It is also probable that ion exchange is unsuitable for such large flow rates and for such complex solutions. (26)
5.1 Filtration As mentioned above, membrane filtration is a suitable method for removal of both salt and water. Since as small molecules as monosaccharides must be retained, while water and salt must permeate the membrane, nanofiltration is required. If hydrolysis of starch and of cellulose is to be performed before fermentation, the proteins and the pentose polysaccharides should be separated from the monosaccha-ride solution. Ultrafiltration can be used for this application since these membranes retains macro-molecules and larger particles (22).

11
5.1.1 Membrane filtration Membrane filtration is usually applied when a solution of rather small particles or molecules is to be concentrated. Cake filtration, where the solute flows directly against the filter leaving only the parti-cles that are too large to pass behind, can be used with membranes but the cake formed by the retained particles causes a high resistance to flow. Therefore, crossflow filtration where the feed solution flows along the membrane is the general filtration method for membrane applications. In ultrafiltration, par-ticles or molecules in the size interval 0.001-0.5 μm are retained, e.g. proteins and other macromole-cules as well as larger particles are concentrated in the original solution. Common industrial applica-tions for ultrafiltration are food processing, purification of pharmaceuticals, recycle of chemicals in the paper industries and waste treatment. For retention or separation of small molecules or ions, nanofil-tration is required. There is a fine line between nanofiltration and reverse osmosis but the latter term is generally used when the flux is greatly influenced by the osmotic pressure. (27)
5.1.1.1 Membranes The membranes used for crossflow filtration should have a high porosity, small difference in size be-tween pores and the size of the largest pores should be somewhat below that of the species to be con-centrated. Optimally, the pores are small at the inlet of the membrane and larger inside the membrane since this reduces the risk of clogging. The unavoidable variance in pore size leads to partial rejection of molecules in a certain size range but the rejection is also influenced by the shape of the molecules, membrane fouling and the permeate flux. Commonly used polymer materials for ultrafiltration mem-branes are cellulose acetate, polyacrylonitrile and polyamide. Examples of inorganic materials for membranes are sintered stainless steel, porous carbon and alumina, all partially filled with i.e. zirco-nium oxide which gives asymmetric pores with a suitable size distribution. Inorganic membranes nor-mally tolerate higher operating temperatures as well as chemical cleaning and sterilisation, if such is required, while polymer membranes are more suitable for filtration of corrosive solutions. (27)
5.1.1.2 Filtration Modules Membrane filtration modules for industrial use are in general comprised of a large number of tubular or hollow-fibre membranes, large sheets placed as in a filter press or a spiral-wound unit. For tubular units, the flow should be turbulent. The tubes are enclosed by a cylindrical shell and the actual mem-brane is usually a thin polymer sheet supported by porous metal or ceramic tubes. The advantages with tubular membranes are that they are readily substituted and that mechanical cleaning can be performed without difficulty. The main disadvantage is that the surface-to-area ratio is comparatively low. (27) Hollow-fibre membranes are as small as 0.2-2 mm in diameter and the cylindrical modules incapsule hundreds to thousands of fibres. The linear velocity is kept high enough to ensure a high permeate flux but the flow is usually laminar. As expected, smaller fibres give a higher surface area-to-volume ratio but the risk of clogging is elevated with decreasing diameter. Spiral-wound modules are often used for reverse osmosis units but are also common in ultrafiltration applications. Since the inlet is a 1 mm narrow slit, the risk of clogging is less than for hollow-fibre membranes but for the same reason, pre-filtration is suggested. As in hollow-fibre modules, the flow is laminar but spacers inside the unit pro-vide a pressure drop and a better mass transport. (27)
5.1.1.3 Membrane Performance The permeate flux, the fraction of solute rejected and the concentration of the solute in the retentate stream are the three factors used for measurement of the membrane performance. An increase of the pressure difference across the membrane usually increases the flux but the relation is linear only for pure water. Firstly, before any permeation can occur, the pressure difference must exceed the osmotic pressure. The solute concentration increases with increased pressure difference but since this leads to an increase in osmotic pressure, the plot of flux against pressure difference across the membrane is curved, Figure 5.1. A maximum flux can be reached if the solute concentration exceeds the solubility of the solute or if a gel layer is formed on the membrane surface. The latter problem is common for solutions containing macromolecules. The risk of gel formation can be minimised by keeping the flux slightly below the maximum value. (27)

12
Figure 5.1: The permeate flux as a function of the pressure difference across the membrane in membrane filtration. π is the symbol for osmotic pressure (27). Since solute is accumulated at the membrane surface the concentration is generally much higher there than in the bulk and therefore the osmotic pressure at the membrane surface, which affects the permea-tion rate, is also higher than in the bulk. A high osmotic pressure at the membrane surface is often attained for solutions of macromolecules since this increases rapidly with concentration. For smaller-scale applications, batch operation with retentate recycle is common since the permeate-to-feed flow ratio, as well as the increase in solute concentration per passage, is usually small. Continuous filtration is generally used for large-scale industrial applications. A series of many modules with a large recycle ratio is employed. If the feed flow rate is large, several parallel module series are required. (27)
5.1.1.4 Membrane Fouling Fouling poses a general problem concerning membrane filtration since it causes a gradually declining permeate flux. This effect is due to relatively large molecules that enter a pore but are caught inside the membrane or to adsorption of molecules on the walls of the pores. Since the pore size is reduced by this internal fouling, the flux resistance is increased. Fouling can also occur on the membrane sur-face by precipitation or adsorption of molecules. As mentioned earlier, a gel layer can be formed on the surface. Surface fouling, e.g. surface adsorption and gel formation, can be remedied by cleaning, either by reversed flow or by mechanical cleaning. Removal of internal fouling might require the use of chemicals. If the cause of the fouling is determined, changes in operating conditions, modifications of the membrane surface or modifications of the solution can decrease the fouling rate substantially. (27)
5.1.1.5 Diafiltration If salts or small molecules are to be separated from a solution of macromolecules, diafiltration is commonly used. First, the ratio of macromolecules to the small solute is enlarged by ultrafiltration. This does not change the concentration of the small solute which is subsequently washed out of the solution by so called diafiltration. The concentration of the small solute is thus gradually reduced by continuous addition of de-ionized water accompanied by continuous ultrafiltration. When the desired concentration of the small solute is reached, the diafiltration is terminated and possibly followed by a final ultrafiltration step for elevation of the macromolecule concentration. If diafiltration is com-menced at the desired macromolecule concentration, the retentate volume as well as the pure water requirement are low but since the permeate rate is also low, the filtration time is long. If the initial solution is instead very dilute, a high permeate rate is achieved but much more water is required. If small molecules, but not the salt, are to be retained, nanofiltration can be applied in diafiltration. (27)
5.1.2 Recommendations A reduction of the salt concentration to the fresh water level is probably not feasible in this process since it would require huge volumes of deionised water. It is more realistic to try to accomplish a 10-

13
fold reduction to approximately 3 g/l and fresh water will be used instead of deionised water to reduce costs. The required reduction of salt concentration and water content of the algal flour solution is pref-erably accomplished by nanofiltration followed by diafiltration in nanofiltration modules. If the per-formance is poor due to the small difference in size between the salt ions to be permeated and the sugar molecules to be retained, ultrafiltration can be applied instead. This leads to loss of the free sugar from the algal cells but this sacrifice might be necessary to make the filtration process feasible. In the process design, nanofiltration will be used. First, the total solute concentration will be doubled by ordinary nanofiltration. Thereby, the algal flour-to-salt ratio is increased which lowers the fresh water demand. The salt concentration is subsequentially lowered to 3 g/l by diafiltration with nanofil-tration membranes. Finally, the dry matter content is increased to the value required in the fermenta-tion by ordinary nanofiltration. Since a high dry matter content can constitute a problem when macro-molecules are present, the last filtration step might not be feasible. A combined pre-hydrolysis and evaporation, by which water is removed and the macromolecule content is reduced simultaneously, might be employed if it is possible to combine these processes. This last alternative is however not used in the process design. A process flowsheet for the filtration and the fermentation is shown in Fig-ure 5.2.
5.2 Ethanol Production Before the cellulose and starch can be fermented, pre-treatment by hydrolysis is required. The hy-drolysis can be performed either before or during fermentation, the latter by so called simultaneous saccharification and fermentation (SSF). Regarding the fermentation, a suitable microorganism has to be selected and there are a large number of fermentation modes to choose between. Separation of the produced ethanol can be accomplished primarily by distillation or extraction but several other methods exist. (28) Valuable fermentation by-products, such as acetic acid and succinic acid, should if possible be separated and sold.
5.2.1 Hydrolysis Starch is readily hydrolysed by treatment with two amylases, while hydrolysis of cellulose is more difficult and requires more harsh conditions. Hydrolysis of cellulose is traditionally accomplished by the use of a strong acid and a high temperature but developments in the last decades have made enzy-matic processes viable alternatives even for this application. (29)
5.2.1.1 Hydrolysis of Starch Hydrolysis of starch is divided into two steps – liquefaction and saccharification. The liquefaction is usually performed by α-amylase in a slurry phase. A stirred tank reactor or a continuous stirred tank reactor (CSTR) can be used but the most commonly used unit for this process is a jet cooker. The op-timal temperature and pH value depends on the type of starch. For corn starch, the pH value should be around 4.5 while wheat and potato starch is liquefied at pH 5.0-6.5. An example of a liquefaction process commonly used in the industry is gelatinization in a jet cooker at 105°C for 5 min followed by dextrinization in a series of CSTRs at 95°C for 2 h. A low concentration of calcium ions, approxi-mately 5-150 ppm depending on the origin of the α-amylase, is required during liquefaction. (29) For saccharification, either amyloglucosidase or α-amylase can be used. In a batch process, the time required to reach 95-97% conversion to monosaccharides is typically adjusted to 48-70 h by correct dosage of the enzyme. It is, however, possible to achieve the same result in 35 h or less. By addition of a second enzyme, pullulanase, branched dextrins are hydrolysed rapidly and the accumulation of these is reduced. Thereby, the risk of re-polymerisation of dextrose is lowered. Optimal ranges of tempera-ture, pH and calcium concentration for different enzymes for starch hydrolysis are listed in Table 5.1. The hydrolysis steps are usually performed batch-wise but a continuous process can, at least in theory, give the same high conversion if a tube reactor or an infinite series of CSTRs is used. In practice, a tank series with at least 8 CSTRs is used which gives a slightly lower conversion than the correspond-ing batch process. (29)

14
Table 5.1: Different enzymes for hydrolysis of starch and their optimal working conditions (29). Enzyme Temperature (°C) pH [Ca2+] (ppm) α-amylase, bacterial, mesophilic 80-85 6-7 150 α-amylase, bacterial, thermophilic 95-105 5-7 5 α-amylase, fungal 55-70 4-5 50 Pullulanase 55-65 3.5-5 0 Amyloglucosidase 55-65 3.5-5 0
5.2.1.2 Hydrolysis of Cellulose Traditionally, hydrolysis of cellulose has been performed by treatment with a strong concentrated acid, usually sulphuric acid, at a temperature around 100-120°C. However, the use of concentrated acid is associated with some problems. The monosaccharide xylose is degraded to furfural which decreases the sugar yield and might disturb later process steps. Other problems are e.g. corrosion, the need for neutralisation and the cost of recycling of the acid. A lower acid concentration cannot be compensated by a higher process temperature since that causes faster degradation at the same time as the increase in yield is small. (30) By the use of enzymes instead of strong acids, the formation of by-products is practically eliminated due to the bond specific action of the enzymes. All of the other problems concerning the use of strong acids, except the need for catalyst recycle, are eradicated in the enzymatic process. When lignocellu-losic material, i.e. wood or wheat residues, is to be enzymatically hydrolysed, pre-treatment is required to free the cellulose from lignin and hemicellulose and thereby make it accessible for the enzymes. (30) For pure cellulose, i.e. pulp, no pre-treatment is needed and it is readily hydrolysed by the chosen enzymes (9). The three types of enzymes cellobiohydrolases, endoglucanases and β-glucosidases are used for hy-drolysis of cellulose. Cellulose is cut into cellobiose (30), which is a dimer of D-glucose (29), by cel-lobiohydrolases which act on the ends of the cellulose chains and by endoglucanases which act inter-nally on the polymers. β-glucosidases cleave the cellobiose into D-glucose. The cellulose is fairly re-sistant to hydrolysis which, together with the protection provided by the hemicellulose and the lignin, renders the rate of hydrolysis approximately 100 times slower than that for starch. Hydrolysis of cellu-lose has a temperature optimum in the range of 50-60°C and the residence time is at least 24 h. (30) The Danish enzyme producer Novozymes has developed a new enzyme combination for cellulose hydrolysis called Cellic® CTech2 which, according to experiments performed at the Department of Chemical Engineering at Lund University, also hydrolyses liquefied starch. This eliminates the need for a saccharification step for the starch which leads to a reduction of both investment and operating costs. Hydrolysis with Cellic® CTech2 should be performed at 50°C during 4-5 days and preferably batch-wise. The residence time can be reduced by an increase of the enzyme concentration but since most enzymes are expensive, it is a balance between enzyme cost and ethanol productivity. (21)
5.2.2 Fermentation After the hydrolysis, either a rather pure glucose/water solution, or one containing proteins and possi-ble residues from the carbohydrates, is to be fermented. Regarding this unit operation, there are many alternatives. There are species both of yeast and of bacteria which can ferment monosaccharides to ethanol. Since yeasts have been used for production of beverages containing ethanol for centuries, this is the predominant type of microorganism used by the industry for this application. (28)
5.2.2.1 Fermentation by Yeast The long history of glucose fermentation with yeasts has lead to techniques giving high selectivity, low by-product formation, high ethanol yield, high productivity and good tolerance for different proc-ess conditions. Since the yeast is an organism and not just an enzyme or a catalyst, it requires certain nutrients for growth. The carbohydrate source, i.e. the raw material, often contains the necessary nutri-ents but sometimes additives are needed. For yeast, the necessary nutrients are carbon, nitrogen, phos-

15
phorus, sulphur, oxygen, hydrogen and smaller amounts of some inorganic ions as well as vitamins, nucleic acids and amino acids. (28) Ethanol is produced by anaerobic fermentation where one molecule of glucose is converted into two molecules of ethanol and two molecules of carbon dioxide. (28) C6H12O6 → 2 C2H5OH + 2 CO2 If all of the sugar could be used for ethanol production, 1 g of glucose would give 0.51 g of ethanol but since a smaller amount is used for yeast growth, the yield is 90-95% of that. The formation of by-products, i.e. glycerol and succinate, also contributes to a lower yield. Different species of yeast can ferment different types of monosaccharides but one common characteristic is that no known yeast can produce ethanol from pentoses. Some species can ferment pentoses during aerobic conditions but when oxygen is present, the monosaccharides are oxidised completely to carbon dioxide and water. Almost all types of yeast can ferment most hexoses, e.g. glucose, maltose and mannose, anaerobically to ethanol. Frequently used yeast species for ethanol production are Saccharomyces cerevisiae (Baker’s yeast), Saccharomyces uvarum (a.k.a. Saccharomyces carlsbergensis), Candida utilis, Sac-charomyces anamensis, Schizosaccharomyces pombe and different species of Kluveromyces. The first three of them are the most commonly used. (28) The sugar concentration during fermentation must be kept below 14% since higher concentrations damages the yeast cells. Ethanol is toxic to yeast and the growth rate is clearly affected at concentra-tions above 10 g/l. At concentrations above 110 g/l neither growth nor fermentation occurs. Even though the fermentation should be performed under anaerobic conditions, oxygen sparging through the broth is required for optimal yeast activity. A pH value below 5 efficiently counteracts infection by bacteria in the fermentor and the optimum for S. cerevisiae is 4.5. Provided that the pH is above 3.5 and below 6, the reaction rate is kept high. The optimum temperature for yeast growth is around 40°C for brewer’s yeast. In general, optimal yield for batch processes are achieved at slightly lower tem-peratures. Cooling might be necessary since the fermentation is exothermic and gives 586 J/g glucose fermented. (28)
5.2.2.2 Fermentation by Bacteria As mentioned earlier, bacteria can also ferment sugars to ethanol. The main advantage with the use of bacteria for ethanol production is that some species can ferment pentoses. Zymomonas mobilis has, as opposed to most other bacteria, a high tolerance towards ethanol and is very suitable for sugar fermen-tation. Attempts have been made to design bacteria that can ferment both hexoses and pentoses to ethanol. One such designed microorganism is recombinant Escherichia coli, which by nature can fer-ment pentoses, modified with genes for hexose fermentation from Z. mobilis. There are also geneti-cally modified strains of Z. mobilis that can ferment pentoses. None of these modified bacteria can ferment pentoses as efficiently as they can ferment hexoses and during the process, the formation of by-products is substantial. (28)
5.2.2.3 Fermentation Modes Fermentation can be performed batch-wise or continuously, or something in between, e.g. semi-continuously. Even though continuous processes are often more suitable for large-scale production in general, most ethanol production is performed in batch mode. The ethanol yield for batch fermentation is 75-95%, the productivity is 1.8-2.5 g/(l·h) and the ethanol concentration at termination is 10-16 vol%. The productivity can be somewhat improved by recycling of the yeast cells. Important disad-vantages with batch fermentation are low productivity, complicated process control, the need for dis-charge, washing and reloading as well as a high workload. The positive features of batch fermentation are its simplicity and the possibility for damage control. Since each batch is fermented separately, infection is not spread and only the contents of the affected tank must be rejected. (28) Practically all of the problems concerning batch fermentation are avoided in the continuous process. Continuous fermentation is performed in a CSTR and can be with or without cell recycle. Without cell

16
recycle, the productivity is up to 6 g/(l·h) for approximately 10% sugar in the feed. If the yeast cells in the outlet stream are separated, i.e. by centrifugation, and recycled to the reactor, the productivity can be as high as 30-51 g/(l·h). The separation is however complicated and therefore expensive. (28)
5.2.2.4 Retention of Yeast Cells inside the Fermentor There are some other solutions by which the yeast cells are retained in the fermentor. Self-flocculating yeast cells can be used in a conventional fermentor and they are thus retained since they settle at the bottom when agitation ceases. This kind of yeasts can also be used in tower fermentors where the de-sign enables circulation and retention of the yeast without agitation. The performance of this type of reactor is impressive but the start-up is very time-consuming. In membrane bioreactors, the yeast is retained by a membrane which enables passage of nutrients, sugars and ethanol. The transport rate for these components can be increased by application of a pressure difference across the membrane which induces a flow. Since this reactor is rather complex, there are severe problems concerning operation and mechanical functions. (28) Solvent extraction can be used to enable recirculation of the fermentation broth or for fermentation with immobilised yeast cells. These methods can lead to less energy-consuming separation of the ethanol from the broth but they are still under development. If the yeast cells are immobilised on carri-ers or in a gel, their concentration in the fermentor can be increased significantly which in turn in-creases ethanol productivity. Fixed- or fluidised-bed reactors are used for this application. Low mass transfer rate is a problem since the ethanol can be accumulated in the matrix which leads to inhibition of the fermentation. If the reaction temperature is lowered, the problem is solved since the reaction and mass transfer rates at 30°C balance each other. (28)
5.2.2.5 SSF Hydrolysis of cellulose is inhibited by high concentrations of cellobiose and glucose which leads to a slow process. One method of decreasing this effect is to perform hydrolysis and fermentation simulta-neously in the same reactor. This method is called SSF or simultaneous saccharification and fermenta-tion. Since the need for purification of the sugar solution is eliminated, the accompanying 5% loss of sugar also disappears. Processes for SSF for starch and for cellulose, respectively, already exist and since Cellic® CTech2 can hydrolyse both polysaccharides, it should be possible to combine the proc-esses. The liquefaction step is still required to render the starch hydrolysable but hydrolysis of starch and cellulose as well as fermentation can be performed in one unit operation. Suitable conditions for SSF are a temperature of 32°C, a pH value around 5.0 and a residence time of 4-5 days. (21) Due to the polysaccharide content of the broth, separation of yeast cells is impossible and when cellu-lose is present, the fermentation is performed batch-wise (21). Another reason why batch fermentation must be used is that there is usually no cell growth during SSF. This reduces the sugar available for fermentation since a larger proportion of it must be consumed during yeast cultivation. (30) As men-tioned earlier, batch processes have lower productivities than continuous processes but batch-wise fermentation is still used for large-scale production so the economical aspects cannot be too bad. At good conditions, a final ethanol concentration of 8 wt% can be achieved. (21) The ethanol yield for SSF is approximately the same as for the other methods, e.g. 90-95%, while the sugar yield for the hydrolysis is around 80% (9).
5.2.3 Separation and Purification of the Ethanol The ethanol is traditionally separated from the broth by distillation, but due to the ethanol-water azeotrope at 96 vol% ethanol, production of anhydrous ethanol (99.7-99.8 vol%) requires additional purification. Another disadvantage with distillation is the high energy demand. The energy consump-tion can however be decreased by the use of heat pumps, heat exchange, vapour recompression and pressure cascading. (28)
5.2.3.1 Separation of Ethanol from the Fermentation Broth Ethanol is commonly concentrated to 96 vol%, the azeotropic composition, by the method described below. The dilute ethanol solution leaving the fermentor is preheated before it enters the first distilla-tion column which is a stripper. In this step, the ethanol concentration is increased to just below 50

17
wt% in the overhead product stream (21) while the ethanol content of the bottom product, the stillage, is below 0.02 wt%. (28) The stillage contains primarily water but also all non-volatile components, e.g. the proteins, carbohydrate residues and some of the fermentation by-products. In the second col-umn, the rectifier, the ethanol is distilled up to the azeotrope. With this method, all by-products that are more volatile than ethanol, e.g. aldehydes, ethers and methanol, end up in the azeotropic ethanol. In fuel ethanol production, these volatile by-products are not removed since the amounts are small and since they are readily combusted in the engine, thereby contributing to the energy available in the fuel. The fusel oils, i.e. higher alcohols such as butanediol, leave the rectifier as a small side stream. (21) (28) If a higher purity is required, e.g. for alcoholic beverages, an aldehyde column is added between the stripper and the rectifier. In the aldehyde column, the liquid is diluted with water which enables sepa-ration of the volatile by-products. Since water is added, more water must be removed in the rectifier which increases the energy demand and the addition of a process unit raises the investment costs. (21) (28) Solvent extraction by a liquid that is immiscible with water, e.g. dibutyl phthalate, can be used for ethanol recovery. Distillation is still used for separation of the ethanol and the solvent but since no azeotrope is formed, the energy demand is reduced. Supercritical carbon dioxide can also be used for ethanol extraction followed by removal of the gas by flashing. Since carbon dioxide is formed during fermentation, it is readily available and this method can more than halve the energy consumption compared to traditional distillation. (28)
5.2.3.2 Dehydration of Azeotropic Ethanol Anhydrous ethanol can be produced from azeotropic ethanol by extractive distillation where an en-training agent, such as benzene, heptane or cyclehexane, is used for formation of a ternary azeotrope. The anhydrous ethanol is the bottom product while the overhead product is the ternary azeotrope con-taining ethanol, water and entraining agent. After condensation, the entraining agent is recovered and returned to the dehydrating column. The use of an entraining agent enables atmospheric distillation for which lower temperature heat can be used. Different adsorption methods can also be used for dehydra-tion of azeotropic ethanol. In the industry, molecular sieves are commonly used for this application. The dehydration column is packed with a zeolite or a resin with pores through which water but not ethanol can pass and absorb. (28) Through e-mail and telephone contact with Christina Bång at SinChriJo (31), the Swedish agent for the Swiss company Zeochem AG Uetikon (32), technical data and price information on suitable mo-lecular sieves have been acquired. The molecular sieve of interest is Zeochem Z3-03 which is spe-cially designed for ethanol dehydration (33). Since regeneration is required when the molecular sieves have been saturated with water, two columns are needed. While one is regenerated, the other one is in operation. PSA, i.e. pressure swing adsorption, will be applied which means that adsorption is per-formed in the gas phase and that regeneration is performed by lowering of the pressure. The regenera-tion can be improved by passage of anhydrous ethanol through the column during the process. (34)
5.2.3.3 Other Separation Methods Some methods for ethanol purification with membranes have been developed. Anhydrous ethanol can be produced by pervaporation where water is filtrated off through a membrane which retains the etha-nol. A vacuum on the permeate side vaporises the water at the membrane which gives the driving force for the process. Reverse osmosis can primarily be used for pre-concentration of the ethanol to 10% before distillation. A membrane similar to the one used for pervaporation retains the ethanol while the water permeates and the driving force is given by a pressure of 4-7 MPa. Since the move-ment of water, but not that of ethanol, is partially prevented by textile yarns, this material can be used for separation of the two liquids. The process resembles the adsorption method with molecular sieves but it is still under development (28).

18
5.2.4 Recommendations Since the enzyme for hydrolysis of cellulose has the same effect on starch, there is no reason not to combine these processes. Liquefaction of the starch with α-amylase is though necessary. Regarding the pre-treatment of the cellulose, it might be redundant due to two factors. There is no lignin or hemi-cellulose present which means that the cellulose is fully accessible and the cavitation has already rup-tured the cell walls. If pre-treatment is in fact necessary, it should suffice with mild hydrothermolysis. In the final process design, pre-treatment of the cellulose is omitted. The fermentation is preferably performed using batch-wise SSF since the hydrolysis of cellulose can be driven by the consumption of cellobiose and glucose at the same time as many process units can be omitted with this method. Three units are reduced to one when hydrolysis and fermentation are com-bined and filtration between these steps is no longer required. Such simplifications generally reduce investment costs. Several fermentors can be run in parallel but at different stages of the processes thus giving a practically constant flow of ethanol. Baker’s yeast (S. cerevisiae) will be used since this is a well-known fermentation microorganism and since it can ferment most of the carbohydrates in the algal flour. The carbon dioxide produced will leave the broth and accumulate at the top of the fermen-tor. Piping will be added to transport the carbon dioxide to the bioreactors. Ethanol purification will be performed by the two-step distillation since the method is well-established and simple. Since the amount of volatile by-products is low and since they do not constitute a problem in fuel ethanol, the aldehyde column is omitted. It is assumed that none of these by-products will cause enzyme poisoning in the transesterification. The energy demand will be minimised by heat exchange. The methods employing solvents are avoided due to the costs and health and environment issues asso-ciated with solvent use in general. Carbon dioxide extraction and the method with yarn are considered too exotic and the minimal concentration increase achieved by reverse osmosis is too small to justify an extra process unit. Two columns with molecular sieves from Zeochem will be used for dehydration of azeotropic ethanol. Since the price of anhydrous ethanol is higher than that of 96 vol% ethanol, all surplus ethanol will be dehydrated. The process design resulting from the suggestions made above is shown in the process flow sheet in Figure 5.2.

19
Nanofiltration
Algal FlourSalt Water
Algal FlourSalt Water
Salt Water
Diafiltration
Saline Water
Fresh Water
Dextrinization
α-amylase
SSF
ProteinsSugarStarch
CelluloseBrackish Water
Cellic CTech2
Stripper
ProteinsEthanol (8 wt%)
Fermentation By-ProductsCarbohydrate residues
Brackish Water
Rectifier
Fusel Oils
Water
Azeotropic Ethanol(96 vol%)
Water
Molecular Sieve Columns
Anhydrous Ethanol
To Transesterification
Azeotropic Ethanol(96 vol%)
Water
Azeotropic Ethanol(96 vol%)
Water
To Transesterification
ProteinsCarbohydrate residues
Brackish WaterGlycerol
Organic Acids
To SeparationTo the Photobioreactors To the Sea
Ethanol (50 wt%)Water
AldehydesMethanolFusel Oils
Algal FlourBrackish Water
Carbon Dioxide
To Photobioreactors
Yeast
EthanolWater
Anhydrous Ethanol
Anhydrous Ethanol
Anhydrous Ethanol
To Storage Tank
Gelatinization
Algal FlourBrackish Water
Figure 5.2: Process flow sheet describing the ethanol production. In practice, there will be several parallel process lines with gelatinization, dextrinization and SSF.
5.3 Fermentation By-Products During fermentation of sugars to ethanol by yeast, 3-5% of the sugars are converted to by-products, with glycerol being the most abundant one. This is traditionally considered purely problematic and process development has lead to processes where the by-product formation is minimised. For this rea-son, records of the amounts of by-products formed are scarce. Data, from a study performed by G. Amin et al. (19), for fermentation with the yeast Saccharomyces bayanus are used for estimation since this yeast species belongs to the same genus as Baker’s yeast. The concentrations of by-products after batch fermentation with S. bayanus are given in Table 5.2. (19) Acetoin is another name for 3-hydroxy-2-butanone, i.e. a four-carbon ketone with a hydroxyl group (35). Table 5.2: Distribution of fermentation products after fermentation of sugar by S. bayanus for batch-wise operation and continuous operation with immobilised cells, respectively. The initial sugar concentration was 151.1 g/l for the batch process and 150.0 g/l for the continuous process (19). Fermentation products Concentration (g/l) Share of sugar consumed (%) Fermentation mode Batch-wise Continuous Batch-wise Continuous Ethanol 69.85 71.20 90.40 92.81 Acetoin 0.15 0.20 0.20 0.27 Butanediol 0.52 0.40 0.69 0.53 Glycerol 3.63 2.85 2.35 1.86 Acetic acid 0.81 0.79 0.80 0.79 Lactic acid Traces 0.08 - 0.05 Succinic acid 0.38 0.30 0.19 0.15 Sum of by-products 5.59 4.62 4.23 3.62

20
As mentioned in Separation and Purification of the Ethanol under Ethanol Production, the acetoin and other highly volatile by-products will end up in the azeotropic ethanol while the fusel oils are separated in the rectifier. The acids are dissolved in the water and will leave the stripper in the stillage (21). The glycerol has a boiling point of 290°C and is completely miscible with water which indicates that this by-product will accompany the water and the acids in the stillage (36). Separation of the ace-toin, methanol, aldehydes and ethers requires the addition of an aldehyde column between the stripper and the rectifier, as described in Separation and Purification of the Ethanol under Ethanol Production. For separation of the individual components of the mixture obtained, further distillation or other sepa-ration methods are probably needed. Generally, these highly volatile fermentation by-products are not removed in fuel ethanol production since they contribute to the energy content of the fuel. (21) This indicates that recovery of these compounds is unprofitable.
5.3.1 Recovery of Glycerol Purification of glycerol in water solutions containing 50% glycerol or more can be performed by dis-tillation and/or evaporation in different combinations. The concentration can be increased to 90-95% in these units. If the salt content is high, ion exclusion chromatography might be needed for satisfac-tory final purity. If thin film evaporation is used for water removal, the salt will also be separated in that process. For solutions with approximately 50% glycerol and low salinity, the salt can be removed by ion exchange. A final glycerol purity of more than 99.5% can be obtained in a falling film evapora-tor. (36) Methods for separation of glycerol from very dilute solutions have not been found in the lit-erature.
5.3.2 Recovery of the Acids in the Stillage The common method for separation of acetic acid from water is distillation but this is only economical if the initial concentration of the acid is high. For separation of acetic acid from more dilute solutions, extractive distillation, azeotropic distillation or solvent extraction are suitable methods. Extractive distillation involves scrubbing of the vapour stream with acetic acid and water with a high-boiling solvent in which one of them is dissolved. A substance that lower the boiling point of water, e.g. an ester, an ether, benzene or a chlorinated hydrocarbon, is used in azeotropic distillation. Solvent extrac-tion is suitable for separation of acetic acid from dilute water solutions where the acid concentration is 0.5-5 wt%. A combination of an organic solvent, usually an alkane, and an organic base, usually a tertiary amine such as trioctylamine, is commonly used for extraction. The acetic acid is subsequently removed by distillation and separation of the water and the organic solvent is simple since they are practically immiscible. (37) Succinic acid can be produced as the main product by fermentation of sugar by certain bacteria. Sepa-ration of the acid from the resulting broth has traditionally been performed by simultaneous fermenta-tion and precipitation of calcium succinate by addition of Ca(OH)2 or CaCO3. The disadvantage with this method is the extensive formation of CaSO4 as a valueless by-product. Another common separa-tion method is reactive extraction with an amine-based solvent. This method is though rather sensitive to the presence of impurities, proteins and salt. Electrodialysis with ion exchange membranes is a method under development which has been successful in combination with simultaneous fermentation. Extensive membrane fouling and high membrane costs are the main problems. In a study from 2009, Qiang Li et al. (38) has investigated the possibility of separation of succinic acid from fermentation broth by adsorption and the use of weak alkaline anion exchange adsorbents gave good results. Impor-tant advantages with adsorbents are that they are relatively cheap and that the regeneration is fast and simple. (38) Prof. Bernt Nilsson at the Department of Chemical Engineering at Lund University, Faculty of Engi-neering also suggested ion exchange adsorption as a suitable separation method for succinic acid. An initial capture where the whole stillage stream passes an ion exchange column will adsorb practically all acids present, provided that they are deprotonated which they will be at pH 7-8. The other compo-nents in the stillage can be washed out of the column and subsequent elution will hopefully give pure

21
succinic acid and pure acetic acid. If further separation of the acids is required, a second much smaller column can be used, for which the conditions for separation of the two acids are optimised. (26)
5.3.3 Recommendations Recovery of aldehydes, ethers and methanol by the use of an aldehyde column does not seem eco-nomical and therefore, these by-products will be left in the ethanol. Since the fusel oils are removed in the rectifier, these by-products can be sold. Glycerol is the most abundant by-product from the fermen-tation but no separation methods suitable for such low concentrations have been found in the literature. Christian Hulteberg (PhD), the inventor of the Biofuel-Solution process, did however suggest separa-tion of the glycerol, the acids, the dissolved sugar and most of the water from the stillage by centrifu-gation. The water content will subsequently be reduced by evaporation and the water that is removed can be sent to the biogas production. The resulting solution will be sent to the boiler where water and glycerol are vaporised before entering the first reactor in the Biofuel-Solution process. Since the sugar stays in the solution, it can be drawn off in a purge stream and sent either to the SSF or to the biogas production (16). In order to maintain a sufficiently high carbon-to-nitrogen ratio in the anaerobic di-gestion and since the sugar which is not fermentable might accumulate, the latter alternative is chosen. There are potent methods for separation of acetic acid from solutions with water and succinic acid from fermentation broth but the concentrations of these acids in the stillage are extremely low while the methods are developed for more moderate concentrations. As mentioned in Glycerol Processing, the propionic acid can be recovered by ion exchange chromatography. The same method can be ap-plied for recovery of the acetic acid and the succinic acid which will also accompany the water in the distillation in the Biofuel-Solution process. Regeneration of the ion exchange resin is assumed to be accomplished by the use of hydrochloric acid. A flowsheet describing the method of recovery of glyc-erol and organic acids is found in Figure 5.3. Since there is a surplus of carbohydrates, some of the algal flour could be used for fermentation to succinic acid instead of ethanol. Due to the difficulty of finding updated methods for production and recovery of succinic acid, as well as time restrictions, this alternative is just mentioned and no calcula-tions for implementation have been performed.
Stillage
WaterOrganic Acids
WaterGlycerol
Organic AcidsSugar
Centrifuge
Evaporator
WaterGlycerol
Organic AcidsSugarStarch
CelluloseProteins
WaterGlycerol
Organic AcidsSugar
Water
Ion ExchangeChromatography
WaterOrganic Acids
OrganicAcids
HCl
Boiler
WaterSugar
WaterGlycerol
Organic Acids
Biofuel-Solution Process
BiogasProduction
EthanolDistillation
Figure 5.3: Simple description of how the glycerol and the organic acids can be recovered. The representation of the ion exchange chromatography is supposed to depict adsorption in the left column and simultaneous regeneration of the right column.

22
5.4 Biogas Production No suitable application for the proteins from the algae has been found, there are residual carbohydrates from the fermentation and small amounts of organic acids from the Biofuel-Solution process and the energy demand for the biorefinery is rather substantial. Therefore, these residues will be anaerobically digested to biogas which can be combusted on site for production of heat and electricity.
5.4.1 The Substrate The residues from the fermentation to ethanol are used as substrate in the biogas production. The car-bohydrates have been exposed to high temperatures but still need to be hydrolysed. The proteins are probably denatured but intact and they also need to be hydrolysed. The amount of lipids in the sub-strate is very small. Proteins constitute the largest part of the inflow and the carbohydrates will be in the relation one to one on weight basis. During the process the substrate will not be completely de-graded, about 80 % of the substrate is estimated to be converted (39).
5.4.2 The Reactors The total solids (TS) of the stillage entering the biogas production are 11 % of the total mass flow. Tank reactors rather than high flow rate reactors such as UASB (upflow anaerobic sludge blanket) reactors should be chosen because a higher dry weight content in the feed is allowed without the risk of clogging. The system of tanks is robust compared to high rate anaerobic reactors, in which the process is easily disrupted by inhibitors or changes in flow rate. (40) The tank system is also capable of handling an external carbon source as long as it is pumpable.
5.4.3 The Coupling of Reactors Since the substrate is estimated to be easily biodegradable the hydraulic retention time could be as low as 20 days (39). If the pH is higher the retention time needs to be expanded to 30 days because of the lower production rate. By using a tank series the risk of substrate being washed out before it has been treated is reduced.
5.4.4 Nitrogen Inhibition With a lot of proteins in the substrate there is a strong possibility of nitrogen inhibition which can lead to a collapse of the process if not prevented or treated (40). Ammonium is released when proteins are degraded and forms equilibrium with ammonia, which is toxic to the methanogenic bacteria. Since the bacteria only sense the actual concentration of ammonia in their surrounding, a substrate rich in nitro-gen can be successfully degraded if the concentration is low enough. Ammonia inhibition has been found at as low concentrations as 150 mg/l but well functioning processes has been documented at 1000 mg/l where the microorganisms have adapted to the environment (39). High ammonia concentra-tions can be found in processes using nitrogen rich substrate such as cow manure (40). The pH dependence of the ammonia - ammonium equilibrium plays an important role. However due to the complex buffering system in an anaerobic digestion the pH cannot be estimated without experi-ments (39). Would the pH be found to be high, the retention time must be increased to 30 days and the volume of the tanks must be increased to compensate for the slower degradation (39).
5.4.5 The Temperature of the Process Thermophilic anaerobic digestion is performed at 55°C where methane is produced at higher rates. Smaller volumes are then needed for the reactors. However, the higher rate makes the process more sensitive to a high pH or toxic substances that cause inhibition. Mesophilic digestion is performed at 37°C and is a more robust process. (40) Thermophilic digestion would be possible if the pH of the process is neutral and the stability of the process can be ensured. Because of the difficulties of estab-lishing the pH, and thereby if nitrogen inhibition would occur, through calculations the mesophilic digestion is chosen.

23
5.4.6 The Residues The residues contain water and organic material as well as microorganisms and nutrients. The algae are cultivated in a controlled environment and should therefore not contain any harmful substances. The nutrients in the residues from the biogas production can be returned to the algae cultivation and the organic compounds can be utilized by the algae a source of organic carbon during night time. Nu-trients in the residues will mainly be nitrogen in the form of ammonium dissolved in the water phase and phosphorous bound in the digest. It is profitable to recirculate the digested material to the photo-bioreactors if the nitrogen content can replace at least 20 % of the added urea (41). The digest contains organic carbon and phosphorous and the nitrogen is mainly found in the water phase. This makes it possible to purify the nutrients and sell them separately for fertilization (39). Another alternative is to the whole stream as fertilization and irrigation on farms.
5.4.7 The Energy Production To determine the potential methane production of the process the composition of the substrate must be known. However, estimations can be made if the amount of fat, proteins and carbohydrates in the sub-strate is determined. The theoretical yield is the maximum amount of methane that can be produced from the organic material. An average chemical formula for carbohydrates, fats and proteins is pre-sented in Table 5.3 (42).The theoretical methane production is calculated per ton of VS into the reac-tor, where VS is the amount of organic substrate (43). Table 5.3: The theoretical methane production is estimated by using average formulas for proteins, fat and carbohy-drates. The amount of organic material is estimated as volatile solids (VS) (43). Component Chemical formula Theoretical biogas potential
(Nm3 CH4 per tonne VSin) Fat C57H104O6 1014 Protein C5H7NO2 496 Carbohydrate (C6H10O5)n 415
5.4.7.1 Gas Purification The biogas produced contains a large quantity of carbon dioxide. There is no need to upgrade the methane content if the purpose is to burn it directly in the boiler, but if it is to be sold the methane must be enriched. One method is to use a water scrubber where the carbon dioxide dissolves into the water phase more easily than the methane. To make it more efficient the water can be exchanged to a liquid that absorbs carbon dioxide better, like the amine (used at Sleipner). Another separation method is to lower the temperature of the gas until carbon dioxide precipitates as snow, while the methane is still in the liquid phase (used at Snøhvit). The carbon dioxide can also be separated by pushing the gas through the algae cultivation where it will dissolve and the methane will be somewhat enriched, how-ever there is need for further purification methods if the methane gas is to be sold commercially (44).
5.4.8 Recommendations A retention time of 20 days will be applied and the anaerobic digestion is to be performed in tank reac-tors at 37°C. In total the biogas process will be designed as three parallel tank series with two tanks in each and a 10 day retention time per tank, see Figure 5.4. Provided that the amount of nitrogen in the residues exceeds 20% of the amount consumed by the algae, the residues will be used as nutrients for the algae.

24
Biogas
Residues
Organic AcidsWater
Stillage
Figure 5.4: Process flowsheet for the biogas production.
6 Process Description A simplified black box flowsheet for the total process is shown in Figure 6.1 while the detailed proc-ess flowsheet with denotations is found in Figure A.1 in Appendix A. The microalga Nannochloropsis salina is to be cultivated in salt water in photobioreactors from AlgaeLink and harvested by floccula-tion, accomplished by an increase of the pH value, followed by gravity sedimentation. Since the cell walls might be hydrolysed at such a high pH value, this method should probably be replaced, e.g. by membrane filtration. The algal oil will be recovered by cavitation, during which the cells are ruptured, and by subsequent phase separation in a stirring settling tank. After removal of phospholipids by de-gumming, the algal oil is to be transesterified. The algae oil is transesterified in three steps where 96 vol% ethanol is used in the first two steps and anhydrous ethanol in the final step. Before the third step the ethanol and water is removed by flashing and the glycerol is separated in a centrifuge. Afterwards the water and the ethanol removed in the flash will be recirculated to the distillation. Using the enzymatic catalysis, the free fatty acids will be in-cluded in the transesterification. The enzymes will be washed and regenerated to lower the costs. The remaining anhydrous ethanol after the third step is flashed off and reused. Glycerol is finally removed in a second centrifuge and the biodiesel is transported to a storage tank. In the Biofuel-Solution process, the glycerol produced in the transesterification is to be converted into n-propanol. The ingoing stream will contain four times as much steam as glycerol and therefore sepa-ration by distillation is required before the last step. Since this water also contains propionic acid, ace-tic acid and succinic acid, these components will be recovered by ion exchange chromatography. Ethanol for the transesterification is to be produced by simultaneous saccharification and fermentation (SSF) of the carbohydrates in the algal flour. The SSF will be performed with Baker’s yeast and cellu-

25
lose degrading enzymes, and preceded by liquefaction of the starch. The carbon dioxide produced during the fermentation can be lead to the photobioreactors and used by the algae for photosynthesis. Since the yeast cells are sensitive to salt, the salt concentration of the algal flour slurry must be re-duced to one tenth of the initial value, or less, before fermentation. This can hopefully be achieved by diafiltration with nanofiltration membranes. Azeotropic ethanol (96 vol%) is to be recovered by a two step distillation and the anhydrous ethanol required in the last transesterification step will be purified by the use of molecular sieves. The ethanol produced will more than cover the requirements for the transesterification and the surplus can be sold. Since the price of fuel ethanol is higher than that of ethanol for technical use (96 vol%), the surplus ethanol will be dehydrated to fuel-grade quality. Valuable by-products in the stillage, i.e. glycerol, succinic acid and acetic acid, will be recovered by centrifugation followed by water reduction by evaporation. The resulting stream will be sent to the Biofuel-Solution process where the sugar and some of the water is separated and sent to the biogas production. As mentioned above, the acids will be recovered by ion exchange chromatography and the additional glycerol contributes to a higher pro-duction rate for n-propanol. The remaining stillage, mainly constituted by proteins and carbohydrate residues, will be anaerobically digested to biogas. The stillage will be anaerobically digested to produce methane in a reactor combination constituted of three parallel series. There will be two tanks in each series and the hydraulic retention time will be 10 days for each tank. Substrate will be continuously fed to the process. The biogas produced, which con-tains mainly methane and carbon dioxide, will be used as energy source combusted in the boiler. Since the residues are rich in nitrogen and organic carbon, it will be used as nutrients for the algae cultiva-tion.
Algae Cultivation Oil Extraction & PretreatmentAlgae
Biodiesel Production
Glycerol Processing
Desalination Ethanol Production
Biogas Production
Algal Residues Algal Flour
Algae Oil
Glycerol
Biodiesel
Ethanol
Stillage
n-Propanol
Nutrients
Fresh Water
Salt Water
Biogas
Carbon Dioxide
Hydrogen
Saline Water
Combustion
Energy
EnzymesYeast
Butanediol
GlycerolAcids
Acids
Figure 6.1: Simplified black-box flowsheet for the whole process.

26
7 Mass and Energy Calculations In the final evaluation of the plant design suggested in this report, the production and consumption rates of different components as well as the net energy consumption, play an important role. Calcula-tion of the volumetric flows is, in addition, necessary for the subsequent dimensioning of process units which is required for estimation of the investment costs. Based on the resulting flow rates, the energy demand has been estimated.
7.1 Flows by Mass and Volume The mass flow rates for each component in each major stream have been calculated based on the reac-tion stoichiometry, the process condition specifications and the assumptions made. As mentioned in Adjustment of the Process, the FFA removal step has been omitted from the oil pre-treatment. Apart from that, the mass flow rates from algae cultivation to algal oil ready for transesterification have been calculated in the same manner as in the former report (Biodiesel Production from Microalgae –A Fea-sibility Study (2)). The design capacity is the requested annual production of 100,000 tonnes of bio-diesel. This required an approach where the mass flows in the transesterification were determined first, followed by those in the oil-pretreatment, oil recovery and algae cultivation. The mass flow of algal meal was then used for calculation of the ethanol produced. Mass flows concerning the by-product recovery were calculated next and subsequently, the mass flows in the Biofuel-Solution process were determined. Finally, the mass flow of biogas was estimated based on the mass flow and composition of the stillage. The molar weights and the densities required for the calculations are given in Table B.1 - Table B.6 in Appendix B. Since the annual operating time specified in Biodiesel Production from Microalgae –A Feasibility Study (2) is 335 days, the same value has been used in these calculations. All calculations have been performed in the numerical computing program MATLAB. The programming code is found in Appendix L.
7.1.1 Transesterification The transesterification is performed in three steps. It is assumed that the formation of by-products is insignificant and that the only reaction taking place is the one described below. Triglyceride + 3 Ethanol → 3 Biodiesel + Glycerol As seen in the reaction formula, three moles of ethanol is consumed per mole of triglyceride that re-acts, i.e. one equivalent of ethanol is defined as three moles ethanol per mole triglyceride. All ethanol equivalents specified are based on the amount of triglycerides entering the first step. Specifications and assumptions for each reaction step are given below.
7.1.1.1 Step 1 • 1/3 equivalent ethanol (96 vol%) added • The molar conversion is 25%, based on the initial amount of triglycerides
7.1.1.2 Step 2 • 2/3 equivalent of ethanol (96 vol%) added • The total molar conversion after step 2 is 90%, based on the initial amount of triglycerides • All of the remaining ethanol including the water is removed by flashing • All of the glycerol separated in the centrifuge
7.1.1.3 Step 3 • 1/2 equivalent of anhydrous ethanol added • The molar conversion is 98%, based on the remaining amount of triglycerides • The surplus of ethanol is separated by flashing and recirculated

27
7.1.2 Algae Cultivation, Oil Separation and Oil Pre-Treatment As mentioned in the introduction to the mass calculations, the only modification of the algae cultiva-tion, oil separation and oil pre-treatment described in Biodiesel Production from Microalgae –A Fea-sibility Study (2) made is the omission of the FFA removal. Otherwise, the same assumptions as in Biodiesel Production from Microalgae –A Feasibility Study (2) are used for the calculations. The amounts of phosphoric acid and sodium hydroxide required for degumming are not specified. There are two reasons for this. The first is that the information given in Biodiesel Production from Microalgae –A Feasibility Study (2) is not enough to perform such calculations. The second is that the amounts needed are very low and therefore the costs for these chemicals are most likely negligible, which is also concluded in Biodiesel Production from Microalgae –A Feasibility Study (2). Assumptions made for the calculations are listed below.
7.1.2.1 Harvesting and separation • 1 wt% algae in the photobioreactors at harvest • 85 wt% of the algae harvested are separated in the subsequent flocculation and sedimentation
while the rest is recirculated to the photobioreactors • 85 wt% of the water harvested is recirculated to the photobioreactors after sedimentation • The algal flour slurry leaving the stirred settling tank contains 5 wt% algal flour
7.1.2.2 Oil separation and pre-treatment • 40 wt% oil in the algae • 1 wt% phospholipids in the algal oil • The stream with algal oil leaving the settling tank is composed of 50 wt% oil and 50 wt% wa-
ter • All remaining water in the oil stream after the settling tank is removed in the centrifuge
7.1.3 SSF In the SSF, hydrolysis of starch and cellulose is performed simultaneously with fermentation. This is preceded by liquefaction of the starch in which the starch polymers are split into short chains of sugar monomers. For simplification of the calculations, it is assumed that only physical changes occur in the liquefaction and that the actual breakage of chemical bonds happens in the SSF. This does not affect the final result but the mass flow of starch is assumed to be the same after liquefaction as before, even though this will not be the case in practice. Complete liquefaction of the starch is assumed. The hy-drolysis and the fermentation are described with reaction formulas below. Hydrolysis: (C6H10O5)n + n H2O → n C6H12O6 Fermentation: C6H12O6 → 2 C2H5OH + 2 CO2 This simple stoichiometry gives n moles monosaccharides per mole cellulose or starch that is hydro-lysed while n moles water is consumed. One mole monosaccharides gives 2 moles ethanol and carbon dioxide, respectively. The assumptions made are summarised below.
• Algae composition: 15 wt% proteins, 30 wt% cellulose, 10 wt% starch and 5 wt% sugar • The molar conversion for the hydrolysis is 80%, based on the initial amount of starch and cel-
lulose • 84.2 wt% of the sugar and the starch in the algae can be fermented by the yeast, see Table B.3
in Appendix B • 94.63 mol% of the monosaccharides are fermented • The molar conversion of monosaccharides to ethanol and carbon dioxide is 90.40% while the
rest of the monosaccharides that react form by-products • Carbon dioxide production is estimated solely based on the ethanol formation • The final ethanol concentration is 8 wt%, based on the amount of liquid in the fermentation
broth

28
• The ideal gas law is applicable The molar conversion specified for the fermentation is a compromise based on the theoretical value of 90-95%. According to the study performed on S. bayanus by G. Amin et al. (19), approximately 90% of the sugar is converted to ethanol while slightly more than 4% forms by-products during batch-wise operation. As mentioned in Fermentation By-Products, the fusel oils are separated in the rectifier, the more volatile by-products end up in the biodiesel and the glycerol, as well as the acids, accompanies the stillage. Thereby, the volatile by-products can be included in the ethanol since they constitute a part of the final biodiesel and the by-products that end up in the stillage can be seen as a part of the unfermented carbohydrates. The fusel oil stream is very small and can be neglected. An estimation of the by-product formation has been made based on the ethanol produced but these small mass flows are not included in the mass balances for the whole plant. Based on these concentration relations listed below, weight percent factors were defined. 69.85 g/l of ethanol (90.4% yield) gives:
• 0.15 g/l of acetoin (0.20% yield) • 0.52 g/l of butanediol (0.69% yield) • 3.63 g/l of glycerol (2.35% yield) • 0.81 g/l of acetic acid (0.80% yield) • 0.38 g/l of succinic acid (0.19% yield)
7.1.4 Membrane Filtration The membrane filtration will be performed in two steps. Firstly, the water content is reduced to the level required in the SSF. This minimised the amount of fresh water needed for the subsequent wash-ing. Secondly, diafiltration is performed on the concentrated algal flour-water slurry. In this process, fresh water will be added continuously, while water from the slurry is continuously filtered off. Since it is difficult to perform calculations for continuous diafiltration, the process will be approximated with step-wise addition of water and filtration. A small amount of fresh water is added and the same amount is filtered off until the desired salt concentration has been reached. If the added amount is small enough, the approximation is rather good. (22) The assumptions made are listed below.
• 3.5 wt% salt in the water initially • 0.1 wt% salt in the fresh water • 0.3 wt% salt in the algal flour-water slurry after filtration • 1 wt% fresh water added per step, based on the amount of water in the algal flour-water slurry
The mass balance for the salt in each step with dilution and filtration is given below. The permeate is the fluid that passes through the membrane while the retentate is the fluid that is held back by the membrane. xwt,salt,diluted is the weight fraction of salt in the slurry after addition of fresh water. fdilution is the weight fraction of fresh water added in each step. The algorithm represented by the last formula was used to determine the salt concentration after each step and iteration gave the number of steps required. Mass flows of permeate and fresh water were determined by simple mass balances. 𝑚𝑚𝑠𝑠𝑠𝑠𝑠𝑠𝑠𝑠 𝑤𝑤𝑠𝑠𝑠𝑠𝑤𝑤𝑤𝑤 ,𝑖𝑖𝑖𝑖 ∙ 𝑥𝑥𝑤𝑤𝑠𝑠 ,𝑠𝑠𝑠𝑠𝑠𝑠𝑠𝑠 ,𝑠𝑠𝑠𝑠𝑠𝑠𝑠𝑠 𝑤𝑤𝑠𝑠𝑠𝑠𝑤𝑤𝑤𝑤 + 𝑚𝑚𝑓𝑓𝑤𝑤𝑤𝑤𝑠𝑠ℎ 𝑤𝑤𝑠𝑠𝑠𝑠𝑤𝑤𝑤𝑤 ,𝑖𝑖𝑖𝑖 ∙ 𝑥𝑥𝑤𝑤𝑠𝑠 ,𝑠𝑠𝑠𝑠𝑠𝑠𝑠𝑠 ,𝑓𝑓𝑤𝑤𝑤𝑤𝑠𝑠ℎ 𝑤𝑤𝑠𝑠𝑠𝑠𝑤𝑤𝑤𝑤
= 𝑚𝑚𝑠𝑠𝑠𝑠𝑠𝑠𝑖𝑖𝑖𝑖𝑤𝑤 𝑤𝑤𝑠𝑠𝑠𝑠𝑤𝑤𝑤𝑤 ,𝑝𝑝𝑤𝑤𝑤𝑤𝑚𝑚𝑤𝑤𝑠𝑠𝑠𝑠𝑤𝑤 ∙ 𝑥𝑥𝑤𝑤𝑠𝑠 ,𝑠𝑠𝑠𝑠𝑠𝑠𝑠𝑠 ,𝑑𝑑𝑖𝑖𝑠𝑠𝑑𝑑𝑠𝑠𝑤𝑤𝑑𝑑 + 𝑚𝑚𝑠𝑠𝑠𝑠𝑠𝑠𝑖𝑖𝑖𝑖𝑤𝑤 𝑤𝑤𝑠𝑠𝑠𝑠𝑤𝑤𝑤𝑤 ,𝑤𝑤𝑤𝑤𝑠𝑠𝑤𝑤𝑖𝑖𝑠𝑠𝑠𝑠𝑠𝑠𝑤𝑤 ∙ 𝑥𝑥𝑤𝑤𝑠𝑠 ,𝑠𝑠𝑠𝑠𝑠𝑠𝑠𝑠 ,𝑑𝑑𝑖𝑖𝑠𝑠𝑑𝑑𝑠𝑠𝑤𝑤𝑑𝑑 ⇒ 𝑚𝑚𝑠𝑠𝑠𝑠𝑠𝑠𝑠𝑠 𝑤𝑤𝑠𝑠𝑠𝑠𝑤𝑤𝑤𝑤 ,𝑖𝑖𝑖𝑖 ∙ 𝑥𝑥𝑤𝑤𝑠𝑠 ,𝑠𝑠𝑠𝑠𝑠𝑠𝑠𝑠 ,𝑠𝑠𝑠𝑠𝑠𝑠𝑠𝑠 𝑤𝑤𝑠𝑠𝑠𝑠𝑤𝑤𝑤𝑤 + 𝑚𝑚𝑠𝑠𝑠𝑠𝑠𝑠𝑠𝑠 𝑤𝑤𝑠𝑠𝑠𝑠𝑤𝑤𝑤𝑤 ,𝑖𝑖𝑖𝑖 ∙ 𝑓𝑓𝑑𝑑𝑖𝑖𝑠𝑠𝑑𝑑𝑠𝑠𝑖𝑖𝑑𝑑𝑖𝑖 ∙ 𝑥𝑥𝑤𝑤𝑠𝑠 ,𝑠𝑠𝑠𝑠𝑠𝑠𝑠𝑠 ,𝑓𝑓𝑤𝑤𝑤𝑤𝑠𝑠ℎ 𝑤𝑤𝑠𝑠𝑠𝑠𝑤𝑤𝑤𝑤
= 𝑚𝑚𝑠𝑠𝑠𝑠𝑠𝑠𝑠𝑠 𝑤𝑤𝑠𝑠𝑠𝑠𝑤𝑤𝑤𝑤 ,𝑖𝑖𝑖𝑖 ∙ 𝑓𝑓𝑑𝑑𝑖𝑖𝑠𝑠𝑑𝑑𝑠𝑠𝑖𝑖𝑑𝑑𝑖𝑖 ∙ 𝑥𝑥𝑤𝑤𝑠𝑠 ,𝑠𝑠𝑠𝑠𝑠𝑠𝑠𝑠 ,𝑑𝑑𝑖𝑖𝑠𝑠𝑑𝑑𝑠𝑠𝑤𝑤𝑑𝑑 + 𝑚𝑚𝑠𝑠𝑠𝑠𝑠𝑠𝑠𝑠 𝑤𝑤𝑠𝑠𝑠𝑠𝑤𝑤𝑤𝑤 ,𝑖𝑖𝑖𝑖 ∙ 𝑥𝑥𝑤𝑤𝑠𝑠 ,𝑠𝑠𝑠𝑠𝑠𝑠𝑠𝑠 ,𝑑𝑑𝑖𝑖𝑠𝑠𝑑𝑑𝑠𝑠𝑤𝑤𝑑𝑑 ⇒ 𝑥𝑥𝑤𝑤𝑠𝑠 ,𝑠𝑠𝑠𝑠𝑠𝑠𝑠𝑠 ,𝑠𝑠𝑠𝑠𝑠𝑠𝑠𝑠 𝑤𝑤𝑠𝑠𝑠𝑠𝑤𝑤𝑤𝑤 + 𝑓𝑓𝑑𝑑𝑖𝑖𝑠𝑠𝑑𝑑𝑠𝑠𝑖𝑖𝑑𝑑𝑖𝑖 ∙ 𝑥𝑥𝑤𝑤𝑠𝑠 ,𝑠𝑠𝑠𝑠𝑠𝑠𝑠𝑠 ,𝑓𝑓𝑤𝑤𝑤𝑤𝑠𝑠ℎ 𝑤𝑤𝑠𝑠𝑠𝑠𝑤𝑤𝑤𝑤 = (𝑓𝑓𝑑𝑑𝑖𝑖𝑠𝑠𝑑𝑑𝑠𝑠𝑖𝑖𝑑𝑑𝑖𝑖 +1) ∙ 𝑥𝑥𝑤𝑤𝑠𝑠 ,𝑠𝑠𝑠𝑠𝑠𝑠𝑠𝑠 ,𝑑𝑑𝑖𝑖𝑠𝑠𝑑𝑑𝑠𝑠𝑤𝑤𝑑𝑑
⇒ 𝑥𝑥𝑤𝑤𝑠𝑠 ,𝑠𝑠𝑠𝑠𝑠𝑠𝑠𝑠 ,𝑑𝑑𝑖𝑖𝑠𝑠𝑑𝑑𝑠𝑠𝑤𝑤𝑑𝑑 =𝑥𝑥𝑤𝑤𝑠𝑠 ,𝑠𝑠𝑠𝑠𝑠𝑠𝑠𝑠 ,𝑠𝑠𝑠𝑠𝑠𝑠𝑠𝑠 𝑤𝑤𝑠𝑠𝑠𝑠𝑤𝑤𝑤𝑤 + 𝑓𝑓𝑑𝑑𝑖𝑖𝑠𝑠𝑑𝑑𝑠𝑠 𝑖𝑖𝑑𝑑𝑖𝑖 ∙ 𝑥𝑥𝑤𝑤𝑠𝑠 ,𝑠𝑠𝑠𝑠𝑠𝑠𝑠𝑠 ,𝑓𝑓𝑤𝑤𝑤𝑤𝑠𝑠ℎ 𝑤𝑤𝑠𝑠𝑠𝑠𝑤𝑤𝑤𝑤
(𝑓𝑓𝑑𝑑𝑖𝑖𝑠𝑠𝑑𝑑𝑠𝑠𝑖𝑖𝑑𝑑𝑖𝑖 +1)
The osmotic pressure caused by the sugar concentration in the retentate has been estimated by the simplified formula below.

29
Π = 𝑐𝑐𝑠𝑠𝑑𝑑𝑠𝑠𝑠𝑠𝑤𝑤 ∙ 𝑅𝑅 ∙ 𝑇𝑇
7.1.5 Distillation and Dehydration The distillation is performed in a stripper followed by a rectifier. The molecular sieves for dehydration of the anhydrous ethanol required in the biodiesel production are also included in this part of the cal-culations. Assumptions made are given below.
• No ethanol in the stillage • 48 wt% ethanol in the stream leaving the top of the stripper • No ethanol in the stream leaving the bottom of the rectifier • 96 vol% (93.5 wt%) ethanol in the ethanol leaving the top of the rectifier • Ethanol and water that is flashed of before the third step of the biodiesel process is recircu-
lated to the stripper • All of the butanediol is recovered in the rectifier • Anhydrous ethanol does not contain any water • The flow of anhydrous ethanol required for regeneration is given by the formula below. The
regeneration pressure is 0.2 bar while dehydration is performed at 3 bar. feff is an efficiency factor with the value 1.1-1.5. In the calculations, the value 1.3 has been used. (34)
�̇�𝑚𝑠𝑠𝑖𝑖ℎ𝑦𝑦𝑑𝑑𝑤𝑤𝑑𝑑𝑑𝑑𝑠𝑠 𝑤𝑤𝑠𝑠ℎ𝑠𝑠𝑖𝑖𝑑𝑑𝑠𝑠 ,𝑤𝑤𝑤𝑤𝑠𝑠𝑤𝑤𝑖𝑖 = �̇�𝑚𝑠𝑠𝑎𝑎𝑤𝑤𝑑𝑑𝑠𝑠𝑤𝑤𝑑𝑑𝑝𝑝𝑖𝑖𝑐𝑐 𝑤𝑤𝑠𝑠ℎ𝑠𝑠𝑖𝑖𝑑𝑑𝑠𝑠 ,𝑓𝑓𝑤𝑤𝑤𝑤𝑑𝑑 ∙𝑝𝑝𝑤𝑤𝑤𝑤𝑠𝑠𝑤𝑤𝑖𝑖𝑝𝑝𝑑𝑑𝑤𝑤ℎ𝑦𝑦𝑑𝑑
∙ 𝑓𝑓𝑤𝑤𝑓𝑓𝑓𝑓
• During adsorption, the temperature can vary between 120°C and 150°C (34). As a simplifica-tion, the temperature is assumed to be 135°C constantly. Regeneration is performed at 200-230°C but the temperature during this process is assumed to be constant at 210°C (33).
7.1.6 Fermentation By-Product Recovery Since a reasonable amount of glycerol is formed in the SSF, this by-product will be recovered and converted to n-propanol in the Biofuel-solution process. The glycerol is found in the stillage together with small amounts of acetic acid and succinic acid. Separation of the macromolecules, i.e. proteins and polysaccharides, is performed by centrifugation. The water content is subsequently reduced to the level required in the Biofuel-Solution process by evaporation. Sugar and water are separated in the boiler, before the first reactor in the Biofuel-Solution process, and sent to the anaerobic digestion. The assumptions are listed below.
• 75% of the water, the glycerol, the acetic acid, the succinic acid and the sugar in the stillage are recovered in the centrifuge
• The water-sugar solution sent to the biogas production consists of 25 wt% sugar and the bal-ance water
• There is 20 wt% glycerol in the steam-glycerol stream entering the first reactor in the Biofuel-Solution process
7.1.7 Biofuel-Solution Process Since the total capital cost for the Biofuel-Solution process has been specified by the company, the only flows which had to be quantified are the ones entering and leaving the system enclosed by dashed lines in Figure A.1in Appendix A. This process is also performed in three steps with one reactor for each. Two reactions are taken into account in the first step, formation of acrolein and formation of the by-product propionic acid. Formation of acrolein: C3H5(OH)3 (g) → 2 H2O (g) + C2H3CHO (g) Formation of propionic acid: C3H5(OH)3 (g) → H2O (g) + C2H5COOH (g) It is assumed that no by-products are formed in the two subsequent hydrogenations. Formation of propionaldehyde: C2H3CHO (g) + H2 (g) → C2H5CHO (g) Formation of propanol: C2H5CHO (g) + H2 (g) → C3H7OH (g)

30
Other assumptions made and process specifications required are given in the list below.
• 1.2 equivalents of hydrogen, i.e. 2.4 moles per mole glycerol, is added in the second reactor • Surplus hydrogen is recirculated • The yield of acrolein is +90%, based on the ingoing amount of glycerol • The conversions to propionaldehyde and propanol, respectively, are assumed to be 100% • The product contains 2.4 wt% water and the rest of the water is separated in the distillation • All organic acids (acetic acid, propionic acid, succinic acid) leave with the water separated in
the distillation and this stream is sent to the ion exchange chromatography columns • 75 wt% of each acid is recovered in the ion exchange chromatography columns
7.1.8 Anaerobic Digestion The anaerobic digestion will be performed in three parallel tank series with two tanks in each. As-sumptions made for the mass calculations are listed below.
• 80 wt% of the organic material is converted to biogas • 496 Nm3 methane is produced per tonne proteins • 415 Nm3 methane is produced per tonne carbohydrates • The organic acids are equatable with carbohydrates • The contribution to the biogas formation from yeast and enzyme residues is neglected • The biogas consists solely of methane and carbon dioxide • The anaerobic digestion is performed at 38°C • The ideal gas law is applicable
If the ammonia formation during anaerobic digestion is too high, yielding a concentration above 1000 mg/l, nitrogen poisoning may occur. The theoretical ammonia concentration is therefore calculated for pH 7 and pH8. The assumptions made are given below.
• 6.25 mass units of protein corresponds to 1 mass unit of nitrogen • 1% of the nitrogen forms ammonia at pH 7 • 10% of the nitrogen forms ammonia at pH 8 • pH ≈ 7
The residues generally contain a large amount of nutrients, especially nitrogen, which can be recircu-lated to the photobioreactors. If this amount corresponds to more than 20% of the daily requirement of ammonium, which is 60.6 tonnes, recirculation is profitable.
7.1.9 Summary of the Results An annual production of 100 ktonnes biodiesel requires 240 ktonnes of algae from which 95 ktonnes of algal oil can be recovered. The production of glycerol will be 13 ktonnes/year which, with addition of 0.5 ktonnes hydrogen/year, can be converted to 7.4 ktonnes 97.6 wt% propanol/year. For trans-esterification, 17 ktonnes 96 vol% ethanol and 1.5 ktonnes anhydrous ethanol will be needed annually. Since 29 ktonnes anhydrous ethanol and 17 ktonnes 96 vol% ethanol can be produced from the annual 144 ktonnes algal flour, 27 ktonnes fuel ethanol can be sold each year. 53 ktonnes biogas/year, with a methane content of 57 vol%, will be produced from the stillage. The annual fermentation by-product production is 317 tonnes butanediol, 278 tonnes acetic acid, 582 tonnes propionic acid and 130 tonnes succinic acid. All flows are listed in Appendices C- D. Table C.1-Table C.9 in Appendix C contain the mass flow for each component in each stream and Table D.1-Table D.8 in Appendix D contains the volumetric flow for each stream. The theoretical mass flows of fermentation by-products are listed in Table C.10.

31
Apart from pure mass balances, some calculations regarding e.g. concentrations and pressure have been performed. The results from these are given in the following text. For the ion exchange chroma-tography to be an efficient method of recovery of the acids, the concentrations should not be too low. How low levels that are acceptable is however unknown. According to the calculations, the water stream entering the chromatography column contains 0.7 wt% acetic acid, 1.4 wt% propionic acid and 0.3 wt% succinic acid. The concentration of water-insoluble solids (WIS), i.e. proteins and polysaccharides, is important both in the SSF and in the preceding membrane filtration. After filtration, the concentration of WIS will be 21% which is rather high for both processes. This might cause problems and other methods can be needed in practice. Another concentration of importance for the membrane filtration is the concentra-tion of sugar in the retentate since this determines the osmotic pressure. The result is 2.8 bar which is not too high. The WIS concentration of the stillage entering the anaerobic digestion tanks will be just below 11% which might be somewhat high. In this process it can however be compensated by a longer retention time. The proteins-to-carbohydrates ratio of the stillage will be around 1.2 but according to the calcu-lations, nitrogen poisoning will not occur. The ammonia concentration at pH 7 will be 91 mg/l which is below the lowest limit of nitrogen inhibition. At pH 8, the ammonia concentration is 910 mg/l and would require an adapted flora of microorganisms to function well. Depending on the pH in the reac-tors the appropriate design must be chosen. In further calculations the assumption is made that the pH will remain around neutral where no nitrogen inhibition occurs. As suggested, the residues will be used as an additional source of nutrients for the algae since the daily production of ammonia will be 17.7 tonnes, corresponding to 29% of the required amount. The biogas will be constituted of 57 vol% methane and 43 vol% carbon dioxide, giving a potential energy production of 29.
7.2 Energy Calculations Based on the flow rates calculated as described above in Flows by Mass and Energy, the heating and cooling requirements as well as the consumption of electricity for each process have been estimated. Most of the energy demand can be covered by the energy produced by combustion of the biogas com-bined with heat exchange in and between processes.
7.2.1 Energy Demand The processes with the highest heating demands are the Biofuel-Solution process, due to the high tem-perature and pressure, and the ethanol distillation together with the evaporation, due to the high en-thalpy of vaporisation for water. Regarding the electricity consumption, the pumps for the photobiore-actors and the ultrasound cavitation unit have the highest energy demands. Estimations of the energy demand of each sub-process are given below.
7.2.1.1 The Algae Cultivation, Oil Recovery and Oil Pre-Treatment The energy demand for the process units in the algal oil production facility have been taken from Bio-diesel Production from Microalgae –A Feasibility Study (2). A summary of the energy requirements is shown in Table 7.1. Table 7.1: Energy demand for the algal oil production facility divided into electricity and heating. (2) Process Unit Electricity Demand (MW) Heating Demand (MW) Photobioreactors 7.320 - Sedimentation tank Neglected - Cavitation 2.744 - Stirred settling tank Neglected - Centrifuges 0.037 - Degumming 0.036 0.36 Pumps 0.0897 Total 10.227 0.36

32
7.2.1.2 Biofuel-Solution Process For estimation of the energy flows in the Biofuel-Solution process, the process modelling program Aspen Plus has been used. The process design chosen for the simulations is a follows, see Figure E.1 in Appendix E for process flowsheet. The water-glycerol feed to reactor one is pumped up to 10 bar, which requires 0.005 MW electricity, and is heat exchanged with the product stream. After the first heat exchanger the feed is further heated with the outgoing stream from reactor one. Then it is heat exchanged with the feed to the distillation column and before the water-glycerol stream enters reactor one, 4.34 MW from fresh steam at 100 bar is used to vaporise the water-glycerol stream and heat it to reactor temperature. The first reactor is adiabatic, with the ingoing temperature 290°C, while the sec-ond and third are isothermal at 180°C. In the first reactor glycerol is converted to acrolein, which in the second reactor is hydrogenated to propionic aldehyde. Since the second reactor is isothermal, it has a cooling demand of 0.39 MW. The steam-glycerol mixture is then separated in a distillation column which demands more cooling than heating, because the stream into the column is much warmer than the column operating temperature. The condenser requires 12.27 MW of cooling and the reboiler requires 8.22 MW of heat. It is assumed that the 4.05 MW in difference can be used for heating in other processes. Out from the top of the column comes propionic aldehyde and hydrogen at 1 bar and 27°C. Before the stream enters the last reactor, a compressor is used to increase the pressure to 10 bar. This requires 0.094 MW of electricity. 0.32 MW of cooling is required in the last reactor to maintain isothermal operation. According to the simulations, 4.34 MW must be supplied by steam at 100 bar. A total of 0.099 MW of electricity has to be supplied and 5.05 MW at a lower temperature can be used for heating in other processes at the plant.
7.2.1.3 Ethanol Production During the SSF, heat is evolved but since the operating is only 32°C, cooling with sea water will be applied. Heating is required during the liquefaction but the energy demand is assumed to be small and possible to cover by the use of “waste heat” from processes operating at higher temperatures. The same assumption is made regarding the heat required for regeneration of the dehydration columns. The major part of the energy required in the ethanol production is the steam needed to run the distillation. Aspen Plus has been used for simulation of the ethanol-water distillation. Since the use of solids can pose a problem during Aspen simulations, only the water and the ethanol are taken into account. The design of the process is described below, see Figure E.2 in Appendix E for process flowsheet. The pressure of the fermentation broth is increased with a pump from 1 bar to 1.2 bar which requires 0.0005 MW electricity. The feed is heat exchanged with outgoing stillage, which increases the tem-perature of the fermentation broth from 32 to 88°C. In the stripper, all the ethanol is stripped of and the reboiler requires 6.23 MW. To the rectifier two streams, except that from the stripper, are added in form of the water-ethanol mixture flashed off from the transesterification and the water-ethanol mix-ture from the regeneration of the dehydration columns. All streams enter at the same stage. The recti-fier requires 1.02 MW of heat in the reboiler and has a cooling demand of 4.54 MW in the condenser. This results in a total heating demand of 7.25 MW, which can be supplied at a pressure around 5 bar, a cooling demand of 4.54 MW and a negligible electricity demand. According to the tray sizing function in Aspen Plus, the stripper will be 1.45 m in diameter and 16 m high with 20 stages. The dimensions of the rectifier will be a diameter of 1.70 m and a height of 20 m with 25 stages.
7.2.1.4 Biogas Production and Biodiesel Production It is important that the temperature in the tanks for anaerobic digestion is held constant but this is as-sumed possible to achieve by insulation and heating with “waste heat”. The transesterification is also
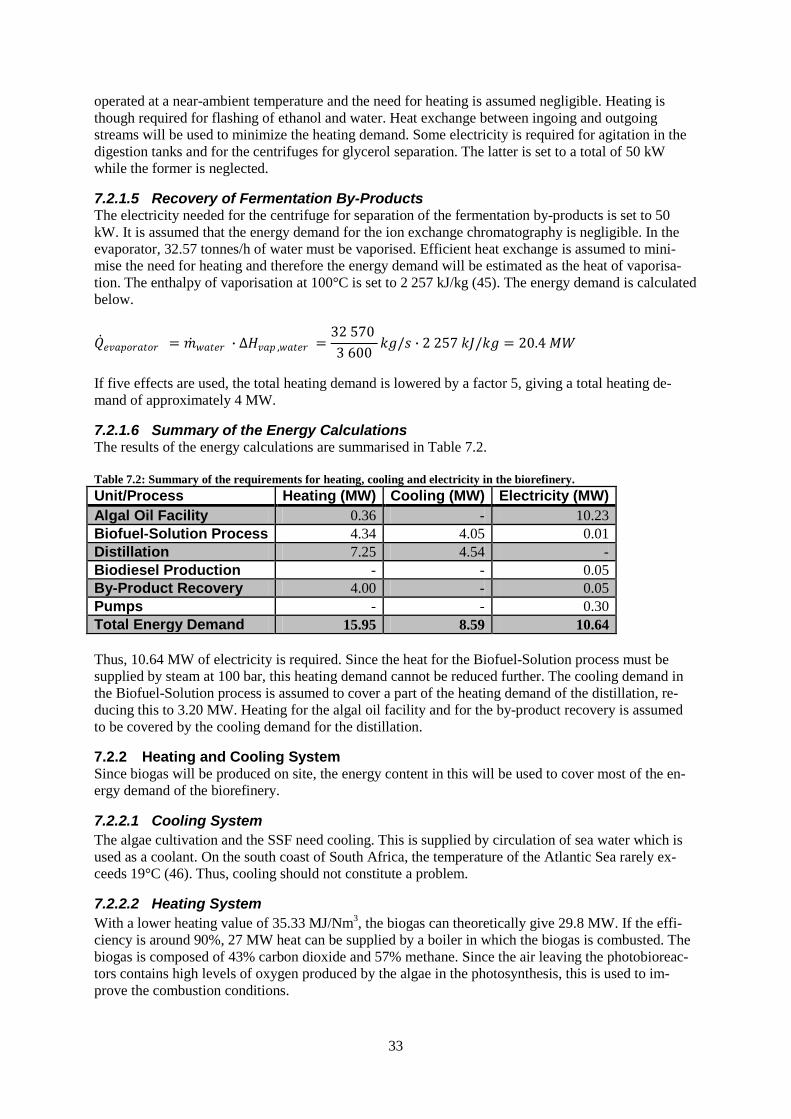
33
operated at a near-ambient temperature and the need for heating is assumed negligible. Heating is though required for flashing of ethanol and water. Heat exchange between ingoing and outgoing streams will be used to minimize the heating demand. Some electricity is required for agitation in the digestion tanks and for the centrifuges for glycerol separation. The latter is set to a total of 50 kW while the former is neglected.
7.2.1.5 Recovery of Fermentation By-Products The electricity needed for the centrifuge for separation of the fermentation by-products is set to 50 kW. It is assumed that the energy demand for the ion exchange chromatography is negligible. In the evaporator, 32.57 tonnes/h of water must be vaporised. Efficient heat exchange is assumed to mini-mise the need for heating and therefore the energy demand will be estimated as the heat of vaporisa-tion. The enthalpy of vaporisation at 100°C is set to 2 257 kJ/kg (45). The energy demand is calculated below.
�̇�𝑄𝑤𝑤𝑒𝑒𝑠𝑠𝑝𝑝𝑑𝑑𝑤𝑤𝑠𝑠𝑠𝑠𝑑𝑑𝑤𝑤 = �̇�𝑚𝑤𝑤𝑠𝑠𝑠𝑠𝑤𝑤𝑤𝑤 ∙ ∆𝐻𝐻𝑒𝑒𝑠𝑠𝑝𝑝 ,𝑤𝑤𝑠𝑠𝑠𝑠𝑤𝑤𝑤𝑤 =32 570 3 600
𝑘𝑘𝑠𝑠/𝑠𝑠 ∙ 2 257 𝑘𝑘𝑘𝑘/𝑘𝑘𝑠𝑠 = 20.4 𝑀𝑀𝑀𝑀 If five effects are used, the total heating demand is lowered by a factor 5, giving a total heating de-mand of approximately 4 MW.
7.2.1.6 Summary of the Energy Calculations The results of the energy calculations are summarised in Table 7.2. Table 7.2: Summary of the requirements for heating, cooling and electricity in the biorefinery. Unit/Process Heating (MW) Cooling (MW) Electricity (MW) Algal Oil Facility 0.36 - 10.23 Biofuel-Solution Process 4.34 4.05 0.01 Distillation 7.25 4.54 - Biodiesel Production - - 0.05 By-Product Recovery 4.00 - 0.05 Pumps - - 0.30 Total Energy Demand 15.95 8.59 10.64 Thus, 10.64 MW of electricity is required. Since the heat for the Biofuel-Solution process must be supplied by steam at 100 bar, this heating demand cannot be reduced further. The cooling demand in the Biofuel-Solution process is assumed to cover a part of the heating demand of the distillation, re-ducing this to 3.20 MW. Heating for the algal oil facility and for the by-product recovery is assumed to be covered by the cooling demand for the distillation.
7.2.2 Heating and Cooling System Since biogas will be produced on site, the energy content in this will be used to cover most of the en-ergy demand of the biorefinery.
7.2.2.1 Cooling System The algae cultivation and the SSF need cooling. This is supplied by circulation of sea water which is used as a coolant. On the south coast of South Africa, the temperature of the Atlantic Sea rarely ex-ceeds 19°C (46). Thus, cooling should not constitute a problem.
7.2.2.2 Heating System With a lower heating value of 35.33 MJ/Nm3, the biogas can theoretically give 29.8 MW. If the effi-ciency is around 90%, 27 MW heat can be supplied by a boiler in which the biogas is combusted. The biogas is composed of 43% carbon dioxide and 57% methane. Since the air leaving the photobioreac-tors contains high levels of oxygen produced by the algae in the photosynthesis, this is used to im-prove the combustion conditions.

34
Because of the need of high pressure steam to heat the Biofuel-Solution process, a 100 bar steam boiler is used. For this purpose, high pressure steam at 100 bar is taken directly from the boiler. In the ethanol-water distillation and the transesterification, low pressure steam is used at 6 bar. This low pressure steam at 6 bar is drawn off before entering the low pressure turbine. The condensate from the Biofuel-Solution process is used to superheat the 6 bar steam before it enters the low pressure turbine. Superheating the vapor prevents water fall-out in the low pressure turbine and increases the efficiency. A low pressure is maintained in the condenser where the stream is con-densed with sea water. The condensed water stream is preheated by the flue gases from the boiler and the water content in the flue gases condenses, thereby recovering energy from the flue gases. The stream is preheated a second time by waste energy from the Biofuel-Solution process.
7.2.2.3 Choice of Turbine Power The system is designed to burn all of the produced biogas and the surplus of energy is cooled with sea water to get a high electric output. An electric efficiency of 40% is assumed to calculate the power of the turbine. To calculate the turbine power the consumption of steam in the plant must be withdrawn from the total steam production. With the 6 bar stream of 3.20 MW and the 100 bar stream of 4.34 MW the remaining 19.5 MW can be used to produce electric power in the turbines. The assumed elec-tric efficiency of 40% gives a turbine power of 19.5 MW·0.4 = 7.8 MW. Based on this, a turbine power of 8 MW is chosen. The design of the heating and cooling system is presented in Figure 7.1.
CondenserSea Water 15-20°C
CondensingFlue Gases
Approx. 2 MW
Biofuel-SolutionProcess Heat 86°C
5.05 MW
Steam 100 bar 4.34 MW
Super-heater Condensate
Return100 bar
CondensateReturn 6 bar
27 MW
Steam 6 bar2.20 MW
CondensateReturn 100 bar
Figure 7.1: Process flowsheet for the heating and cooling system with the ingoing and outgoing flows of energy. The 2 MW of heat recovered by flue gas condensation is considered a buffer, should the total energy demand be underesti-mated.
8 Cost Estimates The total production cost for the biodiesel production facility is summarised as the depreciated capital cost and the operating cost. Cost figures are based on estimations in the report Biodiesel Production

35
from Microalgae –A Feasibility Study (2) as well as on calculations described in this chapter. The costs in the former report are valid for 2008, thus they had to be recalculated to 2010 year’s money value, which was performed by the use of the Swedish consumer price index, KPI, and SEK/€ ex-change rates.
8.1 Assumptions Since there are parameters that are unknown, assumptions had to be made before cost estimates could be performed. The general assumptions are the same as in the report Biodiesel Production from Mi-croalgae –A Feasibility Study since the work presented in this report is a continuation of the work in the preceding report. These general assumptions are listed below.
• The annual operating time is 335 days • The biorefinery has a useful life span of 15 years • It is assumed that carbon dioxide can be supplied for a negligible cost by one of many coal
power plants or by the local chemical industry Since the implications of some of the assumptions, both general and process specific, have a large impact on the total costs, this chapter is ended with a sensitivity analysis. The exchanges rates used are 9.57 SEK/€ for March 2010 (47) and 6.1 SEK/$ for mid 1982 (48).
8.2 Capital Costs The total capital cost is determined either with Ulrich's method or, if information is available, as a direct purchase cost. With Ulrich's method the cost is estimated for the different process equipment. The equipment cost, Cp, is derived from specifications, e.g. the vessel volume, by read-off in relevant charts in the compendium Projekteringshandboken 2007 by Prof. Hans T. Karlsson (49). Cp is then multiplied by a factor taking the material, pressure, design etc. into consideration. This gives the bare module cost, CBM, of the equipment, see the formula below. For a further description of Ulrich's method, see Projekteringsmetodik by Prof. Hans T. Karlsson (50). 𝐶𝐶𝐵𝐵𝑀𝑀 = 𝐶𝐶𝑝𝑝 ∙ 𝐹𝐹𝐵𝐵𝑀𝑀𝛼𝛼
8.2.1 Add on Factors In addition to the costs for process equipment, the costs for contracting and unexpected expenses as well as help systems such as steam boiler, chimneys, roads, switchgear, waste water treatment etc. have to be considered. These additional costs are taken into account by multiplying the bare module cost with factors, see the formula below.
𝐾𝐾$,1982 = �(𝐶𝐶𝐵𝐵𝑀𝑀)𝑖𝑖 ∙ 𝑓𝑓𝑐𝑐𝑑𝑑/𝑑𝑑𝑖𝑖 ∙ 𝑓𝑓ℎ𝑤𝑤𝑠𝑠𝑝𝑝
𝑖𝑖
𝑖𝑖=1
fco/un corresponds to the add on due to contracting and unexpected expenses and fhelp to the add on due to help systems. According to the rule of thumb in Projekteringshandboken 2007 (49) suitable factors are 1.15 for contracting and 1.17 - 1.25 for help systems. A factor of 1.20 is chosen for consideration of costs for the help systems. This is justified by the fact that the steam boiler is calculated as a module cost and as it is expected to be the single most expensive help system in the biorefinery. Since the cost is given in USD for 1982, conversion into € for 2010 has been performed according to the method in Appendix F.
8.2.2 Algal Oil Production Facility The capital investment of the algal oil production facility considered in the study presented in the re-port Biodiesel Production from Microalgae –A Feasibility Study (2) constitutes the foundation of the

36
capital investment of the biorefinery presented in this report. However, the process step for removal of free fatty acids suggested in the former report is not taken into consideration here. The explanation is that the enzymatic transesterification process used in the biorefinery does not require removal of free fatty acids, see Biodiesel Production. It is assumed that no re-scaling is required since the decrease in triglyceride production is only 4%, i.e. from 12.4 tonnes/h to 11.8 tonnes/h (2). This decrease is due to the use of ethanol, instead of methanol, for the transesterification which means that the alkoxy groups constitute a larger part of the weight of the biodiesel. A summary of the relevant cost estimates from the earlier report, converted into 2010 year’s money value, is presented in Table 8.1. It should be noted that the add on factors are the ones the authors of Biodiesel Production from Microalgae –A Feasibility Study (2) decided to use for their calculations. Table 8.1: Capital cost estimates for the algal oil production facility based on the work in Biodiesel Production from Microalgae –A Feasibility Study (2). Process Unit Origin Add on
Factor Cost Including Add on Factors (€)
Photobioreactors Cost turnkey equipment 1.21 402 000 000 Flocculation & sedimentation Ulrich module cost 1.21 32 000 000 Ultrasound Purchased equipment cost 3.45 113 000 000 Settling tank Ulrich module cost 1.21 2 420 000 Centrifuge Ulrich module cost 1.21 285 000 Degumming Purchased equipment cost 3.45 4 450 000 Storage tanks algae culture Ulrich module cost 1.21 34 000 000 Total capital investment 594 640 000
8.2.3 Biodiesel Production Facility The module costs of the process equipment in the facility described in this report (see Figure A.1 in Appendix A) are calculated according to Ulrich’s method. Since these costs are given in USD for 1982, they had to be converted into € for 2010. Table 8.2 shows the estimated costs for all process equipment belonging to the biodiesel production facility. Calculations for estimation of the prices for the molecular sieves, the filtration units and the distillation units (stripper, rectifier and heat exchangers) are accounted for in Appendix G. Details re-garding the data used for determination of the Ulrich module costs and some of the purchased equip-ment costs are given in Appendix H. The cost for the enzymes required for start up of the transesterifi-cation is given in Appendix I. The total capital cost for the Biofuel-Solution process was provided by Christian Hulteberg (PhD), the founder of the company Biofuel-Solution (16).

37
Table 8.2: Capital cost estimates for the biodiesel production facility. Process Unit Origin CBM Buffer/product tanks Ulrich module cost €261 104 Centrifuges Ulrich module cost €1 128 834 Anaerobic digestion tanks Ulrich module cost €426 870 Process vessels, liquefaction & SSF Ulrich module cost €125 644 Process vessels, transesterification Ulrich module cost €440 150 Enzymes, transesterification start up Purchased equipment cost €4 443 670 Molecular sieves Purchased equipment cost €49 178 Dehydration columns Ulrich module cost €164 424 LPG tank Purchased equipment cost €60 000 Process vessels, Biofuel-Solution process Purchased equipment cost €6 000 000 Filtration units Purchased equipment cost €23 870 000 Ion exchange chromatographs Ulrich module cost €1 106 700 Evaporators Ulrich module cost €2 450 550 Stripper Ulrich module cost €910 656 Rectifier Ulrich module cost €984 173 Heat exchangers Ulrich module cost €758 880 Steam turbine, 7 MW Ulrich module cost €1 272 705 Steam boiler, 100 bar, 28 MW Ulrich module cost €1 418 157 Summarized module costs €45 871 695 Based on the summarised module costs and the total capital investment presented in Table 1, the total capital investment of the entire biorefinery is calculated as: €594 640 000 + €45 871 695 ∙ 1.15 ∙ 1.20 = €657 942 939 Since it was concluded in Production from Microalgae –A Feasibility Study (2) that the cost of land is negligible, together with the fact that the photobioreactors require a much larger area than the rest of the plant, this assumption is valid in this study as well.
8.3 Operating Costs As the capital costs, the operating costs consist of updated cost estimates from the report Biodiesel Production from Microalgae –A Feasibility Study (2) as well as cost estimates for the biodiesel pro-duction facility. Changes made to the earlier process are taken into consideration. The costs are di-vided into costs for chemicals, labor costs and energy costs and they have been calculated for 2010 year’s money value.
8.3.1 Costs for Chemicals Used in the Algal Oil Production Facility The costs for the chemicals in Biodiesel Production from Microalgae –A Feasibility Study (2) that are relevant for this study have been used with respect to the following:
• Recirculation of nitrogen from the biogas production plant which decreases the need of urea by 29.2%, that is from 130 000 kg/day to 92 014 kg/day.
• The decreased need of production capacity for algal oil by 4% gives a decreased need of nutri-ents. This decrease is estimated to cover the need of nutrients for the yeast used in the fermen-tation.
Estimated costs per day are presented in Table 8.3.

38
Table 8.3: Revised chemical costs for the algal oil production facility based on the study in Biodiesel Production from Microalgae –A Feasibility Study (2). Chemical substance Added Amount
(kg/day) Price 2005 ($/kg)
Total Price 2005 (€/day)
Total Price 2010 (€/day)
Urea 92 014 0.198 18 219 14 338 Nitric acid 7 860 0.248 1 500 1 180 Lime 16 700 0.082 1 400 1 102 Monobasic sodium phosphate
13 900 1.83 25 800 20 304
Tetrabasic potassium pyrophosphate
23 100 1.74 13 900 10 939
Potassium hydroxide 9 330 0.344 3 200 2 518 Ferric chloride 1 570 0.398 630 496 Total Cost 50 877 This gives a total annual cost of: 335 ∙ €50 877 = €17 043 795
8.3.2 Costs for Chemicals in the Biodiesel Production Facility Based on the mass and volumetric flows in Appendices C and D, the costs for the chemicals and en-zymes used in the biorefinary have been calculated. Prices have been estimated through personal con-tacts and are presented as follows:
• Yeast used in the fermentation: €9/kg (51) • Enzymes used in the ethanol production (21)
o Liquefaction: 0.2 SEK/l ethanol from starch o Hydrolysis: 0.5 SEK/l ethanol from starch and cellulose
• Hydrogen used in the Biofuel-Solution process: €2/kg (16) • Fresh water: €1.26/kg (52) • Enzymes for biodiesel production: $1 000 (53)
For a detailed description on how the total price for the enzymes and the amount of yeast used in the ethanol production are calculated, see Appendix K. Since the amount of hydrochloric acid required for regeneration of the ion exchange resins is small, the cost for it is neglected. Daily costs for the en-zymes and the n-hexane for the transesterification are based on the consumption rates calculated in Appendix I. The results from the calculations are found in Table 8.4. For conversion of $ to €, an ex-change rate of 0.7749 €/$ for May 6, 2010 has been used (54). Table 8.4: Chemical costs for the biodiesel production facility. Chemical substance Added Amount
per Day Price 2010 Total price 2010
(€/day) Yeast (Ethanol) 887kg €9/kg 7 980 Enzymes (Ethanol) - - 8 153 Hydrogen (Propanol) 1 453 kg €2/kg 2 906 Fresh water (Filtration) 4 272m3 €1.26/m3 5 383 Enzymes (Biodiesel) 148.8 $1 000 115 305 n-Hexane 504 kg €0.616/kg 310 Hydrochloric acid Small Neglected Neglected Total Cost 140 037 The total annual cost is:

39
335 ∙ €140 037 = €46 912 395
8.3.3 Labor Costs The work force that is needed to maintain the production has been estimated in collaboration with Prof. Hans T. Karlsson (55) and is presented in Table 8.5. It should be noted that the estimation is based on what was suggested as reasonable in Biodiesel Production from Microalgae – A Feasibility Study (2). Monthly salaries used in the calculations are according to information from Christian Hulte-berg (16). Administration is suggested to include a HR manager, economy manager and a secretary. The process operators are to work in five shifts of six persons per shift. Table 8.5: Labor costs for personnel at the biorefinery. Personnel Number of
Persons Salary (ZAR/month)
Total Salary (ZAR/month)
Total Salary (€/month)
Head of factory 1 30 000 30 000 2 559 Process operator 30 10 000 300 000 25 590 Engineer 4 15 000 60 000 5 118 Electrician 3 8 000 24 000 2 047 Mechanic 2 8 000 16 000 1 365 Laboratory assistant 4 8 000 32 000 2 730 Total 47 39 409 The total monthly salaries of €39 409 give rise to an annual cost of €472 908.
8.3.4 Energy Costs The energy consumption in the algal oil production facility in Biodiesel Production from Microalgae – A Feasibility Study (2) as well as in the biodiesel production facility has been estimated. Table 8.6 and Table 8.7 summarise the electricity demand in the process steps that are identified as the most energy intensive ones. It should be noted that there is a negative electricity demand of 8 MW in the biorefin-ery which is due to power generation in the turbine discussed in Heating System under Energy Calcu-lations. Table 8.6: Electricity demand in the algal oil production facility. Equipment Power (kW) Ultrasound 2 744 Photobioreactors 7 320 Centrifuges 37 Pumps 89.7 Degumming 36 Table 8.7: Electricity demand in the biodiesel production facility. Equipment Power (kW) Centrifuges 100 Pumps 300 Biofuel-Solution process 99 Turbine -8000 According to the estimates, there is a total electricity demand of 10.64 MW, to which 2% is added in order to take non-specific electricity costs for personal computers, lights etc. into consideration. This means that a total of 1.02 ∙ 10.64− 8 = 2.85 𝑀𝑀𝑀𝑀 electricity must be supplied to the process. With today’s price of electricity in South Africa of 0.65 ZAR/kWh (52), the annual cost from energy con-sumption is calculated as: 2850 𝑘𝑘𝑀𝑀 ∙ 335 ∙ 24 ∙ 0.65 𝑍𝑍𝑍𝑍𝑅𝑅/𝑘𝑘𝑀𝑀ℎ ∙ 0.1017 €/𝑍𝑍𝑍𝑍𝑅𝑅 = €1 514 730

40
The exchange rate of 0.1017 €/ZAR was taken from oanda.com on May 6, 2010 (54). In addition to electrical energy, steam is needed in the facility, see Table 7.2 under Energy Calcula-tions. This demand is however possible to cover with on-site production.
8.4 Total Production Costs For calculation of the total production cost, additional costs for e.g. maintenance, administration and licenses have to be estimated. This has been done by the use of add on factors. The given factors are according to the rules of thumb in Projekteringsmetodik (50). The depreciated capital cost for the Biorefinery is calculated with the annuity factor module method. The annuity factor multiplied with the total investment cost gives the depreciated capital cost. 15 years and an interest of 5% are assumed and give the annuity factor 0.0963, according to the formula below. p is the interest in fractional form, n is the useful life span in years and k is the resulting annuity factor. 𝑘𝑘 =
𝑝𝑝1 − (1 + 𝑝𝑝)−𝑖𝑖
The cost of maintenance and repairs is based on the total investment cost of the biorefinery and is mul-tiplied with a factor of 2-10%. A value of 2% is chosen due to the high investment cost of the rela-tively simple photobioreactors. Overhead cost for personnel is constituted of social costs, costs for overtime etc. It is calculated as 70% of the cost of operating personnel and 50% of the cost for the daytime personnel. The administration cost is based on 25% of the overhead for personnel cost. Costs for distribution and sales as well as for R&D are not considered here as they are assumed to be han-dled by the main organisation. License fees are estimated as 2% of the total operating cost. The results of the calculations described above are listed in Table 8.8. Table 8.8: Summary of the contributions to the total production cost. Production Costs €/year Total nutrient price 17 043 795 Total chemicals 46 912 395 Total salary 472 908 Electrical costs 1 514 730 Depreciated capital cost 63 387 728 Maintenance and repairs 13 158 859 Overhead for personnel 297 870 Administration 74 468 Distribution and sales 0 R & D 0 Licenses 2 915 566 Sum operating costs 145 778 319

41
Table 8.9 summarises the annual income from sale of by-products. The price for anhydrous ethanol is an estimated price for fuel ethanol of 5 SEK/l, provided by Prof. Guido Zacchi (21). Conversion from SEK/l to €/tonne was performed as follows.
5 𝑆𝑆𝑆𝑆𝐾𝐾/𝑠𝑠 = 5 000 𝑆𝑆𝑆𝑆𝐾𝐾/𝑚𝑚3 =5 0009.57
€/𝑚𝑚3 =5 0009.57
€/𝑚𝑚3 ∙1
0.789 𝑠𝑠𝑑𝑑𝑖𝑖𝑖𝑖𝑤𝑤𝑠𝑠/𝑚𝑚3 = 662 €/𝑠𝑠𝑑𝑑𝑖𝑖𝑖𝑖𝑤𝑤
Table 8.9: Annual revenues from the by-products which are to be sold. Chemical Production
(ktonnes/year) Sales Price (€/tonne) Income (€/year)
Anhydrous Ethanol 27.0 662 17 874 000 Propanol (97.6 wt %) 7.4 1 200 (16) 8 880 000 Butanediol 0.32 1162 (56) 371 800 Acetic Acid 0.28 500 (57) 140 000 Propionic Acid 0.58 1 000 (16) 580 000 Succinic Acid 0.13 7 500 (58) 975 000 Total Income 28 820 800 This gives a biodiesel production price of: €(145 778 319− 28 820 800)/𝑦𝑦𝑤𝑤𝑠𝑠𝑤𝑤
100 000 𝑠𝑠𝑑𝑑𝑖𝑖𝑖𝑖𝑤𝑤𝑠𝑠/𝑦𝑦𝑤𝑤𝑠𝑠𝑤𝑤∙
0.880 ∙ 10−3 𝑠𝑠𝑑𝑑𝑖𝑖𝑖𝑖𝑤𝑤𝑠𝑠𝑠𝑠
= €𝟏𝟏.𝟎𝟎𝟎𝟎/𝒍𝒍
8.5 Sensitivity Analysis Some of the parameters used in the calculations of the final production price of the biodiesel in this facility are identified as more critical than others. By this is meant that the price is more sensitive to changes in these. Following parameters are analysed:
• Price of the enzymes used in the enzymatic transesterification process • Investment cost of the photobioreactors
As touched upon in Biodiesel Production, the high costs of the enzymes used in the enzymatic trans-esterification process are a limiting factor. It is therefore important to study what impact a decrease in the purchase price of the enzymes would have on the production price of the biodiesel. Since the en-zymatic transesterification and the enzymes for it are under development, the price is expected to de-crease rather than increase. Thus, the following two scenarios are investigated – a lowering of the price to $500/kg enzymes and a lowering of the price to $250/kg enzymes. In the case of a decrease in purchase price to $500, the production price of the biodiesel is reduced to €0.86/l. At the even further decrease to $250/kg enzymes, the price drops to €0.77/l. The capital investment of the photobioreactors contributes the most to the total capital investment of the biorefinery. If it could be reduced either by using a cheaper technique (or construction material), alternatively by increasing the efficiency of the algae cultivation which means smaller vessels are needed, a decrease in the production price for the biodiesel is expected. Once again two scenarios are studied – a decrease in capital investment by 20% and an increase by 20%. The first scenario gives a production price of €0.95/l and the second one a production price of €1.11/l. The results from the sensitivity analysis are shown graphically in Figure 8.1.

42
Figure 8.1: Final production price of the biodiesel in €/l for the different scenarios and the base case.
9 Conclusions According to the calculations made, the final production price for the biodiesel will be €1.03/l. This is rather high and the two factors contributing most to this are the high capital cost for the photobioreac-tors and the high price of the enzymes for the transesterification. As shown in Figure 8.1 under Sensi-tivity Analysis, a reduction of the enzyme price by 50% would lower the biodiesel production price to €0.77/l. Since the exact composition of the algae is uncertain and can be altered by the growth conditions, it will have impact on the whole process if the estimations made are far from the algal composition ob-tained in practice. Other aspects that might influence the process are the uncertainties regarding the performance of the membrane filtration and the biogas production. Regarding the former, the dry mat-ter content could be too high to make it feasible but this might be remedied by pre-hydrolysis or reduc-tion of the water content before cavitation. Regarding the latter, nitrogen poisoning might occur since the concentration is close to the limit. One solution for this is to add an external carbon source, e.g. organic waste. Compared to biodiesel production without by-product recovery, i.e. where the algal flour is dried and sold as fodder or manure, both the lipids and the carbohydrates are refined to high-value products and almost all energy required for the plant is produced on site.
10 References 1. Darzins, Philip T. - Pienkos, Al. The promise and challenges of microalgal-derived biofuels. Wiley InterScience. 2009, 3. 2. Lassing, Merit - Mårtensson, Peter - Olsson, Erik - Svensson, Marcus. Biodiesel Production from Microalgae - A Feasibility Study. Lund : Department of Chemical Engineering, Lund University, Faculty of Engineering, May 16, 2008.

43
3. AlgaeLink - Aquaculture consultants. AlgaeLink. [Online] AlgaeLink NV. [Cited: 1 April 2010.] http://www.algaelink.com/about-us.htm. 4. Gallery of the Roscoff Plankton Group. Plancton Océanique Roscoff - Home Page. [Online] Plancton Océanique Roscoff, 9 April 2006. [Cited: 4 April 2010.] http://www.sb-roscoff.fr/Phyto/gallery/main.php?g2_itemId=31. 5. Boussiba, Sammy - Vonshak, Avigad - Cohen, Zvi - Avissar, Yael - Richmond, Amos. Lipid and Biomass Production by the Halotolerant Microalga Nannochloropsis salina. Biomass. 1987, 12. 6. Zhu, C. J. - Lee, Y. K. Determination of biomass dry weight of marine microalgae. Journal of Applied Phycology. 1997, 9. 7. Volkman, John K. - Brown, Malcolm R. - Dunstan, Graeme A. - Jeffrey, S. W. The Biochemical Composition of Marine Microalgae from the Class Eustigmatophyceae. Journal of Applied Phycology. 1993, 29. 8. Comparative study on lipase-catalyzed transformation of soybean oil for biodiesel production with different acyl acceptors. Du, Wei - Xu, Yuanyuan - Liu, Dehua - Zeng, Jing. 3-4, Beijing : Journal of Molecular Catalysis B: Enzymatic, 2004, Vol. 30. 9. Wallberg, Ola. Researcher. Personal contact. Lund University, Lund : Department of Chemical Engineering, 25 March 2010. 10. Grauslund, Anders Handlos. Master Thesis, Production of biodiesel from algae oil. s.l. : The Faculty of Life Sciences, Biology and Biotechnology, University of Copenhagen, Denmark, 2009. 11. Enzymatic Synthesis of Biodiesel from Transesterification. Rodrigues, Rafael Costa - Volpato, Giandra - Wada, Keiko - Ayub, Marco Antonio Zachia. s.l. : Journal of American Oil Chemists' Society, 2008, Vol. 85. 12. Biodiesel A Realistic Fuel Alternative for Diesel Engines. s.l. : Springer London, 2008. ISBN 978-1-84628-995-8. 13. Nielsen, Per Munk. Senior Science Manager. E-mail contact. Novozymes A/S, Bagsvaerd, 3 March 2010. 14. Different enzyme requirements for the synthesis of biodiesel:Novozym 435 and Lipozyme TL IM. Hernandez-Martin, Estela - Otero, Cristina. Madrid Spain : Department of Biocatalysis, Institute of Catalysis and Petroleochemistry, CSIC, Cantoblanco, 2006. 15. Impact of Biodiesel Production on the Glycerol Market. HGCA. [Online] October 2006. [Cited: 30 March 2010.] http://www.hgca.com/document.aspx?fn=load&media_id=3605&publicationId=2363. 16. Hulteberg, Christian. Researcher. Personal contact. Lund University, Lund : Department of Chemical Engineering, February 10, March 25, April 9, April 22 and May 5 2010. 17. Biofuel-Solution Research. Biofuel-Solution. [Online] Biofuel-Solution, 6 December 2009. [Cited: 31 March 2010.] http://www.biofuel-solution.com/index.asp?action=research. 18. Pålsson, Anton. Separation of propionaldehyde in a conversion process of glycerol. Lund, Sweden : Department of Chemical Engineering, Lund University, Faculty of Engineering, 2009. 19. Amin, G.- Van den Eynde, E.- Verachtert, H. Determination of By-Products Formed During the Ethanolic Fermentation, Using Batch and Immobilized Cell Systems of Zymomonas mobilis and Saccharomyces bayanus. European Journal of Applied Microbiology and Biotechnology. 1983, 18. 20. Fumagalli, Carlo. Kirk-Othmer Encyclopedia of Chemical Technology - Succinic Acid and Succinic Anhydride. [Internet] Hoboken, New Jersey, USA : John Wiley & Sons, Inc, 2006. ISBN: 978-0-471-48494-3. 21. Zacchi, Guido. Professor. Personal contact. Lund University, Lund : Department of Chemical Engineering, March 24, March 29, April 23 and May 3 2010 2010. 22. Jönsson, Ann-Sofi. Professor. Personal contact. Lund University, Lund : Department of Chemical Engineering, March 19 and April 29 2010. 23. Lidén, Gunnar. Professor. Personal contact. Lund University, Lund : Department of Chemical Engineering, 23 February 2010. 24. Anaerobic glycerol production by Saccharomyces cerevisiae strains under hyperosmotic stress. Modig, Tobias - Granath, Katarina - Adler, Lennart - Lidén, Gunnar. 75, Berlin : Springer-Verlag, 2007, Vol. Applied Microbiology and Biotechnology. ISSN: 0175-7598. 25. Search USGS: Results ("water salinity definition"). USGS - U.S. Geological Survey Web Site. [Online] 14 August 2002. [Cited: 30 March 2010.]

44
http://search.usgs.gov/results.html?cx=005083607223377578371%3Ab5ixbbpqpx0&cof=FORID%3A11&q=water+salinity+definition&as_sitesearch=&sa=Search#991. 26. Nilsson, Bernt. Professor. Personal contact. Lund University, Lund : Department of Chemical Engineering, 22 March 2010. 27. McCabe, Warren L. - Smith, Julian C. - Harriott, Peter. Unit Operations of Chemical Engineering. New York : McGraw-Hill, 2005. ISBN: 007-124710-6. 28. Kosaric, Naim - Duvnjak, Zdravko - Farkas, Adalbert - Sahm, Hermann - Bringer-Meyer, Stephanie - Goebel, Otto - Mayer, Dieter. Ullmann's Encyclopedia of Industrial Chemistry - Ethanol. [Internet] Hoboken, New Jersey, USA : John Wiley & Sons, Inc, 2001. ISBN-10: 3-527-30385-5. 29. Kirk, Ole - Damhus, Ture - Vedel Borchert, Torben - Crone Fuglsang, Claus - Sejr Olsen, Hans - Hansen, Tomas Tage - Lund, Henrik - Schiff, Hans Erik - Nielsen, Lone Kierstein. Kirk-Othmer Encyclopedia of Chemical Technology - Enzyme Applications, Industrial. [Internet] Hoboken, New Jersey, USA : John Wiley & Sons, Inc, 2004. ISBN: 978-0-471-48494-3. 30. Linde, Marie. Process Development of Bioethanol Production from Wheat and Barley Residues. Lund : Department of Chemical Engineering, Lund University, November 2007. ISBN: 978-91-628-7300-4. 31. Bång, Christina. Telephone and e-mail contact. SinChriJo, Höganäs, Sweden, April 29 and 30, May 3 2010. 32. Zeochem AG Uetikon. Zeochem AG Uetikon. [Online] Zeochem, 26 May 2008. [Cited: 2 May 2010.] http://www.zeochem.ch/en/company/index.htm. 33. Zeochem AG Uetikon. Zeochem Z3-03. s.l. : Information leaflet, 2007. 34. —. Molecular Sieves for Alcohol Drying. s.l. : Information leaflet. 35. Hwang, Yng-Long - Bedard, Thomas C. Kirk-Othmer Encyclopedia of Chemical Technology - Ketones. [Internet] Hoboken, New Jersey, USA : John Wiley & Sons, Inc, 2001. ISBN: 978-0-471-48494-3. 36. Christoph, Ralf - Schmidt, Bernd - Steinberner, Udo - Dilla, Wolfgang - Karinen, Reetta. Ullmann's Encyclopedia of Industrial Chemistry - Glycerol. [Internet] Hoboken, New Jersey, USA : John Wiley & Sons, Inc, 2006. ISBN-10: 3-527-30385-5. 37. Cheung, Hosea - Tanke, Robin S. - Torrence, G. Paul. Ullmann's Encyclopedia of Industrial Chemistry - Acetic Acid. [Internet] Hoboken, New Jersey, USA : John Wiley & Sons, Inc, 2005. ISBN-10: 3-527-30385-5. 38. Li, Qiang - Xing, Jianmin - Li, Wangliang - Liu, Qingfen - Su, Zhiguo. Separation of Succinic Acid from Fermentation Broth Using Weak Alkaline Anion Exchange Adsorbents. Industrial & Engineering Chemistry Research. 2009, 48. 39. Björnsson, Lovisa. Associate professor. Lund, Sweden, 31 Mars 2010. 40. Avfall Sverige AB. Rapport U2009:03 Microbiologisk handbok för biogasanläggningar. Malmö : Avfall Sverige AB, 2009. 1103-4092. 41. Achu, Nges Ivo. Ph.D. student. Personal contact. Lund University, Lund : Department of Biotechnology, 31 March 2010. 42. Davidsson, Åsa. Increase of Biogas Production at Wastewater Treatment Plants. Lund : Lund University, 2007. 978-91-7422-143-5. 43. Jonstrup, Maria - Murto, Marika - Björnsson, Lovisa. Enviromental Biotechnology. Lund, Sweden : Department of Biotechnology, LTH, 2010. 44. Sialve, Bruno - Bernet, Nicolas - Bernard, Oliver. Anaerobic digestion of microalgae as necessary step to make microalgal biodiesel sustainable. Biotechnology Advances. 2009, 27. 45. Mörtstedt, Sten-Erik - Hellsten, Gunnar. Data och diagram - Energi- och kemitekniska tabeller. Stockholm : Liber AB, 2005. ISBN: 91-47-00805-9. 46. South Africa Climate. World Weather and Climate. [Online] Climate & Temperature, 2008-2009. [Cited: 1 May 2010.] http://www.climatetemp.info/south-africa/. 47. Valutaomvandlare | Oanda. Oanda. [Online] Oanda Corporation, 2010. [Cited: 27 April 2010.] http://www.oanda.com/lang/sv/currency/converter/. 48. KET050 Projektering: Index och växelkurser. Kemiteknik, LTH: Hemsida. [Online] Lunds tekniska högskola, 10 May 2010. http://www.chemeng.lth.se/ket050/Index.html.
45
49. Karlsson, Hans T. Projekteringshandboken. Lund : Department of Chemical Engineering, Lund University, 2007. 50. —. Projekteringsmetodik. Lund : Department of Chemical Engineering, Lund University, 1992. 51. Basuyaux, Pierre. Regional Sales Manager. E-mail contact. Fermentis, Lille, France, den 3 May 2010. 52. Sakib Khan, M. Director. E-mail contact. Enerleq, Johannesburg, den 3 May 2010. 53. A review of the Current State of Biodiesel Production Using Enzymatic Transesterification. Fjerbaek, Lene - Christensen, Knud V. - Norddahl, B. 5, Odense : Wiley InterScience, 2009, Vol. 102. 54. Valutaomvandlare | Oanda. Oanda. [Online] Oanda Corporation, 2010. [Cited: 6 May 2010.] http://www.oanda.com/lang/sv/currency/converter/. 55. Karlsson, Hans T. Professor. Peronal contact. Lund University, Lund : Department of Chemical Engineering, den 3 May 2010. 56. Butanediol (BDO) Prices and Pricing Information. Chemical Industry New & Intelligence. [Online] Reed Business Information Limited, 2010. [Cited: 7 May 2010.] http://www.icis.com/v2/chemicals/9075176/butanediol/pricing.html. 57. Acetic Acid Prices and Pricing Information. Chemical Industry News & Intelligence. [Online] Reed Business Information Limited, 2010. [Cited: 7 May 2010.] http://www.icis.com/v2/chemicals/9074786/acetic-acid/pricing.html. 58. Biosuccinic acid ready for take off? Royal Society of Chemistry. [Online] Chemistry World, 21 January 2010. [Cited: 7 May 2010.] http://www.rsc.org/chemistryworld/News/2010/January/21011003.asp. 59. Aylward, Gordon - Findlay, Tristan. SI Chemical Data. Milton, Australia : John Wiley & Sons Australia, Ltd., 2002. ISBN-10: 0-470-80044-5. 60. Beaton, C. F. - Hewitt, G. F. Physical Property Data for the Design Engineer. New York, USA : Hemisphere Publishing Corporation, 1989. ISBN-10: 0-89116-739-0. 61. U.S. Department of Agriculture. Density table for ethanol mixtures. 62. Krässig, Hans - Schurz, Josef - Steadman, Robert G. - Schliefer, Karl - Albrecht, Wilhelm - Mohring, Marc - Schlosser, Harald. Ullmann's Encyclopedia of Industrial Chemistry - Cellulose. [Internet] Hoboken, New Jersey, USA : John Wiley & Sons, Inc, 2004. ISBN-10: 3-527-30385-5. 63. Daniel, James R. - Whistler, Roy L. - Röper, Harald - Elvers, Barbara. Ullmann's Encyclopedia of Industrial Chemistry - Starch. [Internet] Hoboken, New Jersey, USA : John Wiley & Sons, Inc, 2008. ISBN-10: 3-527-30385-5. 64. Composition of GLUCOSE. Physics Laboratory Homepage. [Online] National Institute of Standards and Technology (NIST) Physics Laboratory, 22 April 2010. [Cited: 26 April 2010.] http://physics.nist.gov/cgi-bin/Star/compos.pl?matno=172. 65. Alptekin, Ertan - Canakci, Mustafa. Determination of the density and the viscosities of biodiesel– diesel fuel blends. Renewable Energy. 2008, 33. 66. Statistiska centralbyrån. KPI, fastställda tal (1980=100). Statistiska centralbyråns hemsida. [Online] den 13 April 2010. [Citat: den 5 May 2010.] http://www.scb.se/Pages/TableAndChart____272151.aspx. 67. Zeochem AG Uetikon. PSA ETOH Notes. s.l. : Information leaflet, 2002. 68. Texas Instruments. TI-83 Plus (calculator). SI Tools (application) : s.n. 69. LPG Tanker. Alibaba Manufacturer Directory. [Online] Alibaba Group, 2010. [Cited: 5 May 2010.] http://www.alibaba.com/product-gs/227095618/LPG_tanker_100M3.html. 70. Hexane (Europe) Price Report. ICIS Pricing. [Online] Reed Business Information Limited, 6 November 2009. [Cited: 6 May 2010.] http://www.icispricing.com/il_shared/Samples/SubPage90.asp. 71. Enzymatic alcoholysis for biodiesel fuel production and application of the reaction to oil processing. Shimada, Yuji - Watanabe, Yomi - Sugihara, Akio - Tominaga, Yoshio. Osaka : Journal of Molecular Catalysis, 2002, Vol. 17. 133-142. 72. Wine Range Wineries. Fermentis: levure, levure pour alcool, levure bière, levure sèche. [Online] Fermentis, 2009. [Cited: 29 April 2010.] http://www.fermentis.com/FO/90-Ethanol/90-40_faq.asp.

I
A Appendix A
Figure A.1: Process flowsheet for the designed plant with denotations for all streams and process units.

I
B Appendix B The molar weights and the densities required for the mass calculations are specified in this appendix. Since most of the substances in the processes are composed of carbon, hydrogen and oxygen and since there are only a few other elements present, the molar weights of the constituent elements have been used for calculation of all molar weights. The molar weights of these elements are listed in Table B.1. Table B.1: Molar weights for the elements of which all reacting components are composed. (59) Element Molar Weight (kmoles/h) Carbon 12.01·10-3 Hydrogen 1.01·10-3 Oxygen 16.00·10-3 Nitrogen 39.10·10-3 Average molar weights of the algal oil and of the biodiesel, respectively, have been calculated based on the composition of the fatty acids in the triglycerides that constitute the algal oil. The composition of the algal oil, with regard to the fatty acids, is summarised in Table B.2. Table B.2: Specification of the fatty acid content in the algal oil based on weight. (7) Notation Carbon Atoms Unsaturations Share (wt%) 14-0 14 0 5.0 15-0 15 0 0.5 16-0 16 0 27.8 18-0 18 0 1.0 16-1 16 1 32.4 17-1 17 1 0.2 18-1 18 1 8.5 16-2 16 2 0.4 16-3 16 3 0.1 18-2 18 2 1.7 18-3 18 3 0.6 20-3 20 3 0.9 20-4 20 4 4.0 20-5 20 5 16.1 The formulas below have been used for calculation of the average molar weights. i symbols the num-ber of carbon atoms in the acid and j symbols the number of unsaturations in the same. x is the weight fraction of the concerned fatty acid tail. 𝑀𝑀𝑖𝑖−𝑗𝑗 ,𝑓𝑓𝑠𝑠𝑠𝑠𝑠𝑠𝑦𝑦 𝑠𝑠𝑐𝑐𝑖𝑖𝑑𝑑 𝑠𝑠𝑠𝑠𝑖𝑖𝑠𝑠 = (𝑖𝑖 − 1) ∙ 𝑀𝑀𝐶𝐶 + (2 ∙ (𝑖𝑖 − 1) + 1 − 2 ∙ 𝑗𝑗) ∙ 𝑀𝑀𝐻𝐻
𝑀𝑀𝑠𝑠𝑒𝑒𝑤𝑤𝑤𝑤𝑠𝑠𝑠𝑠𝑤𝑤 ,𝑓𝑓𝑠𝑠𝑠𝑠𝑠𝑠𝑦𝑦 𝑠𝑠𝑐𝑐𝑖𝑖𝑑𝑑 𝑠𝑠𝑠𝑠𝑖𝑖𝑠𝑠𝑠𝑠 =𝑚𝑚𝑠𝑠𝑑𝑑𝑠𝑠𝑠𝑠𝑠𝑠 ,𝑓𝑓𝑠𝑠𝑠𝑠𝑠𝑠𝑦𝑦 𝑠𝑠𝑐𝑐𝑖𝑖𝑑𝑑 𝑠𝑠𝑠𝑠𝑖𝑖𝑠𝑠𝑠𝑠
𝑖𝑖𝑠𝑠𝑑𝑑𝑠𝑠𝑠𝑠𝑠𝑠 ,𝑓𝑓𝑠𝑠𝑠𝑠𝑠𝑠𝑦𝑦 𝑠𝑠𝑐𝑐𝑖𝑖𝑑𝑑 𝑠𝑠𝑠𝑠𝑖𝑖𝑠𝑠𝑠𝑠=
𝑚𝑚𝑠𝑠𝑑𝑑𝑠𝑠𝑠𝑠𝑠𝑠 ,𝑓𝑓𝑠𝑠𝑠𝑠𝑠𝑠𝑦𝑦 𝑠𝑠𝑐𝑐𝑖𝑖𝑑𝑑 𝑠𝑠𝑠𝑠𝑖𝑖𝑠𝑠𝑠𝑠
∑𝑚𝑚𝑖𝑖−𝑗𝑗 ,𝑓𝑓𝑠𝑠𝑠𝑠𝑠𝑠𝑦𝑦 𝑠𝑠𝑐𝑐𝑖𝑖𝑑𝑑 𝑠𝑠𝑠𝑠𝑖𝑖𝑠𝑠𝑀𝑀𝑖𝑖−𝑗𝑗 ,𝑓𝑓𝑠𝑠𝑠𝑠𝑠𝑠𝑦𝑦 𝑠𝑠𝑐𝑐𝑖𝑖𝑑𝑑 𝑠𝑠𝑠𝑠𝑖𝑖𝑠𝑠
𝑖𝑖−𝑗𝑗
=𝑚𝑚𝑠𝑠𝑑𝑑𝑠𝑠𝑠𝑠𝑠𝑠 ,𝑓𝑓𝑠𝑠𝑠𝑠𝑠𝑠𝑦𝑦 𝑠𝑠𝑐𝑐𝑖𝑖𝑑𝑑 𝑠𝑠𝑠𝑠𝑖𝑖𝑠𝑠𝑠𝑠
𝑚𝑚𝑠𝑠𝑑𝑑𝑠𝑠𝑠𝑠𝑠𝑠 ,𝑓𝑓𝑠𝑠𝑠𝑠𝑠𝑠𝑦𝑦 𝑠𝑠𝑐𝑐𝑖𝑖𝑑𝑑 𝑠𝑠𝑠𝑠𝑖𝑖𝑠𝑠𝑠𝑠 ∙ ∑𝑥𝑥𝑖𝑖−𝑗𝑗 ,𝑓𝑓𝑠𝑠𝑠𝑠𝑠𝑠𝑦𝑦 𝑠𝑠𝑐𝑐𝑖𝑖𝑑𝑑 𝑠𝑠𝑠𝑠𝑖𝑖𝑠𝑠𝑀𝑀𝑖𝑖−𝑗𝑗 ,𝑓𝑓𝑠𝑠𝑠𝑠𝑠𝑠𝑦𝑦 𝑠𝑠𝑐𝑐𝑖𝑖𝑑𝑑 𝑠𝑠𝑠𝑠𝑖𝑖𝑠𝑠
𝑖𝑖−𝑗𝑗
=1
∑𝑥𝑥𝑖𝑖−𝑗𝑗 ,𝑓𝑓𝑠𝑠𝑠𝑠𝑠𝑠𝑦𝑦 𝑠𝑠𝑐𝑐𝑖𝑖𝑑𝑑 𝑠𝑠𝑠𝑠𝑖𝑖𝑠𝑠𝑀𝑀𝑖𝑖−𝑗𝑗 ,𝑓𝑓𝑠𝑠𝑠𝑠𝑠𝑠𝑦𝑦 𝑠𝑠𝑐𝑐𝑖𝑖𝑑𝑑 𝑠𝑠𝑠𝑠𝑖𝑖𝑠𝑠
𝑖𝑖−𝑗𝑗
𝑀𝑀𝑠𝑠𝑠𝑠𝑠𝑠𝑠𝑠𝑠𝑠 𝑑𝑑𝑖𝑖𝑠𝑠 = 𝑀𝑀𝐶𝐶3𝐻𝐻5 + 3 ∙ �𝑀𝑀𝐶𝐶𝐶𝐶𝐶𝐶 + 𝑀𝑀𝑠𝑠𝑒𝑒𝑤𝑤𝑤𝑤𝑠𝑠𝑠𝑠𝑤𝑤 ,𝑓𝑓𝑠𝑠𝑠𝑠𝑠𝑠𝑦𝑦 𝑠𝑠𝑐𝑐𝑖𝑖𝑑𝑑 𝑠𝑠𝑠𝑠𝑖𝑖𝑠𝑠𝑠𝑠 � 𝑀𝑀𝑏𝑏𝑖𝑖𝑑𝑑𝑑𝑑𝑖𝑖𝑤𝑤𝑠𝑠𝑤𝑤𝑠𝑠 = 𝑀𝑀𝐶𝐶2𝐻𝐻5 + 𝑀𝑀𝐶𝐶𝐶𝐶𝐶𝐶 + 𝑀𝑀𝑠𝑠𝑒𝑒𝑤𝑤𝑤𝑤𝑠𝑠𝑠𝑠𝑤𝑤 ,𝑓𝑓𝑠𝑠𝑠𝑠𝑠𝑠𝑦𝑦 𝑠𝑠𝑐𝑐𝑖𝑖𝑑𝑑 𝑠𝑠𝑠𝑠𝑖𝑖𝑠𝑠𝑠𝑠

II
Since the yeast S. cerevisiae cannot ferment all types of sugar, it is important to estimate how much of the sugars in the algal flour that can be converted to ethanol. Cellulose is composed solely of glucose units while the compositions of the starch and the free sugar have been taken from a study by J. K. Volkman et al. (7). This composition is compared to data regarding which sugars S. cerevisiae can ferment (28), see Table B.3. Since most of the sugars are fermentable, the missing 0.1 wt% is added to the total share of fermentable sugars, giving 84.2 wt% fermentable sugars in the starch and in the free sugar in the algae. Table B.3: Comparison between the sugar composition in N. salina and the ability of S. cerevisiae to ferment those sugars. (7) (28) Type of Sugar Share of Sugar
in N. salina Fermentable by S. cerevisiae
Addition
Arabinose 1.2 wt% No - Fucose 8.9 wt% Yes 8.9 wt% Galactose 8.8 wt% Yes 8.8 wt% Glucose 60.5 wt% Yes 60.5 wt% Mannose 2.0 wt% Yes 2.0 wt% Rhamnose 11.2 wt% No - Ribose 3.9 wt% Yes 3.9 wt% Xylose 3.4 wt% No - Total 99.9 wt% - 84.1 wt% All densities for liquids and solids used in the calculations are given in the tables below. The ideal gas law has been used for estimation of gas densities. Table B.4 gives densities for four pure organic sub-stances at 20°C and 50°C, respectively. Table B.4: Densities for ethanol, glycerol, propanol and propionic acid at 20°C and 50°C, respectively. (60) Substance Temperature (°C) Density (tonnes/m3) Ethanol 20 0.789
50 0.763 Glycerol 20 1.260
50 1.242 Propanol 20 0.804
50 0.779 Propionic Acid 20 0.993
50 0.963 The density of water for some different temperatures is listed in Table B.5. Table B.5: The density for water at some different temperatures. (45) Temperature (°C) Density (tonnes/m3)
20 0.9982 30 0.9957 40 0.9922
100 0.9584 The density of ethanol-water mixtures of different compositions are given in Table B.6.

III
Table B.6: The density for different ethanol-water mixtures at 20°C. The compositions marked with * are for the stream between the first and the second reactors in the biodiesel process and for the stream flashed of after the second reactor, re-spectively. (61) Ethanol Content Density (vol%) (wt%) (tonnes/m3)
96 93.5 0.8121 - 78.2* 0.8525
80 73.5 0.8639 - 59.0* 0.8980
Table B.7 gives the density of cellulose, starch, glucose, algal oil and biodiesel, respectively. As seen, the densities of the three types of carbohydrates are approximately the same. Due to this and to the fact that it is difficult to define a density for proteins, the densities of cellulose, starch, glucose, proteins and algal flour have all been set to 1.55 tonnes/m3. Regarding the density of biodiesel, the mean value 0.88 tonnes/m3 is used. Table B.7: Densities of cellulose, starch, glucose, algal oil and biodiesel. Substance Density (tonnes/m3) Cellulose 1.52 – 1.59 (62)
Starch 1.5 (63) Glucose 1.54 (64) Algal oil 0.920 (10) Biodiesel 0.86-0.90 (65) Acetic Acid 1.0491 (37) Succinic Acid 1.572 (20) For calculation of the density of the algae the size specifications in Biodiesel Production from Micro-algae –A Feasibility Study (2) and the average alga weight according to J. K. Volkman et al. (7). The length of the alga is 3.3 μm, the diameter is 1.9 μm and the dry weight is 8.3 pg/alga. Since the algae are ellipsoid the average density can be calculated by the formulas below.
𝑉𝑉𝑠𝑠𝑠𝑠𝑠𝑠𝑠𝑠 =4 ∙ 𝜋𝜋
3∙𝑠𝑠𝑠𝑠𝑠𝑠𝑠𝑠𝑠𝑠
2∙ �𝑑𝑑𝑠𝑠𝑠𝑠𝑠𝑠𝑠𝑠
2 �2
𝜌𝜌𝑠𝑠𝑠𝑠𝑠𝑠𝑠𝑠 =
𝑚𝑚𝑠𝑠𝑠𝑠𝑠𝑠𝑠𝑠
𝑉𝑉𝑠𝑠𝑠𝑠𝑠𝑠𝑠𝑠

I
C Appendix C Table C.1-Table C.9 in this appendix contain the mass flows for all streams with denotations in Figure A.1 in Appendix A. Consumption of flocculation chemicals, nutrients, enzymes and yeast is treated in Cost Estimations. The theoretical mass flows of fermentation by-products, assuming total recovery, are listed in Table C.10 together with an indication of which components that will be recovered. Table C.1: Calculated mass flows for the transesterification. Component Triglycerides Glycerol Biodiesel Ethanol Water Mass Flow Tonnes/h Tonnes/h Tonnes/h Tonnes/h Tonnes/h B1 11.81 0 0 0 0 B2 8.86 0.32 3.12 0.16 0.045 B4 1.18 1.17 11.22 0.19 0.14 B5 1.18 1.17 11.22 0 0 B6 1.18 0 11.22 0 0 B7 0.024 0.13 12.44 0.78 0 B8 0.024 0.13 12.44 0 0 B9 0.024 0 12.44 0 0 E15 0 0 0 0.19 0 E18 0 0 0 0.65 0.045 E19 0 0 0 1.30 0.090 E20 0 0 0 0.19 0.14 B3 0 0 0 0.78 0 Table C.2: Calculated mass flows for the algae cultivation, the algal oil recovery and the algal oil pre-treatment. Component Algae Water Algal Oil Triglycerides Phospholipids Algal
Flour Mass Flow Tonnes/h Tonnes/h Tonnes/h Tonnes/h Tonnes/h Tonnes/h A1 35.10 3475 0 0 0 0 A2 29.83 497 0 0 0 0 A3 0 497 11.93 17.90 A4 0 11.93 11.93 0 0 0 A5 0 0 11.93 0 0 0 A6 0 0 0 11.81 0 0 A7 5.26 2978 0 0 0 0 A8 0 11.93 0 0 0 0 A9 0 145 0 0 0 0 A10 5.26 3134 0 0 0 0 A11 0 0 0 0 0.12 0 Table C.3: Calculated mass flows for the SSF, including the stillage. Component Cellulose Starch Sugar Proteins Water Ethanol Carbon
Dioxide Mass Flow Tonnes/h Tonnes/h Tonnes/h Tonnes/h Tonnes/h Tonnes/h Tonnes/h E3 8.95 2.98 1.49 4.47 62.04 0 0 E7 0 0 0 0 0 0 5.05 E8 1.79 0.60 1.27 4.47 60.98 5.30 0 E9 1.79 0.60 1.27 4.47 55.24 0 0

II
Table C.4: Calculated mass flows for the membrane filtration. Component Water Algal Flour Mass Flow Tonnes/h Tonnes/h E1 340.1 17.9 E2 62.0 17.9 E4 177.4 0 E5 278.0 0 E6 177.4 0 Table C.5: Calculated mass flows for the distillation. Component Water Ethanol Mass Flow Tonnes/h Tonnes/h E10 5.74 0 E11 5.74 5.30 E12 0.41 5.86 E13 0.27 3.91 E14 0.27 0.36 E16 0.14 1.95 E17 0 3.55 E21 0 3.36 E22 0 3.91 E23 0 0.36 Table C.6: Calculated mass flows with recovered fermentation by-products. Component Water Sugar Glycerol Acetic Acid Succinic Acid Mass Flow Tonnes/h Tonnes/h Tonnes/h Tonnes/h Tonnes/h R1 41.43 0.952 0.206 0.046 0.022 R5 8.86 0.952 0.206 0.046 0.022 Table C.7: Calculated mass flows for components separated from the fermentation by-products. Component Water Proteins Carbohydrates Mass Flow Tonnes/h Tonnes/h Tonnes/h R2 13.81 4.47 2.80 R3 32.57 0 0 R4 2.86 0 0.95 Table C.8: Calculated mass flows for the Biofuel-Solution process. Comp Glycerol Propanol Acetic
Acid Propionic Acid
Succinic Acid
Water Hydrogen
Mass Flow
Tonnes/h Tonnes/h Tonnes/h Tonnes/h Tonnes/h Tonnes/h Tonnes/h
G3 1.294 0 0 0 0 0 0 P1 0 0.9008 0 0 0 0.022 0 P2 0 0 0 0 0 0 0.061 P3 0 0 0.046 0.097 0.022 6.543 0 P4 0.206 0 0.046 0 0.022 6.001 0 P5 0 0 0 0 0 0 0.018 P6 0 0 0.035 0.072 0.016 0 0 P7 0 0 0.012 0.024 0.005 6.543 0

III
Table C.9: Calculated mass flows for the anaerobic digestion. Component Water Proteins Carbohydrates Methane Carbon Dioxide Mass Flow Tonnes/h Tonnes/h Tonnes/h Tonnes/h Tonnes/h D1 20.51 1.49 1.26 0 0 D2 20.51 1.49 1.26 0 0 D3 20.51 1.49 1.26 0 0 D4 0 0 0 2.14 4.47 D5 61.52 0.90 0.76 0 0 Table C.10: Calculated mass flows of the fermentation by-products and whether or not they will be recovered. Component Mass Flow (tonnes/h) Recovered Acetoin 0.011 No Butanediol 0.039 Yes Glycerol 0.275 Yes Acetic Acid 0.061 Yes Succinic Acid 0.029 Yes

I
D Appendix D The volumetric flows for all streams which have denotations in Figure A.1 in Appendix A, are listed in Table D.1-Table D.8 below. The division of the contents of the tables is based on which sub-process each stream primarily belongs to. Table D.1: Calculated volumetric flow rates for the streams concerning the transesterification process. Stream Volumetric Flow (m3/h) Stream Volumetric Flow (m3/h) B1 12.84 B9 14.16 B2 13.67 E15 0.25 B4 15.33 E18 0.85 B5 14.96 E19 1.71 B6 14.03 E20 0.37 B7 15.27 B3 1.01 B8 14.26 - - Table D.2: Calculated volumetric flow rates for the streams concerning the algae cultivation, the algal oil recovery and the algal oil pre-treatment. Stream Volumetric Flow (m3/h) Stream Volumetric Flow (m3/h) A1 3510 A6 12.8 A2 521 A7 2990 A3 523 A8 12.0 A4 24.9 A9 145 A5 13.0 A10 3150 Table D.3: Calculated volumetric flow rates for the streams concerning the SSF. Stream Volumetric Flow (m3/h) E3 73.9 E7 2880 E8 73.3 Table D.4: Calculated volumetric flow rates for the streams concerning the membrane filtration. Stream Volumetric Flow (m3/h) E1 352.7 E2 73.8 E4 178.0 E5 278.9 E6 178.0 Table D.5: Calculated volumetric flow rates for the streams concerning the distillation and the ethanol dehydration. Stream Volumetric Flow (m3/h) Stream Volumetric Flow (m3/h) E9 60.82 E13 0.25 E10 1.71 E14 0.014 E11 8.88 E16 7.17 E12 7.43 E17 4.61

II
Table D.6: Calculated volumetric flow rates for the streams concerning the fermentation by-product recovery. Stream Volumetric Flow (m3/h) R1 5.07 R2 4.32 R3 5.60 R4 0.75 R5 1.25 Table D.7: Calculated volumetric flow rates for the streams concerning the Biofuel-Solution process. Stream Volumetric Flow (m3/h) G3 1.03 P1 1.15 P2 112.92 P3 6.72 P4 6.24 P5 34.37 P6 0.12 P7 6.60 Table D.8: Calculated volumetric flow rates for the streams concerning the anaerobic digestion. Stream Volumetric Flow (m3/h) D1 22.4 D2 22.4 D3 22.4 D4 6001 D5 63.0

I
E Appendix E
Figure E.1: Process flowsheet from Aspen Plus for the Biofuel-Solution process.
Figure E.2: Process flowsheet from Aspen Plus for the ethanol-water distillation.
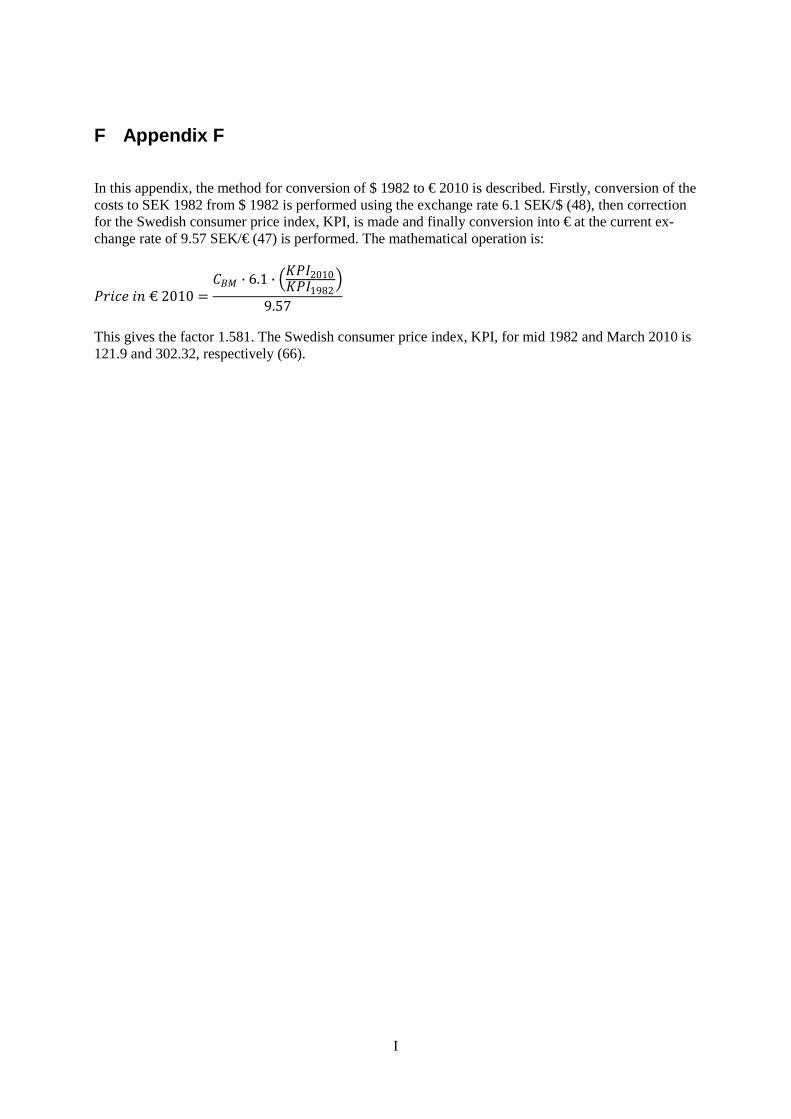
I
F Appendix F In this appendix, the method for conversion of $ 1982 to € 2010 is described. Firstly, conversion of the costs to SEK 1982 from $ 1982 is performed using the exchange rate 6.1 SEK/$ (48), then correction for the Swedish consumer price index, KPI, is made and finally conversion into € at the current ex-change rate of 9.57 SEK/€ (47) is performed. The mathematical operation is:
𝑃𝑃𝑤𝑤𝑖𝑖𝑐𝑐𝑤𝑤 𝑖𝑖𝑖𝑖 € 2010 =𝐶𝐶𝐵𝐵𝑀𝑀 ∙ 6.1 ∙ �𝐾𝐾𝑃𝑃𝐼𝐼2010
𝐾𝐾𝑃𝑃𝐼𝐼1982�
9.57
This gives the factor 1.581. The Swedish consumer price index, KPI, for mid 1982 and March 2010 is 121.9 and 302.32, respectively (66).

I
G Appendix G The capital costs for the filtration units, the molecular sieves with dehydration columns, the stripper, the rectifier and the heat exchangers in the distillation columns are estimated below. For conversion of SEK to €, the exchange rate of 9.57 SEK/€, specified in Assumptions under Cost Estimates, has been used.
G.1 Capital Cost for the Filtration Units The price of the membrane filtration units is based on the required membrane area. According to Prof. Ann-Sofi Jönsson, it is not profitable to construct a filtration unit for which the flux is lower than 10-20 l/(m2·h) (22). Due to this, the difficulty of estimating the flux theoretically and the high dry matter content to be reached, the flux is set to 10 l/(m2·h). If a higher flux is achieved in practice, the capital cost for the filtration units will decrease with the same factor as the flux is increased. An approximate price for the filtration unit is 5 000 SEK/m2 for spiral-wound units, 15 000 SEK/m2 for tubular units and 30 000 SEK/m2 for ceramic units. These price estimations were given by Prof. Ann-Sofi Jönsson. (22) The simple formula for calculation of the membrane areas is given below. A is the membrane area, V is the volumetric flow of permeate and J is the flux of permeate.
𝑍𝑍 =�̇�𝑉𝑘𝑘
The results are listed in Table G.1: Areas of the membranes for the filtration units, the price per area and the resulting unit price. Filtration Unit Area (m2) Price per Area Price per Area Price 2010 F1 27900 5 000 SEK/ m2 €522/m2 €14 571 000 F2 17 800 5 000 SEK/ m2 €522/m2 €9 299 000 Total cost €23 870 000
G.2 Capital Cost for the Molecular Sieves and the Dehydration Columns Rules of thumb for estimation of the linear velocity of the gas passing through the dehydration col-umns and for the height-to-diameter ratio of the columns have been used for calculation of a suitable column size and the required amount of molecular sieves. The rules of thumb used for these calcula-tions were found in the information leaflets from Zeochem (34) (33) (67). According to the informa-tion, the linear velocity should be 5-20 m/min (300-1 200 m/h) and the height-to-diameter ratio should be between 3 and 7. The equations used are given below. 𝑒𝑒𝑠𝑠𝑖𝑖𝑖𝑖𝑤𝑤𝑠𝑠𝑤𝑤 ,𝑚𝑚𝑠𝑠𝑥𝑥 = 61.5 ∙ 𝜌𝜌𝑠𝑠𝑠𝑠𝑠𝑠−0.485
𝑒𝑒𝑠𝑠𝑖𝑖𝑖𝑖𝑤𝑤𝑠𝑠𝑤𝑤 ,𝑚𝑚𝑖𝑖𝑖𝑖 =4.74𝜌𝜌𝑠𝑠𝑠𝑠𝑠𝑠
Since the densities should be given in lbs/ft3 and the resulting linear velocity has the unit ft/min, the following conversion factors were used (68). 1 tonne = 2204.62262 lbs 1 m3 = 35.31467 ft3
1 ft = 0.3048 m

II
Since the calculated maximum linear velocity was 2 303 m/h while the corresponding minimum veloc-ity was 380 m/h, half of the former value, i.e. 1 099 m/h, was chosen. The diameter and height of the columns were calculated according to the formulas below. A height-to-diameter ratio of 5 was chosen.
𝑍𝑍𝑐𝑐𝑤𝑤𝑑𝑑𝑠𝑠𝑠𝑠 𝑠𝑠𝑤𝑤𝑐𝑐𝑠𝑠𝑖𝑖𝑑𝑑𝑖𝑖 ,𝑐𝑐𝑑𝑑𝑠𝑠𝑑𝑑𝑚𝑚𝑖𝑖 =�̇�𝑉𝑠𝑠𝑠𝑠𝑠𝑠𝑒𝑒𝑠𝑠𝑖𝑖𝑖𝑖𝑤𝑤𝑠𝑠𝑤𝑤
𝑑𝑑𝑐𝑐𝑑𝑑𝑠𝑠𝑑𝑑𝑚𝑚𝑖𝑖 = �4 ∙ 𝑍𝑍𝑐𝑐𝑤𝑤𝑑𝑑𝑠𝑠𝑠𝑠 𝑠𝑠𝑤𝑤𝑐𝑐𝑠𝑠𝑖𝑖𝑑𝑑𝑖𝑖 ,𝑐𝑐𝑑𝑑𝑠𝑠𝑑𝑑𝑚𝑚𝑖𝑖
𝜋𝜋= 1.15 𝑚𝑚
ℎ𝑐𝑐𝑑𝑑𝑠𝑠𝑑𝑑𝑚𝑚𝑖𝑖 = 5 ∙ 𝑑𝑑𝑐𝑐𝑑𝑑𝑠𝑠𝑑𝑑𝑚𝑚𝑖𝑖 = 5.76 𝑚𝑚 Based on the bulk density 750 kg/m3 (33) and the price of €4.55/ kg, given by Christina Bång at SinChriJo (31), the price for the molecular sieves in the two dehydration columns was estimated. Since the price given does not include shipment, 20% is added to account for this.
𝑉𝑉𝑐𝑐𝑑𝑑𝑠𝑠𝑑𝑑𝑚𝑚𝑖𝑖 = ℎ𝑐𝑐𝑑𝑑𝑠𝑠𝑑𝑑𝑚𝑚𝑖𝑖 ∙𝜋𝜋 ∙ 𝑑𝑑𝑐𝑐𝑑𝑑𝑠𝑠𝑑𝑑𝑚𝑚𝑖𝑖2
4= 6.00 𝑚𝑚3
𝑚𝑚𝑚𝑚𝑑𝑑𝑠𝑠𝑤𝑤𝑐𝑐𝑑𝑑𝑠𝑠𝑠𝑠𝑤𝑤 𝑠𝑠𝑖𝑖𝑤𝑤𝑒𝑒𝑤𝑤𝑠𝑠 = 2 ∙ 𝜌𝜌𝑚𝑚𝑑𝑑𝑠𝑠𝑤𝑤𝑐𝑐𝑑𝑑𝑠𝑠𝑠𝑠𝑤𝑤 𝑠𝑠𝑖𝑖𝑤𝑤𝑒𝑒𝑤𝑤𝑠𝑠 ∙ 𝑉𝑉𝑐𝑐𝑑𝑑𝑠𝑠𝑑𝑑 𝑚𝑚𝑖𝑖 = 9 007 𝑘𝑘𝑠𝑠 𝑃𝑃𝑤𝑤𝑖𝑖𝑐𝑐𝑤𝑤 𝑚𝑚𝑑𝑑𝑠𝑠𝑤𝑤𝑐𝑐𝑑𝑑𝑠𝑠𝑠𝑠𝑤𝑤 𝑠𝑠𝑖𝑖𝑤𝑤𝑒𝑒𝑤𝑤𝑠𝑠 = 9 007 𝑘𝑘𝑠𝑠 ∙ €4.55/𝑘𝑘𝑠𝑠 ∙ 1.20 = €𝟒𝟒𝟒𝟒 𝟏𝟏𝟏𝟏𝟏𝟏 The calculated values for diameter and height give the Ulrich price: 𝑈𝑈𝑠𝑠𝑤𝑤𝑖𝑖𝑐𝑐ℎ 𝑝𝑝𝑤𝑤𝑖𝑖𝑐𝑐𝑤𝑤 = 2 ∙ $13 000 = $26 000 An add on factor of 4.0 for stainless steel, together with the factor for conversion of $ for 1982 to € 2010 in Appendix X, gives the current price. 𝑃𝑃𝑤𝑤𝑖𝑖𝑐𝑐𝑤𝑤 𝑑𝑑𝑤𝑤ℎ𝑦𝑦𝑑𝑑𝑤𝑤𝑠𝑠𝑠𝑠𝑖𝑖𝑑𝑑𝑖𝑖 𝑐𝑐𝑑𝑑𝑠𝑠𝑑𝑑𝑚𝑚𝑖𝑖𝑠𝑠 = 4.0 ∙ €1.581/$ ∙ $26 000 = €𝟏𝟏𝟏𝟏𝟒𝟒 𝟒𝟒𝟒𝟒𝟒𝟒
G.3 Capital Cost for the Distillation Units Based on the tray sizing results and the power requirements for the reboilers and the condenser given in Aspen Plus, the capital cost for the stripper and the rectifier has been estimated using Ulrich’s method. The total cost is summarised as the costs for vessels, trays and heat exchangers for the reboil-ers and the condensers. In Table F.2, the costs for the vessels and the trays for each unit are specified. Table G.2: Costs for the vessels and the trays in the stripper and the boiler, respectively. Unit Height (m) Width (m) Stages Ulrich Price incl. Factor Price 2010 Stripper 16 1.45 20 $576 000 €910 656 Rectifier 20 1.70 25 $622 500 €984 173 The heating requirements for the reboilers and the condenser were calculated in Aspen, as described in Energy Calculations. Based on these values, the temperatures in the reboilers and the condenser, an assumed heat transfer value of 2 kW/(m2·°C) (9) and the specified use of steam at 160°C, the heat exchanger area for each unit was calculated according to the formulas below. �̇�𝑄 = 𝑘𝑘 ∙ 𝑍𝑍 ∙ (𝑇𝑇𝑠𝑠𝑠𝑠𝑤𝑤𝑠𝑠𝑚𝑚 − 𝑇𝑇𝑑𝑑𝑖𝑖𝑖𝑖𝑠𝑠 ) Ulrich’s method was used for estimation of the costs. The results are given in Table F.3.

III
Table G.3: Costs for the reboilers and the condenser, respectively. Unit Q (kW) Tunit (°C) A(m2) Ulrich Price Factor Price 2010 Stripper, reboiler 6 230 105 56 $65 000 3 €308 295 Rectifier, reboiler 1 020 99 8 $25 000 3 €118 575 Rectifier, condenser -4 540 78 60 $70 000 3 €332 010 Total Cost €758 880

I
H Appendix H All process vessels, for which the price has been estimated with Ulrich’s method, will be constructed in stainless steel. The reason is that this mate-rial is suitable for some of the chemicals for which carbon steel is not resistant enough, e.g. ethanol. Estimated prices for the buffer and product storage tanks are given in Table G.1 and for the LPG tank in Table G.2. The prices for the centrifuges are listed in Table G.3. Table H.1: Data used for estimation of the prices for the buffer and product storage tanks. The prices were read from a graph based on the volume of the vessel. Tank Nota-tion
T (°C) p (atm) Type Flow Rate (m3/h)
Retention Time (h)
Volume (m3)
Ulrich Price
Factor Price 1982
Price 2010
T1 30 1 Bin 12.84 48 616 $2 100 4.5 $9 450 €14 940 T2 30 1 Cone roof 1.03 48 49 $5 000 4.5 $22 500 €35 573 T3 25 1 Bin 73.90 48 3 547 $7 000 4.5 $31 500 €49 802 T4 38 1 Bin 67.29 48 3 230 $7 000 4.5 $31 500 €49 802 T5 30 1 Bin 2.56 48 123 $800 4.5 $3 600 €5 692 T6 25 1 Bin 4.40 168 739 $2 300 4.5 $10 350 €16 363 T7 25 1 Bin 11.48 168 1 929 $5 000 4.5 $22 500 €35 573 T8 25 1 Bin 14.16 168 2 379 $7 500 4.5 $33 750 €53 359 Total cost €261 104 Table H.2: Data used for estimation of the price of the LPG tank. The price was taken from the website Alibaba.com (69). Substance T (°C) p (atm) Type Flow Rate (m3/h) Retention Time (h) Volume (m3) Price 2010 LPG 25 25 Pressure 1929 48 183 €60 000 Table H.3: Data used for estimation of the prices for the centrifuges. The prices were read from a graph based on the volume of the vessel. Unit Notation T (°C) p (atm) Flow Rate (m3/s) Type Ulrich Price Factor Price 1982 Price 2010 C1 30 1 0.004 Centrifuge $55 000 3.4 $187 000 €295 647 C2 100 1 0.004 Centrifuge $55 000 3.4 $187 000 €295 647 C3 37 1 0.017 Centrifuge $100 000 3.4 $340 000 €537 540 Total cost €1 128 834

II
The corresponding data for the liquefaction and the SSF are given in Table G.4 and those for the anaerobic digestion are given in Table G.5. Table H.4: Data required for estimation of the prices for the reactors for the gelatinization, the dextrinisation and the SSF. The prices are based on the vessel volume. Reactor Notation
T (°C) p (atm) Type Flow Rate (m3/h)
Retention Time (h)
Volume (m3)
Ulrich Price Factor Price 1982 Price 2010
R7 ~100 1 Cone roof
36.95 5/60 3 $1 300 4.5 $5 850 €9 249
R8 ~100 1 Cone roof
36.95 5/60 3 $1 300 4.5 $5 850 €9 249
R9 ~100 1 Bin 36.95 2 74 $530 4.5 $2 385 €3 771 R10 ~100 1 Bin 36.95 2 74 $530 4.5 $2 385 €3 771 R11 32 1 Bin 36.95 96 3547 $7 000 4.5 $31 500 €49 802 R12 32 1 Bin 36.95 96 3547 $7 000 4.5 $31 500 €49 802 Total Cost €125 644 Table H.5: Data required for estimation of the price for the reactors for anaerobic digestion. The price is based on the vessel volume. Reactor Notation
T (°C) p (atm) Type Flow Rate (m3/h)
Retention Time (h)
Volume (m3)
Ulrich Price Factor Price 1982 Price 2010
R13 37 1 Bin 22.43 240 5383 $10 000 4.5 $45 000 €71 145 R14 37 1 Bin 22.43 240 5383 $10 000 4.5 $45 000 €71 145 R15 37 1 Bin 22.43 240 5383 $10 000 4.5 $45 000 €71 145 R16 37 1 Bin 22.43 240 5383 $10 000 4.5 $45 000 €71 145 R17 37 1 Bin 22.43 240 5383 $10 000 4.5 $45 000 €71 145 R18 37 1 Bin 22.43 240 5383 $10 000 4.5 $45 000 €71 145 Total Cost €426 870 In Table G.6, the estimation of the price for the ion exchange chromatographs is given in figures. Table H.6: Estimated price for the ion exchange chromatographs and the data for calculation. Unit T (°C) p (atm) Flow Rate
(m3/s) Type Ulrich Price Number Price 1982 Price 2010
Ion Exchange Chro-matographs
25 1 0.019 Water softening $350 000 2 $700 000 €1 106 700
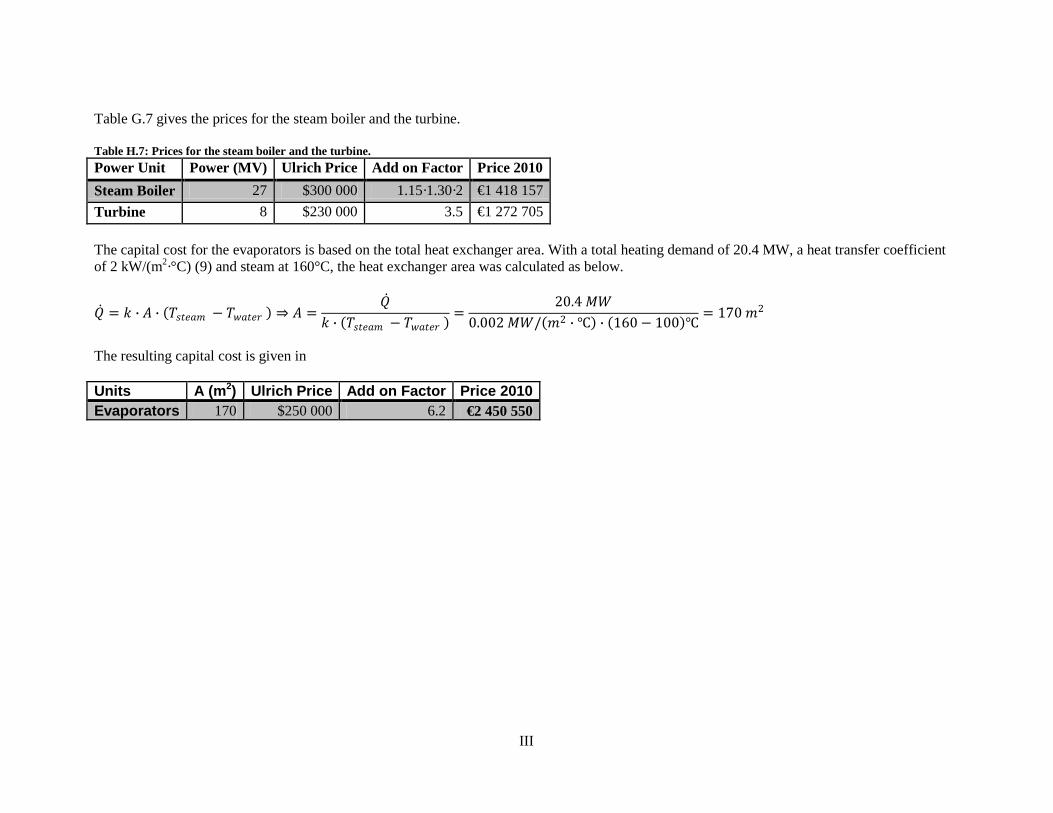
III
Table G.7 gives the prices for the steam boiler and the turbine. Table H.7: Prices for the steam boiler and the turbine. Power Unit Power (MV) Ulrich Price Add on Factor Price 2010 Steam Boiler 27 $300 000 1.15·1.30·2 €1 418 157 Turbine 8 $230 000 3.5 €1 272 705 The capital cost for the evaporators is based on the total heat exchanger area. With a total heating demand of 20.4 MW, a heat transfer coefficient of 2 kW/(m2·°C) (9) and steam at 160°C, the heat exchanger area was calculated as below.
�̇�𝑄 = 𝑘𝑘 ∙ 𝑍𝑍 ∙ (𝑇𝑇𝑠𝑠𝑠𝑠𝑤𝑤𝑠𝑠𝑚𝑚 − 𝑇𝑇𝑤𝑤𝑠𝑠𝑠𝑠𝑤𝑤𝑤𝑤 ) ⇒ 𝑍𝑍 =�̇�𝑄
𝑘𝑘 ∙ (𝑇𝑇𝑠𝑠𝑠𝑠𝑤𝑤𝑠𝑠𝑚𝑚 − 𝑇𝑇𝑤𝑤𝑠𝑠𝑠𝑠𝑤𝑤𝑤𝑤 ) =20.4 𝑀𝑀𝑀𝑀
0.002 𝑀𝑀𝑀𝑀/(𝑚𝑚2 ∙ ℃) ∙ (160− 100)℃= 170 𝑚𝑚2
The resulting capital cost is given in Units A (m2) Ulrich Price Add on Factor Price 2010 Evaporators 170 $250 000 6.2 €2 450 550

I
I Appendix I Prof. Hans T Karlsson has contributed with calculation of the enzyme consumption. For details on his calculations, see Appendix J. With given data, plots have been constructed from which residence time and enzyme consumption can be read. Based on these values, reactor volumes have been calculated. To minimize the consumption of enzymes in reactor one, a residence time of 500 h has been chosen, which gives a consumption of 1.2 kg enzymes/h. This gives a large reactor but is less expensive, due to the high price of enzymes compared to the cost of enlarging the reactor. The reactor volume has been es-timated to 7 000 m3. The same line of thought can be applied on reactor two. A longer residence time gives a smaller consump-tion of enzymes, but increases the reactor volume. A residence time of 500 h gives a consumption of 2.5 kg enzymes/h and a volume of 7 000 m3. As for the third step of the transesterification, which is performed in a series of four reactors, a long resi-dence time has been chosen and assuming the same consumption of enzymes as in the second step, the volume of the four reactors has been estimated. This gives a volume of 5 000 m3 for each reactor. Thus, the enzyme consumption will be 6.2 kg/h. The estimated prices for the reaction vessels are listed in Table G.4. Table I.1: Data required for estimation of the prices for the reactors for the transesterification. The prices are based on the vessel volume. Reactor Notation
T (°C)
p (atm)
Type Volume (m3) Factor Price 1982
Price 2010
R1 35 1 Bin 7000 4,8 $52 800 €83 477 R2 35 1 Bin 7000 4,8 $52 800 €83 477 R3 35 1 Bin 5000 4,8 $43 200 €68 299 R4 35 1 Bin 5000 4,8 $43 200 €68 299 R5 35 1 Bin 5000 4,8 $43 200 €68 299 R6 35 1 Bin 5000 4,8 $43 200 €68 299 Total Cost €440 150 The cost of enzymes for start up has been estimated to €4 443 670 by Prof. Hans T. Karlsson. n-Hexane will be used for regeneration of the enzymes by washing. From the recycle stream, the immobi-lised enzymes are continuously separated by filtration and washed with n-hexane. 210 kg enzymes are washed per hour. To calculate the usage of n-hexane, a solubility of 50 wt% oil in n-hexane and 5 wt% oil on the enzyme particles are assumed. This gives a daily consumption of 0.504 tonnes n-hexane. With the cost of €616 (70) per tonne n-hexane, the daily cost becomes €310.

I
J Appendix J The enzymatic reaction in the transesterification process leads to deactivation of the immobilized enzyme according to two mechanisms, one irreversible mechanism and one reversible mechan-ism. The latter form of deactivation may be counteracted by washing the enzyme. Hence, reactors R1 and R2 are operated continuously as CSTR’s, however, part of the enzyme is separated from the outflow, washed and recycled back to the inlet of each reactor. It is assumed that the deactivation mechanisms are independent and can be described by standard expressions: 𝑍𝑍𝑅𝑅 = 𝑤𝑤𝑥𝑥𝑝𝑝(−𝑘𝑘𝑅𝑅 ∙ 𝑠𝑠) 𝑍𝑍𝐼𝐼 = 𝑤𝑤𝑥𝑥𝑝𝑝(−𝑘𝑘𝐼𝐼 ∙ 𝑠𝑠) in which case R and I indicate reversible and irreversible deactivation, respectively. The notation A is the activity, which attains the value unity when no deactivation has occurred. The deactiva-tion constants k were evaluated from batch experiments by Rodrigues, Rafael C. et al. (11) If the two mechanisms are independent, the total activity can be written as: 𝑍𝑍 = 𝑍𝑍𝑅𝑅 ∙ 𝑍𝑍𝐼𝐼 A short cut was used to obtain kinetic data required for the design. Batch data performed by Shi-mada, Y. et al. (71) were used to evaluate a standard residence time required for the CSTR’s. The batch data were adjusted for deactivation using the equations given above and then adjusted for a CSTR design rather than a batch design. By this method standard residence times (θ0) were ob-tained for reactors R1 and R2, respectively to achieve 30 percent and 90 percent conversion, re-spectively. By extending the residence time in excess of the standard residence time to account for the deac-tivation, as well as a applying a recycle-wash procedure, the required conversions can be reached. The average activity within the CSTR’s as a function of the recycle ratio and the residence time may be written as: �̅�𝑍 = 𝑤𝑤𝑥𝑥𝑝𝑝[−𝜃𝜃 ∙ {𝑘𝑘𝑅𝑅 + 𝑘𝑘𝐼𝐼 ∙ (1 + 𝑅𝑅)}] Here, R denotes mass of recycled enzyme divided by the fresh mass flow of enzyme into the reactor. Note that segregation does not have to be taken into consideration because the deactiva-tion mechanisms are assumed to be first-order processes. The actual residence time required due to deactivation is simply related to the activity as follows:
𝜃𝜃 =𝜃𝜃0
�̅�𝑍

II
The required recycle ratio may be calculated by combining the latter equations according to the following expression:
𝑅𝑅 =𝑠𝑠𝑖𝑖(𝜃𝜃/𝜃𝜃0)𝑘𝑘𝐼𝐼 ∙ 𝜃𝜃
−𝑘𝑘𝑅𝑅𝑘𝑘𝐼𝐼− 1
If selecting an appropriate residence time, the recycle ratio is given from the equation above. The actual feed rate of fresh enzyme may then be estimated from a material balance. Finally, the reac-tor volume is simply the feed rate multiplied by the residence time. Example of design data are given in Figure 1 - Figure 3.
1
10
100
40 60 80100 300 500
Enzyme consumption R1 (kg/h)Enzyme consumption R2 (kg/h)
Enz
yme
cons
umpt
ion
(kg/
h)
Residence time (h)
Figure J.1. Enzyme consumption as a function of residence time.

III
1
10
100
40 60 80100 300 500
Recycle ratio R2Recycle ratio R1
Rec
ycle
ratio
Residence time (h)
Figure J.2. Recycle ratio of enzymes to the washing steps with n-hexane as a function of residence time.
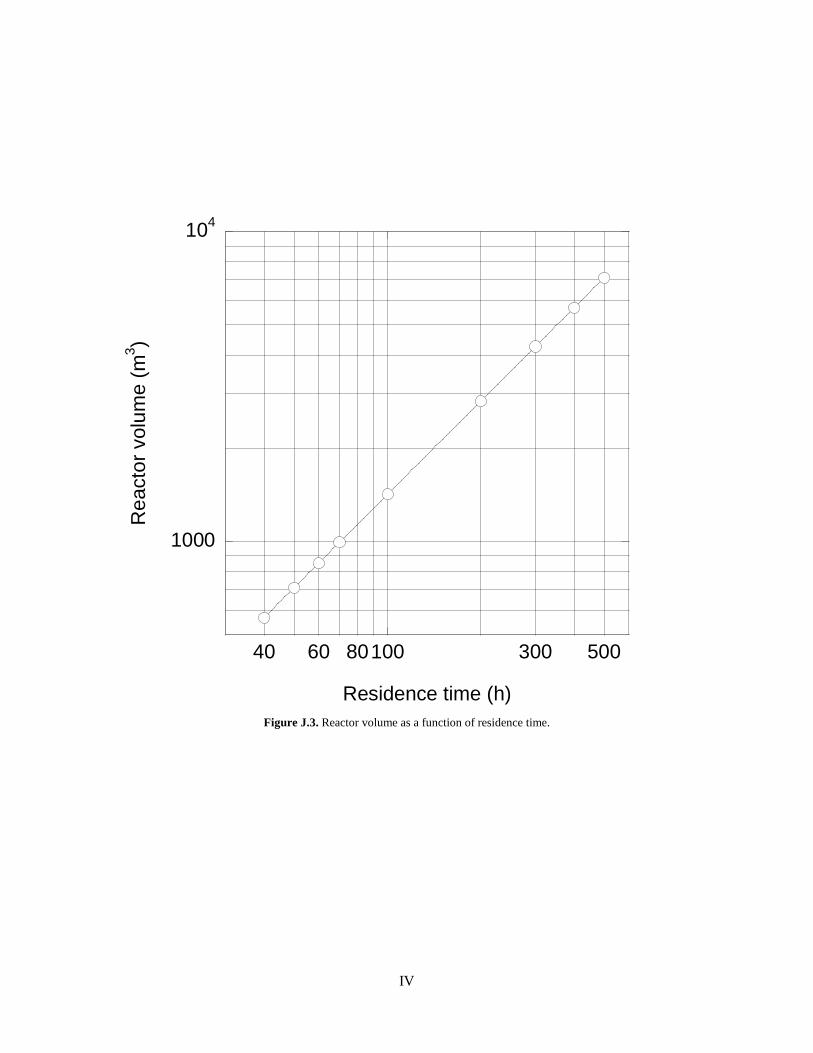
IV
1000
104
40 60 80100 300 500
Rea
ctor
vol
ume
(m3 )
Residence time (h)
Figure J.3. Reactor volume as a function of residence time.
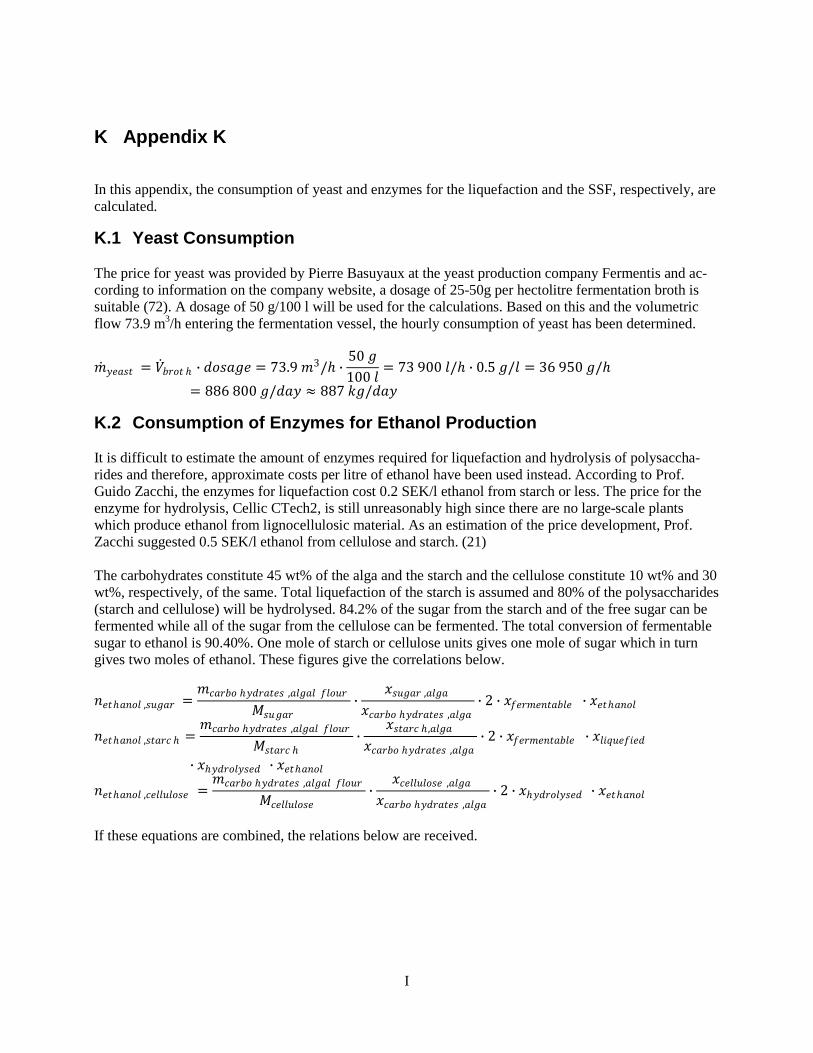
I
K Appendix K In this appendix, the consumption of yeast and enzymes for the liquefaction and the SSF, respectively, are calculated.
K.1 Yeast Consumption The price for yeast was provided by Pierre Basuyaux at the yeast production company Fermentis and ac-cording to information on the company website, a dosage of 25-50g per hectolitre fermentation broth is suitable (72). A dosage of 50 g/100 l will be used for the calculations. Based on this and the volumetric flow 73.9 m3/h entering the fermentation vessel, the hourly consumption of yeast has been determined.
�̇�𝑚𝑦𝑦𝑤𝑤𝑠𝑠𝑠𝑠𝑠𝑠 = �̇�𝑉𝑏𝑏𝑤𝑤𝑑𝑑𝑠𝑠 ℎ ∙ 𝑑𝑑𝑑𝑑𝑠𝑠𝑠𝑠𝑠𝑠𝑤𝑤 = 73.9 𝑚𝑚3/ℎ ∙50 𝑠𝑠100 𝑠𝑠
= 73 900 𝑠𝑠/ℎ ∙ 0.5 𝑠𝑠/𝑠𝑠 = 36 950 𝑠𝑠/ℎ= 886 800 𝑠𝑠/𝑑𝑑𝑠𝑠𝑦𝑦 ≈ 887 𝑘𝑘𝑠𝑠/𝑑𝑑𝑠𝑠𝑦𝑦
K.2 Consumption of Enzymes for Ethanol Production It is difficult to estimate the amount of enzymes required for liquefaction and hydrolysis of polysaccha-rides and therefore, approximate costs per litre of ethanol have been used instead. According to Prof. Guido Zacchi, the enzymes for liquefaction cost 0.2 SEK/l ethanol from starch or less. The price for the enzyme for hydrolysis, Cellic CTech2, is still unreasonably high since there are no large-scale plants which produce ethanol from lignocellulosic material. As an estimation of the price development, Prof. Zacchi suggested 0.5 SEK/l ethanol from cellulose and starch. (21) The carbohydrates constitute 45 wt% of the alga and the starch and the cellulose constitute 10 wt% and 30 wt%, respectively, of the same. Total liquefaction of the starch is assumed and 80% of the polysaccharides (starch and cellulose) will be hydrolysed. 84.2% of the sugar from the starch and of the free sugar can be fermented while all of the sugar from the cellulose can be fermented. The total conversion of fermentable sugar to ethanol is 90.40%. One mole of starch or cellulose units gives one mole of sugar which in turn gives two moles of ethanol. These figures give the correlations below. 𝑖𝑖𝑤𝑤𝑠𝑠ℎ𝑠𝑠𝑖𝑖𝑑𝑑𝑠𝑠 ,𝑠𝑠𝑑𝑑𝑠𝑠𝑠𝑠𝑤𝑤 =
𝑚𝑚𝑐𝑐𝑠𝑠𝑤𝑤𝑏𝑏𝑑𝑑 ℎ𝑦𝑦𝑑𝑑𝑤𝑤𝑠𝑠𝑠𝑠𝑤𝑤𝑠𝑠 ,𝑠𝑠𝑠𝑠𝑠𝑠𝑠𝑠𝑠𝑠 𝑓𝑓𝑠𝑠𝑑𝑑𝑑𝑑𝑤𝑤
𝑀𝑀𝑠𝑠𝑑𝑑𝑠𝑠𝑠𝑠𝑤𝑤∙
𝑥𝑥𝑠𝑠𝑑𝑑𝑠𝑠𝑠𝑠𝑤𝑤 ,𝑠𝑠𝑠𝑠𝑠𝑠𝑠𝑠
𝑥𝑥𝑐𝑐𝑠𝑠𝑤𝑤𝑏𝑏𝑑𝑑 ℎ𝑦𝑦𝑑𝑑𝑤𝑤𝑠𝑠𝑠𝑠𝑤𝑤𝑠𝑠 ,𝑠𝑠𝑠𝑠𝑠𝑠𝑠𝑠∙ 2 ∙ 𝑥𝑥𝑓𝑓𝑤𝑤𝑤𝑤𝑚𝑚𝑤𝑤𝑖𝑖𝑠𝑠𝑠𝑠𝑏𝑏𝑠𝑠𝑤𝑤 ∙ 𝑥𝑥𝑤𝑤𝑠𝑠ℎ𝑠𝑠𝑖𝑖𝑑𝑑𝑠𝑠
𝑖𝑖𝑤𝑤𝑠𝑠ℎ𝑠𝑠𝑖𝑖𝑑𝑑𝑠𝑠 ,𝑠𝑠𝑠𝑠𝑠𝑠𝑤𝑤𝑐𝑐 ℎ =𝑚𝑚𝑐𝑐𝑠𝑠𝑤𝑤𝑏𝑏𝑑𝑑 ℎ𝑦𝑦𝑑𝑑𝑤𝑤𝑠𝑠𝑠𝑠𝑤𝑤𝑠𝑠 ,𝑠𝑠𝑠𝑠𝑠𝑠𝑠𝑠𝑠𝑠 𝑓𝑓𝑠𝑠𝑑𝑑𝑑𝑑𝑤𝑤
𝑀𝑀𝑠𝑠𝑠𝑠𝑠𝑠𝑤𝑤𝑐𝑐 ℎ∙
𝑥𝑥𝑠𝑠𝑠𝑠𝑠𝑠𝑤𝑤𝑐𝑐 ℎ ,𝑠𝑠𝑠𝑠𝑠𝑠𝑠𝑠
𝑥𝑥𝑐𝑐𝑠𝑠𝑤𝑤𝑏𝑏𝑑𝑑 ℎ𝑦𝑦𝑑𝑑𝑤𝑤𝑠𝑠𝑠𝑠𝑤𝑤𝑠𝑠 ,𝑠𝑠𝑠𝑠𝑠𝑠𝑠𝑠∙ 2 ∙ 𝑥𝑥𝑓𝑓𝑤𝑤𝑤𝑤𝑚𝑚𝑤𝑤𝑖𝑖𝑠𝑠𝑠𝑠𝑏𝑏𝑠𝑠𝑤𝑤 ∙ 𝑥𝑥𝑠𝑠𝑖𝑖𝑙𝑙𝑑𝑑𝑤𝑤𝑓𝑓𝑖𝑖𝑤𝑤𝑑𝑑
∙ 𝑥𝑥ℎ𝑦𝑦𝑑𝑑𝑤𝑤𝑑𝑑𝑠𝑠𝑦𝑦𝑠𝑠𝑤𝑤𝑑𝑑 ∙ 𝑥𝑥𝑤𝑤𝑠𝑠ℎ𝑠𝑠𝑖𝑖𝑑𝑑𝑠𝑠
𝑖𝑖𝑤𝑤𝑠𝑠ℎ𝑠𝑠𝑖𝑖𝑑𝑑𝑠𝑠 ,𝑐𝑐𝑤𝑤𝑠𝑠𝑠𝑠𝑑𝑑𝑠𝑠𝑑𝑑𝑠𝑠𝑤𝑤 =𝑚𝑚𝑐𝑐𝑠𝑠𝑤𝑤𝑏𝑏𝑑𝑑 ℎ𝑦𝑦𝑑𝑑𝑤𝑤𝑠𝑠𝑠𝑠𝑤𝑤𝑠𝑠 ,𝑠𝑠𝑠𝑠𝑠𝑠𝑠𝑠𝑠𝑠 𝑓𝑓𝑠𝑠𝑑𝑑𝑑𝑑𝑤𝑤
𝑀𝑀𝑐𝑐𝑤𝑤𝑠𝑠𝑠𝑠𝑑𝑑𝑠𝑠𝑑𝑑𝑠𝑠𝑤𝑤∙
𝑥𝑥𝑐𝑐𝑤𝑤𝑠𝑠𝑠𝑠𝑑𝑑𝑠𝑠𝑑𝑑𝑠𝑠𝑤𝑤 ,𝑠𝑠𝑠𝑠𝑠𝑠𝑠𝑠
𝑥𝑥𝑐𝑐𝑠𝑠𝑤𝑤𝑏𝑏𝑑𝑑 ℎ𝑦𝑦𝑑𝑑𝑤𝑤𝑠𝑠𝑠𝑠𝑤𝑤𝑠𝑠 ,𝑠𝑠𝑠𝑠𝑠𝑠𝑠𝑠∙ 2 ∙ 𝑥𝑥ℎ𝑦𝑦𝑑𝑑𝑤𝑤𝑑𝑑𝑠𝑠𝑦𝑦𝑠𝑠𝑤𝑤𝑑𝑑 ∙ 𝑥𝑥𝑤𝑤𝑠𝑠ℎ𝑠𝑠𝑖𝑖𝑑𝑑𝑠𝑠
If these equations are combined, the relations below are received.

II
𝑥𝑥𝑤𝑤𝑠𝑠ℎ𝑠𝑠𝑖𝑖𝑑𝑑𝑠𝑠 ,𝑠𝑠𝑠𝑠𝑠𝑠𝑤𝑤𝑐𝑐 ℎ =𝑖𝑖𝑤𝑤𝑠𝑠ℎ𝑠𝑠𝑖𝑖𝑑𝑑𝑠𝑠 ,𝑠𝑠𝑠𝑠𝑠𝑠𝑤𝑤𝑐𝑐 ℎ
𝑖𝑖𝑤𝑤𝑠𝑠ℎ𝑠𝑠𝑖𝑖𝑑𝑑𝑠𝑠 ,𝑠𝑠𝑑𝑑𝑠𝑠𝑠𝑠𝑤𝑤 + 𝑖𝑖𝑤𝑤𝑠𝑠ℎ𝑠𝑠𝑖𝑖𝑑𝑑𝑠𝑠 ,𝑠𝑠𝑠𝑠𝑠𝑠𝑤𝑤𝑐𝑐 ℎ + 𝑖𝑖𝑤𝑤𝑠𝑠ℎ𝑠𝑠𝑖𝑖𝑑𝑑𝑠𝑠 ,𝑐𝑐𝑤𝑤𝑠𝑠𝑠𝑠𝑑𝑑𝑠𝑠𝑑𝑑𝑠𝑠𝑤𝑤
=
𝑥𝑥𝑠𝑠𝑠𝑠𝑠𝑠𝑤𝑤𝑐𝑐 ℎ ,𝑠𝑠𝑠𝑠𝑠𝑠𝑠𝑠𝑀𝑀𝑠𝑠𝑠𝑠𝑠𝑠𝑤𝑤𝑐𝑐 ℎ
∙ 𝑥𝑥𝑓𝑓𝑤𝑤𝑤𝑤𝑚𝑚𝑤𝑤𝑖𝑖𝑠𝑠𝑠𝑠𝑏𝑏𝑠𝑠𝑤𝑤 ∙ 𝑥𝑥𝑠𝑠𝑖𝑖𝑙𝑙𝑑𝑑𝑤𝑤𝑓𝑓𝑖𝑖𝑤𝑤𝑑𝑑 ∙ 𝑥𝑥ℎ𝑦𝑦𝑑𝑑𝑤𝑤𝑑𝑑𝑠𝑠𝑦𝑦𝑠𝑠𝑤𝑤𝑑𝑑𝑥𝑥𝑠𝑠𝑑𝑑𝑠𝑠𝑠𝑠𝑤𝑤 ,𝑠𝑠𝑠𝑠𝑠𝑠𝑠𝑠𝑀𝑀𝑠𝑠𝑑𝑑𝑠𝑠𝑠𝑠𝑤𝑤
∙ 𝑥𝑥𝑓𝑓𝑤𝑤𝑤𝑤𝑚𝑚𝑤𝑤𝑖𝑖𝑠𝑠𝑠𝑠𝑏𝑏𝑠𝑠𝑤𝑤 + 𝑥𝑥ℎ𝑦𝑦𝑑𝑑𝑤𝑤𝑑𝑑𝑠𝑠𝑦𝑦𝑠𝑠𝑤𝑤𝑑𝑑 ∙ �𝑥𝑥𝑠𝑠𝑠𝑠𝑠𝑠𝑤𝑤𝑐𝑐 ℎ ,𝑠𝑠𝑠𝑠𝑠𝑠𝑠𝑠𝑀𝑀𝑠𝑠𝑠𝑠𝑠𝑠𝑤𝑤𝑐𝑐 ℎ
∙ 𝑥𝑥𝑓𝑓𝑤𝑤𝑤𝑤𝑚𝑚𝑤𝑤𝑖𝑖𝑠𝑠𝑠𝑠𝑏𝑏𝑠𝑠𝑤𝑤 ∙ 𝑥𝑥𝑠𝑠𝑖𝑖𝑙𝑙𝑑𝑑𝑤𝑤𝑓𝑓𝑖𝑖𝑤𝑤𝑑𝑑 +𝑥𝑥𝑐𝑐𝑤𝑤𝑠𝑠𝑠𝑠𝑑𝑑𝑠𝑠𝑑𝑑𝑠𝑠𝑤𝑤 ,𝑠𝑠𝑠𝑠𝑠𝑠𝑠𝑠𝑀𝑀𝑐𝑐𝑤𝑤𝑠𝑠𝑠𝑠𝑑𝑑𝑠𝑠𝑑𝑑𝑠𝑠𝑤𝑤
�
=0.1
0.1622 ∙ 0.842 ∙ 1 ∙ 0.80.05
0.1802 ∙ 0.842 + 0.8 ∙ � 0.10.1622 ∙ 0.842 ∙ 1 + 0.3
0.1622�= 0.195
𝑥𝑥𝑤𝑤𝑠𝑠ℎ𝑠𝑠𝑖𝑖𝑑𝑑𝑠𝑠 ,𝑐𝑐𝑤𝑤𝑠𝑠𝑠𝑠𝑑𝑑𝑠𝑠𝑑𝑑𝑠𝑠𝑤𝑤 =
𝑖𝑖𝑤𝑤𝑠𝑠ℎ𝑠𝑠𝑖𝑖𝑑𝑑𝑠𝑠 ,𝑐𝑐𝑤𝑤𝑠𝑠𝑠𝑠𝑑𝑑𝑠𝑠𝑑𝑑𝑠𝑠𝑤𝑤
𝑖𝑖𝑤𝑤𝑠𝑠ℎ𝑠𝑠𝑖𝑖𝑑𝑑𝑠𝑠 ,𝑠𝑠𝑑𝑑𝑠𝑠𝑠𝑠𝑤𝑤 + 𝑖𝑖𝑤𝑤𝑠𝑠ℎ𝑠𝑠𝑖𝑖𝑑𝑑𝑠𝑠 ,𝑠𝑠𝑠𝑠𝑠𝑠𝑤𝑤𝑐𝑐 ℎ + 𝑖𝑖𝑤𝑤𝑠𝑠ℎ𝑠𝑠𝑖𝑖𝑑𝑑𝑠𝑠 ,𝑐𝑐𝑤𝑤𝑠𝑠𝑠𝑠𝑑𝑑𝑠𝑠𝑑𝑑𝑠𝑠𝑤𝑤
=
𝑥𝑥𝑐𝑐𝑤𝑤𝑠𝑠𝑠𝑠𝑑𝑑𝑠𝑠𝑑𝑑𝑠𝑠𝑤𝑤 ,𝑠𝑠𝑠𝑠𝑠𝑠𝑠𝑠𝑀𝑀𝑐𝑐𝑤𝑤𝑠𝑠𝑠𝑠𝑑𝑑𝑠𝑠𝑑𝑑𝑠𝑠𝑤𝑤
∙ 𝑥𝑥ℎ𝑦𝑦𝑑𝑑𝑤𝑤𝑑𝑑𝑠𝑠𝑦𝑦𝑠𝑠𝑤𝑤𝑑𝑑𝑥𝑥𝑠𝑠𝑑𝑑𝑠𝑠𝑠𝑠𝑤𝑤 ,𝑠𝑠𝑠𝑠𝑠𝑠𝑠𝑠𝑀𝑀𝑠𝑠𝑑𝑑𝑠𝑠𝑠𝑠𝑤𝑤
∙ 𝑥𝑥𝑓𝑓𝑤𝑤𝑤𝑤𝑚𝑚𝑤𝑤𝑖𝑖𝑠𝑠𝑠𝑠𝑏𝑏𝑠𝑠𝑤𝑤 + 𝑥𝑥ℎ𝑦𝑦𝑑𝑑𝑤𝑤𝑑𝑑𝑠𝑠𝑦𝑦𝑠𝑠𝑤𝑤𝑑𝑑 ∙ �𝑥𝑥𝑠𝑠𝑠𝑠𝑠𝑠𝑤𝑤𝑐𝑐 ℎ ,𝑠𝑠𝑠𝑠𝑠𝑠𝑠𝑠𝑀𝑀𝑠𝑠𝑠𝑠𝑠𝑠𝑤𝑤𝑐𝑐ℎ
∙ 𝑥𝑥𝑓𝑓𝑤𝑤𝑤𝑤𝑚𝑚𝑤𝑤𝑖𝑖𝑠𝑠𝑠𝑠𝑏𝑏𝑠𝑠𝑤𝑤 ∙ 𝑥𝑥𝑠𝑠𝑖𝑖𝑙𝑙𝑑𝑑𝑤𝑤𝑓𝑓𝑖𝑖𝑤𝑤𝑑𝑑 +𝑥𝑥𝑐𝑐𝑤𝑤𝑠𝑠𝑠𝑠𝑑𝑑𝑠𝑠𝑑𝑑𝑠𝑠𝑤𝑤 ,𝑠𝑠𝑠𝑠𝑠𝑠𝑠𝑠𝑀𝑀𝑐𝑐𝑤𝑤𝑠𝑠𝑠𝑠𝑑𝑑𝑠𝑠𝑑𝑑𝑠𝑠𝑤𝑤
�
=0.3
0.1622 ∙ 0.80.05
0.1802 ∙ 0.842 + 0.8 ∙ � 0.10.1622 ∙ 0.842 ∙ 1 + 0.3
0.1622�= 0.695
Since the amount of substance is proportional to the volume, 19.5 vol% of the ethanol produced originates from starch and 89 vol% originates from polysaccharides. Based on the daily production of 5.30·24 tonnes = 127.2 tonnes ethanol, the enzyme cost is calculated as described below.
�̇�𝑉𝑤𝑤𝑠𝑠ℎ𝑠𝑠𝑖𝑖𝑑𝑑𝑠𝑠 𝑓𝑓𝑤𝑤𝑑𝑑𝑚𝑚 𝑠𝑠𝑠𝑠𝑠𝑠𝑤𝑤𝑐𝑐 ℎ = 𝑥𝑥𝑤𝑤𝑠𝑠ℎ𝑠𝑠𝑖𝑖𝑑𝑑𝑠𝑠 ,𝑠𝑠𝑠𝑠𝑠𝑠𝑤𝑤𝑐𝑐 ℎ ∙ �̇�𝑉𝑤𝑤𝑠𝑠ℎ𝑠𝑠𝑖𝑖𝑑𝑑𝑠𝑠 = 𝑥𝑥𝑤𝑤𝑠𝑠ℎ𝑠𝑠𝑖𝑖𝑑𝑑𝑠𝑠 ,𝑠𝑠𝑠𝑠𝑠𝑠𝑤𝑤𝑐𝑐 ℎ ∙�̇�𝑚𝑤𝑤𝑠𝑠ℎ𝑠𝑠𝑖𝑖𝑑𝑑𝑠𝑠
𝜌𝜌𝑤𝑤𝑠𝑠ℎ𝑠𝑠𝑖𝑖𝑑𝑑𝑠𝑠= 0.195 ∙
127.2 𝑠𝑠𝑑𝑑𝑖𝑖𝑖𝑖𝑤𝑤𝑠𝑠/𝑑𝑑𝑠𝑠𝑦𝑦0.789 𝑠𝑠𝑑𝑑𝑖𝑖𝑖𝑖𝑤𝑤𝑠𝑠/𝑚𝑚3 = 31 437 𝑠𝑠/𝑑𝑑𝑠𝑠𝑦𝑦
�̇�𝑉𝑤𝑤𝑠𝑠ℎ𝑠𝑠𝑖𝑖𝑑𝑑𝑠𝑠 𝑓𝑓𝑤𝑤𝑑𝑑𝑚𝑚 𝑐𝑐𝑤𝑤𝑠𝑠𝑠𝑠𝑑𝑑𝑠𝑠𝑑𝑑𝑠𝑠𝑤𝑤 = 𝑥𝑥𝑤𝑤𝑠𝑠ℎ𝑠𝑠𝑖𝑖𝑑𝑑𝑠𝑠 ,𝑐𝑐𝑤𝑤𝑠𝑠𝑠𝑠𝑑𝑑𝑠𝑠𝑑𝑑𝑠𝑠𝑤𝑤 ∙ �̇�𝑉𝑤𝑤𝑠𝑠ℎ𝑠𝑠𝑖𝑖𝑑𝑑𝑠𝑠 = 𝑥𝑥𝑤𝑤𝑠𝑠ℎ𝑠𝑠𝑖𝑖𝑑𝑑𝑠𝑠 ,𝑐𝑐𝑤𝑤𝑠𝑠𝑠𝑠𝑑𝑑𝑠𝑠𝑑𝑑𝑠𝑠𝑤𝑤 ∙�̇�𝑚𝑤𝑤𝑠𝑠ℎ𝑠𝑠𝑖𝑖𝑑𝑑𝑠𝑠
𝜌𝜌𝑤𝑤𝑠𝑠ℎ𝑠𝑠𝑖𝑖𝑑𝑑𝑠𝑠= 0.695 ∙
127.2 𝑠𝑠𝑑𝑑𝑖𝑖𝑖𝑖𝑤𝑤𝑠𝑠/𝑑𝑑𝑠𝑠𝑦𝑦0.789 𝑠𝑠𝑑𝑑𝑖𝑖𝑖𝑖𝑤𝑤𝑠𝑠/𝑚𝑚3 = 112 046 𝑠𝑠/𝑑𝑑𝑠𝑠𝑦𝑦
𝐶𝐶𝑑𝑑𝑠𝑠𝑠𝑠 𝛼𝛼 − 𝑠𝑠𝑚𝑚𝑦𝑦𝑠𝑠𝑠𝑠𝑠𝑠𝑤𝑤 = 0.2 𝑆𝑆𝑆𝑆𝐾𝐾/𝑠𝑠 ∙ �̇�𝑉𝑤𝑤𝑠𝑠ℎ𝑠𝑠𝑖𝑖𝑑𝑑𝑠𝑠 𝑓𝑓𝑤𝑤𝑑𝑑𝑚𝑚 𝑠𝑠𝑠𝑠𝑠𝑠𝑤𝑤𝑐𝑐 ℎ = 0.2 𝑆𝑆𝑆𝑆𝐾𝐾/𝑠𝑠 ∙ 31 437 𝑠𝑠/𝑑𝑑𝑠𝑠𝑦𝑦 = 6 287 𝑆𝑆𝑆𝑆𝐾𝐾/𝑑𝑑𝑠𝑠𝑦𝑦
= 657 €/𝑑𝑑𝑠𝑠𝑦𝑦 𝐶𝐶𝑑𝑑𝑠𝑠𝑠𝑠 𝐶𝐶𝑤𝑤𝑠𝑠𝑠𝑠𝑖𝑖𝑐𝑐 𝐶𝐶𝑇𝑇𝑤𝑤𝑐𝑐ℎ2 = 0.5 𝑆𝑆𝑆𝑆𝐾𝐾/𝑠𝑠 ∙ ��̇�𝑉𝑤𝑤𝑠𝑠ℎ𝑠𝑠𝑖𝑖𝑑𝑑𝑠𝑠 𝑓𝑓𝑤𝑤𝑑𝑑𝑚𝑚 𝑠𝑠𝑠𝑠𝑠𝑠𝑤𝑤𝑐𝑐 ℎ + �̇�𝑉𝑤𝑤𝑠𝑠ℎ𝑠𝑠𝑖𝑖𝑑𝑑𝑠𝑠 𝑓𝑓𝑤𝑤𝑑𝑑𝑚𝑚 𝑐𝑐𝑤𝑤𝑠𝑠𝑠𝑠𝑑𝑑𝑠𝑠𝑑𝑑𝑠𝑠𝑤𝑤 �
= 0.5 𝑆𝑆𝑆𝑆𝐾𝐾/𝑠𝑠 ∙ (31 437 𝑠𝑠/𝑑𝑑𝑠𝑠𝑦𝑦 + 112 046 𝑠𝑠/𝑑𝑑𝑠𝑠𝑦𝑦) = 71 742 𝑆𝑆𝑆𝑆𝐾𝐾/𝑑𝑑𝑠𝑠𝑦𝑦 = 7 496 €/𝑑𝑑𝑠𝑠𝑦𝑦 𝐶𝐶𝑑𝑑𝑠𝑠𝑠𝑠 𝑤𝑤𝑖𝑖𝑎𝑎𝑦𝑦𝑚𝑚𝑤𝑤𝑠𝑠 𝑓𝑓𝑑𝑑𝑤𝑤 𝑤𝑤𝑠𝑠ℎ𝑠𝑠𝑖𝑖𝑑𝑑𝑠𝑠 𝑝𝑝𝑤𝑤𝑑𝑑𝑑𝑑𝑑𝑑𝑐𝑐𝑠𝑠𝑖𝑖𝑑𝑑𝑖𝑖 = 𝐶𝐶𝑑𝑑𝑠𝑠𝑠𝑠 𝛼𝛼 − 𝑠𝑠𝑚𝑚𝑦𝑦𝑠𝑠𝑠𝑠𝑠𝑠𝑤𝑤 + 𝐶𝐶𝑑𝑑𝑠𝑠𝑠𝑠 𝐶𝐶𝑤𝑤𝑠𝑠𝑠𝑠𝑖𝑖𝑐𝑐 𝐶𝐶𝑇𝑇𝑤𝑤𝑐𝑐ℎ2
= 657 €/𝑑𝑑𝑠𝑠𝑦𝑦 + 7 496 €/𝑑𝑑𝑠𝑠𝑦𝑦 = 𝟏𝟏 𝟏𝟏𝟏𝟏𝟎𝟎 €/𝒅𝒅𝒅𝒅𝒅𝒅

I
L Appendix L % Average molar weight of the triglycerides and the ethylesters function M=avemolweight(x) % Atomic Mass M_C=12.01e-3; % tonnes/kmole M_H=1.01e-3; % tonnes/kmole M_O=16.00e-3; % tonnes/kmole % FFA Molar Weights % Saturated FFAs M_14_0=13*M_C+(2*13+2-1)*M_H; % tonnes/kmole M_15_0=14*M_C+(2*14+2-1)*M_H; % tonnes/kmole M_16_0=15*M_C+(2*15+2-1)*M_H; % tonnes/kmole M_18_0=17*M_C+(2*17+2-1)*M_H; % tonnes/kmole % Monounsaturated FFAs M_16_1=15*M_C+(2*15-1)*M_H; % tonnes/kmole M_17_1=16*M_C+(2*16-1)*M_H; % tonnes/kmole M_18_1=17*M_C+(2*17-1)*M_H; % tonnes/kmole % Polyunsaturated FFAs M_16_2=15*M_C+(2*15-2-1)*M_H; % tonnes/kmole M_16_3=15*M_C+(2*15-4-1)*M_H; % tonnes/kmole M_18_2=17*M_C+(2*17-2-1)*M_H; % tonnes/kmole M_18_3=17*M_C+(2*17-4-1)*M_H; % tonnes/kmole M_20_3=19*M_C+(2*19-4-1)*M_H; % tonnes/kmole M_20_4=19*M_C+(2*19-6-1)*M_H; % tonnes/kmole M_20_5=19*M_C+(2*19-8-1)*M_H; % tonnes/kmole M=[M_14_0 M_15_0 M_16_0 M_18_0 M_16_1 M_17_1 M_18_1 M_16_2 M_16_3 M_18_2 M_18_3 M_20_3 M_20_4 M_20_5]; % tonnes/kmole % Total Amount of Substance n_tot=sum(x./M); % Average Lipid Tail Molar Weight M_lipid=1/sum(x./M); % Average Triglyceride Molar Weight M_COO=M_C+2*M_O; M_C3H5=3*M_C+5*M_H; M_triglyceride=M_C3H5+3*(M_COO+M_lipid); % Average Ethylester Molar Weight M_C2H5=2*M_C+5*M_H;

II
M_ethylester=M_C2H5+M_COO+M_lipid; M=[M_triglyceride M_ethylester]; end %% Mass balances function massbalancealgaloil format compact %% Constants % Molar Weights % Weight Fractions of the Fatty Acids in the Algal Oil x=[0.0500 0.0050 0.2780 0.0100 0.3240 0.0020 0.0850 0.0040 0.0010 0.0170 0.0060 0.0090 0.0400 0.1610]; M=avemolweight(x); M_triglyceride=M(1); % tonnes/kmole M_ethylester=M(2); % tonnes/kmole % Elements M_C=12.01e-3; % tonnes/kmole M_H=1.01e-3; % tonnes/kmole M_O=16.00e-3; % tonnes/kmole M_N=14.01e-3; % tonnes/kmole % Organic Substances M_glycerol=3*M_C+8*M_H+3*M_O; % tonnes/kmole M_ethanol=2*M_C+6*M_H+M_O; % tonnes/kmole M_propanol=3*M_C+8*M_H+M_O; % tonnes/kmole M_propionicacid=3*M_C+6*M_H+2*M_O; % tonnes/kmole M_cellulose_starch_n=6*M_C+10*M_H+5*M_O % tonnes/kmole M_glucose=6*M_C+12*M_H+6*M_O % tonnes/kmole % Inorganic Substances M_hydrogen=2*M_H; % tonnes/kmole M_water=2*M_H+M_O; % tonnes/kmole M_CO2=M_C+2*M_O; % tonnes/kmole M_NH4=M_N+4*M_H; % tonnes/kmole M_CH4=M_C+4*M_H; % tonnes/kmole % Densities for Solids rho_cellulose_starch_glucose=1.55; % tonnes/m^3 m_alga=8.3e-12*1e-6; % tonnes l_alga=3.3e-6; % m b_alga=1.9e-6; % m r1_alga=l_alga/2; % m r2_alga=b_alga/2; % m V_alga=4/3*pi*r1_alga*r2_alga^2; % m^3
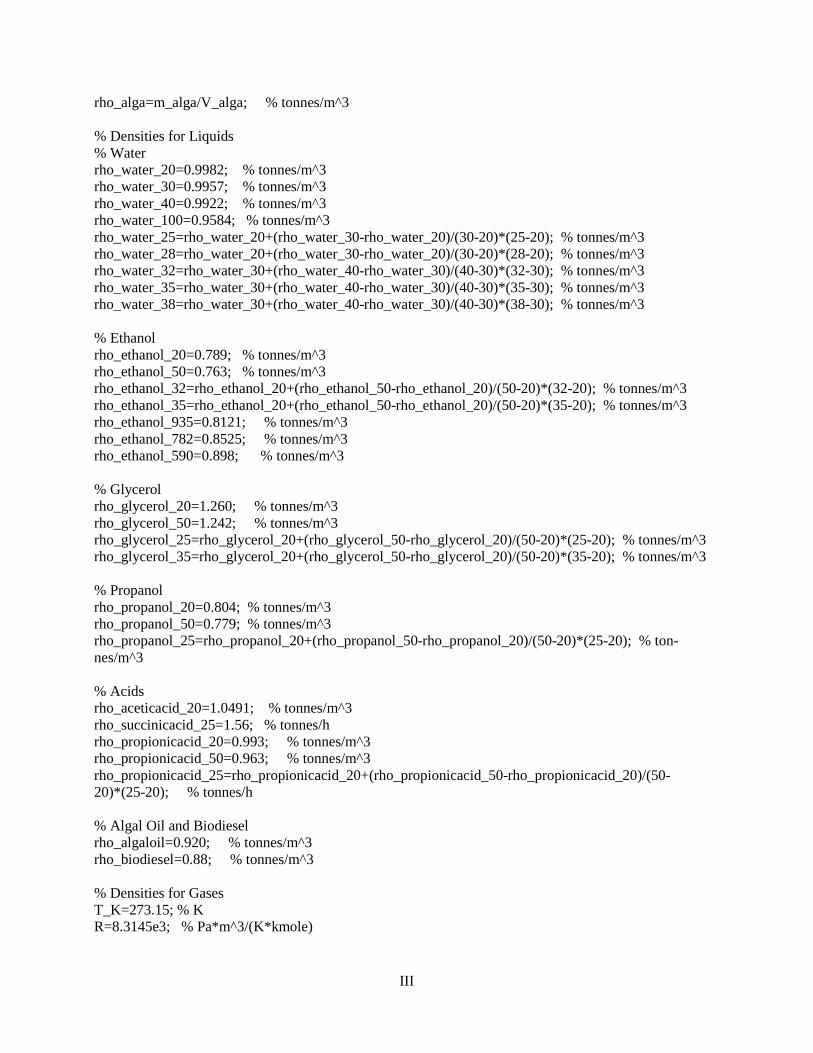
III
rho_alga=m_alga/V_alga; % tonnes/m^3 % Densities for Liquids % Water rho_water_20=0.9982; % tonnes/m^3 rho_water_30=0.9957; % tonnes/m^3 rho_water_40=0.9922; % tonnes/m^3 rho_water_100=0.9584; % tonnes/m^3 rho_water_25=rho_water_20+(rho_water_30-rho_water_20)/(30-20)*(25-20); % tonnes/m^3 rho_water_28=rho_water_20+(rho_water_30-rho_water_20)/(30-20)*(28-20); % tonnes/m^3 rho_water_32=rho_water_30+(rho_water_40-rho_water_30)/(40-30)*(32-30); % tonnes/m^3 rho_water_35=rho_water_30+(rho_water_40-rho_water_30)/(40-30)*(35-30); % tonnes/m^3 rho_water_38=rho_water_30+(rho_water_40-rho_water_30)/(40-30)*(38-30); % tonnes/m^3 % Ethanol rho_ethanol_20=0.789; % tonnes/m^3 rho_ethanol_50=0.763; % tonnes/m^3 rho_ethanol_32=rho_ethanol_20+(rho_ethanol_50-rho_ethanol_20)/(50-20)*(32-20); % tonnes/m^3 rho_ethanol_35=rho_ethanol_20+(rho_ethanol_50-rho_ethanol_20)/(50-20)*(35-20); % tonnes/m^3 rho_ethanol_935=0.8121; % tonnes/m^3 rho_ethanol_782=0.8525; % tonnes/m^3 rho_ethanol_590=0.898; % tonnes/m^3 % Glycerol rho_glycerol_20=1.260; % tonnes/m^3 rho_glycerol_50=1.242; % tonnes/m^3 rho_glycerol_25=rho_glycerol_20+(rho_glycerol_50-rho_glycerol_20)/(50-20)*(25-20); % tonnes/m^3 rho_glycerol_35=rho_glycerol_20+(rho_glycerol_50-rho_glycerol_20)/(50-20)*(35-20); % tonnes/m^3 % Propanol rho_propanol_20=0.804; % tonnes/m^3 rho_propanol_50=0.779; % tonnes/m^3 rho_propanol_25=rho_propanol_20+(rho_propanol_50-rho_propanol_20)/(50-20)*(25-20); % ton-nes/m^3 % Acids rho_aceticacid_20=1.0491; % tonnes/m^3 rho_succinicacid_25=1.56; % tonnes/h rho_propionicacid_20=0.993; % tonnes/m^3 rho_propionicacid_50=0.963; % tonnes/m^3 rho_propionicacid_25=rho_propionicacid_20+(rho_propionicacid_50-rho_propionicacid_20)/(50-20)*(25-20); % tonnes/h % Algal Oil and Biodiesel rho_algaloil=0.920; % tonnes/m^3 rho_biodiesel=0.88; % tonnes/m^3 % Densities for Gases T_K=273.15; % K R=8.3145e3; % Pa*m^3/(K*kmole)

IV
T_hydrogen=180; % degrees C p_hydrogen=10e5; % Pa rho_hydrogen_180_10bar=M_hydrogen*p_hydrogen/(R*(T_hydrogen+T_K)); % tonnes/m^3 T_CO2=32; % degrees C p_CO2=101325; % Pa rho_CO2_32_1atm=M_CO2*p_CO2/(R*(T_CO2+T_K)); % tonnes/m^3 % Annual Biodiesel Production m_biodiesel_year=100000; % tonnes/year operating_time_year=335*24; % h/year %% Transesterification disp('Transesterification') disp(' ') % Specifications x_wt_aze_ethanol=0.935; % wt% ethanol in azeotropic ethanol conv_react_1=0.25; conv_react_2_tot=0.9; conv_react_3=0.98; conv_tot_biodiesel=1-(1-conv_react_2_tot)*(1-conv_react_3); eq_1=1/3; eq_2=2/3; eq_3=1/2; m_biodiesel=m_biodiesel_year/operating_time_year; % tonnes/h n_biodiesel=m_biodiesel/M_ethylester; % kmoles/h % First Reactor % Triglycerides n_triglyceride_B1=n_biodiesel/(3*conv_tot_biodiesel); % kmoles/h m_triglyceride_B1=n_triglyceride_B1*M_triglyceride; % tonnes/h n_triglyceride_B2=n_triglyceride_B1*(1-conv_react_1); % kmoles/h m_triglyceride_B2=n_triglyceride_B2*M_triglyceride; % tonnes/h % Glycerol m_glycerol_B1=0; % tonnes/h n_glycerol_B2=n_triglyceride_B1*conv_react_1; % kmoles/h m_glycerol_B2=n_glycerol_B2*M_glycerol; % tonnes/h % Biodiesel m_biodiesel_B1=0; % tonnes/h n_biodiesel_B2=3*n_triglyceride_B1*conv_react_1; % kmoles/h m_biodiesel_B2=n_biodiesel_B2*M_ethylester; % tonnes/h % Azeotropic Ethanol m_aze_ethanol_B1=0; % tonnes/h m_aze_water_B1=0; % tonnes/h n_aze_ethanol_E18=n_triglyceride_B1*3*eq_1; % kmoles/h

V
m_aze_ethanol_E18=n_aze_ethanol_E18*M_ethanol; % tonnes/h m_aze_water_ethanol_E18=m_aze_ethanol_E18/x_wt_aze_ethanol; % tonnes/h m_aze_water_E18=m_aze_water_ethanol_E18-m_aze_ethanol_E18; % tonnes/h n_aze_ethanol_B2=n_aze_ethanol_E18-3*(n_triglyceride_B1-n_triglyceride_B2); % kmoles/h m_aze_ethanol_B2=n_aze_ethanol_B2*M_ethanol; % tonnes/h m_aze_water_B2=m_aze_water_E18; % tonnes/h % Second Reactor % Triglycerides n_triglyceride_B4B5B6=n_triglyceride_B1*(1-conv_react_2_tot); % kmoles/h m_triglyceride_B4B5B6=n_triglyceride_B4B5B6*M_triglyceride; % tonnes/h % Glycerol n_glycerol_B4B5=n_triglyceride_B1*conv_react_2_tot; % kmoles/h m_glycerol_B4B5=n_glycerol_B4B5*M_glycerol; % tonnes/h m_glycerol_B6=0; % tonnes/h m_glycerol_G1=m_glycerol_B4B5; % tonnes/h % Biodiesel n_biodiesel_B4B5B6=3*n_triglyceride_B1*conv_react_2_tot; % kmoles/h m_biodiesel_B4B5B6=n_biodiesel_B4B5B6*M_ethylester; % tonnes/h % Azeotropic Ethanol n_aze_ethanol_E19=n_triglyceride_B1*3*eq_2; % kmoles/h m_aze_ethanol_E19=n_aze_ethanol_E19*M_ethanol; % tonnes/h m_aze_water_ethanol_E19=m_aze_ethanol_E19/x_wt_aze_ethanol; % tonnes/h m_aze_water_E19=m_aze_water_ethanol_E19-m_aze_ethanol_E19; % tonnes/h n_aze_ethanol_B4E20=n_aze_ethanol_E18+n_aze_ethanol_E19-3*conv_react_2_tot*n_triglyceride_B1; % kmoles/h m_aze_ethanol_B4E20=n_aze_ethanol_B4E20*M_ethanol; % tonnes/h m_aze_water_B4E20=m_aze_water_E19+m_aze_water_B2; % tonnes/h m_aze_ethanol_B5B6=0; % tonnes/h m_aze_water_B5B6=0; % tonnes/h % Third Reactor % Triglycerides n_triglyceride_B7B8B9=n_triglyceride_B1*(1-conv_tot_biodiesel); % kmoles/h m_triglyceride_B7B8B9=n_triglyceride_B7B8B9*M_triglyceride; % tonnes/h % Glycerol n_glycerol_B7B8=n_triglyceride_B4B5B6*conv_react_3; % kmoles/h m_glycerol_B7B8=n_glycerol_B7B8*M_glycerol; % tonnes/h m_glycerol_B9=0; % tonnes/h m_glycerol_G2=m_glycerol_B7B8; % tonnes/h m_glycerol_G3=m_glycerol_G1+m_glycerol_G2; % tonnes/h % Biodiesel n_biodiesel_B7B8B9=3*n_triglyceride_B1*conv_tot_biodiesel; % kmoles/h m_biodiesel_B7B8B9=n_biodiesel_B7B8B9*M_ethylester; % tonnes/h

VI
% Anhydrous Ethanol n_anhyd_ethanol_E15B3=n_triglyceride_B1*3*eq_3; % kmoles/h m_anhyd_ethanol_E15B3=n_anhyd_ethanol_E15B3*M_ethanol; % tonnes/h n_anhyd_ethanol_B7=n_anhyd_ethanol_E15B3-3*n_triglyceride_B4B5B6*conv_react_3; % kmoles/h m_anhyd_ethanol_B7=n_anhyd_ethanol_B7*M_ethanol; % tonnes/h m_anhyd_ethanol_B3=m_anhyd_ethanol_B7; % tonnes/h m_anhyd_ethanol_E15=m_anhyd_ethanol_E15B3-m_anhyd_ethanol_B7; % tonnes/h m_anhyd_ethanol_B8B9=0; % tonnes/h m_water_B7B8B9=0; % tonnes/h m_water_B3E15=0; % tonnes/h % Mass Flows Transesterification disp('Mass Flows (tonnes/h): Triglycerides, Glycerol, Biodiesel, Ethanol, Water') m_transest_B1=[m_triglyceride_B1 m_glycerol_B1 m_biodiesel_B1 m_aze_ethanol_B1 m_aze_water_B1] % tonnes/h m_transest_B2=[m_triglyceride_B2 m_glycerol_B2 m_biodiesel_B2 m_aze_ethanol_B2 m_aze_water_B2] % tonnes/h m_transest_B4=[m_triglyceride_B4B5B6 m_glycerol_B4B5 m_biodiesel_B4B5B6 m_aze_ethanol_B4E20 m_aze_water_B4E20] % tonnes/h m_transest_B5=[m_triglyceride_B4B5B6 m_glycerol_B4B5 m_biodiesel_B4B5B6 m_aze_ethanol_B5B6 m_aze_water_B5B6] % tonnes/h m_transest_B6=[m_triglyceride_B4B5B6 m_glycerol_B6 m_biodiesel_B4B5B6 m_aze_ethanol_B5B6 m_aze_water_B5B6] % tonnes/h m_transest_B7=[m_triglyceride_B7B8B9 m_glycerol_B7B8 m_biodiesel_B7B8B9 m_anhyd_ethanol_B7 m_water_B7B8B9] % tonnes/h m_transest_B8=[m_triglyceride_B7B8B9 m_glycerol_B7B8 m_biodiesel_B7B8B9 m_anhyd_ethanol_B8B9 m_water_B7B8B9] % tonnes/h m_transest_B9=[m_triglyceride_B7B8B9 m_glycerol_B9 m_biodiesel_B7B8B9 m_anhyd_ethanol_B8B9 m_water_B7B8B9] % tonnes/h m_transest_in=m_triglyceride_B1+m_aze_ethanol_E18+m_aze_ethanol_E19+m_anhyd_ethanol_E15 m_transest_out=m_triglyceride_B7B8B9+m_biodiesel_B7B8B9+m_glycerol_B4B5+m_glycerol_B7B8+m_aze_ethanol_B4E20 disp(' ') disp('Ethanol Mass Flows (tonnes/h): B3, E15, E18, E19, E20') m_ethanol_transest=[m_anhyd_ethanol_B3 m_anhyd_ethanol_E15 m_aze_ethanol_E18 m_aze_ethanol_E19 m_aze_ethanol_B4E20] % tonnes/h disp(' ') disp('Water Mass Flows (tonnes/h): B3, E15, E18, E19, E20') m_water_transest=[m_water_B3E15 m_water_B3E15 m_aze_water_E18 m_aze_water_E19 m_aze_water_B4E20] % tonnes/h % Volumetric Flows Transesterification rho_transest_B1_B2=[rho_algaloil rho_glycerol_35 rho_biodiesel rho_ethanol_782 rho_ethanol_782]; % tonnes/m^3

VII
rho_transest_B4_B5_B6=[rho_algaloil rho_glycerol_35 rho_biodiesel rho_ethanol_590 rho_ethanol_590]; % tonnes/m^3 rho_transest_B7_B8_B9=[rho_algaloil rho_glycerol_35 rho_biodiesel rho_ethanol_32 rho_ethanol_32]; % tonnes/m^3 disp(' ') disp('Volumetric Flows (m^3/h): B1, B2, B4, B5, B6, B7, B8, B9') V_transest_B1=sum(m_transest_B1./rho_transest_B1_B2); % m^3/h V_transest_B2=sum(m_transest_B2./rho_transest_B1_B2); % m^3/h V_transest_B4=sum(m_transest_B4./rho_transest_B4_B5_B6); % m^3/h V_transest_B5=sum(m_transest_B5./rho_transest_B4_B5_B6); % m^3/h V_transest_B6=sum(m_transest_B6./rho_transest_B4_B5_B6); % m^3/h V_transest_B7=sum(m_transest_B7./rho_transest_B7_B8_B9); % m^3/h V_transest_B8=sum(m_transest_B8./rho_transest_B7_B8_B9); % m^3/h V_transest_B9=sum(m_transest_B9./rho_transest_B7_B8_B9); % m^3/h V_B1_B2_B4_B5_B6_B7_B8_B9=[V_transest_B1 V_transest_B2 V_transest_B4 V_transest_B5 V_transest_B6 V_transest_B7 V_transest_B8 V_transest_B9] % m^3/h disp(' ') disp('Volumetric Flows (m^3/h): B3, E15, E18, E19, E20') V_B3_E15_E18_E19_E20=(m_ethanol_transest+m_water_transest)./[rho_ethanol_35 rho_ethanol_35 rho_ethanol_935 rho_ethanol_935 rho_ethanol_590] % m^3/h % Total Mass Flows Transesterification % sumtrans_R1_in=sum(m_transest_B1)+m_aze_ethanol_E18+m_aze_water_E18 % sumtrans_R1_out=sum(m_transest_B2) % sumtrans_R2_in=sum(m_transest_B2)+m_aze_ethanol_E19+m_aze_water_E19 % sumtrans_R2_out=sum(m_transest_B4) % sumtrans_flash1_out=sum(m_transest_B5)+m_aze_ethanol_B4E20+m_aze_water_B4E20 % sumtrans_cent1_in=sum(m_transest_B5) % sumtrans_cent1_out=sum(m_transest_B6)+m_glycerol_G1 % sumtrans_R3_in=sum(m_transest_B6)+m_anhyd_ethanol_B3+m_anhyd_ethanol_E15 % sumtrans_R3_out=sum(m_transest_B7) % sumtrans_flash2_out=sum(m_transest_B8)+m_anhyd_ethanol_B3 % sumtrans_cent2_in=sum(m_transest_B8) % sumtrans_cent2_out=sum(m_transest_B9)+m_glycerol_G2 disp(' ') disp('***') disp(' ') %% Algae Cultivation, Oil Separation and Oil Pre-Treatment disp('Algae Cultivation, Oil Recovery and Oil Pre-Treatment') disp(' ') % m_algaloil_A3A4A5=1e5/(24*335);%fel 100000 diesel % Degumming

VIII
x_phos=0.01; % wt% m_algaloil_A3A4A5=m_triglyceride_B1/(1-x_phos); % tonnes/h m_phos_algaloil=m_algaloil_A3A4A5*x_phos; % tonnes/h m_water_oil_A5=0; % tonnes/h V_algaloil_A3A4A5=m_algaloil_A3A4A5/rho_algaloil; % m^3/h % Stirred Settling Tank and Centrifuge % No losses => No change in algal oil flow % Cavitation x_lipids=0.4; % wt% m_algae_sep_A2=m_algaloil_A3A4A5/x_lipids; % tonnes/h m_algae_A3A4A5A8A9=0; % tonnes/h m_algaloil_A1A2A7A8A9A10=0; % tonnes/h % Flocculation and Sedimentation x_wt_algae_sep=0.85; % wt% m_algae_harv_A1=m_algae_sep_A2/x_wt_algae_sep; % tonnes/h m_algae_recycle_A7=m_algae_harv_A1*(1-x_wt_algae_sep); % tonnes/h m_algae_recycle_A10=m_algae_recycle_A7; % tonnes/h % Harvesting x_algae=0.01; m_sol_harv_A1=m_algae_harv_A1/x_algae; % tonnes/h m_water_harv_A1=m_sol_harv_A1*(1-x_algae); % tonnes/h % Algal flour m_algalflour_A3E1=m_algae_sep_A2*(1-x_lipids); % tonnes/h m_algalflour_A1A2A4A5A7A8A9A10=0; % tonnes/h x_algalflour_sep=0.05; % Water flows x_water_sep_A7=0.85; m_recycle_A7=x_water_sep_A7*m_sol_harv_A1; % tonnes/h m_water_recycle_A7=m_recycle_A7-m_algae_recycle_A7; % tonnes/h m_water_sep_A2A3=m_water_harv_A1-m_water_recycle_A7; % tonnes/h m_water_oil_A4A8=m_algaloil_A3A4A5; % tonnes/h m_water_algalflour_E1=m_algalflour_A3E1/x_algalflour_sep-m_algalflour_A3E1; % tonnes/h m_water_algaflour_recycle_A9=m_water_sep_A2A3-m_water_algalflour_E1-m_water_oil_A4A8; % tonnes/h m_water_algaflour_recycle_A10=m_water_recycle_A7+m_water_oil_A4A8+m_water_algaflour_recycle_A9; % tonnes/h % Mass Flows of Algae, Algal Oil and Algal Flour disp('Mass Flows (tonnes/h): Algae, Water, Algal Oil, Algal Flour') m_algae_A1=[m_algae_harv_A1 m_water_harv_A1 m_algaloil_A1A2A7A8A9A10 m_algalflour_A1A2A4A5A7A8A9A10] % tonnes/h m_algae_A2=[m_algae_sep_A2 m_water_sep_A2A3 m_algaloil_A1A2A7A8A9A10 m_algalflour_A1A2A4A5A7A8A9A10] % tonnes/h m_algae_A3=[m_algae_A3A4A5A8A9 m_water_sep_A2A3 m_algaloil_A3A4A5 m_algalflour_A3E1] % tonnes/h

IX
m_algae_A4=[m_algae_A3A4A5A8A9 m_water_oil_A4A8 m_algaloil_A3A4A5 m_algalflour_A1A2A4A5A7A8A9A10] % tonnes/h m_algae_A5=[m_algae_A3A4A5A8A9 m_water_oil_A5 m_algaloil_A3A4A5 m_algalflour_A1A2A4A5A7A8A9A10] % tonnes/h m_algae_A7=[m_algae_recycle_A7 m_water_recycle_A7 m_algaloil_A1A2A7A8A9A10 m_algalflour_A1A2A4A5A7A8A9A10] % tonnes/h m_algae_A8=[m_algae_A3A4A5A8A9 m_water_oil_A4A8 m_algaloil_A1A2A7A8A9A10 m_algalflour_A1A2A4A5A7A8A9A10] % tonnes/h m_algae_A9=[m_algae_A3A4A5A8A9 m_water_algaflour_recycle_A9 m_algaloil_A1A2A7A8A9A10 m_algalflour_A1A2A4A5A7A8A9A10] % tonnes/h m_algae_A10=[m_algae_recycle_A10 m_water_algaflour_recycle_A10 m_algaloil_A1A2A7A8A9A10 m_algalflour_A1A2A4A5A7A8A9A10] % tonnes/h disp(' ') % Mass Flow of Phospholipids disp('Mass Flow (tonnes/h): Phospholipids') m_phos_A11=m_phos_algaloil % tonnes/h disp(' ') % Volumetric Flows of Algae, Algal Oil and Algal Flour rho_algae_water_algaloil_algalflour=[rho_alga rho_water_28 rho_algaloil rho_cellulose_starch_glucose]; % tonnes/m^3 V_algae_A1=sum(m_algae_A1./rho_algae_water_algaloil_algalflour); % m^3/h V_algae_A2=sum(m_algae_A2./rho_algae_water_algaloil_algalflour); % m^3/h V_algae_A3=sum(m_algae_A3./rho_algae_water_algaloil_algalflour); % m^3/h V_algae_A4=sum(m_algae_A4./rho_algae_water_algaloil_algalflour); % m^3/h V_algae_A5=sum(m_algae_A5./rho_algae_water_algaloil_algalflour); % m^3/h V_algae_A7=sum(m_algae_A7./rho_algae_water_algaloil_algalflour); % m^3/h V_algae_A8=sum(m_algae_A8./rho_algae_water_algaloil_algalflour); % m^3/h V_algae_A9=sum(m_algae_A9./rho_algae_water_algaloil_algalflour); % m^3/h V_algae_A10=sum(m_algae_A10./rho_algae_water_algaloil_algalflour); % m^3/h disp('Volumetric Flows (m^3/h): A1, A2, A3, A4, A5, A7, A8, A9, A10') V_A1_A2_A3_A4_A5_A7_A8_A9_A10=[V_algae_A1 V_algae_A2 V_algae_A3 V_algae_A4 V_algae_A5 V_algae_A7 V_algae_A8 V_algae_A9 V_algae_A10] % m^3/h disp(' ') disp('***') disp(' ') %% SSF disp('SSF') disp(' ') x_proteins_algae=0.15; x_cellulose_algae=0.3; x_starch_algae=0.1; x_sugar_algae=0.05;

X
x_proteins_algalflour=x_proteins_algae/(1-x_lipids); x_cellulose_algalflour=x_cellulose_algae/(1-x_lipids); x_starch_algalflour=x_starch_algae/(1-x_lipids); x_sugar_algalflour=x_sugar_algae/(1-x_lipids); % Liquefaction and Hydrolysis yield_liq=1; yield_sugar=0.8; x_wt_ferm_starch_sugar=0.842; m_cellulose_E3=m_algalflour_A3E1*x_cellulose_algalflour; % tonnes/h n_cellulose_E3=m_cellulose_E3/M_cellulose_starch_n; % kmoles/h m_starch_E3=m_algalflour_A3E1*x_starch_algalflour; % tonnes/h n_starch_E3=m_starch_E3/M_cellulose_starch_n; % kmoles/h m_starch_ferm=x_wt_ferm_starch_sugar*m_starch_E3; % tonnes/h n_starch_ferm=m_starch_ferm/M_cellulose_starch_n; % kmoles/h m_sugar_E3=m_algalflour_A3E1*x_sugar_algalflour; % tonnes/h n_sugar_E3=m_sugar_E3/M_glucose; % kmoles/h m_sugar_ferm=m_sugar_E3*x_wt_ferm_starch_sugar; % tonnes/h n_sugar_ferm=m_sugar_ferm/M_glucose; % kmoles/h n_glucose_tot_R9R10=n_sugar_ferm+yield_liq*yield_sugar*n_starch_ferm+yield_sugar*n_cellulose_E3; % kmoles/h n_water_hydrolysis_R9R10=yield_sugar*(n_cellulose_E3+n_starch_E3); % kmoles/h m_water_hydrolysis_R9R10=n_water_hydrolysis_R9R10*M_water; % tonnes/h m_ethanol_E3E7=0; % tonnes/h m_CO2_E3E8=0; % tonnes/h % Fermentation x_wt_acetoin_ethanol=0.15/69.85; x_wt_butanediol_ethanol=0.52/69.85; x_wt_glycerol_ethanol=3.63/69.85; x_wt_aceticacid_ethanol=0.81/69.85; x_wt_succinicacid_ethanol=0.38/69.85; yield_ethanol=0.9040; yield_acetoin=0.0020; yield_butanediol=0.0069; yield_glycerol=0.0235; yield_aceticacid=0.0080; yield_succinicacid=0.0019; conv_glucose_tot=yield_ethanol+yield_acetoin+yield_butanediol+yield_glycerol+yield_aceticacid+yield_succinicacid n_glucose_cons=n_glucose_tot_R9R10*conv_glucose_tot; % kmoles/h n_glucose_cons_byprod=n_glucose_tot_R9R10*(yield_acetoin+yield_butanediol+yield_glycerol+yield_aceticacid+yield_succinicacid); % kmoles/h m_glucose_cons_byprod=n_glucose_cons_byprod*M_glucose; % tonnes/h n_ethanol_prod=yield_ethanol*2*n_glucose_tot_R9R10; % kmoles/h m_ethanol_prod=n_ethanol_prod*M_ethanol; % tonnes/h n_CO2_ferm_E7=n_ethanol_prod; % kmoles/h m_CO2_ferm_E7=n_CO2_ferm_E7*M_CO2; % tonnes/h

XI
% By-Products from the SSF m_acetoin=m_ethanol_prod*x_wt_acetoin_ethanol; % tonnes/h m_glycerol=m_ethanol_prod*x_wt_glycerol_ethanol; % tonnes/h m_aceticacid=m_ethanol_prod*x_wt_aceticacid_ethanol; % tonnes/h m_succinicacid=m_ethanol_prod*x_wt_succinicacid_ethanol; % tonnes/h m_butanediol=m_ethanol_prod*x_wt_butanediol_ethanol; % tonnes/h m_ethanol_E8E11=m_ethanol_prod+m_acetoin; % tonnes/h x_wt_ethanol_SSF_R9R10=0.08; m_water_SSF_E3=m_ethanol_E8E11/x_wt_ethanol_SSF_R9R10-m_ethanol_E8E11+m_water_hydrolysis_R9R10; % tonnes/h m_water_ethanol_E8=m_water_SSF_E3-m_water_hydrolysis_R9R10; % tonnes/h x_wt_solids_SSF_E3=m_algalflour_A3E1*(x_proteins_algalflour+x_cellulose_algalflour+x_starch_algalflour)/(m_algalflour_A3E1+m_water_SSF_E3) % Algal Flour m_proteins_E3E8E9=m_algalflour_A3E1*x_proteins_algalflour; % tonnes/h n_cellulose_E8E9=n_cellulose_E3*(1-yield_sugar); % kmoles/h n_starch_E8E9=n_starch_E3*(1-yield_liq*yield_sugar); % kmoles/h n_sugar_E8E9=n_sugar_E3+(n_starch_E3-n_starch_E8E9)+(n_cellulose_E3-n_cellulose_E8E9)-n_glucose_cons; % kmoles/h m_cellulose_E8E9=M_cellulose_starch_n*n_cellulose_E8E9; % tonnes/h m_starch_E8E9=M_cellulose_starch_n*n_starch_E8E9; % tonnes/h m_sugar_E8E9=M_glucose*n_sugar_E8E9; % tonnes/h m_carb_E8E9=m_cellulose_E8E9+m_starch_E8E9+m_sugar_E8E9; % tonnes/h m_cellulose_E7=0; % tonnes/h m_starch_E7=0; % tonnes/h m_sugar_E7=0; % tonnes/h m_proteins_E7=0; % tonnes/h m_water_E7=0; % tonnes/h x_wt_solids_SSF_R9R10=(m_proteins_E3E8E9+m_carb_E8E9)/(m_proteins_E3E8E9+m_carb_E8E9+m_water_ethanol_E8+m_ethanol_E8E11) disp(' ') % Mass Flows SSF disp('Mass Flows (tonnes/h): Cellulose, Starch, Sugar, Proteins, Water, Ethanol, Carbon Dioxide') m_SSF_E3=[m_cellulose_E3 m_starch_E3 m_sugar_E3 m_proteins_E3E8E9 m_water_SSF_E3 m_ethanol_E3E7 m_CO2_E3E8] % tonnes/h m_SSF_E8=[m_cellulose_E8E9 m_starch_E8E9 m_sugar_E8E9 m_proteins_E3E8E9 m_water_ethanol_E8 m_ethanol_E8E11 m_CO2_E3E8] % tonnes/h m_SSF_E7=[m_cellulose_E7 m_starch_E7 m_sugar_E7 m_proteins_E7 m_water_E7 m_ethanol_E3E7 m_CO2_ferm_E7] % tonnes/h disp(' ') % Volumetric Flows SSF rho_SSF=[rho_cellulose_starch_glucose rho_cellulose_starch_glucose rho_cellulose_starch_glucose rho_cellulose_starch_glucose rho_water_32 rho_ethanol_32 rho_CO2_32_1atm]; % tonnes/m^3 V_SSF_E3=sum(m_SSF_E3./rho_SSF); % m^3/h

XII
V_SSF_E8=sum(m_SSF_E8./rho_SSF); % m^3/h V_SSF_E7=sum(m_SSF_E7./rho_SSF); % m^3/h disp('Volumetric Flows (m^3/h): E3, E7, E8') V_E3_E7_E8=[V_SSF_E3 V_SSF_E7 V_SSF_E8] % m^3/h disp(' ') % Total Mass Flows SSF % sumSSF_in=sum(m_SSF_E3) % sumSSF_out=sum(m_SSF_E8)+sum(m_SSF_E7)+m_glucose_cons_byprod+m_ethanol_prod-m_ethanol_E8E11 disp(' ') disp('***') disp(' ') %% Membrane Filtration x_wt_salt_start=0.035; x_wt_salt_end=0.003; x_wt_salt_freshwater=0.001; f_wt_diafilt=0.01; J=10e-3; % m^3/(m^2*h) disp('Membrane Filtration') disp(' ') x_wt_algalflour_E3=m_algalflour_A3E1*(x_proteins_algalflour+x_cellulose_algalflour+x_starch_algalflour)/(m_algalflour_A3E1+m_water_SSF_E3) m_algalflour_E4E5E6=0; % tonnes/h m_water_E2=m_water_SSF_E3; % tonnes/h m_water_E5=m_water_algalflour_E1-m_water_E2; % tonnes/h V_water_E5=m_water_E5/rho_water_25; % m^3/h x=[]; x(1)=x_wt_salt_start; for i=2:500 x(i)=(x(i-1)+f_wt_diafilt*x_wt_salt_freshwater)/(1+f_wt_diafilt); end x_below_limit=find(x<x_wt_salt_end); n_dilutions=x_below_limit(1); m_water_dilution_E4=m_water_E2*n_dilutions*f_wt_diafilt; % tonnes/h m_water_E6=m_water_dilution_E4; % tonnes/h V_water_E6=m_water_E6/rho_water_25; % m^3/h A_membrane_F1=V_water_E5/J % m^2 A_membrane_F2=V_water_E6/J % m^2

XIII
Price_membrane_m2=5000/9.57; % EUR/m^2 Cost_F1_EUR=A_membrane_F1*Price_membrane_m2 % EUR Cost_F2_EUR=A_membrane_F2*Price_membrane_m2 % EUR Cost_filt_tot=Cost_F1_EUR+Cost_F2_EUR % EUR c_sugar_E3=n_sugar_E3/V_SSF_E3; % kmoles/m^3 pi_sugar=c_sugar_E3*R*(25+T_K)*1e-5 % bar disp(' ') % Mass Flows Filtration disp('Mass Flows (tonnes/h): Water, Algal Flour') m_filt_E1=[m_water_algalflour_E1 m_algalflour_A3E1] % tonnes/h m_filt_E2=[m_water_E2 m_algalflour_A3E1] % tonnes/h m_filt_E4=[m_water_dilution_E4 m_algalflour_E4E5E6] % tonnes/h m_filt_E5=[m_water_E5 m_algalflour_E4E5E6] % tonnes/h m_filt_E6=[m_water_E6 m_algalflour_E4E5E6] % tonnes/h disp(' ') % Volumetric Flows Filtration rho_filt=[rho_water_25 rho_cellulose_starch_glucose]; % tonnes/m^3 V_filt_E1=sum(m_filt_E1./rho_filt); % m^3/h V_filt_E2=sum(m_filt_E2./rho_filt); % m^3/h V_filt_E4=sum(m_filt_E4./rho_filt); % m^3/h V_filt_E5=sum(m_filt_E5./rho_filt); % m^3/h V_filt_E6=sum(m_filt_E6./rho_filt); % m^3/h disp('Volumetric Flows (m^3/h): E1, E2, E4, E5, E6') V_E1_E2_E4_E5_E6=[V_filt_E1 V_filt_E2 V_filt_E4 V_filt_E5 V_filt_E6] % m^3/h disp(' ') disp('***') disp(' ') %% Distillation and Dehydration x_wt_ethanol_rect=0.935; x_wt_ethanol_stripper=0.48; p_ads=3e5; % Pa p_regen=0.2e5; % Pa T_ads=140; % Degrees C f_eff=1.3; f_feed_regen=p_regen/p_ads*f_eff; f_tonnes_m3_to_lbs_ft3=2204.62262/35.31467; % (lbs/ft^3)/(tonnes/m^3) f_ft_min_to_m_h=0.3048*60; % (m/h)/(ft/min) % Stripper m_ethanol_stripper_E11=m_ethanol_E8E11; % tonnes/h m_ethanol_water_stripper_E11=m_ethanol_stripper_E11/x_wt_ethanol_stripper; % tonnes/h

XIV
m_water_stripper_E11=m_ethanol_water_stripper_E11-m_ethanol_stripper_E11; % tonnes/h % Molecular Sieves m_aze_ethanol_E16=m_aze_ethanol_E18+m_aze_ethanol_E19; % tonnes/h m_aze_water_E16=m_aze_water_E18+m_aze_water_E19; % tonnes/h m_anhyd_ethanol_E17=m_ethanol_E8E11+m_aze_ethanol_B4E20-m_aze_ethanol_E16; % tonnes/h m_water_sep_rect_E10=m_water_stripper_E11+m_aze_water_B4E20-m_aze_water_E16; % tonnes/h m_ethanol_E10=0; % tonnes/h m_aze_ethanol_E13=m_anhyd_ethanol_E17/(1-f_feed_regen/x_wt_ethanol_rect); % tonnes/h m_aze_ethanol_water_E13=m_aze_ethanol_E13/x_wt_ethanol_rect; % tonnes/h m_aze_water_E13=m_aze_ethanol_water_E13-m_aze_ethanol_E13; % tonnes/h m_anhyd_ethanol_E22=m_aze_ethanol_E13; % tonnes/h m_anhyd_ethanol_E23E14=m_anhyd_ethanol_E22-m_anhyd_ethanol_E17; % tonnes/h m_water_E14=m_aze_water_E13; % tonnes/h m_anhyd_ethanol_E21=m_anhyd_ethanol_E17-m_anhyd_ethanol_E15; % tonnes/h m_water_E17_E21_E22_E23=0; % tonnes/h % Rectifier m_rect_ethanol_E12=m_aze_ethanol_E13+m_aze_ethanol_E16; % tonnes/h m_rect_water_E12=m_aze_water_E13+m_aze_water_E16; % tonnes/h % Stillage m_water_stillage_E9=m_water_ethanol_E8-m_water_stripper_E11; % tonnes/h rho_gas_E13=(m_aze_water_E13+m_aze_ethanol_E13)/(m_aze_water_E13/M_water+m_aze_ethanol_E13/M_ethanol)*p_ads/(R*(T_ads+T_K)); % tonnes/m^3 rho_gas_E22=M_ethanol*p_ads/(R*(T_ads+T_K)); % tonnes/m^3 disp('Distillation and Dehydration') disp(' ') % Mass Flows of Water, Proteins, Cellulose/Starch and Sugar disp('Mass Flows (tonnes/h): Water, Proteins, Cellulose, Starch, Sugar') m_stillage_E9=[m_water_stillage_E9 m_proteins_E3E8E9 m_cellulose_E8E9 m_starch_E8E9 m_sugar_E8E9] % tonnes/h disp(' ') % Mass Flows of Water-Ethanol Mixtures disp('Mass Flows (tonnes/h): Water, Ethanol') m_dist_E10=[m_water_sep_rect_E10 m_ethanol_E10] % tonnes/h m_dist_E11=[m_water_stripper_E11 m_ethanol_stripper_E11] % tonnes/h m_dist_E12=[m_rect_water_E12 m_rect_ethanol_E12] % tonnes/h m_dist_E13=[m_aze_water_E13 m_aze_ethanol_E13] % tonnes/h m_dist_E14=[m_water_E14 m_anhyd_ethanol_E23E14] % tonnes/h m_dist_E16=[m_aze_water_E16 m_aze_ethanol_E16] % tonnes/h m_dist_E17=[m_water_E17_E21_E22_E23 m_anhyd_ethanol_E17] % tonnes/h m_dist_E21=[m_water_E17_E21_E22_E23 m_anhyd_ethanol_E21] % tonnes/h m_dist_E22=[m_water_E17_E21_E22_E23 m_anhyd_ethanol_E22] % tonnes/h m_dist_E23=[m_water_E17_E21_E22_E23 m_anhyd_ethanol_E23E14] % tonnes/h
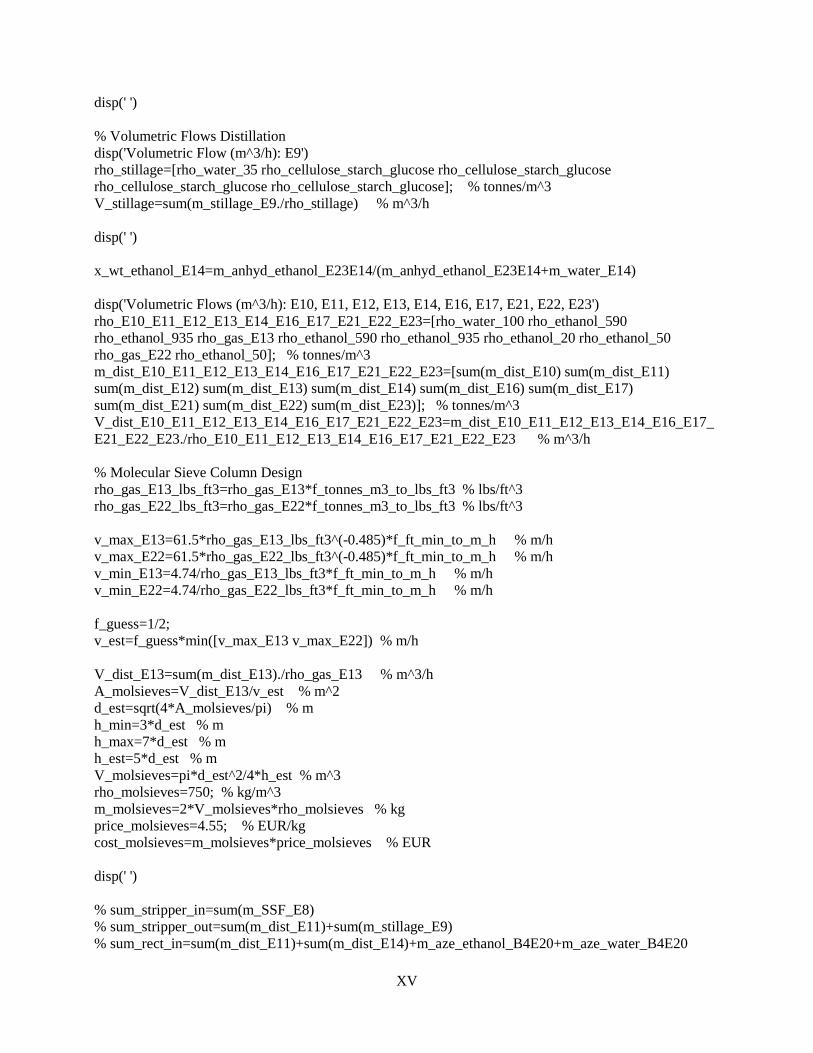
XV
disp(' ') % Volumetric Flows Distillation disp('Volumetric Flow (m^3/h): E9') rho_stillage=[rho_water_35 rho_cellulose_starch_glucose rho_cellulose_starch_glucose rho_cellulose_starch_glucose rho_cellulose_starch_glucose]; % tonnes/m^3 V_stillage=sum(m_stillage_E9./rho_stillage) % m^3/h disp(' ') x_wt_ethanol_E14=m_anhyd_ethanol_E23E14/(m_anhyd_ethanol_E23E14+m_water_E14) disp('Volumetric Flows (m^3/h): E10, E11, E12, E13, E14, E16, E17, E21, E22, E23') rho_E10_E11_E12_E13_E14_E16_E17_E21_E22_E23=[rho_water_100 rho_ethanol_590 rho_ethanol_935 rho_gas_E13 rho_ethanol_590 rho_ethanol_935 rho_ethanol_20 rho_ethanol_50 rho_gas_E22 rho_ethanol_50]; % tonnes/m^3 m_dist_E10_E11_E12_E13_E14_E16_E17_E21_E22_E23=[sum(m_dist_E10) sum(m_dist_E11) sum(m_dist_E12) sum(m_dist_E13) sum(m_dist_E14) sum(m_dist_E16) sum(m_dist_E17) sum(m_dist_E21) sum(m_dist_E22) sum(m_dist_E23)]; % tonnes/m^3 V_dist_E10_E11_E12_E13_E14_E16_E17_E21_E22_E23=m_dist_E10_E11_E12_E13_E14_E16_E17_E21_E22_E23./rho_E10_E11_E12_E13_E14_E16_E17_E21_E22_E23 % m^3/h % Molecular Sieve Column Design rho_gas_E13_lbs_ft3=rho_gas_E13*f_tonnes_m3_to_lbs_ft3 % lbs/ft^3 rho_gas_E22_lbs_ft3=rho_gas_E22*f_tonnes_m3_to_lbs_ft3 % lbs/ft^3 v_max_E13=61.5*rho_gas_E13_lbs_ft3^(-0.485)*f_ft_min_to_m_h % m/h v_max_E22=61.5*rho_gas_E22_lbs_ft3^(-0.485)*f_ft_min_to_m_h % m/h v_min_E13=4.74/rho_gas_E13_lbs_ft3*f_ft_min_to_m_h % m/h v_min_E22=4.74/rho_gas_E22_lbs_ft3*f_ft_min_to_m_h % m/h f_guess=1/2; v_est=f_guess*min([v_max_E13 v_max_E22]) % m/h V_dist_E13=sum(m_dist_E13)./rho_gas_E13 % m^3/h A_molsieves=V_dist_E13/v_est % m^2 d_est=sqrt(4*A_molsieves/pi) % m h_min=3*d_est % m h_max=7*d_est % m h_est=5*d_est % m V_molsieves=pi*d_est^2/4*h_est % m^3 rho_molsieves=750; % kg/m^3 m_molsieves=2*V_molsieves*rho_molsieves % kg price_molsieves=4.55; % EUR/kg cost_molsieves=m_molsieves*price_molsieves % EUR disp(' ') % sum_stripper_in=sum(m_SSF_E8) % sum_stripper_out=sum(m_dist_E11)+sum(m_stillage_E9) % sum_rect_in=sum(m_dist_E11)+sum(m_dist_E14)+m_aze_ethanol_B4E20+m_aze_water_B4E20
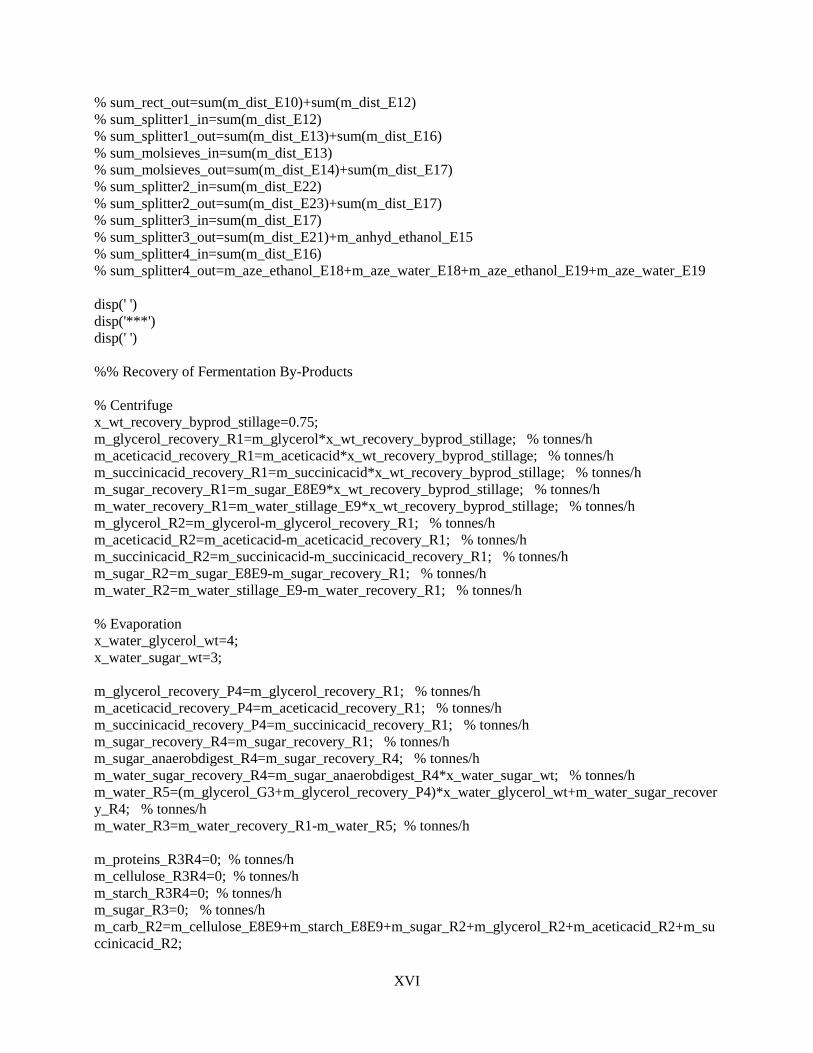
XVI
% sum_rect_out=sum(m_dist_E10)+sum(m_dist_E12) % sum_splitter1_in=sum(m_dist_E12) % sum_splitter1_out=sum(m_dist_E13)+sum(m_dist_E16) % sum_molsieves_in=sum(m_dist_E13) % sum_molsieves_out=sum(m_dist_E14)+sum(m_dist_E17) % sum_splitter2_in=sum(m_dist_E22) % sum_splitter2_out=sum(m_dist_E23)+sum(m_dist_E17) % sum_splitter3_in=sum(m_dist_E17) % sum_splitter3_out=sum(m_dist_E21)+m_anhyd_ethanol_E15 % sum_splitter4_in=sum(m_dist_E16) % sum_splitter4_out=m_aze_ethanol_E18+m_aze_water_E18+m_aze_ethanol_E19+m_aze_water_E19 disp(' ') disp('***') disp(' ') %% Recovery of Fermentation By-Products % Centrifuge x_wt_recovery_byprod_stillage=0.75; m_glycerol_recovery_R1=m_glycerol*x_wt_recovery_byprod_stillage; % tonnes/h m_aceticacid_recovery_R1=m_aceticacid*x_wt_recovery_byprod_stillage; % tonnes/h m_succinicacid_recovery_R1=m_succinicacid*x_wt_recovery_byprod_stillage; % tonnes/h m_sugar_recovery_R1=m_sugar_E8E9*x_wt_recovery_byprod_stillage; % tonnes/h m_water_recovery_R1=m_water_stillage_E9*x_wt_recovery_byprod_stillage; % tonnes/h m_glycerol_R2=m_glycerol-m_glycerol_recovery_R1; % tonnes/h m_aceticacid_R2=m_aceticacid-m_aceticacid_recovery_R1; % tonnes/h m_succinicacid_R2=m_succinicacid-m_succinicacid_recovery_R1; % tonnes/h m_sugar_R2=m_sugar_E8E9-m_sugar_recovery_R1; % tonnes/h m_water_R2=m_water_stillage_E9-m_water_recovery_R1; % tonnes/h % Evaporation x_water_glycerol_wt=4; x_water_sugar_wt=3; m_glycerol_recovery_P4=m_glycerol_recovery_R1; % tonnes/h m_aceticacid_recovery_P4=m_aceticacid_recovery_R1; % tonnes/h m_succinicacid_recovery_P4=m_succinicacid_recovery_R1; % tonnes/h m_sugar_recovery_R4=m_sugar_recovery_R1; % tonnes/h m_sugar_anaerobdigest_R4=m_sugar_recovery_R4; % tonnes/h m_water_sugar_recovery_R4=m_sugar_anaerobdigest_R4*x_water_sugar_wt; % tonnes/h m_water_R5=(m_glycerol_G3+m_glycerol_recovery_P4)*x_water_glycerol_wt+m_water_sugar_recovery_R4; % tonnes/h m_water_R3=m_water_recovery_R1-m_water_R5; % tonnes/h m_proteins_R3R4=0; % tonnes/h m_cellulose_R3R4=0; % tonnes/h m_starch_R3R4=0; % tonnes/h m_sugar_R3=0; % tonnes/h m_carb_R2=m_cellulose_E8E9+m_starch_E8E9+m_sugar_R2+m_glycerol_R2+m_aceticacid_R2+m_succinicacid_R2;

XVII
m_carb_R3=m_cellulose_R3R4+m_starch_R3R4+m_sugar_R3; m_carb_R4=m_cellulose_R3R4+m_starch_R3R4+m_sugar_anaerobdigest_R4; disp('Fermentation By-Products') disp(' ') % Mass Flows in the Fermentation By-Product Recovery disp('Mass Flows (tonnes/h): Water, Sugar, Glycerol, Acetic Acid, Succinic Acid') m_recovery_R1=[m_water_recovery_R1 m_sugar_recovery_R1 m_glycerol_recovery_R1 m_aceticacid_recovery_R1 m_succinicacid_recovery_R1] m_recovery_R5=[m_water_R5 m_sugar_recovery_R4 m_glycerol_recovery_R1 m_aceticacid_recovery_R1 m_succinicacid_recovery_R1] disp(' ') disp('Mass Flows (tonnes/h): Water, Proteins, Carbohydrates') m_recovery_R2=[m_water_R2 m_proteins_E3E8E9 m_carb_R2] m_recovery_R3=[m_water_R3 m_proteins_R3R4 m_carb_R3] m_recovery_R4=[m_water_sugar_recovery_R4 m_proteins_R3R4 m_carb_R4] % sum_centrifuge_in=sum(m_stillage_E9)+m_glycerol+m_aceticacid+m_succinicacid % sum_centrifuge_out=sum(m_recovery_R1)+sum(m_recovery_R2) % % sum_evap_in=sum(m_recovery_R1) % sum_evap_out=sum(m_recovery_R3)+sum(m_recovery_R5) disp(' ') % Volumetric Flows in the Fermentation By-Product Recovery disp('Volumetric Flows (m^3/h): R1, R2, R3, R4, R5') rho_R1R5=[rho_water_25 rho_cellulose_starch_glucose rho_glycerol_25 rho_aceticacid_20 rho_succinicacid_25]; % tonnes/m^3 rho_R2R3R4=[rho_water_25 rho_cellulose_starch_glucose rho_cellulose_starch_glucose]; % ton-nes/m^3 V_R1=sum(m_recovery_R1/rho_R1R5); % m^3/h V_R2=sum(m_recovery_R2/rho_R2R3R4); % m^3/h V_R3=sum(m_recovery_R3/rho_R2R3R4); % m^3/h V_R4=sum(m_recovery_R4/rho_R2R3R4); % m^3/h V_R5=sum(m_recovery_R5/rho_R1R5); % m^3/h V_R1_R2_R3_R4_R5=[V_R1 V_R2 V_R3 V_R4 V_R5] % m^3/h disp(' ') % Theoretical Mass Flows of Fermentation By-Products disp('Theoretical Mass Flows (tonnes/h): Acetoin, Butanediol, Glycerol, Acetic Acid, Succinic Acid') m_byproducts_ferm=[m_acetoin m_butanediol m_glycerol m_aceticacid m_succinicacid] % tonnes/h disp(' ') disp('***') disp(' ')

XVIII
%% Biofuel-Solution Process disp('Biofuel-Solution Process') disp(' ') x_hydrogen_glycerol_mol=1.2*2; conv_propanol=0.92; conv_propionicacid=1-conv_propanol; x_wt_water_propanol=0.024; % Reactions m_water_P4=m_water_R5-m_water_sugar_recovery_R4; % tonnes/h n_glycerol_G3=m_glycerol_G3/M_glycerol; % kmoles/h n_glycerol_P4=m_glycerol_recovery_P4/M_glycerol; % kmoles/h n_propanol_P1=conv_propanol*(n_glycerol_G3+n_glycerol_P4); % kmoles/h m_propanol_P1=n_propanol_P1*M_propanol; % tonnes/h m_propanol_water_P1=m_propanol_P1/(1-x_wt_water_propanol); % tonnes/h m_water_P1=m_propanol_water_P1-m_propanol_P1; % tonnes/h n_propionicacid_P3=conv_propionicacid*(n_glycerol_G3+n_glycerol_P4); % kmoles/h m_propionicacid_P3=n_propionicacid_P3*M_propionicacid; % tonnes/h m_propanol_G3P3P4=0; % tonnes/h m_glycerol_P1P3P4=0; % tonnes/h m_propionicacid_G3P1P4=0; % tonnes/h m_water_G3=0; % tonnes/h n_hydrogen_in_react=x_hydrogen_glycerol_mol*(n_glycerol_G3+n_glycerol_P4); % kmoles/h m_hydrogen_in_react=n_hydrogen_in_react*M_hydrogen; % tonnes/h n_water_prod=2*n_propanol_P1+n_propionicacid_P3; % kmoles/h m_water_prod=n_water_prod*M_water; % tonnes/h m_water_P3=m_water_P4+m_water_prod-m_water_P1; % tonnes/h n_hydrogen_cons=2*n_propanol_P1; % kmoles/h n_hydrogen_P2=n_hydrogen_cons; % kmoles/h m_hydrogen_P2=n_hydrogen_P2*M_hydrogen; % tonnes/h m_hydrogen_P5=m_hydrogen_in_react-m_hydrogen_P2; % tonnes/h % Acids x_acids_sep=0.75; m_aceticacid_G3P1=0; % tonnes/h m_succinicacid_G3P1=0; % tonnes/h m_aceticacid_P3P4=m_aceticacid_recovery_P4; % tonnes/h m_succinicacid_P3P4=m_succinicacid_recovery_P4; % tonnes/h m_aceticacid_P6=x_acids_sep*m_aceticacid_recovery_P4; % tonnes/h m_succinicacid_P6=x_acids_sep*m_succinicacid_recovery_P4; % tonnes/h m_propionicacid_P6=x_acids_sep*m_propionicacid_P3; % tonnes/h m_aceticacid_P7=m_aceticacid_P3P4-m_aceticacid_P6; % tonnes/h m_succinicacid_P7=m_succinicacid_P3P4-m_succinicacid_P6; % tonnes/h m_propionicacid_P7=m_propionicacid_P3-m_propionicacid_P6; % tonnes/h m_glycerol_P6P7=0; % tonnes/h m_propanol_P6P7=0; % tonnes/h m_water_P6=0; % tonnes/h m_water_P7=m_water_P3; % tonnes/h

XIX
% Mass Flows Biofuel-Solution Process disp('Mass Flows (tonnes/h): Glycerol, Propanol, Acetic Acid, Propionic Acid, Succinic Acid, Water') m_biofuelsol_G3=[m_glycerol_G3 m_propanol_G3P3P4 m_aceticacid_G3P1 m_propionicacid_G3P1P4 m_succinicacid_G3P1 m_water_G3] % tonnes/h m_biofuelsol_P1=[m_glycerol_P1P3P4 m_propanol_P1 m_aceticacid_G3P1 m_propionicacid_G3P1P4 m_succinicacid_G3P1 m_water_P1] % tonnes/h m_biofuelsol_P3=[m_glycerol_P1P3P4 m_propanol_G3P3P4 m_aceticacid_P3P4 m_propionicacid_P3 m_succinicacid_P3P4 m_water_P3] % tonnes/h m_biofuelsol_P4=[m_glycerol_recovery_P4 m_propanol_G3P3P4 m_aceticacid_P3P4 m_propionicacid_G3P1P4 m_succinicacid_P3P4 m_water_P4] % tonnes/h m_biofuelsol_P6=[m_glycerol_P6P7 m_propanol_P6P7 m_aceticacid_P6 m_propionicacid_P6 m_succinicacid_P6 m_water_P6] % tonnes/h m_biofuelsol_P7=[m_glycerol_P6P7 m_propanol_P6P7 m_aceticacid_P7 m_propionicacid_P7 m_succinicacid_P7 m_water_P7] % tonnes/h % sum_acidsep_in=sum(m_biofuelsol_P3) % sum_acidsep_out=sum(m_biofuelsol_P6)+sum(m_biofuelsol_P7) disp(' ') disp('Mass Flows (tonnes/h): Hydrogen P2, P5') m_hydrogen_biofuelsol=[m_hydrogen_P2 m_hydrogen_P5] % tonnes/h % Volumetric Flows Biofuel-Solution Process rho_biofuelsol=[rho_glycerol_25 rho_propanol_25 rho_aceticacid_20 rho_propionicacid_25 rho_succinicacid_25 rho_water_25]; % tonnes/m^3 V_biofuelsol_G3=m_biofuelsol_G3./rho_biofuelsol; % m^3/h V_biofuelsol_P1=m_biofuelsol_P1./rho_biofuelsol; % m^3/h V_biofuelsol_P3=m_biofuelsol_P3./rho_biofuelsol; % m^3/h V_biofuelsol_P4=m_biofuelsol_P4./rho_biofuelsol; % m^3/h V_biofuelsol_P6=m_biofuelsol_P6./rho_biofuelsol; % m^3/h V_biofuelsol_P7=m_biofuelsol_P7./rho_biofuelsol; % m^3/h V_biofuel_hydrogen=m_hydrogen_biofuelsol./rho_hydrogen_180_10bar; % m^3/h disp(' ') % Ion Exchange Chromatography x_wt_aceticacid_P3P4=m_aceticacid_P3P4/sum(m_biofuelsol_P3) x_wt_propionicacid_P3=m_propionicacid_P3/sum(m_biofuelsol_P3) x_wt_succinicacid_P3P4=m_succinicacid_P3P4/sum(m_biofuelsol_P3) disp(' ') disp('Volumetric Flows (m^3/h): G3, P1, P2, P3, P4, P5, P6, P7') V_G3_P1_P2_P3_P4_P5_P6_P7=[sum(V_biofuelsol_G3) sum(V_biofuelsol_P1) V_biofuel_hydrogen(1) sum(V_biofuelsol_P3) sum(V_biofuelsol_P4) V_biofuel_hydrogen(2) sum(V_biofuelsol_P6) sum(V_biofuelsol_P7)] % m^3/h % Total Mass Flows Biofuel-Solution Process % sumbiofuelsolin=sum(m_biofuelsol_G3)+m_hydrogen_P2+sum(m_biofuelsol_P4) % sumbiofuelsolout=sum(m_biofuelsol_P1)+sum(m_biofuelsol_P3)

XX
disp(' ') disp('***') disp(' ') %% Anaerobic digestion disp('Anaerobic Digestion') disp(' ') conv_biogas=0.8; x_wt_N_protein=6.25; f_pH7=0.01; f_pH8=0.1; yield_methane_proteins=496; % Nm^3/tonne yield_methane_carb=415; % Nm^3/tonne p_NTP=1e5; % Pa p_anaerobdigest=101325; % Pa T_NTP=273.15; % K T_anaerobdigest=38; % K m_NH4_required_daily=60.6; % tonnes/day Hi_methane=35.33; % MJ/Nm^3 m_carb_anaerobicdigest=m_carb_R2+m_carb_R3+m_carb_R4+m_aceticacid_P7+m_succinicacid_P7+m_propionicacid_P7; % tonnes/h x_wt_proteins_carb=m_proteins_E3E8E9/m_carb_anaerobicdigest disp(' ') % Consumption of Organic Material m_water_in_anaerobdigest=m_water_sep_rect_E10+m_water_R2+m_water_R3+m_water_sugar_recovery_R4+m_water_P7; % tonnes/h m_carb_D5=(1-conv_biogas)*m_carb_anaerobicdigest; % tonnes/h m_proteins_D5=(1-conv_biogas)*m_proteins_E3E8E9; % tonnes/h m_digest_D5=m_water_in_anaerobdigest+m_carb_D5+m_proteins_D5; % tonnes/h V_digest_D5=m_water_in_anaerobdigest/rho_water_38+(m_carb_D5+m_proteins_D5)/rho_cellulose_starch_glucose; % m^3/h % Methane Production V_methane_anaerobdigest_NTP=conv_biogas*(m_proteins_E3E8E9*yield_methane_proteins+m_carb_anaerobicdigest*yield_methane_carb); % Nm^3/h n_methane_anaerobdigest_D4=V_methane_anaerobdigest_NTP*p_NTP/(R*T_NTP); % kmoles/h m_methane_anaerobdigest_D4=M_CH4*n_methane_anaerobdigest_D4; % tonnes/h V_methane_anaerobdigest_D4=V_methane_anaerobdigest_NTP*(T_anaerobdigest+T_K)/T_NTP*p_NTP/p_anaerobdigest; % m^3/h % Carbon Dioxide Production m_biogas_D4=m_proteins_E3E8E9+m_carb_anaerobicdigest+m_water_in_anaerobdigest-m_digest_D5; % tonnes/h m_CO2_anaerobdigest_D4=m_biogas_D4-m_methane_anaerobdigest_D4; % tonnes/h

XXI
V_CO2_anaerobdigest_D4=m_CO2_anaerobdigest_D4*R*(T_anaerobdigest+T_K)/(p_anaerobdigest*M_CO2); % m^3/h x_vol_methane_biogas=V_methane_anaerobdigest_D4/(V_methane_anaerobdigest_D4+V_CO2_anaerobdigest_D4) % Risk of Nitrogen Poisoning m_N=m_proteins_E3E8E9*conv_biogas/x_wt_N_protein; % tonnes/h c_wt_N_E9=m_N/V_digest_D5*1e6; % mg/l c_wt_NH3_pH7=c_wt_N_E9*f_pH7 % mg/l c_wt_NH3_pH8=c_wt_N_E9*f_pH8 % mg/l disp(' ') if c_wt_NH3_pH7<1000 && c_wt_NH3_pH8<1000 disp('No nitrogen poisoning') else disp('Risk of nitrogen poisoning!') return end disp(' ') % Use of Digest as Nutrients for the Algae m_N_digest=c_wt_N_E9*V_digest_D5/1e6; % tonnes/h m_NH4_digest_D5=M_NH4/M_N*m_N_digest; % tonnes/h m_NH4_digest_daily=m_NH4_digest_D5*24 % tonnes/day x_NH4_digest_daily=m_NH4_digest_daily/m_NH4_required_daily disp(' ') if x_NH4_digest_daily>=0.2 disp('Profitable to use the digest as nutrients for the algae') else disp('Not profitable to use the digest as nutrients for the algae') end disp(' ') % Energy Production from Biogas Combustion disp('Energy Produced by Methane Combustion (MW)') E_methane=V_methane_anaerobdigest_NTP*Hi_methane/3600 % MW disp(' ') % Mass Flows Anaerobic Digestion disp('Mass Flows (tonnes/h): Water, Proteins, Carbohydrates') m_anaerobdigest_D1D2D3=[m_water_in_anaerobdigest m_proteins_E3E8E9 m_carb_anaerobicdigest]./3 % tonnes/h m_anaerobdigest_D5=[m_water_in_anaerobdigest m_proteins_D5 m_carb_D5] % tonnes/h disp(' ')

XXII
disp('Mass Flows (tonnes/h): Methane, Carbon Dioxide') m_anaerobdigest_D4=[m_methane_anaerobdigest_D4 m_CO2_anaerobdigest_D4] % tonnes/h disp(' ') % Volumetric Flows Anaerobic Digestion disp('Volumetric Flows (m^3/h): D1, D2, D3, D4, D5') rho_water_proteins_carbs=[rho_water_38 rho_cellulose_starch_glucose rho_cellulose_starch_glucose]; % tonnes/m^3 V_anaerobdigest_D1D2D3=sum(m_anaerobdigest_D1D2D3./rho_water_proteins_carbs); % m^3/h V_anaerobdigest_D4=V_methane_anaerobdigest_D4+V_CO2_anaerobdigest_D4; % m^3/h V_anaerobdigest_D5=V_digest_D5; % m^3/h V_anaerobdigest_D1_D2_D3_D4_D5=[V_anaerobdigest_D1D2D3 V_anaerobdigest_D1D2D3 V_anaerobdigest_D1D2D3 V_anaerobdigest_D4 V_anaerobdigest_D5] % m^3/h % sum_anaerobdigest_in=3*sum(m_anaerobdigest_D1D2D3) % sum_anaerobdigest_out=sum(m_anaerobdigest_D4)+sum(m_anaerobdigest_D5) % % sum_stillagetank_in=sum(m_dist_E10)+sum(m_recovery_R2)+sum(m_recovery_R3)+sum(m_recovery_R4)+sum(m_biofuelsol_P7) disp(' ') disp('***') disp(' ') %% Annual Production and Consumption disp('Reactants and Products (ktonnes/year)') m_algae_prod_year=m_algae_sep_A2*operating_time_year/1e3 % ktonnes/year m_algaloil_prod_year=m_triglyceride_B1*operating_time_year/1e3 % ktonnes/year m_biodiesel_year=m_biodiesel_B7B8B9*operating_time_year/1e3 % ktonnes/year m_glycerol_prod_year=(m_glycerol_G3+m_glycerol)*operating_time_year/1e3 % ktonnes/year m_hydrogen_cons_year=m_hydrogen_P2*operating_time_year/1e3 % ktonnes/h m_976_wtpercent_propanol_year=(m_propanol_P1+m_water_P1)*operating_time_year/1e3 % kton-nes/year m_algalflour_prod_year=m_algalflour_A3E1*operating_time_year/1e3 % ktonnes/year m_anhydrous_ethanol_prod_year=m_anhyd_ethanol_E17*operating_time_year/1e3 % ktonnes/year m_anhydrous_ethanol_sale_year=m_anhyd_ethanol_E21*operating_time_year/1e3 % ktonnes/year m_96_volpercent_ethanol_prod_year=(m_aze_water_E16+m_aze_ethanol_E16)*operating_time_year/1e3 % ktonnes/year m_57_volpercent_biogas_year=m_biogas_D4*operating_time_year/1e3 % ktonnes/year disp(' ') disp('Production of Fermentation By-Products and Propionic Acid(tonnes/year)') m_butanediol_year=m_butanediol*operating_time_year % tonnes/year m_aceticacid_year=m_aceticacid_P6*operating_time_year % tonnes/year m_propionicacid_year=m_propionicacid_P6*operating_time_year % tonnes/year m_succinicacid_year=m_succinicacid_P6*operating_time_year % tonnes/year % disp(' ')

XXIII
% % disp('Potential Production of Fermentation By-Products and Propionic Acid (tonnes/year)') % m_butanediol_year=m_butanediol*operating_time_year % tonnes/year % m_aceticacid_year=m_aceticacid_P6*operating_time_year % tonnes/year % m_succinicacid_year=m_succinicacid_P6*operating_time_year % tonnes/year % m_propionicacid_year=m_propionicacid_P6*operating_time_year % tonnes/year end


