Embed Size (px)
Citation preview

A-F Informatio
n Night

Welcome
IntroductionsPurposeOutline of tonightQ & A session at the end

3
Reading Data[All Students]

4
Skill 09-10 10-11 11-12 Growth
Vocabulary 75 75 92 +17
Affixes n/a 80 100 +20
Ant. Hom. Synonyms n/a 75 100 +25
Comp & Crit. Literacy
67 80 84 +17
Infer. & Interpretation 71 67 80 +13
Sum. & Generalization 67 67 80 +13
Analysis & Evaluation 67 86 80 +13
Literary Elements n/a 60 75 +15
Research 67 67 86 +19
Alumni Areas of 10% Reading Growth

Skill 10-11 11-12 Growth
Sum. & Generalizaton 60 86 +26
Literary Elements 50 80 +30
Research & Information
42 83 +41
Access & Information 42 83 +41
Current Areas of 10% Reading Growth

6
Math Test Data[All Students]

7
Skill 09-10 10-11 11-12 Growth
Estimation 75 90 88 +13
Measurement 75 80 100 +25
Alumni Areas of 10% Math Growth
Current Areas of 10% Math GrowthSkill 10-11 11-12 Growth
Geometry 71 89 +18
Data Analysis 71 86 +15
Data Analysis 75 100 +25
8
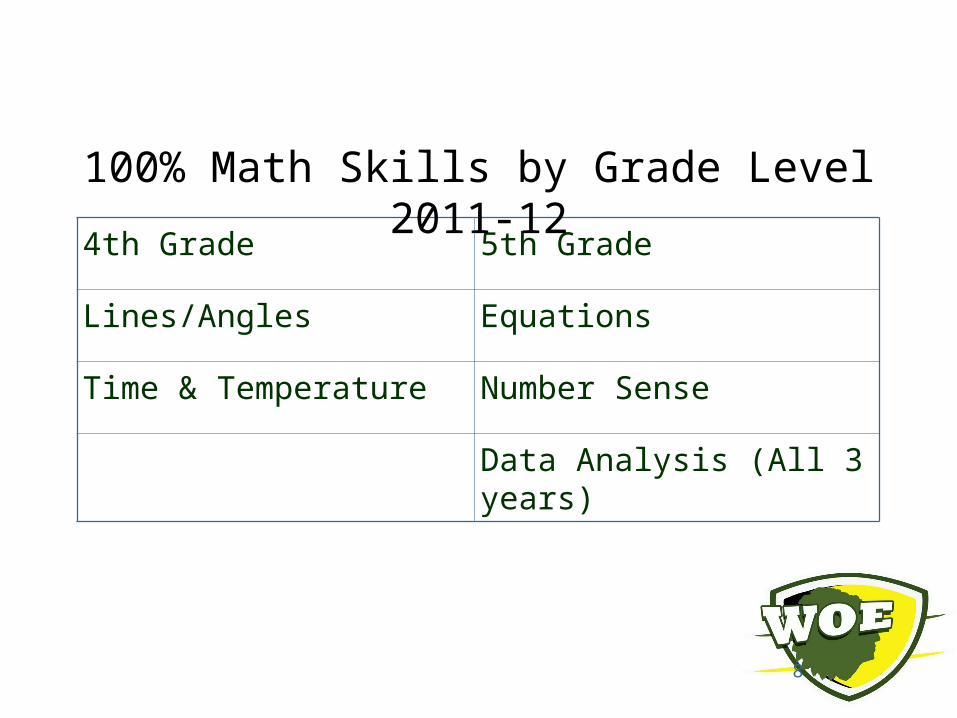
4th Grade 5th Grade
Lines/Angles Equations
Time & Temperature Number Sense
Data Analysis (All 3 years)
100% Math Skills by Grade Level 2011-12

Narrowing the GapAlignment of Skills
Identify areas of weakness
Common language
Appropriate accommodations
Make personal connections
Phonics
Letter recognition
Recognizing sounds with ELL
Writing sounds
Repetition
Listening to language songs
Reading & Writing strategies

Student Info - Strategies
Build relationships
Flex groups
Immediate feedback
Differentiated instruction
Goal setting
Collaboration
Writing to explain
Home & school connection
Key vocabulary
Running Records

11
Based on your data, describe the strategies you are having success with in your school.
Leveled Literacy InterventionsTitle pulloutTutoringMath Fact foldersReading achievement recognition
What are your next steps for this school year?•Data from weekly common assessments•Data driven small group instruction•Tracking student progress•Working on established goals•Expanding LLI program to include higher levels
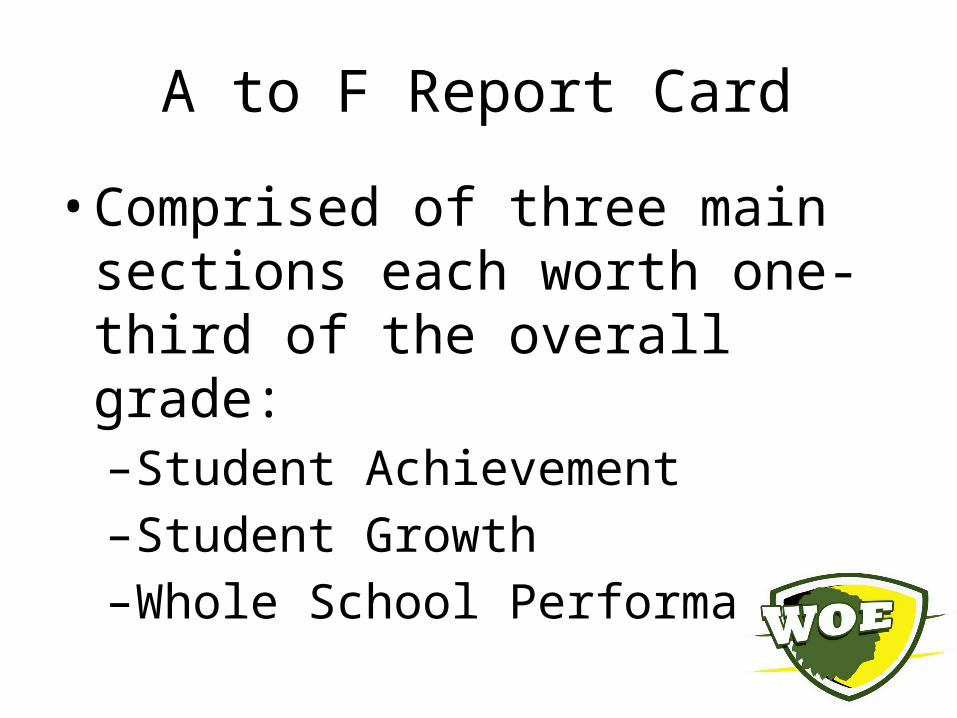
A to F Report Card
• Comprised of three main sections each worth one-third of the overall grade: –Student Achievement –Student Growth –Whole School Performance

Student Achievement Section • Includes all Oklahoma State Testing Program
(OSTP) exams administered during the most recent school year– Oklahoma Core Curriculum Tests (OCCT) – Oklahoma Modified Alternative Assessment
Program (OMAAP) – Oklahoma Alternative Assessment Program
(OAAP).
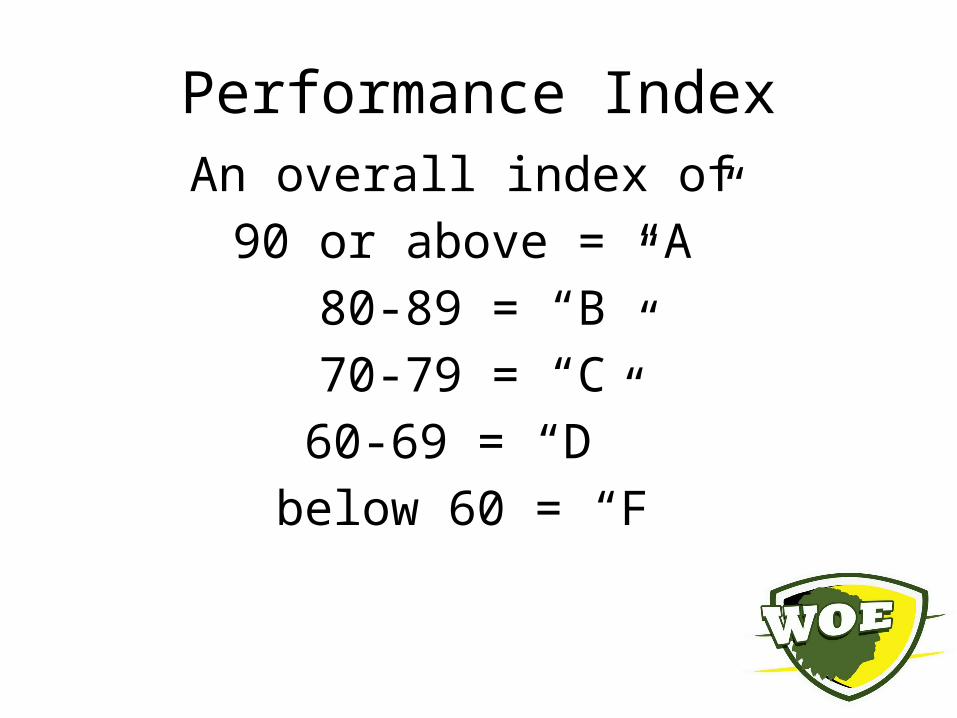
Performance IndexAn overall index of 90 or above = “A”
80-89 = “B”70-79 = “C”60-69 = “D”
below 60 = “F

15
Student Achievement Section Shows Performance in All Content Areas
Reading 3rd - 5th B
Math 3rd - 5th A
Science 5th grade only A
Social Studies 5th grade only C
Writing 5th grade only C
Overall 3rd - 5th B

16
Student Growth Section
• Growth is divided into two sub-categories; • All students in a school worth seventeen
percent (17%) of the final grade • Bottom twenty-five percent of students in a
school worth seventeen percent (17%) of the final grade
• OSTP Reading and Math exams only (Grades 3-8 OCCT Reading and Mathematics).

17
Student Growth Calculation
Number of Points Awarded Based on Change of Proficiency Level
Previous Proficiency Level
Current Proficiency Level
Increase OPI > State Avg.
Unsatisfactory Limited Knowledge
Proficient Advanced
Unsatisfactory 1 0 1 2 3
Limited Knowledge
1 0 0 1 2
Proficient 0 0 0 1 1
Advanced 0 0 0 1 1

18
Western Oaks Elementary
Reading B Reading A
Math A Math A
Overall
A Overall
A
Student Growth Bottom 25%

Whole School Performance Section • Student attendance rate, • Parent/community volunteer hours• Attendance will carry 100% of the base grade for Whole School
Improvement.• Elementary sites can earn bonus points for Climate Survey
results and Parent/Community volunteers.• If a school does not test 95% of eligible students enrolled, the
school’s overall letter grade will be reduced by one whole letter grade. – For example, a school gets an “A” in every area but only
tested 94% of the students, the overall letter grade of “A” will be reduced to a “B”.

20
Attendance StrategiesSecretary tracking absences & early release
District attendance policy passed out at Parent Orientation
Letters sent
Phone calls made by
Teachers, Counselor, & Administrators
Classroom Goals
Administrator calls on students absent for Reading & Math Title services
Encourage parents to observe learning times for other engagements

Attendance2009 - 2010 2010 - 2011 2011 - 2012
95% 93.8% 94.6%

22
Section Weights in Final Grade(GPA calculation)
Section WeightStudent Achievement
33%
Overall Student Growth
17%
Bottom 25% Growth 17%Whole School Performance
33%
23
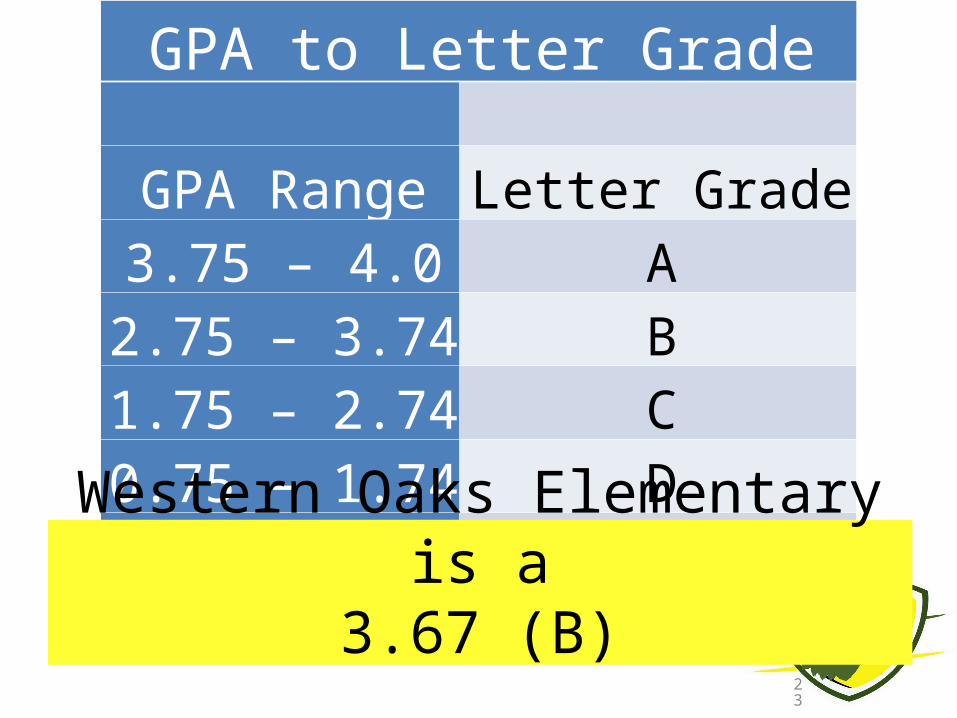
GPA to Letter Grade
GPA Range Letter Grade3.75 – 4.0 A
2.75 – 3.74 B1.75 – 2.74 C0.75 – 1.74 D
0 - .74 FWestern Oaks Elementary is a3.67 (B)

24
A Message From The Former Principal

QuickTime™ and a decompressor
are needed to see this picture.
25

Q & AThank you for coming and being a “PIECE”
of our success!