Embed Size (px)
Citation preview

A Dynamic Market Mechanism for Integration of Renewables and Demand
ResponseAnuradha Annaswamy
1
Panel on Market-based Approaches for Demand Response IEEE Power and Energy Society General Meeting 2015
Denver, CO07/28/2015

Outline• Demand Response (DR) – Importance, potential,
and current practice
• An emerging taxonomy based on the constraints of DR-devices– Buckets, Batteries, Bakeries
• DR real-time market integration – role in a Dynamic Market Mechanism
• Case study (IEEE-118 bus, Polish grid)

Outline• Demand Response (DR) – Importance, potential,
and current practice
• An emerging taxonomy based on the constraints of DR-devices– Buckets, Batteries, Bakeries
• DR real-time market integration – role in a Dynamic Market Mechanism
• Case study (IEEE-118 bus, Polish grid)

Importance of Demand Response
Generation = Demand
⇒ 𝐺𝐺 + 𝐷𝐷 = 0
𝐺𝐺 + 𝐺𝐺𝑟𝑟 + 𝐷𝐷 + 𝐷𝐷𝑑𝑑 = 0
Renewables DemandResponse
Usual practice:
Practice with renewables:
Source: “Vision for Smart Grid Control: 2030 and Beyond,” (Eds. M. Amin, A.M. Annaswamy, C. DeMarco, and T. Samad), IEEE Standards Publication, June 2013.

Importance of Demand Response• Demand response refers to changes in electric usage by
demand-side resources from their normal consumption patterns in response to:– Changes in the price of electricity over time, or– Incentive payments designed to induce lower electricity use at times
of high wholesale market prices or when system reliability is jeopardized
• Demand response benefits:– Peak reduction– Lower electricity prices at
the wholesale market– Higher system reliability– Reduced need for reserves
Figure: EIA

DR Program Types and Potentials
Incentive-based Time-based
Source: Federal Energy Regulatory Commission. “2012 Assessment of Demand Response and Advanced Metering”. Staff Report, 2012.

DR in Today’s Wholesale Markets*• ISO-NE:
– On call response if needed settled through Forward Capacity Market (FCM)– Not allowed to bid in Day-Ahead Market (DAM) or Real-Time Market (RTM)
• PJM:– Allowed to bid in DAM and Regulation Market (REGM), not allowed in RTM
• NY-ISO:– On call response if needed settled
through FCM– Allowed to bid in FRM, DAM, REGM,
not allowed in RTM
• CAISO:– Allowed to bid in FRM, DAM, REGM
* Currently in a state of flux due to halt of FERC order 745
Figure source: Monitoring Analytics, “State of the Market Report for PJM”, August 2014

Wholesale Markets and the Role of DR
power dispatch (MW) and price ($)
ISO
ensure grid feasibilitycompute optimal
price
Cost curves ($/MW)
Market Players
GenCosminimize
cost
ConCos
price ($)
Forward Capacity Markets
Forward Reserve Markets
Day Ahead
Markets
Real Time
Markets
ISO-NE
NY-ISO
Regulation Markets
PJM PJM
NY-ISO
CAISO CAISO

Limitations of Today’s Implementations• In RTM: Consumers are price-takers, not price-setters• ISOs are not relying on response of demand to real-time prices
• Much needed are mechanisms to ensure response to real-time price signals

Outline
• Demand Response (DR) – Importance, potential, and current practice
• A taxonomy of DR-devices– Buckets, Batteries, Bakeries
• DR real-time market integration – role in a Dynamic Market Mechanism
• Case study (IEEE-118 bus, Polish grid)

• Residential level– Single household– Aggregated level
Demand Response: Type of Consumers• Industrial
– Food industry – refrigeration 16%
– Chemical sector – metal and paper
– Data centers – 1.3% of total energy
37%
34%
26%
3%
ResidentialCommercialIndustrialPHEVs
• Demand characterization
• Commercial
Source: EIA

Demand Response Models
Consumer Decision Making
Adjustable Demand
Value function 𝑣𝑣(𝜆𝜆, 𝜇𝜇,𝜃𝜃):• Economic component 𝜆𝜆• Comfort component 𝜇𝜇• Environment component 𝜃𝜃
Device Constraints
Risk aversion
Value function
Device characteristics:• Curtailable → Bucket
• Interruptible → Battery
• Deferrable → Bakery
𝑣𝑣
𝑟𝑟(𝑣𝑣)
𝑟𝑟(𝑣𝑣)𝑣𝑣(λ, 𝜇𝜇,𝜃𝜃)
High
Low

Dynamic Characteristics of Loads• Defer in inherent magnitude, run-time and integral constraints
Water heater
HVAC
WasherEV battery
Chemical processRefrigerator
Swimming pool filtering
Home battery system
Battery
BakeryBucket

• Most flexible type of demand (can consume or supply power)
• Example: energy storage units, HVAC
• Have a deadline for achieving a fully charged state
• Example: Plug-in Hybrid Electric Vehicle
• Energy must be consumed in an uninterrupted stretch
• Example: industrial production cycles
Buckets PDc
Batteries PDt
Bakeries PDk
Source: M. K. Petersen, K. Edlund, L. H. Hansen, J. Bendtsen, and J. Stoustrup, “A Taxonomy for Modeling Flexibility and a Computationally Efficient Algorithm for Dispatch in Smart Grids,” 2013 American Control Conference, 2013.
A New Demand Response Taxonomy
The BBB Configuration

Outline• Demand Response (DR) – Importance, potential,
and current practice
• An emerging taxonomy based on the constraints of DR-devices– Buckets, Batteries, Bakeries
• DR real-time market integration – role in a Dynamic Market Mechanism
• Case study (IEEE-118 bus, Polish grid)

Our Approach• A Dynamic Market Mechanism (DMM) for RTM –
consumers are price-setters, not price-takers
• The DMM is an alternative to the current wholesale electricity market clearing process.
• Rather than submitting one-time bids, generators and consumers repeatedly exchange information with each other and with the ISO to negotiate generation, consumption, and prices.
• Allows direction integration of DR (ex. BBB) into the DMM

Nodal Power Balance
Line Capacity
Generation/Demand Power Limits
Generation Rates of ChangeDemand Energy Limits
Note:The index k corresponds with the market clearing instance
Source: J. Knudsen, J. Hansen, and A.M. Annaswamy “A Scaleable Dynamic Market Mechanism for Integration of Renewables and Demand-Side Management,” IEEE Trans. Control Systems Technology ( b itt d) 2014
OPF Formulation (including BBB)
The index K corresponds with the negotiation iterations

DMM structure• Iterative negotiations over a wide area grid
1k k kx x x+ = + ∆1k k kλ λ λ+ = + ∆
𝑥𝑥: states of players and ISO𝜆𝜆: Lagrange multiplier (LMP)
𝑥𝑥𝑘𝑘 =
𝑃𝑃𝐺𝐺𝐺𝐺𝑘𝑘
𝑃𝑃𝐺𝐺𝑟𝑟𝑘𝑘
𝑃𝑃𝐷𝐷𝑟𝑟𝑘𝑘
𝛿𝛿𝑘𝑘
Conventional generation
Renewable generation
Demand response
Voltage angles
ISO
ensure grid feasibilitycompute optimal
price
Suggested bids (MW)
Market Players
GenCosminimize
cost
ConCosmaximize
utility
Suggested price ($)
power dispatch (MW) and price ($)
ISO
ensure grid feasibilitycompute optimal
price
Cost curves ($/MW)
Market Players
GenCosminimize
cost
ConCos
price ($)
• Challenges addressed:– Computation time– Most information must be kept private– Stability

Economic Dispatch Today
20
Periodic with a regular interval.Single iteration process.Centralized computation.
Economic dispatch interval Time
Inflexible load
Generationset-points
Automaticgenerationcontrol
Collect cost curves Find optimal dispatch Communicate set-points
ISO
Flexibledemand
Generation

Our Solution: Dynamic Market Mechanism (DMM)21
Economic dispatch interval Time
Generationset-points
Most recent information is included. Individual constraints remain private.
Benefits when addressing:o Fuel uncertainty
• Wind• Solar• Natural gas
o Change in operating conditionsof components
• Saturation limits• Protection tripping• Emergency conditions
o Dynamic price response• Lower real-time prices
before dispatching• Close-loop price control
Inflexible load
Start negotiations
Negotiate and converge to an optimal solution
Implement set-points
Automaticgenerationcontrol
Sufficiently long period for
convergence

DMM and shorter dispatch interval
22
Implement dispatch on shorter intervals.
Opportunities for addressing:o Significant and unpredicted
penetration of renewableso Non-zero mean volatility of
renewable generationo High regulation requirements
in presence of renewables
Time
Generationset-points
Economic dispatch interval
Automaticgenerationcontrol
Inflexible load
Start negotiations
Negotiate and converge to an optimal solution
Implement set-pointsSufficiently long
period for convergence

Integrated DMM (economic dispatch + AGC)
23
Energy Market
Regulation Market
AutomaticGenerationControl
Assumption of magnitude and time-scale separation between OPF and AGC.
Large penetration of intermittent energy represents a challenge.
Conventional architecture
Energy Market
Regulation Market
AutomaticGenerationControl
Aggregated feedback from AGC
Simultaneous decisions at both markets.
Proposed approach

4
Time-scales Introduced by DMM
24
DMM Negotiation
s
AGCUpdates
DMM Market
Clearing
OPF Market Clearing
Existing time-scales
New time-scales

Feedback from AGC to DMM
25
• Frequency measurements averaged over 𝑡𝑡𝑚𝑚−2, 𝑡𝑡𝑚𝑚−1 are used in negotiations during 𝑡𝑡𝑚𝑚−1, 𝑡𝑡𝑚𝑚 , which take effect during the operating period 𝑡𝑡𝑚𝑚, 𝑡𝑡𝑚𝑚+1 .
Negotiations OperationMeasurements
𝑡𝑡𝑚𝑚−1𝑡𝑡𝑚𝑚−2 𝑡𝑡𝑚𝑚 𝑡𝑡𝑚𝑚+1

DMM Iterates Final FormApproximated Hessian• Increases rate of convergence• Preserves privacy
Distributed gradient updates• A single cost/utility bid per iteration• Preserves privacy
State and price update equations
𝑥𝑥𝑘𝑘+1 = 𝑥𝑥𝑘𝑘 − 𝛼𝛼 � ��𝐻𝐻−1 � 𝛻𝛻𝛻𝛻 𝑥𝑥𝑘𝑘 + 𝑁𝑁�̂�𝜆𝑘𝑘+1
𝜆𝜆𝑘𝑘+1 = �̂�𝜆𝑘𝑘+1 − 𝛼𝛼 � 𝑐𝑐 � ℎ′ 𝑥𝑥𝑘𝑘
Modified power balance• Integrates real-time market and AGC

Outline• Demand Response (DR) – Importance, potential,
and current practice
• An emerging taxonomy based on the constraints of DR-devices– Buckets, Batteries, Bakeries
• DR real-time market integration – role in a Dynamic Market Mechanism
• Case study (IEEE-118 bus, Polish grid)

Modified IEEE 118 Bus Test CaseBus consists of:• 45 conventional generators• 9 renewable generators (30% penetration)• 7 consumers (10% penetration)• 186 transmission lines

Implications of Our Architecture
TRANSACTIVE ARCHITECTURE
Conven Gen. RenewablesDemand Response Units
12. + + + + + +
. . . .
.
. . . .
.
. . . .
.
1. + + + + + +
2. + + + + + +
0 500 1000 15001400
1600
1800
2000
2200
2400
2600
Time [s]
Gen
erat
ion
[MW
]
0 500 1000 1500
245250255260265270275
Flex
ible
Dem
and
[MW
]
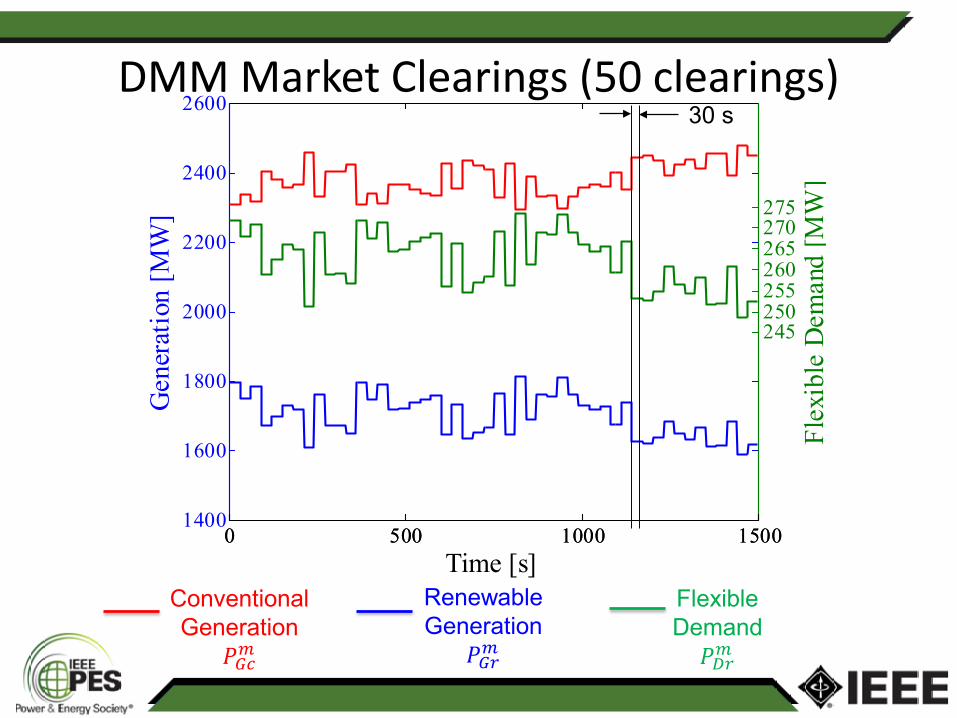
DMM Market Clearings (50 clearings)30 s
Conventional Generation
𝑃𝑃𝐺𝐺𝐺𝐺𝑚𝑚
Renewable Generation
𝑃𝑃𝐺𝐺𝑟𝑟𝑚𝑚
Flexible Demand𝑃𝑃𝐷𝐷𝑟𝑟𝑚𝑚

Negotiations over a single 30 second period
1110 1115 1120 1125 1130 1135 114022
24
26
28
30
32
34
36
Time [s]
Flex
ible
Con
sum
ptio
n [M
W]
1110 1115 1120 1125 1130 1135 11400
50
100
150
200
250
300
350
400
Time [s]Co
nven
tiona
l Gen
erat
ion
[MW
]
𝑥𝑥𝑘𝑘 =
𝑷𝑷𝑮𝑮𝑮𝑮𝒌𝒌
𝑃𝑃𝐺𝐺𝑟𝑟𝑘𝑘
𝑷𝑷𝑫𝑫𝒓𝒓𝒌𝒌
𝛿𝛿𝑘𝑘
Conventional generation
Renewable generation
Demand response
Voltage angles

Actual Generation and Demand (AGC time-scale)
0 500 1000 15001400
1600
1800
2000
2200
2400
2600
Time [s]
Gen
erat
ion
[MW
]
0 500 1000 1500
245250255260265270275
Flex
ible
Dem
and
[MW
]
Conventional Generation
𝑃𝑃𝐺𝐺𝐺𝐺𝐾𝐾
Renewable Generation
𝑃𝑃𝐺𝐺𝑟𝑟𝐾𝐾
Flexible Demand𝑃𝑃𝐷𝐷𝑟𝑟𝐾𝐾

Impact on Area Control Error
• Peaks less severe using DMM than OPF• Adding feedback shifts ACE closer to zero

Summary of DMM Benefits
1. Allows flexible consumers to act as price-setters at the real-time market (and not only to respond to price)
2. Admits the most recent weather predictions in market clearing (every 30 seconds)
3. Enables feedback from AGC layer into the market layer, reducing regulation requirements
4. Preserves privacy of market players’ sensitive information– e.g. cost curves, generation/consumption bounds
Is this scaleable?

Polish 3120 Bus Test System
Data source:Matpower
Figure source:www-pub.iaea.org
The system consists of:• 3120 buses • 3693 transmission lines with line
capacities of 250 MW• 505 generators with linear cost curves
and capacities in the range 10MW-150MW
• Extension to renewable energy resources and demand response is straight forward.

Single DMM Clearing on Polish 3120 System
30ms per iteration𝑡𝑡2 − 𝑡𝑡1=30 s
𝑡𝑡1 𝑡𝑡2
Transmission line flows Power generation
Locational marginal prices
Generation and price increase at bus 3010 once three transmission lines reach their limits.
Line 59congestion
Lines 31,32congestion

Number of iterations to convergenceMatpower test cases
Demonstrates the scalability of the DMM
The convergence time depends on:• Step size • Congestion• Cost curves
Number of iterations does not increase with decision variables

Key Open Questions
• Closer to real-time DR integration:– Reliability and security– Communication infrastructure vs. scalability– Direct load control vs. transactive load control– Sensitivity of customers to the price