Embed Size (px)
Citation preview

Iranian American Perceptions of Experienced Prejudice and
Discrimination in the Political and Social Context of the United States of America
A DISSERTATION SUBMITTED TO THE GRADUATE DIVISION OF THE
UNIVERSITY OF HAWAIʻI AT MĀNOA IN PARTIAL FULFILLMENT OF THE
REQUIREMENTS FOR THE DEGREE OF
DOCTOR OF PHILOSOPHY
IN
PSYCHOLOGY
MAY 2014
By
Shari Paige
Dissertation committee:
Elaine Hatfield, Chairperson
Ashley Maynard
Dan Landis
Scott Sinnett
Julie E. Stokes
David. A. Frederick
Richard L. Rapson
Keywords: Perception, Iranian, Prejudice, Discrimination

ii
COPYRIGHT
© Shari Paige, 2013, All Rights Reserved.

iii
ABSTRACT
The post 9/11 context created a political and social climate in the United States
(U.S.) that promoted prejudice and discrimination against anyone who looked Middle
Eastern (e.g., Iranian) or Muslim (Britto, 2008). I was interested in how much and what
kinds of prejudice and discrimination Iranian Americans with various religious
affiliations perceived. Iranian American perceptions were explored by examining their
Social Identity (Tajfel & Turner, 1979; Tanti, Stukas, Halloran, & Foddy, 2010). The
specific dimension of Iranian American social identity examined was religious affiliation
and how it related to perceived Ethnic Harassment (Schneider, Hitlan, & Radhakrishnan,
2000) and Social Distance (Bogardus, 1947; Rollock & Vrana, 2005) from Euro
Americans. Based on the current social and political context and social identity
differences between Iranian Americans and Euro Americans, I hypothesized that Iranian
American Muslims would report perceiving more experiences of prejudice and
discrimination (as assessed by measures of frequency and severity) than would Iranian
American Jews or those without religious affiliation. In addition, I hypothesized that
Iranian American Muslims, who appeared more prototypically Muslim, would report
perceiving a higher rate of prejudice and discrimination (as assessed by measures of
frequency and severity), than did Iranian American Muslims who appeared more
prototypically Western.
A survey was posted on Surveymonkey.com and participants were approached in
Persian grocery stores. A total of 374 Iranian Americans, ages 18 and older, filled out an
online or in-person survey packet that included the following: a consent form, an
adaptation of the Ethnic Harassment Experiences Scale (EHES) (Schneider, Hitlan, &

iv
Radhakrishnan, 2000), an adaptation of the Social Distance Scale (Bogardus, 1959), a
brief religiosity scale (Allport & Ross, 1967), and a demographic questionnaire. I
discovered that Iranian American Jewish and Muslim participants reported perceiving
significantly higher rates of ethnic harassment and social distance from Euro Americans
than did Iranian Americans with no religious affiliation.

v
Table of Contents
Copyright Page……………………………………………………………………………ii
Abstract…………………………………………………………………………………...iii
Overview…………………………………………………………………………………..1
Intersection of Ethnicity and Religion…………………………………………….2
General Questions………………………………………………………………....3
Outline……………………………………………………………………………..4
Chapter 1. The Effects of Negative Characterizations of Iranian Americans……….…….6
Past and Present
The Axis of Evil Metaphor and the Mirror Image Effect………………………....6
The Negative Perception of Iranian Americans, Past and Present………………...8
Stereotypes about Middle Easterners and Iranian Americans…………………...10
The Recent Spike in Prejudice and Discrimination Toward Anyone that……....12
Appears Middle Eastern or Muslim
The Diverse Identities of Iranian Americans in U.S. Immigration Patterns…….16
The Current Demographic Characteristics of Iranian Americans……………….17
Recent Research on Iranian Americans and the Current Study………………....19
Chapter 2. Theoretical Frameworks………..…………………………………………….21
Social Identity Theory…………………………………………………………...21
In-group Cognitive Processing…………………………………………..21
Out-group Formations…………………………………………………...23
Social Identity and Iranian Americans…………………………………………..26
Social Distance Theory…………………………………………………………..27
Social Nearness…………………………………………………………..27
Patterns of Social Distance………………………………………………………31
Middle Easterners in the U.S…………………………………………………….34
Hypotheses and Research Questions…………………………………………….34
Hypotheses……………………………………………………………….34
Specific Research Questions……………………………………………..35
Chapter 3. Southern California Context………………………………………………….37
Method. Demographics of the Sample: Frequencies and Descriptive…………...39
Statistics
Gender……………………………………………………………………39
Age……………………………………………………………………….39
Religious Affiliation……………………………………………………..39
Level of Education……………………………………………………….40
Annual Income during Childhood……………………………………….40
Predictors………………………………………………………………………...40
Ethnic Identity…………………………………………………………...40
Iranian Subgroup Part A…………………………………………………41
Iranian Subgroup Part B…………………………………………………41
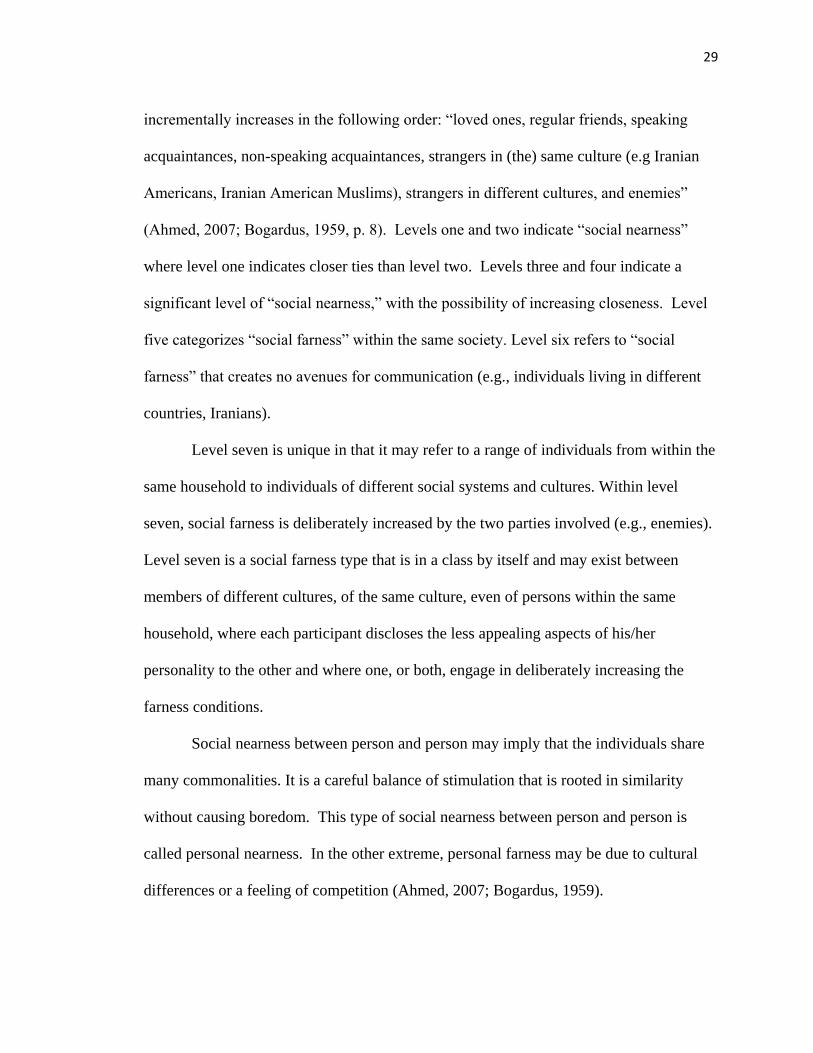
Skin Tone……………...…………………………...…………………….41
Skin Lightening………………………………………………………….42
Willingness to Lighten Skin……………………………………………..42
Accent……………………………………………………………………43

vi
Immigration Status……………………………………………………….43
Generational Status………………………………………………………43
Symbols of Religious Affiliation………………………………………...43
Symbols of Religious Affiliation. Open Format…………………………44
What Religious Symbols…………………………………………………44
Ethnically Traditional Clothing………………………………………….45
Ethnically Traditional Clothing. Free Response…………………………45
What Ethnically Traditional Clothing. Free Response…………………..45
Occupation……………………………………………………………….46
Father’s Occupation……………………………………………………...46
Mother’s Occupation…………………………………………………….46
Geographic Location…………………………………………………….46
Participants: Recruitment………………………………………………………..46
Online/In-Person Survey: Procedure…………………………………………….49
Online/In-Person Survey: Apparatus/Materials………………………………….50
The Ethnic Harassment Experiences Scale………………………………51
The Social Distance Scale………………………………………………..52
The Brief Religiosity Scale………………………………………………54
Chapter 4. Results……..…………………………………………………………………55
Chapter 5. Discussion…….……………………………………………………………...73
Summary of Key Findings……………………………………………………….73
Limitations and Strengths………………………………………………………..77
Implications and Concluding Comments………………………………………...80
Appendix A………………………………………………………………………………83
Appendix B………………………………………………………………………………85
Appendix C………………………………………………………………………………94
Appendix D………………………………………………………………………………95
Appendix E………………………………………………………………………………98
Appendix F……………………………………………………………………………....99
Appendix G……………………………………………………………………………..106
Appendix H……………………………………………………………………………..108
Appendix I……………………………………………………………………………...111
Appendix J……………………………………………………………………………...112
Appendix K……………………………………………………………………………..113
Appendix L……………………………………………………………………………..114
Appendix M…………………………………………………………………………….115
Appendix N……………………………………………………………………………..116
Appendix O……………………………………………………………………………..117
Appendix P……………………………………………………………………………...118
Appendix Q……………………………………………………………………………..119
Appendix R……………………………………………………………………………..120
References………………………………………………………………………………121

vii
Tables
Table 1…………………………………………………………………………………...14
Table 2.…………………………………………………………………………………..29
Table 3…………………………………………………………………………………...52
Table 4…………………………………………………………………………………...54
Table I5. Appendix I……………………………………………………………………111
Table J6. Appendix J……………………………………………………………………112
Table K7. Appendix K………………………………………………………………….113
Table L8. Appendix L…………………………………………………………………..114

viii
Figures
Figure M1. Appendix M………………………………………………………………..115
Figure N2. Appendix N…………………………………………………………………116
Figure O3. Appendix O…………………………………………………………………117
Figure P4. Appendix P………………………………………………………………….118
Figure Q5. Appendix Q…………………………………………………………………119

1
Overview
The post 9/11 context created a political and social climate in the United States
(U.S.) that promoted prejudice and discrimination against anyone who looked Middle
Eastern (e.g., Iranian) or Muslim (Britto, 2008). Prejudice is defined as an “attitude” or a
judgment formed without sufficient information to warrant a negative conclusion (Katz,
1991). Discrimination may be defined as the behavioral action(s) based in prejudicial
thoughts or acted out to conform to societal expectations (Allport, 1959; Katz, 1991).
Researchers examined some of the negative consequences of appearing Middle
Eastern. Unkelbach, Forgas, and Denson (2008) asked if appearing Middle Eastern or
Muslim increased university students’ aggressive behavior. They tested a phenomenon
referred to as “the shooter bias effect”—which describes the way individuals utilize racial
and ethnic information when deciding whether or not to shoot during a simulated
shooting game. “The shooter bias effect” was tested on 66 university students (men,
women, conservative, and liberal). The researchers discovered that participants were
more likely to shoot at unarmed targets wearing symbols of Muslim/Middle Eastern
group membership such as, turbans (a cultural headgear worn by men) or hijabs (a
cultural headscarf worn by women) than targets without such markers.
Government agencies have tracked the number of reported hate crimes against
Middle Eastern Americans. Human Rights Watch (2002) investigated citizen likelihood
of experiencing prejudice and discrimination when wearing turbans or hijabs. They found
that Middle Easterners or Muslims who wore culturally symbolic headwear were more
likely to be victims of hate crimes. The Federal Bureau of Investigation (FBI) reported
that anti Middle Eastern/Muslim hate crimes increased seventeen-fold from the years

2
2000 to 2001 (as cited in HRW, 2002). Hate crimes against Middle Easterners/Muslims
declined from the peak of 2001, yet remain substantially above pre-2001 levels.
Consequently, as a result of suffering public disapproval, Middle Easterners or Muslims
in the U.S. may be at risk of experiencing alienation, isolation, depression, anxiety
(Britto, 2008; Clay, 2011), and post-traumatic stress disorder (Clay, 2011). Furthermore,
Middle Easterners may potentially experience hate crimes (HRW, 2002), racial profiling
(Siggins, 2002), negativity during job interviews (King & Ahmad, 2010), prejudice and
discrimination within academia (Omeish, 1999), and face personal identity issues
(Bradford, 2009; Zaman, 2010).
Intersection of Ethnicity and Religion
As demonstrated in the above section, much of past research has focused on either
ethnicity or religion. However, it was at the intersection of ethnicity (Iranian/ Middle
Eastern) and religion (Muslim), that a spike in prejudice and discrimination occurred
(HRW, 2002). Iranian American Muslims may have become vulnerable to prejudice and
discrimination due to both their ethnicity and religion. Thus, in this dissertation, the
differences between perceptions of prejudice and discrimination reported by Iranian
Americans of various religious affiliations and the extent to which a number of display
characteristics influenced the frequency and intensity of such perceived experiences is
explored.
The study of Iranian American perceptions of prejudice and discrimination is
important for a number of reasons. First, it may alert officials by demonstrating that
prejudice and discrimination against Iranian Americans in the U.S. exists. Second, it may
influence those involved in policy to create protocols that will protect Iranian Americans.

3
Third, it may lead to more effective ways of overcoming biases (Soares, 2004). Fourth,
with increased knowledge therapists may become better equipped to identify and respond
to the unique challenges Middle Eastern patients encounter (Boghosian, 2011). Fifth,
such knowledge may assist institutions in developing more effective outreach programs
that engage communities at risk (Middle Eastern Center, The University of Utah, 2009).
Sixth, it may assist physicians and hospitals in creating protocols that provide
opportunities for dialogue and response around potential precursors to physical and
psychological health challenges (Carteret, 2011). Seventh, information may help educate
emerging pupils and leaders about the potential of misdiagnosis, lack of treatment, and
mental breakdowns. Eighth, it may assist political and business leaders in becoming more
effective in conducting business with cultures and countries different from the dominant
group. Lastly, it may assist in helping businesses advance in a globalizing economy.
General Questions
1) Do Iranian American Muslims perceive experiencing more prejudice and
discrimination from Euro Americans than do their non-Muslim peers (be they
Jewish or possessing no religious affiliation)?
2) Do Iranian American Muslims who appear prototypically Muslim (skin tone
(color), Iranian accent, displays of religious affiliation, ethnically traditional
clothing, generational status, sub-ethnic identification (other than Iranian
American), or family income), report perceiving higher rates of prejudice and
discrimination from Euro Americans than do Iranian American Muslims whose
appearance is more prototypically Western (or non-Muslim)?

4
3) Does gender affect frequency and severity of perceived prejudice and
discrimination among Iranian Americans?
Outline
In Chapter One, a review of the current social and political depictions of Iranian
Americans is presented. In general, researchers describe a negative and homogenous
portrayal. I explore how this negative characterization developed and speculate about the
possible effects of such depictions. A review of past and current stereotypes of Iranian
Americans is also presented. Lastly, the chapter documents a recent increase in hate
crimes against people who possess a Muslim appearance or were assumed to be Muslim.
In Chapter Two, a review of psychological theories and concepts employed in
formulating my hypotheses is presented. A description of the relevance of Social Identity
Theory (Tajfel & Turner, 1979; Tanti, Stukas, Halloran, & Foddy, 2010) and Social
Distance Theory (Bogardus, 1947; Rollock, & Vrana, 2005) to the theoretical framework
is provided. More specifically, the ways in which the Iranian American social identity
affected their perceptions of social distance and prejudice from Euro Americans is
explored. Chapter Two concludes with proposed hypotheses and specific research
questions.
Chapter Three outlines the methods utilized. Descriptions of the Southern
California context, sample demographic characteristics (in terms of frequencies and
percentages), recruitment strategies, apparatus/materials, and procedure were reported.
The participants were recruited using snowball and purposive sampling (Daniel, 2012;
Perez, Nie, Arder, Radhu, & Ritro, 2011). The apparatus/materials included a consent
form, an adaptation of the Ethnic Harassment Experiences Scale (EHES) (Schneider,

5
Hitlan, & Radhakrishnan, 2000), an adaptation of the Social Distance Scale (Bogardus,
1959), a brief religiosity scale (Allport & Ross, 1967), and a demographic questionnaire.
Chapter Four includes the Results section. The Results section describes findings
of the statistical analyses. More specifically, the findings that Iranian American Jews and
Muslims reported perceiving significantly higher rates of prejudice and discrimination
than Iranian Americans with no religious affiliation. In addition, Iranian American Jews
who displayed symbols of religious affiliation reported significantly higher rates of
perceived prejudice and discrimination.
Chapter Five presents the Discussion Section. I provide an interpretation of the
statistical findings. The discussion section is organized into three sections: summary of
key findings, limitations and strengths, and implications and concluding comments. The
Discussion section was written to explore possible reasons for the significant differences
between Iranian American Muslim, Jewish, and non-religious perceptions of experienced
ethnic harassment and social distance from Euro Americans.

6
CHAPTER 1
The Effects of Negative Characterizations of Iranian Americans. Past and Present
Chapter One describes past and current portrayals of Iranian Americans. It also
examines a number of psychological concepts. The descriptions and concepts provided in
Chapter One are presented below. One factor explored, in the political depiction of
Iranian Americans, is the categorization of Iran as one of the three countries that make up
the “Axis of Evil” (Bush, 2002) metpahor. Next, the concepts of the “mirror image
phenomenon” (Peteraf, & Shanley, 1997; White, 1970) and “the need for cognitive
consistency” (Brofenbrenner, 1963; Nail, Bedell, & Little, 2003) describe the effects on
the public of such negative political characterizations of Iranian Americans (White,
1970). Negative portrayals may predispose recipients to feeling vulnerable and may
produce a hostile social environment.
The Axis of Evil Metaphor and the Mirror Image Effect
The categorization of Iran as part of the Axis of Evil metaphor may have
significantly changed the perception of Iranian Americans in the U.S. Former President
George W. Bush was the first to categorize Iran as part of an “Axis of Evil.” The concept
characterized Iran, Iraq, and North Korea as “terrorist states” (Heradsteveit & Bonham,
2007; Public Broadcasting Service, 2011). Historically, the term “Axis” originally
referred to the alliance between Nazi Germany, Italy, and Japan (Heradsteveit &
Bonham, 2007). The use of the term Axis may still evoke memories of terror for those
affected by World War II. Consequently, American descendants of countries labeled as
part of the Axis of Evil (e.g., Iranian Americans) may be stigmatized as wrong and evil.

7
The stigmatization of Iranian Americans due to the negative political portrayal of Iran
may be referred to as the “mirror image” effect (White, 1970).
The mirror image effect is a concept that may explain a psychological
phenomenon. The concept suggests that when two countries such as Iran and the U.S.
have contentious relations, members of each country will label the opposing country and
its people as bad and wrong and justify their own country and people as good and right
(Peteraf & Shanley, 1997; White, 1970). Governmental endorsement of negative
characterizations, such as former President George W. Bush’s Axis of Evil concept,
strongly encourages the effect. One of the significant time periods during which the
“mirror image” phenomenon occurred was during the month following the Iran Hostage
Crisis in 1979. Most of the “mirror image” effects related to evaluative constructs (e.g.,
dangerous/safe, unfriendly/friendly), where 70% of American participants reported a
positive image of Americans and a negative image of Iranians (Johnston, Mingst, &
Sigelman, 1980). The mirror image effect on individuals was partly shaped by
perceptions of cultural similarities and differences.
Individuals typically report less favorable attitudes toward members of countries
that are culturally dissimilar than those that are similar (Nincic & Russett, 1979; Rouhana
& Fiske, 1995). Important cultural dimensions upon which Iran differs from the U.S. are
language, religion, and political characteristics. The increased likelihood of favorable
attitudes toward those who are culturally similar is due to categorization of individuals as
belonging to the in-group (or in closer relation to the in-group) vs. the out-group. The in-
group is comprised of the social, ethnic, or cultural groups one feels a part of; the out-

8
group is comprised of social groups one competes with and does not associate with
themselves (Tajfel & Turner, 1979).
Categorizing individuals as part of the in-group vs. outgroup has significant
psychological implications. Differences between the in-group and out-group are
described as the social–cognitive perception of differences between “we and they”
(Mclauchlin & Pearlman, 2011; Tajfel & Turner, 1979; Yamagishi, Mifune, Liu, &
Pauling 2008). Individuals sympathize and feel similar to members of their in-group and
compete with members of the out-group (Tajfel & Turner, 1979; Waldzus, Mummendey,
& Wenzel, 2004). The out-group categorization of individuals leads to “a negative
evaluation of a social group, or a negative evaluation of an individual that is significantly
based on the individual’s group memberships” (Crandall & Eshleman, 2003, p. 414) in
order to maintain a degree of cognitive consistency (Brofenbrenner, 1963; Nail, Bedell,
& Little, 2003).
Jane Elliot was an educator who created an exercise on racism using elementary
school children that illustrated how quickly an us vs. them dynamic may develop. Once
the third graders were placed into blue or brown eye groups, they judged their in-group to
be good and superior and the out-group to be wrong and inferior. The blue eyes/brown
eyes exercises demonstrates the significant effect in-group/out-group categorization has
on one’s perception of out-group members (Infinito, 2003).
The Negative Perception of Iranian Americans, Past and Present
The current section explores past and present political contexts and relations
between the U.S. and Iran that contribute to the current negative portrayal and perception
of Iran and Iranian Americans. The order of events described are as follows: past

9
positive relations between the U.S. and Iran, the Iranian Revolution, The Iran Hostage
Crisis, The Iran-Iraq war, the tragic events of 9/11, and the current struggle and plight of
the Iranian people. This information is important because it provides a context for the
current negative portrayal of Iranian Americans and offers an insight into the Iranian
American experience.
The relationship between the U.S. and Iran was at one time positive and fruitful.
With Mohammad Reza Shah Pahlavi (also known as the Shah) in power (1941), the
relationship flourished. In support of the Shah and to protect foreign access to Iranian
oil, the U.S. and the British worked together to remove Iran’s Prime Minister Mohammad
Mossadeq in 1953. Mossadeq advocated the nationalization of Iranian oil and limitations
on foreign ownership. Following Mossadeq’s removal, the Shah instituted the White
Revolution in 1963 to work toward Westernizing Iran. However, it is important to note
that the monarchy typically punished and imprisoned those who openly criticized the
Shah.
The downfall of the Shah was complex. One of the Shah’s greatest critics was
religious extremist/fanatic Ayatollah Ruhollah Khomeini. The Shah eventually forced
Khomeini to leave Iran. During this time, some of the Iranian people opposed the
absolute power of a monarchy and protested against the Shah. In 1979, the Iranian
revolution occurred, and Khomeini returned to Iran. Khomeini took power and renamed
the country the Islamic Republic of Iran. He replaced the Iranian legal system with his
interpretation of an Islamic set of laws and regulations called velayat-e faqih. The code
also named Khomeini as the supreme leader. As a result, the Shah and his family fled

10
Iran and the Shah sought cancer treatment in the U.S. Most of the Iranian people who
were associated with the Shah were imprisoned and tortured.
Then, one of the most influential and negative events in the relationship between
the U.S. and Iran occurred. In October of 1979, a group of Muslim extremists held 52
Americans hostage in the American embassy in Tehran. The hostages were not released
for 444 days and the event was referred to as the Iran Hostage Crisis. President Jimmy
Carter instituted a prohibition of Iranian oil. After several failed attempts to rescue the
hostages, the Ayatollah Khomeini finally released them in 1981 after the U.S. and Iran
signed the Algiers Accords in Algeria. After the Iran Hostage Crisis, the relationship
between the U.S. and Iran never recovered.
Subsequently, Iran was involved in a lengthy war and lost any positive connection
with the Western world. In 1980, the Iran-Iraq war began and was termed the longest
conventional war of the 20th
century. The use of chemical weapons still affects some
Iranians today. After eight years and millions of deaths, the war ended without any gain
to either side. Please see Appendix A for more information on the historical relationship
between the U.S. and Iran, the current plight of the Iranian people, and the Green
Movement. Iran once again became a point of interest following the tragic events of
9/11. The Western world became interested in Iran’s involvement in terrorism and ability
to have nuclear weapons.
Stereotypes about Middle Easterners and Iranian Americans
Stereotypes about Middle Easterners historically consisted of the idea of the
“hook-nosed, savage,” (Shaheen, 2003, p. 171) According to Shaheen (2003), depictions
of Middle Easterners in Hollywood movies have been of those who despise Christians

11
and Jews and are “heartless and brutal” (Shaheen, 2003, p. 171). The American cinema
has marginalized the Middle Easterner, who is assumed to be Arab and Muslim, as one
who is an outsider (an other). Shaheen’s (2003) analysis of over 900 Hollywood films
found that 95% of the movies analyzed depicted Arabs as, “brute murders, sleazy rapists,
religious fanatics, oil-rich dimwits, and abusers of women … (that) all look alike”
(Shaeen, 2003, p. 172). It comes as no surprise that the tragic events of 9/11 only shed
light on the underlying prejudices that existed towards the Middle Eastern community.
Researchers have also described stereotypes that are unique to Iranian Americans.
Eagly and Kite (1987) surveyed 303 students at Purdue University. The undergraduate
students were enrolled in an Introduction to Psychology class and were asked to rate
individuals from 28 countries. Participants stereotyped Iranian American men and
women as religious, traditional, and poor (Eagly & Kite, 1987). More recently Ghavami
and Peplau (2013) surveyed 627 undergraduates from a Southern California University in
regard to ethnic stereotypes in a free response format. They found that Middle Eastern
men and women were stereotyped as dark-skinned, Muslim, and religious. However,
researchers have also analyzed stereotypes about Iranian Americans and Middle
Easterners that were specific to gender.
The differences between what kinds of stereotypes apply to individuals of the
same ethnicity but different gender were examined. Eagly and Kite (1987) found that
Iranian American men were stereotyped as hostile, aggressive, never giving up, dirty,
proud, and arrogant. While Iranian American women were stereotyped as family
oriented, conforming, conservative, proud, devoted to others, honest, and emotional.
More recently Ghavami and Peplau (2013) found that Middle Eastern men were

12
stereotyped as anti-West, suspicious, and good at bargaining. While Middle Eastern
women were stereotyped as quiet, covered, oppressed, family-oriented, having many
children, sexually conservative, and (being) housewives.
In recent years a new stereotype of Iranian Americans may have developed
alongside the stereotypes mentioned above. In 2012, the TV network Bravo created a
reality show called Shahs of Sunset. The show features six Iranian Americans living in
Los Angeles. Many Iranian Americans have disapproved of the show claiming it
reinforced negative stereotypes about the community (Perdomo, 2012). Individuals on the
show are seen throwing expensive parties with caged tigers. There are many
conversations about designer labels, excessive drinking, and trips to Las Vegas. A
number of prestigious Iranian Americans have spoken out about the show and the
negative image it creates for the community including the former Iranian American
mayor of Beverly Hills.
Middle Easterners and Iranian Americans have faced more than stereotyping and
stigma. There has been a recent increase in behavioral actions against Middle Easterners
and anyone who is assumed to be Muslim. Below is a discussion of hate crimes toward
anyone who is categorized or assumed to be Middle Eastern.
The Recent Spike in Prejudice and Discrimination Toward Anyone that Appears
Middle Eastern or Muslim
The post 9/11 context created a political and social climate in the U.S. that
promotes prejudice and discrimination against anyone who appears to be Middle Eastern
or Muslim (Britto, 2008). According to the Federal Bureau of Investigation (FBI) reports
(HRW, 2002), anti-Middle Eastern hate crimes increased seventeen-fold from the year

13
2000 to 2001 (HRW, 2002). Iranian Americans and Iranian American Muslims contend
with prejudice and discrimination that is aimed toward all Middle Easterners in the U.S.
This section describes the recent increase in prejudice and spike in hate-crimes against
anyone who appears to be Middle Eastern (e.g., Iranian Americans or Iranian American
Muslims) or Muslim.
People who appear to be Middle-Eastern or Muslim have been lumped into one
social group and discriminated against. For example, members of the Sikh religion were
victims of hate crimes and discrimination because they were mistaken for Muslims.
Balbir Singh Sodhi was a Sikh Indian man murdered on September 15, 2001, by Frank
Roque, who claimed he was seeking revenge for the attacks of 9/11. Sodhi, was
ethnically Sikh and wore a turban.
Hate crimes are distinguished by the motivations behind them. In other words, it
is not the underlying act committed, (e.g., vandalism, assault, murder) that categorizes a
crime as a hate crime; it is the hostility the perpetrator has against the victim, based on
“racial, ethnic, religious, gender, or sexual orientation” (Human Rights Watch [HRW],
2002). Hate crimes originate from deeply seated anger toward a specific community. The
individual committing the hate crime holds the victim, who is a member of the targeted
community, responsible for their hatred. While the degree of hate or anger involved in a
hate crime is atypical, the sentiment is sometimes reinforced by a larger societal view
(e.g., the Axis of Evil concept). Post 9/11 hate crimes were a prime example of an
unusual manifestation of hatred that reflected a societal sentiment in the U.S. toward
Middle Easterners.

14
Individuals who are most visibly identified as members of the discriminated
group fall vulnerable to higher rates of victimization. Signs of group membership may
include a hijab for women and a turban for men in the Middle Eastern or Muslim
communities. The hijab is a traditional Muslim article of clothing worn by women in the
community to cover their hair. The turban is a traditional Middle Eastern (also African
and Far Eastern) headwear worn by men of the community, who may belong to a number
of religious groups.
Moreover, members of the Middle Eastern community who held occupations that
were more typical for Middle Easterners were more likely to be victims of hate crimes
(HRW, 2002). For example, taxi drivers, convenience store owners, and motel owners
were more likely to experience hate crimes than were those Middle Easterners who did
not occupy stereotypical occupations for their ethnic group. The occupations of murder
victims resulting from post 9/11 backlash include two convenience store owners and one
gas station owner. There were significant increases measured in the number of hate
crimes against Middle Easterners or Muslims in the months following the events of 9/11.
Please see Table 1 below.
Table 1. Location and Increase in the Number of Hate Crimes Post 9/11/2001
Location Percent or Number increased
Chicago Year 2000 = 4 anti-Muslim hate crimes
Year 2001 = 51 anti-Muslim hate crimes
Los Angeles Year 2000 = 12 anti-Muslim hate crimes
Year 2001 = 188 anti-Muslim hate crimes
Florida The attorney general reported an increase in hate crimes of 24.5 percent
(HRW, 2002)
15
The extent of hate crimes committed against those who appear to be Muslim in
the post 9/11 context remains unknown. One reason for uncertainty is that the rate of hate
crimes is based on the number of individuals that choose to report such crimes. A second
reason for the unreliable statistics is due to the existence of cases in which a crime has
mixed motives. Because the motives behind a crime may be based on a number of
factors and not limited to the victim’s religion, race, gender, or sexual orientation, the
crime may not be categorized a hate crime.
A fourth problem in hate crime reporting statistics is that in some cases language
is a barrier. According to HRW (2002), some victims of the post 9/11 anti-Middle
Eastern or anti-Arab backlash had difficulty communicating with government officials in
their attempt to report the incidents of hate crimes. Furthermore, the post 9/11 backlash
was not limited to hate crimes. Many Middle Eastern Americans filed complaints with
the U.S. Equal Employment Opportunity Commission claiming to be illegally fired
(HRW, 2002). In 2002, there was a significant increase in claims to the Department of
Transportation in the number of persons of Middle Eastern background that were
searched without probable cause at airports (HRW, 2002).
Members of the Middle Eastern or Muslim communities, in the post 9/11 context,
are left vulnerable to prejudice and discrimination. Iranian American Muslims or Iranian
Americans mistaken to be Muslim, face prejudice and discrimination due to both their
ethnic and religious group appearance and memberships. Iranian Americans are a diverse
group of people and various dimensions of their identity are explored below.

16
The Diverse Identities of Iranian Americans in U.S. Immigration Patterns
Iranian Americans are a diverse group of people, predominantly made up of
immigrants. The Iranian American experience and identity will vary depending on the
time period and reasons for which an Iranian immigrated to the U.S. Push factors are
reasons that motivate an immigrant to leave his/her place of origin. Pull factors are
reasons that motivate an individual to immigrate to a particular country. A brief
description of Iranian American immigration patterns is provided below.
Iranian migration to the United States occurred mainly during two phases. The
first phase took place in the mid 1950s and consisted of mostly the elite Iranian
population. During the first phase of migration, Iranian immigrants included mostly
college students. The growing and industrializing economy of Iran created the need for a
more educated population. As a result, children of the elite and those politically aligned
with the monarchy sought a U.S. college education, with the intention of returning to Iran
and contributing to the country’s workforce. Approximately 34,000 Iranians migrated to
the U.S. during this first phase of immigration.
The second phase of Iranian migration into the U.S. occurred under significantly
different circumstances than the first phase of migration. Beginning with the Islamic
Revolution in Iran in the late 1970s until present day, Iranian immigrants have mainly
included refugees. It is estimated that 330,000 Iranians immigrated to the U.S. during this
time. The second phase of immigrants consisted of Iranians from diverse backgrounds.
Immigrant identities ranged from Iranians who were Jewish, Baha’i, or Christian. The
Iran-Iraq War also occurred during the second phase of immigration. Beginning in 1980,
migration to the U.S. increased by 74 % (Retrieved June 5, 2011 from

17
http://www.migrationinformation.org/about.cfm). Many of the immigrants were young
Iranians who did not politically agree with the Iran-Iraq War and women and children
who escaped warfare in Iran. The Office of Immigration Statistics (1980-2004) estimated
“more than one out of every four Iranian immigrants (was) a refugee or asylee.”
Thus far I have described the past and present political and social identities of
Iranian Americans. Next I will present current demographic characteristics of the
community in the U.S.
The Current Demographic Characteristics of Iranian Americans
The section above described the unique contexts within which Iranians
immigrated to the U.S. A description of estimates of current demographic information
about Iranian Americans is presented. Many Iranian American groups such as The Public
Affairs Alliance of Iranian Americans, the Iranian American Bar Association, and the
Iranian Alliances Across Borders, have attempted to increase awareness about the Iranian
American community. Below I discuss some of the demographic characteristics and the
difficulties involved in accurately identifying the Iranian American community.
There is a discrepancy between the estimated number of Iranians living in the
U.S., according to the U.S. Census (2010) and a number of Iranian American
associations. The U.S. Census Bureau (2010) reported approximately 463,552 Iranians
living in the U.S. The Iranian Studies Group, a non-profit group associated with The
Massachusetts Institute of Technology (MIT), on the other hand, estimated that there are
more than 691,000 (2010) Iranians living in the U.S.
The actual number of Iranian Americans living in the U.S. has become a difficult
figure to ascertain. One reason is that Iranian Americans must first identify themselves as

18
racially “other” (and not White) and then specify (fill in the blank) their identity as
Iranian American in order to be publicly recorded as Iranian American. In addition, many
Iranian Americans identify themselves as Persian. Thus, Iranian Americans who only
identify themselves as White are not counted as Iranian American on public records such
as the U.S. census. Iranian American research groups are still working to tabulate the
information found on the 2010 census. Therefore, much of the information presented
below is either from independent Iranian American research groups or based on the 2000
U.S. census.
Iranian Americans are a diverse group of people, mostly made up of immigrants.
Within the Iranian American group are wide variations in cultural identity. The cultural
variations are based on the following factors: 1) skin tone/color, 2) foreign accent
3) religious identity 4) Islamic appearance 5) identifying as Jewish 6) identifying as
Baha’i, Christian, or Zoroastrian and 7) having no religious affiliation. For a detailed
description on the aforementioned dimensions of cultural identity within the Iranian
American community please see Appendix B.
Despite the Islamic regime in Iran, not all Iranian Americans identify as Muslims.
Religiously, 40% of Iranians in the U.S. identify as Muslim and nearly the same amount
identify as non-religious (Public Affairs Alliance of Iranian Americans, PAAIA, 2008).
The remaining 20% identified as Jewish, Baha’i, Christian, or Zoroastrian. In addition,
61% of Iranians in the U.S. are naturalized citizens. This is in contrast to the 40% of the
“foreign-born population (that) was naturalized.” “Three out of every five Iranian
immigrants were naturalized U.S. citizens.” Iranian Americans were also found to be
more likely to speak a language other than English within their household. Where 92% of

19
“foreign born” Iranian Americans spoke a language other than English at home; only
83% of other “foreign born individuals spoke a language other than English” at home.
Iranian Americans are one of the most educated, independent, and economically
flourishing immigrant groups in the U.S. According to PAAIA (2008), more than half of
Iranian immigrants earned a bachelor’s degree or higher (51%). This was more than
double the percentage of total foreign-born individuals (24%). Iranian Americans were
twice as likely, compared to other foreign born individuals, to be self-employed. In 2000,
12% of Iranian Americans identified as self-employed, almost double the rate of the 7 %
of other foreign born individuals. Iranian Americans were also more likely to earn higher
incomes than were their foreign born counterparts. The median annual income of male
Iranian Americans was $52,333; female Iranian Americans had a median annual income
of $36,422. This was significantly higher than their foreign born counterparts: males,
$30,288 and females, $25,260.
Recent Research on Iranian Americans and the Current Study
There are a number of ways in which Iranian Americans have been analyzed. The
Iranian American identity has been explored via literature reviews (Mostofi, 2003).
Cultural retention among Iranian Americans was measured through participant interviews
(Darnell, 2002). The political threat of Iran has been analyzed through content analysis of
Canadian and U.S. newspapers (Ricard, 2012). Different types of family conflicts were
measured through surveys among Iranian Americans (Partiali, 2012).
Researchers have analyzed Iranian and Afghan children’s experiences. They
grouped their reports of prejudice and discrimination through interviews, focus groups,
journals, and field logs (Khanlou, Koh, & Mill, 2008). In addition, Iranian Americans’

20
feelings of isolation and depression in Iowa were assessed on the basis of interviews and
surveys (Chaichian, 1997). Past research has utilized a mixed methods design in the state
of Iowa and most past researchers have studied Iranian Americans as one homogenous
group. The current study was interested in intragroup differences in perceptions and
experiences with prejudice and discrimination in terms of frequency and severity. Thus, a
quantitative approach was utilized, measuring perceptions of experienced prejudice and
discrimination among Iranian Americans of various religious affiliations (no religious
affiliation, Muslim, Jewish).

21
CHAPTER 2
Theoretical Frameworks
The theoretical frameworks employed in the current study are Social Identity
Theory, Social Distance Theory, and related concepts (e.g., categorization, comparison,
identification, and psychological distinctiveness). More specifically, the theories discuss
how Iranian Americans and Euro Americans come to accept individuals who make up
their in-group(s), while becoming prejudiced and discriminatory toward out-group
members. This section describes the significant differences between Euro American and
Iranian American social identity that may lead to higher rates of social distance between
the two groups. A discussion of significant differences between Iranian and Euro
American social identities is also presented.
Social Identity Theory
Social identity is framed by the various social groups to which one belongs
(Tajfel & Turner, 1979; Tanti, Stukas, Halloran, & Foddy, 2010). For example an Iranian
American may belong to several social groups including the Jewish religious group, the
Democratic political group, and the White racial group. This section explores the
cognitive processes involved in social identity formation. The processes include
categorization, comparison, identification, and psychological distinctiveness.
In-group Cognitive Processing. The categorization process involves the cognitive
information processing model, whereby the mind organizes information into
nomenclatures (Dovidio & Gaertner, 1986: Mayer, 2012). In other words people
organize stimuli into categories such as man, woman, and/or American. Individuals
identify “functionally important aspects” that are common or dissimilar between groups

22
of people (Dovidio & Gaertner, 1986, p. 128; Mayer, 2012). An important aspect or cue
would be a turban or a hijab in categorizing an individual as Middle Eastern or Muslim.
An unimportant aspect may be the size of their hands or what kind of shoes they were
wearing.
Race is one of the most important social categories in the U.S., despite the non-
biological nature and the non-existence of a “pure” race. Racial attributes such as skin
color, hair texture, facial structure (Rose, 1997) are used to categorize individuals into
racial groups. Iranian Americans are considered White. However, they have diverse skin
tones, hair textures, and facial structures that will be further described later on in the
dissertation.
Colorism is a concept that explores differences in degree of prejudice and
discrimination experienced by individuals of the same racial group who have different
skin tones (lighter vs. darker) (Jones, 2000). Skin color may be a proxy for an
individual’s type of occupation and the neighborhood in which he/she resides (Rose,
1997). The correlation between non-White skin tone and disproportionate representation
within lower status work and neighborhood is a social and not biological phenomenon.
Researchers found that Middle Easterners were stereotyped as having darker skin tone
(Ghavami & Peplau, 2013).
Skin tone is an ascribed status (Parrillo, 1994) due to one’s inability to choose
skin tone and compounded by the cultural significance of skin color in the U. S. (Rose,
1997). In addition to ascribed statuses, socially constructed attributes are also used in the
categorization processes (Dovidio & Gaertner, 1986; Mayer, 2012). Characteristics such
as religious affiliation and region of origin, are identifiable through other social cues. For

23
example many Iranian Americans who possess an Euro American appearance may be
categorized as Middle Eastern by Euro Americans through the social cue of their ethnic
names. There is a relationship between social group categorization and context because
of the social and political privileges and powers gained or lost by the particular group
within which one is categorized.
A comparison process determines with which group(s) one identifies. However,
the comparison process assesses more than actual differences and accounts for the
notions of “we and they.” The group comparison process affects the individual’s self-
concept. Important attributes of an individual’s self-concept, such as self-esteem, are
affected by how society and the individual themselves assess the in-group (Dovidio &
Gaertner, 1986; Mayer, 2012). Group assessment is generally assessed via an interval
scale whereby the value of one group is only relevant when compared to the value of
another group. For example, individuals from California and Texas may perceive one
another as culturally significantly different. However, the same two individuals may feel
very similar when placed in a different context such as outside of the U.S. They may
perceive each other as American and very similar when conversing outside of the U.S.
The positive social identity theory suggests that individuals desire membership
within the empowered groups of society (Mayer, 2012; Sachdev & Bourhis, 1985). The
nature of group comparisons creates the motivation for an individual to desire group
distinctiveness. Group power may be defined as the ability to control one’s surroundings
and the actions of others.
Out-group Formations. The out-group, foreigner/immigrant/alien is perceived as
strange, unusual, or eccentric (Schrieke, 1971; Semyonov, Raijman, & Gorodzeisky,

24
2006). This deviation from what is deemed as “normal” is observable through dress,
language, and many other social behaviors. That which is considered different is
considered wrong (versus right) and causes social hostilities. For example, Iranian
Americans who speak Farsi and identify as Muslim may be perceived as significantly
different and therefore wrong. The term “alien” is itself dehumanizing and asserts ideas
of inferiority. Hence, “the greater the difference in cultural or social heritage, the greater
(is) the repugnance” (Schrieke, 1971, p. 71; Semyonov, Raijman, & Gorodzeisky, 2006).
Both minority and majority group members solidify their identity when placed in
contexts where power differentials are readily observed within a social hierarchy (Porter
& Washington, 1993).
Social group members develop a bias against members of the out-group. The bias
entails the attribution of out-group successes to external causes, and successes of the
in-group to internal causes (Ross, 1977). The bias described above is called the
fundamental attribution error. The fundamental attribution error may lead to a form of
discrimination against members of the out-group, in order to maintain in-group power.
This type of discrimination is referred to as minimal intergroup discrimination (Stukas,
Halloran, & Foddy, 2010; Tajfel & Turner, 1979). It is called minimal intergroup
discrimination because the effect is based on the minimal group paradigm (Tajfel &
Turner, 1979).
The minimal group paradigm describes the minimum number of characteristics
necessary to create a sense of in-group solidarity among individuals. Individuals will
demonstrate a sense of in-group solidarity based on the most non-significant group
designation, which is referred to as the minimal discrimination effect (Stukas, Halloran,

25
& Foddy, 2010; Tajfel & Turner, 1979). In other words, once an individual has identified
with an in-group, a biased comparison is assessed to create a positive social identity
marked by group power.
Discrimination includes biased allotments of resources and goods to an
individual’s in-group (Katz, 1991; Tajfel & Turner, 1979). Power, as defined above, is
desired to create a higher sense of self-esteem for the in-group while simultaneously
widening differences between the in-group and the out-group. The widening of
differences and the minimal discrimination effect work together to create and maintain
power differentials perceived or real between the in-group and the out-group.
Interestingly, participants in a group experiment who displayed discriminatory behaviors
also maintained a higher level of self-esteem (Katz, 1991; Oakes & Turner, 1980). The
findings that displays of discrimination positively correlate with higher levels of self-
esteem, suggests that such discrimination occurs to heighten the status of an individual’s
group, and in turn support a positive social identity.
The distinctiveness phase describes the motivations for group categorization
(Stukas, Halloran, & Foddy, 2010; Tajfel & Turner, 1979). Although the processes of
categorization, identification, and comparison precede psychological distinctiveness, the
motivation for these three processes is to achieve psychological distinctiveness and to
enhance positive social identity (Dovidio & Gaertner, 1986; Stukas, Halloran, & Foddy,
2010).
Self-categorization theorists view social category boundaries as flexible. In other
words, the “saliency” of particular social identities may change within different contexts
among various individuals (Deaux, 1993). Various group identifications will become

26
more or less salient depending on the status and advantage gained within the immediate
context. When aspects of one’s social identity are negatively evaluated by others,
individuals may not want to reveal those particular aspects—such as their religious
affiliation, political affiliation, or sometimes country of origin. For example, an Iranian
American may choose to go by an American nickname in social settings to avoid possible
prejudice and discrimination. However, the communication of ascribed status and
ascribed group membership is automatic despite social gain or loss.
Social Identity and Iranian Americans
Iranian Americans may have different experiences in the U.S. depending on how
they are categorized, based on ethnic appearance as it pertains to skin tone and hair
texture. More specifically, Iranian immigrants to the U.S. come from different regions of
Iran that have distinct customs, linguistic dialects, and different skin tones. Iranian
Americans vary in appearance from blond hair, blue eyes, small/big pointy noses, and
light skin to dark brown/black eyes, black hair, darker/tan/brown or olive skin tones, and
wider set noses. Iranian Americans also range from having straight light hair to having
dark black curly hair. They may affiliate with Islam, Judaism, or other religious groups
and display cultural symbols of belonging to the Iranian American group.
Individuals may categorize Iranian Americans or Iranian American Muslims as
part of their in-group/out-group based on similarities and/or dissimilarities between the
group member and themselves. Within the comparison process, the Iranian American or
the Iranian American Muslim is perceived as a member of the out-group, the other, and
as foreigners referred to as “aliens.” Ultimately, these described notions of “we versus
they” and “alien” are examples of what is identified as the in-group verses the out-group.

27
Iranian Americans with more phenotypically Eurocentric features may be socially
and politically motivated to socially distance themselves from the Iranian American
group. For example, Iranian Americans with Eurocentric appearances may Anglicize
their names, wear Westernized attire, and altogether deny being Iranian American if they
feel that it is to their social benefit. Whereas Iranian Americans with more ethnic
appearances (darker skin tone, darker hair/eyes, ethnic hair texture, ethnic facial
structures) do not have control over their ascribed status. Consequently, they become less
accepted by the U.S. dominant mainstream group.
Social Distance Theory
The section above described Social Identity Theory, application to Iranian
Americans, and the biases that develop based on in-group memberships. Below is a
description of Social Distance Theory and its effects on prejudice (Bogardus, 1947;
Rollock, & Vrana, 2005). The Iranian American community is perceived as the “other”
and represents a social identity that is significantly different from the mainstream U.S.
identity. This suggests a possible vulnerability to higher rates of social distance between
Iranian Americans and Euro Americans.
Social Nearness. Social nearness (of social distance theory) describes a high
degree of sympathetic understanding (Ahmed, 2007; Bogardus, 1959). Sympathy is
defined as an emotional or behavioral response that is positive or in the best interest of
another person or group of persons. Sympathetic understanding may occur between
individuals, between an individual and a social group, and between social groups. For
example, there is a high degree of sympathetic understanding (social nearness) among
Iranian American refugees, due to their unique and similar social identities and life

28
experiences. Williams (as cited in Weaver, 2008) describes social distance as “feelings of
unwillingness among members of a group to accept or approve a given degree of
intimacy in interaction with a member of an out-group” (Weaver, 2008, p. 780).
Interestingly, social distance exists on a personal or group level within every social
interaction.
Social distance may exist between person and person, between a person and
group, and between social groups (Bogardus, 1959; Rollock, & Vrana, 2005). Social
distance is placed on a continuum between degree of social nearness or farness
(Bogardus, 1959; Rollock, & Vrana, 2005). Measuring social distance is complicated
due to the fact that social distance never ceases to exist. In other words, “social nearness”
indicates a high degree of sympathy and understanding between “person and person, or
person and group, or group and group.” On the other hand, “social farness” indicates a
low degree of sympathy and understanding between individuals, an individual and a
group, or social groups. Social distance pertaining to “person and person” is illustrated in
seven specific levels (Bogardus, 1959). Please see Table 2 below.
Table 2. Levels of Social Nearness and Distance
1. Loved Ones
2. Regular Friends
3. Speaking Acquaintances
4. Non-Speaking Acquaintances
5. Strangers in Same Culture
6. Strangers in Different Cultures
7. Enemies
(Bogardus, 1959)
“Social nearness” begins with level one, which includes “loved ones,” and
gradually approaches “social farness” with “enemies” at level seven. Social distance
29
incrementally increases in the following order: “loved ones, regular friends, speaking
acquaintances, non-speaking acquaintances, strangers in (the) same culture (e.g Iranian
Americans, Iranian American Muslims), strangers in different cultures, and enemies”
(Ahmed, 2007; Bogardus, 1959, p. 8). Levels one and two indicate “social nearness”
where level one indicates closer ties than level two. Levels three and four indicate a
significant level of “social nearness,” with the possibility of increasing closeness. Level
five categorizes “social farness” within the same society. Level six refers to “social
farness” that creates no avenues for communication (e.g., individuals living in different
countries, Iranians).
Level seven is unique in that it may refer to a range of individuals from within the
same household to individuals of different social systems and cultures. Within level
seven, social farness is deliberately increased by the two parties involved (e.g., enemies).
Level seven is a social farness type that is in a class by itself and may exist between
members of different cultures, of the same culture, even of persons within the same
household, where each participant discloses the less appealing aspects of his/her
personality to the other and where one, or both, engage in deliberately increasing the
farness conditions.
Social nearness between person and person may imply that the individuals share
many commonalities. It is a careful balance of stimulation that is rooted in similarity
without causing boredom. This type of social nearness between person and person is
called personal nearness. In the other extreme, personal farness may be due to cultural
differences or a feeling of competition (Ahmed, 2007; Bogardus, 1959).

30
The term personal-group distance refers to the relationship between an individual
and the group(s) he/she may be a part of, with which he/she interacts. Personal-group
distance refers to the degree of “sympathetic understanding” (Bogardus, 1959, p. 10)
between a person and a group. For example, personal-group nearness describes the
situation in which an individual has a strong sense of loyalty to a group.
In contrast, an individual may be part of a social group, such as an Iranian
American, and if phenotypically able to pass for non-Iranian American, they may deny
group membership and engage in personal-group farness. People may not be accepting
of a group, and a group may not be accepting or approving of an individual. The term
group-personal farness describes a situation wherein the individual’s values,
characteristics, or behaviors deviate from what a group deems as normal or acceptable.
Therefore, deviating from the “norm” is a strong indication of whether or not a group will
accept an individual.
An interesting dynamic exists between isolation and social deviation (Bogardus,
1959; Clinard & Meier, 2010). The relationship describes an individual becoming
socially deviant as a cause of isolation (e.g., the Iranian American who is rejected by the
group). However the individual may also become socially deviant as a result of his or her
isolation from the group (e.g., Iranian Americans who deny group membership). The
group may be more or less accepting of an individual depending on the values of the
group and whether the individual is deemed a “liability or an asset” (Bogardus, 1959,
p. 10; Clinard & Meier, 2010). The term “liability” refers to a person who may lessen or
threaten the group’s status or values whereas the term “asset” refers to a person who may
further the goals or heighten the status of a group. Personal-group distance may be

31
conceptualized similarly. That is, the individual is more likely to desire group
membership if his/her status or values are heightened—for example, an Iranian American
with Eurocentric features may likely desire entrance into the White American group in
order to heighten social status or value.
Group distance is measured by the degree of sympathetic understanding
(Bogardus, 1959) that exists between two groups in society. Social groups may include,
among other categories, religious groups, ethnic groups, or racial groups (e.g., Iranian
American, Iranian American Muslim). An example of group distance is described
between employers and employees (Bogardus, 1959; Gonzalez, Burke, Santuzzi, &
Bradley, 2003). In the case of a workers’ strike, generally there is a high degree of group
social distance between that particular group of employees and their employer. Racially
motivated riots also illustrate the phenomena of social group distance between racial
groups.
Hate crimes and hate rallies may result from a high degree of social group
distance. Group nearness is likely to occur when groups have similar backgrounds,
cultures, and goals. Group nearness refers to those groups not in direct competition with
one another. To further understand types of group social distance you may refer to
Appendix C, regarding horizontal and vertical social distance.
Patterns of Social Distance
There are basic patterns within which social distance increases or decreases
(Bogardus, 1959; Clinard & Meier, 2010). Past research on patterns of social distance
allows researchers to understand what particular group memberships are of interest when
looking at biases and prejudices. Social distance patterns were observed from 1926 to

32
1956 (Bogardus, 1959). One of the first social factors explored were patterns regarding
race. Race may be conceptualized as a social construct. A social construct is one that is
created by the individuals of a society as part of its culture (Lorber, 1994). Social
constructs are dynamic. Individuals must unanimously accept the social construct as true
and behave accordingly to maintain social parameters and boundaries. Social constructs
are created and maintained in this manner. As a result, anticipated behaviors and
standards or norms are based on accepted social constructs that are reinforced
institutionally, socially, and personally within a society.
Simply stated, race has no biological validity (Lorber, 1994). This theory also
addresses the two racial myths: First, that there exists one superior race; and second, that
any race is genetically pure. Both of these myths are scientifically inaccurate (Henslin,
2003). Social distance between racial groups in a society is referred to as racial distance
(Bogardus, 1959; Clinard & Meier, 2010). Racial distance may be more easily reduced
among racial groups that share cultural commonalities (Bogardus, 1959; Clinard &
Meier, 2010). For example, although Middle Easterners, Iranian Americans, and Euro
Americans are all considered members of the White racial group; there may still be a
high rate of group distance due to cultural differences on a number of important cultural
dimensions.
Group distance may also be due to differences in power among groups. For
example dominant groups in society may fear that their status is threatened by non-
dominant groups, and consequently put forth significant effort to lessen the opportunities
available to the non-dominant group members for social empowerment. Interestingly,
racial distance tends to increase during times of war (Bogardus, 1959).

33
Three major factors that contribute to decreasing racial distance are described
below (Bogardus, 1959; Goff, Davies, & Steele, 2008). First, the dominant group must
experience a reduction in fear of the non-dominant group. Second, the non-dominant
group must experience a degree of social empowerment through opportunity. Lastly, the
level of communication between the two races must increase and facilitate a higher
degree of understanding between them.
Social distance between religious groups was explored (Bogardus, 1959; Wark &
Galliher, 2007). Social distance in the area of religious group membership is termed
religious distance. Religion is considered a cultural phenomenon. Due to the highly
exclusive nature of religion, overcoming religious distance is challenging (e.g., social
distance with Iranian American Muslims). In other words, each religion conceptualizes
itself as the “right” religion, and hence considers other religious groups to be “wrong.”
The expertise, power, and control that a religion bears are not to be questioned by its
followers.
A lack in religious nearness is evident in the many wars fought in the name of
religion. In addition to, between groups religious conflict, the religious group sects that
form within a given religious group illustrate internal conflict between religious group
members. Religious distance is based on a difference in beliefs and endorsement of
leaders. Religious farness is manifested in the prohibition established by a number of
religions that do not allow religious group members to marry members of other religious
groups. Religious distance may be due to differences between religious groups and the
members’ theoretical beliefs (Bogardus, 1959; Wark & Galliher, 2007). It may also be
due to a competition to recruit group members and heightened during times of war.

34
Concepts such as the Axis of Evil may also increase religious distance. As a result,
religious distance is difficult to reduce.
Middle Easterners in the U.S.
Past researchers have analyzed the relationship between Americans in the U.S.
and Iranian Americans and/or Middle Easterners. Below is a description of research that
was conducted in the Middle Eastern community. Researchers reported that students from
a private southern university did not mind being friends with someone of Middle Eastern
descent but would not accept them as a family member (Horsfall & Salih, 2003).
Navarre-Jackson (2011) found that knowing someone from Middle Eastern descent
decreased social distance between individuals in the U.S. and other Middle Eastern
Americans. However, Koleser (2009) found that Middle Easterners were the least likely
to be accepted in the U.S. on the Social Distance and Semantic Differentials Scale. Thus,
the information is both contradictory and limited to studying Middle Easterners as one
homogenous group from an outsider’s perspective.
Hypotheses and Research Questions
On the basis of the preceding theoretical framework and research, I explored
whether or not Iranian Americans of various religious affiliations (no religious affiliation,
Jewish, Muslim) differed in their perceptions of prejudice and discrimination.
Specifically, the hypotheses and research questions were:
Hypotheses:
Hypothesis I. Iranian American Muslims will report higher rates of perceived
experiences of ethnic harassment and social distance from Euro Americans than
their non-Muslim peers (be they Jewish or possessing no religious affiliation).

35
Hypothesis II. Iranian American Muslims who appear prototypically Muslim
(displaying scarf/hijab, Allah necklace, a beard, Islamic stone, or a Tasbih), will
report higher rates of perceived experiences of ethnic harassment and social
distance from Euro Americans than will Iranian American Muslims whose
appearance is more prototypically Euro-American (or non-Muslim).
Specific Research Questions:
I. Does gender and/or religious affiliation (no religious affiliation, Jewish, or
Muslim) affect Iranian American perceptions of experienced ethnic harassment
from Euro Americans?
II. Are Iranian American perceptions of experienced ethnic harassment from
Euro Americans within the full sample predicted by, Jewish identity, Muslim
identity, gender, skin tone (color), Iranian accent, displays of religious affiliation,
ethnically traditional clothing, generational status, sub-ethnic identification
(other than Iranian American), or family income?
III. Are Iranian American perceptions of experienced ethnic harassment from
Euro Americans within each religious subsample (Iranian Americans: no
religious affiliation, Jewish, Muslim) predicted by, gender, skin tone (color),
Iranian accent, displays of religious affiliation, ethnically traditional clothing,
generational status, sub-ethnic identification (other than Iranian American), or
family income?
IV. Does gender and/or religious affiliation (no religious affiliation, Jewish, or
Muslim) affect Iranian American perceptions of social distance from Euro
Americans?

36
V. Are Iranian American perceptions of social distance from Euro Americans
within the full sample predicted by Jewish identity, Muslim identity, gender, skin
tone (color), Iranian accent, displays of religious affiliation, ethnically traditional
clothing, generational status, sub-ethnic identification (other than Iranian
American), or family income?
VI. Are Iranian American perceptions of social distance from Euro Americans
within each religious subsample (Iranian Americans: no religious affiliation,
Jewish, Muslim) predicted by, gender, skin tone (color), Iranian accent, displays
of religious affiliation, ethnically traditional clothing, generational status, sub-
ethnic identification (other than Iranian American), or family income?
VII. Does religiosity affect perceptions of experienced ethnic harassment and/or
perceived social distance from Euro Americans among Iranian Americans?
VIII. Is there an underlying latent construct within the measured variables of:
skin tone, accent (Iranian), displays of religious symbols, displays of ethnically
traditional clothing, generational status, and identification with an ethnicity other
than Iranian American?

37
CHAPTER 3
Southern California Context
Southern California was an excellent location in which to conduct the current
study. Most notably because of the significant presence and social/political representation
of Iranian Americans in the area. Most of the participants resided in LA or Orange
Counties (56%) and a significant number disclosed their residence as California alone
(30%). Therefore it is relevant in regard to the participants of the study to describe the
Southern California context. Los Angeles is home to the largest number of people of
Iranian descent outside of Iran. More specifically, Beverly Hills (Los Angeles County)
and Irvine (Orange County) have large populations of Iranian Americans. Iranian
Americans gained political visibility in 2007 and 2010 when Beverly Hills, Iranian
American, Mayor Jamshid Delshad was voted into office.
Southern California has a unique culture that may be accepting of immigrants and
their cultures. The Los Angeles Times described Southern California as a center for
cultural diffusion, referred to as a “melting pot”- with diverse communities and
neighborhoods that represent a number of ethnic and racial groups. More specifically,
according to the 2012 Census, Orange County is racially composed of: White (74.5%),
Black or African American (2.0%), American Indian and Alaska Native (1.1%), Asian
(18.9%), Native ʻan and other Pacific Islander (.4%), two or more races (3.2%), Hispanic
or Latino (34.1%), or White not Hispanic or Latino (43.1%). According to the 2012
Census, Los Angeles County is racially composed of: White (71.6%), Black or African
American (9.3%), American Indian and Alaska Native (1.5%), Asian (14.5%), Native ʻan
and other Pacific Islander (.4%), two or more races (2.8%), Hispanic or Latino (48.2%),

38
or White not Hispanic or Latino (27.3%). Thus, Iranian Americans may feel more
welcomed and comfortable in the Southern California context due to its diverse and
inclusive culture.
Los Angeles and Orange counties are financially affluent areas. The median
incomes are significantly higher than the nations average (OC, Mdn = 75,762, Century
City (West LA), Mdn = 95,135, Nation’s Average = 42,979.61). This does not suggest
that all individuals living in Los Angeles and Orange Counties are in higher income
brackets than individuals in the rest of the nation. However, there are substantial pockets
of wealth.
Los Angeles and Orange County are markedly different in regard to political
characteristics. According to the Public Affairs Alliance of Iranian Americans (2008),
only one out of every eight Iranian Americans identify as Republican, one out of every
two identify as Democrat, and one out of every four as independent. Orange County is
politically conservative while Los Angeles County inhabitants have voted democratically
for the last four decades.
The Iranian Americans surveyed represented a unique sample predominantly from
Southern California. That is to say that many participants did not display symbols of
religious affiliation. In addition there were not many visual markers of diversity within
the Muslim (e.g., Sunni vs. Shiite) or Jewish (e.g., Hasidic vs. Orthodox) participants in
the study.

39
Method
Demographics of the Sample: Frequencies and Descriptive Statistics
Gender. Participants were asked to identify their gender by choosing either man
or woman. The sample size totaled 374 adults (125 men, 249 women). A majority (67%)
of the sample identified as women and 33% identified as men. Participant answers were
coded as man = 0 and woman = 1.
Age. Participants were asked in a free response format to indicate their age.
Responses were categorized into the following age brackets: ages 18-27, 28-37, 38-47,
48-57, 58-67, and 67+. Participants ranged from the ages of 18 to 68. Most participants
were over 30 years of age (M = 38, Mdn = 35, SD = 11.670). More specifically
participant age ranges were as such: ages 18-27(5), 28-37(75), 38-47(137), 48-57(77),
58-67(60), and 67+(20).
Religious Affiliation. Participants were asked, “What is your religious affiliation?
Please write none if you have no religious affiliation.” Three of the 374 participants did
not disclose their religious affiliation. Participants identified as having no religious
affiliation (Men =52, Women = 55), Christian (Men =1, Women = 4), Jewish (Men = 24,
Women = 58), Muslim (Men = 34, Women = 115), Other (Men = 13, Women = 15), and
three individuals did not answer the question (Men = 1, Women = 2). Of the 371
participants, 40% identified as Muslim, 22% identified as Jewish, 1% identified as
Christian, 8% identified as other, and 29% reported having no religious affiliation.
However, due to the lack of Christian and “other” participants and also no research
interest in those groups, Iranian American Christians and those who identified as “other”

40
were not used in the statistical analyses used to explore the hypotheses and research
questions of the study. Answers were coded as 0 = none, 1 = Christian, 2 = Jewish,
3 = Muslim, and 4 = other.
Level of Education. Participants were asked to report their highest level of
education. Participants reported the following highest level of education completed: No
answer (9%), grade school (2%), high school (12%), vocational degree or certification
(4%), BA/BS (34%), MS/MA (24%), or PhD/MD (15%). Answers were coded as
1 = Grade school, 2 = High School, 3 = Vocational degree/Certification, 4 = BS/BA,
5 = MS/MA, or 6 = Ph.D./M.D.
Annual Income during Childhood. Participants were asked what their annual
household income was during most of their childhood. Participants reported the following
incomes: Under $17,000 (4%), $17,000-24,999 (5%), $25,000-49,999 (13%), $50,000-
99,999 (37%), and $100,000+ (41%). Answers were coded as 1 = Under $17,000, 2 =
$17,000-24,999, 3 = $25,000-49,999, 4 = $50,000-99,999, or 5 = $100,000.
Predictors
Ethnic Identity. Participants were asked, “Which one group best describes your
ethnic identity or the ethnic group with which you most strongly identify?” Participants
were given the options (coding used the same numbers): White = 1, White/Iranian = 2,
Middle Eastern = 3, Middle Eastern/Iranian = 4, Persian = 5, Iranian = 6, Iranian
American = 7, Other Fill in the Blank = 8. In descending order participants identified as
Persian (33%), Iranian American (22%), Iranian (17%), White/Iranian (17%), Middle
Eastern/ Iranian (5%), White (4%), Middle Eastern and Other (1%).

41
Iranian Subgroup Part A. Participants were asked, “Do you identify with any
other ethnic group besides Iranian American? (e.g., Azerbaijani, Afghani, Bahrani,
etc.)?” About 50% of the sample also identified with an additional sub-ethnic group other
than Iranian American. For example, there are subcultures in Iranian e.g., Turkish
Iranian. Although the group is of Iranian descent and primarily identifies as Iranian, they
also identify with the Turkish subculture in Iran. Answers were coded as no = 0 or
yes = 1.
Iranian Subgroup Part B. Participants were asked, “If answered no to question
3b (referenced above), skip to question 4. Do you believe that Iranian Americans from a
different region of Iran than yourself are treated significantly different from you in the
context of the U.S. by non-Iranian Americans?” Only 3.7% of participants answered
“yes.” Participant answers were coded as no = 0 or yes = 1.
Skin tone. Participants were asked, “Please select the skin color/tone that best
represents your skin color/tone. Indicate your choice by selecting the number associated
with the skin color/tone you choose. Write number here___” Skin tone was measured by
asking participants to rate their own skin complexion on The Fitzpatrick Scale (Daniel,
Heckman, Kloss, & Manne, 2009). The scale was created in 1975 and categorizes skin
types by reaction to UV light. The Fitzpatrick Scale (Daniel, Heckman, Kloss, & Manne,
2009) was utilized because it offered a description along with a visual depiction of the
skin color. In addition the scale is often used among dermatologists.
The majority of participants (61%) rated their skin tone as a four on the
Fitzpatrick Scale, which associates with “dark brown hair and green, hazel, brown eyes”
(SD = .85). Only 1% indicated a one rating, 5% indicated a rating of two, 11% indicated a

42
three, 18% indicated a five, and 4% indicated a six. Skin color/tone was coded the same
way the Fitzpatrick Scale denoted it’s categories. Skin color/tone became darker as
numbers increased from 1-6.
Skin Lightening. Participants were asked, “Have you ever used/undergone a skin
lightening product/procedure (for the purposes of lightening your skin color/tone)?” An
overwhelming majority of participants (99%) reported never having under-gone a skin
lightening procedure. Answers were coded as no = 0 and yes = 1.
Willingness to Lighten Skin. Participants were asked, “Would you ever
use/undergo a skin lightening product/procedure (for the purposes of lightening your skin
color/tone)?” Answers were coded as no=0 and yes=1. A majority, 98% reported they
would never undergo a skin lightening procedure. Answers were coded as no = 0 and
yes = 1.

43
Accent. Participants were asked, “Do you consider yourself to have an Iranian
Accent when speaking English?” Participants reported whether or not they had an Iranian
accent on a 7 item scale. In descending order: 32% reported “Not at all,” 17% reported
“moderate,” 15% reported “mild,” 13% reported a two (between “Not at all” and “mild”),
12% reported a six (between “moderate” and “acute”), only 6% reported having an
“acute” accent, and 5% reported a four (between “mild” and “moderate”) (SD = 2.05).
Answers were coded from 1-7 ranging from 1 = Not at all to 7 = Acute.
Immigration Status. Participants were asked, “How old were you when you
immigrated to the U.S.? Or were you born in the U.S.?” The majority of participants were
born outside of the U.S. (82%) while a minority was born in the U.S. (18%). Answers
were coded as 0 = Born in the U.S., 1= Born out of the U.S.
Generational Status. Participants were asked, “How many generations has your
family been in the U.S.?” When asked about generational status in the U.S. participants
wrote in the following responses: 81% “born out of the country,” 14% “first generation,”
4% “second generation,” and 1% “third generation”. Answers were coded as 0 = born out
of the country, 1 = first generation, 2 = second generation, and 3 = third generation. For
many of the analyses answers were coded as 0 = born out of the country and 1 = born in
the U.S.
Symbols of Religious Affiliation. Participants were asked, “Do you wear symbols
of your religious affiliation? (e.g., Cross, Yarmulke, Turban, Scarf, etc.).” Most
participants reported “never” displaying religious symbols (70%). While 27% of
participants reported “sometimes” displaying religious symbols and only 3% of

44
participants reported always displaying religious symbols. Answers were coded as
Never=1, Sometimes=2, or Always=3. For many of the analyses answers were coded as
0 = never and 1 = sometimes or always.
Symbols of Religious Affiliation. Open Format. Participants were asked how
often, if ever, they display symbols of religious affiliation. Participants were given a free
response format. The majority of participants reported “never” (72%). All other
participant responses were placed into eleven categories based on self-reports: seldom,
religious event, twice a year, once a year, once a month, twice a month, sometimes,
weekly, twice a week, daily, always, or 99. Each category of those displaying a symbol
included less than 4% of the sample. Answers were coded as, never=0, seldom=1,
religious event=2, twice a year=3, once a year=4, once a month=5, twice a month=6,
sometimes=7, weekly=8, twice a week=9, daily=10, or always=11.
What Religious Symbols. Participants were asked what kinds of religious
symbols they wear, in a free-response format. The 30% of participants who reported
displaying symbols of religious affiliation were asked “what religious symbols” they
display. The majority reported wearing a scarf/hijab (15%). Participants also reported
displaying the Star of David (3%), a Yarmulke (2%), a Faravahar (symbol of
Zoroastrianism) (1%), an Allah necklace (1%), or jewelry (5%). Less than 2% of
participants reported displaying: a Kara (steel bangle worn by Sikhs) (.3%), Evil eye
jewelry (.3%), a Cross (.3%), a beard (.3%), Islamic Stone (.3%), or a Tasbih (.5%).
Answers were coded as: 1=scarf/hijab, 2= Star of David, 3=Yarmulke, 4=Faravahar
(symbol of Zoroastrianism), 5=Allah necklace, 6=Jewelry, 7=Kara (steel bangle

45
traditional worn by Sikhs), 8=Evil eye (non-religious), 9= Christian Cross, 10=Beard,
11=Islamic stone, 12=Tasbih.
Ethnically Traditional Clothing. Participants were asked, “Do you wear
ethnically traditional clothing? (e.g., clothing worn in non-urban areas of Iran such as
Mahali clothing)?” The majority (94%) of participants reported “never” wearing
ethnically traditional clothing. A small percentage of participants (6%) reported
“sometimes” wearing ethnically traditional clothing. No participants reported “always”
wearing ethnically traditional clothing. Answers were coded as Never=1, Sometimes=2,
or Always=3. However, for the purposes of the multiple regression those who displayed
ethnically traditional clothing were coded as 1, and those who did not were coded as 0.
Ethnically Traditional Clothing. Free Response. The 6% of participants who
reported “sometimes” wearing ethnically traditional clothing were asked an open ended
question of how often they did so. Answers were then placed in the following categories:
seldom (2%), Halloween (1%), ethnic/cultural event (2%), once a month (1%), or very
often (1%). Answers were categorized and coded as, 0= never, 1=seldom, 2=Halloween,
3=ethnic/cultural event, 4=once a month, or 5=very often.
What Ethnically Traditional Clothing. Free Response. Participants who reported
(6%) wearing ethnically traditional clothing were asked a free response question of what
kind of ethnically traditional clothing they wear. Responses were placed in the following
categories: thobe/dishdasha (.3%), mahali dress (1.1%), colorful scarf (.8%),
scarfs/jewelry (.3%), or bags/scarves/jewelry/skirt (1.6%). Answers were coded as
Responses were placed in the following categories: 1= thobe/dishdasha, 2 = mahali dress,
3 = colorful scarf, 4 = scarfs/jewelry, or 5 = bags/scarves/jewelry/skirt.

46
Occupation. Participants were asked, in a free response format, to report their
occupation. Participants reported their occupation in a free response format. Responses
were placed into the following categories: White collar (84%), blue collar (1%),
homemaker (10%), or other (5%). Answers were coded as 1=white collar, 2=blue collar,
3=homemaker, or 4=other.
Father’s Occupation. Participants were asked, in a free response format, to report
their father’s occupation. Responses were placed in the following categories: White collar
(75%), blue collar (3%), army (8%), or other (14%). Responses were coded as 1 = white
collar, 2 = blue collar, 3 = army, or 4 = other.
Mother’s Occupation. Participants were asked, in a free response format, to
report their mother’s occupation. Participants’ mother’s occupation was placed in the
following categories: White collar (36%), blue collar (0%), homemaker (35%), or other
(29%). Responses were coded as 1 = white collar, 2 = blue collar, 3 = homemaker, or
4 = other.
Geographic Location. Participants were asked to report their geographic location.
Participant responses were placed in the following categories: Los Angeles, CA (28%),
Orange County, CA (28%), California (30%), Orange County or Los Angeles (1%), or
other (13%). Participant responses were coded as 1 = Los Angeles, 2 = Orange County,
3 = California, 4 = Orange County or Los Angeles, or 5 = Other.
Participants: Recruitment
Participants were recruited using snowball and purposive sampling Please see
Appendix D. I collaborated with the Persian American Society for Health Advancement
(PASHA – a non-religious organization which includes Jewish, Muslim, and Iranian

47
Americans with various religious affiliations) and used media outlets to recruit
participants. Surveys were conducted on SurveyMonkey.com and available via
Facebook.com and LinkedIn.com. I also recruited participants at Iranian grocery stores
on Westwood Blvd. in West Los Angeles (March 9th
and March 16th
).
Initially an invitation to distribute and complete the survey was emailed to the
following Iranian American organizations: University of Maryland Iranian Student
Foundation, Persian American Association of Northern California, Iranian-American
Women’s Foundation, Persian Student Association at Stanford University, Iranian
Student Alliance in America at UC Berkeley, Association of Professors & Scholars of
Iranian Heritage, Iranian Students Association at Arizona State University, Pars Times,
Iranian-American Cultural Association of Missouri, Iranian American Bar Association,
Persian Academic & Cultural Student Association at the University of Southern
California, and The Persian American Society for Health Advancement. It is unclear
which organizations distributed the survey link. An invitation was sent out to the
aforementioned organizations a couple of times. The content of the email is provided
below:
“Hello,
My name is Shahrzad Yousefinejad. I am a Ph.D. candidate working under
the supervision of Dr. Elaine Hatfield at the University of Hawaiʻi,
Mànoa. I am conducting my doctoral study on Iranian American
perceptions. I am experiencing a challenge recruiting Iranian
Americans (18 years and older) to take my survey online. I was wondering if your
organization could help me distribute my survey among the Iranian American
community. Below is the link to my survey:
https://www.research.net/s/IranianAmericanPerceptions
Any input or guidance from your organization is greatly appreciated!

48
Many many thanks,
Shahrzad”
I also wrote invitations to Synagogues. The following Synagogues were
contacted: Chabad of Bel Air, Beth Jacob Congregation, Congregation Magen David of
Beverly Hills, Young Israel of North Beverly Hills, LeoBaeck Temple, and University
Synagogue. The aforementioned synagogues were emailed because they are located in or
around the Beverly Hills area. According to NPR (2006), 20% of individuals living in
Beverly Hills are Iranian American and 40% of students who attend schools in the area
are Iranian American.
It is unclear which organizations distributed the survey link. The emails were sent
on 02/13/2013. The synagogues were emailed the following message:
“Hello,
My name is Shahrzad Yousefinejad. I am a Ph.D Candidate at the University of
Hawaiʻi, Mânoa, under the advisement of Dr. Elaine Hatfield. I moved back to
Southern California to conduct my doctoral study.
I am contacting you in hopes of gaining your guidance and help. The topic of my
dissertation is on the complex identity of Iranian Americans. There is a dearth of
research on the social identity of Iranian Americans. I would like to demonstrate
the diversity within the Iranian American community, by surveying their
perceptions and opinions, in exploration of their experiences with prejudice and
discrimination.
It is of great importance that the Iranian American Jewish voice is included in my
work. I personally have no religious affiliation and am experiencing a challenge
entering any religious community. I am wondering if you would be willing to
work with me to distribute and encourage Iranian American Jewish participation.
I have provided my survey link below:
https://www.research.net/s/IranianAmericanPerceptions
Please let me know if you would like any further information. I am happy to
converse by email, phone (949)280-7648, or in-person. Thank you for your time
and consideration.

49
Warmest regard,
Shahrzad “
Next, I contacted individuals with ethnically Iranian names with an invitation to
complete the survey, via LinkedIn.com. Individuals were recruited because the website
suggested that I may be acquainted with them. However, I did not know the individuals
in any shape or form. The emails were sent between 11/14/2012-12/18/2013. It is unclear
which individuals completed or distributed the survey link. The message was as follows:
“Aloha!
Do you identify as Iranian American? Have you ever thought about how you are
portrayed or understood in the social sciences? There is a dearth of research out
there on your group! My name is Shahrzad Yousefinejad and I am a Ph.D.
Candidate at the University of Hawaiʻi, Mânoa- working under the advisement of
Dr. Elaine Hatfield. Please take this opportunity to voice your opinion by
completing an online survey. You need not identify yourself and the survey is
confidential! The survey link is provided below. Thank you for your time!”
Lastly, participants were approached at two ethnically Persian (Iranian) grocery
stores on Westwood Blvd. in West Los Angeles, CA, on March 9th
and March 16th
. The
two grocery stores were Jordan Market and Super Sun. Of the 374 participants, 58% were
recruited online and 42% were recruited in person. I approached individuals I perceived
to appear Iranian American. I spoke to them in Farsi and asked if they would like to take
a survey. Everyone I approached was in fact Iranian American.
Online/In-Person Survey: Procedure
The survey was conducted on Surveymonkey.com and in-person with paper and
pen. The researcher recruited participants from grocery stores two weeks prior to Persian
New Years because many Iranian Americans shop for groceries prior to the New Year.
Participants were asked to agree to the terms of the survey on a consent form and indicate

50
their understanding of the form by marking an X. I approached participants by
introducing myself in Farsi. They were approached outside of the grocery store on public
property. Many of the participants asked that I read the questions out loud in English and
sometimes translate questions into Farsi.
Participants who were recruited online were provided with a link to the survey on
Surveymonkey.com. Initially, participants were required to answer whether or not they
consented to taking the survey and understood their rights. Participants who did not agree
were directed to a Thank You page. Participants who agreed to the consent form were
able to complete the survey online.
Online/In-Person Survey: Apparatus/Materials
The materials for the online/in-person survey included a consent form. Please see
Appendix E. In addition to a survey packet that included the following scales: 1) An
adaptation of the Ethnic Harassment Experiences Scale (EHES) (Schneider, Hitlan, &
Radhakrishnan, 2000), 2) An adaptation of the Social Distance Scale (Bogardus, 1959),
3) a brief religiosity scale (Allport & Ross, 1967) and 4) a demographic questionnaire (in
which a number of one-item Qs were included- such as: questions designed to assess
gender, age, ethnic identity, sub-ethnic identity (if any), treatment of those who affiliate
with a sub-ethnic identity, religious affiliation, skin tone/color, whether or not they have
or would undergo skin lightening procedures, foreign accent, age of immigration,
generational status, displays of religiously symbolic clothing, displays of ethnically
traditional clothing, highest level of education, family income during childhood,
occupation, father’s occupation, mother’s occupation, and geographic location). The
demographic questionnaire one-item questions were described above in the

51
Demographics and Predictors sections. The order in which the 1) Ethnic Harassment
Experiences Scale (EHES) (Schneider, Hitlan, & Radhakrishnan, 2000), 2) Social
Distance Scale (Bogardus, 1959) and, 3) brief religiosity scale (Allport & Ross, 1967)
were presented to participants was randomized in the maximum number of ways to
control for ordering effects. Please see Appendix F for the survey packet.
1. The Ethnic Harassment Experiences Scale (Schneider et al., 2000). The alpha
level for The Ethnic Harassment Experiences Scale was .80. Please see Appendix G for
more information on the statistical reliability and validity of the EHES. The EHES asked
participants to rate experiences with ethnic harassment within the last 24 months, on a
scale ranging from 1 (never) to 3 (almost always).
The questions were as follows: 1) Someone made derogatory comments about
your ethnicity. 2) Someone used ethnic slurs to describe you. 3) Someone made racist or
prejudiced comments about you or your ethnicity. (For example saying people of your
ethnicity aren’t very smart). 4) Someone tells jokes about your ethnic group. And 5)
Someone excludes you from social interactions because of your ethnicity. Please see
Table 3 below.
Table 3. Adapted EHES Statements
1) Someone made derogatory comments about your ethnicity.
2) Someone used ethnic slurs to describe you.
3) Someone made racist or prejudice comments about you or your ethnicity.
(For example says people of your ethnicity aren’t very smart, are terrorists, etc.)
4) Someone tells jokes about your ethnic group.
5) Someone excludes you from social interactions because of your ethnicity.
(Schneider, Hitlan, & Radhakrishnan, 2000)

52
More specifically, the scale measured frequency of harassment and incidents of
marginalization. The researcher in the current study used five items adapted to the
Iranian American identity. Participant responses were coded as such: 1 = never,
2 = sometimes, and 3 = always. On average participants reported experiencing ethnic
harassment in following ways: Never (81%), Sometimes (18%), Always (1%) (M = 1.47,
SD = .41). Higher numbers indicated higher degrees of perceived ethnic harassment.
2. The Social Distance Scale. The alpha level for The Social Distance Scale
was, α = .82 (Angermeyer, Matschinger, & Corrigan, 2003). Please see Appendix H
for additional information on the Social Distance Scale (Bogardus, 1959). I chose to
include the Social Distance Scale in my survey packet to measure the perceived
degree of sympathetic understanding between non-Iranian Americans and Iranian
Americans (from the Iranian American perspective). In this context, sympathy is
defined as an emotional or behavioral response that is positive or in the best interest
of another person or group of persons.
The questions on the adapted scale ranged from: 1) Do you believe Euro-
Americans would marry into the Iranian-American group? 2) Do you believe Euro-
Americans would like to work in the same office with Iranian Americans? – to 3) Do you
believe Euro-Americans would like to debar Iranian Americans from the U.S.? Please see
Table 4 below, for the adapted Social Distance Scale (Bogardus, 1959).

53
Table 4. Social Distance Scale
1. Do you believe Euro-Americans would marry into the Iranian-American
group
Yes, no
2. Do you believe Euro-Americans would like Iranian-Americans as close
friends
Yes, no
3. Do you believe Euro-Americans would like Iranian-Americans as next
door neighbors
Yes, no
4. Do you believe Euro-Americans would like to work in the same office
with Iranian-Americans
Yes, no
5. Do you believe Euro-Americans would like Iranian-Americans as
speaking acquaintances only
Yes, no
6. Do you believe Euro-Americans would like Iranian-Americans as
visitors only to the U.S.
Yes, no
7. Do you believe Euro-Americans would like to debar Iranian Americans
from the U.S.
Yes, no
(Bogardus, 1959)
The Social Distance Scale (Bogardus, 1959) uses a seven-point Likert scale. A
Likert scale assumes that the items on the questionnaire are equidistant from one another.
In the Social Distance Scale (Bogardus, 1959) agreeing to an item suggests that the
participant agrees with prior items. The adapted version of the Social Distance Scale used
in the current study examines Iranian American perceptions of prejudice from Euro
Americans. Thus the more items, further along the list of questions, an individual agrees
with, the more social distance they perceive from Euro Americans. Participants were able
to answer each question with either a yes or no. Questions 1-4 were coded as no = 1 and
yes = 0. Questions 5-7 were coded as no = 0 and yes = 1. On average participants
reported a high level of social distance (14%), medium level of social distance (9%), and

54
little to no social distance (77%) (M = .25, SD = .29). Higher numbers indicated higher
rates of perceived social distance.
3. The Brief Religiosity Scale. The alpha level for the first cluster of the
religiosity scale was, α = .81, and α =.87 for the second cluster (Gryczynski & Ward,
2012). The scale determined how important religion was to the individual. Questions
ranged from “How would you respond to the statement: ‘Religion provides the individual
with an interpretation of his existence which could not be discovered by reason alone.’”
And “Faith, meaning putting full confidence in the things we hope for and being certain
of things we cannot see, is essential.” To “My religion is unimportant to my sense of
what kind of person I am.”
Higher numbers indicate a higher level of religiosity. Participant answers to
questions 1-3 were coded as such: Disagree=1, Agree=2, Strongly agree=3. Questions 4-
7 were coded the same way but reverse coded to ensure that higher numbers indicated a
higher level of religiosity.
Participants completed two parts to the Religiosity Scale. The first religiosity
scale revealed the following reports: Very religious (13%), Somewhat religious (38%), or
not religious (48%) (M = 1.87, SD = .70). The second religiosity scale revealed the
following: Very religious (17%), somewhat religious (47%), or not religious (36%)
(M = 2.07, SD = .73). Higher numbers indicated a higher degree of religiosity.

55
CHAPTER 4
Results
I conducted a number of statistical analyses to explore the findings of the research
questions. Below is an outline of the way in which the results are organized. I began with
my first research question 1) Does gender and/or religious affiliation (no religious
affiliation, Jewish, or Muslim) affect Iranian American perceptions of experienced ethnic
harassment from Euro Americans? Initially raw averages were presented, organized by
gender and religious affiliation. I also reported percentages of individuals by gender and
religious affiliation that perceived experiences of ethnic harassment. Percentages are
illustrated in Table I5 (please see Appendix I). I also conducted a 2 (gender) x 3
(religion) between groups ANOVA along with associated t-tests to see if there were any
significant differences. The results of the ANOVA are illustrated in Figure M1 (please
see Appendix M).
I was also interested in testing the predictive ability of a number of variables on
perceptions of experienced ethnic harassment. I conducted a multiple linear regression
using the following predictors: No religious affiliation, Jewish identity, Muslim identity,
gender, skin tone (color), Iranian accent, displays of religious affiliation, ethnically
traditional clothing, generational status, sub-ethnic identification (other than Iranian
American), or family income. The results of the multiple linear regression are displayed
in Table J6 (see Appendix J). Next, I explored the predictive ability of the
aforementioned variables while taking into consideration religious affiliation. I split the
file by religion and re-examined the multiple linear regression results.

56
I conducted statistical analyses on Iranian American perceptions of social distance
from Euro Americans. My research question was, does gender and/or religious affiliation
(no religious affiliation, Jewish, or Muslim) affect Iranian American perceptions of social
distance from Euro Americans? Initially I presented raw averages organized by gender
and religious affiliation. I also reported percentages of individuals by gender and
religious affiliation that perceived social distance from Euro Americans. Percentages are
illustrated in Table K7 (please see Appendix K). I also conducted a 2 (gender) x 3
(religion) between groups ANOVA along with associated t-tests to explore whether or
not there were any significant differences. The results are illustrated in Figure N2 (please
see Appendix N).
I was also interested in testing the predictive ability of a number of variables on
perceptions of social distance. I conducted a multiple linear regression using the
following predictors: Jewish identity, Muslim identity, gender, skin tone (color), Iranian
accent, displays of religious affiliation, ethnically traditional clothing, generational status,
sub-ethnic identification (other than Iranian American), or family income. The results of
the multiple linear regression are displayed in Table L8 (please see Appendix L). Next, I
explored the predictive ability of the aforementioned variables while taking into
consideration religious affiliation. I split the file by religion and re-examined the multiple
linear regression results.
I analyzed the effect of religiosity on perceptions of experienced ethnic
harassment and social distance from Euro Americans. I initially reported averages by
gender and religious affiliation. I also explored statistical issues with the scale and
reported results of a factor analysis. I used two approaches in analyzing the religiosity

57
measure. The first approach justified no further analysis using the measure. The second
approach identified two distinct factors, 1) experiential and 2) personal religiosity. An
Exact Factor score was calculated for both dimensions of religiosity and multiple
regressions were conducted using perceived ethnic harassment and perceptions of social
distance as dependent variables. Lastly, I conducted additional analyses taking into
account religious affiliation.
I investigated whether or not there was an underlying latent construct within the
measured variables of: skin tone, accent (Iranian), displays of religious symbols, displays
of ethnically traditional clothing, generational status, and identification with an ethnicity
other than Iranian American. I conducted an exploratory factor analysis (EFA) using a
maximum likelihood method and a direct oblimin rotation with Kaiser normalization. I
go onto explain why one sole latent variable was not revealed.
I. Does gender and/or religious affiliation (no religious affiliation, Jewish, or Muslim)
affect Iranian American perceptions of experienced ethnic harassment from Euro
Americans?
I initially calculated averages and standard deviations to explore the relationship
between gender and religious affiliation in regard to perceptions of experienced ethnic
harassment. There was a difference between men and women on average scores on the
Ethnic Harassment Scale (Men = 1.51, SD = .41; Women = 1.45, SD = .41). The average
scores on the Ethnic Harassment Scale were as follows among participants who had no
religious affiliation (M = 1.48, SD = .40), identified as Jewish (M = 1.48, SD = .47), or
identified as Muslim (M = 1.45, SD = .39). Please see Table I5 (please see Appendix I)

58
for percentages of individuals (categorized by gender and religious affiliation) that
perceived experiences of ethnic harassment.
I conducted an ANOVA to explore whether or not there was a significant effect of
gender and/or religion on perceptions of ethnic harassment. More specifically I conducted
a 2 (gender) x 3 (religion) between subjects ANOVA that revealed an interaction between
gender and religion (F(1, 2, 332 ) = 3.181, p = .043), no significant effect of gender
(F(1, 332) = .358,p = .550) and no significant effect of religion (F(2, 332) = .257,
p = .774). The results are illustrated on Figure M1 (please see Appendix M).
A t - test revealed a significant difference between the degree of ethnic
harassment perceived by Iranian American Muslim men vs. their female counterparts.
Iranian American Muslim men were more likely to report perceived experiences of ethnic
harassment than Iranian American Muslim women, t(332) = 2.60, p = .010.
Gender. Religion. A t- test revealed that neither gender nor religion significantly
predicted perceived experiences of ethnic harassment among Iranian Americans with no
religious affiliation, Jews, or Muslims.
Hypothesis I. Iranian American Muslims will report higher rates of
perceived experiences of ethnic harassment and social distance from Euro
Americans than their non-Muslim peers (be they Jewish or possessing no
religious affiliation).
II. Are Iranian American perceptions of experienced ethnic harassment from Euro
Americans within the full sample predicted by, Jewish identity, Muslim identity,
gender, skin tone (color), Iranian accent, displays of religious affiliation, ethnically

59
traditional clothing, generational status, sub- ethnic identification (other than
Iranian American), or family income?
I conducted a multiple linear regression to test the predictive strength of the
following factors: Islamic identity, Jewish identity, skin tone (color), Iranian accent,
displays of religious affiliation, ethnically traditional clothing, generational status, sub-
ethnic identification (other than Iranian American), or family income – on average
reports of perceived experiences of ethnic harassment. Please see Table J6 (please see
Appendix J). The results are enumerated below:
Jewish Identity. Identifying as Jewish significantly predicted higher rates of
perceived experiences of ethnic harassment among Iranian Americans,
β = .159, t(330)= 2.152, p = .032.
Muslim Identity. Gender. Neither identifying as Muslim nor gender significantly
predicted perceiving experienced ethnic harassment among Iranian Americans. This fails
to support Hypothesis I.
Skin tone. Having lighter skin tones significantly predicted perceptions of higher
rates of experiences of ethnic harassment, β = -.045 t(330)= -2.543, p = .011. This fails to
support Hypothesis II.
Accent. More acute Iranian accents significantly predicted higher rates of
perceived experiences of ethnic harassment, β = .151 t(330) = 2.377, p = .018.
Displays of religious affiliation. Ethnically traditional clothing. Generational
status. Whether or not a participant displayed symbols of religious affiliation, displayed
ethnically traditional clothing, nor their generational status significantly predicted higher
rates of perceived experiences of ethnic harassment. This fails to support Hypothesis II.

60
Sub-Ethnic Group. Identifying with an ethnicity other than Iranian American
significantly predicted higher rates of perceived experiences of ethnic harassment,
β = .226, t(330) = 3.164, p = .002. However, it is important to note that 96% of these
participants reported that they did not feel that Euro Americans treated Iranian Americans
from other regions any different from how they treated them.
Family income during childhood. Lower family income during childhood
significantly predicted higher rates of perceived experiences of ethnic harassment,
β = -.209, t(330) = -3.732, p = <.001.
Hypothesis II. Iranian American Muslims who appear prototypically
Muslim (displaying scarf/hijab, Allah necklace, a beard, Islamic stone, or a
Tasbih), will report higher rates of perceived experiences of ethnic
harassment and social distance from Euro Americans than will Iranian
American Muslims whose appearance is more prototypically Euro-American
(or non-Muslim).
III. Are Iranian American perceptions of experienced ethnic harassment from Euro
Americans within each religious subsample (Iranian Americans: no religious
affiliation, Jewish, Muslim) predicted by, gender, skin tone (color), Iranian accent,
displays of religious affiliation, ethnically traditional clothing, generational status,
sub-ethnic identification (other than Iranian American), or family income?
I conducted a multiple linear regression and compared religious affiliation to test
the predictive strength of the following factors: skin tone (color), accent (Iranian),
displays of religious affiliation, ethnically traditional clothing, generational status, sub-
ethnic identification (other than Iranian American), or family income – on average

61
perceptions of experienced ethnic harassment within religious subgroups (no religious
affiliation, Jewish, Muslim). The results are enumerated below:
Gender.
Gender. No Religious Affiliation. Gender did not significantly predict perceptions
of ethnic harassment among Iranian Americans with no religious affiliation.
Gender. Jewish. Muslim. Iranian American Jewish women were more likely to
rate higher levels of perceived ethnic harassment than Iranian American Jewish men,
β = .273, t(330) = 2.852, p = .006. Iranian American Muslim men reported higher rates of
perceived ethnic harassment than Iranian American Muslim women,
β = -.219, t(330)= -2.323, p = .022.
Skin tone.
Skin tone. No Religious Affiliation. Skin tone did not significantly predict
perceptions of ethnic harassment among Iranian Americans with no religious affiliation.
Skin tone. Jewish. Muslim. Among both Iranian American Jews,
β = -.258, t(330) = -2.618, p = .011, and Iranian American Muslims,
β = -.308, t(330) = -3.654, p = <.001, those who reported having lighter skin tones were
more likely to perceive higher rates of experienced ethnic harassment than those with
darker skin tones. This fails to support Hypothesis II.
Accent.
Accent. No Religious Affiliation. Muslim. Accent did not significantly predict perceptions
of ethnic harassment among Iranian Americans with no religious affiliation and Muslims.
This fails to support Hypothesis II.

62
Accent. Jewish. Iranian American Jews with more acute accents reported higher
rates of perceived ethnic harassment than Iranian Americans Jews with little to no accent,
β = .462, t(330) = 4.214, p= <.001.
Symbols of Religious Affiliation.
Symbols of Religious Affiliation. No Religious Affiliation. Muslim. Displaying
symbols of religious affiliation did not significantly predict perceptions of ethnic
harassment among Iranian Americans with no religious affiliation and Muslims. This
fails to support Hypothesis II.
Symbols of Religious Affiliation. Jewish. Iranian American Jews who displayed
symbols of religious affiliation reported perceiving higher rates of ethnic harassment than
those who did not, β = .255, t(330) = 2.570, p = .012.
Ethnically Traditional Clothing.
Ethnically Traditional Clothing. No Religious Affiliation. Jewish. Muslim.
Displays of ethnically traditional clothing did not predict perceptions of ethnic
harassment among Iranian Americans with no religious affiliation, Jews, or Muslims.
Generational Status.
Generational Status. No Religious Affiliation. Jewish. Muslim. Generational status
did not significantly predict perceptions of ethnic harassment among Iranian Americans
with no religious affiliation, Jews, or Muslims.
Sub-Ethnic Group.
Identifying with a Sub-Ethnic Group. No Religious Affiliation. Identifying with a
sub-ethnic group other than Iranian did not significantly predict reports of ethnic
harassment among Iranian Americans with no religious affiliation.

63
Identifying with a Sub-Ethnic Group. Jewish. Muslim. Identifying with a sub-
ethnic group other than Iranian significantly predicted higher rates of perceived ethnic
harassment among Iranian American Jews, β = .315, t(330) = 3.044, p = .003, and
Muslims, β = .193, t(330) = 1.992, p = .048. However, it is important to note that 96% of
these participants reported that they did not feel that Euro Americans treated Iranian
Americans from other regions any different from how they treated them.
Family Income during Childhood.
Family Income during Childhood. No Religious Affiliation. Jewish. Muslim.
Family income during childhood significantly predicted reports of ethnic harassment
among Iranian Americans with no religious affiliation (only),
β = -.233, t(329) = -2.35, p = .022.
IV. Does gender and/or religious affiliation (no religious affiliation, Jewish, or
Muslim) affect Iranian American perceptions of social distance from Euro
Americans?
I initially calculated averages and standard deviations to explore the relationship
between gender and religious affiliation in regard to perceptions of social distance from
Euro Americans. Scores on the Social Distance Scale for men and women were, Men =
.21, SD = .29; Women = .25, SD = .29. The average scores on the Social Distance Scale
were as follows among participants who had no religious affiliation, M = .20,
SD = .27, Jewish M = .34, SD = .34, Muslim M = .23, SD = .28. Please see Table K7
(please see Appendix K) for percentages of individuals (categorized by gender and
religious affiliation) that reported perceptions of social distance.

64
I conducted an ANOVA to explore whether or not there was a significant effect of
gender and/or religion on perceptions of social distance from Euro Americans. More
specifically I calculated a 2 (gender) x 3 (religion) between subjects ANOVA that
revealed a significant main effect of religion, F(2, 332) = 3.500, p = .031, no significant
effect of gender, F(1, 332) = .1.148, p = .285, and no significant interaction between
gender and religion, F(1, 2, 332) = 1.268, p = .283. The results are illustrated on Figure
N2 (please see Appendix N).
Fisher’s Least Significant Difference. LSD. A post hoc LSD test revealed that
Iranian American Jews reported higher rates of perceived social distance from Euro
Americans than Iranian Americans with no religious affiliation and Iranian American
Muslims,
(difference in means = .1433, SE = .0426, p = .009, dfs = 2, 332):
(difference in means = .1060, SE = .0399, p = .008, dfs = 2, 332).
Fisher’s Least Significant Difference. Iranian Americans with no religious
affiliation reported perceiving significantly less social distance from Euro Americans
than Iranian American Jews (Mean differences = -.1433, p = .001).
Gender. A t-test revealed that gender did not significantly predict perceptions of
social distance from Euro Americans among Iranian Americans with no religious
affiliation, Jews, or Muslims.
Hypothesis I. Iranian American Muslims will report higher rates of
perceived experiences of ethnic harassment and social distance from Euro
Americans than their non-Muslim peers (be they Jewish or possessing no
religious affiliation).

65
V. Are Iranian American perceptions of social distance from Euro Americans
within the full sample predicted by Jewish identity, Muslim identity, gender, skin
tone (color), Iranian accent, displays of religious affiliation, ethnically traditional
clothing, generational status, sub-ethnic identification (other than Iranian
American), or family income?
I conducted a multiple linear regression to test the predictive strength of the
following factors: Islamic identity, Jewish identity, gender, skin tone (color), Iranian
accent, displays of religious affiliation, ethnically traditional clothing, generational status,
sub-ethnic identification (other than Iranian American), or family income – on average
reports of perceived social distance from Euro American. Please see Table L8 (please see
Appendix L). The results are enumerated below:
Jewish Identity. Muslim Identity. Gender. Skin tone. Jewish identity, Muslim
identity, gender, and skin tone did not significantly predict perceptions of social distance.
This fails to support Hypothesis I.
Accent. Iranian Americans with more acute accents were more likely to perceive
a higher degree of social distance from Euro Americans than those with little to no
accents, β = .143, t(330) = 2.281, p = .023.
Symbols of Religious Affiliation. Iranian Americans who displayed symbols of
religious affiliation were significantly more likely to perceive a higher degree of social
distance from Euro Americans than those who did not, β = .174, t(330) = 2.912, p = .004.
Ethnically Traditional Clothing. Generational Status. Sub-Ethnic Group.
Income during childhood. Displays of ethnically traditional clothing, generational status,

66
identifying with a sub-ethnic group, and income during childhood did not significantly
predict perceptions of social distance.
Hypothesis II. Iranian American Muslims who appear prototypically
Muslim (displaying scarf/hijab, Allah necklace, a beard, Islamic stone, or a
Tasbih), will report higher rates of perceived experiences of ethnic
harassment and social distance from Euro Americans than will Iranian
American Muslims whose appearance is more prototypically Euro-American
(or non-Muslim).
VI. Are Iranian American perceptions of social distance from Euro Americans
within each religious subsample (Iranian Americans: no religious affiliation, Jewish,
Muslim) predicted by, gender, skin tone (color), Iranian accent, displays of religious
affiliation, ethnically traditional clothing, generational status, sub-ethnic
identification (other than Iranian American), or family income?
I conducted a multiple linear regression comparing religious affiliation to test the
predictive strength of the following factors: skin tone (color), Iranian accent, displays of
religious affiliation, ethnically traditional clothing, generational status, sub-ethnic
identification (other than Iranian American), or family income – on perceived social
distance from Euro Americans. The results are enumerated below:
Gender. Skin tone. No Religious Affiliation. Jewish. Muslim.
Neither gender nor skin tone significantly predicted perceptions of social distance
from Euro Americans among Iranian Americans with no religious affiliation, Jews, or
Muslims. This fails to support Hypothesis II.

67
Accent. Displays of Religious Affiliation.
Neither accent nor displays of religious affiliation significantly predicted
perceptions of social distance from Euro Americans among Iranian Americans with no
religious affiliation or Muslims. This fails to support Hypothesis II.
However, Iranian American Jews with more acute accents perceived higher
degrees of social distance from Euro Americans than those with little to no accent,
β = .501, t(330) = 4.189, p = <.001.
In addition, Iranian American Jews who displayed symbols of religious affiliation
perceived higher degrees of social distance from Euro Americans than those who did not,
β = .300, t(330) = 2.776, p = .007.
Ethnically Traditional Clothing. Generational Status. Sub-Ethnic Group.
Family Income.
None of the following factors: displaying ethnically traditional clothing,
generational status, identifying with a sub ethnic group, nor family income during
childhood- significantly predicted perceived social distance from Euro Americans among
Iranian Americans with no religious affiliation, Jews, or Muslims.
VII. Does religiosity affect perceptions of experienced ethnic harassment and/or
perceived social distance from Euro Americans among Iranian Americans?
Approach I. The Religiosity Scales had good internal reliability with Cronbach’s
alphas for the three item Religiosity Scale and four item Religiosity Scale of.81 and .87.
The Cronbach’s alpha for the combination of both sets of scores was .52. The average
scores on Religiosity Scales One and Two were as follows: Men = 1.92, SD = .77;
Women = 1.84, SD = .65; Men = 1.86, SD = .74; Women = 2.19, SD = .70. The average

68
scores on Religiosity Scales One and Two were as follows among participants who had
no religious affiliation, M = 2.16, SD = .72; M = 1.43, SD = .55), Jewish
(M = 1.57, SD = .65; M = 2.58, SD = .36), Muslim (M = 1.83, SD = .61; M = 2.25,
SD = .66).
The Religiosity Scales also had good construct validity with Iranian American
Jews and Iranian American Muslims (Jews = 2.43, Muslims = 2.17) having higher mean
scores than Iranian Americans with no religious affiliation (M = 1.84).
Religiosity items 1-3 and items 4-7 clustered together in a factor analysis.
However, I discovered an unusually significantly high negative correlation among Iranian
American Jews and averages on Religiosity Scale one and Religiosity Scale two
(r = -.341). Iranian American Muslims and Iranian Americans with no religious
affiliation had positive correlations between Religiosity Scale One and Religiosity Scale
Two (Muslims r = .10 No religion r = .479). The two scales should measure the same
construct.
The finding that Iranian American Jews were the only group in the study to have a
highly negative correlation between Religiosity Scale One and Religiosity Scale Two
suggests an error in how this particular construct was understood by the participant
group. As a result, further statistical analysis using the Religiosity Scales was not
possible.
Approach II. The second approach to analyzing the religiosity measure was to
treat questions 1-3 and 4-7 as separate measures of unique dimensions of religiosity.
Exact Factor scores were calculated for both series of questions using the factor loadings
as weights. Once Exact Factor scores were calculated a multiple regression was

69
conducted using perceptions of ethnic harassment and social distance from Euro
Americans as dependent variables.
The factor analysis (direct oblimin) revealed that I have two distinct factors,
experiential (questions 1-3) and personal religiosity measures (questions 4-7). Please see
the scree plots in Figure O3 (please see Appendix O).
The experiential scale was designed to assess the importance or role religion plays
in the individual’s conceptualization of reality (Glock & Stark, 1965). The personal scale
was designed to measure how religion affects the individual’s concept of self (Allport &
Ross, 1967).
Separate factor analyses were conducted to calculate Exact Factor scores for
questions 1-3 and 4-7. Exact Factor scores, weight each person’s score on each item by
the factor loadings, and then an average is calculated on the weighted scores. Questions
1-3 and 4-7 produced two Exact factor scores.
I conducted a multiple linear regression and compared religious affiliation to test
the predictive strength of experiential and personal religiosity (using Exact Factor scores)
on average reports of perceived experiences of ethnic harassment.
Experiential Religiosity
Experiential Religiosity. Jewish. Experiential Religiosity significantly predicted
higher rates of perceived experiences of ethnic harassment among Iranian American
Jews, β = .473, t(2, 78)= 5.453, p = <.001.
Personal Religiosity
Personal Religiosity. Jewish. Personal Religiosity significantly predicted higher
rates of perceived experiences of ethnic harassment among Iranian American Jews,

70
β = .371, t(2, 78)= 4.277, p = <.001.
I conducted a multiple linear regression and compared religious affiliation to test
the predictive strength of experiential and personal religiosity (using Exact Factor scores)
on average reports of perceived social distance from Euro Americans.
Experiential Religiosity
Experiential Religiosity. Jewish. Experiential Religiosity significantly predicted
higher rates of perceived social distance from Euro Americans among Iranian American
Jews, β = .510, t(2, 78)= 5.798, p = <.001.
Personal Religiosity
Personal Religiosity. Jewish. Muslim. Personal Religiosity significantly
predicted higher rates of perceived social distance from Euro Americans among Iranian
American Jews, β = .311, t(2, 78)= 3.539, p = .001, and Muslims,
β = .285, t(2, 146)= 3.566, p = <.001.
Additional Analyses. I compared religious affiliation by conducting direct oblimin
factor analyses (principle axis factoring). I found that Iranian American Muslims reported
rates of religiosity as expected by the two distinct factors described above (Experiential
and Personal). The factor analyses revealed two significant factors as demonstrated by
Figure P4 (Appendix P). Factor One included questions R4-R7 (Personal religiosity) and
Factor Two included R1-R3 (Experiential religiosity). However, the factor analyses
revealed that three factors were extracted within the Iranian American Jewish ratings as
demonstrated by Figure Q5 (Appendix Q). The first factor included items R1-3
(Experiential religiosity). However, Iranian American Jews rated Personal religiosity
items in an unexpected way. Factor two included R4 and R6. Factor three included R5

71
and R7. According to the scale questions R4-R7 should all measure personal religiosity.
It is unexpected and unusual that Iranian American Jews answered the personal
religiosity questions in significantly different ways. Consequently, treating the Brief
Religiosity Survey (Allport & Ross, 1967) as demonstrating two distinct types of
religiosity may not be appropriate among Iranian American Jews.
VIII. Is there an underlying latent construct within the measured variables of: skin
tone, accent (Iranian), displays of religious symbols, displays of ethnically
traditional clothing, generational status, and identification with an ethnicity other
than Iranian American?
I conducted an Exploratory Factor Analysis (EFA) using the factors as weights. I
investigated a number of variables to see if there was an underlying variable that affected
all other variables included. The factors consisted of: Skin tone, accent (Iranian), displays
of religious symbols, displays of ethnically traditional clothing, generational status, and
identification with an ethnicity other than Iranian American. Skin tone scores, accent
(Iranian), displays of religious symbols, displays of ethnically traditional clothing,
generational status, and identifying with an ethnicity other than Iranian American – were
Z scored for the purposes of the EFA.
The items listed above were analyzed to reveal no latent variable through an EFA.
The factors did not load onto one factor. One requirement was that items were not
conceptually related. I used a Maximum Likelihood method as it is may be the best
estimation procedure. I also used a Direct Oblimin rotation with Kaiser normalization to
reveal the correlational relationship between factors. I found no statistical evidence for
items to load onto one factor.

72
Two factors were extracted. The factors were skin tone and accent. Skin tone
accounted for 23% of the variance and accent accounted for 5% of the variance.
However, when reviewing the factor matrix I found that skin tone was correlated with
accent (.78). There is no conceptually valid reason why darker complected individuals
would have an accent. Nor does there seem to be a logical reason for skin tone correlation
and displays of symbols of religious affiliation (.41), ethnically traditional clothing (-.12),
generational status (.48), or identifying with an identity other than Iranian American
(-.57). The same illogical weak correlations were found with accent. Accent correlated
with skin tone (.35), displays of religious symbols (-.25), ethnically traditional clothing
(-.03), generational status (.20), or identifying with an ethnicity other than Iranian
American (.25). Thus there is no latent factor that explains the measured variables.

73
CHAPTER 5
Discussion
Summary of Key Findings
The primary hypothesis was, Iranian American Muslims will report higher rates
of perceived experiences of ethnic harassment and social distance from Euro Americans
than will their non-Muslim peers (be they Jewish or possess no religious affiliation). The
primary hypothesis was only partially supported. My findings indicated that Iranian
American Muslims perceived higher rates of experienced ethnic harassment than Iranian
Americans with no religious affiliation. However, Iranian American Muslims did not
perceive significantly higher rates of social distance than Iranian American Jews. In fact
Iranian American Jews reported higher rates of social distance than Iranian American
Muslims. Although Iranian American Muslim men perceived (insignificantly higher) the
highest rates of ethnic harassment on average- there was no significant difference
between Iranian American Muslim men and Iranian American Jewish women.
The secondary hypothesis was, Iranian American Muslims who appear
prototypically Muslim (displaying scarf/hijab, Allah necklace, a beard, Islamic stone, or a
Tasbih), will report higher rates of perceived experiences of ethnic harassment and social
distance from Euro Americans than will Iranian American Muslims whose appearance is
more prototypically Euro-American (or non-Muslim). The data analysis failed to support
the secondary hypothesis. This is unusual given the higher likelihood of these individuals
falling victim to hate crimes (HRW, 2002). However, Iranian American Jews who
displayed symbols of religious affiliation were significantly more likely to perceive
higher rates of ethnic harassment and social distance from Euro Americans than those

74
who did not. This is supported by the fact that most hate crimes motivated by religion in
the United States are against Jewish Americans (FBI reports, 2009). However, there is a
significantly higher number of Jews than Muslims in the U.S. which may affect hate
crime rates. Thus these findings warrant additional research.
There are a number of interesting and significant findings in the current study.
One finding was that Iranian American Muslim men reported higher rates of perceived
experiences of ethnic harassment than Iranian American Muslim women. This finding
negates reports on hate crime rates by the Human Rights Watch (2002) organization. The
reasoning behind it may be: 1) Iranian American women may seem less threatening due
to their double minority status as women and Iranian 2) Iranian American men may seem
more threatening due to their appearance, size, and social power as men 3) Iranian
American Muslim women may be more likely to alter their appearance to appear Euro
American.
Social Dominance Theory (SDT) (Sidanius & Pratto, 2012) may be used to
explain why Iranian American Muslim men reported higher rates of ethnic harassment
than Iranian American Muslim women. SDT suggests that society is made up of social
hierarchies. One social hierarchy in the U.S., as it pertains to the current study, is
comprised of Euro American men as the dominant group and in descending order, Iranian
American men and Iranian American women. According to SDT, Iranian American men
may experience higher rates of ethnic harassment as an attempt by the dominant group to
maintain the social hierarchy and power differentials within society. Iranian American
women are viewed as non-threatening and unimportant to maintaining the social power
and hierarchy of Euro American men.

75
In addition, Iranian American Muslim women may be more likely to alter their
appearance to appear Euro American than Iranian American Muslim men (e.g. hair
texture/color, skin tone, plastic surgery, etc.). Consequently, Iranian American Muslim
women may appear more Euro American than their male counter parts.
I also found that religion had a significant effect on perceptions of social distance
from Euro Americans. In contrast to my hypothesis Iranian American Jews reported
significantly higher rates of social distance from Euro Americans than Iranian American
Muslims and Iranian Americans with no religious affiliation. One explanation is that the
Iranian American Muslims in this study may be socially insulated and do not interact
with the larger public as much as Iranian American Jews.
Another explanation may have to do with gender roles and Iranian American
Jewish women’s identity. One of the many components of what has traditionally been
“women’s work” is to maintain the emotional and personal well being of her family
(Hochschild, 2012). I suggest that Iranian American Jewish women feel it is their
responsibility to transmit their culture intergenerationally as a way of maintaining the
community’s health, well being, and overall existence. Thus, they may feel compelled to
marry and maintain strong relationships with other Iranian American Jews- resulting in a
higher degree of social distance from Euro Americans. Another factor is that Iranian
American Jews are a numerical minority and preserving their culture may be a priority
that increases perceptions of social distance from Euro Americans.
Lighter skin tone preference and more favorable treatment of individuals with
lighter skin complexion have been widely researched in the past (Jones, 2000). However,
the analysis revealed that lighter skin tone preference was only relevant to Iranian

76
American Jews and Muslims and did not affect Iranian Americans with no religious
affiliation. Iranian American Jews and Muslims with lighter skin tones reported
perceiving higher rates of ethnic harassment. This may be because Iranian Americans
with lighter skin tones may appear European and many Euro Americans may not
immediately realize their Iranian American ethnicity. Thus, Iranian Americans with
lighter skin tones may witness Euro Americans express prejudices toward Iranian
Americans more often than Iranian Americans who phenotypically appear Middle
Eastern (e.g skin tone, hair texture). This additional exposure to prejudicial attitudes of
Euro Americans may lead to higher rates of perceived ethnic harassment. A second
argument is that lighter skinned Iranian American Muslims and/or Jews feel unaccepted
from both the mainstream Euro American group and from their own in-group. The idea is
that if they appear more European then in-group members may feel that they do not
experience the same level of prejudice and discrimination they do- resulting in prejudice
toward them for their alleged privilege. However, these results must be replicated as there
were not enough participants recruited within every skin tone category. The majority of
participants identified with the skin color corresponding with numbers four or five on the
Fitzpatrick Scale (Daniel, Heckman, Kloss, & Manne, 2009) (distribution was generally
normal).
Past researchers have demonstrated higher rates of prejudice and discrimination
toward individuals with foreign accents (Lippi-Green, 1994). Iranian American Jews
reported the highest rates of perceived experiences of ethnic harassment and social
distance from Euro Americans based on acuteness of foreign accent more so than Iranian
American Muslims or Iranian Americans with no religious affiliation. This may be

77
because Iranian American Jews contend with layers of prejudice and discrimination
based on their ethnicity, religion, and accent. Also, there are numerically less Iranian
American Jews in the world than Iranian American Muslims or those without religious
affiliation. This may amplify Iranian American Jewish perceptions of perceived ethnic
harassment and/or social distance.
Lastly, I found that Iranian Americans who were born outside of the U.S.
perceived higher rates of social distance than those who were born in the U.S. One may
suggest that Iranian Americans born in the U.S. may be more assimilated into U.S.
society. It may be the case that cultural assimilation shields some Iranian Americans from
experiencing higher rates of perceived ethnic harassment and social distance from Euro
Americans.
Limitations and Strengths
One limitation is that I did not take into account degree of assimilation into the
U.S. culture and society. This raises the question of how religious affiliation may affect
intra and inter group perceptions of assimilation. Considering the JudeoChristian roots of
the United States, the dynamic of what traits define American identity (in the context of
assimilation) could be studied on a continuum. It would be interesting for future
researchers to explore what if any social, political, or economic benefits or privileges
Iranian Americans gain through assimilation, taking into account religious affiliation.
Another limitation was that I was required to reveal my intention of researching
perceived experiences of prejudice and discrimination on the consent form. Thus, by
directly revealing what I aimed to measure, on the consent form, I may have attracted
individuals who were 1) emotionally ready to talk about such experiences and/or 2)

78
individuals who had such experiences. Researchers face challenges in measuring
prejudice or perceived prejudice due to social desirability pressures and challenges of
deciphering between participant opinion and fact.
While conducting the study in Southern California afforded access to a large
number of Iranian Americans, I still faced a number of limitations. Recruiting from the
Southern California region came with some drawbacks. First off, an overwhelming
majority of the Iranian American Muslim and Jewish participants were recruited from
either Orange County or West Los Angeles. Both of these Southern California regions are
affluent and median incomes far exceed national averages (OC, Mdn = 75,762, Century
City (West LA), Mdn = 95,135, Nation Average = 42,979.61). Thus, the results of the
study are limited to representing Iranian Americans from those regions.
The Southern California region is also limited to representing Iranian Americans
living in a state that predominantly votes for the Democratic Party in elections. The LA
Times described Southern California as a “melting pot” (meaning a place with a high
degree of cultural diffusion) with diverse communities and neighborhoods that represent
a number of racial ethnic groups. Despite the general political and cultural characteristics
of California, Orange County is heavily populated with a majority of Republicans. It is
unclear how the political nature of the regions affects the experiences of Iranian
Americans. Nevertheless, the state is heavily populated with immigrants and is inclusive
of cultures from many parts of the world.
Some of the unique challenges I faced surveying Iranian Americans was cultural
mistrust, refusal to denote religious affiliation, and the fact that most participants were
immigrants or refugees. While conducting the current study I found that many Iranian

79
Americans were extremely suspicious of how the information would be utilized. Many
asked if there would be governmental tracking. Upon further conversation many
participants voiced a concern. They described how in Iran government officials would
ask about political attitudes in a seemingly safe environment, only to persecute
individuals who had opinions against the regime. As a result, many participants felt that a
similar strategy could be employed in the U.S. Thus, a large number of individuals
refused to take the survey and many were very hesitant in answering questions about
ethnic harassment or social distance from Euro Americans. I assured participants, who
did complete the survey that it was confidential and that the only information that could
be derived was general demographic traits.
A number of Iranian Americans found the options offered as answers to the
questions in the EHES were challenging. In other words they found it difficult to report
their perceptions or experiences of ethnic harassment with the options of 1) never 2)
sometimes or 3) always. Perhaps the scale may be revised by the original authors after
gathering input from participants.
Another interesting finding was that many Iranian Americans did not want to
disclose their religious affiliation. Perhaps this refusal was due to fear of social
marginalization or discrimination. This was evident by a few participants who reported
not having any religious affiliation but “sometimes” (6%) or “always” (2%) displaying
symbols of religious affiliation. It also may have occurred because these individuals
perceived religion as part of their ethnic identity and did not make a religious distinction
within their personal identity. They may not follow the tenets of the religion but merely
respect their hereditary connection to the religion. Hence some participants verbally

80
identified as Iranian American Jewish without being asked about religious affiliation.
This area requires additional research.
Another challenge was that most Iranian Americans surveyed were born outside
the U.S. I failed to ask if they were immigrants or refugees. The psyche, mentality, and
culture of a refugee are significantly different from that of an immigrant (Tribe, 2002).
Thus, the question should have been added to the survey.
One of the advantages of conducting the study in Southern California is that there
is a significantly large population of Iranian Americans. Large populations of Iranian
Americans reside in the areas of Orange County (the city of Irvine) and Los Angeles. In
fact Los Angeles has the largest number of Iranians outside of Iran. The majority of
Iranian American Jews in the study were recruited from West Los Angeles. The majority
of Iranian American Muslims were recruited from Orange County. It is unclear if there
are fewer Iranian American Muslims in Orange County versus Los Angeles, since the
majority of past researchers have only asked about ethnicity.
Lastly, it was advantageous that I speak Farsi with Native fluency. This aided
with translation and cultural mistrust issues. It also helped me get endorsements and
collaborative efforts from Iranian American organizations.
Implications and Concluding Comments
The findings in the current study inspired the following question: is there is a
social hierarchy based on cultural similarity to Euro Americans that is explicitly related
to religious affiliation (in relation to the degree of perceived prejudice and
discrimination)? Perhaps Iranian Americans with no religious affiliation (although very
different) were more similar to Euro American Christians (the dominant group) than

81
Iranian American Jews or Muslims. I ask the question does religious assimilation
(religious conversion) shield one from a higher degree of prejudice and discrimination
among Iranian Americans with no religious affiliation? More importantly what religion
most closely resembles American identity (on the continuum of social identity) and must
Iranian American Jews and Muslims change their religious affiliation in order to
assimilate? These are all questions I hope to explore in future studies.
In contrast to my hypothesis I found that Iranian American Jews reported
significantly higher degrees of social distance from Euro Americans than Iranian
American Muslims and Iranian Americans with no religious affiliation. One may infer
that Iranian American Jews may be a population that feels particularly vulnerable in the
current social and political context.
One speculation is that, because there are numerically fewer Iranian American
Jews, they may feel the need to preserve their group’s existence and future. Cultural
preservation may seemingly require a higher degree of intragroup cohesion. This may
result in less intermarriage and perhaps explains in part why Iranian American Jews
reported higher rates of perceived social distance from Euro Americans. Future research
may explore Iranian American Jewish identity and consider qualitative interviews to ask
the community how and why they think these phenomena occurred.
Future studies may aim to mitigate the above listed challenges. One remedy is to
attempt to collect nationally representative data. Recruitment should ensure the inclusion
of Iranian American Jews and Muslims who display a higher degree of symbols of
religious affiliation and participants from a wide range of income brackets. Lastly, future
researchers may also include a higher number of men.

82
As noted above, all of the analyses revealed that Iranian American Jews and
Muslims perceived significantly higher rates of ethnic harassment and/or social distance
than Iranian Americans with no religious affiliation. Social distance may generally be
defined as a “lack of intimacy” (Weaver, 2008). It may be stated that intimacy (social
nearness) must be validated (reciprocated) by both parties for it to exist. Hence Iranian
Americans’ perceptions of social distance may be indicative of actual social distance.
The current study demonstrated the complex social identities of Iranian
Americans. As is evident by the results enumerated above, Iranian American perceptions
are significantly influenced by religious affiliation. I hope that researchers will begin to
examine Iranian American identity in a more multidimensional manner that takes into
account the intersectionality of ethnicity and religion. The study also demonstrated that
Iranian American Jews and Muslims are vulnerable and perceive higher rates of ethnic
harassment and social distance from Euro Americans. Thus, this is an issue (once
replicated) that should be taken into account when developing policy and standards of
practice both in public and private organizations.

83
APPENDIX A – RECENT SOCIAL AND POLITICAL RELATIONSHIP
BETWEEN THE U.S. AND IRAN
The current section is a description of the recent social and political context and
past relationship between the U.S. and Iran. In 1990-1991, Iran remained neutral during
the Persian Gulf War between several countries led by the U.S. against Iraq. In 1993,
under the leadership of President William Clinton, the U.S. instituted a policy of “dual
containment,” designed to isolate Iran and Iraq in retaliation for their involvement in
supporting terrorists and terrorist causes. In 1995, President Clinton signed an executive
order that prohibited any U.S. trade with Iran. In 1996, the U.S. Congress passed the Iran
and Libya Sanctions Act that instituted economic repercussions against entities that
invested in Iran or Libya.
The events of 9/11 occurred in the U.S. in 2001, causing hundreds of mostly
civilian deaths, billions of dollars in damages, and resulted in the Axis of Evil
conception. Al-Qaeda terrorists crashed two aircrafts into the Twin Towers of the World
Trade Center, another aircraft crashed into the Pentagon, and a fourth airplane was
intended to crash into the White House or the Capitol Building. However, the fourth
plane crashed in a rural area of Pennsylvania due to passenger intervention.
Consequently, the U.S. began the War on Terror (also known as the Overseas
Contingency Operation) and invaded Afghanistan. Soon thereafter, on March 20, 2003,
the war in Iraq began. As previously mentioned, in 2002, President George W. Bush,
labeled the countries of Iran, Iraq, and North Korea, as part of the “Axis of Evil.”
President Bush remarked that the countries of the Axis of Evil harbored weapons of mass
destruction and were a threat to the safety of the U.S. and the world. The concept of the
Axis of Evil changed the way in which Americans perceived Iran (Heradstveit &

84
Bonham, 2007). Iranians used the renewed interest in Middle Eastern politics to fight for
change via the Green Movement.
Since the Iranian revolution and the events of 9/11, Iranians in Iran have suffered
and fought against the despotic rule of the Islamic Regime in a political movement called
the Iranian Green Movement. Years of protesting, false imprisonment, public hangings,
the stoning of women, and civilian torture were brought to light in 2009. The
unprovoked public murder of Neda Agha-Soltan during a protest against the Islamic
Regime was captured on tape and viewed widely among the international community.
The book and movie of The Stoning of Soraya M. also tells the far too common story of a
young woman stoned in a village in Iran. The Green Movement began as a political
movement demanding the removal of Mahmoud Ahmadinejad from power, but has since
become a movement encouraging hope for freedom and human rights in Iran. Despite the
vulnerable and desperate situation of Iranians in Iran, Iranian Americans are
overshadowed by the terroristic stereotypes encouraged by the Axis of Evil concept.

85
APPENDIX B – THE IMPACT OF SKIN COLOR, ACCENT, RELIGIOUS
IDENTITY, AND A LACK OF RELIGIOUS AFFILIATION ON PREJUDICE
AND DISCRIMINATION
Skin Color Prejudice and Discrimination
The following paragraphs explore the effects of skin tone in the United States.
Skin tone is often used as a proxy for racial or ethnic group membership (Jones, 2000).
There is a wide range of skin tones and other markers of racial and ethnic identity among
Iranian Americans. A description of the phenotypic makeup of Iranian Americans and
possibly experienced skin tone prejudice and discrimination is provided below.
Iranians are a culturally and phenotypically diverse group of people. More
specifically, different regions of Iran are inhabited by groups of Iranians with distinct
customs, linguistic dialects, and different skin tones. Iranians vary in appearance from
blond hair, blue eyes, and light skin to dark brown eyes, black hair, and darker skin tones.
In addition, Iranian Americans range from having straight light hair to having dark black
curly hair. Hence, Iranians living in the U.S. may have different experiences depending
on their ethnic appearance as it pertains to skin tone and hair texture. Differences in the
degree of prejudice and discrimination toward individuals specifically skin tone may be
referred to as, “colorism” (Jones, 2000). In other words, a distinction between skin color
and race can be made. Skin color and hair texture often vary among individuals within
the same racial group. As a result, individuals of the same racial group, may experience
prejudice to different degrees.
Colorism uses skin color as a proxy for social status, whereas racism uses racial
identification as a proxy for social status. Colorism occurs both between and within
social (racial/ethnic) groups. Researchers have found that lightness has been associated

86
with “intelligence, refinement, prosperity, and femininity. Darkness [has been found to
be] associated with toughness, meanness, indigence, criminality, and masculinity” (Jones,
2000, p. 1527). Thus, Iranian Americans may perceive and experience prejudice and
discrimination differently in the U.S. based on their skin color and other ethnic markers
of group membership.
Foreign Accent
Many Iranian Americans who have immigrated to the U.S. possess an accent
when speaking English. Iranian Americans who possess a foreign accent face different
forms of prejudice and discrimination than those without such an accent (Lee, 2007).
The following paragraph describes the negative effects a foreign accent may have on
one’s experiences in the U.S.
Foreign students, particularly from the Middle East, face institutional
discrimination (Lee, 2007). Lee (2007) notes: “One of the factors that potentiated
prejudice and discrimination toward Middle Eastern students are stereotypes surrounding
students’ accents. In addition, many participants associated an accent with a lack of
comprehension and a lack of intelligence” (Lee, 2007, p. 29). Not all accents are
perceived as negative. Some accents, such as a British accent, are perceived as
prestigious and indicative of high-class (Wang, Arndt, Singh, & Biernat, 2007). Hence,
Iranians in the US who possess foreign accents may face a higher degree of prejudice and
discrimination than their counterparts who do not have such an accent.
Religious Identity
Religion is an important aspect of identity. We have noted that Iranian Americans
are affiliated with a variety of religions—Muslim, Christian, Jewish, Baha’i, and

87
Zoroastrian, or they may be agnostic or atheist. The following section describes the
importance of religion and its influences on inter-group interactions. This section
describes the concept of religion in general and how it may influence experiences of
prejudice and discrimination.
Religion has historically had complex effects on rates of prejudice (Allport, Clark,
& Pettigrew, 1979; Katz, 1991). Individuals who attend church services on a regular
basis have been found to be either more or less prejudiced than the typical person.
Prejudice in such cases may stem from a “realistic conflict” between religious groups
(Allport et. al., 1979; Katz, 1991). Many of the major religions of the world claim to
have access to the “Truth,” and in so doing suggest that other religions are flawed. There
are differences of ideas that lead to conflict between the major religions of the world.
The impact of religion is found in the construct of culture. For example,
Christianity had had a significant impact on Western culture. The same is true in regard
to Islam and its effects on the Middle East. Judaism is also looked upon as a cultural
group with an associated language, type of food, etc. The tendency to over-generalize
about out-group members is not specific to one particular religion. Prejudice is not
predicted by type of religion, but by the degree of religiosity (Allport, et. al., 1979; Katz,
1991). Highly religious individuals tend to have both higher and lower rates of prejudice
than average. It is important to note the contradictory effects of religion on individuals.
Muslim Attire
The following section describes significant effects of wearing Muslim attire and
appearing Muslim in the post 9/11 context (Unkelbach, Forgas, & Denson, 2008). As
previously mentioned, the hijab and turban signify group membership in the Muslim

88
group. Many Muslim women wear hijabs due to religious requirements to cover their
hair. The turban is a widely worn headgear by men in Africa, India, and the Middle East.
Despite the non-specific religious or ethnic nature of the turban, it is now a symbol of
Muslim group membership. The paragraphs below analyze prejudice and discrimination
that may result from wearing Muslim attire. This section is relevant because 40% of
Iranian Americans identify themselves as Muslim (PAAIA, 2008).
The current paragraph explores the negative effects of wearing Muslim attire and
appearing Muslim in the post 9/11 context (Unkelbach, Forgas, & Denson, 2008). More
specifically, their study looked at participant reactions to Muslim headgear. Muslim
headgear includes men wearing turbans and women wearing hijabs. In a computer-
simulated game, participants were asked to shoot at individuals who were armed. The
photos of Muslim targets were categorized as “non-Black” and “non-Asian.” The targets
were outfitted with either a white turban or a white hijab. Participants were more likely
to shoot at unarmed targets wearing turbans or hijabs than at those not so clothed and
sometimes armed (Unkelbach, Forgas, & Denson, 2008). The researchers suggest that
these findings demonstrate the negative stereotypes and perceptions linked to the Muslim
appearance. The “shooter bias” effect was found across men, women, conservative, and
liberal participants. Surprisingly, the likelihood of shooting Muslim targets increased
when participants were in a positive mood.
Public reactions to the Islamic headscarf, called the hijab, worn by Muslim
women, have been controversial. In 2004, a law passed in France prohibiting women
from wearing hijabs in public schools (Thomas, 2008). More recently, Iran’s female
soccer team was banned from the 2012 London Olympics due to their religious headgear.

89
In reaction, the Iranian women’s soccer team created headgear that covered their hair and
neck that would not interfere with their participation in the sport. Ultimately, FIFA
banned the team stating safety issues with the headgear.
The Iranian American Jewish Community
The Iranian and Jewish communities are unique groups in the U.S. that face
different kinds of prejudices and discrimination. The current section describes the Jewish
past and current experiences in the U.S. This section attempts to demonstrate the
complex identities of Iranian Americans Jews, as a group that encounters both the
prejudices and discrimination associated with being Iranian and with being Jewish in the
U.S.
The stereotype and stigmatization of Jews has a long history in the U.S. A brief
summary is provided below. It was not until the 1840’s that a large influx of German
Jews migrated to the U.S. A notable number of the Jewish communities formed in New
York and thereafter a stereotype of a “dishonest peddler” formed (Higham, 1984, p. 121;
Wilson, 1996). During and around the time of the American Civil War (1861-1865), a
stronger anti-Semitic ideology grew. Jewish Americans were perceived as an outsider and
a threat to the Christian American way of life (Higham, 1984; Wilson, 1996). The
German and Polish Jewish American communities had established themselves as
merchants all across the United States and heavily in New York City (Higham, 1984;
Wilson, 1996). No other immigrant group had acquired the success and social mobility
of the Jewish American community.
A new stereotype of the Jewish American formed following the American Civil
War. The Jewish American was now perceived as someone who had recently acquired

90
wealth but was lacking “manners” (Higham, 1984, p. 125; Wilson, 1996). In reaction,
the American elite of the time attempted to exclude Jewish Americans from staying in
certain hotels, resorts, and created “educational quotas, restrictive housing covenants …”
(Sundquist, 2005, p. 20) and viciously stereotyped the Jewish American community.
Famously, the prominent banker, Jewish American Joseph Seligman, was not permitted
to stay at the Grand Union Hotel in Saratoga in 1877. Some of the signs at the hotel read,
“no Jews or Dogs Admitted Here” (Higham, 1984, p. 128; Sundquist, 2005). It was
common practice in 1881 for many private eastern schools to refuse to accept Jewish
students.
The success of the Jewish community seemed to translate as a threat to the
Christian majority. This caused more private schools, ivy-league schools, resorts, and
hotels to either form quotas for how many Jews they accepted or to out-right not allow
Jews to attend at all. However, by the early 1920s, the distance between German
American and Eastern European Jews decreased. The Jewish American communities
fought against housing covenants, student quotas, and quotas put in place in medical
schools nationwide (Higham, 1984; Wilson, 1996). It was during the second
establishment of the Ku Klux Klan in the 1920s that the anti-Semitic ideology of Jews as
“Christ killers” was re-established in the United States (Higham, 1984, p. 149). The
stereotype of Jewish Americans was cemented in the idea of the “banker” who was a
threat to those in power.
The life sentencing of a pencil factory manager, Leo Frank, in 1913, and the later
kidnapping and public lynching of Frank, are evidence of the hate ideology towards
Jewish Americans. One may claim that it was this anti-Semitic ideology that contributed

91
to the decision the United States made in the late 1930s not to increase limited quotas of
allowed Jewish immigrants during World War II (Sundquist, 2005). Iranian American
Jews face prejudice and discrimination due to their ethnic identity as Iranian and also due
to their religious identity as Jewish. Thus in addition to the stereotypes and stigmas faced
by all Iranians, Iranian American Jews also experience prejudices unique to the Jewish
identity in the U.S.
The Iranian American Baha’i, Christian, and Zoroastrian Communities
Baha’i, Christian, and Zoroastrian Iranians represent a numerical minority within
the Iranian American group. It is important to understand the diversity of the Iranian
American community and the unique needs of the various religious groups within the
community.
These groups are a part of the Iranian American voice and their identities are described
below.
The Baha’i community is the second most ethnically diverse religious group with
North Korea and the Vatican City as the only two countries in the world to not have any
documented Baha’is (Smith, 2008). According to The National Spiritual Assembly of the
Baha’is of the United States (2011) there are 169,578 Baha’is in the U.S not including
Hawaiʻi or Alaska, making Baha’is a religious minority in the United States. According
to the International Federation for Human Rights (2003), despite the fact that the Baha’i
faith was founded in Iran, Baha’is living in Iran after the Iranian revolution of 1979 face
religious persecution. Many Baha’is in Iran are arrested, imprisoned, tortured, and even
killed for actively practicing their religion. Furthermore, Baha’is in Iran face prejudice
and discrimination at their place of employment and within the Iranian education system.

92
Many Baha’is fled Iran since the 1979 revolution and now reside in countries throughout
the world.
A very small minority of Iranians are Christian. However, Christianity has had a
presence in Iran since the birth of the religion. In 2009, The United States Department of
State estimated there were 300,000 Iranian Christians living in Iran. The Iranian
government claims to afford Christians representation within the establishment and to
guarantee other government rights. However, similar to the experience of most religious
minorities in Iran and Iranians in general, Christians have experienced prejudice and
discrimination. Post the Revolution of 1979, Iranian Christians were imprisonment and
sometimes killed by the Iranian government.
According to The New York Times (2006), there are approximately 11,000
Zoroastrians living in the U.S. today. Currently, the Zoroastrian community faces the
challenge of keeping the community alive and active. Zoroastrianism is a monotheistic
religion founded in Iran before the establishment of Christianity and Islam. Following
the Islamatization of Iran in the seventh century A.D., Zoroastrians were slaughtered and
exiled. Many relocated to India. According to The Federation of Zoroastrian
Associations of North America (2004), worldwide there are only 190,000 Zoroastrians.
This may also be due the debated issue of not accepting converts into the Zoroastrian
community. Despite the minority status, oppression, discrimination, and prejudice faced
by Zoroastrians, many of the Zoroastrian practices are still adopted in Iran today. For
example, Persian New Year, or Nowruz, is said to have its origins in Zoroastrianism, and
is still widely celebrated by most Iranians of all religious affiliations today.

93
Iranian Americans Without Religious Affiliation
As discussed in the prior sections of this paper, Iranian Americans without any
religious affiliation may face discrimination due to their ethnic identities. This section is
written with the caveat that many Iranian Americans are assumed or mistaken to be
Muslim, due to the “Axis of Evil” analogy (as described in previous sections). If Iranian
Americans without religious affiliation are able to overcome the assumption that they are
Muslim, then they will contend with the issues surrounding a social identity without
religious affiliation and/or belief in God. For example, one Gallup poll (2011) found that
atheists were the least likely to be trusted with a political position in the U.S. Thus,
Iranian Americans who are classified as being atheists due to their lack of a religious
affiliation, experience prejudice and discrimination due to both their ethnicity and their
lack of religious affiliation.

94
APPENDIX C – HORIZONTAL AND VERTICAL SOCIAL DISTANCE
To further understand the concept of social distance as a type of prejudice, a
description of horizontal and vertical social distance is provided below.
Horizontal and vertical social distance may occur between persons, between
person and social group, and between social groups. Horizontal versus vertical social
distance is founded in the notion that society is stratified into social groups that belong to
different social statuses. In other words, some social groups in society have social
advantages that other social groups do not.
The concept of horizontal social distance describes a type of social distance that
occurs between individuals or social groups that have the same social status. In other
words, horizontal social distance functions between equals, or groups that share a similar
status within society. For example the social distance between two Iranian Americans
who both have Eurocentric appearances.
The concept of vertical distance describes a type of social distance that occurs
between individuals or social groups that have different levels of social status. For
example the social distance between an Iranian American with eurocentric features and
an Iranian American with ethnic features. It is important to emphasize that social status
in this context refers to the social stratifications of a society based on ascribed status, but
social status may also refer to the achievements an individual has attained. Individuals
may feel superior based on their income or education, but not necessarily in their ascribed
status. Hence, vertical distance is based on a number of social factors and is quite
complex. Vertical distance is a form of social farness with no intention by either party to
decrease the level of distance.

95
APPENDIX D- SNOWBALL & PURPOSIVE SAMPLING
Snowball Sampling. The participant recruitment methods are described below.
The current study employs snowball and purposive sampling. Snowball sampling may be
an effective way of recruiting from populations that may not frequently take part in
research projects (Perez, Nie, Ardern, Radhu, & Ritvo, 2011). Some of the challenges
may be that the population mistrusts authority figures, has a disinterest in the area of
study, or faces linguistic issues. However, researchers may work to overcome such
challenges by “building trust with individuals and the community by prioritizing
participants’ concerns and convenience, and effectively conveying study purpose, task,
and potential benefits to individuals and the community” (Perez et al., 2011, p. 2). In
return, the individuals with whom the researcher has built a relationship with are asked to
refer other individuals of that population.
Purposive Sampling. Purposive sampling is a type of sampling or recruiting of
participants that selects individuals based on a number of chosen criteria (Daniel, 2012).
In other words, researchers define a set of desired traits and a set of undesired traits;
individuals that meet all of the desired requirements are selected to participate in the
study. According to Daniel (2012), purposive sampling develops through five steps.
Please see Table 9 below.
Table 9. Steps for Purposive Sampling
1) Define the target population
2) Identify inclusion and exclusion criteria
3) Create a plan to recruit and select population elements that satisfy the inclusion and
exclusion criteria
4) Determine the sample size
5) Select the targeted number of population elements (Daniel, 2012, p. 89)

96
The five steps described above are implemented in the current study below. Please see
Table 10 below.
Table 10. Implemented Steps for Purposive Sampling
1) Define the target population: Iranian Americans. Jewish, Muslim, & Baha’i Iranian
Americans.
2) Identify inclusion and exclusion criteria: 3 men: 3 women: must identify as ethnically
full Iranian: Must permanently reside in the U.S. Must be either, Muslim/ Jewish/ or
Baha’i, & must be 18 years or older,
3) Create a plan to recruit and select population elements that satisfy the inclusion and
exclusion criteria: Snowball sampling. Participants are recruited through other
participants’ acquaintances.
4) Determine the sample size: The sample size will be 6 individuals (3men, 3 women).
5) Select the targeted number of population elements: Two: 1) Gender (men, women),
2)Religion (Muslim, Jewish, Baha’i)
(Daniel, 2012, p. 89)
It should be noted that research conducted using purposive sampling is not
generalizable and is not meant to be generalizable. Such research is exploratory and is
only reliable and valid for the individuals used in the study. The purpose of exploratory
qualitative work is that it represents the experiences and thoughts of a selected few. By
representing these individuals, researchers are able to give voice to a segment of the
population that is relatively unknown to the mainstream. There is a dearth of research
voicing the thoughts and experiences of Iranian Americans in the current U.S. context.
Thus, the study encourages other researchers to replicate the findings of the study.
The current study employs snowball sampling. According to Perez, Nie, Ardern,
Radhu, and Ritvo (2011), snowball sampling may be an effective way of recruiting from
populations that may not frequently take part in research projects. Some of the challenges
may be that the population mistrusts authority figures, has a disinterest in the area of
study, or faces linguistic issues. However, researchers may work to overcome such

97
challenges by “building trust with individuals and the community by prioritizing
participants’ concerns and convenience, and effectively conveying study purpose, task,
and potential benefits to individuals and the community” (Perez et al., 2011, p. 2). In
return, the individuals with whom the researcher has built a relationship with are asked to
refer other individuals of that population.

98
APPENDIX E- CONSENT TO PARTICIPATE IN RESEARCH
Iranian American Perceptions
A Ph.D. student in the Department of Psychology at the University of Hawaiʻi,
Mānoa is conducting a study on the social attitudes of Iranian Americans. We are
interested in perceptions of Iranian Americans on the extent to which prejudice and/or
discrimination against Iranian Americans exists in the U.S. You are being asked to
participate because you are an adult over the age of 18 who identifies as Iranian
American.
Activities and Time Commitment: You are being asked to participate in a 40-45 minute
online survey or paper/pencil survey (whichever you prefer). The survey is primarily
composed of multiple choice questions with several opportunities for short fill-in the
blank responses. Approximately 240 Iranian Americans will participate in the study.
Benefits and Risks: Participation in this research may be of no direct benefit to you.
Participants may find the subject matter of prejudice and discrimination upsetting and as
a result there may be the potential for psychological pain. If you experience psychological
pain, you may call a nationwide crisis hotline for help, at 1(800)448-3000 or 1(800)273-
8255. It is believed that the results of this project will help social scientists better
understand perceptions of Iranian Americans on prejudice and/or discrimination within
the U.S.
You will also be asked to fill out the Ethnic Harassment Experiences (EHES)
scale (Schneider et al., 2000), a Social Distance Scale (Bogardus, 1959), a brief
religiosity scale (Allport & Ross, 1967), and a demographic sheet.
Confidentiality and Privacy: All data collected will be summarized into broad
categories. Although, we will not ask for your name the demographic questionnaire (what
part of the country you live in, your age, etc.) may potentially cause a loss of privacy.
Voluntary Participation: At any time, you are free to discontinue participation for any
reason, without loss. Research data will be confidential to the extent allowed by law.
Agencies with research oversight, such as the University of Hawaiʻi’s, Human Studies
Program, have the authority to review research data. All research records will be stored in
a locked file in the primary investigators’ office for the duration of the research project.
All research records will be destroyed three years after the completion of the project.
Questions: If you have any questions, please contact the researcher, Shahrzad
Yousefinejad at [email protected]. You may also contact the faculty advisor Dr.
Elaine Hatfield, at [email protected]. If you have any questions regarding
your rights as a research participant, please contact the University of Hawaiʻi’s, Human
Studies Program at (808) 956-5007, or [email protected]. If you choose to participate,
please print the letter X on the line provided below and the date, to indicate your consent
and comprehension of the nature of this study. ________________________

99
APPENDIX F- SURVEY PACKET
INSTRUCTIONS: Ethnic Harassment Experiences Scale. Please indicate whether you
have experienced the following within the last 24 months, by marking an X on the often,
sometimes, or never space.
1) Someone made derogatory comments about your ethnicity.
________ Never ________ Sometimes ________Always
2) Someone used ethnic slurs to describe you.
________ Never ________ Sometimes ________Always
3) Someone made racist or prejudice comments about you or your ethnicity. (For
example saying people of your ethnicity aren’t very smart).
________ Never ________ Sometimes ________Always
4) Someone tells jokes about your ethnic group.
________ Never ________ Sometimes ________Always
5) Someone excludes you from social interactions because of your ethnicity.
________ Never ________ Sometimes ________Always

100
INSTRUCTIONS: We are interested in Iranian American perceptions in the U.S.
Particularly perceptions regarding Iranian American feeling toward how they are looked
at by Euro-Americans (Americans of European descent). Please answer the following
questions:
INSTRUCTIONS: Religiosity Scale. Please answer the following questions.
1. How would you respond to the statement: “Religion provides the individual with an
interpretation of his existence which could not be discovered by reason alone.”
1. Strongly agree
2. Agree
3. Disagree
2. Would you say that one’s religious commitment gives life a certain purpose which it
could not otherwise have?
1. Strongly agree
2. Agree
3. Disagree
3. Faith, meaning putting full confidence in the things we hope for and being certain of
things we cannot see, is essential.
1. Strongly Agree
2. Agree
3. Disagree
1. Do you believe Euro-Americans would marry into the Iranian-American
group
Yes, no
2. Do you believe Euro-Americans would like Iranian-Americans as close
friends
Yes, no
3. Do you believe Euro-Americans would like Iranian-Americans as next
door neighbors
Yes, no
4. Do you believe Euro-Americans would like to work in the same office
with Iranian-Americans
Yes, no
5. Do you believe Euro-Americans would like Iranian-Americans as
speaking acquaintances only
Yes, no
6. Do you believe Euro-Americans would like Iranian-Americans as
visitors only to the U.S.
Yes, no
7. Do you believe Euro-Americans would like to debar Iranian Americans
from the U.S.
Yes, no

101
INSTRUCTIONS: Religiosity Scale. Please indicate the degree to which you agree or
disagree with the following statements.
4. Overall, my religion has very little to do with how I feel about myself.
A B C D
Strongly Mildly Mildly Strongly
Disagree Disagree Agree Agree
5. My religion is an important reflection of who I am.
A B C D
Strongly Mildly Mildly Strongly
Disagree Disagree Agree Agree
6. My religion is unimportant to my sense of what kind of person I am.
A B C D
Strongly Mildly Mildly Strongly
Disagree Disagree Agree Agree
7. In general, my religion is an important part of my self-image.
A B C D
Strongly Mildly Mildly Strongly
Disagree Disagree Agree Agree

102
INSTRUCTIONS: Please fill out the following demographic questionnaire.
1) Please choose your gender identity (sex). ______Man ______Woman
2) Age ________
3) a)_______. Which one group best describes your ethnic identity, or the ethnic group
with which you most strongly identify?
1. White
2. White /Iranian
3. Middle Eastern
4. Middle Eastern /Iranian
5. Persian
6. Iranian
7. Iranian American
6. If other, please specify: ____________________________
3) b) Do you identify with any other ethnic group besides Iranian American? (e.g.,
Azerbaijani, Afghani, Bahrani, etc.) ______Yes ______No
3) c) If answered no to question 3b, skip to question 4.
Do you believe that Iranian Americans from a different region of Iran than yourself are
treated significantly different from you in the context of the U.S. by non-Iranian
Americans?
______Yes ______No
4) What is your religious affiliation? Please write none if you have no religious
affiliation.
_________________________________
5) Please select the skin color/tone that best represents your skin color/tone. Indicate
your choice by selecting the number associated with the skin color/tone you choose.
Write number here ____________
103
6) a) Have you ever used/undergone a skin lightening product/procedure (for the
purposes of lightening your skin color/tone)? ______Yes ______No
6) b) Would you ever use/undergo a skin lightening product/procedure (for the purposes
of lightening your skin color/tone)? ______Yes ______No
7) Do you consider yourself to have an Iranian accent when speaking English?
Acute Moderate Mild Not at all
1 2 3 4 5 6 7
______ ______ ______ ______ ______ ______ ______
8) How old were you when you immigrated to the U.S.? Or were you born in the U.S.?
_____________________________
9) How many generations has your family been in the U.S.?
_____________________________
10a) Do you wear symbols of your religious affiliation? (e.g., Cross, Yarmulke, Turban,
Scarf, etc.)
________ Never ________ Sometimes ________Always

104
10b) How often? ____________________________________
10c) If so what do you wear?
_________________________________________________
11a) Do you wear ethnically traditional clothing? (e.g., clothing worn in non-urban areas
of Iran such as Mahali’ clothing)
________ Never ________ Sometimes ________Always
11b) How often? ____________________________________
11c) If so what do you wear?
_________________________________________________
12) Highest level of education you have completed. Please circle one.
Grade School
High School
Vocational Degree or Certification
BS / BA
MS / MA
Ph. D. /M.D.
13) What was the annual family household income during most of your childhood ?
Under $17,000
$17,000-24,999
$25,000- 49,999
$50,000 – 99,999
$100,000 +
14) What is your occupation?______________________
15) What is your father’s occupation?___________________
16) What is your mother’s occupation? _____________________

105
17) What state and county do you reside in? ____________________

106
APPENDIX G – ADDITIONAL STATISTICS ON THE ETHNIC HARASSMENT
EXPERIENCES SCALE
The Ethnic Harassment Experiences Scale was built and organized based on the
Sexual Experiences Questionnaire (Fitzgerald et al., 1988). The statistical information
provided below is taken from Schneider, Hitlan, & Radhakrishnan’s (2000) study on
ethnic harassment involving Anglo and Hispanic participants.
“Combining all of the data from Hispanic and Anglo participants in our four
samples resulted in 556 cases with complete data on all seven items (a should be
an alpha = .79). A confirmatory factor analysis conducted on the combined data
suggested that the fit indexes for the two-factor model were reasonable. The
goodness-of-fit index (GFI) was .95, the adjusted goodness-of-fit index (AGFI)
was .90, the comparative fit index (CFI) was .93, the normed fit index (NFI) was
.92, the non-normed fit index (NNFI) was .89, and the root mean square residual
(RMSR) was .05. The chi-square value (df = 13) was 103.60 (x2/df ratio: 7.97).
The parameter loading for each item were positive and significant (all ts > 12.9),
and the correlation between the two factors was .54. We compared the two-factor
model with a one-factor model. The one-factor model did not fit the data as well.
GFI, AGFI, NFI, NNFI, and CFI values were .87, .72, .80, .69, and .81,
respectively; the RMSR was .07. The x21dfratio was 19.30, and the chi-square
value (df = 14) was 270.22. The alpha reliability indexes for the two-factor EHES
in all four samples were acceptable given the heterogeneous nature of some of
the behaviors included in the scale and the relative sizes of the samples that
completed all seven items. The reliabilities for the verbal ethnic harassment and

107
exclusion factors, respectively, were .85 and .47 in Sample 1 (n = 117), .74 and
.49 in Sample 2 (n = 43), .77 and .88 in Sample 3 (n = 97), and .82 and .63 in
Sample 4 (n = 286)” (Schneider, Hitlan, & Radhakrishnan, 2000, pg 7-8).”

108
APPENDIX H – THE SOCIAL DISTANCE SCALE
Social nearness (social distance theory) may be quite complex because it attempts
to measure a feeling: a feeling of “sympathetic understanding.” Scales were developed as
early as 1924 to measure the degree of social distance between social groups. Please see
Table 11 below.
Table 11. Social Distance Scale
1. Would marry into group Yes, no
2. Would have as close friends Yes, no
3. Would have as next door neighbors Yes, no
4. Would work in same office Yes, no
5. Have as speaking acquaintances only Yes, no
6. Have as visitors only to my nation Yes, no
7. Would debar from my nation Yes, no
(Bogardus, 1959)
The Social Distance Scale uses the Guttman Scale to measure social farness or
nearness. On a Guttman Scale items are ranked in a particular order so that when a
“typical” respondent answers with a yes to an item, they also agree with items ranked
lower on the scale. For example, if a participant is willing to accept a particular social
group member as a “speaking acquaintance,” then it is very likely that they also would
accept a member of that social group in their nation.
Ideally, a Guttman Scale is ordered from least extreme to most extreme, as is the
case with the Bogardus Social Distance Scale. As a result, debarring a social group from
your country is the most extreme and last item on the scale. The scale also uses intervals
of equal proportions where questions are ranked in such a way that the difference

109
between each interval is equal. This makes the sum score of the scale useful for
statistical analysis.
The theory of social distance (whether it is social farness or social nearness) may
be conceptualized on a continuum from a high degree of social distance (social farness)
to a low degree (social nearness). There is never a relationship where there is no social
distance. Hence, social distance may be represented on a linear model. A linear model
may be simply represented on a line. As a result, an individual may be represented by a
point on a graph. For example, a graph may be used to illustrate race and gender.
In the graph below, race is represented on the X-axis and gender is represented on
the Y-axis. On one polar end of the X-race-axis is the social construct of Whiteness. On
the opposite polar end of the X-race-axis is the social construct of Blackness. On one
polar end of the Y-gender-axis is the social construct of women. On the opposite polar
end of the Y-gender-axis is the social construct of men. When constructing the graph, the
numerical value given for the social construct of race or gender is not important because
social distance is calculated using absolute values. This means that the distance formula
used in algebra may be applied, which uses only absolute values. Hence, the
directionality, or whether the number is positive or negative, is not important. The
distance formula is .
Located on the graph below are two points, A and B. Point is A is found at the
coordinates (-5, 11) and represents the social identity of a Black man. Point B is found at
the coordinates (-11, 5) and represents the social identity of a White woman. By creating
an algebraic representation of social distance we are able to calculate the social distance.
The coordinates that define an individual’s social identity are called one’s social location.

110
Social location refers to the location of an entity on a graphical representation of an
individual’s identity. Below is the figurative calculation of social distance between the
social identity of a Black man and the social identity of a White woman.
social distance = the square root of (-5 (-) 5)² + (11 (-) -11)²
social distance = the square root of (-10)² + (22)²
social distance = the square root of (100 + 484)
social distance (almost equals) = 24.17
Racial and Gender (sex) Distance
Black/Man Men
(-5,11)
Black
White
(5,11)
Women
White /
Woman

111
APPENDIX I
Table I5
Percentage of Men and Women Perceiving Ethnic Harassment. Never, Sometimes, Always
Never Sometimes Always
Men Women Men Women Men Women
% % % % % %
Overall 20 19 74 74 6 7
Age Groups
18-27 0 80 0 0 0 20
28-37 10 16 85 78 5 6
38-47 14 15 81 80 5 5
48-57 25 22 71 76 4 2
58-67 21 24 70 57 9 19
68+ 42 37 50 50 8 13
Education
High School or Less 11 14 89 79 0 7 Vocational Degree or Cert. 33 15 67 85 0 0
BA/BS 8 11 84 81 8 8
MA/MS/PhD/MD 26 29 68 63 6 8
Income during Childhood
17,000-24,999 36 21 57 63 7 16
25,000-49,999 26 11 69 82 5 7
50,000-99,999 13 15 80 74 7 11
100K+ 19 23 77 75 4 2
Religious Affiliation
No Religious Affiliation 26 21 70 75 4 4
Jewish 8 13 88 71 4 16
Muslim 20 18 71 78 9 4

112
Appendix J
Table J6
Predictors of Perceiving Ethnic Harassment among Iranian American Men and Women.
No Religious Affiliation Jewish Muslim Full Sample
β β β β
Jewish Identity - - - .16*
Muslim Identity
Islamic Appearance
Jewish Appearance
-
-
-
-
-
-
-
-
-
.01
-.12*
.19***
Gender -.09 .27** -.22* -.05
Skin tone -.05 -.26* -.31** -.14**
Accent -.07 .46*** .08 .15*
Religious Symbol .03 .26* .08 .09
Ethnically Traditional
Clothing
.13 .19 -.10 .01
Generational Status -.09 -.12 .19* .-18
Sub-Ethnic Group -.06 .32** .20 .23**
Family Income -.23* -.18 -.09 -.21***
* p < .05, ** p < .01, *** p < .001.

113
Appendix K
Table K7
Percentages of Perceptions of Social Distance among Iranian American Men and Women.
None-Low Low-Medium Medium-High
Men Women Men Women Men Women
% % % % % %
Overall 20 19 74 74 6 7
Age Groups
18-27 0 80 0 0 0 20
28-37 50 34 35 53 15 13
38-47 45 36 38 47 17 17
48-57 46 27 36 51 18 22
58-67 35 43 48 24 17 33
68+ 58 25 17 37 25 38
Education
High School or Less 44 37 33 49 23 14 Vocational Degree or Cert. 33 38 33 39 34 23
BA/BS 42 31 42 48 16 21
MA/MS/PhD/MD 50 47 35 30 15 23
Income during Childhood
17,000-24,999 50 42 21 21 29 37
25,000-49,999 37 43 37 39 26 18
50,000-99,999 54 24 28 49 18 27
100K+ 42 43 48 46 10 11
Religious Affiliation
No Religious Affiliation 52 51 31 33 17 16
Jewish 8 19 75 48 17 33
Muslim 52 30 27 51 21 19

114
Appendix L
Table L8
Predictors of Perceptions of Social Distance from Euro Americans among Iranian
Americans.
No Religious
Affiliation
Jewish Muslim Full
Sample
β β β β
Jewish Identity - - - .14
Muslim Identity
Islamic
Appearance
Jewish
Appearance
-
-
-
-
-
-
-
-
-
-.09
.08
.22***
Gender -.03 .20* -.01 .02
Skin tone -.17 -.06 -.07 -.08
Accent -.04 .50*** .03 .14*
Religious Symbol .11 .30** .10 .17**
Ethnically
Traditional
Clothing
-.05 .02 -.13 -.07
Generational
Status
.13 -.01 -.01 .05
Sub-Ethnic Group -.05 .04 -.14 -.03
Family Income -.18 -.08 -.12 -.17**
* p < .05, ** p < .01, *** p < .001.

115
Appendix M
Figure M1
Average Rates of Perceived Ethnic Harassment. Gender and Religion.

116
Appendix N
Figure N2
Average rates of Perceived Social Distance among Iranian American Men and Women.

117
Appendix O
Figure O3
Factor Analysis. Religiosity Scale One and Religiosity Scale Two.

118
Appendix P
Figure P4
Factor Analysis. Religiosity Scale One and Religiosity Scale Two. Iranian American
Muslim.

119
Appendix Q
Figure Q5
Factor Analysis. Religiosity Scale One and Religiosity Scale Two. Iranian American
Jewish.

120
APPENDIX R – ADDITIONAL ANALYSES
I conducted additional analyses to analyze differences in perceived averages of
ethnic harassment and social distance from Euro Americans among participants who
were recruited online versus those recruited in person. Participants recruited online had
similar means and standard deviations to those recruited in person in regard to ethnic
harassment (online: M = 1.482, SD = .397: in-person: M = 1.457, SD = .415). Participants
recruited online had similar means and standard deviations to those recruited in person in
regard to social distance (online: M = .197, SD = .267: in-person: M = .272, SD = .304).

121
References
Ahmed, A. M. (2007). Group identity, social distance and intergroup bias. Journal of
Economic Psychology, 28, 324-337.
Allport, G. W., Clark, K., & Pettigrew, T. (1979). The nature of prejudice: 25th
Anniversary edition. United States of America: Perseus Books Publishing, LLC
Allport, G. & Ross, J. M. (1967). Personal religious orientation and prejudice. Journal of
Personality and Social Psychology, 5, 447-457.
Angermeyer, M. C., Matschinger, H., & Corrigan, P. W. (2003). Familiarity with mental
illness and social distance from people with schizophrenia and major depression:
testing a model using data from a representative population survey. Schizophrenia
Research, 69, 175-182.
Boghosian, S. (2011). Counseling and psychotherapy with clients of Middle Eastern
descent: A qualitative inquiry. Utah State University Merrill-Cazier Library, 898.
Bendek, D. M., Wynn, G. H. (2010). Clinical manual for management of PTSD.
Arlington, VA: American Psychiatric Publishing, Inc.
.Bogardus, E. S. (1959). Social distance. Los Angeles, CA: The Antioch Press, Yellow
Springs, Ohio.
Bogardus, E. S. (1967). A forty year racial distance study. Los Angeles, CA: University
of Southern California.
Bradford, J. W. (2009). American/Muslims: Reactive solidarity, identity politics and
social identity formation in the aftermath of September 11th
. Dissertation
Abstracts International Section, 70, 1042.

122
Britto, P. R. (2008). Who am I? Ethnic identity formation of Arab Muslim children in
contemporary U.S. society. American Academy of Child and Adolescent
Psychiatry,47, 853-857.
Brofenbrenner, U. (1993). Living through societal chaos: Developmental risks and
rescues. Newsletter of the International Society for the Study of Behavioral
Development, 23, 1-2.
Chaichian, M. (1997). First generation immigrants and the question of cultural identity.
International Migration Reviews, 31, 612-627.
Clinard, M. B., & Meier, R. F. (2010). Sociology of deviant behavior. Belmont, CA.
Wadworth Cengage Learning.
Contrada, R. J., Ashmore, R. D., Gary, M. L., Coups, E., Egeth, J. D., Sewell, A., …
Chasse, V. (2000). Ethnicity-related sources of stress and their effects on well-
being. Current Directions in Psychological Science, 9, 136-139.
Crandall, C. S., &Warner, R. H. (2005). How a prejudice is recognized. Psychological
Inquiry,16, 137-141.
Creswell, John (1998). Qualitative inquiry and research design: Choosing among five
traditions. Thousand Oaks, CA: Sage.
Clary, E., & Tesser, A. (1983). Reactions to unexpected events – the naïve scientist and
interpretive activity. Personality and Social Psychology Bulletin, 9, 609-620.
Clay, R. A. (2011). Muslims in America, post 9/11. American Psychological Association,
42, 72.
Cohen, S., Kamarck, T., & Mermelstein, R. (1983). The global measure of perceived
stress. Journal of Health and Social Behavior, 24, 385-396.

123
Correll, J., Park, B., Judd, C. M., Wittenbrink, B., Sadler, M. S., & Keesee, T. (2007).
Across the thin blue line: Police officers and racial bias in the decision to shoot.
Journal of Personality and Social Psychology, 9, 1006-1023.
Crocker, J., & Major, B. (1989). Social stigma and self-esteem: The self-protective
properties of stigma. Psychological Review, 96, 608-630.
Daniel, J. (2012). Sampling essentials. Practical guidelines for making sampling choices.
The Thousand Oaks, CA: SAGE Publications, Inc.
Daniel, L. C., Heckman, C. J., Kloss, J. D., & Manne, S. L. (2009). Comparing
alternative methods of measuring skin color and damage. Cancer Causes Control,
20, 313-321.
Darnell, F. J. (2002). Iranian Americans: A comparative study of Iranian cultural
retention among three generations of Iranian Americans (Doctoral dissertation,
Humboldt State University). Retreived from
http://humboldtdspace.calstate.edu/handle/2148/897
Deaux, K. (1993). Reconstructing social identity. Personality and Social Psychology
Bulletin, 19, 4-12.
Derous, E. (2009) Hiring discrimination against Arab minorities: Interactions between
prejudice and job characteristics. Human Performance, 22, 297-320.
Dion, K. L., Earn, B. M., & Yee, P. H. N. (1978). The experience of being a victim of
prejudice. International Journal of Psychology, 13, 197-214.
Doosje, B., Zimmermann, A., Kupper, B., Zick, A., & Meertens, R. L. (2009). Terrorist
threat and perceived Islamic support for terrorist attacks as predictors of personal
and institutional out-group discrimination and support for anti-immigrant policies-
124
evidence from 9 European countries. International Review of Social Psychology,
22, 203-233.
Dovidio, J. F., & Gaertner, S. L. (1986). Prejudice, discrimination, and racism. San
Diego, CA: Academic Press.
Eagly, A. H., & Kite, M. E. (1987). Are stereotypes of nationalities applied to both
women and men? Journal of Personality and Social Psychology, 53, 451-462.
Feagin, J. R., & Feagin, C. B. (2003). Racial and ethnic relations (7th
ed.). Upper Saddle
River, NJ: Prentice Hall.
Federation of Zoroastrian Associations of North America. (2004). Retrieved from
http://www.fezana.org/PressReleases
Freeman, H. E., Ross, J. M., Armor, S., & Pettigrew, R. F. (1966). Color gradation and
attitudes among middle class income Negroes. American Sociological Review, 31,
365-374.
Gerbner, G., Gross, L., Morgan, M., & Signorielli, N. (1994). Growing up with
television: The cultivation perspective. In J. Bryant and D. Zillman (eds.), Media
effects, p. 17-41. Hillsdale, NJ: Lawrence Erlbaum Associates.
Ghavami, N. & Peplau, L. A. (2013). An intersectional analysis of gender and ethnic
stereotypes. Testing three hypotheses. Psychology of Women Quarterly, 37, 113-
127.
Gilbert, D. J. (1998). The prejudice perception assessment scale: Measuring stigma
vulnerability among African American students at predominantly Euro-American
universities. Journal of Black Psychology, 24, 305-321.
Goff, P. A., Davies, P. G., & Steele, C. M. (2008). The space between us:

125
Stereotype threat and distance in interracial contexts. Journal of Personality and
Social Psychology, 94, 91-107.
Gonzalez, M. G., Burke, M. J., Santuzzi, A. M., & Bradley, J. C. (2003). The impact of
group process variables on the effectiveness of distance collaboration groups.
Computers in Human Behavior, 19, 629-648.
Goodstein, L. (2006, September, 6). Zoroastrians keep the faith, and keep dwindling. The
NewYork Times.
Gullikson, A. (2005). The significance of color declines: A re-analysis of skin tone
differentials in post-civil rights America. Oxford Journals, Oxford University
Press, 84, 157-180.
Gryczynski, J., & Ward, B. W. (2012). Religiosity, heavy alcohol use, and vicarious
learning networks among adolescents in the United States. Health Education &
Behavior, 39, 341-351.
Haque, A. (2004). Religion and mental health: The case of American Muslims. Journal
of Religion and Health, 43, 45-58.
Harvey, J. H., Yarkin, K. L., Lightner, J. M., & Town, J. P. (1980). Unsolicited
interpretation and recall of interpersonal events. Journal of Personality and
Social Psychology, 38, 551-568.
Hatch, J. A. (2002). Doing qualitative research in education settings. Albany, NY:
SUNY Press.
Henslin, J. M. (2003). Sociology, a down to earth approach (6th
ed.). Boston, MA: Allyn
and Bacon.

126
Heradstveit, D., Bonham, M. G. (2007). What the axis of evil metaphor did to Iran. The
Middle East Journal, 61, 241-440.
Herndon, R. M. (2006). Handbook of neurologic rating scales. New York, NY: Demos
Medical Publishing, Inc.
Higham, J. (1984). Send these to me. Immigrants in urban America. Baltimore. MD: The
John Hopkins University Press.
Hiro, D. (1990). The longest war: The Iran-Iraq military conflict. United States of
America:Routledge Chapman & Hall, Inc.
Horsfall, S. & Salih, I. (2003, August). Social distance between people of Middle Eastern
descent and students at a Southern U.S. university. Paper presented at the annual
meeting of the American Sociological Association, Atlanta, GA. Abstract
retrieved from
http://citation.allacademic.com/meta/p_mla_apa_research_citation/1/0/7/0/0/p107
002_index.html
Hoschild, A., & Machung, A. (2012). The second shift: Working families and the
revolution at home. New York, NY: The Penguin Group.
Houston, L. N. (1990). Psychological principles and the Black experience. Lanham, MD:
University Press of America, Inc.
Hutchinson, P. (2011). Prejudice against Muslims: Anxiety as a mediator between
intergroup contact and attitudes, perceived group variability and behavioral
intentions. Ethnic and Racial Studies, 34, 40-61.

127
Human Rights Watch. (2002). “We are not the enemy,” Hate crimes against Arabs,
Muslims, and those perceived to be Arab or Muslim after September 11, 2001.
Agency France Press. Vol. 14, No. 6 (G). New York, NY.
Infinito, J. (2003). Jane Elliot meets Foucault: The formation of ethical identities in the
Classroom. Journal of Moral Education, 32, 67-76.
Janesick, V. (1998). “Stretching” exercises for qualitative researchers. Thousand Oaks,
CA:Sage.
Johnston, P., Mingst, K., & Sigelman, L. (1980). Mirror images in Americans’
perceptions of nations and leaders during the Iranian hostage crisis. Journal of
Peace Research, 17, 325-337.
Jones, T. (2000). Shades of brown: The law of skin color. Duke Law Journal, 49, 1487-
1557.
Kahlor, L., Dunwoody, S., & Griffin, R. J. (2002). Attributions in explanations of risk
estimates. Public Understanding of Science, 11, 243-257.
Katz, I. (1991). Gordon Allport’s the nature of prejudice. Political Psychology, 12, 125-
157.
Kelley, H. H. (1971). Attribution in social interaction. New York: General Learning
Press.
Khanlou, N. Koh, J., & Mill, C. (2008). Cultural identity and experiences of prejudice
and discrimination of Afghan and Iranian immigrant youth. International Journal
of Mental Health and Addiction, 6, 514-516.
Koleser, J. M. (2009). Measuring acceptance of immigrant groups in the U.S.: The
importance of the semantic differential scale in conjunction with the social

128
distance scale (Doctoral dissertation). Retrieved from
http://mss3.libraries.rutgers.edu/dlr/showfed.php?pid=rutgers- lib:26094
King, E. B., Ahmad, A. S. (2010). An experimental field study of interpersonal
discrimination toward Muslim job applicants. Personnel Psychology, 63, 881-906.
Kleg, M. (1993). Hate, prejudice, and racism. Albany, New York: State University of
New York Press, Albany.
Krippendorff, K. H. (2003). Content Analysis: An introduction to its methodology.
Beverly Hills, CA: SAGE Publications, Inc.
Lee, J. J. (2007). Neo-racism toward international students: A critical need for change.
About Campus, 11, 28-30.
Lippi-Green, R. (1994). Accent, standard language ideology, and discriminatory pretext
in the Courts. Language in Society, 23, 163-198.
Lofland, J., Snow, D., Anderson, L., & Lofland, L. H. (2006). Analyzing social settings:
A guide to qualitative observation and analysis (4th
ed.). Belmont, CA: Thomson
Wadsworth.
Lorber, J. (1994). Paradoxes of gender. Binghamton, NY: Yale University Press.
Mayer, R. (2012). Information processing. Washington, DC: American Psychological
Association.
McLauchlin, T., Pearlman, W. (2011). Out-group conflict, in-group unity?:Exploring the
effect of repression on intramovement cooperation. The Journal of Conflict
Resolution, 56, 41-66.
Miles, M. B., & Huberman, A. M. (1994). Qualitative data analysis (2nd
ed.). Thousand
Oaks, CA: SAGE Publications, Inc.

129
Miller, L. Nayeli-Rodriguez, W. E., & Cruz, M. (2010). War over ground zero.
Newsweek, 145, 26-33.
Mostofi, N. (2003). Who we are: The perplexity of Iranian-American identity. The
Sociological Quarterly, 44, 681-703.
Nail, P. R., Bedell, K. E., & Little, C. D. (2003). Should president Clinton be prosecuted
for perjury? The effects of preference for consistency, self-esteem, and political
party affiliation. Personality and Individual Differences, 35, 1821-1831.
Navarre-Jackson, L. C. (2011). The status of stigma (Doctoral dissertation). Retrieved
from http://ir.uiowa.edu/etd/1250/.
Nincic, M., Russett, B. (1979). The effect of similarity and interest on attitudes toward
foreign countries. Public Opinion Quarterly, 43, 68-78.
Nisbett, R. E., & Bellows, N. (1977). Verbal reports about causal influences on social
judgments: Private access versus public theories. Journal of Personality and
Social Psychology, 35, 613-624.
Nisbett, R. E., Caputo, C., Legant, P., & Marecek, J. (1973). Behavior as seen by the
Actor and as seen by the observer. Journal of Personality and Social Psychology,
27, 154-164.
Oakes, P. J., & Turner, J. C. (1980). Social categorization and intergroup behavior: Does
minimal intergroup discrimination make social identity more positive? European
Journal of Social Psychology, 10, 295-301.
Omeish, M. S. (1999). Muslim students’ perceptions of prejudice and discrimination in
American academia: Challenges, issues, and obstacles and the implications for

130
educators, administrators, and university officials. Dissertation Abstracts
International Section, 60, 0360.
Osgood, C. E., May, W. H., & Miron, M.S. (1975). Cross-cultural universals of affective
meaning. Urbana, IL: University of Illinois Press.
Perdomo, G. (2012). Shahs of Sunset shows a distorted view from Tehrangeles. A reality
show about spoiled, bratty Iranian Americans has enraged the Persian expat
community. Macleans, 125.
Peteraf, M., Shanley, M. (1997). Getting to know you: A theory of strategic group
identity. Strategic Management Journal, 18, 165-186.
Pronin, E., Gilovich, T., & Ross, L. (2004). Objectivity in the eye of the beholder:
Divergent perceptions of bias in self versus others. Psychological Review, 111,
781-799.
Pronin, E., & Kugler, M. B. (2007). Valuing thoughts, ignoring behavior: The
introspection illusion as a source of the bias blind spot. Journal of Experimental
Social Psychology, 43, 565-578.
Paradies, Y. (2006). A systematic review of empirical research on self-reported racism
and health. International Journal of Epidemiology, 35, 888-901.
Parrillo, V. N. (1994). Strangers to these shores: race and ethnic relations in the United
States (8th
ed.). Pearson Education, Inc.
Partiali, N. R. (2012). Family conflict, psychological maladjustment, and the mediating
roles of sociotropy and coping in Iranian American adolescents (Doctoral

131
Dissertation). Retrieved from
http://xerxes.calstate.edu/fullerton/metasearch/record?group=2012-05-20-
000440&resultSet=020898&startRecord=1
Perez, D. F., Nie, J. X., Ardern, C. I., Radhu, N., & Ritvo, P. (2011). Impact of
participant incentives and direct and snowball sampling on survey response rate in
an ethnically diverse community: Result from a pilot study of physical activity
and the built environment. Journal of Immigrant Minority Health, 1-8.
Porter, J. R., & Washington, R.E. (1993). Minority identity and self-esteem. Annual
Review of Sociology, 19, 139-161.
Public Broadcasting Service, Frontline. (2011). Retrieved from http://www.pbs.org/wgb
h/pages/frontline/shows/tehran/etc/cron.html
Razran, G. H. S. (1939). A quantitative study of meaning by a conditioned salivary
technique (semantic conditioning). Science, 90, 89-90.
Ricard, S. (2012). Framing the Iranian threat: An analysis of Canadian and American
Newspaper coverage of the Iranian nuclear project, September 11 2000-
September 11- 2002 (Doctoral dissertation). Retrieved from
http://xerxes.calstate.edu/fullerton /meta sea rch/record?group=2012-05-20-
000421&resultSet=018719&startRecord=1
Rollock, D., & Vrana, S. R. (2005). Ethnic social comfort I: Construct validity through
social distance measurement. Journal of Black Psychology, 31, 386-417.
Rose, P. I. (1997). They and we: Racial and ethnic relations in the United States. New
York, NY: McGraw-Hill.

132
Ross, L. (1977). The intuitive psychologist and his shortcomings: Distortions in the
attribution process. Advances in Experimental Social Psychology, 10, 173-220.
Roth, W. D. (2005). The end of the one-drop rule? Labeling of multiracial children in
Black Intermarriages. Sociological Forum, 20, 35-67.
Rouhana, N. N., & Fiske, S. T. (1995). Perception of power, threat, and conflict intensity
in asymmetric intergroup conflict: Arab and Jewish citizens of Israel. The
Journal of Conflict Resolution, 39, 49-81.
Sachdev, I., & Bourhis, R. Y. (1985). Social categorization and power differentials in
group relations. European Journal of Social Psychology, 15, 415-434.
Salazar, J. M., Marin, G. (2010). National stereotypes as a function of conflict and
territorial proximity: A test of the mirror image hypothesis. The Journal of Social
Psychology, 101, 13-19.
Saldana, J. (2003). Longitudinal qualitative research: Analyzing change through time.
Walnut Creek, CA: AltaMira Press.
Saldana, J. (2009). The coding manual for qualitative researchers. Los Angeles, CA:
SAGE Publications, Inc.
Schrieke, B. J. O. (1971). Alien Americans; a study of race relations. San Francisco, CA:
R and E Research Associates.
Schutz, A. (1967). The phenomenology of the social world. Evanston, IL: Northwestern
University Press.
Seidman, I. (2006). Interviewing as qualitative research. A guide for researchers in
education and the social sciences. New York, NY: Teachers College Press.
Shaheen, J. G. (2003). Reel bad Arabs: How Hollywood vilifies a people. The ANNALS

133
of the American Academy of Political and Social Science, 588, 171-193.
Smith, P. (2008). An introduction to the Baha’i faith. Cambridge: Cambridge University
Press.
Soares, C. (2004). Learning about prejudice and discrimination. The Internet TESL
Journal, X(11).
Stephan, W. G., Renfro, C. L., Esses, V. M., Stephan, C.W., & Martin, T. (2005). The
effects of feeling threatened on attitudes toward immigrants. International
Journal of Intercultural Relations, (29), 1-19.
Strabac, Z., & Listhaug, O. (2008). Anti-Muslim prejudice in Europe: A multilevel
analysis of survey data from 30 countries. Social Science Research, 37, 268-286.
Strauss, A. L. (1987). Qualitative analysis for social scientist. Cambridge: Cambridge
University Press.
Suleiman, M.W. (1999). Arabs in America: building a new future. Philadelphia:Temple
University Press.
Sumner, W. G. (1906). Folkways. Boston, MA: Ginn.
Sundquist, E. J. (2005). Strangers in the land. Blacks, Jews, Post-Holocaust America.
Cambridge, MA: The Belknap Press of Harvard University Press.
Tajfel, H., & Turner, J. C. (1979). An integrative theory of intergroup conflict. In W. G.
Austing & S. Worchel (Eds.), The social psychology of intergroup relations.
Monterey, CA Brooks-Cole.
Tanti, C., Stukas, A. A., Halloran, M. J., Foddy, M. (2011). Social identity change: Shifts
in social identity during adolescence. Journal of Adolescence, 34, 555-567.

134
Thomas, R. M. (2008). God in the classroom: Religion and America’s public schools.
Westport, CT: Greenwood Publishing Group, Inc.
Thompson, M. S., & Keith, V. M. (2001). The blacker the berry: Gender, skin tone, self-
esteem, and self-efficacy. Gender and Society, 15, 336-357.
The Public Affairs Alliance of Iranian Americans, (2008). Retrieved from
http://www.paaia.org/CMS/home.aspx
Tribe, R. (2002). Mental health of refugees and asylum-seekers. Advances in Psychiatric
Treatment, 8, 240-247.
Udry, J. R., Bauman, K. E., Chase, C. (1969). Skin color, status, and mate selection.
American Journal of Sociology, 76, 722-733.
United States Census, (2010). Retrieved from http://2010.census.gov/2010census/
Unkelbach, C., Forgas, J. P., & Denson, T. F. (2008). The turban effect: The influence of
Muslim headgear and induced affect on aggressive responses in the shooter bias
paradigm. Journal of Experimental Social Psychology, 44, 1409-1413.
Unkelbach, C., Goldenberg, L., Muller, N., Sobbe, G., & Spannaus, N. (2009). A shooter
bias in Germany against people wearing Muslims headgear. International Review
of Social Psychology, 22, 181-201.
Waldzus, S., Mummendey, A., & Wenzel, M. (2004). When “different” means “worse”:
In-group prototypicality in changing intergroup contexts. Journal of Experimental
Social Psychology, 41, 76-83.
Wark, C., & Galliher, J. F. (2007). Emory Bogardus and the origins of the social distance
scale. The American Sociologist, 38, 383-395.
Weaver, C. N. (2008). Social distance as a measure of prejudice among ethnic groups in
135
the United States. Journal of Applied Social Psychology, 38, 779-795.
Wolcott, H. F. (1994). Transforming qualitative data. Thousand Oaks, CA: SAGE
Publications, Inc.
White, R. K. (1970). Nobody wanted war. Garden City: Anchor.
Yamagishi, T., Mifune, N., Liu, J. H., & Pauling, J. (2008). Exchanges of group-based
favors: Ingroup bias in the prisoners dilemma game with minimal groups in Japan
and New Zealand. Asian Journal of Social Psychology, 2, 196-207.
Zaman, N. K. (2010). Understanding the experiences of discrimination in Muslim
Americans post 9/11: A qualitative study. Dissertation Abstracts International,
70, 6582.