Embed Size (px)
Citation preview

A DIGITAL LIBRARY SUCCESS MODEL FOR COMPUTER SCIENCE
STUDENT USE OF A META-SEARCH SYSTEM
Vikram Raj Vidya Sagar
Thesis submitted to the faculty of the Virginia Polytechnic Institute and State University in partial
fulfillment of the requirements for the degree of
Master of Science
in
Computer Science and Application
Dr. Edward A. Fox
Dr. Weiguo Patrick Fan
Dr. Manuel A. Pérez-Quiñones
Dr. Naren Ramakrishnan
Dr. Dennis G. Kafura
August 4, 2006 Blacksburg, VA
Keywords: Behavioral Modeling, Computer Science

A DIGITAL LIBRARY SUCCESS
MODEL FOR COMPUTER SCIENCE STUDENT USE OF A
META-SEARCH SYSTEM
Vikram Raj Vidya Sagar
ABSTRACT
The success of any product of Information Technology lies in its acceptance by
the target audience. Several behavioral models have been formulated to analyze
factors that affect human decisions to accept new technology while some
technology is already in place. These models enable us to identify the areas of
concern within the system and its environment and to address them. However,
these models are based in industrial settings, and are more suited to situations
when a person is introduced to the field of Information Technology. A separate
stream of research tries to model the factors that cause an Information System,
especially at the workplace, to be termed a success. No such models exist for the
academic community and the Computer Science student community, in
particular. In this thesis, the success of a new academic meta-search system for
the Computer Science student community is measured and the extent to which
various factors affect this success is identified. For this purpose, an Information
System success model is composed with the help of models for technology
acceptance and Digital Library quality metrics. The resultant model is then used
to formulate a survey instrument and the results of a user study with this
instrument are used to begin to validate this model.

iii
TABLE OF CONTENTS
Abstract ........................................................................................................................... ii List of Figures ................................................................................................................ iv Acknowledgments ......................................................................................................... vi Chapter 1: Problem Description and Approach ......................................................... 1 Chapter 2: The Meta-Search System ............................................................................ 3
Chapter 3: Literature Review ........................................................................................ 8 Chapter 4: Model for the CS Student Community ................................................... 24 Chapter 5: Questionnaire and IRB Approval ........................................................... 33 Chapter 6: User Study .................................................................................................. 35
Chapter 7: Analysis of Results .................................................................................... 37 Chapter 8: Conclusion ................................................................................................. 52 Bibliography .................................................................................................................. 54 Appendix A ................................................................................................................... 57
Appendix B ................................................................................................................... 63 Appendix C ................................................................................................................... 77 Appendix D .................................................................................................................. 80

iv
LIST OF FIGURES
Figure 1: CIC Portal View .................................................................................................................... 4 Figure 2: M9 View ................................................................................................................................. 5
Figure 3: Super-Google View............................................................................................................... 6 Figure 4: Meta Scholar 3D View ......................................................................................................... 7 Figure 5: Theory of Reasoned Action ................................................................................................. 9 Figure 6: Technology Acceptance Model .........................................................................................11
Figure 7: Theory of Planned Behavior ..............................................................................................12 Figure 8: Computer Self-efficacy Model ...........................................................................................13 Figure 9: Decomposed Theory of Planned Behavior .....................................................................15 Figure 10: TAM Augmented with Experience.................................................................................16
Figure 11: Pre-Implementation Version ...........................................................................................17 Figure 12: Post-Implementation Version .........................................................................................17 Figure 13: Extended TAM .................................................................................................................19 Figure 14: Unified Theory of Acceptance and Use of Technology ...............................................20
Figure 15: DeLone and McLean's Model of IS Success .................................................................21 Figure 16: Seddon's Model of IS Success .........................................................................................22 Figure 17: IS Success ...........................................................................................................................25 Figure 18: Life Cycle of a Digital Object (reproduced with permission of author) .....................26
Figure 19: Model to measure DL Success (reproduced with permission of author) ...................27 Figure 20: Model of Computer Science Student Community ........................................................29 Figure 21: Regression Analysis - Graduate Students - Information Quality ................................63 Figure 22: Regression Analysis - Undergraduate Students – Information Quality ......................64
Figure 23: Regression Analysis - Graduate Students - System Quality .........................................65 Figure 24: Regression Analysis - Undergraduate Students - System Quality ................................66 Figure 25: Regression Analysis - Graduate Students - Performance Expectancy ........................67 Figure 26: Regression Analysis - Undergraduate Students – Performance
Expectancy .............................................................................................................................67 Figure 27: Regression Analysis - Graduate Students - Satisfaction ...............................................68 Figure 28: Regression Analysis - Undergraduate Students - Satisfaction ......................................68 Figure 29: Regression Analysis - Graduate Students - Behavioral Intention ................................69
Figure 30: Regression Analysis - Undergraduate Students - Behavioral Intention ......................69 Figure 31: Regression Analysis - Voluntary Users – Information Quality....................................70 Figure 32: Regression Analysis - Involuntary Users – Information Quality .................................71 Figure 33: Regression - Experience - Voluntary Users – System Quality .....................................72
Figure 34: Regression - Experience - Involuntary Users – System Quality ..................................73 Figure 35: Regression Analysis - Voluntary Users - Performance Expectancy ............................73 Figure 36: Regression Analysis - Involuntary Users - Performance Expectancy .........................74 Figure 37: Regression Analysis - Voluntary Users - Satisfaction ...................................................74

v
Figure 38: Regression Analysis - Involuntary Users - Satisfaction .................................................75 Figure 39: Regression - Voluntary Users - Behavioral Intention ...................................................75
Figure 40: Regression - Involuntary Users - Behavioral Intention ................................................76 Figure 41: IRB Approval ....................................................................................................................78 Figure 42: IRB Amendment Approval .............................................................................................79 Figure 43: Permission obtained from Dr. Gonçalves to reproduce Figure 18 .............................80
Figure 44: Permission obtained from Dr. Shen to reproduce Figure 19 ......................................81

vi
ACKNOWLEDGMENTS
I would like to thank my family and friends who motivated me to take up
graduate studies and have supported me throughout my student life.
This being my first stint with research, I needed constant prodding and direction.
Dr. Fox has been patient with me and helped me with all issues that came up
during the course of my thesis. Dr. Fan and Hui Lin guided me during the
statistical analysis of the model. My heartfelt thanks go to them.
I might not have taken up this topic for my thesis if not for Dr. Rao Shen; a
special thanks to her. All along, she provided valuable advice and comments.
I had significant assistance during various phases of my thesis. If not for the
timely support from Aaron Krowne and Urvashi Gadi, this would not have been
possible. On the theoretical side of the thesis, I had considerable support from
Rohit Chopra. Special thanks go to each of them.
Given the nature of the thesis, I had to have many users take up a study. Help
flowed in from many quarters, from known and unknown faces. I should thank
them all. Also, special thanks go to both Pengbo and Srinivas who helped me
with equipment when my computer crashed.
During my life of being a graduate student, I gained particular inspiration from
taking courses under Dr. Godmar Back, Dr. Eunice Santos, and Dr. Robert
Broadwater. I can now confidently call myself an engineer, thanks to them.

1
CHAPTER 1: PROBLEM DESCRIPTION AND APPROACH
Various search engines are currently available to the academic community. When
a new search engine is introduced to the community, various factors contribute to
its acceptance. These factors and the extent to which each factor affects the
overall acceptance of the new search engine need to be identified. The
relationship between each of these factors needs to be established. A model of
the process of reaching at the decision, regarding if a new search engine should
be used instead of others, also needs to be scientifically verified for correctness.
The Computer Science academic community uses various commercial search
engines such as Google™, Yahoo!™, etc., as well as academic search engines
such as CiteSeer, IEEE, etc. As a part of a research project funded by the
Institute of Library and Museum Sciences (IMLS) [Grant #415019], Emory
University is constructing a meta-search engine to better address the needs of the
Computer Science academic community. Given that the community is already
accustomed to some tools of realizing their goals, the acceptance of this new
search engine, and the factors which affected users‟ preferences were studied.
This could have been done by asking the target audience to use the search
engines for a while, and then asking them if they were satisfied with it or not.
However, in the case of a user being unsatisfied, specific feedback about what
was negatively affecting the user, and to what extent it was affecting them, would
probably not be obtained.
When a model of system acceptance is formulated, the possible visible and
invisible factors that could affect the user‟s satisfaction, and subsequently the
acceptance of the system, are brought together, and the cause and effect

2
relationships among these factors are identified. The target community also could
have some unique characteristics which might be useful to be discovered so that
future efforts can be directed by exploiting that knowledge. Some perceived
factors might not have any influence at all, and so such knowledge gained could
save a considerable amount of effort. Also, useful knowledge can be gained
which can be used proactively regarding other products/systems designed for the
same community in future.
The extent to which each factor has a bearing on the overall acceptance needs to
be scientifically proved. Based on the facts that there exist multiple variables that
determine acceptance and that these variables might interact, the model derived
should be a multiple linear regression model. Multiple linear regression analysis
establishes the coefficients for such variables, in effect showing the extent to
which they affect a variable of interest. Having established the extent to which
one factor affects another, corrective measures regarding negative effects can be
prioritized. In general, such corrective or other measures might have a cascading
effect on those factors on which they have a direct or indirect causal effect. These
various considerations have led researchers to build models and apply suitable
regression analyses for measuring acceptance and satisfaction.
The next section describes the meta-search system that was developed, and which
we were charged to help evaluate. The subsequent section summarizes the
various models that were studied to derive a model that would represent assist
with our assessment work. The synthesis of this model is explained in detail in the
following section.

3
CHAPTER 2: THE META-SEARCH SYSTEM
This chapter provides an overview of the system that was tested for acceptance.
The features offered by the meta-search engine are explained and visual examples
are provided.
Search engines are used primarily for one of two reasons:
Locating an artifact whose identity is already known
Exploring for an artifact. This often is based on some pre-formulated idea.
The meta-search engine was developed by researchers at Emory University in an
attempt to better address the needs of the academic community. The system was
built using an iterative approach – a prototype is constructed, focus groups
comment on these prototypes, these comments are taken into account, another
prototype is constructed, and the cycle repeats again.
The user‟s goal while using the search engine cannot be known beforehand. To
overcome this problem, this meta-search engine provides four different views for
the same results, and the user is allowed to choose the view that suits best.
The meta-search engine was designed to work with Firefox™. Access to this
search engine was set up on a web server. The data for the search-engine index
was obtained from the collections available at CITIDEL (Computing and
Information Technology Interactive Digital Educational Library), located at
http://www.citidel.org, which houses meta-data harvested from various sources.

4
The CIC (Committee on Institutional Cooperation) view arranges the results in
the order of decreasing text similarity. It was named because of the similarity to
how the CIC portal lays out results. A snapshot of the CIC view is shown in
Figure 1.
Figure 1: CIC Portal View

5
The Meta-9 (M9) view was so named because of its similarity to the commercial
A9™ search engine. It divides the results into bins based on the collections from
where the resources are obtained. The user can collapse/expand each collection
bin. The individual results within each bin are ordered based on text similarity.
This provides two dimensions to the ordering. An illustration of the M9 view is
given in Figure 2.
Figure 2: M9 View

6
The S-G (Super-Google) view arranges the results after ordering them based on
popularity, text similarity, and both metrics and laying them next to each other.
Popularity could have different definitions – number of clicks leading to a
resource, the number of times it is rated highly by researchers, etc. In this case,
the rating provided by other academicians was taken to be the definition of
popularity. A snapshot of the S-G view is shown in Figure 3.
Figure 3: Super-Google View

7
The Meta-Scholar 3-D view goes one step further and arranges results in a three-
dimensional manner. The results are primarily divided by the collections from
where they are obtained. These results are then segmented in accordance with the
popularity of the resources into four categories, namely highest, high, medium,
and low/unknown. Within each of these categories, the results are arranged in
decreasing order of text similarity to the query. A snapshot is shown below in
Figure 4.
Figure 4: Meta Scholar 3D View

8
CHAPTER 3: LITERATURE REVIEW
This section summarizes knowledge gained from existing models from a
historical and a learning perspective. Knowledge gained from these models was
used in formulating an acceptance model specifically for the Computer Science
student community, but possibly also for others in the academic world.
The literature reviewed for this thesis can be broadly classified into three
categories – technology acceptance, Information Systems (IS) success, and Digital
Library (DL) quality metrics.
Considerable interest was expressed in studying technology acceptance since the
„80s when Information Technology was clearly seen to have an impact on
people‟s lives. In those days, computers were being introduced at the workplace.
However, many of the anticipated benefits did not accrue, due to reluctance of
users to accept computers and the associated software systems. This caused
researchers, particularly in the Behavioral Sciences community, to explore what
the reasons might be. While some researchers treated this as a new problem and
started developing customized models, others looked at this as a special case of
the Theory of Reasoned Action [7] (summarized in Figure 5) and looked at it
from the perspective of human behavior in the wake of a new device being
introduced in their way of life. The Theory of Reasoned Action explains actual
human behavior to be the outcome of the effect of two categories of significant
beliefs – behavioral and normative.

9
Figure 5: Theory of Reasoned Action
Behavioral Beliefs can be mathematically explained as the sum of products of
various aspects of behavioral belief and the user‟s evaluation of their importance
( biei). Normative Beliefs is similarly the sum of products of various aspects of
belief about social compliance and the user‟s evaluation of their importance (
nbimci). While the behavioral beliefs reflect one‟s attitude towards behavior,
normative beliefs act as indicators of social pressure.
One of the earliest studies was reported by Bailey et al. [3] in which they
attempted to develop a tool that would measure and analyze computer user
satisfaction. It is a simple one-level model that attempts to list the factors that
might affect user satisfaction and identifies the perceived importance of each of
them to the user.
Mathematically, user satisfaction can be expressed as
Si = RijWij with j varying between 1 and n
where Rij = the reaction to factor j by individual i and Wij = the importance of
factor j to individual i.

10
One interesting aspect is that it takes care of the fact that the importance of each
factor might be different for different users. However, it does not take care of the
relationship between these factors. Moreover, it is tailor-made for a user who is
made to get accustomed to a computer in the workplace. This becomes evident
from the work reported by Doll et al. [11]; they could not reuse this model but
instead had to develop a model from scratch so as to measure end-user
computing satisfaction for users who had to deal with database management
systems. Also, this study was conducted in a time period when users were getting
accustomed to computers in the workplace. It does not suit today‟s situation
where computers are ubiquitous, nor in the scope of this thesis where the need is
to measure the satisfaction of the academic user of using a meta-search system;
that requires a fresh approach.
Davis et al. [7] studied two different models – the Theory of Reasoned Action
(TRA) and the Technology Acceptance Model (TAM) - to see how they
performed with respect to a specialized user class; computer users. Studies in the
field of behavioral sciences led to the development of TRA by Fishbein and
Azjen [12]. That model is highlighted in Figure 5; it was successful in predicting
and explaining behavior across a wide variety of domains. However, as the
authors of [8] observed, TRA was too general, and so led to the development of
the Technology Acceptance Model (TAM) [8], that explains computer usage
behavior specifically. It is illustrated in Figure 6, for a quick reference. TAM
builds on a wealth of knowledge of Information Systems (IS) accumulated over a
decade, and is well-suited to model computer acceptance. External variables are
introduced. The notion of there being no relationship between Perceived
Usefulness (U) and Perceived Ease of Use (E) was done away with. Also, the
significant effect of Perceived Usefulness on the intention to use was brought out
by introducing a causal relationship between them.

11
Figure 6: Technology Acceptance Model
Both models were tested with a set of users who were introduced to a new word
processor. Attitudes intervened between beliefs and intentions lesser than was
predicted by TRA and TAM. They recommended further research to identify the
conditions under which attitudes mediate the belief-intention link.
In another study, Davis [9] observed that valid measurement scales for predicting
user acceptance were in short supply and tried establishing such scales for
Perceived Ease of Use (E) and Perceived Usefulness (U) in the TAM. The set of
scale items that were suggested initially were subjected to a pilot test and analysis
for reliability and validity. The set was refined to ten each for usefulness and ease
of use. Two studies were conducted to see how well the scale could be adapted
across systems. In keeping with the observation of Cohen et al. [4], in both
studies, usefulness was more strongly linked to usage than ease of use. It also was
pointed out that the effect of intrinsic motivation as a factor needs to be studied.
This was a pointer for research in the future.
Alternative theories were explored to explain the behavior of people with
computers. One such theory was proposed by Triandis[24]. Thompson et al. [23]

12
used this theory to identify factors affecting user acceptance. They found that
social norms and three components of expected consequences, namely
complexity of use, fit between the job and PC capabilities, and long-term
consequences play important roles. However, the theory does not signify the
relation between effect and utilization as discovered by the authors. In other
words, the results suggest the importance of training in the deployment process.
Meanwhile, the TRA, on which the TAM was built, was subjected to an overhaul.
Ajzen [2] did a detailed analysis and came up with the Theory of Planned
Behavior (TPB) to “overcome the limitations that deal with behaviors over which
people have incomplete volitional control”. He added Perceived Behavioral
Control as another factor that affects behavioral intention, and that affects
behavior (mildly) as well. Interdependencies between attitude and subjective
norm, subjective norm and perceived behavioral control, and attitude and
behavioral control, were added to make the model more complete.
Figure 7: Theory of Planned Behavior

13
The model was empirically studied, and the authors claim to have proved the
sufficiency of the theory.
While the above literature attempted to model the Information System in the
context of an environment of the user, Compeau et al. [5] presented a different
perspective by proposing a model to measure the self-efficacy of the user, placing
the system/technology under observation in the environment. It builds on the
Social Cognitive Theory which states that environmental influence, personal
factors and behavior exhibit triadic reciprocality. The resulting model (shown in
Figure 8) shows support, others‟ use, and encouragement by others, to be
positively affecting self-efficacy and outcome expectation. Self-efficacy also
positively affects outcome expectation. Depending on the efficacy, it may cause
affection or anxiety for usage of the system/technology.
Figure 8: Computer Self-efficacy Model
However, during the course of user studies, they discovered that support could
negatively affect efficacy. An example is when a user finds something to be tough

14
and the support personnel consider it to be trivial and fix it instantly. Compeau et
al. [6] validated this model using a longitudinal study.
The TAM could not keep up with changes in the field of IT. Taylor and Todd
[21] put the TAM (Figure 6), the TPB (Figure 7), and a decomposed variant
(Figure 9) of it, to the test. Their differences were identified, and the fact that
TAM is not specialized to accommodate present day needs became clear from the
fact that the authors state that the model has reasonable explanatory power, but
has not produced consistent results in all cases. Also, they point out that there are
quite a number of external variables that affect usage – system design
characteristics, training, documentation, and other types of support. While the
TPB identifies the first-level affecting factors of behavioral intentions, the
decomposed model breaks down these factors to another set of dependencies.
After user studies, the authors analyzed and found that the decomposed version
of the TPB works best among the three. The authors emphasized that these
models have to be updated with improvements in technology.

15
Figure 9: Decomposed Theory of Planned Behavior
The models discussed so far had been developed for situations where users were
introduced to new systems. The importance of prior experience was not taken
into account. This was becoming significant as the problem of being introduced
to IT shifted to being introduced to a competitor‟s product, or a new version of
an existing product. Taylor and Todd assessed IT usage with prior experience [22]
taken as a determinant in the TAM. They tried to assess if TAM could predict
behavior for inexperienced users and if the determinants of IT usage are the same
for experienced and inexperienced users. In particular, the effect of experience on
Perceived Behavioral Control (PBC) on behavior was studied. The authors noted
that the knowledge gained from past behavior helps to shape intention because
past experience may make low probability events more salient, ensuring that they

16
are accounted for in the formation of intentions. To help TAM accommodate
experience as a factor, PBC was linked to behavior, as can be seen in Figure 10.
The authors observed that the PBC had less impact on intention but more impact
on behavior for inexperienced users, who rely more on Perceived Usefulness.
Figure 10: TAM Augmented with Experience
As indicated earlier, with time, users had become experienced with computers
which necessitated that these models be blended into the software engineering
life cycle. Davis et al. [9] improved upon the existing TAM to produce two
versions of it – one that could be used pre-implementation, and one that could be
used after implementation of the system under study.

17
Figure 11: Pre-Implementation Version
Figure 12: Post-Implementation Version
The pre-implementation model (Figure 11) predicts acceptance with Perceived
Usefulness (U) and Perceived Ease of Use (E), while the post-implementation
(Figure 12) model predicts acceptance with Perceived Usefulness (U) alone. This
suggests that users would lay emphasis on ease of use if competing products are
equally useful. Otherwise, proven utility can have a significant impact on the
user‟s intention to use the system. Szajna [20] empirically evaluated this idea of
having two versions and compared it with the original TAM. The author pointed
out the earlier work of Ajzen [2] which says “Information gathered from
experience over a period of time certainly has the potential for changing future
intentions”. Hence, the effect of intentions on usage becomes less with

18
experience. The authors suggested reverting to TAM augmented with actual
system usage for pre- and post-implementation. They directed future researchers
to use measures other than usage to measure acceptance. They cited an example
of tax software whose acceptance cannot be measured with usage frequency, and
where reaching an accurate result can be used as a measure instead.
Davis [9] had earlier identified the need to fit in the role of Intrinsic Motivation in
TAM. This was investigated by Venkatesh [25]. Seven different training methods
were identified – tutorial, courses/lectures/seminars, computer-aided instruction,
interactive training manual, resident expert, help component, and external
training. These methods lay emphasis on communication of knowledge to users.
The author proposed that the training method would make a difference and
suggested a game-based training method to increase the Perceived Ease of Use
(E) component in TAM. This training method has disadvantages in that it is
possible for users to dismiss such training as non-related to work. Nevertheless,
the results from studies conducted favored game-based training. However, a
point to note in this study is that the age of the participants is not considered.
All along, the factors that would contribute to Perceived Usefulness (U) of the
system in the TAM model were not comprehensively listed. Venkatesh and Davis
[26] addressed this, and extended TAM to form TAM2. They also introduced the
concept of moderating variables, namely Experience and Voluntariness.
Moderating variables allow one to view different cross-sections of the user
population. The responses of each kind of users can provide interesting results.
Their work involved a comprehensive analysis of TAM for modern needs. The
study was spread over three phases – before implementation of a system,
immediately after implementation of the system, and after the user gets
comfortably acquainted with the implemented system. Studies conducted by
Hartwick and Barki [15] suggested that Subjective Norm had a major impact on

19
Perceived Usefulness in mandatory settings. The authors argue that the image and
elevated status resulting from using a technology adds impetus to Perceived
Usefulness. The authors also claim that theory and evidence exist that suggest
that the direct effect of Subjective Norm on intentions may subside over time
with increased system experience. Also, the authors identify social cognitive
attributes in the present time that affect Perceived Usefulness – Job Relevance,
Output Quality and Result Demonstrability, in addition to the existing Perceived
Ease of Use. This model worked fine across all three phases. The model is shown
below.
Figure 13: Extended TAM
Different researchers, over a period of time, have suggested various
augmentations to TRA, TAM, and TPB. Some have devised different models by
themselves. Each derived model has its own share of pros and cons. To redirect
these differing views onto a single track and to derive knowledge from associated
frameworks, Venkatesh et al. studied eight popular models, and came up with a

20
Unified Theory of Acceptance and Use of Technology (UTAUT) to streamline
them all [27]. The concepts underlying all frameworks contain interactions
between three entities – Individual Reactions to Using Information Technology,
Intentions to Use Information Technology, and Actual Use of Information
Technology. The models studied were TRA, TAM/TAM2, Motivational Model
(MM), Model of PC Utilization (MPCU), Innovation Diffusion Theory (IDT),
TPB/Decomposed TPB, Social Cognitive Theory (SCT), and Combined TAM-
TPB. Figure 14 shows the model that the authors proposed as a unified
framework.
Figure 14: Unified Theory of Acceptance and Use of Technology
The UTAUT framework proposes Performance Expectancy, Effort Expectancy,
Social Influence and Facilitating Conditions to be affecting Behavioral Intention
while being moderated by Gender, Age, Experience and Voluntariness. The
Behavioral Intention thus formed along with the Facilitating Conditions affect
the Use Behavior. This model was subjected to empirical studies and it performed

21
well. The concept of moderating variables is in keeping with the expansion of
technology to a wider audience.
The discussion so far has focused on exploring user behavior. The following
paragraphs describe methods used in defining and measuring the success of an
Information System.
The work done by De Lone and Mc Lean [10] is considered to be a milestone in
modeling success of Information Systems. The model proposed by them is
shown in Figure 15.
Figure 15: DeLone and McLean's Model of IS Success
Seddon [18] observes the pitfalls of this model, and cites examples of where it
could be misleading. He then respecifies a model for measuring IS success which
is shown below. The details of this model are available in the next section.

22
Figure 16: Seddon's Model of IS Success
However, a key observation that can be made is that the models mentioned
above are more suited for industry-based settings. In the academic environment,
especially in that of Digital Libraries, some domain-specific quality metrics have
been proposed. Gonçalves, in his dissertation on formalizing the definition of
digital libraries [13], specifies a set of quality metrics for digital libraries along with
their precise definitions.
Shen et al. [19] studied IS success, to adapt it to measure Digital Library success
[new paper]. Accordingly, Perceived Usefulness from the IS success model was

23
replaced by Performance Expectancy from the UTAUT model. These terms are
equivalent by definition. However, this enabled us to include the moderating
factors presented by the UTAUT model. Also, the factor of Net Benefits to
Different Stakeholders from the IS Success model was replaced by Social
Influence that is borrowed from the UTAUT model. To break down System
Quality and Information Quality into constructs of relevance in the Digital
Library domain, quality metrics specified by Gonçalves [13] were used.
This section presented the findings of various authors and also showed how
researchers have gone about modeling user communities.

24
CHAPTER 4: MODEL FOR THE CS STUDENT COMMUNITY
This section explains how a model was arrived at for explaining the behavior of
the Computer Science student community. Findings from the literature explained
in the previous section, known characteristics of the community in question, and
input from Human Computer Interaction (HCI) experts contributed to the
formulation of the model.
A brief explanation of the UTAUT model proposed by Venkatesh et al. [27] was
provided in the previous chapter (Figure 14). UTAUT attempts to streamline and
unify various models that attempt to explain Behavioral Intention. The model
suggests that Performance Expectancy, Effort Expectancy, and Social Influence
will effect Behavioral Intention, which, along with Facilitating Conditions, effects
Use Behavior. The effects of these factors are moderated by Gender, Age,
Experience, and Voluntariness.
Performance Expectancy is defined as the degree to which an individual believes that
using the system will help him or her to increase productivity at work. This term
is used as a normalizing factor for various names used in each one of the eight
models that the UTAUT [27] attempts to normalize. Effort Expectancy is defined as
the effort required on the part of the user to use the system to reach his/her
goals. Social Influence is defined as the degree to which an individual perceives that
people significant to him/her would expect him/her to use the new system.
According to the model that Seddon formulated to measure the success of
Information Systems, the factors that contribute to that success are shown in
Figure 17.

25
Figure 17: IS Success
Information Quality is concerned with relevance, timeliness, accuracy, etc. of
information generated by the Information System. System Quality is concerned
with aspects such as the bug-free nature of the system, the consistency of the user
interface, ease of use, quality of documentation, and sometimes, quality and
maintainability of the program code.
The model suggests that the General Perceptual Measures of Net Benefits of IS
Use are chiefly affected by the Measures of Information and System Quality, and
the net benefits to other stakeholders.
To measure the success of Digital Library systems, this IS Success model needs to
be adapted accordingly. The Information Quality and System Quality constructs
are decomposed with metrics that are best suited to measure the quality of Digital
Library systems. These metrics are borrowed from Gonçalves‟ Quality Model for
Digital Libraries [14]. Gonçalves has defined a life cycle for a digital object. Each
digital object goes through four phases – creation, distribution, seeking and

26
utilization, and different metrics can be used to measure the quality of it during
each of these stages. This is shown in Figure 18 below:
Figure 18: Life Cycle of a Digital Object (reproduced with permission of author)
A meta-search engine is a container of digital objects. It is available for users after
development. Hence, the distribution and creation phases are irrelevant. This
would be the case for any similar service. Hence, the relevant phases of the life
cycle are seeking and utilization which can be broken down into measurable
constructs (Figure 18).

27
The model proposed to measure DL success by Shen et al. [19] is shown in
Figure 19.
satisfactionperformance
expectancy
behavioral
Intention to
(re)use
relevance adequacy timeliness
reliability understandability scope
relevance adequacy timeliness
reliability understandability scope
accessibilityease of use
joy of use reliability
user
interface
social influence
information quality
(IQ)
system quality
(SQ)
Figure 19: Model to measure DL Success (reproduced with permission of author)
This model uses metrics from the life cycle of a digital object provided by
Gonçalves [13]. However, this model by itself is generic for a given intended
audience. It needed to be adapted to fit the Computer Science student
community that was to be studied.
As can be seen, this model does not build upon the concept of moderating
variables introduced by the UTAUT framework [27]. The fact that students all
over the world do not share the same traits had to be considered as well. Thus, in

28
addition to Gender, Age, Voluntariness, and Experience, Race is also included as
a moderating variable.
The DL Success Model [19] does not consider the effect of review of a digital
object on information quality. The knowledge of an artifact being reviewed by
someone in the past is important to the student when selecting from a given set
of choices. A construct named Vettedness is added for this purpose.
Also, the DL Success Model [19] misses out constructs such as Support available
to the user in the form of documentation (the „Help‟ feature) and Choices
available for users of varying expertise. These factors affect the System Quality as
perceived by the student user.
Usability engineering emphasizes having interfaces for the common user and the
expert user. For most systems, the Computer Science student can be considered
an expert who would not mind if the system was not very user-friendly, as long as
he/she gets the desired outcome. In other words, the role of System Quality in
the model is minimal, but cannot be neglected. So, the effect of System Quality
on Performance Expectancy is removed. The Computer Science student being an
expert, the effect of Social Influence could affect the perceived Performance
Expectancy, but the choice of Satisfaction remains largely unaffected.
The model for the Computer Science student community thus formed is shown
in Figure 20.

29
Figure 20: Model of Computer Science Student Community

30
An explanation of each factor involved in formulating Information Quality and
System Quality in the context of a meta-search engine follows:
Relevance – This corresponds to how much the results are related to the
user‟s particular query. Gonçalves [13] defines this to be a characteristic
that can take values of either 0 or 1. However, from speaking with users
of different search engines, it was found instead that they considered
some results to be partially relevant, almost relevant, and so on.
Adequacy – When a user issues a query, he/she gets to see an information
snippet with each result and upon clicking a particular result, more
information about the resource itself is displayed, along with where the
resource can be located. When a user wants to use a search engine for
his/her research, he/she wants to see more information about the data
itself. The sufficiency of this information is essential for determining if
the quality of information is high.
Understandability – The search engine provides multiple views to the user.
The organization of results in each view was explained in Section 2.
However, this organization should make sense for the users to benefit.
This aspect measures how well the users comprehend the results as the
developers want them to.
Reliability – The search engine provides results to the user. However, in
some cases, the location of the resource indicated by the search engine or
the meta-data provided about a resource might be wrong. A search
engine should minimize such problems.

31
Vettedness – When a resource found by a search is endorsed by someone
significant in its field, it might be considered desirable. However, this is
not the case always. For instance, a philosopher might not be interested
in the rating by a practitioner.
Openness – Researchers may prefer an open source system so that they can
extend or modify it to suit their requirements. They also may prefer to
know details of the operation of a system so as to make maximum use of
it.
Scope – Users prefer more rather than less data to search on. Digital
Library search engines obtain data from various providers. Examples of
such providers would be the IEEE, ACM, etc. Users might want to know
the sources considered by a particular search engine.
An explanation of each factor involved in formulating System Quality follows:
Ease of Use – Users prefer search engines that are not difficult to work
with. Hence, this is a factor that needs to be considered.
Joy of Use – Users are motivated by a „cool‟ factor to get started on a
system and to continue using it. They prefer when using the system is a
pleasurable experience.
Support – Users might require help to know how to go about doing certain
operations. The availability and the quality of such help might be an
important factor in determining System Quality.

32
Accessibility – This refers to the responsiveness of the system. This
includes the time taken for the homepage to load, and the time the search
engine takes to retrieve results for issued queries.
Reliability – In the context of system quality, this refers to the absence of
bugs in the system. The users are bound to dislike a system that
malfunctions often.
Choice – Users might prefer having more options related to controlling
how they interact with the system.
This section explained how a model was formulated to explain the behavior of
the Computer Science student community, and provided a detailed explanation of
the constructs into which the model is decomposed. Based on that, we prepared a
questionnaire to obtain responses from sample users of the community. The
following section explains how this was done.

33
CHAPTER 5: QUESTIONNAIRE AND IRB APPROVAL
This section explains how a questionnaire corresponding to the model derived in
the previous chapter was formulated. The questionnaire was then approved by
the Institutional Review Board (IRB) at Virginia Tech.
A chief concern was if each participant would understand the question as the
researcher expected. Consequently, an iterative approach was followed to
formulate the questionnaire. It was subjected to pilot testing where the participant
had to think aloud what he/she understood from each question. The
shortcomings of the questions were noted, and the next version was developed.
Questions were formulated after discussions with eligible subjects. It was
suggested implicitly and explicitly by the participants that the questions pertaining
to a particular factor in the model also needed some assistive questions or
statements. The assistive questions could be something very specific to the
system being tested for acceptance, about a particular task that could be done by
the user to verify the meaning of the factor in the model. For example, assistive
statements to accessibility would be “The text and images associated with the
pages of the search engine loaded quickly on an average” followed by “Overall,
this search engine appears to be responsive.”. These assists helped the participant
to form an idea of what exactly the factor meant in terms of the meta-search
system, and then reach a decision on that factor.
The questions were formulated in such a way that the answers could fit into the
standardized 7-point Likhert scale. The questionnaire that was obtained out of
this process is available as Appendix A.

34
Since the user study would require human subjects, approval from the
Institutional Review Board had to be obtained. The questionnaire along with the
mode of study and an estimate of how many subjects would be required was
submitted. The documents pertaining to the IRB are attached in Appendix C.

35
CHAPTER 6: USER STUDY
This section describes how the user study was conducted, and how, when, and
where the questionnaire, whose formulation was discussed in the previous
chapter, was served.
To study the satisfaction and acceptance of the meta-search system, students with
a background in Computer Science were invited. The subjects were over eighteen
years in age, and were either undergraduate or graduate students.
The users were asked to use the meta-search engine along with the existing search
engine that operated on the same data sets, from http://www.citidel.org. The
study was conducted over a period of 12 days. The users were required to use
both systems, and then answer a questionnaire that was made available online. To
lessen invalid responses, the questionnaire was made available only 7 days after
the user study started.
The questionnaire was broken down at the level of factors that are present in the
model (Figure 20), and the order in which these factors were presented to the
user was randomized. Also, since there were a number of factors in the model,
the user was presented questions pertinent to one factor at a time, and he/she
had the option to save the responses provided so far, and come back later to
continue working on it.
The questionnaire contains a section that asks for demographic information, and
confirms if they had used the existing search engine. From then on, the responses
were on a 7-point Likhert scale that included Strongly Agree, Somewhat Agree,
Slightly Agree, Neutral, Slightly Disagree, Somewhat Disagree, and Strongly
Disagree as the options. To reduce the likelihood of users picking the wrong

36
choice by mistake, the responses were color-coded - the responses were coded
from green (for “Strongly Agree”) to orange (for “Strongly Disagree”) with
progressive shades.
Advertisements were sent out periodically on the mailing list of CS-Students. A
class of CS undergraduates was asked to take this up as an assignment. Credits
were awarded to those undergraduates who took up the user study.
At the end of the study, a total of 111 responses were received. Out of these, 4
responses were considered invalid because the users were professors, and did not
fit into the targeted community.

37
CHAPTER 7: ANALYSIS OF RESULTS
This section describes the method that was used for analysis of the results, and
the findings from the questionnaire responses obtained.
The model hypothesized in Chapter 4 (Figure 20) shows each factor in the model
to be affected my multiple independent factors (regressor variables), except for
the factors at the edges. This naturally leads us to a multiple linear regression
model. Mathematically, Information Quality, System Quality, Performance
Expectancy, Satisfaction, and Behavioral Intention can be expressed in the form
y = B0 + B1x1 + B2x2 + … + ε
(1)
where y would be each one of them, while x1 , x2, etc. would be the factors that
affect them, i.e. the ones that have outward arrows. This is an equation of a plane
of which B0 is the intercept, ε is a random error term, and terms B1, B2, B3 are
known are partial regression coefficients, the name arising from the fact that B1
measures the exact change in y per unit change in x1 and so on. The random error
term ε can be removed from the equation if we assume the expected value of the
error term to be zero, i.e., E(ε) = 0.
For example, Information Quality is hypothesized to be affected by Relevance,
Adequacy, Understandability, Reliability, Vettedness, Openness and Scope. This
would mathematically translate into:
Information Quality = B0 + B1(Relevance) + B2(Adequacy) + B3(Understandability) +
B4(Reliability) + B5(Vettedness) + B6(Openness) + B7(Scope)

38
(2)
Similarly, with different values for Bi,
System Quality = B0 + B1(Ease of Use) + B2(Joy of Use) + B3(Support) + B4(Accessibility)
+ B5(Reliability) + B6(Choice)
(3)
Performance Expectancy = B0 + B1(Information Quality) + B2(Social Influence)
(4)
Satisfaction = B0 + B1(System Quality) + B2(Performance Expectancy)
(5)
Behavioral Intention = B0 + B1(Satisfaction)
(6)
However, the model hypothesizes that the moderating variables would have an
effect on each one of these. Mathematically, this means that the coefficients
would be different when the responses are divided into different sets by gender,
age, voluntariness, and race.
The partial regression coefficients can be obtained by using the method of least
squares explained below. The model can be proved to be valid if all the models
mentioned above in the form of equations are proven to be significant. The tests
of significance are at two levels – one for the fit of the model, and one for the
significance of each regressor variable. The tests used to assess these measures are
known as the F-test and the least square estimated standard error.

39
The method of least squares requires that n observations be present such that n >
k where k is the number of partial regression coefficients (or, the number of
factors). If the responses provided by one user constitute one observation, the
observations are
yi = B0 + B1 x i 1 + B2 xi 2 + … Bk xi k + εi where i = 1, 2, 3, … n and n > k
This can be expressed in matrix notation as
Y = Xβ + ε
where Y is an (n x 1) vector of the observations, X is an (n x p) matrix of the
levels of the independent variables, β is a (p x 1) vector of the regression
coefficients, and ε is a (n x 1) vector of errors.
It is required to find the vector of least square estimators, ß, that minimizes
L = Σ εi2 = ε'ε = (Y - X β)' (Y - X β)
and j = 1 to k
L needs to be minimized. Montgomery and Runger [17] show that this can be
minimized by solving the equation
X'X ß = X'Y
which leads to
ß = (X'X) - 1 X' Y
(7)

40
The fitted model with the regression coefficients obtained from solving equation
2 is:
ỳi = ß 0 + Σ ß j x i j where i = 1, 2, 3, … n and j = 1, 2, … k
To obtain the significance of each factor in the model, the estimated standard
error of each ß j is used, which is denoted by se(ß j). Each ß j being considerably
larger than se(ßj) is an indication of reasonable precision of estimation.
Montgomery and Runger [17] provide a detailed explanation of how these
standard errors are arrived at.
The test for significance ascertains that a linear relationship exists between a
subset of the regressor variables and the response variable. There could be two
possible hypotheses for any given relationship:
H0: B1 = B2= B3 = … = Bk = 0
H1: Bj ≠ 0 for at least one j
The sum of squares of all responses is partitioned into sum of squares due to
regression (explained below) and a sum of squares due to error, i.e.
SST = SSR + SSE
(8)
The method of arriving at SSE is explained by Montgomery and Runger [17] in
detail. With SSR and SSE, the mean square values of them can be calculated as
MSR and MSE respectively. The ratio of MSR to MSE gives a value that can be
used to assess the goodness of fit, and is known as the F value [17]. The

41
significance of the F-value, if lesser than the critical value of 0.05, causes us to
reject H0 implying that the model is significant overall [16].
To arrive at the values for the partial regression coefficients in each of equations
and the estimated standard errors of the least square estimators, the Analysis
ToolPak™ in Microsoft Excel™ 2003 was used. Of the answers provided by the
user, answers to assistive questions were ignored because they were provided
largely for the purpose of better understanding by the user and their effectiveness
was validated with pilot studies described earlier. Responses provided to the
direct relevant questions were used for the analysis. Upon providing the values
for the known y values, and the known x values obtained from the study, and
running a regression analysis, a multitude of statistics resulted, including the
values in which we are interested, namely ß and se(ß) (standard error of ß).
The following paragraphs explain how the data was split across moderating
variables, and how the hypothesized model (equations 2 through 6) was verified
for each one of the cases.
In keeping with IRB regulations, the obtained results were processed to make
them anonymous so that the users could not be personally identifiable. The
received responses can be classified in different ways as shown below.
Gender-wise, 91 males and 16 females responded.
Experience-wise, 55 undergraduates, and 52 graduates responded.
Of the 107 students who took part in the study, 41 of them were non-
voluntary, and 66 of them were voluntary users. The reason for
considering them to be so is explained later in this chapter.

42
Age-wise, only 4 of the 107 participants were outside the 20-30 range.
These classifications enable study of the validity of the effect of moderating
variables.
In the hypothesized model (Figure 20) introduced in Chapter 4, five moderating
variables were introduced – gender, age, experience, voluntariness, and race. Of
these, the effect of gender and age cannot be learned using the results of this
study because of very few responses. However, the significance of these
moderating variables has been identified in UTAUT by Venkatesh et al. [27], so
including them in the model seems justified.
No questions pertaining to race were asked during the user study. The study
could not be conducted across different nations for logistical reasons. But, the
known fact that teacher-student relationship is different in different cultures gives
confidence regarding including race as a moderating variable.
The validity of the model could be verified regarding the effect of experience and
voluntariness.
However, though the number of participants was over 100, the entire Computer
Science student community is very much larger, so analysis of the significance of
the regressor variables was not considered to be justified. Hence, fit of the model
alone is considered.
The results of regression analysis for each of Information Quality, System
Quality, Performance Expectancy, Satisfaction and Behavioral Intention are
attached in Appendix B. The partial regression coefficients and the fit of the
model alone are discussed below.

43
Experience
Of the 107 students who took part in the study, 55 of them were undergraduates,
and 52 of them were graduates. Graduate students can safely be considered to be
more experienced than undergraduates.
The results for regression analysis of equation 2 that pertains to Information
Quality for graduate students was
Information Quality = 0.4404 + 0.4142(Relevance) + 0.0624(Adequacy) – 0.0184
(Understandability) + 0.2654 (Reliability) – 0.0535 (Vettedness) + 0.1501 (Openness) +
0.0741(Scope)
(9)
while that obtained for undergraduate students was
Information Quality = 0.1296 + 0.1824(Relevance) + 0.1707(Adequacy) +
0.1302(Understandability) + 0.4382 (Reliability) + 0.0018 (Vettedness) + 0.1329
(Openness) – 0.0745(Scope)
(10)
The significance of the F-value for both models was less than 0.05, hence proving
the overall significance of the model. Details are available at Figures 21 and 22.
The sign and magnitude for each coefficient in equation 9, versus in equation 10,
indicate differences between students with different levels of experience, when
determining the Information Quality of a system.
The fact that graduate students do not bother as much about understandability or
reliability as do undergraduate students, suggests that as long as they achieve their

44
desired outcome, they do not bother about how understandable or reliable is the
help provided by the system. Higher importance is attached to scope by graduate
students, suggesting that they do not want to miss out on anything, even at the
cost of reliability or understandability.
The results for regression analysis of equation 3 that pertains to System Quality
for graduate students was
System Quality = 1.3928 + 0.0868 (Ease of Use) + 0.2425 (Joy of Use) – 0.0153
(Support) + 0.3602 (Accessibility) + 0.2304 (Reliability) – 0.2655 (Choice)
(11)
while that for undergraduate students was
System Quality = 0.3769 + 0.4197(Ease of Use) + 0.3899 (Joy of Use) –
0.0565(Support) - 0.0826(Accessibility) + 0.2216 (Reliability) + 0.0109 (Choice)
(12)
The significance of the F-value for both models was less than 0.05, hence proving
the overall significance of the model. Details are available at Figures 23 and 24.
It appears that with experience, the importance that the Computer Science
student attaches to Ease of Use, Joy of Use, Support and Choice decreases, while
the student is increasingly concerned about Reliability and Accessibility with
regard to the quality of the system.
In other words, the new student seems to be more worried about achieving
desired results and prefers an easy to use system. With experience, he/she gains

45
confidence and worries more about the system always being accessible and
reliable.
The results for regression analysis of equation 4 that pertains to Performance
Expectancy for graduate students was
Performance Expectancy = 0.8656 + 0.6044 (Information Quality) + 0.1365 (Social
Influence)
(13)
while that obtained for undergraduate students was
Performance Expectancy = 0.7211 + 0.5805 (Information Quality) + 0.2414 (Social
Influence)
(14)
The significance of the F-value for both models was less than 0.05, hence proving
the overall significance of the model. Details are available at Figures 25 and 26.
Equations 14 and 15 show that social influence which could be from a peer or a
professor does have an effect on the perceived Performance Expectancy which
decreases with experience, while the effect of perceived Information Quality may
increase.
The results for regression analysis of equation 5 that pertains to Satisfaction for
graduate students was
Satisfaction = 0.0106 + 0.3874 (System Quality) + 0.5515 (Performance Expectancy)
(15)

46
while that obtained for undergraduate students was
Satisfaction = 0.5047 + 0.2065 (System Quality) + 0.6990 (Performance Expectancy)
(16)
The significance of the F-value for both models was less than 0.05, hence proving
the overall significance of the model. Details are available at Figures 27 and 28.
It seems that experienced students attribute more importance to System Quality
than inexperienced students which might seem a bit contradictory. However,
from equations 11 and 12, we see that graduates perceive System Quality more in
terms of Accessibility and Reliability than factors such as Ease of Use and Joy of
Use which mattered more for undergraduate students. This justifies the apparent
contradiction that is seen from equations 15 and 16.
The results for regression analysis of equation 6 that pertains to Behavioral
Intention for graduate students was
Behavioral Intention = 0.3361 + 0.9185 (Satisfaction)
(17)
while that obtained for undergraduate students was
Behavioral Intention = 0.7387 + 0.8987 (Satisfaction)
(18)
The significance of the F-value for both models was less than 0.05, hence proving
the overall significance of the model. Details are available at Figures 29 and 30.

47
Equations 17 and 18 reflect very similar attitudes between graduate and
undergraduate students. A high level of satisfaction is required for them to use
the system again. This suggests that Experience does not affect someone‟s
intention to use a system again, when considering their satisfaction.
Voluntariness
Of all participants, 41 of them undertook the study as a part of an exercise in
class, and received credit for filling out the questionnaire, while the remaining 66
of them undertook the study voluntarily. The ones who participated under the
constraint of credit can be considered as involuntary participants.
The results for regression analysis of equation 2 that pertains to Information
Quality for voluntary users was
Information Quality = 0.2319 + 0.3604(Relevance) + 0.1171(Adequacy) +
0.0043(Understandability) + 0.2856 (Reliability) – 0.0198 (Vettedness) + 0.1418
(Openness) + 0.0535(Scope)
(19)
while that obtained for involuntary users was
Information Quality = - 0.1847 + 0.3099(Relevance) + 0.1198(Adequacy) +
0.0957(Understandability) + 0.4950 (Reliability) – 0.1239 (Vettedness) +
0.0264(Openness) – 0.0169(Scope)
(20)

48
The significance of the F-value for the model for voluntary users was less than
0.05, but it was not so for involuntary users. Details are available at Figures 31
and 32.
A closer inspection of the responses provided by most of the involuntary users
suggested that the study being perceived as mandatory made them choose
random answers to the questions. However, the fact that most of them had
answered positively for questions pertaining to their satisfaction and behavioral
intention, as shown later, suggests that their responses were dictated more by
credit offered to them. This offers significant evidence to the strength of
voluntariness as a moderating variable.
The results for regression analysis of equation 3 that pertains to System Quality
for voluntary users was
System Quality = 1.0612 + 0.1849 (Ease of Use) + 0.3754 (Joy of Use) –
0.1027(Support) + 0.2505(Accessibility) + 0.1338 (Reliability) – 0.0514 (Choice)
(21)
and that for involuntary users was
System Quality = 1.7020 + 0.2145 (Ease of Use) + 0.3609 (Joy of Use) +
0.0637(Support) - 0.0064 (Accessibility) + 0.2449 (Reliability) - 0.3092 (Choice)
(22)
The significance of the F-value for the model pertaining to voluntary users was
less than 0.05, while the model pertaining to involuntary users was 0.059. Details
are available at Figures 33 and 34.This implies that it is reasonable to endorse the
model of equation 21, but less reasonable to endorse the model of equation 22.

49
It can be seen that irrespective of Voluntariness, there is not a positive effect of
Choice on the perception of System Quality. But, Voluntariness may influence
the user‟s perception of Accessibility. Perhaps, users who were taking up the
study for credit were unconcerned about the system being accessible after the
study was done. As expected, voluntary users associated a somewhat low priority
to Support being provided as long as the system was accessible and reliable and
gave them a relatively pleasurable experience.
The results for regression analysis of equation 4 that pertains to Performance
Expectancy for voluntary users was
Performance Expectancy = 0.7637 + 0.6815 (Information Quality) + 0.0803 (Social
Influence)
(23)
while that obtained for involuntary users was
Performance Expectancy = 0.7211 + 0.4796 (Information Quality) + 0.3173 (Social
Influence)
(24)
The significance of the F-value for both models was less than 0.05, hence proving
the overall significance of the model. Details are available at Figures 35 and 36.
Voluntary versus involuntary users seem to perceive differently the factors that
affect Performance Expectancy. The fact that the role of Social Influence is
higher among the involuntary users when compared to the voluntary users
supports the use of Voluntariness as a moderating variable. In case of voluntary

50
users, as expected, Information Quality affects their perception of Performance
Expectancy even more than for involuntary users.
The results for regression analysis of equation 5 that pertains to Satisfaction for
graduate students was
Satisfaction = - 0.3913 + 0.2850 (System Quality) + 0.8422 (Performance Expectancy)
(25)
while that obtained for undergraduate students was
Satisfaction = 1.4038 + 0.2073 (System Quality) + 0.4189 (Performance Expectancy)
(26)
The significance of the F-value for both models was less than 0.05, hence proving
the overall significance of the model. Details are available at Figures 37 and 38.
The effect of voluntariness is observed in these models also. The amount of
importance associated by voluntary users to Performance Expectancy is more
than double than that associated by involuntary users.
The results for regression analysis of equation 6 that pertains to Behavioral
Intention for voluntary users was
Behavioral Intention = 0.3860 + 0.9144 (Satisfaction)
(27)
while that obtained for involuntary users was

51
Behavioral Intention = 0.8857 + 0.8677 (Satisfaction)
(28)
The significance of the F-value for both models was less than 0.05, hence proving
the overall significance of the model. Details are available at Figures 39 and 40.
Equations 27 and 28 reflect very similar attitudes between voluntary and
involuntary users. A high level of satisfaction is required for them to use the
system again. This confirms the observations made about equations 17 and 18.
To view the estimated standard error of each regressor variable across the
different models and moderating variables, see Appendix B that has the output of
regression analyses run with Microsoft ™ Excel 2003. The estimated standard
errors that are used to assert the significance of regressor variables might be
significant in certain models which are in keeping with the discussion above, to
the effect of moderating variables, and the size of the sample.

52
CHAPTER 8: CONCLUSION
This section reviews the work that was done as a part of this thesis, how the goals
were realized, what findings were made, and what lies for researchers in this
model in the future.
Existing models were studied, and a model thought to best portray the behavior
of the Computer Science community was formulated. An iterative approach was
followed and a questionnaire was constructed. Users were recruited, and a study
was conducted. The results were used to validate the model. However, the
hypothesized model predicts that Gender, Age and Race would be moderating
variables which could not be validated based on the available data. However, they
might be investigated as moderating variables in the future, based on results from
previous studies and some known facts about teacher-student relationships across
various cultures. Validation of the model was carried out using a multiple linear
regression model. It could have been done using Partial Least Squares method
explained by Montgomery and Runger [16] as well.
The validated model suggests that Computer Science students consider
themselves to be experts and do not give much importance to the usability
aspects of a system if they are going to get their desired results. Also, with
experience, their self-confidence grows and their tendency to be influenced by
people academically significant to them reduces.
To further establish this model as characterizing the behavior of the Computer
Science student community, studies could be conducted to study the actual
effects of gender, age and race. Also, this model could be tested for its validity

53
against a different product designed for the Computer Science student
community. The outputs from these studies might help refine this model further.
The regression equations obtained for the model could be used to prioritize
development of aspects of a system that is being targeted at the Computer
Science student community. For instance, it seems more important for a system
to be more reliable and accessible than very user-friendly.
Another observation that could researchers should consider for future studies is
that participation in return for credit may not ensure that users participate in a
study whole-heartedly.

54
BIBLIOGRAPHY
[1] Ajzen, I., Attitudes, Traits, and Actions: Dispositional Predictions of Behavior in
Personality and Social Psychology, Advances in Experimental Social Psychology 20,
Academic Press, Inc., San Diego CA, 1987, pp. 1-64
[2] Ajzen, I, The Theory of Planned Behavior, Organizational Behavior and Human
Decision Processes 50, 1991, pp. 179-211
[3] Bailey, J.E. and S.W. Pearson, Development of a Tool for Measuring and Analyzing
Computer User Satisfaction, Management Science 29(5), 1983, pp. 530-545
[4] Cohen, J and P. Cohen, Applied Multiple Regression / Correlation Analysis for the
Behavioral Sciences, Erlbaum, Hillsdale NJ, 1975
[5] Compeau, D.R. and C.A. Higgins, Computer Self-Efficacy: Development of a Measure
and Initial Test, MIS Quarterly 19(2), 1995, pp. 189-211
[6] Compeau, D.R., C.A. Higgins, and S. Huff, Social Cognitive Theory and Individual
Reactions to Computing Technology: A Longitudinal Study, MIS Quarterly 23(2), 1999,
pp. 145-158
[7] Davis, F.D., R.P. Bagozzi, and P.R. Warshaw, User Acceptance of Computer
Technology: A Comparison of Two Theoretical Models, Management Science 35, 1989,
pp. 982-1003
[8] Davis, F.D., A Technology Acceptance Model for Empirically Testing New End-User
Information Systems: Theory and Results, Doctoral Dissertation, MIT Sloan School of
Management, Cambridge MA, 1986

55
[9] Davis, F.D., Perceived Usefulness, Perceived Ease of Use, and User Acceptance of
Information Technology, MIS Quarterly 13(3), 1989, pp. 319-340
[10] DeLone W.H., and E.R. McLean, Information System Success: The Quest for the
Dependent Variable, Information Systems Research 3(1), 1992, pp. 60-95
[11] Doll, W.J. and G. Torkzadeh, The Measurement of End-User Computing
Satisfaction, MIS Quarterly 12(2), 1988, pp. 259-274
[12] Fishbein, M. and I. Ajzen, Belief, Attitude, Intention and Behavior: An Introduction
to Theory and Research, Addison-Wesley, Reading MA, 1975
[13] Gonçalves, M., E.A. Fox, L. Watson, N. Kipp, Streams, Structures, Spaces,
Scenarios, Societies (5S): A Formal Model For Digital Libraries, ACM Trans
Information Systems 22(2), 2004, pp. 270-312
[14] Gonçalves, M., B.L. Moreira, E.A. Fox, L.T. Watson, “What is a good Digital
Library?” – A Quality Model for Digital Libraries, Information Processing and
Management, (to appear in 2007)
[15] Hartwick, J. and H. Barki, Explaining the Role of User Participation in Information
System Use, Management Science 40, 1994, pp. 440-465
[16] Levine, D.M., M.L. Berenson, D. Stephan, T.K. Krehbiel, Statistics for
Managers Using Microsoft Excel, 4th ed., Pearson-Prentice Hall, 2005, Ch. 13
[17] Montgomery, D.C. and G.C. Runger, Applied Statistics and Probability For
Engineers, 3rd ed., John Wiley & Sons Inc., 2003
[18] Seddon, P.B., A Respecification and Extension of the DeLone and McLean Model of
IS Success, Information Systems Research 8(3), 1997, pp. 240-253

56
[19] Shen, R., N.S. Vemuri, W. Fan and E.A. Fox, What is a successful Digital
Library?, European Conference on Digital Libraries, September 2006, Alicante,
Spain, pp. 208-219
[20] Szajna, B., Empirical Evaluation of the Revised Technology Acceptance Model,
Management Science 42(1), 1996, pp. 85-92
[21] Taylor, S. and P.A. Todd, Understanding Information Technology Usage: A Test of
Competing Models, Information Systems Research 6(2), 1995, pp. 144-176
[22] Taylor, S. and P.A. Todd, Assessing IT Usage: The Role of Prior Experience, MIS
Quarterly 19(4), 1995, pp. 561-570
[23] Thompson, R.L., C.A. Higgins, and J.M. Howell, Personal Computing: Toward a
Conceptual Model of Utilization, MIS Quarterly 15(1), 1991, pp. 125-143
[24] Triandis, H.C., Values, Attitudes, and Interpersonal Behavior, Nebraska
Symposium on Motivation, 1979, pp. 195-259
[25] Venkatesh, V., Creation of Favorable User Perceptions: Exploring the Role of Intrinsic
Motivation, MIS Quarterly 23(2), 1999, pp. 239-260
[26] Venkatesh, V. and F.D. Davis, A Theoretical Extension of the Technology
Acceptance Model: Four Longitudinal Field Studies, Management Science 46(2), 2000,
pp. 186-204
[27] Venkatesh, V., M.G. Morris, G.B. Davis, and F.D. Davis, User Acceptance of
Information Technology: Toward a Unified View, MIS Quarterly 27(3), 2003, pp. 425-
478

57
APPENDIX A
The following was the questionnaire that was used for the user study.
No. Question Ranking/Response
1. Demographic Information
1 Gender Male | Female
2 Age ___ years
3 Specialization Computer Science | History
4 I am a(n) Undergraduate | Graduate | Professor
5 I am receiving credits for participating in this user study.
Yes | No
6 I use search engines for my research Many times a day | … | Never
Search engines are primarily used for two purposes in research Locating - finding an item whose identity is already known (e.g., searching for a paper whose title is already known) Exploring - finding identities of items of interest (e.g., searching for various papers on a particular topic)
7 My relative usage of search engines for locating versus exploring would approximately be
100-1 | 75-25| 50-50| 25-75 | 1-100
8 I have used CITIDEL/AmericanSouth. Yes | No
2. Information Quality
2.1 Adequacy of Meta-data When I search for something, the results are laid out in a page. When I click on one of the results, details about the item(which could be a Microsoft Word document / Image / Video / Audio / PDF document) are displayed, which includes the location that actually contains the item .
2.1.1 The detail that I get to see about the item of my interest is sufficient for my needs.
Strongly agree | ... | Strongly disagree
2.1.2 The detail that I get to see about the item of my interest is complete for my needs.
Strongly agree | ... | Strongly disagree
2.1.3 In addition to the details, I would like to see if I have unrestricted access to the item.
Strongly agree | ... | Strongly disagree

58
2.1.4 From my experience, I found the details available about items to be adequate for my needs.
Strongly agree | ... | Strongly disagree
2.2 Relevance Search engines are primarily used for two purposes in research Locating - finding something whose identity is already known(e.g. searching for a paper whose title is already known) Exploring - finding identities of resources of interest(e.g. searching for various papers on a particular topic)
2.2.1 When I was locating a particular item, it was within the first few results.
Strongly agree | ... | Strongly disagree
2.2.2 When I was exploring for items on a topic, I found the results to be very pertinent to what I was looking for.
Strongly agree | ... | Strongly disagree
2.2.3 Overall, I found the results returned by this search system to be relevant to my queries.
Strongly agree | ... | Strongly disagree
2.3 Reliability
2.3.1 If I were to publish a paper, I would like to be able to confidently cite an item I find through this search engine.
Strongly agree | ... | Strongly disagree
2.3.2 The detail about an item helps me determine if it is reliable.
Strongly agree | ... | Strongly disagree
2.3.3 I could always access the item at the location that the detail about the item pointed to.
Strongly agree | ... | Strongly disagree
2.3.4 Overall, I could easily tell if the information that I obtain from this search engine is reliable.
Strongly agree | ... | Strongly disagree
2.4 Scope of Collection A Digital Library (DL) search engine helps find records that are present in different sources. For instance, AmSouth or ACM would be sources.
2.4.1 I would prefer to know what sources this search engine uses.
Strongly agree | ... | Strongly disagree
2.4.2 I could use this search engine for a variety of topics.
Strongly agree | ... | Strongly disagree
2.4.3 I feel that this search engine could give me information on many topics in my research.
Strongly agree | ... | Strongly disagree
2.4.4 I would prefer a search engine that has more sources.
Strongly agree | ... | Strongly disagree
2.5 Understandability
2.5.1 I find the information presented by the search engine to be clear.
Strongly agree | ... | Strongly disagree

59
2.5.2 When I search for something, I see a page with snippets of information. The information in the snippets is understandable.
Strongly agree | ... | Strongly disagree
2.5.3 The organization of results in different views is clear to me.
Strongly agree | ... | Strongly disagree
2.5.4 I could easily find the usage rights (copyright, print fee etc.) associated with any item.
Strongly agree | ... | Strongly disagree
2.5.5 Overall, I could easily understand the information presented by the search engine.
Strongly agree | ... | Strongly disagree
2.6 Vettedness
2.6.1 Having each item to be rated, say on a scale of five stars, by an external authority would be helpful for me.
Strongly agree | ... | Strongly disagree
2.7 Openness
2.7.1 I would prefer to know how different search engines organize results.
Strongly agree | ... | Strongly disagree
2.7.2 The MetaScholar 3D view organizes the search results based on certain attributes (e.g., popularity, collection). It (was/would be) helpful for me to understand the meaning of these attributes.
Strongly agree | ... | Strongly disagree
2.7.3 I would prefer to know how this search engine works so that I can maximize benefits that I could get from it.
Strongly agree | ... | Strongly disagree
3. System Quality
3.1 Accessibility
3.1.1 The homepage of this search engine loads quickly. Strongly agree | ... | Strongly disagree
3.1.2 This search engine appears to respond quickly on an average.
Strongly agree | ... | Strongly disagree
3.1.3 The text and images associated with the pages of the search engine loads quickly on an average.
Strongly agree | ... | Strongly disagree
3.1.4 Overall, this search engine appears to be responsive.
Strongly agree | ... | Strongly disagree
3.2 Reliability
3.2.1 The number of times the search engine malfunctioned during my course of interaction was few (less than 3) or none.
Strongly agree | ... | Strongly disagree
3.2.2 Having a logo in the search engine would improve its credibility.
Strongly agree | ... | Strongly disagree

60
3.2.3 Overall, I feel I would be comfortable to rely on this search engine.
Strongly agree | … | Strongly disagree
3.3 Ease of Use
3.3.1 Learning to use this search engine was easy. Strongly agree | … | Strongly disagree
3.3.2 The user interface of this search engine is easily understandable.
Strongly agree | … | Strongly disagree
3.3.3 I found this search engine easy to use. Strongly agree | … | Strongly disagree
3.3.4 I always felt to be in control of this search engine. Strongly agree | … | Strongly disagree
3.4 Joy of Use
3.4.1 I found using this search engine to be fun. Strongly agree | … | Strongly disagree
3.4.2 I found this search engine to be flexible to my needs.
Strongly agree | … | Strongly disagree
3.4.3 Using this search engine was a pleasant experience.
Strongly agree | ... | Strongly disagree
This search engine works best on Firefox.
3.4.4 If my favorite browser were not Firefox, I would not use this search engine.
Strongly agree | ... | Strongly disagree
3.5 Freedom of Choice
3.5.1 I liked the option of having three different views and using what I thought was best.
Strongly agree | ... | Strongly disagree
3.5.2 I would prefer a search engine that offers me different choices and lets me to use what would suit my need.
Strongly agree | ... | Strongly disagree
3.6 Support
3.6.1 Having some training before using this search engine would have helped me.
Strongly agree | … | Strongly disagree
3.6.2 Availability of instructional help would give me more confidence to use a search engine.
Strongly agree | ... | Strongly disagree
4. Performance Expectancy
4.1 Using this search engine could satisfy some of my complicated needs.
Strongly agree | ... | Strongly disagree
4.2 This search engine could be of use in my computer-aided research.
Strongly agree | ... | Strongly disagree
4.3 If I were using CITIDEL or AmSouth, I would use this search engine instead.
Strongly agree | ... | Strongly disagree

61
4.4 I feel that this search engine can enable find what I want quickly.
Strongly agree | ... | Strongly disagree
4.5 Overall, I found this search engine to be useful. Strongly agree | ... | Strongly disagree
5. Social Influence
5.1 Given what I know, I would use this search engine.
Strongly agree | ... | Strongly disagree
5.2 If my peers encourage using this search engine, I would use it.
Strongly agree | ... | Strongly disagree
5.3 If my superiors encourage using this search engine, I would use it.
Strongly agree | ... | Strongly disagree
5.4 If people who academically influence me encourage using this search engine, I would use it.
Strongly agree | ... | Strongly disagree
6. Satisfaction
6.1 I would recommend this search engine to others. Strongly agree | ... | Strongly disagree
6.2 If I had to login to use this search engine, I would do that.
Strongly agree | ... | Strongly disagree
6.3 Overall, I was satisfied with this search engine. Strongly agree | ... | Strongly disagree
7. Intention to use
7.1 I would use this search engine. Strongly agree | ... | Strongly disagree
7.2 I plan to use this search engine Many times a day| … |Never
8. Information Quality and System Quality
8.1 This search engine appears to be of good quality in terms of appearance.
Strongly agree | ... | Strongly disagree
8.2 This search engine appears to be of good quality in terms of functioning and the results.
Strongly agree | ... | Strongly disagree
Note: Three abbreviations in the above questionnaire represent longer expressions, as seen below: Strongly agree | ... | Strongly disagree: Strongly agree | Somewhat agree | Slightly agree | Neutral | Slightly disagree | Somewhat disagree | Strongly disagree Many times a day | … | Never:

62
Many times a day | Few times a day | Few times a week | Few times a month | Rarely | Never

63
APPENDIX B
The following tables are the outputs of regression analysis for the model, broken
down into smaller parts across different moderating variables, namely:
Experience and Voluntariness.
(i) Experience: Graduate Students - Information Quality
Figure 21: Regression Analysis - Graduate Students - Information Quality
(ii) Experience: Undergraduate Students – Information Quality

64
Figure 22: Regression Analysis - Undergraduate Students – Information Quality
(iii) Experience: Graduate Students – System Quality

65
Figure 23: Regression Analysis - Graduate Students - System Quality
(iv) Experience: Undergraduate Students – System Quality

66
Figure 24: Regression Analysis - Undergraduate Students - System Quality
(v) Experience: Graduate Students – Performance Expectancy
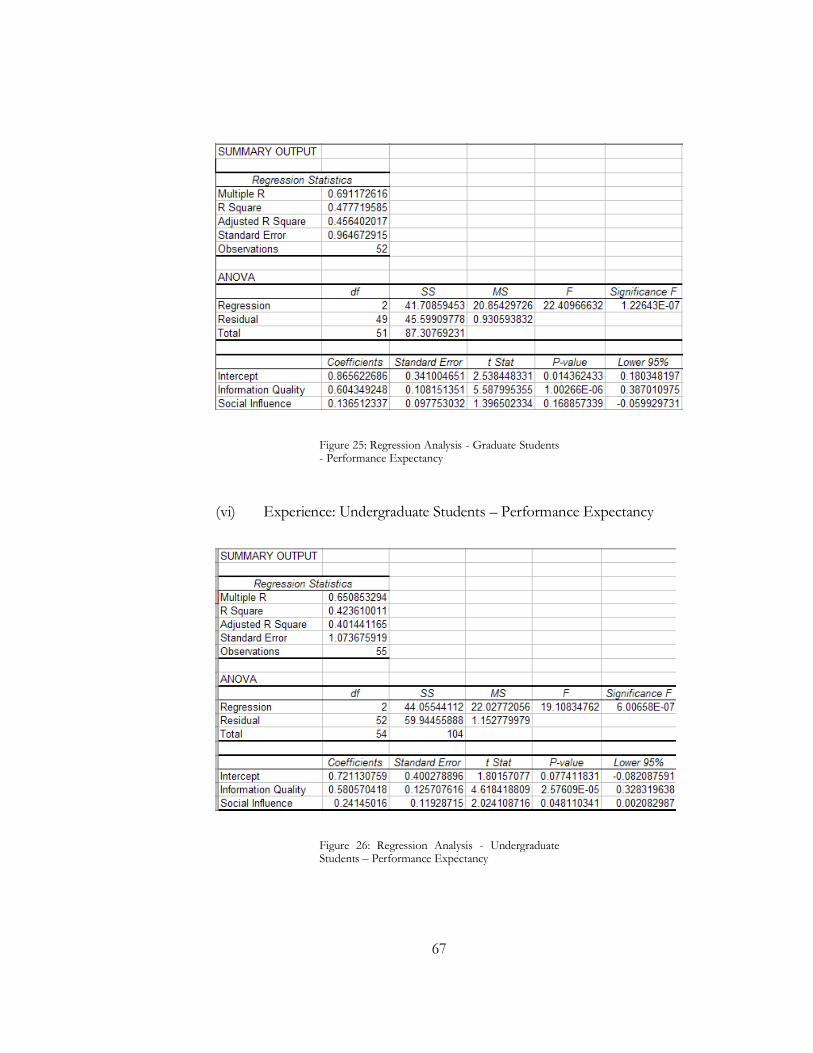
67
Figure 25: Regression Analysis - Graduate Students - Performance Expectancy
(vi) Experience: Undergraduate Students – Performance Expectancy
Figure 26: Regression Analysis - Undergraduate Students – Performance Expectancy

68
(vii) Experience: Graduate Students – Satisfaction
Figure 27: Regression Analysis - Graduate Students - Satisfaction
(viii) Experience: Undergraduate Students – Satisfaction
Figure 28: Regression Analysis - Undergraduate Students - Satisfaction

69
(ix) Experience: Graduate Students – Behavioral Intention
Figure 29: Regression Analysis - Graduate Students - Behavioral Intention
(x) Experience: Undergraduate Students – Behavioral Intention
Figure 30: Regression Analysis - Undergraduate Students - Behavioral Intention

70
(xi) Experience: Voluntary Users – Information Quality
Figure 31: Regression Analysis - Voluntary Users – Information Quality
(xii) Experience: Involuntary Users – Information Quality

71
Figure 32: Regression Analysis - Involuntary Users – Information Quality
(xiii) Experience: Voluntary Users – System Quality

72
Figure 33: Regression - Experience - Voluntary Users – System Quality
(xiv) Experience: Involuntary Users – System Quality

73
Figure 34: Regression - Experience - Involuntary Users – System Quality
(xv) Experience: Voluntary Users – Performance Expectancy
Figure 35: Regression Analysis - Voluntary Users - Performance Expectancy

74
(xvi) Experience: Involuntary Users – Performance Expectancy
Figure 36: Regression Analysis - Involuntary Users - Performance Expectancy
(xvii) Experience: Voluntary Users – Satisfaction
Figure 37: Regression Analysis - Voluntary Users - Satisfaction

75
(xviii) Experience: Involuntary Users – Satisfaction
Figure 38: Regression Analysis - Involuntary Users - Satisfaction
(xix) Experience: Voluntary Users – Behavioral Intention
Figure 39: Regression - Voluntary Users - Behavioral Intention

76
(xx) Experience: Involuntary Users – Behavioral Intention
Figure 40: Regression - Involuntary Users - Behavioral Intention

77
APPENDIX C
The following figures show the approval obtained from the IRB at Virginia Tech
regarding the user studies as explained.

78
Figure 41: IRB Approval

79
Figure 42: IRB Amendment Approval

80
APPENDIX D
The following e-mails show the correspondence with authors of papers from
which images were reproduced in this thesis.
Figure 43: Permission obtained from Dr. Gonçalves to reproduce Figure 18

81
Figure 44: Permission obtained from Dr. Shen to reproduce Figure 19