Embed Size (px)
Citation preview

SSC-291
A DESIGN PROCEDUREFOR MINIMIZING
PROPELLER-INDUCEDVIBRATION IN HULL
STRUCTURAL ELEMENTS
This document has been approvedfor public relaesa and sale; its
distribution is unlimited.
SHIP STRUCTURE COMMllTEE
1s79

— —
TheSHIPpm~am to imoveby an =tensfonofconstruction.
SHIPSTRUCTUSJCOMMIITEE
STRUCTUB3c014fITTSEis constitutedto prosecutea researchthehullstructuresof shipsandothermarim structure.krmwledg.pertainingto design,materialsandmethodsof
RADMH. ii.BELL (Chairman) Mr. M. PITSINChief,Officeof MerchantMarine Assistmt Administratorfor’
safe@ ConmwwialDevelopmentU. S. CoastGuard Maritim Ardmini8t?ation
.@. P. M. FALEW M.. R. B. XR4HLsir-actor Chief.Brmch of MarineGi1MullIntegri~ OiVisim aid Gas GperatiomNmml Sea SUstem Commd U. s. Ceologicalsurvey
MY.W. J. NANL4N Mr. C. J. WIk5’TOflEVicePtwsident ChiefEnginee>AmericanBureauof Shipping ?+ilitarySealiftCommd
LCDR T. H. ROBINSON,U.S. CoastGuard (Seoretq+ )
SHIP S’TRUCTUSESUBCCN’CWITTEE
me SHIPSTRUCTURISUBCOMMITTEEactsfortheShipstructureCmmitteeon technicalmattersby providingtechnicalcoordinationforthedeterminationof goalsandobjectivesof theprogram,andby evaluatingandinterpretingtheresultsin term?of structuraldesign,constr.ctimandoperation.
U.S.~AST GUW
cmT R. L. BROW7iCDR J. C. CARDLCDR J. A. SAXI&, JR.CDR W. M. SIMPSON,JR.
NAvAL SEA SYSTEMSCONMAND
Mr.R. CHIU~. R. JOHNSONJ@. J. B. O’BRIENM,. G. SORI,?N
U. S. GEOLOGICALSURVEY
Mr. R. GIANGERSLLlM,. J. GRSGORY
NATIONALACADENYOF SCIENCESsHIPRESEARCRCOWTTEE
Mr.O. H. OARLEY- LiaisonMr.R. W. RUMXS - Liaison
~ SOCIETYOFNAVALASCHITECTSh MARINEENC1NEEFL5
~. N. O. HAIOdER- Liaison
WELDINGRESEARmcOLMCIL
Mr.K. .7.K00PM,4/- Liaison
U. S.MM7CHAWTMARINEACADEMY
Dr.C.-B.SIM - Liaison
KCLITARYSEALIFTCOMMAND
Mr.T. W. CHAPM4NM?. A. B. S?AVOVY (Chaimm)M?. D. STEIN
AMSRICANBUREAUOF SHIPPING
Dr.H.-Y.JAJD?. D. LIUMr. I. L. STERN
MARIT1!QADNIN1sTRATION
Mr. F. J. DASHNAW.%. N. O. HAM4ERM?. F. SEIBOLDMr. M. TOLM4
INTESNATIONALSHIPSTRUCTURESCONGRSSS
MY. S. G. ST14J’SEN- Liaison
AMERICANIRON& STEELINSTITUTE
M?.R. B. STERNE- LiaisOn
STATEUNIVERSITYOF NEWYORKWSITIFE COLLECE
Or. W.R. POR2”ER- Liaison
U. S. COASTGU~ ACADEMT
CAPT!4.C.NOLAN - Liaison
U. s. NAVALACADEMY
Or.R. BHAITACHARYYA- Liaison
I

MsmberAg6mkUdfed.%&s CcmfGwd
Nmzlselsy$temcmnmd
Vmkd statmGw+?icxdSufv3yAlrrefhmamam Ci.%igyirig
AddrsasCh’remndencsto:
-W, ShiPS&WtUIsComtkeUS.CastGuordH~,(GMR2)kVa+in@nI,D.C.20SW
An InteragencyAdvisoryCommitiee
DedicatedtoImprovingtheStructureofShips
SR-1240
September 1979
The rapid advance in ship size and power and the trendtoward lighter hull scantlings prompted the Ship StructureCommittea to inveatfgate the propeller-induced vibrations in thehull and euperatructure of the chip. High vibratory forces inthe ahip can cause discomfort in the living quarters, excessive“panting” type deflection of tank bulkheads, and fatigue crackain webs and plating.
The first phase developed a bibliography published as
SSC-281 . It was made availabla for the October 15 - 16, 1978,Ship Vibration Symposium, eponsored jointly by the Ship StructureCemmittee and the Society of Naval Architects and MarineEngineers.
The subsequent phases, including the development of adesign procedure for minimizing propellar-induced vibration inhull structural elements, have been completed and are reportedhere.
&nrf$%f&Rear Admiral, U.S. Coast Guard
Chairman, Ship”Structure Committee

.- .
? -– _.”,“,
; “; 1=2,~’z“z,6’ l“ ~““ l“ ‘“ 1’“ “ 0’6 ‘ ‘ ‘ ‘ 1’ c K ‘“a.
~!!:!ll;lll~lll~l-fill!i!!llli!l/llllllll/lllllllllllll!lllllll!!,:,/,zlllli]~ll!~llll\llill]ll \l.,i Il,,l,il,1,,,III1111IIllIllIll!ltlll~~lIll!\\ll11111111111111111Illi,illlllllllll1111111!1111(111111111111.
g Ill Ill Ill Ill Ill 1[1 Ill Ill Ill Ill Ill Ill Ill Ill Ill Ill Ill Ill,,!!, $!! ..1,!, ,!, ,4,!,,!,,,! ,,, ,,, ,,, ,,, ,, ,,, ,,, ,,, ,,, ,, ,,, ,,, ,,, ,,, ,,, ,.QE, , 7 6 $ 4 3 2 , ,.*.SG=
~. .>.i .-=..%-=.->.
-ii-

TechnicalkeportDocument.aionPcIge
1.Repwt N..,.-. —
?, Go. ernrnenl A...,,; . . N,. -p-E&.!, catalog N.. ~
: ‘-------+2~SSC-291
4,T, ,1. w:s.-b~-—
A DESIGN PROCEDURE FOR MINIMIZINGPROPELLER-INDUCED VIBRATION IN HULL STRUCTURALELEMENTS
6~-Pmtm,ng O,g.n, m,,on C.de—
> 8 Pm fo, m,. g Orgon<, o!, o. R,,.,, N..
7“ ‘“’’n’”) O. H. Burnside, O. D. Kana, and SWRI-02-4821
.EL&JQL_9.Parlorm, r,g Orgm, z.?, m Nom, and Add,.,, 10.w.rku.,,No (T RAISI
Southwest Research Institute6220 Culebra Road, P.O. Drawer 28510 l).Con,r.c,.,G,o”tMm,San Antonio, TX 78284 DOT-CG-61907-A
13. Tw .1 R,,.,, .md Per,. d Ce, e,ed
1?. S,..,.,,,,,9 AO.OCY Name md Add..,, Final ReportU. S. Coast Guard 2/4/77 thru 4/27/79Office of Merchant I@77ineSafetyWashington, D.C. 20590 14.s,....,;;Age.,,cod.
A design procedure for minimizing propeller-inducedvibration in hull struc-tural elements is recommended. This procedure begins when the ship’s vfbra-tion specifications are defined and continues ehro~gh the design a“d Con-struction process until the vibration levels measured during sea trials arecompared with the specifications. Consideration is given to the hydro-dynamic excitation and structural response of the propeller-inducedvibra-tion problem, with both analytical and experimental techniques being used
in the design process. The recommended procedure is presented and discussedin the form of a flow diagram with 27 separate design steps. The processalso contains five evaluation milestones. At these points, the design isassessed, and, if deficiencies are found, corrective action can be takenbefore the design proceeds. The recommended complete procedure is presentedin this report for the first time. Many of the aspects of this procedureare still being developed, in particular, the influence of propeller cavi-tation on hull pressures and a simple but accurate treatment of water in-ertia. These indefinite aspects have to be treated empirically using j“dg-ment and experimental data. The portions of the procedure which are avail-able are illustrated in an example using a single-screw, containerized andunitized cargo ship.
17, K., W.,,ds 18, D<, tr:buti=,n $,a, mm?
Propel1ers Structural Analysis Document is available to the U.S. Public
Vibration Hydrodynamic Forces through the National Technical
Ship Hul1 Structures Cavitation Information Service, Springfield, VA22161
19. Sec. r;,y cl.,,!{, (.1 ,h; s ,.p.rt) 20. s.=”.;,”C1. s,’f. [06 ,hl. ~.ge) 21. N.. of ?.,. s 12. p,,.,
Unclassified Unclassified 160
F.cmDOT–F 1700.7(8-721 Reprc. duction of completed poge .wtho, ized
-iii-
TABLE OF CONTENTS
LIST OF ILLUSTR4TIONS
LIST OF TABLES
TAfiLEOF NOMENCLATILCW
I. INTRODUCTION
1. Overview of Program2. Definition of Propeller-Induced HU1l Vibration
Design Problem3. Consideration of Interdisciplinary
II. DESCRIPTION OF RECOMMENDED OVERALL DESIGN
III. DETAILED STEPS FOR SHIP VIBR4TION DESIGN
1.
2.3.4.5.6.7.8.9.
10.
11.12.13.14.15.16.
17.
18.19.
20.21.22.
23.24.
25.26.27.
Requirements
PROCEDURE
Define Vibration SpecificationsEstablish General Ship Design DataConduct Wake Survev. .Estimate Longitudinal Propulsion FrequenciesDesign PropellerCompute Propeller ForcesCompute Hull Pressures Without CavitationEvaluate Propeller CavitationEvaluate Propeller Cavitation FactorsDirect Calculation of Cavitation Pressures and
ForcesConduct Model TestsConduct Cavitation TestsCompute Total Pressures and ForcesDetermine Forced Longitudinal Response of ShaftingDetermine Forced Response of Nachinery SpaceDetermine Forced Lateral Response of Shafting
(Rigid Hull)Determine Forced Lateral Response of Shafting
(Flexible Hull)Conduct Superstructure Modal AnalysisDetermine Natural Frequencies and Forced Response
of RudderEvaluate Local Plating DesignAssemble Model of Entire ShipDetermine Vibration Ampltiudes and Stress Levels
of Complete ShipConduct Shaker Tests
Assess Local Vibrations, Structural. Damping, andModeling Techniques
Measure Vibrations During Sea TrialaCompare Measured Vibrations with SpecificationsCompare Meaaured Vibrations with Calculations
Page
...Viii
xii
xiv
1
1
1
3
4
9
91113141618212323
262828293233
38
4142
454648
5254
56575859
1.”.
TABLE OF CONTENTS (Cent’d)
IV. DESIGN EVALUATION MILESTONES
1. MILESTONE I - Preliminary Hydrodynamic Evaluation2. MILESTONE 11 - Final Hydrodynamic Evaluation3. MILESTONE III - Ship Substructure Evaluation4. MILESTONE IV - Complete Ship Structure Evaluation5. MILESTONE V - Test and Evaluation Review
v. APPLICATION OF THE RECOMMENDED PROCEDURE TO ACONTAINERIZED AND UNITIZED CARGO SHIP
1. Overview2. Procedure as Applied to a Containerized and
Unitized Cargo Ship2.1 General2.2 Ship Description2.3 Application of the Procedures
2;3.12.3.22.3.32.3.4
2.3,52.3.62.3.7
2.3.82.3.92.3.10
2.3.112.3.122.3.132.3.14
2.3.15
2.3.16
2.3.17
2.3.182.3.19
2.3.202.3.212.3.22
Define Vibration SpecificationsEstablish General Ship Design DataConduct Wake SurveyEstimate Longitudinal Propulsion
FrequenciesDesign PropellerCompute Propeller ForcesCompute Hull Pressures Without
CavitationEvaluate Propeller CavitationEvaluate Propeller Cavitation FactorsDirect Calculation of Cavitation
Pressures and ForcesConduct Model TestsConduct Cavitation TestsCompute Total Pressures and ForcesDetermine Forced Longitudinal
Response of ShaftingDetermine Forced Response of
Nachinery SpaceDetermine Forced Lateral Response of
Shafting (Rigid Hull)Determine Forced Lateral Response of
Shafting (Flexible Hull)Conduct Superstructure Modal AnalysisDetermine Natural Frequencies and
Forced Response of RudderEvaluate Local Plating DesignAssemble Model of Entire ShipDetermine Vibration Amplitudes and
Stress Levels of Complete Ship
-vi-
@.!?60
6064687173
76
76
76767678787878
788181
8182
82
87878782
87
90
90
9090
106106106
107
TABLE OF CONTENTS (Cent’d)
2.3.23 Conduct Shaker Tests2.3.24 Assess Local Vibrations, Structural
Damping, and Modeling Techniques2.3.25 Measure Vibrations During Sea Trials2.3.26 Compare Measured Vibrations with
Specifications2.3.27 Compare Measured Vibration with
Calculations3. Procedure as Applied to a Large RO/RO Ship Design4. Discussion of Example Problem
VI. CONCLUS IONS AND RECOMMRNDATIONS
1.2.
REFERENCES
APPENDIX A:
APPENDIX B :
APPENDIX C:
APPENDIX D :
APPENDIX E:
APPENDIX F:
APPENDIX G:
ConclusionsRecommendations
Computer Programs for Computing Propeller Forcesand Moments
Computer Programs for Computing Hull Pressuresand Forces
Computer Programa for Computing the LongitudinalResponse of the Propulsion Shafting
Computer Programs for Computing the LateralResponse of the Propulsion System
Computer Programs for Computing the Response ofthe Entire Hull Girder Structure
Longitudinal, Tangential, and Axial Wakes for the
Containerized and Unitized Cargo Ship Analyzedin Chapter V
Sunnnary of Vibration Studies Conducted by LittletonResearch and Engineering Corp. for a RO/ROTrailer Ship Designed by Sun Shipbuilding andDrydo ck Company
E!E
107
107107
110
107110118
120
120121
123
131
136
139
144
147
152
157
-vii-

LISTOFILLUSTRATIONS
2
3
4
5
6
7
8
9
10
11
12
13
14
15
16
ConceptualIdentificationofHullVibrationSources
ConceptualDiagramofDesiredDesignProcedure
FlowDiagramofRecommendedDesignProceduretoMinimizePropeller-InducedVibrations
First-ModeLongitudinalNaturalFrequencyVersusThrustBearingFoundationStiffness
SternGeometryforCavitationTunnelTests,from[48]
CavitationPropertiesofModelSeriesPropelleratKT= 0.075,from[48]
FlowDiagramforComputationofTotalPropeller-InducedPressuresandForces
Finite-ElementModelofa Ship’sAfterbody,from[61]
Finite-ElementModelandResponseoftheDoubleBottomandShaftfora 172,000dwtTanker,from[67]
DependenceoftheFirstShaftNaturalFrequencyonThrustBlockStiffness,KTB,172,000dwtTanker,from[67]
ThreeLevelsofSuperstructureMathematicalModels,from[75]
First-ModeShapeofThree-DimensionalSuper-structureModel,from[75]
UnitizedandContainerizedShip,VerticalVibrationModel
UnitizedandContainerizedShip,TransverseVibrationModel
ElevationViewofFinite-ElementModel
IsometricViewofFinite-ElementModel
!35!?
2
2
6
15
25
25
31
35
37
39
43
45
49
49
51
51
-viii-

LIST OF ILLUSTRATIONS (Cent’d)
E!..iwE
17
18
19
20
21
22
23
24
25
26
27
28
29
30
31
32
33
34
Finite-Element Mesh for TWo-Dimensional Modelof 370,000 dwt Tanker, from [75]
Forced Response Depending on the Applied GlobalDamping Value. 370,000 dwt Tanker, BallastCondition, from [75]
Calculated Forced Response at the Top of Super-structure in Longitudinal Direction. 370,000dwt Tanker; Ballast Condition, from [75]
Position of Nodal Points on the Main Deck forForced Vibrations Calculations of the HullGirder. 370,000 dwt Tanker, Ballast Condition,from [75]
Elasto Dynamic Model of Aft Part and Correlationof Exciter Tests with Free Vibration Calculations,from [94]
Preliminary Hydrodynamic Design Phase
MILESTONE I - Preliminary Hydrodynamic DesignEvaluation
Axial Wake Distributions for Original andModified Body Lines, from [97]
Final Hydrodynamic Design Phase
MILESTONE II - Final Hydrodynamic Evaluation
Ship Substructure Design Phase
MILESTONE 111 - Ship Substructure Evaluation
Complete Ship Structure Design Phase
MILESTONE IV - Complete Ship Structure Evaluation
Test and Evaluation Design Phase
MILESTONE V - Test and Evaluation Review
Outboard Profile
Propeller in Aperture
~
55
55
55
55
56
61
62
63
65
66
69
70
71
72
74
75
79
79
-ix-

LIST OF ILLUSTRATIONS (Cent‘d)
EWE
35
36
37
38
39
40
41
42
43
44
45
46
47
48
49
50
51
52
53
Frequency of Longitudinal Vibration VersusFoundation Stiffness
Ratio of Measured Hull Pressures Nhere CavitationExists to Calculated, Noncavitating Pressures
Vertical Harmonic Force and Transverse BendingMoment Generated on Hull by the Propeller
Inboard Profile
Grid Points on Frame 170, X = 396 In.
Grid Points on Frame 1S1, X = O In.
Amplitude of Axial Motion at the Propeller
Amplitude of Fore and Aft Vibration at PropulsionShaft Thrust Collar and Thrust Bearing Foot
Vibratory Motion on Bridge, Frame 164 at Center-1ine
Vertical Vibration on 36-ft Flat Generated byAxial Propeller Force
Vertical Vibration on 26-ft Flat Excited byAxial Harmonic Force at the Propeller
Vertical Vibration in Tank Top due to Longitudi-nal Excitation at the Propeller at 12.43 Hz
Vertical Vibration in Tank Top due to Longitudi-nal Excitation at the Propeller at 10.8 Hz
Double Amplitude of Sixth Order, Fore and AftMotion of l’hrustBearing Foundation
Double Amplitude of Twelfth Order, Fore and AftVibration on Thrust Bearing Foot
Vibration on 26-ft Flat at About 100 RPM
Vibration on 36-ft Flat at About 100 RPM
Vibration of Bridge Deck at About 98.6 RPM
Vibration of Bridge Deck at About 102 RPM
E?.E? .
80
88
89
92
93
94
99
100
101
102
103
104
105
108
109
111
112
113
114
-x-

LIST OF ILLUSTRATIONS (Cent‘d)
Ea!4.E
5.4
55
56
F1
F2
F3
F4
F5
Experimental Deflection Patterns on Tank Topat ~ at 10, 11, 12, and 12.5 Hertz
Experimental Deflection Patterns on Tank Topat ~ at 12.9, 14, and 16 Hertz
Response to Shaker Excitation
Longitudinal, Tangential, and Axial Wakea at0.335 Radius
Longitudinal, Tangential, and Axial Wakes at0.520 Radius
Longitudinal, Tangential, and Axial Wakes at0.723 Radius
Longitudinal, Tangential, and Axial Wakes at0.950 Radius
Longitudinal, Tangential, and Axial Wakes at1.100 Radius
2.3s2
115
116
117
152
153
154
155
156
.
-xi-

r-
LIST OF TABLES
Table
1
w
12Summary of Design Block 2--Establiah GeneralShip Design Data
Summary of Design Block 4--Estimate LongitudinalPropulsion Frequencies
217
183
4
Summary of Design Block 5--Design Propeller
Summary of Design Block 6--Compute PropellerForces 20
5 Smmnary of Design Block 7--Compute Hull PressuresWithout Cavitation 22
Summary of Design Block 10--Direct Calculation ofCavitation Pressures and Forces
627
307
8
Some Cavitation Test Facilities
Summary of Design Block 14--Determine ForcedLongitudinal Response of Shafting 34
Natural Frequencies of Double Bottom and Shaftfor Separated and Integrated Models, from [67]
936
Summary of Design Block 15--Determine ForcedResponse of Machinery Space
1039
11 Summary of Design Block 16--Determine ForcedLateral Response of Shafting (Rigid Hull) 40
Summary of Design Block 17--Determine ForcedLateral Response of Shafting (Flexible Hull)
1243
Correlation Between Measured and CalculatedSuperstructure Fundamental Resonant Frequencyfor Different Finite-Element Models. 138,000 dwtTanker, Ballast Condition, from [761
13
44
14 Summary of Design Block 18--Conduct SuperstructureModal Analysis 45
47Summary of Design Block 20--Design Local Plating15
16 Summary of Design Block 21--Assemble Model ofEntire Ship 53
-xii-

.— _.-. ._.----- -... .—.._
LIST OF TABLES (Cent’d)
Table
17
18
19
20
21
E!3s
Summary of Design Block 22--De temine Vibrationand Stress Levels of Entire Ship 53
Summary of Design Block 24--Assess LocationVibrations, Structural Damping, and ModelingTechniques 58
Pressure Data at 16 Locations on Seabridge Ship 84
Computed Cavitation Factors for the Three Ships 87
Hull Forces and Moments Due to Cavitation Effects 88
,..-xlll-
TAELE OF NOMENCLATURE
A
Am,An
am
ax
az
c
c
cc
D
d( )dt
E
F
Flull
FX,F ,Fyz
f
!3
IY
Iyz
Iz
Jx
K
KP1
KP2
‘PI ,2
cross-sectional area
areas associated with grid points m and n
acceleration of piston m
longitudinal clearance of propeller-hull, forward
vertical clearance of propeller-hull
factor reflecting density of fluid and proportions of pistons
speed of sound in fluid
critical damping coefficient
propeller diameter
derivative of ( ) with respect to time
modulus of elasticity
force on sphere in direction of vibration
mutual force between areas A and Am n
components of force in x, y, and z directions
frequency
hysteretic damping coefficient
moment of inertia about transverse axis
product of inertia relative to horizontal and vertical axea
moment of inertia about vertical axia
torsional area constant about longitudinal axia
thrust bearing foundation stiffness
pressure coefficient for first harmonic
pressure coefficient for second harmonic
dimensionless pressure variable
-xiv-

%thrust
%Bthrust
coefficient
block stiffness
KXYA shear area constant
KXZA shear area constant
L length of ship
transverse plane
vertical plane
IIX,M ,M components of moment in x, y, and z directionsyz
n number of propeller revolutions per second
P,Pr,P hull pressure
P. static pressure at centerline of propeller shaft at propeller;single amplitude of vertical component of propeller-excitingforce in pounds (at blade frequency)
Pv
R
r
rm
‘I
t
v
Va
Vm
-w
w
wmax
Y
7
y’,z’
vapor pressure
radius
distance between dipole’s centerpressure; radius from source
minimum surface distance betweenhull
propeller thrust
time
velocity
axial velocity of water relative
velocity of model
volume
Taylor wake number
maximum Taylor wake number
single amplitude in roils
transverse coordinate of neutral
and location of desired
grid points m and n on ship’s
to propeller disc
axis
coordinates of shear center of section
-xv-
.

_———
z number of propeller blades
; vertical coordinate of neutral axis
a
A
Ap1>(Ap2)
Aa
e
v
P
on
$1, (02)
m
Wt
angle of attack
displacement of ship in long tons
amplitude of first (second) component of averaged pressurefluctuation
change in angle of attack
angle between a vector to measuring point and force vector
frequency in cycles per second
mass density of fluid
cavitation index
phase angle of first (second) harmonic
angular frequency
angular blade position (wt = O for blade in vertical, topposition)
v displaced volume, m3
xv%

.I. INTRODUCTION
1. Overview of Program
At the outset of this study, it was recognized that various aspectsof the propeller-induced, ship hull vibration problem had received atten-tion in many previous investigations. These ranged in character fromresearch-oriented technical papers (both theoretical and experimental) ,to some papers and reports that dealt with certain parts of ship hull de-sign. Thus, the primary objective of this program has been to conduct acomprehensive survey and evaluation of these existing information sourcesand methods for predicting the exciting forces and the response of thehull structure to vibratory loads caused by the propeller system, and torecommend for design those procedures which appear both practical and re-liable. In meeting this objective, the previously fragmented informationis brought together into an overall design procedure which addresses thecomplete design problem.
This program has been carried out under four tasks. Initially aliterature search was conducted to establish the state-of-the-art forprediction methods currently available. The results of this task servedas the informational basis for this report, and have been previously pub-lished in the form of the bibliography identified in Reference 1. Empha-sis in that document has been placed on the current generation of large,high-powered vessels, so that, of the approximately 550 bibliographicentries, over 60 percent were published since 1970. The second task dealtwith evaluation of the design procedures . This has included principallya judgment about the suitability of the data for design purposes. Theresults of this task formed the basis for the third task, which requiredthe recommendation of an overall design procedure and associated detailedparts. Application of this procedure to a specific ship was demonstrated
in the final task. In essence, the results of all but the literaturesearch are documented in this final report. However, emphasis is placedon the recommended procedure and additional practices appropriate foroverall design, with very little explanation of why some previously usedmethods may have been omitted.
2. Definition of Propeller-Induced Hull Vibration Design Problem
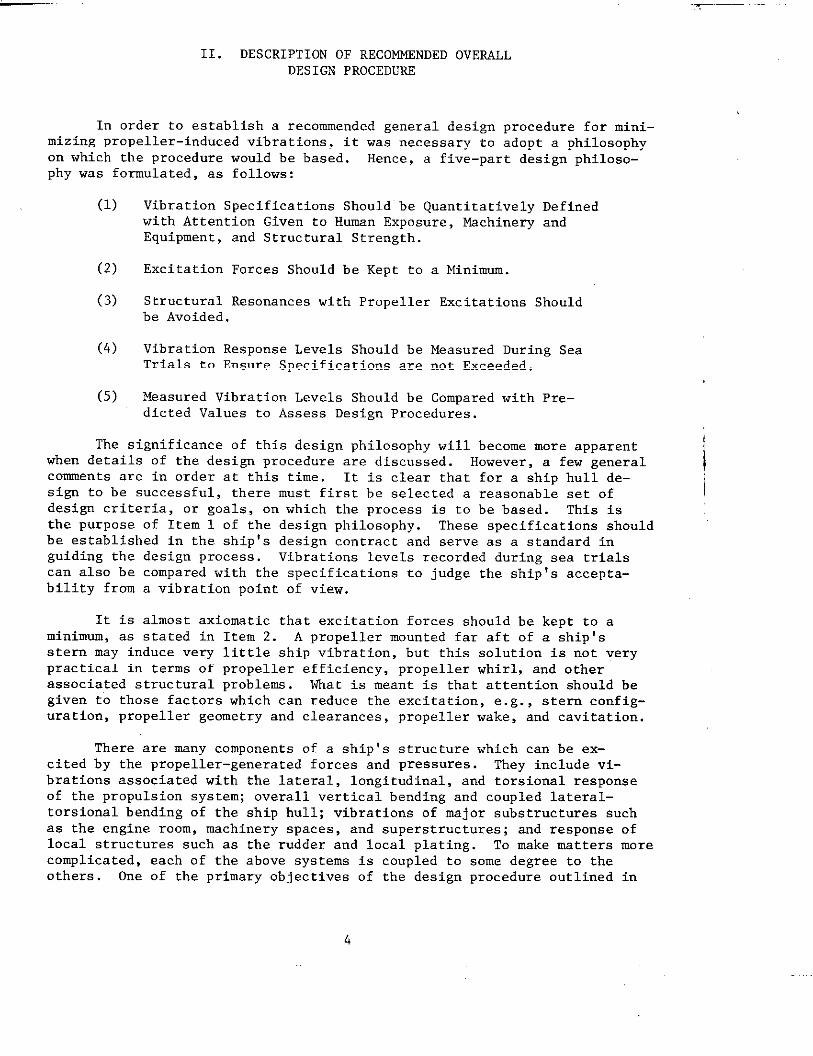
In view of the fact that ship hull vibrations can be excited by avariety of energy sources, it is appropriate that some definition of thepropeller-induced vibration problem be established, along with what gen-eral concepts will be included in the design procedures established forits solution. For simplicity, the problem to be addressed is shown con-ceptually in Figure 1. Thus , only those vibration responses excited bythe propeller and its associated shafting are to be considered. Further-more, a conceptual diagram of a desired design procedure is identifiedin Figure 2. Hence, the design procedure is to start with a given setof specifications, and progress with both analyses and tests to where thedesign has been validated by suitable model and full-scale sea trials.
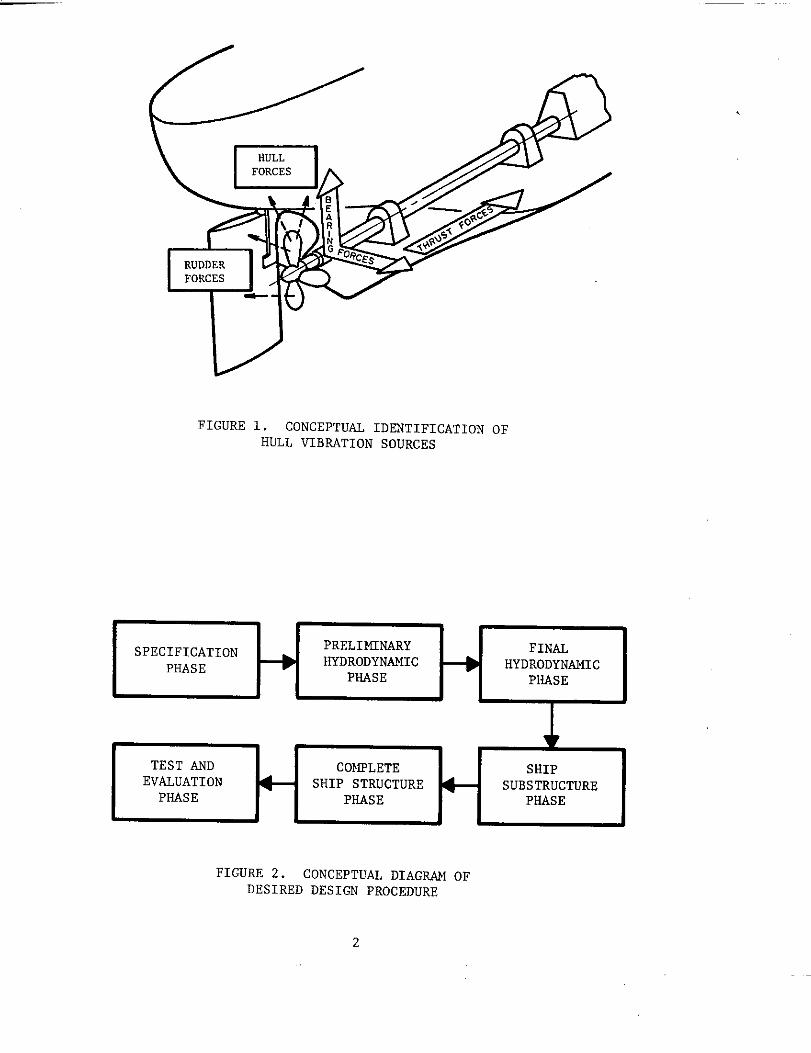
FIGURE 1. CONCEPTUAL IDENTIFICATION OF
HULL VIBRATION SOURCES
SPECIFICATION PRELIMINARY FINAL
PHASE HYDRODYNAMIC HYDRODYNAMICPIL4SE PHASE
I+
I TEST AND SHIPEvALUATION SUBSTRllCTT~RR I
I PHASE1- I ‘msE
,S , ------------PHASE
‘1
FIGURE 2. CONCEPTUAL DIAGRAN OFDESIRED DESIGN PROCEDURE
2

——
3. Consideration of Interdisciplinary Requirements
In view of the previously stated objective, it isveloument of a sufficiently general design procedure is
obvious that de-a formidable task.
This”is especially true if”ii is to be a~pl~cable to many classes of ships.To be successful, the design process involves several different specializednaval architecture and marine engineering disciplines, as well as some othersfrom traditional branches of engineering. Some areas included are:
Naval Architecture and Marine EngineeringShip Form DesignPropeller DesignPropulsion System DesignRudder Design
Theoretical HydrodynamicsPropeller and Hull LoadingCavitationBoundary Layer and Potential(wake survey interpretation)
Experimental HydrodynamicsWake SurveyModel TestsCavitation TestsHull Pressure Tests
Structural AnalysisPropeller ShaftsSubstructuresMain Hull and Superstructure
AcousticsHuman ResponseEquipment Response
Flow Theory
Experimental Vibration Force and Stress MeasurementsWith ShakerIn Service
It is obvious that no one person, and few engineering organizations,have complete expertise in all the above disciplines. However, a propervibration analysis requires an understanding of the interrelationshipbetween all of these factors and their coordination with the ship designprocedure. Therefore, the design of a ship having acceptable vibrationlevels has been and will be established from the technical input of severalsources. This is an important point. One should realize that a realistic
recommended vibration design procedure must mesh with other ship designand construction processes. It is also important to consider the proced-ures in toto, and not merely in terms of one of its parts. For example,
hydrodynamicists should not view the problem only in terms of a hydrody-namic solution; structural engineers should not view the problem only interms of detuning the response from the excitation. Each group needs to
realize the other’s pctential contribution to a solution and the necessityof incorporating input from all necessary sources.
3
II. DESCRIPTION OF RECOMMENDED OVERALLDESIGN PROCEDUKF
In order to establish a recommended general design procedure for mini-mizing propeller-induced vibrations, it was necessary to adopt a philosophyon which the procedure would be based. Hence, a five-part design philoso-phy was formulated, as follows:
(1)
(2)
(3)
(4)
(5)
Vibration Specifications Should be Quantitatively Definedwith Attention Given to Human Exposure, Machinery andEquipment, and Structural Strength.
Excitation Forces Should be Kept to a Minimum.
Structural Resonances with Propeller Excitations Shouldbe Avoided.
Vibration Response Levels Should be Measured During SeaTrials to Ensure Specifications are not Exceeded.
Measured Vibration Levels Should be CoInDaredwith Pre-dicted Values to Assess Design Procedur~s.
The significance of this design philosophy will become more apparentwhen details of the design procedure are discussed. However, a few generalcomments are in order at this time. It is clear that for a ship hull de-sign to be successful, there must first be selected a reasonable set ofdesign criteria, or goals, on which the process is to be based. This isthe purpose of Item 1 of the design philosophy. These specifications shouldbe established in the ship’s design contract and serve as a standard inguiding the design process. Vibrations levels recorded during sea trialscan also be compared with the specif icaticms to judge the ship is accepta-bility from a vibration point of view.
It is almost axiomatic that excitation forces should be kept to aminimum, as stated in Item 2. A propeller mounted far aft of a ship’sstern may induce very little ship vibration, but this solution is not verypractical in terms of propeller efficiency, propeller whirl, and otherassociated structural problems . Nhat is meant is that attention should begiven to those factors which can reduce the excitation, e.g. , stern config-uration, propeller geometry and clearances, propeller wake, and cavitation.
There are many components of a ship’s structure which can be ex-cited by the propeller-generated forces and pressures. They include vi-
brations associated with the lateral, longitudinal, and torsional responseof the propulsion system; overall vertical bending and coupled lateral-torsional bending of the ship hull; vibrations of major substructures suchas the engine room, machinery spaces, and superstructures; and response oflocal structures such as the rudder and local plating. To make matters morecomplicated, each of the above systems is coupled to some degree to theothers. One of the primary objectives of the design procedure outlined in
i
I
4

. ..
this report is to be able to predict accurately the various structural res-onances of the ship and determine if they will be excited by the propeller.If so, these resonances should he avoided because they will result in largeamplifications. This is the reasoning behind the design philosophy pre-sented in Item 3.
Item 4 is normally part of the sea trials for the acceptance of thevessel by the ship owner. The only additional comment which should be madein this report is that vibration levels should be measured at the criticallocations throughout the ship. For human exposure, these include livingquarters, watch stations, steering gear spaces, machinery spaces, and cargospaces. For machinery and equipment, the longitudinal, lateral, and tor-
sional vibration levels of the propulsion system should be measured alongwith those of any other critical components. Finally, the vibrationalstresses in critical structural locations should be monitored to ensurethat fatigue endurance limits are not exceeded. Critical areas would in-clude, for example, bottom framing over the propeller, rudder and rudderhorn, stern bearing support, vertical columns on intersecting bulkheads,and masts and spars .
The purpose of Item 5, in which the measured vibration levels arecompared with the predicted values, is to assess the validity of the de-sign procedure. It is extremely important to conduct this post-mort- anal-ysis because it allows the entire design process to be critically reviewedto determine its strong and weak points. For example, if unacceptablevibrations were measured on the bridge where none were predicted by theanalysis, the fault probably lies with inadequate structural modeling tech-niques of the superstructure. If the stern plating vibrates at the correctfrequency, but at greater amplitudes than predicted, the problem could betraced to underestimation of the propeller-generated pressures by thehydrodynamic computer code or the influence of cavitation.
Having the previously defined philosophy in mind, we now introducein Figure 3 a flow diagram of the recommended design procedures for mini-mizing propeller-induced vibrations. The procedure consists of twenty-seven individual blocks ranging in time from the establishment of vibrationspecifications to after the sea trials are conducted. Each one of theseindividual blocks will be discussed in detail in Chapter 111. In discus-sing these sub-procedures, it is the intent not only to give perspectiveto the function and purpose of each block, but to present detailed infor-mation on how each can be used in the design process. This can best beaccomplished using tables summarizing the pertinent information.
The overall procedure is divided into six design phases: (1) speci-fication, (2) preliminary hydrodynamic, (3) final hydrodynamic, (4) ship
substructure, (5) complete ship structure, and (6) test and evaluation.The purpose of these phase designations is simply to give a qualitativedescription of the overall design process in accordance with the designwhich was given in the Introduction. Figure 3 also shows five evaluationmilestones which are located approximately at the end of each of the lastfive design phases. The purpose of these evaluation milestones is to pro-vide a means of assessing the design integrity up to that point. If itis acceptable, the design may continue on to the next phase; if not,
5

DESIGN
t-
‘-’’”’’m+=c~mm--”
1.
Q
TDEFINEVIakwlos
S?F,cIFIcAnm’s
I-ul0ESTIUATt
WtmnmxlulPRLWLL51OX?F3QUENC1Es r-FiiiE
I I I II
L 4
I
eNUVATIOBMILESTWE 1 dNALUATION
wu.EsmNE11
FIGURE 3. FLOW DIAGMM OF RECOMMENDED DESIGN
6

. .. .—.——
.
““ -“”-----+ ‘“m’ ‘HIF-=-+------ -,1.---———4I
EsEl-@r+zzEl-
-
mCQml”c!
Slmnsm”m
2%
I
@mSwxmmm
@
‘clCGWAJ.E
)EA5UBmVI,umm$
CAuHms
I
1I
I I
Id
ee
PROCEDURES TO MINIMIZE PROPELLER-INDUCED VIBRATIONS
7

corrective action should be taken before the process continues. The ad-vantage in having these frequent evaluations is that potential problemareas can be identified and corrected early in the overall process. This,hopefully, will avoid the all-too-frequent problem of having a certain de-sign fixed, with changes possible only through costly modifications. Theevaluation milestones will be discussed in Chapter IV.
8

III. DETAILED STEPS FOR SHIP VIBRATION DESIGN
The procedures associated with individual design steps identifiedas blocks in Figure 3 will now be discussed in detail.
1. Define Vibration Specifications
It is the goal of the entire vibration design procedure to securea ship which has a minimum of vibration. This goal cannot be reached,however, without clearly establishing what vibration levels are and arenot acceptable to the shipowner. These levels must not be arbitrarilyset, but must be within certain limits to ensure safe and efficient oper-ation of the ship. Too stringent conditions impose an unwarranted burdenon the shipbuilder and high design and construction cost, while the ship
~Y vibrate badly if the specified levels are too high.
Undesirable levels of shipboard vibration manifest themselves inone or more of the following areas:
Human Exposure and Habitability
Machinery and Equipment
Structural Strength
Of these three, experience with the current generation of ships clearlyshows that the greatest problem lies with human exposure and habitability.This is due to the increased size, horsepower and speed of the vessel, andthe greater attention paid to the health and comfort of the crew. Refer-ence 2 discusses in some detail the problem of shipboard vibration andits effect on habitability. It is important to note that acceptable lev-els of vibration for human exposure can be different in different portionsof the ship. For example, continuous exposure levels must be maintainedin the living quarters and watch stations, while less stringent require-ments would be imposed in areas such as the steering gear, cargo, andmachinery spaces.
The machinery which is affected by propeller-induced vibrations isusually associated with the ship propulsion system. Included are thelongitudinal, lateral, and torsional vibrations of the shafting systemand vibra cion in the main power plant. Other items of equipment particu-larly sensitive to vibration would include those associated with naviga-tion, communication, or special cargo which the ship is carrying. How-
ever, all machinery and equipment should be able to withstand levelswhich are acceptable to humans.
The final way in which vibrations can be detrimental to the per-formance of a ship is by reducing its structural strength through fatigue.This is particularly a problem at highly loaded areas in the ship whichexperience many stress reversala. Such areas would include the bottomframing over the propeller, the rudder and rudder horn, the stern bearingsupport, vertical columns on intersecting bulkheads, and masts and spars.
9

_—.—
If we turn now to the set of specifications, they should include as~ minimum the following items:
1. Limits of acceptable vibration for human exposure,machinery and equipment, and structural strength.
2. The types of experimental and analytical studieswhich must be performed to ensure the requirementsare met and the extent of the documentation forthese studies.
3. The test requirements and methods for vibrationmeasurements during the acceptance trials .
4. The responsibility for correcting vibration prob-lems should they occur during the acceptance trialsor during the subsequent warranty period of the ship.
From the literature it appears that the limits of acceptable vibra-tion in humans are well established. Reed [3], in a 1973 paper, discussedthe question of acceptable vibration levels and pointed out that the Inter-national Standard ISO 2631, “Guide for the Evaluation of Human Exposure toWhole-Body Vibration” [4], published by the International Organization fOrStandardization, provides an excellent base for setting these levels onships. The standard permits vibration levels to be rated numerically aspercentages of the established standard of fatigue-decreased proficiency.The standard is related to frequency, direction of motion, and the expo-sure time at the different locations in the ship. Safe exposure limitsand reduced comfort limits are defined in terms of percentages of thefatigue-decreased proficiency level. This ISO Standard also has beenadopted by the American National Standards Institute, and it appears theStandard can be used to establish rational vibration limits for human ex-posure.
Guidance for acceptable vibration of marine steam and heavy-duty gas-turbine main and auxiliary machinery plants has been published recentlyby The Society of Naval Architects and Marine Engineers (SNAME) [5]. Itwas prepared by Panel M-20 (Machinery Vibrations) of the Ships’ MachineryCommittee and was intended to serve as a reference standard in ship’s speci-fications and procurement documents for new marine equipment. This Code
C-5 presents in detail the vibration limits of the machinery plants aswell as those for the longitudinal, lateral, and torsional response ofthe propulsion system. It also specifies what type of tests are to beconducted and the instrumentation required to measure the vibration lev-els.
SNAME also has two additional codes dealing with vibration measure-ments. The first, Code C-1 [6], is concerned with (1) vibration of theship girder excited by the propulsion system at shaft frequency, harmon-ics of the propeller-blade frequency, and frequencies associated withmajor components of machinery; and (2) vibration caused by propeller ex-citation of the propulsion shaft system. The second, Code C-4 [7], ad-dresses local vibration of ship structural elements such as the deckhouse,
10

decks, bulkheads, masts, machines, foundations, or other appurtenant ele-ments of interest. Both of these Codes can be referenced in the shipspecifications as to the manner in which vibration measurements will bemade.
The final item in the specification concerns structural strength.Since the ship’s structure is least affected by propeller-induced vibra-tion, little attention has been received in this area. The specificationshould state that the stresses in structural locations subjected to highloadings should not exceed the fatigue stress endurance limit of the ma-terial with an appropriate factor of safety. Typical critical areas werementioned earlier in this section; these include the bottom framing overthe propeller, the stern bearing support, and masts and spars. Stressesin these locations could be measured with strain gages during the accep-tance trials.
2. Establish General Ship Design Data
In any design process there must be a starting point at which basicinformation is assumed to be known. For the complete ship design, noth-ing more specific than the mission of the vessel would be given. This istoo early to seriously consider the problems associated with propeller-induced vibrations. More information about the ship’s size, configura-tion, and operating requirements must first be established in the feasi-bility studies.
The procedures presented and discussed in this report assume thatcertain general ship design data are available. The amount of informa-tion required is the minimum necessary to begin the design procedure. Asadditional ship data become known from other segments of the total designprocess, they will be used in the vibration study. One should also real-ize that this information is preliminary and may be altered if the designprocedures show changes are necessary.
TIIisstudy will asaume that the preliminary design data necessaryfor approval of the basic design by the Maritime Administration are avail-able. Such data would include:
Preliminary Lines Plan
Preliminary Midships Section Based on ABS Rules
Preliminary General Arrangements of Decks and Inboardand Outboard Profiles
Preliminary Weight and Center of Gravity Estimates
Speed and Power Estimates (No Model Tests)
Preliminary Machinery Arrangements
Preliminary Capacity Plan
Preliminary Hydrostatic Curves
11

Preliminary Flooding Curves and Damaged StabilityCalculations
Preliminary Specifications Indicating Propeller RPMand Diameter
This report will discuss those recommended design procedures whichcan be used after the preliminary design has been completed. This is not
to imply that the preliminary design should not consider the problem ofpropeller-induced vibrations. It is simply more difficult to quantita-tively establish the vibration characteristics of a given ship becauseall the necessary elements are not yet defined. Instead, the preliminary
design must rely heavily on the experience of the naval architectsand existing rules from the classification societies. Insight as towhether a ship will develop vibration problems can often be inferred bythe excitation and response levels on ships having similar stern lines,propeller RPM and power, machinery arrangement, and general structuralconfiguration.
Table 1 shows the data which are necessary to begin the designprocedure presented in Figure.3. As the entire ship’s design progresses,
these data will be supplemented by additional information when it becomes
TABLE 1. SUMMARY OF DESIGN BLOCK 2--ESTABLISH GENERAL SHIP DESIGN DATA
Input Data To Develop Required for
Hydrodynamic Test Wake Survey
Ship PowerModel Definition
and Speed .Estimate of Propeller Propeller Designand Shaft Sizes and Shaft IW’M
Evaluation of Thrust Longitudinal and
PreliminaryBearing and Location Lateral Analyais
Scantlingof Bearings of Shafting
and Shaft- Formulation of Struc- Entire Ship
ing Plans tural Model Mass and VibrationStiffness Analysis
Hydrodynamic Test Wake Survey
Ship LinesModel Definition
Hydrodynamic Test Cavitation TestsModel Definition Behind Ship Model
12
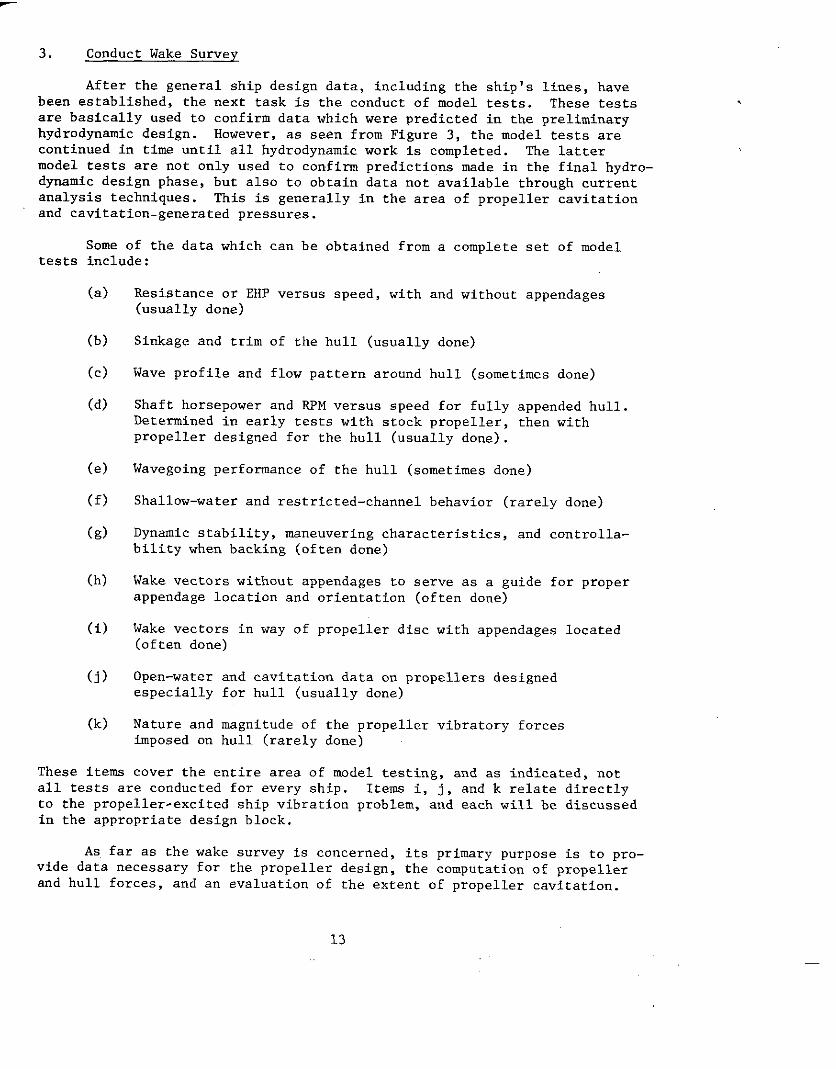
3. Conduct Wake Survey
After the general ship design data, including the ship’s lines, havebeen established, the next task is the conduct of model tests. These testsare basically used to confirm data which were predicted in the preliminaryhydrodynamic design. However, as seen from Figure 3, the model tests arecontinued in time until all hydrodynamic work is completed. The lattermodel tests are not only used to confirm predictions made in the final hydro-dynamic design phase, but also to obtain data not available throu,ghcurrentanalysis techniques. This ia generally in the area of propeller cavitationand cavitation-generated pressures.
Some of the data which can be obtained from a complete set of modelteats include:
(a)
(b)
(c)
(d)
(e)
(f)
(g)
(h)
(i)
(j)
(k)
Resistance or EHP versus speed, with and without appendages(usually done)
Sinkage and trim of the hull (usually done)
Wave profile and flow pattern around hull (sometimes done)
Shaft horsepower and RIM versus speed for fully appended hull.Determined in early tests with stock propeller, then withpropeller designed for the hull (usually done) .
Wavegoing performance of the hull (sometimes done)
Shallow-water and restricted-channel behavior (rarely done)
Dynamic stability, maneuvering characteristics, and controlla-bility when backing (often done)
Wake vectors without appendages to serve as a guide for proper
appendage 10cation and orientation (often done)
Wake vectors in way of propeller disc with appendages located(often done)
Open-water and cavitation data on propellers designedespecially for hull (usually done)
Nature and magnitude of the propeller vibratory forcesimposed on hull (rarely done)
These items cover the entire area of model testing, and as indicated, notall tests are conducted for every ship. Items i, j , and k relate directly
to the propeller-excited ship vibration problem, and each will be discussedin the appropriate design block.
As,far as the wake survey is concerned, its primary purpose is to prO-vide data necessary for the propeller design, the computationand hull forces, and an
of propellercavitation.evaluation of the extent of propeller
13

The wake, when determined in absence of the propeller, is called the nominalwake field. Van Oossanen [8] points out that it is becoming common practiceto no longer accept the measured wake behind a model in a towing basin asrepresentative of the full-scale wake field. Differences arise because thisnominal wake does not consider the effects of the propeller on the true wakeand because Reynolds number scaling is not included. In the last few years,there have been attempts to include these effects by numerical calculations.Hoekstra [9] at the Netherlands Ship Model Basin has developed a procedureto account for both Reynolds number scaling and the effect of the propelleron the nominal wake field.
Reference 10 presents the results of a recent British Ship ResearchAssociation project on propeller-excited vibrations in which methods ofwake quality assessment are discussed. The authors point out quite cor-rectly that the main cause of unsteady cavitation and large prope~lerbearing forces is the non-uniformity of flow into the propeller. It istherefore of the utmost importance that this wake be measured and evalu-ated accurately.
Until recently, only the axial component of the wake velocity wasmeasured. This was partly because the available experimental techniquescould only measure one component at a time and because existing hydrody-namic computational techniques did not include tangential and radial veloci-ties. However, at the present time, all three components can be measuredwith a five-hole pitot tube. This has stimulated additional research intothe ways the information concerning the three-dimensional velocity fieldcan be used in analytical prediction techniques. Other experimental tech-niques which are used to obtain the wake are the hot-wire anemometer andthe laser-Doppler anemometer. These are discussed briefly in a paper byvan Gent and van Oossanen [11].
4. Estimate Longitudinal Propulsion Frequencies
In general, to keep propeller and hull excitation forces low, it isdesirable to use many blades cm the propeller. The number of blades chosenis set primarily by the natural frequency of the shafting and propeller inlongitudinal vibration. To ascertain the probable frequency that will befound after the design of the propulsion system and its supports are de-veloped, it is useful to have a plot of natural frequency versus foundationstiffness such as shown in Figure 4. Using values of tbe probable range offoundation and thrust bearing stiffness, the probable range of shaft longi-tudinal frequency is determined. The number of blades for the propeller ischosen so that, preferably, the excitation frequency is less than 80 percentof a possible propulsion natural frequency. A less desirable, but sometimesnecessary, solution is to locate the longitudinal natural frequency fl about30 percent below the blade frequency of the minimum steady operating speed.Figure 4 shows that, if the foundation stiffness K is estimated to be be-tween 10 x 106 and 20 x 106 lb/in, then a four-bladed propeller will satis-fy the criterion over the entire stiffness range. The five-bladed propel-ler’s natural frequencies all are above the excitation frequency but if
6the actual foundation stiffness turns out to be close to 10 x 10 lb/in,undesirable vibrations could develop. A six-bladed propeller would not beacceptable because the shaft would pass through resonance for the lower
14

600
500
400
300
200
DESIGN RPM=90 rp m
10
THRUST BEARING FOUNDATION STIFFNESS, K( lblin x 106)
M41N SHAH SPEED ( rpm)K( lb/in ) fl(VPM) 4 BLADES 5 BLADES 6 BLADES
10 x 106 494 124 99 82
15 x 106 542 136 108 90
20 x 106 571 143 114 95
FIGURE 4. FIRST MODE LONGITUDINAL NATURAL FREQUENCYVERSUS THRUST BEARING FOUNDATION STIFFNESS
15

foundation stiffness and would lie dangerously close to resonance for th@remaining values.
Estimates for the thrust bearing foundation stiffness can be foundin the recent SNAME Technical and Research Report R-15 [12] and in theearlier work by Kane and McGeldrick [13].
For making these predict ions, the power and machinery arrangementsof the plant must be defined. These, along with the propeller RPM ordiameter, will have been specified by the preliminary design data. Fromthis, the approximate propeller weight and water inertia associated withlongitudinal vibration can be established by the techniques given by Mott[14] and Lewis and Auslaender [15]. Also, the approximate diameter of thetailshaft and lineshaft can be established by rules of the various shipclassification societies.
The simplest procedure for predicting the natural frequencies is onthe basis of a one-degree-of-freedom system consisting of the propellerand water inertia plus a portion of the shaft mass vibrating against thestiffness of the thrust bearing and its foundation. Since the shaftingweighs considerably more than the propeller and adds fIexibility, thisprocedure is not very good.
An improved procedure is to model the propeller and shaft as a seriesof concentrated masses and elastic elements and use a Holzer process forfrequency computation. With this degree of complication, it becomes de-sirable to use one of the many digital computer programs available. Theseprograms are usually based on finite-element or finite-difference methods,and several of the programs are discussed in Reference 16. With the highdegree of sophistication and accuracy found in commercially available struc-tural analysis programs, the choice of a particular code is governed by itsconvenience and cost to the user.
Table 2 presents a summary of the purpose, the input and output in-formation, and pertinent references for this design block. Its format is
typical of the tables for the remaining design steps and is intended toprovide the reader with a concise summary of the individual procedure. Thereferences listed in the tables are by no means exhaustive, but are partic-ularly useful for design purposes. Reference 1 provides a more exhaustivelist.
5. Design Propeller
After the number of blades has been selected based on the results ofthe longitudinal propulsion frequency analysis, the next step is to estab-lish the propeller design. The primaty purpose in this step is to selectthe propeller geometry which will provide the ship the highest propellerefficiency for the specified operating conditions. The design of the pro-
peller must also consider ancillary problems such as blade strength anddeformation, as well as selection of propeller materials and coatings toresist corrosion and erosion.
16
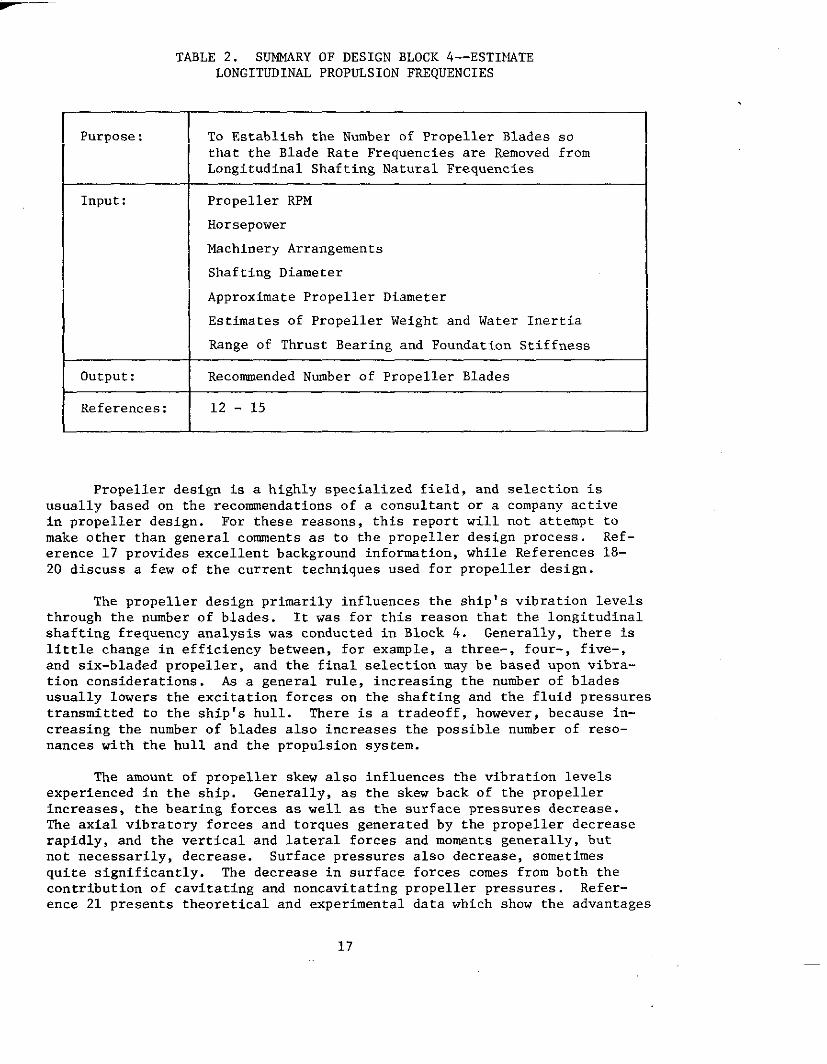
TABLE 2. SUMMARY OF DESIGN BLOCK 4--ESTINATELONGITUDINAL PROPULSION FREQUENCIES
Purpose: To Establish the Number of Propeller Blades sothat the Blade Rate Frequencies are Removed fromLongitudinal Shafting Natural Frequencies
Input: Propeller RPM
Horsepower
Machinery Arrangements
Shafting Diameter
Approximate Propeller Diameter
Estimates of Propeller Weight and Water Inertia
Range of Thrust Bearing and Foundation Stiffness
output : Recommended Number of Propeller Blades
References: 12 - 15
Propeller design is a highly specialized field, and selection isusually based on the recommendations of a consultant or a company activein propeller design. For these reasons, this report will not attempt tomake other than general comments as to the propeller design process. Ref-erence 17 provides excellent background information, while References 18-20 discuss a few of the current techniques used for propeller design.
‘Thepropeller design primarily influences the ship’a vibration levelsthrough the number of blades. It was for this reason that the longitudinalshafting frequency analyais was conducted in Block 4. Generally, there islittle change in efficiency between, for example, a three-, four-, five-,and six-bladed propeller, and the final selection may be based upon vibra-tion considerations . As a general rule, increasing the number of bladesusually lowers the excitation forces on the shafting and the fluid pressurestransmitted to the ship ‘a hull. There is a tradeoff, however, because in-creasing the number of blades also increases the possible number of reso-nances with the hull and the propulsion system.
The amount of propeller skew also influences the vibration levelsexperienced in the ship. Generally, as the skew back of the propellerincreases, the bearing forces as well as the surface pressures decrease.The axial vibratory forces and torques generated by the propeller decreaserapidly, and the vertical and lateral forces and moments generally, butnot necessarily, decrease. Surface pressures also decrease, sometimesquite significantly. The decrease in surface forces comes from botb thecontribution of cavitating and noncavitating propeller pressures. Refer-ence 21 presents theoretical and experimental data which show the advantages
17

and disadvantagespropeller design.used by the Naval
of highly skewed propellers as compared with conventionalThe design procedure and model evaluation techniques
Ship Research and Development Center forpropeller for a cargo ship are discussed in Reference 22.
Design of the propeller is really more a part of thecess than the ship vibration analysis, although there is athe hull vibration process.
Table 3 shown below summarizes thedesign process.
TABLE 3. SDMMARY OF
data required for
DESIGN BLOCK 5--DESIGN PROPELLER
a highly skewed
ship design pro-small input from
the propeller
IPurpose:
Input:
output :
References:
To Design a Propeller for the Given Ship Which WillProduce the Highest Efficiency
Power RequirementsShip SpeedPropeller RPMWake DataPropeller Diameter LimitationEstimate of Propeller SkewNumber of Blades
Geometric Form of Propeller
17 - 22
6. Compute Propeller Forces
Prior to about 1960, the determination of propeller forces was bymeasurements on models, primarily by Frank M. Lewis [231. In the late
1950’s estimates began to be made on a quasi-steady-state basis using theprocedures developed by Burrill [24] for evaluating the loading and effic-iency of propellers whose circumferentially averaged wake varied along thepropeller radii. A computer program for calculating the harmonic forcesand moments generated by the propeller working in varying wakes based uponthis quasi-steady-state procedure was applied by Hinterthon [251. A simi-lar computer program, also based on Burrill’s procedure, but including aswell the Theodorsen effects (i.e., the inertia of the fluid in respondingto circulation changes resulting from changes in angle of attack),was de-veloped by CONESCO [26]. The first tends to give high values of harmonicforces and moments and errors in their phase because the inertia effectsare neglected. The latter program tends to give low values of harmonicforces and moments because the steady-state solution assumes flow over the
18

~
tip and interaction between blades thatflow. Both of these programs have beenthe problem.
are not developed in the unsteadysuperseded by improved analysis of
In 1958,Ritger and Breslin developed a theory for the unsteady thrustand torque of a propeller in a ship wake based upon unsteady airfoil theory.This work has been continued by Tsakonas and Jacobs [27] and is now a fullydeveloped program for predicting the harmonic forces and moments exertedby a propeller on its supporting shaft, when working in the wake behind aship. This program is based upon lifting surface theory. Although the com-putations are long, they are easily handled by a computer. A descriptionof the program is given in Appendix A-1. This program is widely used both
in the United States and abroad.
The Department of Naval Architecture and Marine Engineering at theMassachusetts Institute of Technology has also been active in the predic-tion of the harmonic forces and moments transmitted by a propeller to itssupporting shaft. Using unsteady flow theory with the propeller bladerepresented as a lifting line, Neal A. Brown de”eloped relations for de-termining the periodic propeller forces [28]. Several computer programsbased on this theory have been developed. They are presented in AppendicesA-2 and A-3.
More recently, Kerwin and Frydelund [29] have approached the unsteadyforce problem with another procedure. It is a discrete element approachfor the computation of unsteady blade pressure distribution in the absenceof cavitation. The work is still ongoing, and plans are to extend the pro-cedure to include the effects of unsteady cavitation. A discussion ofKerwin’s computer program is presented in Appendix A-11.
Similar procedures to those developed in the United States have beendeveloped in Europe. M. ‘L’.Murray and J. E. Tubby [30] at the AdmiraltyResearch Laboratory developed a computer program for determining the un-steady shaft forces from propellers. Information on this is presented inAppendix A-5.
Table 4 shows the basic information required to determine the hydro-dynamic forces and moments acting on the propeller. Some of the inputdata may vary slightly, depending on the particdar computer program used.For more detailed information, the reader is referred to the listed ref-erences. It should also be noted that all input information is availableat this point in the design stage, either from the ship’s operating con-dition, propeller design, or wake survey.
The results of the numerical computations provide the mean and har-monics of the blade frequency forces and moments, usually in the longi-tudinal, vertical, and lateral directions. These forces and moments canbe applied to a structural model of the ship to determine its forced re-sponse to propeller excitation. This procedure will be discussed in theship substructure and complete ship structure design phases.
It would be veryto be able to estimate
advantageous, at this point in the ship’s design,the amplitudes of stern vibration based on the
19

TABLE 4. SUMM4HY OF DESIGN BLOCK 6--COMPUTE PROPELLER FORCES
Purpose: To Predict the Hydrodynamic Forces and Moments Act-ing on the Propeller
Input: Propeller Blade GeometryPropeller GeometryShip SpeedResults of Wake Survey (Usually Given in Terms of
the Fourier Coefficients of the SpatialVariation of the Axial and Tangential Com-ponents of Wake)
output : Mean and Blade Frequency Force and Moment Components(This Information is Usually Given for ThreeOrthogonal Forces and Moments)
The Time Varying Blade Pressure Distribution atEach Wake Harmonic
References: 27 - 32
computed propeller forces. This would allow the designer to predict ifexcessive vibration levels are probable and to take corrective action be-fore the design proceeds any farther. Unfortunately, no such general es-timation technique exists, but McGoldrick [31] does give empirical formulasfor the vertical displacement and torsional rotation of the stern. Theformulas are applicable only when the blade frequencies fall well above therange of significant hull mode frequencies. McGoldrick gives the formulafor vertical vibration as
where
Y
P0
A
Cpm
POY=
3.4 x 10⁻⁶ 2x A x (cpm)
= the single amplitude in roils (a mil is equal to 0.001 in.)
the single amplitude of the vertical component ofpropeller-exciting force in pounds (at blade frequency)
. the displacement of the ship in long tons
the blade frequency in cycles per minute
The empirical constant in the formulas is the factor 3.4 x 1o-6 which wasobtained by shaker tests conducted on the SS (bpker Mariner. McGoldrick
indicates that there is some reason to expect the empirical constants
20

could be used for different ships, but that much more experimental data areneeded to establish the constant for various classes of ships. To date,this has not been done. It should again be emphasized that procedures forestimating the stern vibration levels based only on the propeller forcesand gross ahip properties are needed at this point in the design phase.Development of such techniques is certainly worthy of further investigation.
7. Compute Hull Pressures Without Cavitation
It is the purpose of Design Blocks 7-10 to compute the excitationpressures on the ship’s hull, including the effects of cavitation. Themost direct method would involve calculating the type and extent of cavi-tation on the propeller operating in a given wake and then computing thefluid pressures generated on the hull. In the United States,no such directprocedure is available, although research is being conducted in this area.Van Oossanen reports [33] that procedures for calculating these hull cavi-tation pressures are available at the Netherlands Ship Model Basin and areused for design. They will be discussed in Block 11.
In this country, the procedure is roundabout and consists of predict-ing the hull forces generated by the propeller in the absence of cavita-tion and modifying the results by an empirical factor to account for cavi-tation effects. The factor is determined by (1) experience with full-scalemeasurements, (2) model tests in a cavitation towing tank, and (3) modeltests in a cavitation tunnel of sufficient size to include modeling a por-tion of the ship.
In a sense, the use of a factor applied to the pressures determinedin the noncavitating condition is theoretically unsound because the pres-sures are generated by another mechanism other than that responsible forthe pressures generated in the noncavitating case. The hull pressures aregenerated as the sum of three different processes . The first is the pres-sure due to propeller loads, i.e., the difference in pressure on the faceand back of the blades. The second source of pressure generation is thepassage of the propeller blade bulk through the water. Generally thepressures from these two sources are approximately equal in amplitude, butcan be quite different in phase. The third source, cavitation, is thegrowth and decay of cavitation bubbles as the blade moves into high wakeregions. Since the growth and decay of a volume radiate pressure muchmore effectively than moving a volume from one place to another or intro-ducing a flow from a source to a sink, the pressures from small cavitationvolume changes can be large.
The determination of propeller-generated hull forces can be made bytwo processes : (1) estimation of the hull pressure and (2) an integrationprocess involving Green’ s function which yields the total excitation force.Either process involves many engineering approximations for a reasonablesolution. Generally the hull pressure process involves determining thepressure that would be generated by the loading and thickness of the pro-peller in a free field and multiplying this pressure by a factor to repre-sent the pressure of the hull. This so-called boundarv factor is 2 for aninfinite flat plate located adjacent to arestraint on the flow caused by the plate
21
working propeller because thecan be simulated by an “image”
.

propeller working symmetrically opposite to the real propeller. The free-field pressure is that induced from both propellers, which is twice thatof one. The value of 2 is normally used with reasonable accuracy forpoints on a ship’s hull. References 34 and 35 indicate, however, that com-parison between the calculated and measured hull pressures showed somewhatlarge variations from the value of 2 for cavitating and noncavitating pro-pellers. This process is entirely inadequate for estimating differentialpressures across narrow surfaces such as skegs or rudders. The Green’sfunction process requires an estimate of the added mass of the hull surfacefor motions corresponding to each of the components of force and momentthat are required [36]. Theoretical processes for predicting pressure dif-ferences across wedge and cone shaped surfaces [37,38] are available, butnot yet programmed. A theoretical approach, the Smith-Hesse procedure,for predicting the hull pressure is available, but the calculation is solong that it has not at the present time been programmed.
In Reference 39 some of the methods available for calculating thepressure field around a propeller in a free stream are discussed and com-pared to cases where experimental results are available. The results areonly valid for the noncavitating propeller, and Reference 39 indicates theresults are changed appreciably when extensive cavitation is present.
Table 5 presents the data generally required for the computation ofthe hull forces or pressures. Some of the information will vary, depend-ing on the particular computer program used. Procedures for predictinghull pressures by lifting line and lifting surface theory are presented in
Appendices B-1 and B-2, respectively. Appendix B-3 presents the procedure
TABLE 5. SUMMARY OF DESIGN BLOCK 7--co~uTEHULL PRESSURES WITHOUT CAVITATION
II Purpose: To Compute the Excitation Levels without Cavitation
Acting on the Hull at the Ship’s Stem
Input: Propeller Blade Geometry
I I Wake Distribution I
I IThe Spatial Location of Points on the Stern where 1
Pressures are Desired
The Steady and Time-Dependent Blade LoadingDistributions
output : Steady and Harmonic Components of the Pressure FieldGenerated by a Noncavitating prOPeller. (For theGreen’s function method, all components of the totalhull forces and moments at multiples of the propellerblade rates can be computed)
References: 27, 32, 36, 40, 41, 42)
I I
22

for computing the total excitation force on the ship’s stern by using theGreen’s function approach.
8. Evaluate Propeller Cavitation
The evaluation of cavitation in this section refers to analyticalpredictions of the type and extent of cavitation on the faces of the pro-peller blades. Experimental techniques are considered in Section 12. Thepurpose of these calculations is to determine how severe the cavitationproblem is in a given wake field. They will enable the designer to assessthe risk of damage to the propeller from erosion and bent trailing edgesand to estimate the magnification of propeller-generated hull pressure overthe noncavitating case. This report is concerned with the second of thesegoals, and the next section discusses techniques for estimating these pres-sure factors.
Most of the recent research on the theoretical prediction of cavi-tation on propellers has been done in Europe, principally at the NetherlandsShip Model Basin and at the Swedish State Shipbuilding Experimental Tank.Van Oossanen [33] has reported results in late 1977 which show very goodagreement between calculated and observed full scale as well as calculatedand observed in the cavitation tunnel for the extent of cavitation. Thecomputer program used at NSME for these predictions is further discussedin Section 11.
Other predict ions have been made by Johnsson [43] at the SwedishState Experimental Tank, but they do not seem to agree as well with theobserved cavitation or with van Oossanen’s predictions.
9. Evaluate Propeller Cavitation Factors
After the extent of propeller cavitation has been determined fromDesign Block 8, the next step is to estimate the amount cavitation willincrease the pressures on the hull. Research into the problem of propeller-induced forces has been ongoing for several decades, but it was only recog-nized in the past ten years that transient cavitation influences the hullpressures very strongly. In fact, Lewis and Kerwin stated in a recentpaper [44]:
lihile extensive work in noneavitating fLows uas notentire ly a wasted effort, it would seem clear n~ that
both analytical and experimental prediction of v<bra-tory forces are eompZetely unrea list-iewithout incLu-sion of the influence of cavitation. What remains to
be seen is whether or not design decisions based uponminimizing noneavitating propel Zer vibratory excitationare optimum when cavitation is present.
Reference 45 reported to the 12th International Towing Tank Confer-ence that the amplitudes of fluctuating pressures increased around 100percent when cavitation waa present between the propeller tip and about0.85 radius. Other investigations of the variations in these pressurefluctuations are given in References 46-48, and the reported cavitation
23

factors range from 2 to 40. Clearly, with this large variation in thepressures generated between noncavitating and cavitating propellers, itis not a simple task to estimate a reasonable value of the factor.
These factors must be obtained from experimental tests, either fullscale or model. The most straightforward approach is to make pressuremeasurements on a ship with similar lines, wake, and operating conditions .However, for a new design, this approach may not be feasible. Instancesin which such measurements were made are described in References 49-50.Model tests must either be conducted in a cavitation tunnel or a repres-surized towing tank facility. For tests in the cavitation tunnel, thewake field is simulated either by screens and an afterbody model of theship, or if the tank is sufficiently large, a complete ship model. Thesedirect test methods will be described in more detail in Block 12.
The evaluation of the propeller cavitation factors proposed in thissection is much less precise in that estimates based on previous modelexperiments are used as a basis. Reference 48 contains results of cavi-tation tests conducted in the large cavitation tunnel of the NetherlandsShip Model Basin for a number of Wageningen B-series model propellers.Figure 5 shows the geometry of the stern and the location of the pressurepick-ups on the ship’scenterline over the propeller. To uae Reference 48for estimating the cavitation factors, the investigator would first needto evaluate the extent of cavitation on the propeller and compare it withfigures given in the reference. The corresponding cavitation index on cannow be estimated, and knowing the ship’s thrust coefficient, KT, the ampli-tudes of the first and second harmonic component of the average pressurefluctuations (API and AP2) can be estimsted from the tables given in thereference. Figure 6 shows the extent of cavitation on the front and backfaces of a Wageningen BB 4-70 propeller at cavitation indices of 2.5 and5.0 along with the nondimensional pressure fIuctuation corresponding to a
thrust coefficient of KT = 0.075. The dimensionless pressure variableKpl z is defined as
‘P1,2= Kpl sin (zut+l) + KP2 Sin (2ZUt-$2)
where
OJt angular blade position (cot= O for a blade in theve~tical, top position)
z
KP1
number of propeller blades
API— (pressure coefficient forpn2D2
AP2
KP2 — (pressure coefficient for~n2D2
first harmonic)
second harmonic)
.
API> (AP2) = amplitude of first (second) component of averagedpressure fluctuation
24

FIGURE 5. STESN GEOM3TRY FOR CAVITATION TUNNEL TESTS,FROM [48]
B.4cKSIDE CAVITATION
FACE SIDE CA~TATION
“!!ib,, —,I
“$!t?-.\\,)-..
“%\
+49”‘\
DIMENSIONI,ESSPRESSUREFLUCTUATIONSFOR K1.= 0.075
forward-5“. middle
(N -1200 RPM) aft
0.0184 1210.0198 1410.0135 1S0
forward- 2.s 0.0462 172““ middle 0.0491 173(N -1200 RPM) aft 0.0395 182
h> *2
fotw,d““-5
0.0023 133middle 0.0033 135
(N . 1200 SPtl) .E t 0.0025 1%
an - 2.5 forva,d 0.0085 33❑iddle 0.0067 12
(N -1200 mbt) aft 0.0060 2
FIGURE 6. CAVITATION PROPERTIES OF MODELSERIES PROPELLER AT KT = 0.075,
FROM [48]
25
P = density of water
n number of propeller revolutions per second
$1,($*) = phase angles of first (second) harmonic
D = propeller diametex
The cavitation index on and thrust coefficient KT are defined as
T.—‘T pn2D4
where
P . static pressure at the centerline of the propeller shaft0
at the propeller
P“’= vapor pressure
T = propeller thrust
The success of this procedure clearly depends on how closely thestern configuration, propeller geometry, and wake match the test condi-tions. The method will not yield exact results, but may provide valuableinformation as to the magnitudes of the cavitation pressure factors. Theresults are also limited in that they provide information only at themeasured locations and not at other points on the ship’s hull.
10. Direct Calculation of Cavitation Pressures and Forces
After calculation of the pressure forces and moments as discussedin Section 6, the next task is to compute the propeller-generated pres-sures on the hull. These pressures cone from three sources as discussedin Section 7. The first results from a fluid element being displacedfrom one point.to another, the second is due to an expanding or contract-ing fluid volume caused by cavitation, and the third is the pressure due‘cothe propeller loads. As discussed in the previous section, the cavi-tation-induced pressures can increase the total hull pressure by severalfactors and play a major role in producing propeller-induced vibrations .Cavitation also reduces the propeller’s service life in the form of erosionand bent trailing edges. Consequently, accurate prediction of cavitationwould be a major step forward in improving ship design.
I
In recent years, with the increase in ship size, higher speeds andpower, the problem of computing cavitation directly has received increased
attention. Most of the work is being done in Europe, principally by vanOossanen at the Netherlands Ship Model Basin. Reference 33 provides an
26

excellent state-of-the-art review in cavitation prediction techniques.From work recently published by van Oossanen, it appears that his tech-nique gives good correlation with observed cavitation patterns for lightlyand moderately loaded propellers . The predicted results are not as satis-factory for a heavily loaded propeller in a very non-uniform wake. VanOossanen attributes this to lack of knowledge of the change in wake flowdue to the working propeller.
Reference 8 indicates that the Netherlands Ship Model Basin has acomputer program, designated as CAVANAL, for the computation of cavita-
tion on propeller blades. The input data required for tbe program arelisted in Table 6. Reference 33 gives comparisons of the extent of cavi-tation as predicted by theory and observed in model tests.
TABLE 6. SUMMARY OF DESIGN BLOCK 10--DIRECT CALCULATIONOF CAVITATION PRESSURRS AND FORCES
Purpose: To Determine the Extent of Cavitation and PressureDistribution on a Propeller
Input: Propeller Geometry ParametersPropeller DiameterHub DiameterNumber of BladesExpanded Blade Area RatioRadial Pitch DistributionRadial Distribution of:
Distance of Leading Edge to Generator LineDistance of Trailing Edge to Generator LineRadius of Trailing EdgeMaximum Camber-Chord Length RatioMaximum Thickness/Chord-Length RatioLocation of Maximum Camber with Respect to
Leading EdgeAngle Between Nose-Tail Line and Pitch Line
Wake Field at 25 Angular Coordinate Values forFive or More Radii
Direction of RotationPropeller RPMShip SpeedStatic Pressure at Centerline of PropellerFluid Ninimum Vapor PressureWater TemperatureFluid Density
output : Pressure Distribution on Propeller BladeCavitation IndexExtent of Cavitation on Propeller Blades
References: 8, 33, 51
27

Recently, the program CAVANAL has been coupled with another NSMBprogram which calculates the propeller-induced pressure field on thehull . This last program, called HUFO, is based on the theory developedby Noordzij and described in Reference 51. Van Oossanen reports [8] thatsince CAVANAL and HUFO have been joined, a relatively large number ofsuccessful calculations of hull surface pressures have been carried out.These were performed to optimize propulsion configurations for a givenhull, given operational parameters, and a given wake.
11. Conduct Model Tests
The model tests discussed in this section refer to those associatedwith noncavitating propeller-generated forces and pressures. Experimental
tests used to study the effects of cavitation will be discussed in thenext section. Tests related to other portions of the ship’s design werelisted in Section 3, where the wake survey was first discussed. The pur-pose of conducting these model tests is to measure the propeller, hull,and rudder forces for comparison with the values calculated from the ana-lytical techniques . A favorable comparison will confirm the wake surveyand give assurance that the excitation levels actually experienced by theship will be close to those predicted. If the comparison is not withinacceptable limits, then the designer must determine what is causing thediscrepancies. Possible sources of errors are in the conduct of the wakesurvey, the determination of the Fourier component of the wake as requiredby the programs used to compute propeller forces and pressures, inaccu-racies in these programs or associated data, or errors in the conduct ofmodel tests . Whatever the source of error, it is imperative that thedifferences between analytical and experimental predictions be resolved.There is little sense in making response predictions for the entire shipand its subsystems if one does not have confidence in the accuracy of theapplied loadings.
The expense of these tests should only be a small portion of theentire budget allocated to the vibration analysis . In fact, the same
model which was made for the wake survey can be used. Only a scale modelof the final propeller design need be constructed.
The method for conducting these tests was developed by F. M. Lewisin 1936 [23] for the measurement of vertical and lateral forces plus alongitudinal couple. More current techniques for conducting these testsare described in References 52-53. It should be noted that the modeltests for measuring propeller forces require propeller dynamometers whichare located aft of the propeller on a separate measuring device. Thepurpose of this arrangement is, of course, to measure directly the forcesand moments exerted by the propeller at its connection with the lineshafting. David Taylor Model Basin, Massachusetts Institute of Tech-nology, and the Netherlands Ship Model Basin are three test facilitieswhich have propeller dynamometers.
12. Conduct Cavitation Tests
This report has already emphasized the importance of propeller cavi-tation on the level of vibratory pressures imposed on the ship’s hull. It
28

also has indicated that the theoretical prediction techniques of cavita-tion and its effect are still being developed and are not availablethroughout the world. For these reasons, various research organizationshave established experimental facilities to study this problem and assistthe shipbuilder to design a ship in which detrimental propeller cavita-
.
tion effects are minimized. Table 7 lists some of the cavitation testfacilities throughout the world.
These tests can be conducted by either one of two experimental tech-niques: the cavitation tunnel or a facility capable of modeling the freesurface effects.
In a cavitation tunnel of limited size, the wake is established byscreens or a combination of screens and a model of the ship’s afterbody.For larger tunnels such as at the Swedish State Experimental Tank, a com-plete ship model can be used to establish the wake. References 44, 49, and54 describe the testing techniques and results of several investigations
conducted in cavitation tunnels.
For tests conducted in a variable pressure towing tank, the dynamicand kinematic similarities between the ship model and prototype are matchedas closely as possible. The usual procedure is then to maintain equalcavitation and Froude numbers for the model and prototype. The largestdepressurized towing tank is operated by the Netherlands Ship Model Basinin Ede, The Netherlands. A description of this facility along with somerecent experimental results is presented in Reference 55.
References 56 and 57 describe experimental programs for cavitationstudies in both tunnels and variable pressure towing tanks for ductedpropellers on large ships with deadweight tonnage over 200,000-dwt. Ref-erence 58 shows that good agreement was obtained when results obtainedfrom the large cavitation tunnel at the Swedish State Experimental Tankwere compared with those from the Netherlands Ship Model Basin for a tanker.
13. Compute Total Pressures and Forces
The objective of the previous hydrodynamic investigations was to de-termine the magnitudes and frequencies of the individual excitations act-ing on the ship. As indicated in Figure 1, excitations arise from thepropeller operating in a given wake field and are transmitted to the shipby three mechanisms: forces and moments exerted by the propeller on theline shafting; pressures, both noncavitating and cavitating, transmittedto the ship hull; and excitations introduced into the ship through hydro-dynamic loading of the rudder in the vicinity of the working propeller.All of these have been discussed in the previous sections. The purposeof this design block is to assemble the results of the earlier work andcompute the total components of hydrodynamic excitation acting on the ship.These components will then be used as input to determine the forced responsefor each of the ship’s structural subsystems and for the complete ship.The response calculations will be discussed in the next two design phases.
Figure 7peller-induced
shows a flow diagram for the computation of the total pro-pressures and forces acting on the ship. The reader can
29

w0
TABLE 7. SOME CAVITATION TEST FACILITIES*
Organization Location Type of Facility
Massachusetts Institute Cambridge, Massachusetts, Variable Pressureof Technology USA Water Tunnel
David W. Taylor Ship Carderock, Maryland, USA 2 Variable PressureResearch and Development Water TunnelsCenter
Netherlands Ship Model Ede, The Netherlands Variable PressureBasin Towing Tank
Ship Research Institute Trondhe im, Norway Cavita tion Tunnelsof Norway (2)
Swedish State Ship- G6teborg, Sweden Cavitation Tunnelsbuilding, Experimental (2)
Tank
Vws West Berlin, Federal Free SurfaceRepublic of Germany Tunnel
*This list is not necessarily complete.

— ..—

see that all design blocks in the final hydrodynamic phase (Blocks 6-12)are used in the process. The calculation of the propeller forces and mo-ments is fairly straightforward and was discussed in Section 6 along withavailable methods. It was pointed out in Section 11 that model testsshould also be carried out to confirm the wake survey used in the calcu-lation of these moments and forces. The results of the model tests couldsupplant the numerical calculation, but this is not recommended. In gen-eral, the calculation procedures are much less time consuming and costlythan the experimental tests and give a broader picture of the excitation.Therefore, it is probably desirable to carry them through even if detailedmodel tests are run.
The computation of the hull pressures and forces is more difficultthan that for the propeller forces and moments. It is complicated evenmore by the influence of cavitation, whose importance was only quantita-tively recognized within the last ten years. At the present time, theusual way of evaluating the total hull pressures is to compute the pres-sures without cavitation, estimate the effect of cavitation, and apply
appropriate factors to determine the total excitation. These procedureswere discussed in Sections 7-9, where it was indicated this process isroundabout and not very satisfactory from a theoretical point of view. Adirect calculation of the cavitation pressures and forces is certainlymore desirable, and research is active in this area. Section 10 discussesthe direct calculation method used by the Netherlands Ship Model Basin.
The other method of obtaining the cavitating hull pressure is throughmodel tests either in a cavitation tunnel or repressurized towing tank.There are several organizations throughout the world which have experimen-tal facilities especially designed for conducting these tests. These werediscussed in Section 12 along with references to some recently publishedresults. As in the case of the propeller forces, the cavitation modeltests could be used in place of analytical predictions of the extent,andpressure generated by cavitation. The word of caution expressed earlierin this section still applies. Model tests are expensive to conduct, andtheoretical work needs to be continued so that the phenomenon of cavita-tion is fully understood and its effect on the ahip’s design can be ana-lytically predicted.
14. Determine Forced Longitudinal Response of Shafting
By previous calculations, the longitudinal exciting force at thepropeller will have been determined. The purpose of this study is tofind whether the vibration level generated by this excitation will beacceptable. The propeller and the length and diameter of the shaftingwill be known, and the thrust bearing will probably have been selected.The unknown quantity will be the stiffness of the thrust bearing founda-tion. The amplitude of motion at the thrust bearing as a function of fre-quency for different values of foundation stiffness is required
.

-“”
process is to represent the foundation and bottom as a combination offrustums of wedges and beams. This procedure is described in Reference12. A process requiring less engineering judgment is to use finite-ele-ment methods, assuming that the machinery double bottom is supported atits edges . It is also possible to represent the machinery space doublebottom as an anisotropic plate.
Generally, it will be found that the natural frequency of the bottomstructure will not be far removed from the propeller blade frequency. Ifcoincidence occurs, the propeller through longitudinal vibration of theshafting will excite engine room vibration even though the natural fre-quency of the shaft in longitudinal vibration determined from static stiff-ness considerations appears to be suitable. This aspect is considered inthe following section.
As in Design Step 4, in which the longitudinal propulsion frequen-cies were estimated, the maximum excitation frequency should be less thanabout 80 percent of the longitudinal resonance frequency. If this is notpossible, then the excitation frequency at the lowest steady operatingspeed should be about 30 percent above the critical longitudinal frequency.
Several types of computer programs are suitable for this analysis.The system can be broken down to a sequence of masses connected by springs.This can be analyzed by a Holzer Table program, the kind developed fortorsional vibration, or by a standard finite element program such as ANSYS,MARC, STARDYNE, NASTRAN, SESAN, etc. However, the shafting, whose distrib-uted weight is several times that of the propeller with its associated wa-ter inertia, consists of long lengths of constant diameter. This charac-teristic is encouraging to a program that represents the shaft as distrib-uted mass and elasticity, and a few computer programs have been developedwhich utilize this property. In such a case the system can be defined witha minimum of input variables, thus saving time, improving accuracy, andreducing the probability of erroneous inputs .
Table 8 shows the information necessary for conducting this forcedvibration analysis. All of the input data will be available either aspart of the basic ship design parameters or generated during the designprocess.
The following appendices taken from Reference 59 indicate that theMaritime Administration has a program (Appendix C-1) based upon the HolzerMethod for determining longitudinal vibrations; that J. J. McMullen has aprogram (Appendix C-2) for determining longitudinal vibration where theshaft is modeled as lumped masses; and that Newport News has a program(Appendix C-3) that can represent the shaft as a distributed mass system.A Littleton Research and Engineering Corp. program utilizing lumped anddistributed masses and elasticities is described in Appendix c-4.

TABLE 8. SUMMARY OF DESIGN BLOCK 14--DETERMINE FORCED
LONGITUDINAL RESPONSE OF SHAFTING
Purpose: To Compute the Resonant Frequencies and ResponseAmplitudes of the Longitudinal Shafting Subjectedto Forced Excitations
Input: Stiffness of Thrust Bearing FoundationThrust Bearing StiffnessReduction Gear ~ss and StiffnessLength and Diameter of Shafting
Mass and Added hlass of PropellerEstimates of DampingLongitudinal Excitation Levels
output : Longitudinal Shafting Resonant FrequenciesAmplitude of Motion at Thrust Bearing
References: 12-15, 59
vibrations in the machinery spac,ebottom structure can be strongly coupledwith longitudinal vibration of the shafting. Although it might be desir-able to model the double bottom as an aniaotropic plate with variable in-ertias for the same reasons that the distributed mass-elasticity procedureis used for the shafting, this type of model has not been developed, andit is necessary to use finite-element modeling. Reference 60 discussesthe modeling techniques used in a recent static and dynamic finite- elementanalysis of the hull structure of a large surface-effect ship. The aniso-tropic behavior of the hull plating due to longitudinal T-shaped stiffenerswas incorporated into the NASTRAN model by modifying the material propertymatrix.
It is desirable that the computer system that is used be compatiblewith that used for the complete ship. If the final ship is to be modeledby finite-element procedures, the same system should be used for the ma-chinery space, which can then be incorporated in the full model as a sub-structure. If the complete ship is to be modeled as a Timoshenko beamwith sprung masses, any convenient finite-element model can be used forthe machinery space.
Figure 8(a) shows a finite element of the afterbody with the ma-chinery space shaded. The model of the longitudinal shafting and thrustbearing stiffnesses will be available from the analysis conducted in Block14. The question which must be decided is to what extent and in what de-tail must the surrounding machinery space structure be modeled to repre-sent adequately its mass and stiffness properties. The answer depends agreat deal on the experience of the engineer conducting the analysis. Themodel should extend in the transverse direction over the ship’s half width(symmetry can be assumed) , in the longitudinal direction to at least several
34

.
(a) Machinery space is shaded
(b) Aft bearing structure is shaded
FIGURE 8. FINITE ELEMENT MODEL OF A SHIP ‘SAFTERBODY, FROM [611
35

transverse floors on each side of the thrust bearing, and preferably thewhole length of the machinery space, and in the vertical direction fromthe bottom of the ship’s hull to about two decks above the thrust bearing.
The important point to remember is that the model must be accurate enoughto predict the lower natural frequencies and mode shapes.
If doubts exist in choosing a proper model size, the analyst shoulderr on the conservative side; i.e. , pick a model larger than necessary.First, the computed resonant frequencies and response will be closer tothe actual values. Second, the additional work required to generate thelarger model is not lost because the model will be used as a substructurein the complete ship vibration analysis.
One of the earliest finite-element investigations into the naturalfrequencies of the machinery space was made by Reed [62]. Other investi-
gators, especially in Europe, are using finite-element techniques on aroutine basis for the structural analysis of all critical locations in theship. G. C. Volcy at Bureau Veritas has been particularly active in thisarea, and many techniques and results obtained by that organization in itsstudy of propeller-induced vibrations are published together in Reference63. For particular papers dealing with machinery space vibrations, thereader should see References 64-66.
Figure 9(a) taken from Reference 67 shows a finite-element model ofthe shaft and double bottom for a large tanker. Table 9 gives the naturalfrequencies for the separated and integrated models and indicates thedouble bottom affects the shaft‘s frequency more strongly than the shaftaffects the double bottom’s frequency. Figure 9(b) clearly indicates ashaft resonance at 12.11 Hertz, and the corresponding mode shape is givenin Figure 9(c). Reference 67 indicated that the static stiffness of thethrust block was 0.190 x 10⁶ Mp/m (one MP equals 1000 kilograms Of force) ,which resulted in a first mode longitudinal shaft frequency of 12.83 Hertz.Nhen the double bottom model was coupled with the shaft, the frequency
TABLE 9. NATURAL FREQUENCIES OF IKXIBLE BOTTOM AND
SHAFT FOR SEPARATED AND INTEGRATED MODELS ,FROM [67]
>
1st mode ofdouble bottom
1st mode ofshaft
2nd mode ofdouble bottom
Double Bottom
Double Bottom Shaft and Shaft ~
9.20 HZ 9.15 Hz
12.83 I~Z 12.11 Hz
14.06 Hz 13.99 Hz
36
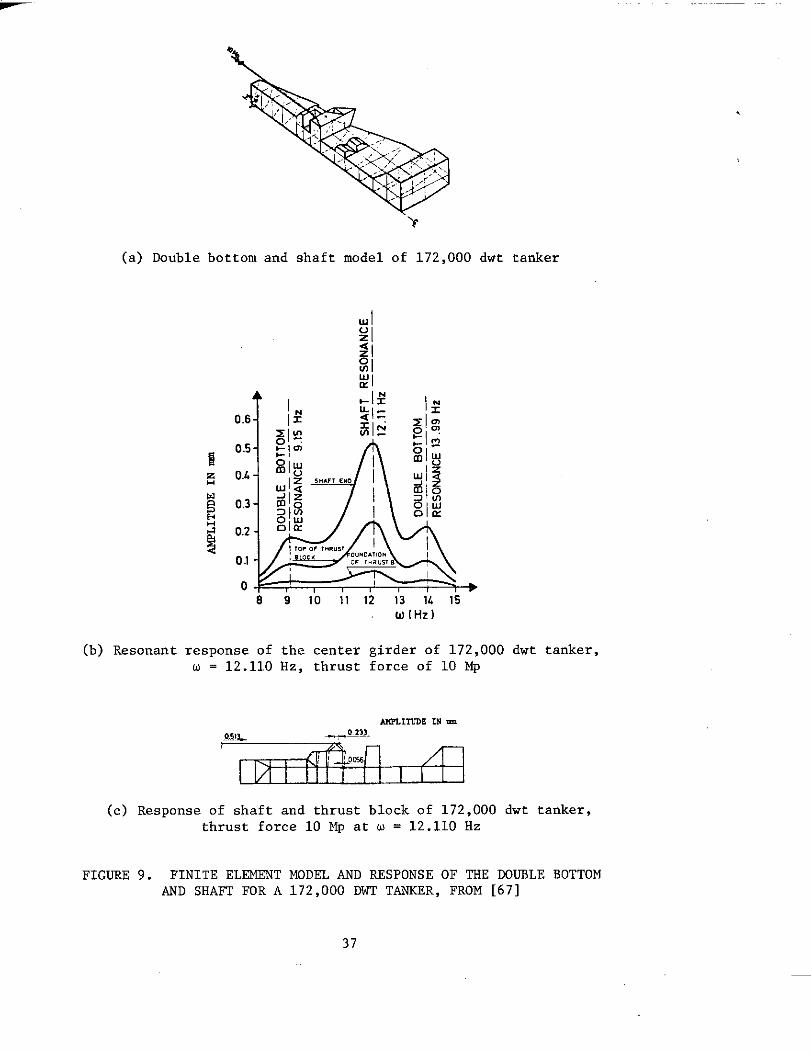
(a) Double
‘7
bottom and shaft model of 172,000 dwt
Iul%12181WI
A
0.6- /2 :1=
~ls?o.5- -rn+1
E0.4- 81:
5
Hz 0.2-
%0.1-
b8 9 10 !1 12 13 IL Is
w(Hz I
(b) Resonant response of the center girder of 172,000
w = 12.110 Hz, thrust force of 10 Mp
tanker
dwt tanker,
(c) Response of shaft and thrust block of 172,000 dwt tanker,thrust force 10 Mp at w = 12.110 Hz
FIGURE 9. FINITE ELEMENT MODEL AND RESPONSE OF TRE DOUBLE BOTTOMAND SHAFT FOR A 172,000 DWT TANKER, FROM [67]
37
.

_. .,. .—.-T.— .—.—
decreased to 12.11 Hertz, and Figure 10 shows that this coupling decreasesthe effective stiffness of the thrust block foundation by approximately 13percent. These results indicate that a separated shaft model can only beused in a vibration analysis where the natural frequencies are not closeto double bottom resonances.
Table 10 shows the information pertinent to the conduct of this analy-sis. The only input data in addition to that required for the forced re-sponse of Section 14 are estimates of the machinery space mass distributionand the ship’s scantling plans.
16. Determine Forced Lateral Response of Shafting (Rigid Hull)
The shaft responds laterally to the harmonic force and moment excita-tions about axes normal to the rotational axis. If the lateral naturalfrequencies of the propeller and shaft system coincide with the blade fre-quency excitation, the input to the hull through the bearings can be stronglyamplified. Calculations of ship response generally show peaks associatedwith lateral frequencies of the shafting. It is, therefore, desirable todesign the shafting system so that these resonances will not occur at thenormal operating speeds. As with the longitudinal vibrations, these studiesare successively made on models of increasing complexity. The first studiesare applied to the shaft simply supported at the bearings (either at theforward and after edges or one-third of the distance from the rear of thestern bearing) . Since it is known that the bearings are relatively flexi-ble, this model will generally give a frequency that is high so that if thelowest lateral frequency is less than, say, 30 percent above the full powerblade frequency, it will probably be.wise to consider relocating the bear-ings or modifying the shafting to raise the frequency. Bureau Veritas inits Guidance Note [68] published in 1971 recommends, for example, that thenatural frequency be above 130 percent of the excitation frequency.
It is also important to ensure that all vertical bearing reactionsbe positive, i.e. , maintain contact with its support, over the range ofexcitation. A negative reaction will result in hammering of the bearings.This hammering is certainly undesirable from the standpoint of maintenanceand noise levels. However, it also changes the system’s natural frequencyand could move it closer to the propeller-excitation frequencies. Largelateral vibratory motions of the shaft would result, and these vibrationswould probably be transmitted to other portions of the ship. References69 and 70 present results of investigations conducted at Bureau Veritas onlateral shafting vibrations and the associated wearing on the bearingscaused by misalignment of the propeller shaft.
To determine the forced vibration response, the analyst can use anyof the commercially available computer programs such as ANSYS, ASRA, NAS-TRAN, SESAM, STARDYNE, and STRUDL. There is no optimum choice among theseprograms because all are highly developed and give essentially the sametype of results. The choice depends on the availability of the programand the familiarity of the user with it. A discussion of the theoreticalaspects of the finite-element method as it pertains to transverse vibra-tions of a ship’s propulsion system is given in Reference 71.
38

FIGURE 10. DEPENDENCE OF
THRUST BLOCK STIFFNESS ,
kTB[ 106 Mp/m )
THE FIRST SHAFT NATURAL FREQUENCY ONKTB, 172,000 DWT TANKER, FROM [67]
TABLE 10. SUMMARY OF DESIGN BLOCK 15--DETERJfINE FORCEDRESPONSE OF MACHINERY SPACE
Purpose: To Compute the Resonant Frequencies and ResponseAmplitudes of the Longitudinal Shafting Includingthe Mass and Stiffness of the Machinery Space
Input: Structural PlansMachinery Space Mass DistributionThrust Bearing StiffnessReduction Gear lfass and StiffnessLength and Diameter of ShaftingMass and Added Mass of PropellerEstimates of DampingLongitudinal Excitation Levels
output : Longitudinal Shafting Resonant FrequenciesAmplitude of Motion at Thrust Bearing
References: 60 - 67
39

Two other methods of determining the transverse response should bementioned at this point. These are the transfer-matrix and finite-differ-ence methods. Reference 72 discusses the transfer-matrix approach and
aPPlieS a particular computer program to the analysis of several ships.The finite-difference method is also used in a fully operational computercode available from the David W. Taylor Naval Ship Research and Develop-ment Center. This program, called GBRP [73], can also treat longitudinaland torsional vibrations of the shafting as well as the coupled lateraland torsional vibration of a beam. This makes it particularly well suitedto study the bending response of a ship which can be idealized as a beam.This application of the GBRP program will be discussed later in the report.
Since the analysis described in the next section is an extension ofthe one assuming a rigid hull, it is wise to choose a computer programwhich can be used for both. This will allow the analyst to use the al-ready existing model of the shafting and only add the flexibility and massof the surrounding hull structure. With the ability of general purposecomputer programs to model longitudinal, lateral, and torsional vibrationof beams with the same finite elements, it may be possible for the analystto use the model alreadv develoued for the longitudinal vibration of theshaft. Table 11 shows the info~mation necessa~y to carry out this analy-sis of the shafting with rigid lateral supports.
TABLE 11. SUMMARY OF DESICN BLOCK 16--DETERMINE FORCED LATERALRESPONSE OF SHAFTING (RIGID HULL)
Purpose: To Compute the Resonant Frequencies and ForcedResponse of the Lateral Shafting Along with ShaftBearing Reactions
Input: Length and Diameter of ShaftingMass and Added Mass of PropellerLocation of BearingsOil Film StiffnessEstimates of DampingVertical and Horizontal ExcitationLevels for Propeller Forces and Moments
output : Resonant FrequenciesResponse Amplitudes of Shafting Versus Excitation
Frequent yStatic and Dynamic Bearing Reactions
References: 68- 73
.
40

17. Determine Forced Lateral Response of Shafting (Flexible Hull)
The analysis conducted in Design Block 16 will ensure the responseof the shafting to lateral excitation will be acceptable if the bearingsare assumed rigid. This is the simplest type of analysis, and the nextlevel of sophistication assumes some flexibility in the bearing supports.The information produced by this investigation is again the resonant fre-quencies and forced response of the lateral shaft along with the bearingreactions. The dynamic bearing reactions should again be positive to avoidslamming and gradual loss of contact.
If gyroscopic effects are neglected (they are important for whirl-ing, but relatively unimportant at blade frequencies) , and the supportsare of equal stiffness in all directions, the natural frequencies andresponse of the shaft will be the same in all directions . If the struc-ture is not symmetrical, the fundamental normal modes may be in any pairof orthogonal planes. The moment restraint at the bearings can also havea significant influence on the shaft frequency.
The amount of structure to include in the stiffness calculation isa matter for the analyst’s judgment. The object is to evaluate the stiff-ness to a region of a large hull mass. For a single-screw ship, this mayinvolve the structure from the after peak bulkhead and up to the steeringgear flat. For shafts supported by struts, it will include the struts andtheir backup structure. If the complete hull is analyzed using a finite-element analysis, the validity of the modeling can be tested.
Since the structure supporting the shaft bearings is complicated,the use of finite-element methods is the most feasible way of determiningthe support stiffness. Figure 8(b) is a finite-element model of the after-body of a ship with the aft bearing structure shaded. When this model isgenerated, consideration should be given to the fact that it will also beused as a substructure in the complete ship analysis. The basic philosophyis to have adequate representations of each subsystem available so they canbe assembled as efficiently as possible. The stiffness between the shaftand bearing of a stave bearing can be quite low if the staves are rubber.The stiffness of an oil film bearing is such that a bearing force intro-duces a motion having a component perpendicular to the load.
If, as a result of the calculations of shaft response, it is foundthat there are no shaft resonances within about 30 percent of the operat-ing speeds of the ship, the shafting can be considered satisfactory forthis level of refinement. Later analyses of the whole ship will confirmits suitability. If, on the other hand, lateral resonances appear closeto the operating speed, then by changing one or more of the following, anew propulsion system can be developed which has resonances properly lo-cated:
1. The overhang of the propeller beyond the stern bearing.
2. The span between the last two bearings supporting thepropeller shaft.
41
.—
3. The diameter of the propeller shaft.
4. The support of the propeller shaft bearing:
a. The skeg and stern tube structure for a single-screwship having a skeg supported bearing.
b. Thethe
c. The
angles, size, attachment to the bearing barrel ofarms carrying a strut bearing for open-screw ships.
structure supporting strut arms.
d. Other changes as indicated by the calculations.
Such changes are frequently required, and good judgment, often using anal-
yses of simple models, is required to discover the optimum solution rapidlyand inexpensively.
The references listed in the last section are all applicable to theshafting analysis considering flexible lateral supports. In addition,Reference 74 addressea specifically the problem of shaft vibrations inelastically supported tail shafts .
Table 12 s-rizes the information required to conduct this analysis.With the exception of the scantling plans necessary to model the mass andstiffness of the hull structure surrounding the shaft, no input data inaddition to that used in Table 11 are required. Appendix D contains sev-eral computer programs specifically written for the analysis of lateralvibration of the shafting. However, any of the commercially availablefinite-element computer codes could also be used.
18. Conduct Superstructure Modal Analysis
In addition to substructures of the shafting and machinery spaces,it is desirable to make a study of the superstructure as a subsystem sinceresonances in this region are a frequent cause of vibration troubles. Fi-
nite-element methods are generally most suitable for modeling this struc-ture. With the high superstructures common on container ships and verylong ships, some superstructures vibrate fore and aft as a cantilever beam.On others the decks vibrate symmetrically within the sides, while on stillothers the decks vibrate anti-symmetrically (port up, starboard down) sothat the finite-element model should not be too coarse to suitably repre-sent the complexity of possible modes.
Figure 11 taken from Reference 75 shows three levels of sophistica-tion for the superstructure models. Generally, the beam and two-dimensionalmodels do not represent adequately the structure, and a three-dimensionalmodel is required. One of the most important considerations in the super-structure analysis is how it is connected to the rest of the ship. This
is shown schematically by the springs in Figure 11. As a first approxima-tion, the analyst could assume fixed and simply-supported conditions anddetermine their effect on the natural frequencies and mode shapes. A bet-ter approach is to include in the model a portion of the ship extending
42

~---” ‘“
TABLE 12. SUMMARY OF DESIGN BLOCK 17--DETERMINE FORCED LATERALRi3spoNsE OF SHAFTING (FLEXIBLE HULL)
Purpose: To Compute the Resonant Frequencies and ForcedResponse of the Lateral Shafting Along with ShaftBearing Reactions when Flexibility of the Surround-ing Hull Structure is Considered
Input: Length and Diameter of ShaftingMass and Added Mass of PropellerLocation of BearingsOil Film StiffnessEstimates of DampingHull Scantling PlansVertical and Horizontal Excitation Levels for
Propeller Forces and Moments
output : Resonant FrequenciesResponse Amplitudes of Shafting Versus Excitation
FrequentyStatic and Dynamic Bearing Reactions
References: 68- 74
1. SUPERSTRUCTURE MODELS ,
AM1.1BEAM 1.22-DIM. 1.33-DIM.
FIGURE 11. THREE LEVRLS OF SUPERSTRUCTUREMATHEMATICAL MODELS, FROM [75]
43

r.——
below the main deck. This is illustrated in Table 13 [76] which showscalculated and measured fundamental natural frequencies of the superstruc-ture as a function of the type of finite-element model. In this case, themodel containing the engine-room below the superstructure has an eight per-cent error with the measured value. The error, of course, decreases asmore of the ship is included. Whichever type of model the analyst chooses,he should realize that the representation will be used as a substructurefor the complete ship analysis .
On ships whose superstructures vibrate badly, it has been found thatthe natural frequencies generally are in resonance with the propeller ex-citation frequencies. For this reason, it is recommended that these fre-quencies should not be within about 25 percent of each other. If this con-dition is not met, then modifications must be made to the superstructureor its surrounding foundation, Figure 12 shows the mode shape at”10.5 Hertzand indicates that the superstructure vibrates essentially as a rigid bodyon a flexible foundation. If the blade rate frequency of the propeller is10 Hertz, then the superstructure should probably be stiffened at the pointsshown to raise its fundamental frequency to about 12.5 Hertz. The adeauacvof these modifications can be confirmed when the analvsis of the cormleteship is conducted.
Table 14 shows theture analysis.
TASLE13.
.–.
information necessary to conduct the superstrue-
COR2EIATIONBETJEENMEASUSEDANDCALCULATEDSUFESSTKUCTUREFONDAMENTALRESONANTFREQNENCTFORDIFFERENTFINITE-ELEMENTMODELS. 3.38,000OWT
TANKER,SALLASTCONDITION,FROM[76]*
Finite Element Model!
Elements
A ..x&---- 464
*
.-
B -- 1190
&
./
c 1500
D -2
2150
delSize Numberof
E
Nodes. S. ernodes
3.30 52
400 68
51D 134
810 185
A - Superstructureclampedat maindeckB - Engine-roombelowsuperstructureincluded(=ss free)C - Comvletemodelof afterbody
~
61
165
315
4453Freuenc Error
Hz z
11.5 39
9.0 8
8.8 6
8.2 I -1
D - ‘Tot;lshipincluded(onlystarboardsideis consideredin allmodels)
*S“perstr”cturefwdamentalfrequencymeasuredvalueS.3 Hz
44

SHAFT RPM = 100
NO. BLADES = 6LOWEST FREQUENCY
f =BLADE RATE
10.5 Hz
FREQUENCY = 10 Hz
FIGuF03 12. FIRST -MODE SHAPE OF THREE-DIMENSIONALSUPERSTRUCTURE MODEL , FROM [75]
TABLE 14. SUMMARY OF DESIGN BLOCK 18--CONDUCTSUPERSTRUCTURE MODAL ANALYSIS
Purpose: To Determine How Close Natural Frequencies of FreeVibration of the Superstructure Are to the Harmonicof Blade Rate Frequencies
Input: Scantling PlansEstimates of Structural and Equipment lfass
output : Superstructure Natural FrequenciesSuperstructure Mode Shapes
References: I 75- 77 I
19. Determine Natural Frequencies and Forced Response of Rudder
Figure 1 indicates that excitations from the propeller can enter theship through the rudder as well as through the propulsion shafting and hull.Although experience has shown that these rudder excitations are not gener-ally as severe as the latter two, care must still be taken in the designstage to avoid them. This can best be done by designing a rudder whosenatural frequencies are not close to the propeller’s blade rate frequencyor its harmonics and which will be subjected to accepted levels of pro-peller-generated pressures. Procedures for calculating the natural fre-quencies of the rudder are further developed than those for calculatingthe excitations.
A ship’s rudder is essentially a flat plate immersed in a fluid. Inorder to compute its natural frequencies, the stiffness and mass of thesystem must be known. The system’s stiffness is simply the stiffness ofthe rudder with no surrounding fluid. The mass. however. is Conmosed oftwo quantities: the structur~l mass of the rudder andmass of the surrounding fluid. This added-mass effectfrequencies of the structure from their in-air values.
the so-called addedreduces the natural
.
45

There have been many investigations toof different geometric shapes. For example,
calculate the added massesthe added mass of a thin rec-
tangular plate was computed in Reference 78 using potential theory, andexperimental tests on the vibration characteristics of cantilever platesin water were conducted in Reference 79. With the development of the fi-nite-element technique, numerical methods are now available for computingon a routine basis the free vibration natural frequencies and mode shapesof an arbitrarily submerged structure. The results of one such recentinvestigation on partially and fully submerged cantilever plates are re-ported in Reference 80. The numerical calculations were made using theNASTRAN computer code, with the plate being modeled by standard platefinite elements and the fluid by isoparametric three-dimensional solidelements. Excellent comparison between numerical and experimental resultswere obtained, and it appears this finite-element technique can be usedroutinely on free vibration analyses of ship appendages such as rudders.
The computation of the excitation forces on the rudder is not assimple as the calculation of the natural frequencies. A numerical pro-cedure and computer program using unsteady-lifting-surface theory hasbeen developed at Davidson Laboratory [81] and subsequently modified totake into account the effects of loading and thickness [82]. However, itdoes not appear that this procedure is used at the present time for designcalculations.
There have also been experimental investigations of the interactionbetween the rudder and propeller operating in a given wake field. Themajor contributions in this field were made by Professor Frank M. Lewisat MIT. References 52 and 53 indicate that the propeller-generated forcesare extremely sensitive to the axial clearance between the rudder and pro-peller, and by proper placement of the rudder, low values of horizontalforce can be obtained. However, the rudder in the experimental tests isessentially rigid, while the full-scale rudder is an elastic body. This
elasticity can play an important role in determining the response, andthe correct scaling parameters should be included in the model tests.
Currently, little attention is paid to propeller-rudder interactioneffects, and clearances are usually chosen on the basis of those recom-mended in various classification rules. Additional research is requiredin this area to fully understand this area of propeller-induced vibrations.
20. Evaluate Local Plating Design
Up to this point, the purpose of the proposed design procedure hasbeen to be able to compute the excitation and response of the major com-ponents of the ship. The overall objective will be realized in DesignBlock 22, when the response of the entire ship will be calculated. Even
though the overall vibration characteristics of the ship’s hull girderand substructure may be acceptable, the possibility still exists thatlocal vibration problems may arise. Reference 7 defines local vibrationas the dynamic response of a structural element, deck, bulkhead, machinery,or eauiument elements which is significantly greater than that of the hullgird~r it that location. However; hull girde~ vibration doeswhen the nodal length is of the order of the beam of a ship.
46
not mean muchThe concept
.

of local vibration in thistions are defined in termshull girder.
report is more restrictive in that local vibra-of major structural elements rather than the
Since local vibration is simply an extension of the global vibrationproblem, the finite-element techniques proposed in the earlier designblocks would apply. This is not recommended for the entire ship, however,because the analysis would become too complicated and expensive. A sim-pler approach is taken in which the local plating natural frequencies areremoved from the excitation frequency or its harmonics . The response of
the plating is not computed. This approach allows the use of analyticalexpressions for plate vibrations such as found in Reference 83. Reference68, published by Bureau Veritas, contains formulas for the fundamentalnatural frequencies of plate panels stiffened in one or two orthogonaldirections with various boundary conditions. The effects of the fluidadded mass on the vibration of plating adjacent to a fluid boundary arealso considered in Reference 68. These formulas are generally not easyto apply because there are difficulties in defining the extent of thestructure taking part in the vibration, the geometric boundary conditions,and the structural mass. In critical areas of the ship where the struc-ture is complicated, these frequencies can be computed using the finite-element method. Also, added-mass effects of external or internal liquidcan be included by the techniques explained in Reference 80.
Generally speaking, it would be too complicated to compute the nat-ural frequencies of all local plating in the ship. By using an experienced
senior draftsman or designer, most of the structural details of the localplating can be finalized in accordance with standard practice and exper-ience. Only when a new structural arrangement or an unusually large un-SuDDorted area is uroDosed. is a more detailed analvsis warranted. Iflo~~l plating vibr~ti~ns d: occur, corrective measu~es are relatively easyto implement before the ship’s finish work is completed. These local vi-
brations can be found during the shaker tests which will be discussed inDesign Block 23.
TABLE 15. SUMNARY OF DESIGN BLOCK 20--DESIGN LOCAL PLATING
Purpose: To Determine How Close Natural Frequencies of FreeVibration of the Local Plating Are to the Harmonicsof the Propeller-Blade Rate Frequency
Input: Scantling PlansEquipment Mass EstimatesAdded Mass Estimates of Adjacent Fluid
output : Local Plating Natural Frequencies
References: 68, 80, 83
I I
47

21. Assemble Model of Entire Ship
Nhen the subsystems discussed in Blocks 14-20 have been designed sothat it is expected that they will be free of vibration resonances, it istime to make a vibration analysis of the complete ship. This analysis ofthe full ship fulfills two important functions:
1. It checks and confirms the validity of the boundariesassumed for the substructures.
2. By modeling the ship as a whole, it is possible, with theproper damping, to predict the vibration levels in allparts of the ship as a function of frequency. Comparingthese predictions with established acceptable levelsallows an assessment of acceptability of the ship zt apoint in construction where corrections and changes toovercome serious difficulties can be determined and in-corporated in the design.
Until approximately ten years ago, the standard technique for the
complete ship analysis was to model the ship aa a beam structure using aTimoshenlco beam as a base. This approach is still satisfactory for cer-tain type ships which are compartmentalized and respond as beam-like struc-tures. Submarines and destroyers fall into this class. However, fOr ships
with wide beams and open deck structures, the models do not give satisfac-tory results because the hull-girder modes and frequencies are affected byvibrations within these areas. Large containerized and bulk carriers areexamples of such ships, and for these cases the finite-element methodshould be used to define the structure accurately. Even in the caseswhere beam models can be used, the results are generally not accuratefor above the fifth or sixth natural frequency because of shear lag andlocal vibration effects.
Reference 84 presents a review of the theory for bending, longitudi-nal, and torsional vibrations of a beam and applies them directly to theship vibration problem. A more recent review of all analytical and numeri-cal methods used to calculate hull vibration is presented in Reference 85.
As an example of a ship modeled in terms of a beam, consider Figure13, an uncoupled vertical vibration model, and Figure 14, a coupled lateraltorsional vibration model. The sprung masses shown in these figures rep-resent the various subsystems in the ship. For the analysis of structuresas complex as shown in Figures 13 and 14, the computer program GBRF (Gen-eral Bending Response Program) developed at the Naval Ship Research andDevelopment Center [73] can be used. In the analysis of the ship hull, itcan treat vertical as well as coupled lateral-torsional vibration. These
capabilities and other features of the program are described in AppendixE–1 .
To define the elastic properties of the structure, it is necessaryto define the cross-sectional elastic properties. A program and procedurefor computing
48

A,,. ,s”$l .,! !/, ,,!7,,, w,,, ,.,L
51(, ,
now AIllilll 11111111 1111111 [lllkllllllllll llllldllll~llll,,, ,. . ,,,
J,”I 20’ ‘J7
FTGuRS 13. DNITIZED AND CONTAINERIZED SHIP, VERTICAL VIBRATION MODEL
!A.,, , /,!,. ),,,.,”,,,,s,
1,.’.,! ,,!m,, ,,:.
m,:”, ,0”
11111111141 rllllll lllllli lll17dllllllllll,,, ,,, ,; ,() ,, II53 ,,,
,“L...—LW: 1$,sl,!:!,! !!)/:21
L s,,,.. ,, s.,..
FIGURE 14. UNITIZED AND CONTAINERIZED SHIP ,
49
TRANSVERSE VIBRATION MODEL

IY
Iz
Iyz
A
KXZA
KXYA
Jx
F
7
y’,z’
(Moment of inertia about transverse axis)
(Moment of inertia about vertical axis)
(Product of inertia relative to horizontal andvertical axes)
(Cross-sectional area)
(Shear area constant vertical plane)
(Shear area constant transverse plane)
(Torsional area constant about longitudinal axis)
(Vertical coordinate of the neutral axis)
(Transverse coordinate of neutral axis)
(Coordinates of the shear center of the section)
are given in Reference 86. This program calculates the equivalent beamparameters for the ship section properties using data tabulations obtainedfrom hull plans by a preestablished orderly procedure.
U. S. Steel Engineers and Consultants, Inc. , developed a programthat represents a ship as a beam on an elastic foundation. Informationon this program is given in Appendix E-2. Other vibration programs basedupon modeling the hull as beams have been developed by Lloyd’s Registryof Shipping and by the Institut fur Schiffstechnik in Berlin, Federal Re-public of Germany. These programs are described briefly in Appendix E-3.
The advantage of representing a ship by a beam model is that thecomputer analysis is more direct and more easily interpreted and is con-siderably less expensive than that with a finite-element analysis for astructure that ia as well defined. As mentioned earlier, the disadvan-tages are that for many ship vibration problems, particularly where thedecks are open so that the vibration across the width of the ship is im-portant, the beam representation of the ship is inadequate and a finite-element process is required for satisfactory modeling.
The use of finite-element methods for predicting ship vibrations isbecoming widespread. References 63, 75, 77, 87, and 88 discuss the methodand give specific examples of its application to ship structures. Finite -element applications in vibrations and structural dynamics problems ofships and other marine structures are discussed in Reference 89, and anextensive bibliography is presented.
Figures 15 and 16 show elevation and isometric views of a finite-element model for a cargo ship. The forward portion of the vessel isrepresented as a beam with offset masses. This is an acceptable practicein this case because detailed knowledge of the vibration response in theforward area is not required. Excessive vibrations in the habitable and
50

1 ,\
I I I II
I I I WJ--m—rrm- : ..’..”>’\
FIGURE 15. ELEVATION VIEW OF FINITE-ELEMENT MODEL
‘h-r
.
FIGURE 16. ISONETRIC VIEW OF FINITE-ELEMENT MODEL
51

and machinery areas are of greater concern, and Figures 15 and 16 showthose portions of the ship are modeled in great detail.
Some organizations have developed finite-element programs specifi-
cally for ship applications. Among these should be mentioned SESAN-69(Appendix E-3) developed by Det norske Veritas, the Norwegian classifica-tion society [90], and DASH (Appendix E-3) developed by the NetherlandsShip Research Center. Bureau Veritas, the French classification society,also has made many -finite element analyses of ship structures. The Elec-tric Boat Division of General Dynamics Corporation developed and maintainsa finite-element computer program GENSAN for use on submarine vibrationproblems. Information on this is presented in Appendix E-3.
Since the cost of developing, maintaining, and updating a large fi-nite-element computer program is high, it is common to apply general pur-pose computer programs to ship vibration problems. In particular, NASTRANis used by Lloyd’s, the American Bureau of Shipping, Littleton Researchand Engineering Corp. , and probably by other organizations. This programwas developed for the analysis of large structures and readily applies toships. It is being updated continually to improve the representation ofstructural elements and the processing efficiency. Because it was devel-oped for large projects, NASTRAN carries high overhead structure. Mostship finite-element studies involve models that are large enough to bene-fit from the generality provided by the overhead, but for many small studiesthat will not later be incorporated in the large model, it may be desirableto use other finite element programs such as STARDYNE, ANSYS, lL4RC, STRDDL,or SAP. Again, the choice should be dictated by the program’s availabilityand experience of the user.
This section has discussed the various ways of modeling the entireship and has presented computer programs which are used for this purpose.A summary of this design block is given in Table 16. This model will beused in the next design step to predict the vibration levels throughoutthe ship.
22. Determine Vibration Amplitudes and Stress Levels of Complete Ship
At this point in the design process, all the ingredients necessaryto compute the forced vibration response of the entire ship are available.The hydrodynamic excitations are available through the methods discussedin Design Blocks 6-13, and a mathematical model of the entire ship struc-ture can be assembled in Design Block 21. This step in the design processsimply applies the excitations to the model and determines the vibrationresponse. Table 17 provides a summary of this design block and indicatesthe only information not yet discussed is the estimate of added mass anddamping.
The concept of added mass as it applies to the rudder was discussed in
Design Block 19. For the complete ship, it is generally assumed the addedmass underway is the same as for the ship at rest. At the present tine,there is little known about the differences.
Damping is, of course, very important in response calculations becausewithout damping, the resonant amplitudes of vibration have infinite values.
52

TABLE 16. SUMMARY OF DESIGN BLOCK 21--ASS~BLE MODEL OF ENTIRE SHIP
Purpose: To Construct a Mathematical Model of the Entire ShipWhich Can Be Used to Predict the Response toPropeller-Induced Excitations
Input: Substructure Models of Superstructure, MachinerySpace, Stern Structure, and Propulsion Shafting
Scantling Plans
Mass Distribution
output : A Mathematical Model of the Entire Ship
References: 63, 75, 77, 84-90
TABLE 17. SUMMARY OF DESIGN BLOCK 22--DETEMINEVIBRATION AND STRESS LEVELS OF ENTIRE SHIP
Purpose: To Compute the Forced Vibration Amplitudes andStress Levels of the Complete Ship Under Propeller-Induced Excitations
Input: Mathematical Model of Entire Ship
Computed or Measured Propeller Forces and Moments
Computed or Measured Hull Forces or Pressures
Computed or Measured Rudder Forces
Locations on Ship Where Vibration Responses AreDesired
Estimates of Damping
Estimatea of Ship’s Added Mass
output : Plots of Vibration Amplitude Versus Propeller RPMat Selected Locations
Plots of Maximum Stress Versus Propeller FW’MatSelected Locations
Resonant Frequencies at Selected Locations
References: 63, 75, 77, 84-93
53

-
Investigations have shown that damping in ships is dependent on the vibra-tion node, the manner of construction and type of construction material, andthe type of cargo. It can be divided in the three forms
Structural, or hysteretic, dampingCoulomJ, or dry friction, dampingViscous, or fluid, damping,
and all three types are present in ship structures. Damping is usuallycalculated on the basis of logarithmic decrement measurements obtainedeither in vibration generator or anchor drop tests. Kumai [91] addressedthe question of how damping is affected by the higher modes of vibration,and in Reference 92 values of the hysteretic damping coefficients, g, are
given for several United States, Japanese, and English ships in the verti-cal modes of vibration. A value of g = 0.029 was recommended to be.usedin the General Bending Response Program, at least until further data couldbe obtained. However, each organization conducting analyses of this typehas its own recommended values of damping.
Specific results obtained from a particular forced vibration analy-sis will be illustrated in detail in Chapter V when the application ofthe recommended procedure is presented. At this point it is only necessaryto illustrate generally what type of results can be expected. Figure 17shows a two-dimensional finite element model taken from Reference 75 fora 370,000 dwt tanker. The forward portion of the ship is not representedby a beam in this model. Let us assume that the forced response in thehorizontal direction at the top of the superstructure is desired for avertical force acting at the ship’s stern. The assumed viscous dampingcoefficient was taken to be 3.5 percent of critical damping. Figure 18shows, however, that the coefficient is an important factor only in thevicinity of the resonant peaks . The analysis presented in Reference 75shows that the top of the superstructure has two resonant peaks at about6.7 and 11.0 Hertz, as illustrated in Figure 19. The higher peak is dueto the natural frequency of the superstructure. Figure 20 reveals thelower peak is essentially a rigid-body motion of the superstructure in-duced by a hull bending mode. At 6.67 Hertz a nodal point is located atthe aft position of the superstructure which will give extreme rigid-bodymotion. This is the blade-rate frequency for a five-bladed propeller at80 ~ service speed. If a six-blade propeller is used, this frequencyincreases to 8.00 Hertz, and Figure 20 indicates that the horizontal re-sponse at the top of the superstructure is reduced greatly. However, ifthe service speed for the six-bladed propeller increases to 103 RPM, thenblade frequency will equal the natural frequency of the superstructure.Reference 75 indicates the calculated vibration levels would be “very un-pleasant” in this case.
23. Conduct Shaker Tests
Up to this point in the design process, all estimates of vibrationlevels have been based upon analytical response predictions. Since it isimperative the ship’s actual response not exceed that established in thespecifications, experimental tests should be conducted to excite the shipand measure the response before all finish work is completed. These tests
hopefully will indicate any areas of structural deficiency, and correctiveaction can be taken before the ship’s sea trials are begun. It should be

I \ \ I I I ) I 1 I I 1 I I I , [
Lx~
FIGuRE 17. FINITE -ELRMENT MESH FOR TWO-DIMENSIONAL MODEL OF 370,000 DWT
TANKER, FROM [75].
FIGURE 19. CALCULATED FORCED RESPONSE AT THE TOPOF SUPERSTRUCTURE IN LONGITUDINAL DIRECTION.
370,000 DWT TANKER, BALLAST CONDITION, FROM [75].
FIGURE 18. FORCED RESPONSE DEPENDING ON THAPPLIED GLOBAL DAMPING VALUE . 370,000 DWI
TANKER , BALLAST CONDITION, FROM [75].
8,0
FIGURE 20. POSITION, OF NODAL POINTS IN THE MDECK FOR FORCED VIBRATIONS CALCULATIONS OF T
HULL GIRDER . 370,000 DWT TANKER, BALLASTCONDITION, FROM [75].
.,

realized that vibration problems in the hull girder, engine room, or super-structure may be very difficult and expensive to correct at this point.The primary purpose of the shaker tests is to ensure the local plating andother local structures are properly designed. The shaker test can also beused to assess the accuracy of the structural modeling techniques and pro-vide estimates of the ship’s structural damping. These will be discussedin Design Block 24.
The tests should be conducted with the ship sitting in the water andthe shaker mounted on a rigid foundation at the ship’s stern. Surroundingdisturbances should also be minimized so that the resulting vibrationamplitudes can be related directly to the excitation forces . This mayrequire conducting the tests at night when work on the ship is at a mini-mum and the water is calm. From experience in measuring vibrations gener-ated in the bottom of a machinery space, it is believed that the sternshaker need not be large if the above conditions are met. The rigid foun-dation is necessary to excite global hull vibrations and not local vibra-tions in the vicinity of the shaker. The shaker should also be positionedas closely as possible over the propeller to more realistically simulatethe propeller excitations. Figure 21, taken from Raference 94, shows theposition of the exciter and some correlation of the experimental resultswith the finite-element model calculations. However, excitations shouldalso be applied in the horizontal direction at the stern to assess thelateral-torsional behavior of the ship. Reference 94 describes the testprocedures and results of shaker tests performed on a cargo-liner.
~-j ,_; :-6,,4 “;--,16. ,04.,..
calculated free vibration 15th mode famof fully loaded ship.
I
~ SF, draft - 10.50 m.
r
[,
/ 14easu.md free vibration mode form.
Ag~_:”6.40””
>=::J~:ij.l”l.rti!..L...!.,k! ,E.quivdm.t beam,offorwardpart.,.
!,, ,, i --
FIGURE 21. ELASTO DYNAMIC MODEL OF AFT PART AND CORRELATION OFEXCITER TESTS WITH FREE VIBSATION CALCULATIONS, FROM [94]
24. Assess Local Vibrations, Structural Damping, and Modeling Techniques
The shaker tests discussed in Design Block 23 provide a means of col-lecting some very valuable information about the vibration characteristicsof the ship. By applying excitations at the stern and measuring the ampli-tudes and phase angles of the response, these tests will show if localresonances exist in the structure at the blade-rate frequencies or their
56

harmonics. The measurements should be taken at the points defined in theship’s specifications, as well as other places where local plating vibra-tion could be present. If deficiencies do exist and can be corrected bylocal stiffening of the structure, these modifications are much easierand less expensive to make now rather than waiting until all finish workis completed.
The shaker tests also provide information on the amount of dampingpresent in the structure. These estimates are usually obtained by comput-ing the width of the resonant peaks. Reference 92 discusses this methodalong with the technique of impulsively exciting a ship and observing thedecay of the free vibration modes . Anchor drops or underwater explosionsare two methods of applying these impulsive loads. Although detailed know-ledge of the damping will probably not help the design of the present ship,it will be valuable in future designs. These tests will help assess theinfluence that such variables as choice of materials, method of construc-tion (e.g., welded or riveted) , and type of framing have on the ship’sdamping characteristics. However, the tests will not provide any infor-mation on the damping due to the cargo because they are conducted in anunloaded condition.
The third way in which the shaker tests can aid the design processis to help estimate the accuracy of the structural modeling techniques.These tests will provide the measured response at various locationsthroughout the ship as a function of a known excitation at the stern.By applying excitations to the.mathematical model of the complete shipdeveloped in Design Block 21, the response can be calculated and comparedwith the measured values . This should provide a reliable means of judg-ing the accuracy of the structural model since the input forces are accu-rately defined. The model can also use the damping computed earlier fromthe shaker tests.
Table 18 summarizes the information in this design step.
25. Msasure Vibrations During Sea Trials
After the construction of the ship has been completed, the next stepis to conduct the sea trials. The purpose of these trials is to determine
how well the ship meets its performance specifications and identify any de-ficiencies in the design. This includes taking vibrations measurements atspecified locations throughout the ship under known conditions so that theselevels can be compared with the specifications defined in Design Block 1.
This report is not intended to serve as a guide for these vibrationtests. References 95 and 96 are specifically written for this purpose.Reference 95 discusses vibration survey techniques, and an acquisition andprocessing ‘system for ship vibration which can simultaneously measure about60 different locations is described in Reference 96. Vibrations measure-ments to correlate with analyses should be much more detailed than thoserequired by most codes such as given in References 6 and 7. As a word of
caution, the vibration tests must follow a detailed test plan that ensuresthat all required vibration levels be measured. As a minimum, the plan
should include:
57

TABLE 18.
rPurpose:
FInput :output :
SUMMARY OF DESIGN BLOCK 24--ASSESS LOCATION VIBRATIONS,STRUCTURAL DAMTING , AND MODELING TECHNIQUES
To Determine if Local Resonances Exist in the Shipat Blade Kate Frequencies or Their Harmonics; ToProvide a Means of Collecting Data on Hull Dampingfor Future Designs; To Estimate the Accuracy of theModel ing Techniques
Results of Shaker Tests
Structural Model of Entire Ship
Location of Local Resonances in Structure
Estimates of Structural Damping
Quantitative Assessment of Accuracy of the Ship’sStructural Model
91 - 94
(1) Test Conditions
(2) Instrumentation Required
(3) Measurement Techniques
(4) Measurement Positions
(5) Data Reduction and Interpretation
(6) Report Requirements
Since there is only a limited amount of time allotted to vibration measure-ments during the sea trials, any confusion as to the test procedures willresult in an incomplete set of vibration measurements .
26. Compare Neasured Vibrations with Specifications
The real test of how well the ship was designed to minimize propeller-induced vibrations comes in this design block. This block is not relatedto design per se, but is part of the overall recommended design procedure.Its purpose is to assess quantitatively the acceptability of the ship’sdesign with respect to propeller-induced vibrations.
I
All of the inputs necessary for making this comparison will be knownat this point. The vibration specifications were defined in Design Block1, and the corresponding vibration levels were measured during sea trialsin Design Block 25. If the measured values are below those specified,then the ship’s design is acceptable from the vibration point of view.If the measured values exceed the specifications, then the design is notacceptable and corrective action must be made. Responsibility for this
58

action will be contained in the vibration specifications if they are writ-ten correctly.
27. Compare Measured Vibrations with Calculations
Design Block 26 discussed how the acceptability of the ship wasjudged by comparing the measured vibrations with the specifications. Ifthe vibrations levels are acceptable, then it could be assumed the recom-mended design procedures were adequate and were applied successfully.This may not be the case. There are instances of ships which should havebeen vibration free and had severe vibration problems. There are alsoexamples where calculations predicted unacceptable vibration levels, butnone were present when the ship was built. These point out that ratherthan the recommended procedures producing an acceptable design, the de-signers were simply lucky that the ship had no vibration problems. If theprocedures are continued, then it is only a matter of time before a shipwhich vibrates badly will be produced . The last step in the design pro-cess is, therefore, to assess the process itself. The purpose of theassessment is to judge the accuracy and acceptability of the establisheddesign procedures and to identify areas in the design process in which im-provements can be made. This can best be done by comparing the measuredvibration levels taken during the sea trials with those computed for theentire ship assembly. A comparison of this type will provide the designteam a quantitative description of how successful it has been in producinga ship with minimum propeller-induced vibrations. Let us assume, forexample, the measured mode shapes of the hull girder compare favorablywith those predicted, but the vibration amplitud~s do not agree. Thiswould indicate that the hull modeling procedures are correct, but themethods of calculating the propeller-generated forces and pressures areinaccurate and that improvements are needed in that area. This evaluationand feedback process will be discussed in the next chapter.
The writers of this report would like to emphasize again a previouspoint: the comparison between meaaured and calculated vibration levelsshould be made even though the ship had acceptable levels . This is usu-ally difficult because of financial and time constraints, but is a neces-sary step in the design process if the recommended procedures are to im-prove continually. As a final comment, the results of this comparisonshould be disseminated to the maritime industry in some form. Again,this is difficult to accomplish, especially for ships which vibrate badly,because no organization wants to advertise it had part in such a design.
59

IV. DESIGN EVALUATION MILESTONES
In any design process, it is necessary to have checkpoints to deter-mine if the design up to that stage is acceptable and should proceed or ifmodifications must be made. For simple problems, this procedure is infor-mal and is continuously being done in the mind of the responsible engineer.However, in more complicated systems, such as a ship, where many individ-uals from different organizations and technical backgrounds are involved,the process needs to become more formalized. This is the purpose of theevaluation milestones shown in Figure 3. There are five such points dur-ing the ship’s design procedure presented in this report, and they aredesignated as follows:
MILESTONE I - Preliminary Hydrodynamic Evaluation
MILESTONE 11 - Final Hydrodynamic Evaluation
MILESTONE 111 - Ship Substructure Evaluation
MILESTONE IV - Complete Ship Structure Evaluation
MILESTONE V - Test and Evaluation Review
Although the evaluation milestones are shown approximately at the end ofeach design phase, they are continuously being conducted throughout theparticular phase. Only at the end of a phase would a formal report of
the results be issued.
Since the evaluation steps are associated with a particular designphase, they serve to divide the design process into smaller tasks accord-ing to technical disciplines and make identification of problem areaseasier. They also serve to establish milestone points for reporting theresults and charting the progress of the entire project.
The five evaluation milestones discussed in the following sectionsare first presented by showing the overall flow diagram for each of theindividual design phases. This diagram is then followed by a more de-tailed presentation of the various phases showing the evaluation and feed-back processes. It is hoped that by utilizing this evaluation procedure,deficiencies in the ship’s design which could cause excessive vibrationswould be identified and corrected before the ship is built.
1. MILESTONE I - Preliminary Hydrodynamic Evaluation
Figure 22 shows the three blocks composing the preliminary hydro-dynamic design. Block 2, in which the general ship design data are es-tablished, is not part of this phase, but is shown for completeness. Anexpanded description of the phase showing the feedback loops in the de-sign process is shown in Figure 23. The reader should remember that the
three primary objectives of this portion of the analysis are:
(a) Choose the number of propeller blades so that the blade-rate frequency is not near the longitudinal propulsionnatural frequency.
60

Block 4
ESTIMATE.
*LONGITUDINALPROPULSION
FREQUENCIES II
dlBlock 2 Block 3
r- - 7I ESTABLISH I
I GENERAL SHIPCONDUCTwAKE
DESIGN
I DESIGN DATA ~➤
SURVEYPROPELLER
L --P- A +,I I Block.5
I I ➤
I I ➤
FIGUHE 22. PRELIlfINARY HYDRODYNAMICC DESIGN PHASE
(b) Choose a stern configuration whose wake distribution doesnot introduce large propeller and hull forces.
(c) Design a propeller whose efficiency is as high as possible.
These three objectives are reflected in decision blocks shown in Figure 23.
A very important part of this phase is to choose a suitable sternconfiguration because it determines the nature of the flow into the pro-peller. Since the propeller forces are dependent on the nonhomogeneousflow into the propeller disc, their magnitudes and directions are directlyrelated to the wake distribution and hence the stern configuration. Oneway of graphically representing the wake is in terms of the Taylor wakenumber, W, defined as
vw= 1-;
m
where
Va = axial velocity of water to propeller disc
61

REEVALUATE
SPEED, POWER,
RPN, OR4
soNACHINERYARRANGENINTSREQUIRE~NTS
d YES
Black 4
ESTINATE RECONMSND
*LONGITUDINAL NUNBEROFPROPULSIONFREQUENCIES BLADES
Block 3
r :T: ,:1CONDUCT
ICENERALSHIP~FINALIZE
WAKE PROPELLERDESIGX DATA
L-=-J SURVEY DESIGN
Slock 2
MODIFY
LINES
FIGURE 23. MILESTONE I - PRELIMINARY HYDRODYNAMIC DESIGN EVALUATION

v= velocity of modelm
The wake number is usually plotted on a polar map showing lines ofconstant W as shown in Figure 24 [97] for a particular stern configura-tion. This figure was taken from the axial wake distributions obtainedin model tests for two aft body configurations. The zero degree angle islocated at the top of the propeller. Figure 24(a) indicates that the in-flow velocity is essentially not moving relative to the ship at the topposition, and there is a steep wake gradient. From experience, this vari-ation in wake would probably result in excessive excitations, and theseexcitations can be reduced by altering the ship’s stern lines in the de-sign stage. Figure 24(b) shows the wake distribution with the aft bodymodified, and the wake peaks and gradients are greatly reduced. Otherexamples of how propeller forces can be reduced by proper selection ofthe stern form and propeller type are given in a recent paper by Okamoto[98]. Solumsmoen [97] points out that it is difficult to give criteriafor an acceptable wake because the excitations also depend on the pro-peller geometry. Huse [99] does suggest some guidelines, for example,
5.7, 72.5-
80-
(a) Example of axial wake distributionfor an original hull giving riseto great hydrodynamic forces
.
65”172.5.
180.
(b) Axial wake distribution for modified

For large tankers and other ships with high blockients, W~x should not exceed 0.75.
cOeffic-
For ships with small block coefficients, e.g. , below 0.6,w should be below 0.55.max
%ax is the wake number measured at the center plane of the propeller in therange O .4 to 1.15 of the propeller’ s radius.
However, more research is needed in this area so that a systematiccorrelation between wake distributions and hydrodynamic excitations and pro-peller cavitation can be established. This correlation is dependent on thepropeller geometry, and an acceptable wake does not guarantee low propeller-generated forces and no cavitation. But such information would provide thedesigner with a rational means of assessing the suitability of proposed aftbody configurations.
2. MILESTONE II - Final Hydrodynamic Evaluation
After the design parameters in the preliminary hydrodynamic phase havebeen established and deemed acceptable in its evaluation, the final hydro-dynamic design may be initiated. This phase was discussed in Sections 6-13of Chapter III and is presented in Figure 25. The overall objective of thefinal hydrodynamic design is to be able to calculate all excitation forcesproduced by the propeller and to evaluate if these forces are likely tocause unacceptable levels of vibration in the ship.
The process by which the final hydrodynamic design is evaluated isillustrated in Figure 26. This figure includes the Design Step 6-13 alongwith the decision points and the feedback paths if redesign is deemed neces-sary.
The process begins by evaluating if the propeller forces computed inBlock 6 are within acceptable limits. As discussed in Section 6 of ChapterIII, there are no accepted guidelines for making this judgment, and addi-tional research ia required in this area to aid the designer. References31 and 100 do provide some simple criteria for maximum permissible excita-tion, although they should be used with caution. If the magnitudes of thepropeller forces and moments are not acceptable, then changes in the designmust be made. These involve modifying the stern configuration to alter thewake distribution and/or changing the propeller design. If the stern linesare altered, then a new wake survey must be conducted to determine the newnominal wake field. This new wake field would in turn require that anotherpropeller design be made. If the original wake is judged suitable, thenperhaps only changes in the propeller’s geometry are necessary. It is cer-tainly desirable to redesign the propeller without altering the number ofblades. However, if this is necessary, then a new longitudinal analysis ofthe shafting (Block 4) must be conducted.
After the propeller forces are judged acceptable, then the calcula-tions for hull pressures, including the effects of cavitation, can be made.Chapter III indicated this could be done in either one of two ways. Theindirect method consists of computing the hull pressures without cavitation,
64
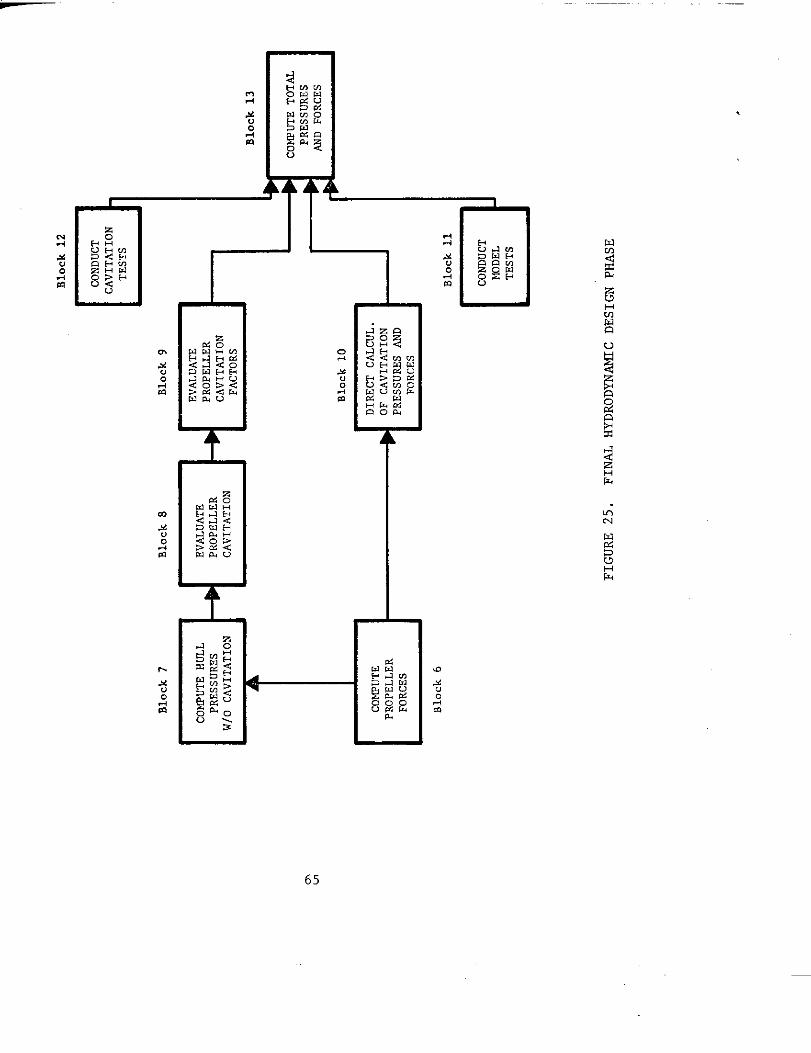
T
.
65

--7
.
I
66

evaluating the effects of cavitation, and estimating the cavitation factors.This procedure was described in Blocks 7-9. The second method, Block 10,involves direct calculation of the cavitation pressures. It is certainlydesirable to develop fully this direct process, and continuing research isbeing conducted in this area. The acceptability of the calculated hull
.
pressures can now be judged. But as with the propeller forces, there isno accepted criterion. Huse [101] in 1971 gave the value of acceptableblade frequency pressure fluctuations p measured at a point directly abovethe propeller as
2p = 13,000 (Pascals)
This figure was based on measurements from 12 ships. Some had vibrationproblems, and some did not [102]. Reference 102 reports that the SwedishState Shipbuilding Tank [103,1041 has the following criterion for thepressure fluctuat~ons above
where
2P =r
v=
D=
a=x
a=z
the propeller:
peak value of
displacement,
pressure fluctuations at reference point
full load, m3
propeller diameter, m
longitudinal clearance of propeller-hull, forward
vertical clearance of propeller-hull
The criterion was based on results of measurements made on eleven ships ofdifferent types. Reference 102 reports that the formula sometimes givestoo low values of permissible excitations on small ships and proposes thefollowing limit on single -screw merchant ships :
2P( )
075+ 75P<.allowed Lr
(Pa.cals)
where
L = length of ship in meters
Pr = pressure amplitude calculated from previous formula
For detailed discussions of these criteria, the reader should see Refer-ences 102-104.
The cavitation tests (Block 12) can also be conducted during thistime either in a cavitation tunnel or in a depressurized towing tank. The
67

. .
purpose of these tests is to study the extent of cavitation on the propellerblades and to measure the magnitudes of the pressure fluctuations on thehull . If the measured or calculated hull pressures are not acceptable bywhatever criterion is chosen, then design changes must be made. Figure 26shows that this again requires either modifying the stern configuration orpropeller geometry.
The model tests (Block 11) are also conducted during the final hydro-dynamic design. The purpose of these tests is to confirm the validity ofthe earlier wake survey by comparing measured and calculated propeller forcesand moments. If agreement is obtained, then more ccmfidence can be placedin the analytical hydrodynamic calculations of propeller-generated excita-tions because all predictions required a wake survey as input. If agree-ment is not obtained, then the original wake survey must be reanalyzed.This process is also shown in Figure 26.
3. MILESTONE III - Ship Substructure Evaluation
The purpose of the ship substructure design phase is to allow for thedesign, evaluation, and modification (if necessary) of each major subsystembefore the complete structure is assembled and analyzed. This process al-lows the ship to be divided into smaller components for which the analysiswill be simpler than that for the ship as a whole. If each substructure isproperly designed, it is hoped the response will be acceptable when the com-plete ship model is assembled. Figure 27 shows a flow diagram of the shipsubstructure design phase, which was discussed in Sections 14-20 of ChapterIII . This diagram is expanded in Figure 28 to include the various evalua-tion and feedback loops. These will now be discussed.
The first requirement is to determine if the resonant frequencies andforced response of the longitudinal shafting as determined by Design Block14 are acceptable. As a guide, the resonant frequencies should not be with-in 25 percent of the blade rate frequency or its harmonics. Reference 5and the design specifications can be used as a guide tO permissible vitnui.tion levels. If the structure is deemed acceptable, then the stiffness andmass of the machinery space can be added to the model. If not, modifica-tions must be made to the thrust bearing and foundation stiffnesses. Theprocess is then continued with the machinery space included as shown inFigure 28. The same acceptability criteria can be used, with any modif ica-tions being made in the stiffness of the thrust bearing and machinery space.
The lateral response of the shafting with both rigid and flexible hullmodels is determined in Design Blocks 16 and 17. If the natural frequencies
are again within about 25 percent of the excitation frequencies or if thebearing reactions are negative, it will be necessary to change the locationof the bearings or alter the stiffness of the lateral supports at the ship’sstern. This feedback process is illustrated in Figure 28.
The design of the superstructure is the next subsystem to be analyzed.Since the superstructure is excited only through the ship’s hull girder,its evaluation is based on having the natural frequencies removed fromthe excitation frequencies. If this criterion is not satisfied, then thesuperstructure’s natural frequencies must be changed, possibly by improvingits continuity with the main deck structure. The philosophy of separating
68

Block 20
Block 19
DETERMINE FORCEDRESPONSE OF
RUDDER b
Block 14 Block 15
~
Block 16 Block 17
~
Block 18
m
. ..—
.
TO COMPLETE
bSHIP STRUCTUREDESIGN PHASE
the natural andlocal plating.terion would bethicknesses.
The final
FIGURE 27. SHIP SURSTRUCTURR DESIGN PHASE
excitation frequencies also applies in the design of theModifications to the plating which did not meet the cri-made by local external stiffening andlor changes in plate
item in the ship substructure evaluation is the analysisof the ship’s rudder. Again th~ primary means of judging the rudder”’sacceptability is based upon how close its natural frequencies lie to thepropeller excitation frequencies. Figure 28 also shows that a criterionbased upon forced response of the rudder should also be included. How-ever, as discussed in Chapter III, the techniques for predicting propeller
69

*
EVALUATELOCAL PLATING
YES1
DESIGNb
Block 20YES
, I
+INO + I
.
DETESMINEFORCED DETESMINEFORCEDCHANCESTIFF-
RESPONSEOF RESPONSEOFNESS OF THRUST
LONC. SHAFTING MACHINERYSPACEBEARINCANDNAcHINERYSPACE
<Block 14 Block15 I
0 YESBlock 16 Block 17
DETESMINELATESALRELOCATEBEARING
FORCBDRESPONSE FORCEORESPONSE FORCEDRESPONSEPOSITIONSOR
OF SHAFTINGLATERALSUPPORT
(RIGIDNULL)STIFFNESS
NODIFYSUPERSTRUCTURE
POSITIONS EODA7,ANALYSIS DESIGN
t
FIGURE 28. MILESTONE III - SHIP SUBSTRUCTURE EVALUATION
:0CONFLETE
SHIPSTNUCTURE)ESIGNPNASB

excitations are not wellthe rudder structure andof support, geometry, or
developed at the present time. Modifications toits response must be made by changing its mannerclearances with the ship’s hull.
4. NILESTONE IV - Complete Ship Structure Evaluation
After the various subsystems analyzed in the ship substructure phasehave been judged as acceptable, the next task is to conduct the completeship analysis. This process is fairly straightforward and is depicted inFigure 29. The mathematical model of the ship is assembled from its compo-
nents, loaded with the propeller-generated forces and pressures, and theresponse determined. The evaluation made in Milestone IV is based upon the
~gnitudes Of the vibratiOn amplitudes and stress levels compared with thoseset in the specifications. If the computed quantities are below the speci-fications , then the complete ship design is acceptable, and the design pro-cess may continue. If the specifications are exceeded, then the design isnot acceptable and modifications must be made.
Figure 30 shows the complete ship structure evaluation process. Ingeneral, the vibration amplitudes are evaluated in each of the ship’s majorsubsystems such as the hull girder, superstructure, machinery space, andpropulsion shafting. It is again important to remember that the vibrationand stress levels must be computed at the locations designated in the speci-fications. If deficiencies are found in the complete ship structure, then
Figure 30 shows that design changes must be made in the deficient structuresand a new analysis conducted. It is difficult to give any specific recom-mendations as to the possible structural modification which will correct aparticular problem. If resonance occurs with the hull girder, it will bealmost impossible to make structural modifications to avoid this resonancefor all variations in ship mass and ranges of propeller RPM. Possible struc-tural changes in the superstructure. shafting. and nmchinerv space subsystems. .could, fro~ past experi~nce, include:
Block 21
{
ASSEMBLE
MODEL OF
ENTIRE
SHIP
Block 22
I DETERMINEVIBRATION
4 AMILITDDESAND STRRSS
I LEVELS OFCONFLETE SHIP
TO TEST AND EVALUATIONwF DESIGN STAGE ➤
FIGURE 29. CONTLETE SHIP STRUCTURX DESIGN PHASE
71

Block 22
ASSENllLE DETESMINEVIBSATION
+MODEL OF --b
AMPLITUDEASSD-9
< ENTIRESHIP STRESSLEVELSOFN COMPLETESHIP
A
IN HULL GIRDER
?’ NO
IN SUPERSTRUC.
SUPERSTRUCTUFW
+!!.
+
YESb
FIGURF 30. MILESTONE IV - COMPLETE SHIP STRUCTURE EVALUATION
TO TEST ANDEVALUATION
➤DESIGNSTAGE

r
Superstructure
Plate ThicknessesBulkhead LocationsStructural CentinuityAddition of PillarsStrengthen BeamsAddition of Bulkheads
Machinery Space
Bulkhead LocationsPlate ThicknessesFoundation StiffnessAddition of PillarsStrengthen BeamsAddition of Bulkheads
Shafting
with Main Deck
Lateral Support LocationsFoundation StiffnessesDiameter of Shafting
This portion of the feedback process must rely heavily on the analysts’ anddesigners’ correct assessment of the problem and possible corrective mea-sures. Figure 30 is intended to show that structural changes should firstbe made in the deficient subsystem, with the hope of not significantly alter-ing the response of the rest of the ship. This may not be possible sinceall systems are coupled together. In any case, structural changes must beincorporated into the complete ship model and the analysis reconducted.This process must continue until the structural response does not exceedthe limits set in the specifications.
5. MILESTONE V - Test and Evaluation Review
The final phase of the recommended design procedure is for test andevaluation of both the ship and the design process. Figure 31 shows thisphase, which was discussed in Sections 23-27 of Chapter III. Based on theinput from the shaker tests, the local vibration levels, hull damping, andstructural modeling techniques are determined. Of these three, the assess-ment of local vibration is the most important becauae it directly affectsthe acceptability of the current design. Hull damping estimates and theevaluation of the modeling techniques are also valuable, but more from theviewpoint of future ship designs and design methods. This is illustratedin Figure 32, which presents the review process for the Test and EvaluationPhase. The figure shows that if the local vibration levels are not accep-table as determined by the shaker tests, then the local structure must be

Block23
CONDUCT Block 26sHAKERTESTS COMPAREMEASURED
+ V1BR4TIONSl$lTHSPECIFICATIONS
Block 25
ASSESSLOCALVIB., MEASUREVIBRATIONSHULL DAMFING, DURING
MODELINGTECHNIQUES SEA TRIALS
Block 27Block 24
COIWAREMEASURED
+ VIBRATIONSWITHCALCULATIONS
FIGURE 31. TEST AND EVALUATION DESIGN PHASE
model techniques are probably deficient and need to be improved. The de-sign and construction process of the ship is not dependent on this review,and after the ship is completed, sea trials will begin.
In the sea trials, vibration levels will be measured at locations andunder operating conditions given in the specifications. Figure 32 showsthat the acceptability of the ship from a vibration point of view is basedupon the measured levels meeting the specifications. If this is accomplished,then the design can be considered adequate. If the specifications are notmet, then the design procedure has failed to produce an acceptable ship, andcorrective measures must be taken.
This report discussed in Section 28 of Chapter III the fact that eventhough the vibration specifications were met, the design procedure may beinadequate. It is necessary, therefore, to end the process with an assess-ment of how well the complete design procedure works. This can best be doneby comparing the calculated vibration levels with those measured during thesea trials. If sufficient agreement is obtained, then the recommended pro-cedure can be considered adequate. If not, a review must be made to deter-mine the source of errors. These errors arise essentially from two sources:(1) calculation of the hydrodynamic excitations snd (2) calculation of theship’s response to these excitations. It is difficult to give any specificrules to pinpoint deficiencies in the analysis techniques. However, if good

Block 23
~— Block 26
mINo
I CONDUCT I I Mmr.m I -~
ISWKER LOCAL
TESTS STKUCTUXE
1 B10ck25 ti=.~’;=’m
MEASUKE
+
V1BRATIONSDURING
ASSESS LOCAL SEA TRIA1, s Block 27VIEWTTONS,MULL
10DEL1.NG COMPARE
-PIIEASURED PROCEDURES
V1BRATIONS?!’’!.?:. !!:!!:5 u
VIBRATION LEVELSW1lll CALCU1,ATIONS ADEquATE
\ ‘“DEL’ / I
HNO
REVIEW STRUC-TURAL MODELING
TECHII IQ”Es +
14(1
REVTEW Di3S1(7NpROCEDURE FOR
50 URCES OF
I ERRORS
FIGURE 32. MILESTONE V - TEST AND EVALUATION REVI~
v. APPLICATION OF THE RECOMMENDED PROCEDURE
1. Overview
It was recognized during the conduct of this program that all the de-tailed steps for vibration design recommended in Chapter III have not been
applied to a single ship. I?ostdesigns use a portion of the individualblocks, but not necessarily in the sequence presented in this report.
In order to validate the recommended procedures to some degree, theoriginal scope of work for this project was extended to include applicationto a specific ship. Detailed ,design information is difficult to obtain,but fortunately vibration analyses which follow closely the recommendedprocedures have been conducted by Littleton Research and Engineering Corp.(LR&EC) , a corporate coauthor of this report. Section 2 presents the pro-cedure as it is applied to a containerized and unitized cargo ship. Thisship was built and underwent extensive vibration measurements. Appendix Gcontains a summary of vibration investigations which were part of the de-sign of a proposed large roll-on/roll-off ship. This information is pre-sented to show the depth of the studies which were made to minimize pro-peller-induced vibration. In both of these examples, the readers willimmediately see that not all the blocks in the recommended procedures havebeen applied. Thus, only a partial example of application of the recom-mended design procedure could be given.
2. Procedure as Applied to a Containerized and Unitized Cargo Ship
2.1 General
To provide a comparison of the reliability of the recommendedprocedure, it was proposed to apply certain elements of the program approach
to a ship built in 1972 by Ingalls Shipbuilding Division, Litton Systems,Inc. , for Farrell Lines, Inc. The ship had a longitudinal vibration of thepropeller and shafting system which required correction. Because of thesedifficulties, an unusually complete set of vibration readings were made onthe ship. LR&EC had made quite extensive vibration studies of the ship inthe design stage, but the studies lacked the completeness and perspectiveof the program presented in this report. The studies included a rough fi-nite-element analysis of the machinery space, which indicated a double bot-tom mode. This mode when coupled with the shafting system represented theoffending vibration. However, under the pressures of time and finances,this difficulty was not recognized at the time. The following sections up-date certain portions of the original analyses and compare the results withtest measurements.
2.2 Ship Description
The important ship characteristics are listed below:
Overall length 668.5 ftLength between perpendiculars 625.0 ft
76

Beam 90.0 ftDepth to main deck 53.0 ftDesign draft 29.0 ftDisplacement (at 31’ 5“ draft) 28,440.0 tonsNumber of containers 872
The ship is divided by transverse bulkheads into eight holdsforward of the machinery space and one long hold aft. The quarters andbridge are located over the machinery space. There are wide hatches portand starboard of a centerline girder in which the containers are stowedvertically in guides. The containers are stowed six high in the holdsand two high over the hatch covers.
Longitudinal strength and some torsional stiffness of the hullare provided by a heavy box girder 9 ft deep by 9 ft 9 in. wide extendingbetween the second and main decks. In addition, there are three heavy M
beams on each deck, and portions of the ship obtain torsional ~tiffnes~from wing tanks. Extensive use is made of high-strength steel.
The ship is driven by a steam turbine plant with a normal horse-power rating of 26,000 and an ABS rated horsepower of 28,500. The corres-ponding propeller shaft speeds are 103 RPM and 106.5 RPM, respectively.The overspeed trip on the turbines is 115 percent of the maximum ratedspeed, which corresponds to 123 RPM for the propeller. The normal operat-ing speed of the ship is 23 knots. Reference 105 contains detailed infor-mation on this class of containership.
The propeller is 23 ft 6 in. in diameter and has six blades.
It is made of Superston 40, ABS Grade 5, whose tensile strength is 90,000psi. The propeller shaft is supported by oil-lubricated bearings . The aftbearing haa a diameter of 29-3/8 in. and a length of 74 inches. The for-ward bearing is 29-1/2 in. in diameter and 25-1/2 in. long. The distancebetween the bearings is 24 ft 9 in., and the distance from the center ofthe aft bearing to the centerline of the propeller is 6 ft 9 inches .
The choice of clearances between the propeller tip and the hullis determined by a balance of several factors. From a structural point ofview, it is desirable to support the propeller with little overhang andminimum extension from the hull. The hydrodynamicist would prefer to havethe propeller work in the high wake boundary layer region close to the hullfor good propulsive efficiency. For low levels of propeller-excited vibra-tion, however, it is desirable to have large propeller clearances. The in-tensity of the pressure field around the propeller falls off rapidly withdistance, and the propeller works in a more uniform wake. Consequently,smaller harmonic propeller and surface forces are generated.
In the preliminary design, the designer normally defines thepropeller location in terms of clearances between the propeller and adja-cent structure expressed as percentages of the propeller diameter. Forthis ship the clearance to the hull over the tip of the blade is about3.21 ft or 13.6 percent of the propeller diameter. The distance from thepropeller leading edge at 0.7 radius to the strut is about 6.85 ft or 29percent of the propeller diameter. The distance from the propeller trail-ing edge at 0.7 radius to the rudder horn is 4.09 ft or 18 percent of the
77

propeller diameter. These are adequate clearances for the high power.The propeller is located 5 in. forward of Frame 223, or 616.58 ft from theforward perpendicular, or about 95 percent of the waterline length fromthe forward perpendicular.
An outboard profile of the ship is shown in Figure 33 and asketch of the propeller aperture in Figure 34.
2.3. Application of the Procedures
The following paragraphs discuss the individual blocks of theRecommended Design Procedures which are covered in this application. The
last series of digits refer to Figure 3, the Flow Diagram of RecommendedDesign Procedures to Minimize Propeller-Induced Vibrations, on pages 6 and7 of this report.
2.3.1. Define Vibration Specifications. No quantitativespecifications for acceptable level of vibrations were established in theship construction contract. The contract specifications for the construc-tion of the ship contained vibration clauses from the Maritime Administra-tion Standard Specifications for Cargo Ship Construction. In connectionwith its analytical predictions, Lit tleton Research and Engineering Corp.developed some criteria. In analyzing the test results, the InternationalStandards Organization 1S0 2631, “Guide for the Evaluation of Human Expo-sure to Whole Body Vibration, ” was used. The reader is referred to Refer-ence 4 for later revision of the standard.
2.3.2. Establish General Ship Design Data. The more signifi-cant characteristics of the ship were presented earlier. Sketches of themachinery space and the superstructure will be presented in the descrip-
tion of the model that is analyzed. The analysis is made for the ship attrial draft conditions in order to compare with measurements.
The drafts and displacements on trials were:
Draft Draft
Forward Aft Trim Tons
Official Trials~g! 9!! 26, ~l! 6, ~!! 19,442
StandardizationTrials 20, 7!! 26‘
2.3.3. Conduct Wake Survey.DTNSRDC in March 1968. The longitudinal0.335 R (radius) , 0.520 R, 0.723 R, 0.95Figures F1 - F5 in Appendix F. These wament and 23 knots.
,~ls 5’ 5-1/2” 19,261
A wake survey was conductedtangential. and axial wakes
byat
R, and 1.100 R are presented ases are for 25,035 tons displace-
2.3.4. Estimate Longitudinal Propulsion Frequencies. Figure
35 plots the relationship between natural frequency of longitudinal vi-bration and the stiffness of the thrust bearing foundation. Kane and
78

.
1A.P. I
,.P.
FIGURE 33. OUTBOARD PROFILE
II A.P,, I , I230 225
FIGURE 34. PROPELLER IN APERTuRE
79

—. . . —
Prop. 6lhrustshaft Thrust Collar
Entrained 40” L - 27” D
Water112,800lb A!/,= 17.08 X 10⁹lbf
m Bull GearHub .5Shaft20,000lbm
m = 19.7x 10⁹ lbf AE - 12.0 x 10⁹ Ibf K, Thrust K, Fom-Shoes, dation
p = 187 lbmfin. P = 120 lbmfin. CollarCase Thrust26.6 lbf/in 8earing
33,000lbal
(a) Propeller and Shaft Nass-Elastic System
BLAOE - RATE F EQUENCY FOR
SIX-BL\DEDPR(,PELLER
o 5 10 15 20 25 30 35
FOUNDATIONSTIFFNESS- 106LBFIIN.
(b) Estimate of Natural Frequency forPropeller Shafting System
FIGURE 35. FREQUENCY OF LONGITUDINAL VIBRATION VERSUSFOUNDATION STIFFNESS
80

McGnldrick [13] give some approximate ranges for K, the foundation stiff-ness, for a thrust bearing located just abaft the gear and tied into gearfoundation, as 5 to 20 x 106 lb/in. On the basis of this, the designerswere informed early in the design process that if a rigid foundation weredesigned (this should not be too difficult because the thmst bearing islocated in a narrow region of the ship) , there should be an adequate marginbetween the natural frequency of the shafting system and the operating fre-quency of a six-bLaded propeller turning at 106.5 RPH. The fo.ndation waswell designed and of heavy construction, so by the general criteria appliedat the tine, longitudinal vibration trouble should not be expected. Whythe trouble occurred will be explained later. The prediction of the troublerequired additioml amlysis of the engine room.
2.3.5. Oeaign Propeller. The propeller design was fumishedto the ship builder along with the lines plan and general arrangement ofthe ship as part of the contract documents.
2.3.6. Campute Propeller Forces. The blade order harmonicforces and moments were computed using the LR&EC lifting line computer pro-gram. It was not possible to compute the twice-blades order forces andmoments because only the first ten harmonics of the wake were furnished.Computations of twice–blade order forces and moments for a six-bladed pro-peller require the eleventh, twelfth, and thirteenth orders.
The values of the blade order harmonic forces and moments, withtheir phase angles, excited by the propeller on the shaft at 99 RPM are:
Fx (longitudinal) 12,963 lb 65.53°Fy (transverse 4,210 lb -19.70”Fz (vertical) 1,185 lb -128.51”Mx (about rotatioml axis) 40,373 ft-lbMy (about transverse axis)
63,47°99,363 ft-lb
~ (abOut vertical axis)
-11.42”37,210 ft-lb –lo6 .25°
All forces and moments are referenced to the coordinate systernshown inFigure 34, and all moments are computed about the origin. The angles aremeasured from the top of the propellerdirection of propeller rotation.
, with the positive values in the
2.3.7. COUPute Hull Pressures Without Cavitation. The hullpressures and the resulting hull force were computed using the LR&EC pr-ogram. This program computes the free-field pressures generated by the dis-tribution of forces along the lifting levers of the propeller blades andthe thickness of the propeller blade and multiplies the result by a factor,generally 2, to represent the solid boundary.
Because at the trial conditions the draft aft was between 26ft and 26.5 ft, the waterline runs out within the propeller aperture be-tween the propeller and the rudder. ‘fherefore, there is little hull sur-face below water in the region of the propeller. The predicted hull forcesgenerated by the propeller at 99 RPM, if the propeller is not cavitating,are:
81

~-.–._
Fx 3,284 lb
FY 2,430 lbFz 4,310 lbMx 36,706 lb-ftMy 28,470 lb-ftMz 19,112 lb-ft
-166”
700-180°-111°128°73° *
The following blocks are combined:
2.3.8. Evaluate Propeller Cavitation
2.3.9. Evaluate Propeller-Cavitation Factors
2.3.13. Compute Total Pressures and Forces
LR&EC has developed a computer program which predicts the pres-sures on the hull of a ship generated by the lift forces and the thicknessof the propeller moving through the water. It does this by computing thepressure that would be generated in open water at the location relative tothe propeller that represents a point on the hull and multiplying this free-field pressure by two to account for the rigid-hull surface. This is an
approximation because it does not deal with the complexities of the reflec-tions off the hull surface and does not include cavitation effects.
The pressure radiation from cavitation is much more efficientthan that from the harmonic force loadings and from the passage of theblade through the fluid. In cavitation there is a harmonic change in thevolume of the cavity. This transmits pressure as a simple source with thepressure amplitude at large distances from the source given by the equation(see Reference 106, page 313)
P d%P .—
4Wr dt2
where
& . the
dt2
P= the
r= the
second time derivative of the volume
mass density of fluid
radius from the source.
The harmonic forces on the blade and the passage of the blade through waterdo not change the volume, but only displace the water, and the pressurefield corresponds to that from a source and sink, a dipole. The equationfor the amplitude of the pressure for a harmonic force at a large distancefrom the dipole is (see Reference 106, page 318)
3Fv CCIS 8
P .—2cr
82
!,

where
P = pressure
F = force on the sphere in the direction of vibration
v= frequency in cps
e= angle between a vector to the measuring point and theforce vector
c = the speed of sound in the fluid
r= distance between the dipole’s center and locationof desired pressure
It is clear that the pressure from a harmonic force, as a source and sinkin general, is a maximum in the direction of the force and zero in a planenormal to the force direction. On the other hand, the pressure from thechanging volume has no directional properties.
At the present time,the procedures for predicting the hullpressure from a changing cavitation bubble are not well developed and arecomplicated. For this analyaia, the loads from pressures on the hull sur-face, required as input to the hull vibration calculation, are estimatedby comparing measured pressures on two ships with propellers at times work-ing in the cavitation region, with the calculated pressures without cavi-tation determined by the procedure described earlier. ‘Ihese two ships arean OBO ship of the San Clemente Class built by National Steel and Ship-building Corp. and a RO/RO ship of the Seabridge Claaa built by IngallaShipbuilding Corporation [107].
The OBO ship has the following characteristics:
Full Power - 24,00 HPShip Speed - 17.15 knotaPropeller RPM - 92Propeller Diameter - 26 ftPropeller Projected Area - 265.04 ft2Propeller Tip Submergence - 18’ 10-1/2”Propeller Thrust - 420,000 lb
Mean Inflow Velocity Ratio at 0.8 R - 0.643Inflow Velocity Rstio at 0.8 R, 0° - 0.306
Pressure readings were taken under steady ahead operation at60 RPM and at 92 RYM. At 60 RPM the average ratio of 11 measured pressuresto calculated pressures was 1.592 and the standard deviation of this ratio,0.718. At 90 RPM the average ratio of 11 measured pressures to calculatedpressures was 3.053 and the standard deviation of this ratio, 1.435.
Measured pressures and information on the harmonic forces arereported in Reference 107.
83

-
The Seabridge Class ship has the following characteristics [22]:
Full Power - 30,000 HPShip Speed - 24.59 knotsPropeller RPM - 112.9Propeller Diameter - 23 ftPropeller Projected Area - 268 ft2Propeller Tip Submergence - 7.9 ftPropeller Thrust - 415,860 lbMean Inflow Velocity Ratio at 0.8 R - 0.866Inflow Velocity Ratio at 0.8 R, O“ - 0.405
Readings of the hull-surface pressure were made under steadyahead operation at 110, 108, 101.2, 95.8, 92, 80, and 70 RPM [108I. Atthe higher speeds there was considerable hull vibration, so the pressurereadinga were corrected for water inertia effects by assuming the hull aninfinitely long cylindrical body having a width corresponding to the water-line width in the plane of the pickup. The water correction is signifi-cant, but, on further reflection, the amount of tbe correction is consid-ered to overcompensate, and half as much compensation would be more rea-sonable. The preasurea measured at 70 RPM were so small as to be consid-ered unreliable (maximum calculated pressure 74 lb/ft2 = abOut O.5 Psi,minimum calculated pressure 4.3 lb/ft2 = 0.03 psi) . The remaining resultsare given in the following table.
TABLE 19. PRESSURE DATA AT 16 LOCATIONSON SEABRIDGE SHIP
I NaximmMeasured
110.0110.0108.0108.0101.2101.295.892.080.0
Accel.Correct.
NoYesNoYesNo
LimitedNoNoNo
Pressures
(lb/ftz)
43258543263724525520819699
Maximum
Calc.
?ressures
(lblftz)
183.7183.7177.1177.1154.9154.9138.8128.096.8
*Max.
~
9.4414.7710.3922.147.697.695.314.5322.08
*iin.
~
0.921.431.021.710.821.070.780.410
Avg.~
3.0735.8133.4475.6882.3132.4451.9651.6820.941
StandardDeviation9
2.1393.4732.2504.1601.6461.6011.1s41.057-.
*Maximum (minimum)ratio of measuredto calculatedpressures
84

characteristics of the ship being analyzed are:.
Design Shaft Horsepower - 26,000 HPShip Speed at 19,500 Ton (Model Test) - 25.53 knotsCorresponding Propeller RPM (Model Test) - 106.7Propeller Diameter - 23.5 ftPropeller Projected Area - 243.2 ft2Propeller Tip Submergence - 2.71 ftPropeller Thrust - 354,860 lbMean Inflow Velocity Ratio at 0.8 R - 0.870Inflow Velocity Ratio at 0.8 R, 0° - 0.393
To utilize the experimental data for the new ship,it is neces-sary to develop some method of comparison. It is presumed that,in general,
the pressures integrated over the surface of the ship to give the totalharmonic force are adequate for the noncavitating condition. These har-monic forces and moments can be multiplied by a factor to account for thecavitation. This is a simplification since, as shown earlier, the dis-tribution of pressures due to cavitation is different from that due toblade forces and displacement.
This simplification is worse for pressures than for forces.In general, the forces due to loading the propeller act axially and tan-gentially on the propeller and would, therefore, tend to give small pres-sures where the plane of the propeller intersects the hull surface. Thisis the region of peak pressures because of proximity to the propeller.The cavitation effects being transmitted without any directional biaswould gi”e higher ratios of (pressures with cavitation) /(pressure without
cavitation) in the regions close to the plane of the propeller disc. Thehull forces, being an integration over the surface, average the variations.
It is further presumed that some of the pressure available be-fore cavitation occurs will be used by the steady lift of the propeller.The remaining pressure will be available for pressure fluctuations, andif these fluctuations are greater than that remaining, cavitation willOccux . Because the object is correlation of experimental data, hopefullythe procedures need not be precise. For example, average pressures ratherthan peak pressures are considered. Because cavitation is a tip phenome-non, 0.8 R is taken as the propeller blade section for study. The sub-mergence plus atmospheric pressure at the propeller’s top on the center-line at O.B R is determined (neglecting thermal effects on vapor pressure) .The thrust per square foot of projected area is obtained by dividing thethrust by the projected area of the propeller. The difference is avail-able for handling fluctuations in wake. The pressure corresponding tothe major fluctuation, the high wake at the top of the propeller disc, isdetermined very roughly by determining the change in angle of attack Aaat this location. The value is
A a = [mean axial wake velocity - local wake velocity] x —‘;.8
= (Vmean ,atio at o ~ ~ - Vratio at o g R 00) x v~hip.,
85

If the slope of the coefficient of lifttaken to be 2T, the average preaaure on
P = Zllax + PV2
= 2Ta x + P [(uRO ~)z + V~xiall
We note that V~ial is negligible compared
change in pressure is
curve at zero angle of attack iathe section is
2with (uR0.8) . Therefore, the
APreaaure = [(v*ean ratio at ~ * R - Vratio at ~.8 R, ~.) x “v~hip
x 1.688] x+x ~x~x0.4D
= 0.01118 x AVelocity ratio x V xRPMx Dship
where V is the ship’s apeed in knots and D is the propeller diameter inahip
feet.
when these relations are applied to the full-power conditionwith the OBO and RO/RO shipa, the values shown in Table 20 are obtained.
The pressure magnifying factors for the RO/RO and the OBO shipare plotted against the cavitation factor in Figure 36. There is clearlyno agreement between the OBO curve and the RO/RO curve, and although severalhypotheses were tried in an attempt to find a correlation, there appearedto be no way to obtain a common relation compatible with both.
For the nreaent. the unitized and containerized ship beingstudied is similar to the Seabridge RO/RO ship, and so the pressure signi-fication aa a function of cavitation factor for this ship is applied to thecalculated hull forces and moments for the ship being analyzed. The verti-cal hull forces and tranaverae moments calculated at 99 RPM are
Force
Fz = 4,310 lb
MY = 28,470 ft-lb
These values are small because moat oftaking the forces and moments proportional to the square of the RPM, valueaat other RPM’a can be calculated. These are given in Table 21, along withthe forces and moments obtained by applying the cavitation factor. The
valuea corrected for cavitation are plotted in Figure 37, and these valueswill be applied to the model developed and discussed in Sections 2.3.15 and2.3.18.
Phase Angle
-180 “
128”
the hull is out of the water. By
86

TABLE 20. CONFUTED CAVITATION FACTORSFOR THE THRRE SHIPS
SeabridgeShip
SubmergencePressureat 0.8R= 2767lblft2
SubmergencePressure,SteadyPressure btinusSteadyPressure APressuredueto
&CavitationFactor
Thrust,lb\ft2 lblftz Wake.lblft2 Col.41C01.3
112.9 1552 1215 329 0.273110 1473 1294 312 0.241108 1420 1347 301 0.223101.2 1247 1520 264 0.17495.8 1117 1640 231 0.14592 1031 1736 219 0.12680 779 1988 165 0.083
SanCleme.teOBO
B“bmergeneaFres.ureat O.SR- 3490lblftz
92 1452 2038 155 0.07660 618 2872 66 0.023
ContainerizedandUnitizedCargoShip
SubmergencePressure at 0.8 R= 2441 lb/ft2
106.7 1459 982 341 0.348100 1282 1159 300 0.25995 1157 1284 270 0.21190 1038 1403 243 0.17385 926 1515 217 0.14384 820 1621 192 0.118
The following three blocks were not accomplished:
2.3.10. Direct Calculation of Cavitation Pressuresand Forces
2.3.11. Conduct Model Tests
2.3.12. Conduct Cavitation Tests
2.3.14. Determine Forced Longitudinal Response of Shafting.
Although normally this improvement upon the estimate made earlier (Block 4)should be made in the design procedure, this calculation will be included withthe response of the machinery space and superstructure (Blocks 14 and 18) .
87
I 1 1 I
SEABRIWX.CLAW ROIFJ3
/’
sw ~EMENTECIASS OBO
I I I I
o 0.05 0.10 0.15 O.m 0.25
CAVITATION FACTOR
FIGUSE 36. SATIO OF MSASUSED HULL PSESSD8ES WHERE CAVITATIONEXISTS TO CALCULATED, NONCAVITATING PRESSUSES
TAELE 21. 8ULL FKM?CESAND MOMENTS DDE TOCAVITATION EFFECT
Fx (lb) My (ft-lb)Cavitation
SPM (Calculated) (Calculated) FactorFx (lb) M (ft-lb)
106.7 5006 33,071 3.00 15,000 100,000
100.0 4398 29,048 4.20 18,470 122,000
95.0 3969 26,216 4.25 16,870 111,420
90.0 3562 23,530 2.37 8,442 55,760
85.0 3177 20,987 1.93 6,132 40,505
80.0 2814 18,591 1.54 4,334 28,630
88

120,000
100,000
80,000
60,000
40,000
20,000
030 40 50 60 70 80 90 100 110
PROPELLERRPM
FIGURE 37. VERTICAL HARMONIC FORCE AND TRANSVERSE BENDING MOMENTGENERATED ON HULL BY THE PROPELLER
0,000
3J
6,000
fR
2,0008
!b,000
4,000
0

2.3.16.
2.3.17.
Determine Forced Lateral Response of Shafting(Rigid Hull)
and
Determine Forced Lateral Response of Shafting (FlexibleHull) . Although these estimates should be made in the course of the design
development, in this demonstration example the step is bypassed (as it wasin the original work) , but is included in Block 21.
2.3.15. Determine Forced Response of Machinery Space
and
2.3.18. Conduct Superstructure Modal Analysis . These two stepsin the development program are combined in a modal analysis and forced re-sponse calculation, which includes the machinery space and superstructureas one common substructure. In the course of a design development, it wouldbe desirable to analyze these two sections separately and to combine them assubstructures in the final finite-element model. However, in this example,it was considered advisable in the interests of obtaining good correlationwith experimental results to combine both the machinery space and the super-structure into one large substructure since the two would be used in a beammodel rather than a large finite-element model.
In the original analysis of the ship in 1969 and 1970, the ma-chinery space was analyzed with a coarse STARDYNE model to give inputs assprung masses to the general beam model of the ship . This model extendedto the main deck, but did not include the propulsion system. The modelgave indications of the type of clifficulty that was experienced, but thesewere not recognized at the time. In more recent finite-element analyses,the modeling has been much more realistic, but there has never been a good
OPPOrtunitY tO cOmPare predictions with measurements on the ship. To Sllp-port the belief that good finite-element analyses will predict potentialvibration problems, it was decided to make the analysis on this ship to thestandard that has been applied on other ships that have been analyzed inrecent years. To further assure this, it was decided to include the super-structure with the machinery space model since they are closely coupled.Of course, the propulsion System should be included. Since the water in-ertia values that have been used in past analyses have always been question-able and are a significant part of the total mass, it was decided to includea new representation of water inertia recently conceived and not developed.Because, among the possible computer programs for analyzing the structure,the AINSYS computer program has an element that appeared to be directly
applicable tO the introduction of water inertia under the new concept, andbecause of the good experience of SWRI with ANSYS, it was decided to usethis program for the analysis. This meant developing a familiarity witha new program instead of NASTRAN, which LR&EC has customarily used for largestructural vibration problems . It has subsequently been determined thatthe water-inertia matrix could be introduced into the NASTRAN program.After a long period of frustration, it was discovered that the ANSYS ini-tial introduction of water inertia was in error so that the choice of com-puter program system for this example was unfortunate. The error in thewater-inertia matrix was subsequently corrected, however.
90

In subsequent sections, the following topics will be discussed:
a. The Structural Modelb. The Treatment of Water Inertia
The Natural Frequencies and Mode Shapes .
:: The Response to Axial Excitation at the Propellere. General Discuaaion of the Substructure Model
(a) The Structural Model
The section of the ship modeled in this analyais is the machineryspace bounded by its forward and aft bulkheads, which are assumed to befixed. Included in the model are the complete superstructure, which gen-erally falla within the length bounds of the bulkheada, and the propellerand shafting, which is free to move axially in ita bearings and is qoupledto the machinery apace at the thrust bearing. An inboard profile of theregion ia presented in Figure 38. A typical section is shown in Figure 39,and Figure 40 shows the after engine room bulkhead at Frame 181. Thesesections contain the grid points used to define its structure and mass load-ing. In the machinery space length extending from Frame 157 to Frame 181,there are five (5) of these web frames , which with the bounding bulkheadagive seven (7) longitudinal subdivisions. There are nine (9) deck levelsin the machinery space and seven (7) in the superstructure. A total of 577grid points are used to define the structure. These carry maaaes and areconnected by membranes (plates whose bending is neglected) , spars (cob.mmawhose bending is neglected) , and beams . A total of 2595 elements, includ-ing masses, were used. The computer program determines the mass of thestructure, but additiona must be made for equipment, furnishings, electri-cal and piping fittings, machinery, water inertia, etc.
The computer program assembles all of these structural elements andcomputes their assembled stiffness and mass matrices, which have generallyat least three times as many elements as the number of grid points, Thesematrices are difficult to analyze, so the stiffness-mass matrix is custom-arily reduced to an equivalent dynamic matrix referred to grid pointsassigned by the analyst as capable of representing the dynamic behaviorof the structure. For this model, there are 72 dynamic-degrees-of- freedom.The choices of degrees of freedom represent what the analyst expects to begood locations to represent the structure and define the vibration patterns.To reduce coat and complexity, he likes to keep the number small, but byso doing he may fail to reflect some particular vibration pattern that hedid not anticipate. Because all the vibration that was strongly observablein the machinery space was symmetrical, i.e. , the same on both the port andstarboard sides, only the symmetrical vibrations have been considered inthis study. Good practice in studying ship hull vibration would dictatethat both the symmetric and anti-symmetric vibrations be analyzed. Once amodel for symmetric vibrations has been set up, it is only necessary tochange boundary conditions, repeat the last calculation, and interpret theresults to cover the anti-symmetric vibrations. Anti-symmetric vibrationsare not as common as symmetric, but they are far from unusual.
91

17.““L FALSESTACK129’11”.4SV~
KINGPOST
EMERG. GEN.FANFM
.
Ilu
CARGOHOLD—. 3
3RDDK WINGTANK3310”Asv~ F.O.SERVICE
26’0”AlJK.NACSYFLAT WINGTANKF.O.SERVICE
MACSINERYSPACS
FR !81 FR \51
,
I
FIGURE 38. INBOARD PROFILE
92
I

69 210 342.9 456
1104
0$
a“conQ. 11111
:a 1111111111
.2nd DK 9138 I I 936
mc+~
36’ n 808 837 850 864 87X892A!
T-7 /’-520”2
‘qJ’-3’7E197.’:Jj 7
108 13.0
32.8
100.5
.
FIGURE 39. GRID POINTS ON FRAME 170,X = 396 IN.
93

MAIN
-m
DECK 57‘-2” 1001‘1%102:1~13’iq5,42::o ,254L ~085
1043
7
68’ ImllhTflL’ ‘
mlllll
t36’ FL
20’ STR 501
13’-8” STR
T
—— —
FOUND
4114TANK T.
66BASE L.
8434.4 * 23.6
FIGURE 40. GRID POINTS ON FRAME 181,X= OIN.
94

The model was loaded at the propeller with longitudinal excitations.Because the hull substructure did not extend aft to the propeller, no hori-zontal or vertical excitations on the propeller or hull are included inthis analysis.
(b) Water Inertia
One of the present serious deficiencies of the analysis of struc-
tures in water by use of finite elements is the treatment of the effec-tive mass of the water moving with the structure. This same difficultyplagued early efforts to predict the natural frequency of ships as beamsuntil F. M. Lewis and J. Lockwood Taylor developed procedures for includ-ing the water mass.
In a structure, it is desirable to assign one mass to each gridpoint in contact with the water. However, this is not enough becausemotion at one location will generate pressures at adjacent locations.One way of representing the water accurately is to establish a volume ofgrid points in the water and use fluid elements to develop the pressuresin the water and on the ship from the vibratory motion of the ship. There
are a limited number of cases where this has been done,and the results aregood . However, the procedure adds complexity to a computer analysis thatis already large.
For this analysis a procedure for computing the mass matrix of thewater inertia over a number of grid points on the bottom was applied.It is based upon the pressure generated on a flat surface (an extensionof the pressure on the surface of a sphere) by a small vibrating pistonlocated in the surface. The pressure is proportional to the area and thevibratory acceleration of the exciting piston and inversely proportionalto the separation between the exciting piston and the location of pres-sure measurement. Thus , the mutual force between small areas ~ and ~ is
CA Aannlm
F=rmn
where
c = a factor reflecting the density of the fluid and the
proportions of the pistons
Am,An = the areas associated with grid points m and n
r the minimum surface distance between grid point m and nmn -
on the ship’s hull
a the acceleration of the piston mm-
.
C Am AnClearly the quantity ~ has the units of mass, and so the force/
macceleration interaction between grid points on a surface bounding a fluidcan be represented by a matrix of mass terms.
95

‘Ihereare corrections for the physical dimensions of the sending andreceiving pistons. Where only half a surface is modeled, the interactionwith the other half can be represented for symmetrical and antisymum tricalmotions by dummy grid points. The influence of free water surface can alsobe represented by using a mirror of grid points above the water surface.
If the dimensions of the pistons are small compared to the wavelength of the transmitted vibration, the pressure wave is transmittedas a spherical wave and there is no significant correction required forthe location of the receiving piston relative to the sending piston.
It was found that the mutual interaction between pistons is sig-nificant for considerable distance such as for the length of the machine-ry space. Where the distance is lon& there can be a phase shift betweenthe force at the remote piston relative to the acceleration at the ~rans-mitting piston. The finite-element model of the fluid normally would notinclude this.
A paper is being prepared for submission to the Journal of ShipResearch covering the background and details of this water-inertia treat–ment. In the machinery space model, it was used in its simplest form withminimal corrections for piston dimensions relative to the separation ofthe sending and receiving pistons.
(c) Natural Frequencies and Mode Shapes
The modal analysis of the stiffness and mass matrices represent-ing the structure, when reduced to equivalent matrices having 72 degreesof dynamic freedom, gave the following frequencies and general mode shapes.
Mode 1: Frequency = 1.9 Hz
The maximum displacement is a vertical motion on the 26-ftflat on tbe centerline at Frame 165. The motion drops rapidly in adja-scentpoints. This grid point is on top of a portable plate and shouldnot have been selected as a degree-of-freedom point. The selection wasmade because it was known that on trials the 26-ft flat vibrated heavily.
Although the 26-ft flat is a light structure and vibratesnoticeably, this particular vibration mode is probably spurious andarises because the weights on the 26-ft flat were distributed evenlyamong the grid points rather than concentrated at the particular itemsof equipment. It will be shown later that this particular mode is notexcited by the longitudinal force at the propeller.
Mode 2: Frequency = 6.2 Hz
The maximum displacement is still on the 26-ft flat and stillat Frame 165, but in this case at a grid point 214 in. (17 ft 10 in.) offthe center. The structure at this location is permanent, but light, andwould not be loaded as heavily as is done by making it a dynamic degree-of-freedom. The frequency is therefore probably spurious.
96

Mode 3: Frequency = 6.5 Hz
The maximum displacement for this mode is still on the 26–ft
flat at Frame 165, 214 in. off the center. However, the vibration ismuch more widespread with amplitudes in the superstructure, along thelower engine room stringer, and axial motions in the shaft one-eighthas large as the maximum amplitude. This is probably the lowest realnatural frequency.
Mode 4: Frequency = 7.1 Hz
The maximum displacement for this mode occurs in the lowerengine room stringer at Frames 174 and 177. Reference to the forcedvibration response to the axial force from the propeller indicates thatthis mode is not strongly excited by the longitudiml propeller force.However, it might be excited by vertical and longitudinal forces andmoments at the propellc r. The kingpost on the after side of the super-structure appears to show fore and aft resonances at this frequency.
console on36–ft flat
Mode 5: Frequency = 8.7 Hz
The maximum amplitude of vibration is at the main controlthe 26–ft flat. There also appears to be some motion on thein the same general region.
Mode 6: Frequency = 9.2 Hz
The maximum motion at this frequency is a lateral motion of
the kingposts This does not appear to be strongly excited by the axialpropelitr force, but might be excited by lateral and vertical forces.
Mode 7: Frequency = 10.2 Hz
The maximum motion associated with this mode occurs on the36-ft flat, Frame 170, centerline at the main control console. Thereis also significant motion in the framing in tbe lower engine room atFrame 170. This mode is quite strongly excited by the axial propellerforce.
Mode 8: Frequency = 10.8 Hz
This is the primary mode of the whole structure vibratingvertically against its restraints at the forward and aft bounding bulk-heads. The motion is accentuated at the 36-ft flat and in the kingposts.It includes bending in the side frames of the machinery space. As willbe shown later, this mode is excited by the axial propeller force. Itmight be more strongly excited by vertical forces and moments about atransverse axis at the propeller and on the hull.
Mode 9: Frequency = 12.3 Hz
The location of the point of maximum motion is again on the36-ft flat, Frame 170, centerline. The mot ion is vertical and although
.
97

the relative motion of the 36-ft flat is larger than for the previousnatural frequency (Mode 8), the remaining motions in the ship are smaller.
Mode 10: Frequency = 12.4 Hz
This is the primary mode of interest in which the propellerand shafting vibrate against the rest of the structure. This mode isstrongly excited by the propeller.
Mode 11: Frequency = 13.6 Hz
The mode shows the superstructure vibrating against the lowership side with small shaft motion.
Higher frequency modes are above 15 Hz and outside the rangeof interest. These modes will be discussed further in section (ej afterconsideration of the response of the structure to forced vibration fromthe propeller.
(d) Response of Substructure to Axial Harmonic Forces at Propeller
Using the substructure as modeled by 72 dynamic degrees-of-freedom,the response to an axial force at the propeller was determined. To avoidconfusion from spurious resonances, a moderate amount of hysteretic damp-ing was introduced (3 percent) . Some of the results are plotted in Fig-ures 41 through 47.
(e) General Discussion of Substructure Model
In these calculations, the substructure is taken to be supportedrigidly at the forward and aft engine room bulkheads, which are Frames157 and 181. Note from Figure 38 that the bulkhead at Frame 181 doesnot extend to the tank top. Because the substructure in reality is sup-ported by the elastic ship rather than the assumed rigid bulkheads, thenatural frequencies in which the whole structure participates will prob-ably be lower than predicted by these calculations. Also because of theflow of vibratory energy from the machinery space into adjacent struc-ture (and also incomplete damping) , the predicted amplitude of motionsarising from the longitudinal excitation from the propeller will be high.Therefore, Figures 41-47 indicate relative vibration amplitudes throughoutthe structure and are not the amplitudes predicted for the complete ship.The excitation from the propeller and on the hull in the vertical and hori-zontal planes is not considered since it acts outside the substructure.Many modes which are weakly coupled to the propulsion shaft system will bemore imuortant than the vibration excited by the axial forces at the pro-peller. ” All of these effects are includedship in Blocks 21 and 22.
The vibration analyst would probablyhas been generated as follows:
(1) There is a strong longitudinaltern. Its frequency at 12.4 Hz is about 17peller excitation at 10.6 Hz. However, it
98
and combined with the ccmplete
interpret the information that
vibration in the shafting sys-percent above the maximum pro-is a strong vibration with

160 -
120 -
80
40
6 7 8 9 10 11 12 13
FREQUENCY , HZ
I I I I I 1 1 I
60 70 80 90 100 110
PROPELLER , RPM
FIGURE 41. AMPLITUDE OF AXIAI NOTION AT
120 130
THE PROPELLER

AXIAL VIBRATIONOF THRUST COLLAR
. . IZu
FORE & AFT
VIBRATION OTHRUST BEAR
o I I
6 7 8 9 10 11 12 13FREQUENCY , HZ
I I I I I I I I
60 70 80 90 100 110 120 130
PROPELLER, RPM
FIGURE 42. AMPLITUDE OF FORE ANDTHRUST COLLAR AND
AFT VIBRATION AT PROPULSIONTHRUST BEARING FOOT

I I I 1 1
.
H-d
2
~ N ‘wr+
u 0
S’IIN ‘NOIJA??81A JO (TE3NIS) lCIIJ,I’IdNV
101

1-0N
10
9
8
7
6
5
4
3
2
1
0’
— FRAME 170 ~ , NULTIPLY ORDINATE BY 10
‘------------FRAME 165 ~ , NULTIPLY ORDINATE BY 10
‘— FFulMX170-210” (17.5’) OFF ~ , NULTIPLY ORDINATE
‘-— FRANE 165-276” (23’) OFF $, , NOLTIPLY ORDINATE BY
6 7 B 9 10 11 12 13
FREQUENCY , HZ
I I I I I I 1 I
60 70 80 90 100 110 120 13
PROPELLER , RPM
FIGURE 44. VRRTICAL VIBRATION ON 36-FT FLAT GBNERATEDBY AXIAL PROPELLER FORCE

8
6
4
2
0
—ATFRAME 170-~
............- AT Fw 17(3- 112,, (9,-411)OFF ~
r —-— AT FRAME 165 - 214” (17’-10”) OFF ~
6 7 8 9 10 11 12 13
FREQUENCY , HZ
I I I I I I 1 I
60 70 80 90 100 110 120 130
PROPELLER . RPM
FIGURE 45. VERTICAL VIBRATION ON 26-FT FLAT EXCITED BYAXIAL HARMONIC FORCE AT THE PROPELLER

50
40
30
20
10
0
AT THE CENTER LINE
--AT THE SHELL
‘\ INTERSECTION
\
\
I 1
180 175 170 165 160
FRAMR NUNBER
FIGURI 46. VERTICAL VIBRATION IN TANX TOP DUE TO LONGITUDINALEXCITATION AT THE PROPELLER AT 12,43 HZ
(Frequency of Longitudinal Shaft Resonance)
_.
S’lm ‘NOITVWIIA JO (TKNIS) XCI~I’IdNV

—.-
broad flanks, and its frequency will drop when introduced into the elasticship. It is lower than would have been expected from the preliminary cal-culation of Block 4, which would indicate that the foundation structure hastoo low a stiffness. This is borne out by Figure 46, which indicates alarge slope in the deflection curve of the bottom. It would appear thatan effective way of improving the stiffness would be to make the transversestructure between Frames 177 and 181 more rigid.
(2) The natural frequency of the whole engine room and superstruc-ture, Figure 43, fails at just about maximum speed. This frequency willdrop somewhat when incorporated in the elastic ship, but even so can beexpected to give some vibration difficulties. The amplitudes generatedby the longitudinal propeller excitation will probably be acceptable, butthis mode would be more strongly excited by propeller and hull force andmoments acting in the vertical plane. Raising the frequency above theoperating speed may be difficult when one recognizes that the predictedvalue at this stage will drop when the substructure is incorporated in theelastic hull. If raising the frequency appears desirable, it should beaccomplished by increased transverse stiffness at about Frame 165. See
Figure 47. The possibility of deepening the transverse bulkhead betweenthe 36-ft flat and the second deck to between the second and main decksmight be explored. It might also be well to make the web frame at Frame165 heavier.
(3) The natural frequency and mode-shape determinations show largemotions on the 26-ft and 36-ft flats. In particular, the 26-ft flat thatis the location of the Engine Control Console is a region where freedomfrom vibration is critical. It would be advisable to improve the finite-element model in these regions and to give some consideration to struc-tural modifications to lessen the vibrations.
2.3.19. Determine Natural Frequencies and Forced Response ofRudder. This study was not made in the original work and is not done inthis program. Generally rudders, even when in the air, have a low trans-verse natural frequency and thus generally have little influence on thehull vibration.
2.3.20. Evaluate Local Plating Design. This important aspectof good vibration analysis has not been treated in this program. Thisaspect of the vibration analysis can be handled most realistically if per-formed after the general vibration level in different regions of the shipis determined in Block 23.
2.3.21. Assemble Model of Entire Ship . It was the intentionof this program to carry the analysis through to a prediction of vibra-tion in the ship and to compare the predictions with measurements. Thecost and time of running the finite-element analyses of the MachinerySpace and Superstructure have precluded this.
Under this item,the finite-element analysis of the machineryspace and s{,nerstructure would be represented as a subsystem, System 4in the ori>inal ship model as shown in Figure 13. This subsystem wouldbe a beam with several sprung masses and would include the shafting sys-tem and longitudinal excitation at the propeller. With this Systern4
106

included, the whole ship would be properly represented as a damped, mass-elastic system excited by five component of propeller force and moment(torsional moments about the rotational axis are omitted) and six compo-nent of hull force and moment.
Although this ship is too complex and the excitation frequency
too high to give good reeults from a beam model, this model was an im-provement on the procedure in general use when it was developed in 1970.It is expected that the reeults would be reasonably confirmed by the trial
measurements since the critical regions of the machinery space and super-structure are accurately modeled. The connecting ship structure transmitsforcee and motione to this region and dynamically interacts at the boun-daries. The assumption is that the accuracy of these boundary reactionswill not too strongly influence the response in the critical regione.
2.3.22. Determine Vibration Amplitude and Stress Levels ofComplete Ship. As discussed under Section 2.3.21, it has not been possibleto accmnplieh this.
2.3.23. Conduct Shaker Teets. A ehaker test was made to de-termine the response at the thrust bearing without the propeller and shaft-ing connected. Although thie test could be used to verify the analysisprocedures, the data obtained were limited, and a modified substructuralmndel would be necessary to make the analytical study for comparison withthe test data. These tests will be considered under Block 27.
2.3.24. Asaees Local Vibrations, Structural Damping, and
Modeling Techniques. No work has been done in this design block.
2.3.25. Measure Vibrations During Sea Triale
and
2.3.27. Compare Measured Vibration with Calculations. Duringsea trials>the ship was observed to have heavy vibrationa of the followingtypes and locations:
(a) Longitudinal vibration of shafting and thrust bearing
(b) Vertical vibration on the 26-ft and 36-ft flata
(d Vertical vibrations in the cabin deck lounge overthe machinery casing
(d) Vertical vibration on the bridge.
Graphs of the data obtained in exploring these vibrationa arepresented in Figures 48 through 53. Figure 48 shows that the peak ampli-tude of fore and aft vibration had probably not been reached at 102 BFM.In Figure 49,the twice-blade frequency fore and aft vibration is plottedin an effort to determine the natural frequency of longitudinal vibration,The results are not very conclusive since tbe excitation at the low epeedrequired to define the resonance is low. However, the combination of
amplitude and phase shift (the phase is with respect to an arbitrary angle)
107

—–. --—---—
40
35
m+0 2C
1 I 1 I I 10308°
0 RECORD B (M41N DECK AFT, FULL POWER)
A ROLL 2, SHEET 1 (sTANDARDIzATIoN)Q 304”
n ROLL 2, 5HEET 2 (vAmAELE 5PEED)
O ROLL 1 (vARIABLE SPEED)
1 =J’&~ ~0 PEM VIBRATION
11
282°
284° ‘267”
II
278”
3000
I
o249”
I111~[,,
A236” Z3[+”
❑ 242°
A200°
290” ❑700 180° 207°
1A A.- “A , ,T,I 11
40 50 60 7U w Yu .Uu ..0
RPM
—,
FIGURE 48. DOURLE AMPLITUDE OF SIXrH ORDER,FORE AND AFT MOTION OF THRUST BEARING
FoUNDATION
108
—
2.8
2.4
2.0
1.6
1.2
0.8
0.4
0
I I t [ I 1
0 RECORD B (NAIN DECK AFT, FULL POWER)
A ROLL 2, SHEET I (STANDARDIZATION)
❑ RoLL 2, SHEET 2 (VARIABLE SPEED)
O ROLL 1 (VARIARLE SPEED)
055”
0 66”
0 16°
0348°
023°
A70°
347” nD42°39.0035’”
143” D
AA 261”A 339”
51”
A 218°I I I I I
❑ 86”
40 50 60 70 80 90 100 110
PROPELLER, RPM
FIGURE 49. IX)UBLEAMPLITUDE OF TWELFTH ORDER,FORE AND AFT VIBRATION ON THRUST BEARING FOOT
109
might be construed to indicate a resonance at about 75 RPM or 15 Hz, orpossibly at 14 Hz since the excitation force increases with the squareof the SIM. Figures 50 and 51 confirm the vibration on the 26-ft and 36-ft flats at the frequency of the primary structural resonance at about
10 Hz. This is reduced from 10.8 to 10 Hz by the flegibility of the sup-ports. Finally, Figures 52 and 53 also chow the primary vertical struc-tural resonance of about 10 Hz and the motion on the bridge, which is lessthan on the 26- and 36-ft flats.
On a subsequent ship, a shaker was mounted on a thrust-bearing
housing roughly bolted to its footing. The shafting was not connected.
The ship was incomplete, but had most of its machinery in place. It was
located in the fitting-out dock with little water under the keel. Themodel patterns along the bottom ~ at a number of frequencies are shown
in Figures 54 and 55. In Figure 56 the experimentally determined responseson the bridge (at Frame 164) and on the bottom at Frame 163 are shown.The tests were run in the evening at the fitting-out dock under pressureto complete the ship. It would have been helpful in interpreting the dataif the shaker had a circuit for providing a phase mark and if a few morereadings had been taken.
It appears that the fundamental 10.6 Hz superstructure reso-nance is moved dnwn to about 10 Hz by the larger water inertia of theshallow drafts. Since it is not strongly coupled with the shafting, itsomission is not strongly felt. On the other hand, the resonance which
appears at about 19.5 Hz probably corresponds in the bottom and the super-1
structure to the 12.4 Hz longitudinal shaft vibration mode without theshaft weight present.
2.3.26. Compare Measured Vibrations with Specifications.Although the measured vibrations were compared to the 1S0 whole body vi-bration standards, this comparison is not important to this evaluationof the computation procedures.
3. Procedure as Applied to a Large RO/RO Ship Design
A portion of the procedure outlined in this report was applied tothe analysis of the vibration of a triple screw roll-on/roll-off trailership designed by Sun Shipbuilding and Drydo ck Company. The studies weremade by Littleton Research and Engineering Corp. , working closely withMr. Hector McVey, project manager, and Charles Lofft. The program was anoutstand ing example of a good mutual interaction between ship vibrationanalysis and ship design. The ship’s dimensions are 945-ft overall length,875-ft length between perpendiculars, 105 .5-ft beam, 76.25-ft depth, and30-ft design draft. It is driven by a center and two wing propellers,each absorbing 50,000 rated horsepower at 155 RPM. Construction of theship has not been initiated, and so comparisons between predictions andmeasurements are not possible. The correlation between the sequence ofstudies recommended earlier in this report and those applied to the vibra-tion studies on this ship will be recognized by the brief summary of thereports generated in the course of the work. A listing of these reportsis contained in Appendix G.
110

+POR’I
1
I I 111111111,1180 175
II
lz+VF,RT+l+ VECTOR PHAS
- VECTOR PHAS
AMPLITUDE IN
26’-0” FLAT
FIGURE 50. VIBRATION ON 26-FT FLAT AT ABOUT 100 RPM

-. -- —...
.
ih 1
d-In
112

,
+PORT
m?,,21200
2.7
~97.
5.8
1 I180
~
4.?.100.+~..l P
130° 151.I
+VERT
k +FWD
+ VECTOR PHASE O“ + 90”—
- VECTOR PHASE 180° ~ 90”
AMPLITUOE IN MILS (O.001 INCH)
FIGURE 52. VIBFATION OF BRIDGE DECK AT ABOUT 98.6 RPM
, I

IJJl11.9232
6.1175. a, 2
I95.
+PORT
IL+vERT
+FND
+ vECTOR.PHASE 0° ~ 90”
VECTOR PHASE 180“ ~ 90“
AMPLITUDE IN MILS (Cl.001 INCR)
W9.7202.
S.2 6.51800 172°
FIGURE 53. vIBRATION OF BRIDGE DECK AT ABOUT 102 RI’M

2gHk

.

uz.
z0
. ..”/.. ”
./. . .
t“..
z0
wmg~
M
CNC-4
c

4. Discussion of Example Problem
In this chapter. it has been demonstrated that,with regard to thedesign of the Litton Industries, Ingalls Shipbuilding Division Unitedand Containerized Cargo Ship built for Farrell Lines, application of thefinite analysis computer techniques now available would have forewarnedof the following vibration difficulties experienced on the ship.
a. Longitudinal vibration of the propeller-shafting system. The
analysis of the machinery space-superstructure subsystem indicated anatural frequency of 12.4 Hz. The frequency could be expected to fallwhen the subsystem is incorporated with the remaining ship structure andis too close to the maximum operating speed. The difficulty occurs be-cause of coupling between the engine room double bottom modes and thevibration of the shafting system against the thrust bearing and.founda-tion and would probably not be discovered by a static analysis.
b. The fundamental frequency of the machinery space and superstruc-ture substructure in vertical vibration is 10.6 Hz. This frequency canalso be expected to decrease when incorporated with the remaining hullstructure. It coincides almost exactly with the blade frequency at fullpower and explains the heavy vibration on the 26- and 36-ft flats in theengine room, the vibration in the wheelhouse, and that in the passengerlounge.
c. The general vertical vibration levels in the ship are accentu-ated on the 26-ft and 36-ft machinery space flats. This was observed ontrials. Since the main machinery control console is located on the 26-ftflat, this is a particularly bad location for vibration.
Time and money limitations did not permit the substructure predic-tions to be refined and quantified by being incorporated into a structuremodel of the complete ship.
A listing of the reports presented to Messrs. McVey and Lofft ofSun Shipbuilding and Dry Dock Company in the course of the design devel-opment of a large RO/RO ship demonstrates how a portion of the designprocedure incorporating vibration analysis presented in this study was
applied tO a high -pOwered ship in which vibrations might be critical.Unfortunately, construction of this ship has not been initiated, so theaccuracy of the procedures cannot be assessed for this case.
Although the analysis of the machinery space and superstructure onthe Farrell Ship incorporates the best present techniques for predictingvibrations, its proposed combination with the remainder of the hull doesnot utilize the best presently available representations. It would bedesirable to complete the study with continuing emphasis upon making the
di ti t ti ll ibl

Detailed calculations compared with detailed measurements underoperating conditions and with shakers, comparable to the program carriedon by McGoldrick at DTMB in the late 1940’s and early 1950’s, would appeardesirable for developing confidence in vibration-prediction processes.

VI. CONCLUSIONS AND IU3COMNENDATIONS
1. Conclusions
This report has presented a recommended design procedure for theminimization of propeller-induced vibrations in hull structural elements.The procedure is general in that it is not dependent upon the ship’s size,
type, Or service conditions, and is intended to mesh with the overallship’s design process. The recommended procedure begins when the vibra-tion specifications are defined and continues until after the vibrationlevels are measured during the ship’s sea trials.
As presented, this recommended procedure is quite comprehensive andwould be expensive to apply in its entirety. Therefore, the designer maychoose to combine or eliminate some of the steps for the sake of economy.Such simplification can only be employed with great experience, and willbe accompanied by increased risk of vibration problems occurring in thefinal design. A trade-off risk versus savings naturally results. Eachdesigner must decide what part of this trade-off he is willing to accept.
Many conclusions pertaining to specialized parts of the design pro-cesses are contained in this report. Rather than reiterate them at thistime, it is felt that the following list of more general conclusions re-garding the entire procedure would be more beneficial to the reader:
The technical state-of-the-art appears to be suf-ficiently advanced so that ships can be designed tohave acceptable vibration levels.
Present-day ships are complex mechanical systemswhose successful design depends on extensive use ofcurrent analytical and experimental analysis methods.
It is highly unlikely that “cookbook” type of designprocedures can be developed and used successfully bythe general maritime industry.
The design process includes many specialized areasand requires the interaction of many individuals.It should be approached from a systems point-of-view,with equal emphasis given to propeller excitation andstructural response.
Any rational design procedure must, as a minimum,contain the following:
_..——

..-
A procedure for measuring actual vibration levelsduring sea trials .
2. Recommendations
Although the set of general conclusions stated that ships can becurrently designed to have acceptable vibration levels, there are certainareas which require additional research if the recommended procedures areto be improved. They are:
A study should be initiated to establish the relation-ships between the ship stern form to the wake and itsvariation, and the wake and wake var iations to thepropeller forces, hull pressure forces, and propellercavitation.
A study should be made to more fully understand theeffects of a working propeller on the nominal wakedistribution.
Efforts should be increased to refine analyticalmethods to predict hull pressures caused by cavi-tation.
A study should be initiated to establish guidelinesfor the acceptability of propeller-generated forcesand pressures based upon gross ship properties.
Additional work is needed in the area of propeller-rudder interaction. This includes improved predictiontechniques for both the propeller-generated forces andthe response of the rudder.
It would be desirable to apply the procedures presentedherein to a ship that has been built and is operating.
The designer of a ship should use discretion in the application ofthis procedure. This discretion should involve a review of each item ofthe process as applied to the ship. For a ship of low power, where vi-bration is rarely a problem unless there is a serious neglect in over-looking important factors that generate vibration, this review shouldgive consideration to propeller clearance and the flow of water to thepropeller, adequate support for the thrust bearing and reasonable supportfor outboard shafting. In ships that are similar to vibration-free shipsalready in operation, the items in the procedure should be checked be-tween the ships.

With powers rising above 30,000 shaft horsepower and with theopen structure characteristics of some of the recent roll-on/roll-offships, it is probably desirable to run through the complete program.For balance between the different elements of the procedure, it isprobably equally important for a vibration-free ship to have goodstructural studies as good hydrodynamic studies. If model studiesinclude measurements of the pressures on the hull from cavitatingpropellers, then an equivalent degree of structural vibration analysisin the form of a study of the dynamic response of the machinery spaceand of the superstructure will be warranted.
The recommendations by the British Ship Research Association ofchecking the vibration response of a ship under excitation by a shakerat the stage where the structure is completed, but before the joinerwork is installed, would appear to have some value for catching localresonances while it is inexpensive to correct them.
122

1.
2.
3.
4.
5.
6.
7.
8.
9.
10.
11.
12.
REFERENCES
Burnside, O. H. , Kana, D. D., and Reed, F. E. , “Bibliography forthe Study of Proueller-Induced Vibration in Hull Structural Ele-ments ,“ sSC-281,’ Final Technical Report on Projectment of Transportation, U. S. Coast Guard Contract61907-A, July 1978.
Hagen, A. , and Hammer, N. O. , “Shipboard Noise anda Habitability Viewpoint, ” Narine Technology , vol.ary 1969.
SR-240, Depart-No. DOT-CG-
Vibration from6, No. 1, Janu-
Reed, F. E., “Acceptable Levels of Vibration on Ships, ” MarineTechnology , Vol. 10, No. 2, April 1973.
1S0 Standard 2631, “Guide for the Evaluation of Human Exposure toWhole-Body Vibration, ” International Organization for Standardiza-
:QQJl, 1974.
—
The Society of Naval Architects and Marine Engineers, “AcceptableVibration of Marine Steam and Heavy-Duty Gas-Turbine Main andAuxiliary Machinery Plants, ” Technical and Research Code C-5,September 1976.
The Society of Naval Architects and Marine Engineers, “Code forShipboard Hull Vibration Measurements, “ Technical and ResearchCode C-1, January 1975.
The Society of Naval Architects and Narine Engineers, “Code forLocal Shipboard Structures and Machinery Vibration Measurements, “Technical and Research Code C-4, December 1976.
Van Oossanen, P. , and Oosterveld, M. W. C. , “Application of Theoryin the Optimization of Single Screw Container Ship, ” presented atthe International Symposium on Practical Design in Shipbuilding(PRADS) , Tokyo, Japan, October 1977.
Hoekstra, M. , “Prediction of Full Scale Wake Characteristics Basedon Model Wake Surveys,” International Shipbuilding Progress, Vol .22, No. 250, June 1975.
Odabasi, A. Y. , and Fitzsimmons, P. A. , “Alternative Methods forWake Quality Assessment, ” International Shipbuilding Progress,
Vol. 25, No. 282, February 1978.
Van Gent, W. , and van Oossanen,peller Loading and Cavitation, ”Drunen, Holland, May 1973.
The Societv of Naval Architects
P ., “Influence of Wake and Pro-Second LIPS Propeller Symposium,
and Marine Engineers, “Longitudi-
nal Stiffness of Nain Thrust Bearing Foundations, ” Technical andResearch Bulletin R-15, September 1972.
123

13. Kane, J. R., and McGoldrick, R. T. , “Longitudinal Vibration of
Marine Propulsion-Shafting System, ” Transactions, SNAMS, Vol. 57,pp 195-252, 1949.
14. Mott, I. K., and Fleeting, R., “Design Aspects of Marine Propulsion
Shafting Systems, ” Transactions, Institution of Marine Engineers,
June 1967.
15. Lewis, F. M. , and Auslaender, J. , “Virtual Inertia of Propellers,Journal of Ship Research, Vol. 3, No. 4, March 1960.
16. Reed, F. E., and Burnside, O. H., “Computer Techniques for Use inShip Hull Vibration Analysis and Design, ” Paper K, SSC and SNAM13Ship Vibration Symposium ‘78, Arlington, Virginia, October 1978.
17. Saunders, H. E., Hydrodynamics in Ship Design, SNANE, New York, 1957.
18. Kerwin, J. E., “Computer Techniques for Propeller Blade SectionDesign, ” International Shipbuilding Progress, Vol. 20, No. 227,July 1973.
19. Van Gunsteren, L. A. , and Pronk, C. , “Propeller Design Concepts,”International Shipbuilding Progress, Vol. 20, No. 227, July 1973.
20. Cox, C. G., and Morgan, W. B. , “The Use of Theory in Propeller
Design, ” Narine Technology , Vol. 9, No. 4, October 1972.
21. Cummings, R. A. , Morgan, W. B. , and Boswell, R. J. , “Righly SkewedPropellers, ” Transactions, SNAME, Vol. 80, pp 98-135, 1972,
22. Boswell, R. J. , and Cox, C. G. , “Design and Model Evaluation of aHighly Skewed Propeller for a Cargo Ship,” Marine Technology , vol.
11, No. 1, January 1974.
23. Lewis, F. M., “Propeller Vibration, ” Transactions, SNAME, Vols. 43and 44, 1935-1936.
24. Burrill, L. C. , “Calculation of Marine Propeller Characteristics, ”Northeast Coast Institute of Engineers and Shipbuilders, Vol. 60,1943-1944.
25. Hinterthon, W. B., “Propeller-Excited Vibratory Forces for the TankerSS ESSO Gettysburg Calculated from Wake Surveys,” Naval Ship Researchand Development Report 2870, August 1968.
26. Reed, F. E., and Bradshaw, R. T. , “Ship Hull Vibrations 11. Dis-tribution of Exciting Forces Generated by Propellers, ” CONESCOReport to Bureau of Ships, F-101-2, Index No. NS712-1OOST2, June1960.
27. Tsakonas, S. , and Jacobs, W. R. , ‘rDocumentation of a Computer Pro-gram for the Pressure Distribution Forces and Moments on Ship Pro-pellers in Hull Wakes, ” Stevens Institute of Technology, DavidsonLaboratory Report SIT-DL-76-1863.
124
28.
29.
.30.
31.
32.
33.
34.
35.
36.
37.
38.
39.
40.
41.
Brown, N. A. , “Periodic Propeller Forces in Non-Uniform Flow,“Massachusetts Institute of Technology, Department of Naval Archi-tecture and Marine Engineering Report 64-7, 1964.
Frydelund, O. , and Kerwin, J. E. , “The Development of NumericalMethods for the Computation of Unsteady Propeller Forces,” Sympo-sium on Hydrodynamics of Ship and Offshore Propulsion Systems, Detnorske Veritas, Oslo, Norway, March 1977.
Murray, M. T., and Tubby, J. E., “Blade-Rate Force Fluctuations ofa Propeller in Non-Uniform Flow.” Admiraltv Research Laboratory.. .ARL/M/P33A, June 1973.
McGoldrick, R. T., “Ship Vibration, ” Davidport 1451, December 1960.
Breslin, J. P. , “Techniques for Estimatingerated by Propel lers,” SNAlm Technical and1-34, January 1975.
Taylor Model Basin Re-
Vibratory Forces Gen-Research Bulletin No.
Van Oossanen, P. , “Theoretical Prediction of Cavitation on Pro-pellers, ” Marine Technology , Vol. 14, No. 4, October 1977.
Huse, E., “The Magnitude and Distribution of Propeller-InducedSurface Forces on Single-Screw Ship Model, ” Publication No. 100,Norwegian Ship Model Experiment Tank, December 1968.
Frivold, H. , “Solid Boundary Factors for the Afterbody of an LNGCarrier, ” Norwegian Maritime Research, Vol. 4, No. 1, 1976.
Vorus, w. s., “A Method for Analyzing the Propeller-Induced Vibra-tory Forces Acting on the Surface of a Ship Stern,” Transactions,SNAME, Vol. 82, 1974.
Yildiz, M. , and Mawardi, O. K. , “On the Diffraction of MultipleFields by a Semi-Infinite Rigid Wedge, ” Journal of the AcousticalSociety of America, Vol. 32, No. 12, December 1960.
Yildiz, M. , and Mawardi, O. K., “Diffraction of a Dipole Field bya Rigid Cone (Abstract) ,” Journal of the Acoustical Society ofAmerica, Vol. 32, No. 11, November 1960.
Johnsson, C. A. , “Pressure Fluctuations Around a Marine Propeller--Results of Calculations and Comparison with Experiment, ” SwedishState Shipbuilding Experimental Tank Report No. 69, 1971.
Breslin, J. P., and Eng, K. S., “A Method of Computing Propeller-Induced Vibratory Forces on Ships,” presented at First Conference
on Ship Vibrations, Stevens Institute of Technology, January 1965.
Tsakonas, S., Jacobs, W. R. , and Ali, M. R. , “Documentation forthe Computer Program for the Pressure Field Generated by a Pro-peller in a Variable Inflow,” Stevens Institute of Technology,Davidson Laboratory Report 1910, May 1977.
125

42.
43.
44.
45.
46.
47.
48.
49.
50.
51.
52.
53.
54.
55.
Vorus, W. S.,
Forces. Force“Calculation of Propeller-Induced Vibratory HullDistributions. and Pressures; Free-Surf ace Effects ,“
Journai of Ship Research, VO1. 20, No. 2, June 1976.
Johnsson, C. A. , “Correlation of Predictions and Full Scale Obser-vations of Propeller Cavitation, ” International Shipbuilding Pro-
-~ vol. 20, No. 226, June 1973.
Lewis, F. M. , and Kerwin, J. E., “Vibratory Forces on a SimulatedHull Surface Produced by Transient Propeller Cavitation, ” Journalof Ship Research, Vol. 22, No. 2, June 1978.
Takahashi, H. , and Ueda, T., “An Experimental Investigation intothe Effect of Cavitation on Fluctuating Pressures Around a MarinePropeller, ” 12th International Towing Tank Conference, Rome, 1969.
Van Manen, J. D., “The Effect of Cavitation on the Interaction Be-tween Propeller and Ship’s Hull,” International Shipbuilding Pro--, Vol. 19, No. 209, January 1972.
S4ntvedt, T. , “Propeller Induced Excitation Forces,” Det norskePublication No. J4, January 1971.
Van Oossanen, P., and van der Kooy, J., “Vibratory Hull ForcesInduced by Cavitating Propellers, ” Proceedings, Royal Institutionof Naval Architects, Vol. 115, 1973.
Johnsson, C. A., and S4ntvedt, T. , “Propeller Excitation and Re-sponse of 230,000 TDW Tankers, ” Swedish State Shipbuilding Experi-mental Tank Publication No. 70, 1972. Also presented at the NinthSymposium on Naval Hydrodynamics, Paris, August 1972.
Johnsson, C. A., et al. , “Vibration Excitation Forces from a Cavi-tating Propeller-Model and Full Scale Tests on a High Speed Con–tainer Ship,” Swedish State Shipbuilding Experimental Tank Publi-cation NO. 78, 1976.
Noordzij, L. , “Pressure Field Induced by a Cavitating Propeller, ”International Shipbuilding Progress, Vol. 23, No. 260, April 1976.
Lewis, F. M. , “Propeller-Vibration Forces in Single-Screw Ships,”Transactions, SNAME, Vol. 77, 1969.
Lewis, F. M., “Propeller Excited Hull and Rudder Force Measure–merits,” Massachusetts Institute of Technology, Department of OceanEngineering Report 73-10, April 1973.
Huse, E., “Cavitation -Induced Hull Pressures, Some Recent Develop-ments of Model Testing Techniques ,“ Norwegian Maritime Research,Vol. 3, No. 2, 1975.
Oosterveld, M. W. C., and van Oossanen, P. , “Recent Results ofTests in the NSMB Repressurized Towing Tank,” First Ship Technologyand Research (STAR) Symposium, Washington, D. C. , August 1975.

56.
57.
58.
59.
60.
61.
62.
63.
64.
65.
66.
67.
68.
69.
Norita, H. , Kuritake, Y. , and Yagi, H. , “Application and Develop-ment of a Large Ducted Propeller for the 288,000-dwt Tanker MSThOrsage, ” Transactions, SNAME, Vol. 82, 1972.
Okamoto, H., et al., “Cavitation Study of Ducted Propellers on LargeShips,” Transactions, SNAME, Vol. 83, 1975.
Dyne, G., and Hoekstra, M. , “Propulsion Cavitation and Propeller-Induced Pressure Fluctuations of a Tanker (Comparative Tests inSSPA Cavitation Tunnel No. 2 and NSM8 Repressurized Towing Tank) ,”SNAME, Spring Meeting, Philadelphia, Pennsylvania, June 1976.
The National Shipbuilding Research Program--Research on ComputerApplications to Shipbuilding VII, Catalog of Progrsm Abstracts,U. S. Department of Commerce, Msritime Administration, in coopera-tion with Avondale Shipyards, Inc. , May 1975.
Hananel, A. S., et al. , “Static and Dynamic Analyses of the LSES HullStructure, ” Journal of Ship Research, Vol. 22, No. 2, June 1978.
Larsen, O. C., “Some Considerations on Shaft Alignment of MarineShafting, ” Norwegian Maritime Research, Vol. 4, No. 2, 1976.
Reed, F. E., “The Design of Ships to Avoid Propeller-Excited Vibra-tions, “ Transactions, SNAME, Vol. 79, 1971.
Bureau Veritas Publications, Machinery Hull Interaction--Vibrations,Paris, France, 1975.
Volcy, G. C., Gamier, H. , and N.asson, J. C. , “Deformability ofthe Hull Steelwork and Deformations of the Engine Room of LargeTankers, ” published in Machinery Hull Interaction--Vibrations,Bureau Veritas, Paris, 1975.
Restad, K. , “Investigation on Free and Forced Vibrations of an LNGTanker with Overlapping Propeller Arrangement, ” published in ?fa-chinery Hull Interaction--Vibrations, Bureau Veritas , Paris, 1975.
Volcy, G. C. , Gamier, H. , and Mssson, J. C. , “Chain of Static andVibratory Calculations of Propulsive Plants and Engine Rooms ofShips, ” published in Machinery Hull Interaction--Vibrations, Bureau
Veritas, Paris, 1975.
Senjanovic, I., and Skaar, K. T. , “Phenomena of Ship Vibration, ” Detnorske Veritas Publication No. 88, May 1975.
Bureau Veritas, “Recommendations Designed to Limit the Effects ofVibrations on Board Ships,” Guidance Note, N.I. 138 BM.3E, May 1971.
Volcy, G. C., “Forced Vibration ofof the Propeller Shaft, “ publishedVibrations, Bureau Veritas, Paris,
1’27
the Hull and Rational Alignmentin Machinery Hull Interact ion--1975.

—
70.
71.
72.
73.
74.
75.
76.
77.
78.
19.
80.
81.
Bourceau, G., and Volcy, G. C., “Forced Vibration Resonators andFree Vibration of the Hull, ” published in Machinery Hull Interac-tions--Vibrations, Bureau Veritas, Paris, 1975.
Hylarides, S. , “Transverse Vibrations of Ship 1s Propulsion System,Part 1, Theoretical Analysis, ” International Shipbuilding Progress,Vol. 21, No. 252, August 1975.
Vassilapoulos, L. , and Bradshaw, R., “Coupled Transverse ShaftVibrations of Modern Ships,” International Shipbuilding Progress,Vol. 21, No. 239, ~uIY 1974.
Golden, M. E., and Henderson, F. M., “An Updated Guide to the Use ofGeneral Bending Response Program (GBRF),” Computation and ~thematicsDepartment Research and Development Report 4601, Naval Ship.Researchand Development Center, Bethesda, Maryland, April 1975.
Volcy, G. C., and Osouf, J., “Vibratory Behaviour of ElasticallySupported Tail Shafts,” published in Machinery Hull Interaction--Vibrations, Bureau Veritas, Paris, 1975.
Hansen, H. R., and Skaar, K. T., “Hull and Superstructure VibrationsDesign Calculation by Finite Elements, ” Det norske Veritas Publica-tion 86, January 1975.
Johannessen, H. , Skaar, K. T. , and Sunogeli, H. , “Dynamic Responseof Hull and Superstructure, ” presented at the International Sym-posium on Practical Design in Shipbuilding (PHADS), The Society ofNaval Architects of Japan, Tokyo, October 1977.
Carlsen, C. A. , “A Parametric Study on Global Hull and Superstruc-ture Vibration Analysis by Means of the Finite-Element Method, ”Paper Issued for Written Discussion, The Royal Institute of NavalArchitects, 1977.
Meyerhoff, I?.K., “Added Masses of Thin Rectangular Plates Calcu-lated from Potential Theory, ” Journal of Ship Research, Volume 14,No. 2, June 1970.
Lindholm, U. S., Kana, D. D., Chu, W. H., and Abramson, H. N.,“Elastic Vibration Characteristics of Cantilever Plates in Water, ”Journal of Ship Research, Vol. 9, No. 1, June 1965.
Marcus, M. S., “A Finite-Element Method Applied to the Vibration ofSubmerged Plates, ” Journal of Ship Research,1978.
Tsakonas, S. , Jacobs, W. R., and Ali, M. R. ,Unsteady-Lifting-Surface Theory to the StudyInteract ion,” Journal of Ship Research, Vol.1970.
Vol. 22, No. 2, June
“Application of theof Propeller-Rudder14, No. 3, September
128

82.
83.
84.
85.
86.
87.
88.
89.
90.
91.
92.
93.
94.
Tsakonas, S., Jacobs, W. R., and Ali, M. R. , “Propeller-RudderInteraction Due to Loading and Thickness Effects, ” Journal of ShipResearch, Vol. 19, No. 2, June 1975.
Leissa, A. W., “Vibration of Plates ,“ National Aeronautics and SpaceAdministration Publication NASA SP-160, Washington, D. C. , 1969.
Robinson, D. C., “Ship Vibration Beam Theory: Part I - A Review ofthe Theory, ” Report AVL-76-962, Acoustics and Vibration Laboratory,
Vibration Division, David Taylor Model Basin, Washington, D. C.,August 1965.
Jensen, J. J., and Madsen, N. F., “A Review of Ship Hull Vibration.Part I: Mathematical Mndels; Part II: Model ing Physical Phenomena;Part III: Methods of Solution; Part IV: Comparison of Beam Models, ”The Shock and Vibration Digest, Vol. 9, Nos. 4-7, April-July 197?.
Leibowitz, R. C. , and Harder, R. L. , “Mechanized Computation of ShipParameters, ” David Taylor Model Basin Report 1841, June 1965.
Volcy, G. C., Gamier, H. , and Nasson, J. C., “An Analysis of theFree and Forced Vibrations of Cargo Tank Structure by Finite-ElementTechnique, ” =, Heft 9, Hamburg, 1975.
Skaar, K. T. , “On the Finite -Element Stress Analysis of Oil TankerStructures, ” Norwegian Maritime Research, Vol. 2, No. 2, 1974.
Kamel, H. A., and Liu, D., “Structural Dynemic Probleme in Ships andOther Marine Structures, ” contained in Finite-Element Applicationsin Vibration Problems, edited by M. M. Kamel and J. A. Wolf, Jr. ,The American Society of Mechanical Engineers, New York, September,1977.
Egeland, O. , and Araldsen, P. O. , “SESAM-69 - A General PurposeFinite Element Program, ” Computers and Structures, Vol. 4, No. 1,January 1974.
Kumai, T., “Damping Factors in the Higher Modes of Ship Vibration, ”Reports of Research Institute for Applied Mechanics, Vol. VI, No.21, Kyushu University, Fukuoka, Japan, 1958.
Woolam, W. E., “Research on Ship-Hull Damping Coefficients for Low-Frequency Vertical Flexural Modes of Vibration, ” Acoustics andVibration Laboratory Research and Development Report 2323, NavalShip Research and Development Center, May 1967.
Volcy, G. C., and Nakayama, M. , “Studies Leading to Vibration andNoise Free Ships ,“ Bulletin Technique Du Bureau Veritas (SpecialEnglish Issue) , Bureau Veritas, Paris, June 19??.
Hart, H. H., “Hull Vibrations of the Cargo Liner lfoudekerk,”International Shipbuilding Progress, Vol. 18, No. 206, October 1971.
129

.—
95.
96.
97.
98.
99.
100.
101.
102.
103.
104.
105.
106.
107.
108.
Knopfle, W. H. , “Vibration Survey Techniques, ” Marine Technology,Vol. 8, No. 1, January 1971.
Kuhii, K. , “Ship Vibration Measurement and Analysis by Data Acqui-sition and Processing System, ” IHI Engineering Review, Special Issue‘71 Ships, Ishikawaj ima-Harima Heavy Industries Co., Ltd. , Tokyo,Japan, July 1971.
Solumsmoen, O. H., ,,ShiplJibratiOn - Experience from Service Mea-
surements, “ Det norske Veritas Publication No. 96, January 1977.
Okamoto, H. , “Reduction of Hull Vibration by Proper Selection ofPropeller Type and Stern Form,” Bulletin of the Marine EngineersSociety of Japan, Vol. 5, No. 2, June 1977.
Huse, E., “Effect of Afterbody Forms and Afterbody Fins on the WakeDistribution of Single Screw Ships,” Norges Skipsforskning-ins titut,Report R-31. 74, Trondheim, Norway, 1974.
..Huse, E., “Dber propellererregte Vibrationen auf Schif fen,” Hansa,No. 12, 1970.
Huse, E., “Trykkimpulser fra Kaviterende propell, ‘rNordiskt Skepps-tekniskt M6te (NSTM), 1971. (In Norwegian)
Lindgren, H., and Johnssen, C. A. , “On the Influence of Cavitationon Propeller Excited Vibratory Forces and Some Means of Reducingits Effect, ” presented at the International Symposium on PracticalDesign in Shipbuilding (P8ADS) , Tokyo, Japan, October 1977.
Johnsson, C. A. , “Stern Vibrations of High--Powered Ships,” FinalReport No. 1763-14, Swedish State Shipbuilding Tank, G6teborg,Sweden, August 1975.
Johnsson, C. A. , “Hydrodynamically Generated Hull Vibrations--ThePropeller as Excitation Source, ” Nordiskt Skeppstekniakt M6te (NSTM) ,Lyngby, Denmark, 1977. (Tn Swedish)
Sartor, T. J., and Giblon, R. P., “Farrell Linea ‘85’ - Class Con-tainerships, ” Marine Technology , Vol. 16, No. 1, January 1979.
Morse, P. M. , Vibration and Sound, McGraw-Hill Book Co., Inc. , 1948.
National Steel and Shipbuilding Company, ‘TIighly-Skewed PropellerResearch Program, San Clemente Ore/Bulk/Oil (OBO) Carriers, ” FinalReport to Maritime Administration on Contract 2-36315, November 1974.
Littleton Research and Engineering Corp. , “Measurement and Analysisof Harmonic Hull Pressures and Vibration Generated by Normal Pro-pellers on the Seabridge Class RO/RO Ships,” Report C-234-2 toAmerican Export Lines, November 1974.
130

A-1 .
1.
2.
APPENDIX A
COMPUTER PROGRAMS FOR COMPUTINGPROPELLER FORCES AND MOMENTS
Propeller Mean and Vibratory Forces Program
(Program developed by Davidson Laboratory, Stevens Institute of
Technology, under U.S. Navy contracts;
Output Information
Steady and time-dependent blade loadingof shaft frequency.
widely used.)
distribution at
Meanform
(a)
(b)
(c)
(d)
(e)
(f)
where
3.
4.
5.
1.
2.
P .
n=
d=
Blade
ind blade-frequency force and moment components infor:
Thrust /pn2d4
Torque/pn2d5
Transverse force/pn2d4
Vertical force/pn2d4
Transverse bending moment /pn2d5
Vertical bending moment/pn2d5
fluid density
propeller rpm
propeller diameter
multiples
coefficient
bending moments about the pitch line at various radial positionsand for various orders of excitation.
Information for the study of cavitation inception.
Information for the study of blade stress analysis which is per-formed by utilizing the STARDYNE-CDC finite element computer program.
Input Information
The propeller blade geometry,
The Fourier components of the spatial variation of the axial and tan-gential components of the wake.
131
Basis for Calculation
The program uses unsteady lifting-surface theory and takes into con-sideration all the relevant propeller geometry and the spatial nonuniformityof the inflow field. The program is available through Davidson Laboratoryfor $6,000. See Reference 27.
A-2 .
1.
2.
1.
2.
3.
less
Harmonic Forces and Moments Generated by a Propeller inNonuniform Flow
(Program developed and used by Littleton Research and EngineeringCorp.)
Output Informat ion
Magnitude and phase of the three components of harmonic propellerforce and the three components of harmonic propeller moment.
The steady vertical and horizontal forces and moments arising fromfirst-order wake action (thrust offset) .
Input Information
Propeller drawing. The propeller drawings should show the followinginformation: propeller diameter, hub diameter, rake, number of bladesand propeller material; the variation with radius of chord j skewback,and pitch; propeller sections at several radii showing the variationof thickness along the chord. For propellers designed in Europe, thevariation with radius of the distance from the reference line to theleading edge, trailing edge, and point of maximum thickness is accep-table in place of the variation of chord and skewback.
Ship speed and corresponding shaft rpm.
Wake as measured in a model test. The results of a harmonic analysisof the measured wake are required. If the harmonic analysis resultsare not available, the measured inflow velocities specified at sev-eral points along the radius and at frequent points around the cir-cumference are acceptable, and a harmonic analysis will be performed.
If a measured wake is not available, it can be inferred from theavailable wakes of other ships.
Basis for Calculations
Propeller forces are determined by lifting line theory. This is much
comnlex than the Davidson Laboratory lifting surface theorv, but isconsidered adequate in view of uncertain~ies in the wake and the wide vari-ation in service wake due to ship motions and sea action. The main reason
for continuing to use the lifting line theory calculation is that it is the>asis for the predictions of hull pressure and hull forces (see AppendixB-1) .
132

A-3 .
1.
2.
1.
2.
This is a proprietary program not developed for general distribution.
Calculation of Steady and Harmonic Propeller Forces
(computer program used by the American Bureau of Shipping. )
Output Information
Mean and blade-frequency components of the three forces and three mo-ments acting on the propeller.
Time-varying blade pressure distribution at each wake harmonic.
Input Information
Propeller blade geometry.
Fourier coefficients of the spatial variation of the axial and tan-gential components of wake.
Basis of Calculation
The program employs an extended version of unsteady lifting linetheory as developed by Dr. Neal A. Brown at MIT [28]. The extension in-cludes the effects of propeller skew, which were not treated in the origi-nal theory. The results of this program are used as partial input to the“Surface Force” program described in Appendix B-3.
A-4 . Harmonic Forces and Moments Generated by a Propeller inNonuniform Flow
(A computer program under development at Massachusetts Institute ofTechnology by Professor Justin E. Kerwin, Department of Ocean Engi-neering. )
The program represents the propeller blade by grid points distributedover the surface and the wake spatially defined (cylindrical coordinates)in three directions: longitudinal, tangential, and radial. A distributionof vorticity is assumed over the surface, and by successive iterations iarefined to be compatible with the boundary of the propeller surface and thelaws of hydrodynamics, Kelvin’s theorem, and the Kutta requirement for flowcontinuity at the trailing edge.
This discrete element approach appears to offer a number of advantagesas a starting point for the computation of unsteady, partially cavitatingflows:
(a) It is capable of yielding accurate predictions of meanloading, both at design and off-design conditions.
(b) Being a numerical procedure, blade geometry can be incor-porated exactly so that propellers with large skew, rake,
133

-
(c)
(d)
(e)
and varying pitch distribution can be accommodated. Thisis considered essential, since it is through the variationof these parameters that optimum propeller designs can beevolved.
Since the procedure includes all three components of in-duced velocity, there is no particular problem in includingtangential and radial wake field components.
Since no loading mode functions are employed, the modifi-cations ultimately required to include the cavities wouldappear to be feasible. Source elements presently includedto represent blade thickness can assume the further roleof representing the cavity volume.
A discrete element method lends itself naturally to a step-by-step domain solution, which is also essential for thesubsequent inclusion of unsteady cavitation.
The procedures are still under development, but have been applied tospecific cases with good results. See References 18 and 29.
A-5
1.
2.
3.
4.
1.
2.
3.
Harmonic Forces and Moments Generated by a Propeller inNonuniform Flow
(Computer program developed and used by the Admiralty ResearchLaboratory, Teddington, England. )
Output Information
The input data.
If wakes are givenprinted (to the 71are listed.
as velocity measurements, the harmonic values areharmonic) . If given as Fourier components, these
The contribution to thrust, torque, vertical and horizontal forces,and moments from each specified radial section.
The integrated thrust, torque, horizontal and vertical forces, andmoments for multiples of blade rate harmonics.
Input Information
Shaft speed.
Propeller geometry, including skew, chord length, blade pitch angleat specific radii.
Wake, either in Fourier Series, amplitude-plus-phase form, or asequally spaced measurements of wake at the radii where the propellergeometry information is given. Only axial or both axial and tan-gential wakes may be specified.
134

4.
5.
6.
7.
8.
Calculations can be run for successive
Input radii may vary from 4 to 14.
skew values.
As many as 20 skew configurations may be determined.
As many as 140 harmonics of the blade frequency forces may be cal-culated, but generally the number is limited to 10.
As many as 100 wake harmonics and 200 wake measurements per radiusmay be input.
Basis for Calculation
The calculation of the fluctuating forces on a propeller falls into—. .
three parts. ‘l’hefirst part is the calculation of the variation of the in-flow velocity to the blades; the next stage involves the calculation of thefluctuating lift-distribution on a section of blade associated with thisfluctuating inflow; the final stage is the calculation of the propellerforces and moments. The calculation of the fluctuating lift is based ontwo-dimensioml unsteady airfoil theory. It ignores blade-to-blade inter-action and the variation with radius of the various significant parameters.These approximations would be unacceptable for predicting the steadv lift.but are acceptable for the unsteady iift, probably overe~timating tie lif~.See Reference 30.
135
APPENDIX B
COMPUTER PROGRAMS FOR COMPUTING HULLPRXSSURES AND FORCES
B-1 . Calculation of Harmonic Forces and Moments on the HullGenerated by Propeller Action
(Program developed and used by Littleton Research and EngineeringCorp.)
Output Information
1. The harmonic hull surface pressure at blade-rate frequency generatedby the loaded, noncavitating propeller in the region of the propeller(generally at grid points corresponding to underwater intersectionsof buttocks and frames within four diameters of the propeller) .
2. By integration of the above, the blade frequency harmonic hull forcesand moments acting on the hull due to noncavitating propeller action.
Input Information
1. The computed propeller lift distribution along the propeller blade(see Appendix A-2) .
2. The geometry of the propeller.
3. The hull coordinates at the points of pressure determination.
Basis for Calculation
The free-field pressures (i.e., the pressures that would exist inopen water if the hull were not present) are calculated at each hull gridpo~.ntdue to (1) the loading on the propeller blades (assumed to be concen-
trated at the forward quarter point of the blade chord), (2) the thicknessof the propeller blade. The sum of these two pressures, in their properphase, is multiplied by two to give the reported pressure on the hull sur-face. The pressure from a harmonically varying force having x, y, and zcomponents involves the distance from the point to the location of the force.Substituting steady and harmonic forces and distances as a function of shaftangle yields values of the pressure. The resulting equations involve a se-ries which under certain conditions converges slowly. Originally. only afew terms were developed. More recently. the general term has been developed,
allowing sufficient terms to assure convergence. This results in pressures
that correspond to measured values. The integration for blade thickness issimilar. If the cavitation volume on the blade could be defined by a Four-ier series, the same process could be applied. This has not yet been done.
This is a proprietary program not developed for general distribu-tion. See Reference 26.
136

B-2. Calculation of Steady and Harmonic Pressure Fields Generatedby a Noncavitating Propeller
(Program developed by Davidson Laboratory, Stevens Institute ofTechnology, under U .S. Navy contracts. )
Output Information
This program furnishes the steady and harmonic components of the pres-sure field generated by a noncavitating ship propeller operating in a spa-tially variable inflow.
Input Information
1. The propeller blade geometry,
2. The Fourier components of the spatial variation of the axial andtangential variation of the axial and tangential components of thewake.
3. The spatial location of the points where the pressures are desired.
4. The steady and time-dependent blade loading distribution at multiplesof any shaft frequency as produced by the program described in Appen-dix A-1.
Basis for Calculation
This program is a continuation of the one described in Appendix A-1and requires data generated in that program. It is available through David-son Laboratory for $5,000. See Reference 41.
B-3. Calculation of Propeller-Induced Hull Surface Forces
(Program developed and used by Professor William S. Vorus (Universityof Michigan) and the American Bureau of Shipping. )
Output Information
This program computes all components of the hull force and moment atmultiples of the propeller blade rates. (In general, the vertical force
component is the only one desired. )
Input Information
1. Propeller geometry.
2. Wake distribution.
3. Stern lines and coordinates describing the sectional geometry of
aPPrOxi~tely the aft one-third of the ship.
137

4. Time-dependent geometry of propeller cavitation effects (optional).
5. Time-varying blade pressure distribution at each wake harmonic (out-put from program described in Appendix A-3) .
Basis of Calculation
This program employs the method presented by Professor William S.Vorus in Reference 36 . The conventional procedure of evaluating the hullforces is to integrate the propeller-generated pressures over the hull sur-face. These pressures are due to diffraction of the propeller-induced waterflow by the hull. The diffraction problem and hence the pressure integrationdifficulties are avoided in the analysis and computer program by utilizing aspecial application of Green’s Theorem.
138

APPENDIX C
COiVIllTERPROGR4MS FOR COMPUTING THE LONGITUDINALRESPONSE OF THE PROPULS ION SHAFTING
c-1. Longitudinal and Torsional Shafting Vibrations
(Program used by Maritime Administration. )
Number and/or Name
**c-9-002
Category(s)
**Hull Shafting Calculations
Descriptive Program Title
**Shaft Vibrational Analysis using Holzer Method
Source Activity
**Office of Ship Construction
*Wfaritime Administration**Washington, D.C.
Engineer (s) Name-Code-Phone
**Richard Siebert, 721.21, 254-7048
Programmer Name-Code-Phone
**NAVSEC
Program Status
**prod”ctiOn
Classification (Security)
*,~Restricted - NAVSEC Program
Programming Language
**FORT~ IV
Computer Type Used
**Control Data 6600
139

Special Hardware
ir*N~ne
Special Hardware/Operation
**N~ne
Program Size-Source Deck Cards
**258
Program Size-Object Core Words
**(J~oooo octal WOrd~
Average Running Time (Min)
**2.57
Program Availability
**September 1970
Documentation Status
**Informal - Complete (15 pages)
Program Abstract
This program calculates torsional and longitudinal critical vibrationfrequencies using the Holzer Method. It was originally developed by NAVSECfor the IBM-7090 and subsequently converted to the CDC-6600 by the MaritimeAdministration. Double precision requirements were eliminated. Input re-
quires hand calculation of all masses, inertias, and stiffness factors foreach component in the turbine- gear-shaft-propeller system. Damping factorsare not included in the calculation. Output consists of critical frequenciesin CPS and RPM for various numbers of blades.
c-2. Longitudinal Shafting Vibrations
(Program used by J. J. McMullen Associates, Inc.)
Number andlor Name
**F_8_OIJg
Category(s)
*Wachinery Shafting and Bearing Calculations
140

Source Activity
**JOhn J . M~Mullen A~~~ciate~, 1nc .**One world Trade center-suite 3047
**New York, New York 10048
Engineer(s) Name-Code-Phone
**Engineering Division
Program Status
**prOdu~tiOn
Classification (Security)
**Uncla~~ified
Programming Language
**FORTRAN IV
Computer Type Used
**IBM 360/40 ~nd IBM 11313
Documentation Status
**InfO~al _ u~c.r,~ Guide
Program Abstract
Lumped mass system, using “level” effect. Text description found in
NSRDC Report 3358, September 1970. Computes frequencies up to four modes.
c-3. Longitudinal and Torsional Shafting Vibrations
(Program used by Newport News Shipbuilding and Drydock Company. )
Number and/or Name
**F_@O16 9.5.0251 FORCE VIB
Category(s)
**wchinery Shafting and Bearing Calculations
Descriptive Program Title
**LOngit~dinal ~nd TOr~iOnal Vibration in Propulsion
Shafting Systems
141

Source Activity
**Newport News Shipbuilding and Drydock Company**Technical Systems Division**41oI Washington Avenue, Newport News, Virginia 23607
(804) 247-7500
Engineer (s) Name-Code-Phone
**A. S. pototzky
PrograrcunerName-Code-Phone
**F. E. Siegel
Program Status
**Acti~e prOdu~tioO
Classification (Security)
**Uncla~aified
Programming Language
**FORTRAN IV
Computer Type Used
**Honeywell 6080
Program Availability
**N~t ~“ailable for general
Documentation Status
**Incomplete
Program Abstract
distribution
FORCE VIB is a computer program to calculate the steady-state longi-tudinal or torsional vibratory response of branched ahafting ayatems, suchas propulsion systems. The systen may have a maximum of 35 elements con-sisting of masses, dampers, and springs, all with only one degree of free-dom. The masses and springs may be lumped or distributed, and the dampers
maY be viscous or solid. The program uses the mechanical impedance methodto calculate displacements, forces, and phase angles, which may all be fre-quently dependent. The program also allows the varying of values to conductparametric studies.
142

c-4 .
1.
2.
3.
1.
2.
3.
4.
5.
.
Longitudir.al Vibration of Shafting, II
(Progran developed and used by Littleton Research and EngineeringCorp.)
Output Information
A plot of the blade–order harmonic force at the thrust bearing as afunction of rpm.
A plot of the amplitudes of axial motion at the propeller and at thethrust bearing as a function of rpm.
Tabular data for above.
Input Information
Shafting arrangement, diameters, and lengths.
Propeller mass, diameter, number of blades, pitch, and developedarea ratio (or mean width ratio) .
Harmonic thrust (can be determined by program described in AppendixA-2) .
The stiffness of the thrust bearing and its foundation.
Reduction gear weight.
Basis for Calculation
The propeller is represented by its mass plus entrained water anddamping, estimated by Lewis and Auslaender’s recommendations. The shaft isrepresented by a distributed mass and elasticity and is assumed to have ahysteretic damping (nominally 4%) . The thrust bearing is represented as aconcentrated mass elastically connected to a rigid hull.
This is a proprietary program not developed for general distribution.
143

APPENDIX D
COMPUTER PROGRAMS FOR COMITJTING THE LATERALRESPONSE OF THE PROPULSION SYSTEM
D-l . Transverse Response of a Beam
(Program used by Newport News Shipbuilding and Drydock Company. )
Number andlor Name
**A-12-130 9.5 .133f11Beam vibration
Category(s)
**conc~pt~~l J)esign
**Ship vibrations
Descriptive Program Title
**Vibration Analysis of Beams
Source Activity
**Newport News Shipbuilding and Drydock COmpany**produ~tion COmp”ter Systems Di”ision**411)1Wa~hingtOn Avenue, Newport News, Virginia 23607
(804) 247-7500
Program Status
Classification (Security)
**Uncla~sified
Programming Language
**FORTRAN v
Computer Type Used
**Honeywel 1 6080
Special Hardware
**N~ne
144
Program Availability
**NOt available for general distribution

Program Abstract
Computes the steady-state transverse vibratory response of a beam withany number of intermediate flexible supports, with generalized end condi-tions, section properties, and loading.
D-2 .
1.
2.
3.
4.
5.
1.
2.
3.
4.
Transverse Vibration of Shafting and Propeller
(Program developed and used by Littlet.n Research and Engineering
Corp.)
Output Information
Plots of bearing forces, in two normal directions, as a function offrequency.
Plots of shaft motions, in two normal directions, as a function offrequency, at the propeller and at other critical locations.
Plots of the shaft deflection curves at each natural frequency with-in the operating speed.
Plots of the steady plus harmonic bending moments in the shaft ofthe aftermost bearing.
Computer tables for above.
Input Information
Shafting arrangement, diameters, and lengths .
Propeller weight and moment of inertia about its rotation axis, diame-ter, number of blades, pitch, and developed area ratio .
Stiffness or flexibility matrices for each bearing about axes perpen-dicular to the axis of rotation (force and rotation) .
Horizontal and vertical harmonic forces and moments, and the steadythrust (can be determined by the program described in Appendix A-2) .
Basis for Calculations
The propeller is represented by its mass, its entrained water, itsmoment of inertia about the rotational axis, its moment of inertia about anaxis perpendicular to the rotational axis, the moment of inertia of its en-trained water, and the hydrodynamic damping in its several modes of motion.The shaft is represented as a series of uniform beams having distributedmass and bending stiffness and hysteretic damping. The bearings are repre-
sented by their stiffness in translation in two directions mutually perpen-dicular to the shaft axis and by their stiffness in rotation about the sametwo axes. The bearings are assumed to bend with the shaft; however, where
there is flegibility between shaft and bearing, e.g. , rubber staves, thisflexibility, lateral and angular, is incorporated in the strut matrix. It
145

is generally acceptable to terminate the shaft at the after inboard line-shaft bearing.
The program computes the vibration in terms of coupled properties inthe horizontal and vertical directions. It includes the influence of the
steady thrust (small effect) , but not that of the steady torque (very small)
This is a proprietary program not developed for general distribution.
146

APPENDIX E
CONPUTER PROGRAMS FOR COMPUTING THE RESPONSEOF THE ENTIRE HULL GIRDER STRUCTUF!l
E-1. General Bending Response Program
(Program developed and used by Naval Ship Research and DevelopmentCenter. )
Name
**GFjRp
Category(s)
**Lateral, Longitudinal, and Torsional Beam Vibrations**Bending coupled with T~r~iOnal Beam vibrations
*Whirling Vibrations of Propeller Shafts
Descriptive Program Title
**General Bending Response Program
Source Activity
**Naval Ship Research and Development Center
**Bethesda, Maryland 20084
Engineer(s)
**Michael E. Golden**Francis M. Henderson
Program Status
**A~ti~e p~od~ction
Classification (Security)
**Un~la~~ified
Programming Language
**FORT~ IV
Computer Type Used
**CDC 600(3series
Output Plotting
**SC 4ozo plOt~
147

Special Software/Operation
**OverIaY~ for program Subroutines
**open Core to Optimize Storage
Program Availability
**Availability for gener-l distribution through David Taylor Naval
Ship Research and Development Center
Documentation
**c~@ete
Program Abstract
The General Bending Response Program (GBRP) consists of the union ofthree programs: General Bending Response Code 1 (GBRC1) for lateral, longi-tudinal, and torsional vibrations; GBRC2 for vibrations involving bendingcoupled with torsion; and GBRC3 for whirling vibrations of propeller shafts.The latter two codes resulted from an extended application of the mathemati-cal model used in the first code. The program formulates the finite-differ-ence equations which approximate the boundary-value problem representing thesteady-state motion of a vibrating nonuniform mass-spring system such as aship hull or shafting in bending. The program calculates natural frequenciesand mode shapes and the response to specified harmonic driving forces andmoments. The program can represent a ship hull connected elastically to othersystems such as the propulsion system and to sprung maases. Longitudinal ortorsional vibrations problems can also be solved by dividing each beam intosections connected by springs, thus reducing the model to a mass-spring sys-tem. See Reference 73.
E-2 . Ship-Hull Vibratory Response
(Program used by USS Engineers and Consultants, Inc.)
Number andlor Name
**A_12_Ofj6 SHRVS
Category(s)
**conceptual Design**Ship vibrations
Descriptive Program Title
**Simulated Ship-Hull Vibration
148

Source Activity
**us S Engineers and Consultants, Inc.**600 Grant Street**Pittsburgh, Pennsylvania 15230
Engineer (s) Name-Code-Phone
**F. Ronald Griffith(412) 433-6517
Program Status
**Product ion
Classification (Security)
**Unclassified
programming Langua~
**FORT~ I“
Computer Type Used
**CDC fj50(j
Special Hardware
**NOne
Special Software/Operation
**None
Program Size-Source Deck Cards
**4,000 cards
Program Size-Object Core Words
**160K Octal Words
Average Running Time (Min)
**3 minutes
Program Availability
**Time Sharing ServiceCall F. R. Griffith
149
**N~g~tiable
Documentation Status
**Inf~mal c~mplete
Program Abstract
The purpose of SHRVS is the accurate prediction of the vibration
response of a ship hull to either steady-state or transient loads appliedin the vertical centerline plane of the hull. Factora considered include
cargo distribution, bulkhead location, machinery space location, aa well aathe flexural and shear stiffness of the main-hull girder and of the double-bottom structure.
150

—
I
151

APPENDIX F
LONGITUDINAL , TANGENTIAL, AND AXIAL WARES FOR THECONTAINERIZED AND UNITIZED CARGO SHIP ANALYZED
IN CHAPTER V
N c m 0 -3 N C-44“ 4“ 0“ 0“
00“ & +
SOILVR ,LN21NOdlI03AL130’IIA
0C3C-J
0N!+
0u
0
152

—
I I I I I I I
w
d“ i -. u CN ml0 0“ & 0“ 0 y“
SOIIVllJ,N1NOCIN03 AJ,1301HA
153

I I I I I I
0%1
0C9
~ OOO(-J. .
6 Ill
t
4ti
040
000
00% 00
$!$loa
I I 1 I I
ITCN.
mNIIL=-
154
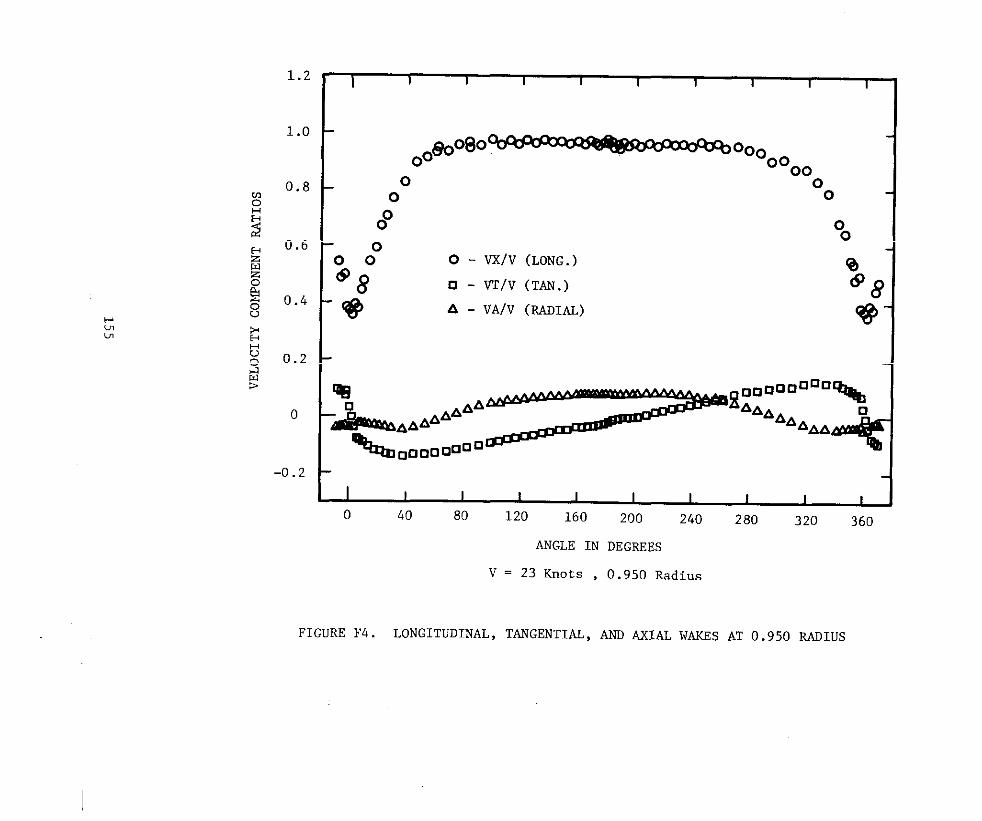
l’-LJLr
1.2
1.0
0.8
0.6
0.4
0.2
0
-0.2
I 1 I I 1 I 1 I I I
Oogooeo ~ooo0000
00
00
0 - vx/v (L.ONG.)Q)
O - VT/V (TAN.) @a
A - VA/v (RADIAL) *
JI I I I 1 I I I I I Io 40 80 120 160 200 240 280 320 360
ANGLE IN DEGREES
V = 23 Knots , 0.950 Radi~~
I
FIGURE F4. LONGITUDINAL , TANGENTIAL, ANO AYIAL WAKES AT 0.950 RADIUS

1.2
1.0
0.8
0.6
0.4
0.2
0
-0.2
I I I 1 I I I I I I
~odf-000000000 duaRQQ900@oo@~o
%00%
o 00
00
0 - WV (LONG.) 0050 u - VT/V (TAN.)
o O“ A - VA/V (RADIAL)o
00 Oco: 0$
~ $
I I 1 I 1 I I I I I
o 40 80 120 160 200 240 280 320 360
ANGLE IN DEGREES
V = 23 Knots , 1.100 Radius
FIGURE F5. LONGITUDINAL, TANGENTIAL, AND AXIAL WAKES AT 1.100 RADIUS

APPENDIx G
Rept.~
I
II
III
Iv
v
SUMMARY OF VIBRATION STUDIES CONDUCTED BY LITTLE TON KESEARCHAND ENGINEERING CORl . FOR AN RO/RO TRAILER SHIP DESIGNED BY
SUN SHIPBUILDING AND DRYDOCK COMPANY
Title
Vibratory Propeller Forces,Hull Pressures and Forces,and Propeller Stresses ofa Trailer Ship
Longitudinal and TransverseVibration of Shafts, SunTrailership, Hull 665
Transverse Vibration ofShafts, Raked and Unraked
Struts, Sun TrailershipStruts
Calculated Static Stiff-nesses of Thrust BearingFoundat ions and Longitudi-nal Vibration of Shafts,Sun Trailership, Hull 665
Frequencies and Mode Shapesof Shafts and the MachinenSpace, Sun Trailership,Hull 665
Summary
Report of computation of propellerforces transmitted to shafts, hullpressures, and hull forces for cen-ter propellers and wing propellershaving 4, 5, and 6 blades.
Natural frequencies of ~ and wing
shafts in longitudinal vibration as
a function of combined thrust bear-ing foundation stiffness . Resonantfrequencies of ~ and wing shafts
in vertical and transverse vibra-tion. Hull assumed rigid, strutstiffness in translation and rota-tion included, bearing fluid filmassumed rigid.
Studied the effects of changes inshaft diameter on lateral frequency.Considered the influence of strutrake on vertical and transverseresonant frequencies
Determined the static stiffness ofthe foundation of the ~ and wing
thrust bearing foundations using afinite element analysis of theengine room structure. Using thesestiffnesses and a stiffness of thethrust bearing, the natural fre-quencies of ~ and wing shafts werecomputed.
Using a dynamic finite-element rep-resentation of the shafting andadjscent hull structure, the shaftvibration of the

Rept.No. Title
v
VI Calculated Propeller In-duced Vibration Levels,
Sun Trailership, Hull 665
VII
VIII
IX
Effect of Center ThrustBulkhead Stiffening onLongitudinal Shaft Fre-quency, Sun Trailership,Hull 665
Effect on Relocating theCenter Thrust Bearing onthe Longitudinal ShaftResonance, Sun Trailership,Hull 665
The Effect of DesignChanges Upon the ResonanceFrequencies of PropulsionShafts, Sun Trailership,Hull 665
Summary
those determined under the rigid-hull assumption. Longitudinal vi-bration frequencies of the ~ andwing shafts are determined. It isfound that the fundamental frequen-cies are not much changed from thoseobtained using static stiffness, butthat new frequencies of importanceare introduced.
The vibration levels throughout theship are predicted. Levels arereasonable by 1S0 standards in themachinery operating stations and inthe crew quarters low in the hull.However, they are excessive in thehouse. Frequencies of peak ampli-tudes generally coincide with shaftresonance frequencies.
Several thicknesses of the longi-tudinal bulkheads supporting the~ thrust bearing are studied to
determine the influence on longi-tudinal natural frequency.
In an effort to increase the nat-ural frequency of longitudinal vi-bration of the ~ propeller shaft
system, the effect of moving thethrust bearing aft is studied.This modification is found to bemore effective than increasing thescantlings of the thrust foundationstructure.
The design changes are made in an
attempt to bring the shaft reso-nance above the blade frequenciesof a 5-bladed ~ propeller and 4-
bladed wing propellers. Structuralchanges such as increasing thick-ness of a longitudinal bulkhead,adding a transverse bulkhead in-

Rept.No.
x
XI
XII
XIII
XIV
xv
XVI
Title
Guide for Response Output
Interpretation, Sun Trailer-ship, Hull 665
Effect of Stern BearingLocation and Strut Rake onCenter Shaft Vertical andLateral Vibration, SunTrailership, Hull 665
Center Shaft and StrutVibrat ion Study, SunTrailership, Hull 665
Wing Shaft and Strut Vi-
bration Study, Sun Trailer-ship, Hull 665
Vibration Evaluation ofBuilt-up Struts, SunTrailership, Hull 665
Vibration Evaluation ofAlternate Strut Designs,Sun Trailership, Hull 665
Static Deflections andStresses, Sun Trailership,Hull 665
summary—.- —___
Users’ Guide
Using the simple shaft.i.ngmodel,several alternative pr0c2sses forchanging the transverse frequencywithout changing the vertical fre-quency are explored.
By reducing propeller overhang,moving the struts aft on the bar–rel, stiffening ‘thehull, and i,,–creasing the strut thickness andchord with tapering, it is possibleto locate the vertical and trans–verse frequencies of the centerlineshaft at desirable values.
It is shown that a combination ofscantlings and rake for the wingpropeller struts can result inacceptable resonant frequencies .The addition of a transverse bulk-head to avoid internal hu].1reso–nance is recommended.
Previous studies ha”e been basedon solid cast steel struts . Because
of procurement difficulties, fabri-cated struts are of interest. suit-able built-up struts are determined.
The design of the struts was shownin previous studies to have a stronginfluence on the shafting resonantfrequencies . This study investi-gated the effects upon natural fre–quency of changing strut rake anddifferent rakes in each of the strutarms.
Use is made of the finite.elementmodel, developed for dynamic analy–sis, to compute the hull.deflections

,..
Rept.& Title Summary
XVII Calculated Propeller Induced This is the final update of the
Vibration Levels, Sun whole hull vibration level predic-Trailership, Hull 665 tion. As a consequence of the
attention given in the shaft reso-nances, the vibration level at de-sign power is at a minimum withpeaks below and above. Althoughthe vibration at the lower peakwould not be acceptable under con-tinuous operation, this frequencyis at a speed which would,be seldomused.
4u. s. GOv ERNME. T ,R,NT\NGOFFICE: 1979.311-586,25,

.QIIPRESEARCH COMMITTEEMaritime Transportation Research Board
National Academy of Sciences-National Research Council
********
The Ship Research Committee has technical cognizance of theinteragency Ship Structure Committee’s research program:
Mr. O. H. Oakley, Chairman, Consultant, McLean, VA
Mr. M. D. Burkhart, Naval OceanographyDivision,De@rtment of the Navy,Washington, D. C.
or. J. N. Cordea, Senior StaffMetallurgist,ARMCOINC.,MiddZetown,OHMr. D. P. Court sal, VicePresident,DRAVO Corporation,Pittsburgh,PAMr. W. J. Lane, Consultant, EizZtimore,MDMr. A. C. McC1ure, Alan C. McClureAssociates,Inc.,Houston, TXDr. W. R. Porter, VicePres.for AcademicAffairs,State Univ.of N.Y.
Ma.mtimeCo1ZegeProf. S. T. Ro1fe, Civil Engineering Dept.,Universityof XansasMr. R. W. Rumke, ExecutiveSecretury,ShipResearchCommittee
********
The Ship Design, Response, and Load Criteria Advisory Groupprepared the project prospectus, evaluated the proposals for this project,provided the liaison technical guidance, and reviewed the project reportswith the investigator:
Mr. W. J. Lane, Chairman, Cw/su2tant,&Ztimore, ,WProf. A. H.-S. Ang, Dept.of CiviZEngineering, Universityof IZlinoisProf. S. H. Crandal 1, Dept.of Mech. Engrg.,Massachusetts Inst. of TechnologyMr. L. R. Glosten, L. R. GZostenAssociates,Inc.,Seattle,WAMr. P. M. Kimon, EXXONInterwtionalCompany,N.J.Dr. 0. H. Oakley, Jr. , ProjectL%gineer,GULFR&D Company,Houston,TXProf. R. H. Scanlan, Dept.of Civil& GeoZogicaZ Engrg., PrincetonUniversityProf. H. E. Sheets, Chairman,Dept.of OceanEngrg.,Univ.of RhodeIsZandMr. J. E. Steele, Naval Architect,Quakertowt,PA
********

SSC-277,
SSC-278,
SSC-279,
SSC-280,
SSC-281,
SSC-282,
SSC-283,
SSC-284,
SSC-285 ,
SSC-286,
SSC-287,
SSC-288 ,
SSC-289 ,
SSC-290,
SHIP STRUCTURE COMMITTEE PUBLICATIONS
Thesedocumentsare distributedby the NationalFeehniealInformationService,SpringfieZd, VA 22161. Thesedoc-umentshavebeen announced-inthe Clearinghouse JowwalU. S. GovernmentResearch& DevelopmentReports (USGRDR)underthe indicatedAD numbers.
Origins1 Radarand StandardTuckerWavemeterSL-7 ContainershipDataReductionand CorrelationSampleby J. F. Oalzel1. 1978. AO-A062394.
WavemeterDataReductionMethodand InitialData for the SL-7Containersizipby J. F. Dalzell. 1978. AD-A062391.
ModifiedRadarand StandardTuckerWavemeterSL-7 ContainershtpDataby J. F. Dalzell. 1978. AD-A062393 .
Resultsand Evaluationof the SL-7 ContainershipRadar and TuckerWave-meterData by J. F. Oalzell . 1978. AD-A062392.
Bibliographyfor the Studyof Propeller-InducedVibrat<onin BullShctura2 EZementsby O. H. 8urnside and D. D. Kana. 1978. AD-A062996.
Comparisonof StressesCalculatedUsingthe DAISYSystemto ThoseMeasuredon the SL-7ContainershipProgrwmby H. Y. Jan, K. T. Chang,and M. E. Wojnarowski . 1979. AD-A069031.
A LiteratureSurveyon the CoZlision and Grounding Protectionof .%ipsby N. Jones. 1979. AD-A069032.
Critical Evacuationof Low-l%ergyShip Co7,Zision-Do?nageTheories andDesignMethodologies- VoZumeI - Evacuationand RecommendationsbyP. R. Van Mater, Jr. , and J. G. Giannotti. 1979. AD-A0705’67.
CriticalEvahction of Low-Energy%ip CoZZision-ikzmagel%eodes andDesign Methodologies- VoZme II - LiteratureSearchand Review byP. R. Van Mater, Jr., and J. G. Giannotti. 1979. AD-A070568.
Resultsof the FirstFive “DataYears’1of ExtremeStressScratchGaugeData CoZleetionAboardSea-Lund’sSL-7’sby R. A. Fain and E. T. 8ooth.1979. AD-A072945 .
Examinationof Serviceand StressData of ThreeShipsfor Developmentof HuZZ GirderLoad Criteriaby J. F. Dalzell , N. M. Maniar, andM. W. HsII. 1979. AD-AO7291O.
!/’heEffectsof VaryingShip HuZZ Proportionsand HuZlMateriaZs on HullFZexibiZity7Bendingand VibratoryStressesby P. Y. Chang.1979.
A Methodfor EconomicTrade-Offsof AZternateShip StrutturaZ Materia1sby C. R. Jordan, J. B. Montgomery, R. P. Krumpen, and 0. J. Woodley.1979.
significance and ControZ of kawl’zr Tearingof SteeZ Platein theShipbuiZdingIndustryby J. Somhel 1a. 1979.


![· Web viewwithin Propeller Selection Range "B" [rpm] Wide Open Throttle-rpm (stbd) within Propeller Selection Range "B" [rpm] Extended Storage Preservation Procedure Note: After max](https://img.dokumen.tips/doc/110x75/5aa387837f8b9a436d8e49c1/viewwithin-propeller-selection-range-b-rpm-wide-open-throttle-rpm-stbd-within.jpg)