Embed Size (px)
Citation preview

Anton HanssonDissertations in Geology at Lund University,Master’s thesis, no 335(45 hp/ECTS credits)
Department of Geology Lund University
2013
A dendroclimatic study at Store Mosse, South Sweden – climatic and hydrologic impacts on recent Scots Pine (Pinus sylvestris) growth dynamics


A dendroclimatic study at Store Mosse, South Sweden – climatic and hydrologic impacts on recent Scots
Pine (Pinus sylvestris) growth dynamics
Master’s thesis Anton Hansson
Department of Geology Lund University
2013

Contents
1 Introduction ........................................................................................................................................................ 5
2 Study site ............................................................................................................................................................. 6
2.1 Geology and Holocene development ............................................................................................................. 6
2.2 Anthropogenic impact ..................................................................................................................................... 7
2.3 Lagan River catchment and meteorological data ............................................................................................ 7
2.4 Sample sites .................................................................................................................................................... 9
3 Methods ............................................................................................................................................................. 10
3.1 Field work ..................................................................................................................................................... 10
3.2 Lab work and chronological processing ...................................................................................................... 10
3.2.1 Preparation and measuring ....................................................................................................................... 10
3.2.2 Cross-dating samples ............................................................................................................................... 11
3.2.3 Cofecha .................................................................................................................................................... 12
3.2.4 Arstan ....................................................................................................................................................... 12
3.2.5 Chronologies ............................................................................................................................................ 12
3.2.6 Germination year ...................................................................................................................................... 13
3.2.7 Dendroclim .............................................................................................................................................. 13
4 Results ............................................................................................................................................................... 13
4.1 Peat stratigraphy ............................................................................................................................................ 13
4.1.1 Transect A ................................................................................................................................................ 13
4.1.2 Transect B ................................................................................................................................................ 13
4.2 Tree ages ....................................................................................................................................................... 15
4.3 Chronologies ................................................................................................................................................. 16
4.4 Elevated and depressed growth ..................................................................................................................... 16
4.5 Meteorological correlations .......................................................................................................................... 17
4.5.1 The solid ground stand ............................................................................................................................. 17
4.5.2 The marginal fen stand ............................................................................................................................. 18
4.5.3 The marginal hummock stand .................................................................................................................. 20
4.5.4 The bog plain margin stand ...................................................................................................................... 21
4.5.5 The Ekeberg stand .................................................................................................................................... 21
4.5.6 The Svensdal stand ................................................................................................................................... 21
4.5.7 The Lake Kalvasjön stand ........................................................................................................................ 22
5 Discussion.......................................................................................................................................................... 22
5.1 Chronologies ................................................................................................................................................. 22
5.2 Recent decline ............................................................................................................................................... 23
5.3 Store Mosse bog pine ages ............................................................................................................................ 23
5.4 Bog setting and pine growth ......................................................................................................................... 24
5.5 Possible anthropogenic impact ...................................................................................................................... 25
5.6 Climate and hydrology .................................................................................................................................. 25
6 Conclusions ....................................................................................................................................................... 27
7 Acknowledgements........................................................................................................................................... 27
8 References ......................................................................................................................................................... 28
Cover Picture: Scots Pine from Store Mosse (Photograph Anton Hansson 2012)
A dendroclimatic study at Store Mosse, South Sweden – climatic
and hydrologic impacts on recent Scots Pine (Pinus sylvestris)
growth dynamics
ANTON HANSSON
Hansson, A., 2013: A dendroclimatic study at Store Mosse, South Sweden – climatic and hydrologic impacts on
recent Scots Pine (Pinus sylvestris) growth dynamics. Dissertations in Geology at Lund University, No. 335, 30 pp.
45 hp (45 ECTS credits).
Keywords: Dendrochronology, Bog, Climate, Water Table Changes, Store Mosse
Supervisors: Dan Hammarlund, Johannes Edvardsson & Hans Linderson
Subject: Quaternary Geology
Anton Hansson, Department of Geology, Lund University, Sölvegatan 12, SE-223 62 Lund, Sweden. E-mail:
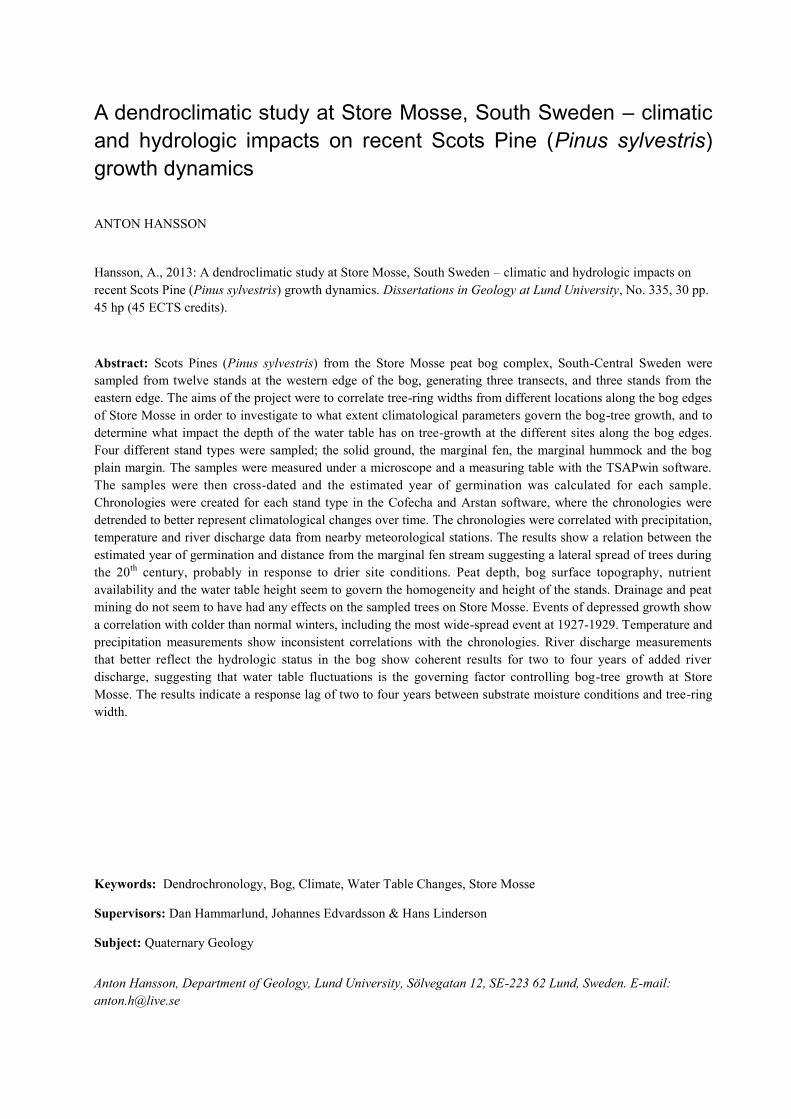
Abstract: Scots Pines (Pinus sylvestris) from the Store Mosse peat bog complex, South-Central Sweden were
sampled from twelve stands at the western edge of the bog, generating three transects, and three stands from the
eastern edge. The aims of the project were to correlate tree-ring widths from different locations along the bog edges
of Store Mosse in order to investigate to what extent climatological parameters govern the bog-tree growth, and to
determine what impact the depth of the water table has on tree-growth at the different sites along the bog edges.
Four different stand types were sampled; the solid ground, the marginal fen, the marginal hummock and the bog
plain margin. The samples were measured under a microscope and a measuring table with the TSAPwin software.
The samples were then cross-dated and the estimated year of germination was calculated for each sample.
Chronologies were created for each stand type in the Cofecha and Arstan software, where the chronologies were
detrended to better represent climatological changes over time. The chronologies were correlated with precipitation,
temperature and river discharge data from nearby meteorological stations. The results show a relation between the
estimated year of germination and distance from the marginal fen stream suggesting a lateral spread of trees during
the 20th century, probably in response to drier site conditions. Peat depth, bog surface topography, nutrient
availability and the water table height seem to govern the homogeneity and height of the stands. Drainage and peat
mining do not seem to have had any effects on the sampled trees on Store Mosse. Events of depressed growth show
a correlation with colder than normal winters, including the most wide-spread event at 1927-1929. Temperature and
precipitation measurements show inconsistent correlations with the chronologies. River discharge measurements
that better reflect the hydrologic status in the bog show coherent results for two to four years of added river
discharge, suggesting that water table fluctuations is the governing factor controlling bog-tree growth at Store
Mosse. The results indicate a response lag of two to four years between substrate moisture conditions and tree-ring
width.

En dendroklimatologisk studie från Store mosse, södra Sverige –
klimatologisk och hydrologisk påverkan på tillväxtdynamik hos
recenta tallar (Pinus sylvestris)
ANTON HANSSON
Hansson, A., 2013: En dendrokronologisk studie från Store mosse, södra Sverige - klimatologisk och hydrologisk
påverkan på tillväxtdynamik hos recenta tallar (Pinus sylvestris). Examensarbeten i geologi vid Lunds universitet,
Nr. 335, 30 sid. 45 hp.
Nyckelord: Dendrokronologi, torvmosse, klimat, vattenståndsförändringar, Store mosse
Anton Hansson, Geologiska institutionen, Lunds universitet, Sölvegatan 12, 223 62 Lund, Sverige. E-post:
Sammanfattning: Tallar (Pinus sylvestris) som växer på Store mosse i Småland har provtagits. Tolv bestånd från
den västra kanten, som tillsammans bildar tre transekter, och tre bestånd från den östra kanten ingår i denna
dendrokronologiska undersökning. Syftet med projektet har varit att korrelera ringbreddsvariationer från tallar
växande på olika platser längs mossekanten för att undersöka i vilken grad klimatiska parametrar styr tillväxten hos
mossetallar och att bestämma hur mycket grundvattenytan påverkar mossetallarnas tillväxt längs mossekanten.
Fyra olika tallbeståndstyper provtogs; fastmarksbestånd, laggkärrsbestånd, högmossekantsbestånd och
högmosseplansbestånd. Proverna mättes med hjälp av ett stereomikroskop och mätbord i programmet TSAPwin.
Proverna korsdaterades och gavs ett uppskattat groddår. Kronologier skapades för varje beståndstyp i programmen
Cofecha och Arstan där kronologierna avtrendades för att bättre representera klimatologiska förändringar över tid.
Kronologierna korrelerades mot nederbörd, temperatur och vattenflödesdata från närliggande meteorologiska
stationer. Resultaten visar ett samband mellan det uppskattade groddåret för proverna och avståndet till
laggkärrsbäcken som indikerar en lateral spridning av mossetallar under 1900-talet som förmodligen beror på
torrare förhållanden på mossen. Torvdjup, torvytans topografi, näringshalt och grundvattenytans läge verkar styra
homogeniteten och höjden på tallarna i de olika typbestånden. Dikning och torvbrytning har inte påverkat de
undersökta träden på Store mosse. Tillväxtkollapser i kronologierna kan korreleras med vintrar med lägre
temperatur än normalt, inklusive den mest välrepresenterade tillväxtkollapsen 1927-1929. Temperatur- och
nederbördsdata visar inkonsekventa korrelationer med kronologierna. Vattenflödesmätningar som kan antas att
bättre avspegla mossens hydrologiska situation visar tydliga resultat för två till fyra års adderat vattenflöde som
indikerar att grundvattenytans läge är den dominerande faktorn som styr mossetallarnas tillväxt på Store mosse.
Resultaten visar på en fördröjning på mellan två och fyra år mellan mossens hydrologi och trädringstjocklek.

5
1 Introduction The field of dendrochronology was born in the early
20th century when it was discovered that tree-ring
width was dependent on climatic and environmental
parameters (Fritts 1976). Correlating tree-ring width
with meteorological measurements has been proven
useful in climatological studies in temperate regions
(Briffa et al. 2002), as the results can be used to
reconstruct climate back in time and to understand the
factors controlling tree growth (Fritts 1976).
Trees growing close to, or at, their distri-
butional limit holds climate information regarding
changes in precipitation, nutrients and temperature
(Fritts 1976). Distributional limits can be high
altitudes and latitudes or environments with an
extreme hydrological setting, such as peatlands or
deserts. The annual resolution in the dendro -
chronological records is suitable for studying climate
changes, in advantage of other geological records that
have a decadal to centennial resolution at best
(Edvardsson et al. 2012). In recent times of impending
climate change, accurate high resolution climate
reconstructions are of vital importance for predictions
of the future climate.
The Earth has experienced a global average
temperature rise of 0.7ºC between 1850 and 2005,
where high latitudes have experienced a temperature
increase twice the global average (IPCC 2007).
The present time of higher than normal temperatures
was preceded by the Little Ice Age that had a mean
temperature of approximately -0.5ºC below the 1961-
1990 mean (Ljungqvist 2010). Northern Europe,
among other parts of the world, has also experienced
significantly increased precipitation during the 20 th
century (IPCC 2007). Changes in precipitation and
evaporation are described as the main contributors to
alterations in peatland wetness in a study by van der
Linden et al.. (2008).
Peatlands cover about 15% of the Swedish land
area (Borgmark & Wastegård 2008). Wood remains
buried in peat deposits have been subject to a number
of dendrochronological studies, mainly on Pinus
sylvestris (Scots Pine) and other pine species (eg,
Edvardsson et al. 2012; Freléchoux et al. 2000;
Linderholm 2001; Linderholm et al. 2002; Vitas &
Erlickyté 2007). The environment of a raised bog is
that of poor nutrient availability with precipitation as
the only moisture source (Andréasson 2006), and is
therefore only present in areas with a positive water
balance (Charman 2002). The adjacent marginal fen
has a higher nutrient availability and receives moisture
both from precipitation and inflow from the surro-
unding solid ground (Andréasson 2006). The veget-
ation on raised bogs is therefore sparse, and only about
half of the Swedish peatlands and thin peat soils are
forested (Rydin et al. 1999). Moreover, the bogs in
western Sweden experience higher humidity than the
ones located in eastern Sweden, and the humidity
gradient has an influence on bog vegetation (Rydin et
al. 1999). Tree growth is according to Freléchoux et al.
(2000) limited mainly by the water table, and therefore
bogs in eastern Sweden are to a larger extent forested.
Vegetation growing on south Swedish bogs includes
Sphagnum (peat moss), Eriophorum vaginatum (cotton
grass), Calluna vulgaris (heather), Betula nana (dwarf
birch) and Pinus sylvestris (Rydin et al. 1999).
Pinus sylvestris is wind-pollinated and grows
on a wide range of substrates, from peatlands to sand
dunes. Pinus sylvestris reaches sexual maturity at an
age of 10 to 15 years (Debain et al. 2003). The June-
August temperature needs to be at least 10.5ºC for
Pinus sylvestris to produce fertile seeds (Øyen et al.
2006). Abundant amounts of seeds are produced every
three to four years (Debain et al. 2003). Seeds that do
not germinate the year they were dispersed do only
have a small chance of germinating the next year
(Karlsson 2000). The reproduction cycle is weather-
dependent and is favoured by warm and windy
conditions (Karlsson 2000).
Eckstein et al. (2009) have studied Mid-
Holocene sub-fossil pines from numerous bogs in
lower Saxony, north-western Germany. Pine was most
widely distributed at the fen to bog transition of the
investigated stratigraphies. As raised bogs developed
the pines tended to die off synchronously. Elevated
water levels were identified as the main trigger that
caused the die-off events according to Eckstein et al.
(2009). Warmer climate and drier bog surfaces have
historically been interpreted as the main causes for bog
tree growth during the Holocene (Gunnarson 1999).
A similar study to Eckstein et al. (2009) by
Edvardsson et al. (2012) indicates that the tree-ring
width is closely linked to the regional climate as tree-
ring records from bog pines in southern Sweden
correlate with corresponding data obtained on the
pines in Germany studied by Eckstein et al. (2009).
The studies by Eckstein et al. (2009) and
Edvardsson et al. (2012) describe bog development
and water level fluctuations during the Holocene.
However, since meteorological records seldom extend
more than 150 years back in time (Linderholm et al.
2002), the water level fluctuations of the bogs cannot
be directly correlated to precipitation and temperature
measurements. Moreover the sub-fossil studies tend to
indicate decadal rather than annual water level fluct-
uations.
Studies of recent tree-ring records from bogs
have been successfully compared to meteorological
measurements. Linderholm et al. (2002) suggest that
precipitation and temperature are the two limiting
factors for Swedish peatland pines. However, water
table fluctuations seem to play a role in the decadal-
scale perspective.
An overwhelming 39% (25000 km2) of all
peatlands in Sweden have been drained (Rydin et al.
1999), mainly since the late 19th century. This includes
10000 km2 drained for forestry purposes, 6000-10000
km2 for agriculture, 4000 km2 of unsuccessfully
drained peatlands and 1000 km2 drained for peat
6
mining (Rydin et al. 1999).
The peat mining industry in Sweden had its
glory days between 1850 and 1950 (Runefelt 2008).
Domestic peat mining was the only realistic alternative
to imported coal during the First World War. The peat
industry then declined in the 1920’s. The Second
World War reinstated peat as a major fuel source, but
the peat industry more or less vanished in the 1960’s
(Runefelt 2008).
Drainage of peatlands has a visible effect on the
vegetation (Rydin et al. 1999). Grünig (1955)
stipulates that bog drainage has an immediate positive
effect on the tree-ring width of pine and spruce, most
effectively within three meters of the drainage channel.
Experiments from Scotland showed that a water level
near the bog surface inhibited almost all tree growth,
as root development was constantly constrained while
trees growing at sites with a lowered water table grew
healthy vertical roots (Boggie 1972).
Studies regarding different types of pine stands
on raised bogs have been performed in the Jura
Mountains of Switzerland (Freléchoux et al. 2000), but
similar studies on Swedish bog pines are absent.
This project aims at investigating bog pines with
similar meteorological preferences but with different
geological settings such as peat depth and water table.
Dendrochronological analysis of pines growing on
solid ground, the marginal fen and the raised bog
surface is anticipated to give broad insight into when
the local hydrological setting overrules the regional
climate as the governing process for bog pine growth.
By sampling multiple trees at each site the internal
variance of germination of bog pines will be evaluated.
The western edge of the Store Mosse raised bog
complex in Småland, southern Sweden has not
experienced any anthropogenic alterations of its
hydrology and was therefore targeted as a suitable
study site for the project.
The primary objective of this project is to
assess how ring-width records obtained from pines
growing at different sites across and adjacent to the
raised bog correlate with monitoring series of
temperature and precipitation. Another main objective
is to clarify the impact of hydrology and peat depth on
the growth of bog pines and specifically at what time-
scales these factors influence tree growth.
2 Study site 2.1 Geology and Holocene develop- ment The study site is located at the south-western part of
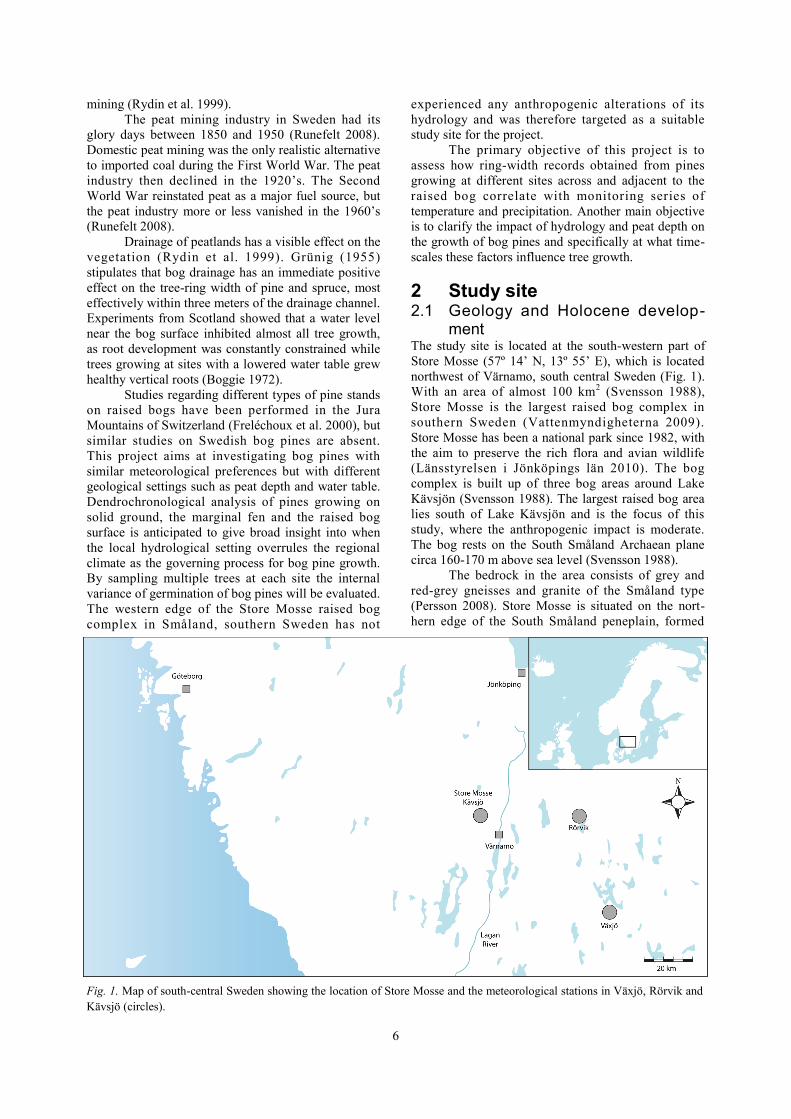
Store Mosse (57º 14’ N, 13º 55’ E), which is located
northwest of Värnamo, south central Sweden (Fig. 1).
With an area of almost 100 km2 (Svensson 1988),
Store Mosse is the largest raised bog complex in
southern Sweden (Vattenmyndigheterna 2009).
Store Mosse has been a national park since 1982, with
the aim to preserve the rich flora and avian wildlife
(Länsstyrelsen i Jönköpings län 2010). The bog
complex is built up of three bog areas around Lake
Kävsjön (Svensson 1988). The largest raised bog area
lies south of Lake Kävsjön and is the focus of this
study, where the anthropogenic impact is moderate.
The bog rests on the South Småland Archaean plane
circa 160-170 m above sea level (Svensson 1988).
The bedrock in the area consists of grey and
red-grey gneisses and granite of the Småland type
(Persson 2008). Store Mosse is situated on the nort-
hern edge of the South Småland peneplain, formed
Fig. 1. Map of south-central Sweden showing the location of Store Mosse and the meteorological stations in Växjö, Rörvik and
Kävsjö (circles).
7
approximately 70 million years ago (Naturvårdsverket
1996). The bedrock is overlain by till and glacio-
lacustrine sediments, mainly fine sand in the Store
Mosse depression. Eolian sediments that originate
from the glaciolacustrine sediments are scattered west
of Store Mosse (Persson 2008), and in patches on the
north-western part of the bog (Svensson 1988).
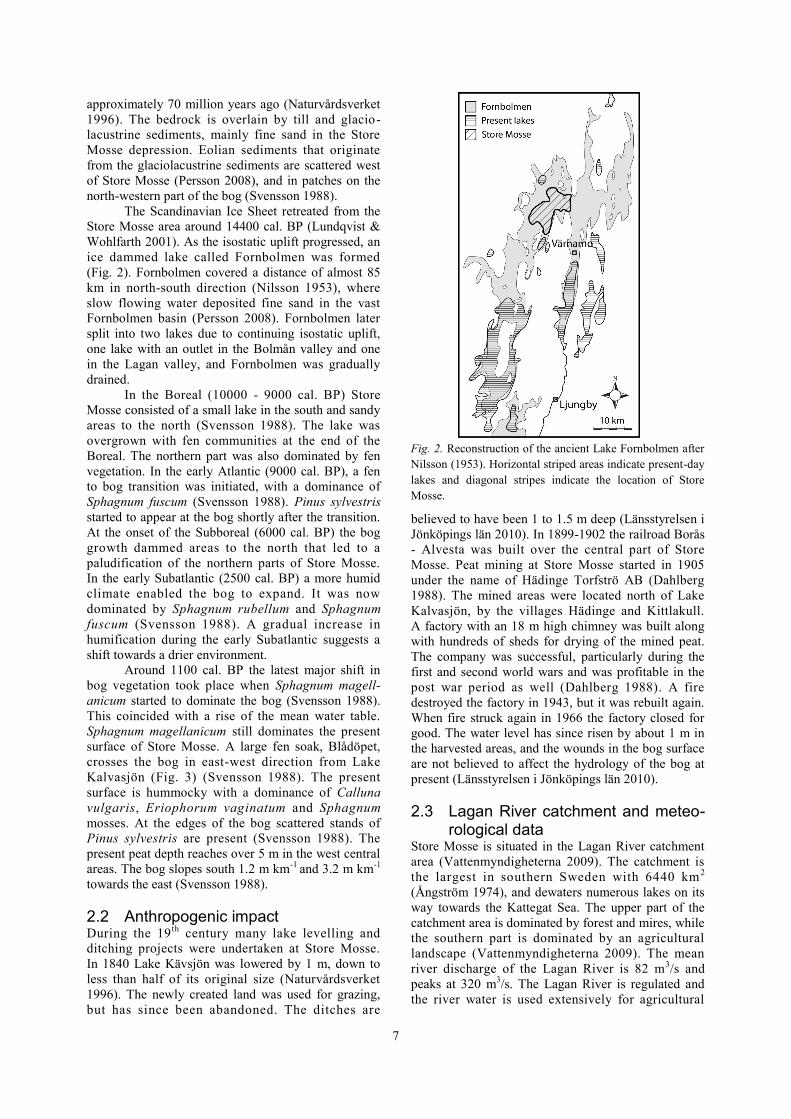
The Scandinavian Ice Sheet retreated from the
Store Mosse area around 14400 cal. BP (Lundqvist &
Wohlfarth 2001). As the isostatic uplift progressed, an
ice dammed lake called Fornbolmen was formed
(Fig. 2). Fornbolmen covered a distance of almost 85
km in north-south direction (Nilsson 1953), where
slow flowing water deposited fine sand in the vast
Fornbolmen basin (Persson 2008). Fornbolmen later
split into two lakes due to continuing isostatic uplift,
one lake with an outlet in the Bolmån valley and one
in the Lagan valley, and Fornbolmen was gradually
drained.
In the Boreal (10000 - 9000 cal. BP) Store
Mosse consisted of a small lake in the south and sandy
areas to the north (Svensson 1988). The lake was
overgrown with fen communities at the end of the
Boreal. The northern part was also dominated by fen
vegetation. In the early Atlantic (9000 cal. BP), a fen
to bog transition was initiated, with a dominance of
Sphagnum fuscum (Svensson 1988). Pinus sylvestris
started to appear at the bog shortly after the transition.
At the onset of the Subboreal (6000 cal. BP) the bog
growth dammed areas to the north that led to a
paludification of the northern parts of Store Mosse.
In the early Subatlantic (2500 cal. BP) a more humid
climate enabled the bog to expand. It was now
dominated by Sphagnum rubellum and Sphagnum
fuscum (Svensson 1988). A gradual increase in
humification during the early Subatlantic suggests a
shift towards a drier environment.
Around 1100 cal. BP the latest major shift in
bog vegetation took place when Sphagnum magell-
anicum started to dominate the bog (Svensson 1988).
This coincided with a rise of the mean water table.
Sphagnum magellanicum still dominates the present
surface of Store Mosse. A large fen soak, Blådöpet,
crosses the bog in east-west direction from Lake
Kalvasjön (Fig. 3) (Svensson 1988). The present
surface is hummocky with a dominance of Calluna
vulgaris, Eriophorum vaginatum and Sphagnum
mosses. At the edges of the bog scattered stands of
Pinus sylvestris are present (Svensson 1988). The
present peat depth reaches over 5 m in the west central
areas. The bog slopes south 1.2 m km-1 and 3.2 m km-1
towards the east (Svensson 1988).
2.2 Anthropogenic impact During the 19 th century many lake levelling and
ditching projects were undertaken at Store Mosse.
In 1840 Lake Kävsjön was lowered by 1 m, down to
less than half of its original size (Naturvårdsverket
1996). The newly created land was used for grazing,
but has since been abandoned. The ditches are
believed to have been 1 to 1.5 m deep (Länsstyrelsen i
Jönköpings län 2010). In 1899-1902 the railroad Borås
- Alvesta was built over the central part of Store
Mosse. Peat mining at Store Mosse started in 1905
under the name of Hädinge Torfströ AB (Dahlberg
1988). The mined areas were located north of Lake
Kalvasjön, by the villages Hädinge and Kittlakull.
A factory with an 18 m high chimney was built along
with hundreds of sheds for drying of the mined peat.
The company was successful, particularly during the
first and second world wars and was profitable in the
post war period as well (Dahlberg 1988). A fire
destroyed the factory in 1943, but it was rebuilt again.
When fire struck again in 1966 the factory closed for
good. The water level has since risen by about 1 m in
the harvested areas, and the wounds in the bog surface
are not believed to affect the hydrology of the bog at
present (Länsstyrelsen i Jönköpings län 2010).
2.3 Lagan River catchment and meteo- rological data Store Mosse is situated in the Lagan River catchment
area (Vattenmyndigheterna 2009). The catchment is
the largest in southern Sweden with 6440 km2
(Ångström 1974), and dewaters numerous lakes on its
way towards the Kattegat Sea. The upper part of the
catchment area is dominated by forest and mires, while
the southern part is dominated by an agricultural
landscape (Vattenmyndigheterna 2009). The mean
river discharge of the Lagan River is 82 m3/s and
peaks at 320 m3/s. The Lagan River is regulated and
the river water is used extensively for agricultural
Fig. 2. Reconstruction of the ancient Lake Fornbolmen after
Nilsson (1953). Horizontal striped areas indicate present-day
lakes and diagonal stripes indicate the location of Store
Mosse.

8
Fig. 4. Southern part of the Store Mosse peatland complex. Coloured boxes indicate sample stands. Letters A-C in the boxes
indicate which sample stands that belong to transects A-C. Peatland areas (light green), forested areas (dark green) and
cultivated areas (light brown) are represented in the figure. Present are also Lake Kalvasjön to the north and Lake
Herrestadssjön to the south.
Fig 3. Temperature, precipitation and water flow data from the Växjö (14º47’ N, 56º52’ E), Kävsjö (13º55’ N, 57º19’ E) and
Rörvik (14º35’ N, 57º14’ E) meteorological stations used in this study. Values are 1961-1990 mean. Data received from SMHI.
purposes.
Three meteorological stations from the swedish
meteorological institute (SMHI) were used in this
study. Climate data for each station can be found in
Fig. 3. The Växjö meteorological station contains
temperature and precipitation measurements and
ranges from 1860 to 2011. Kävsö meteorological
station ranges from 1909 to 2008 and contains
precipitation measurements. The Rörvik water
discharge station ranges from 1907 to 2012 (water
discharge is the amount of water passing the
measuring station per second).

9
2.4 Sample sites
The sample area consists of three east-west stretching
transects along the western edge of the bog, and three
separate sample sites at the eastern edge (Fig. 4).
Transect A is the southernmost transect, and stretches
290 m from the marginal fen stream (Fig. 5).
Some 400 m to the north lies transect B that stretches
289 m (Fig. 5). The northernmost transect is transect
C, 1.7 km north of transect B. Transect C stretches 238
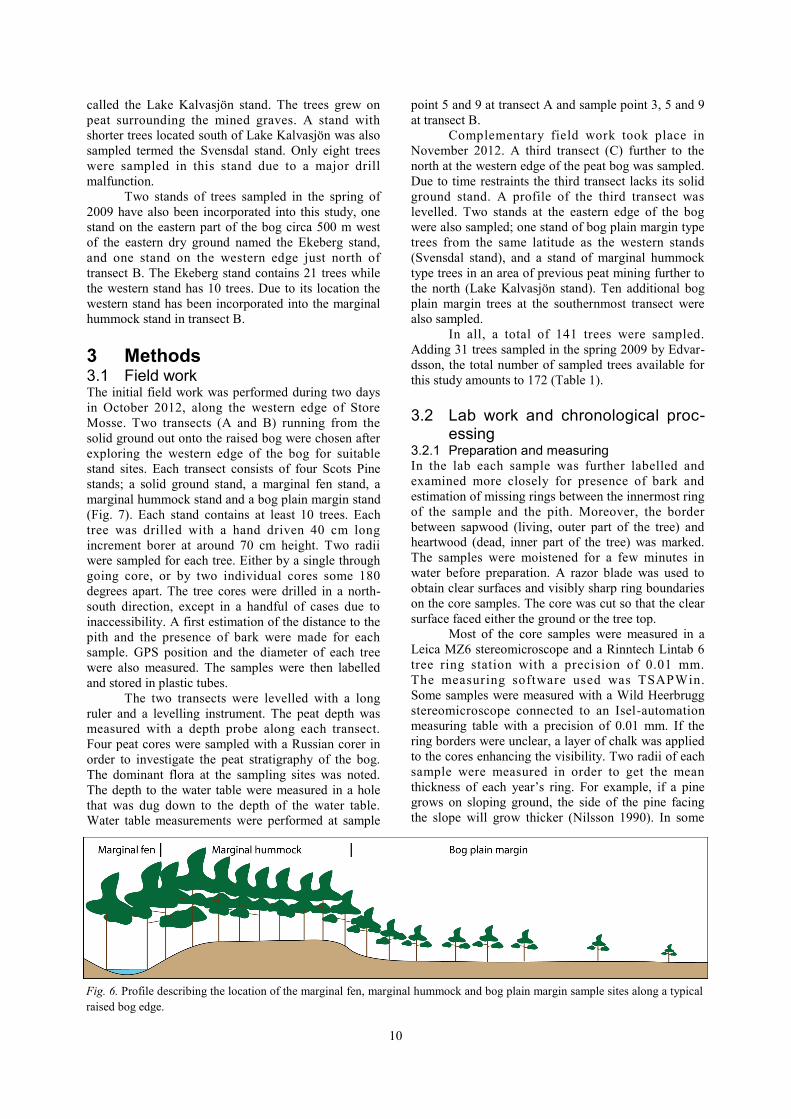
m (Fig. 5). Along each transect a marginal fen stand,
a marginal hummock stand and a bog plain margin
stand were sampled (Fig. 4). Two solid ground stands
lie outside the measured transects in the forested area
to the west. The marginal fen and marginal hummock
stands consist of trees taller than 5 m, while the bog
plain margin stand is often not taller than 3 m. Due to
inaccessibility the marginal fen stand of transect B lies
some 700 m north of the other stands in the transect
(Fig. 4).
One stand was sampled in the previously mined
area north of Lake Kalvasjön consisting of taller trees
Fig. 5. Profiles of transects A-C. Each profile shows sample point 1-12 (Transect A), 1-12 (Transect B) and 1-11 (Transect C).
The number of trees and their height in the profiles reflect the actual height and density variations at the sites. The lines with a
central circle in transects A-B show the border between the peat deposit and the substrate. Note that no peat depth measurements
were performed in transect C. The location of the marginal fen stream is just west of all transects.
10
called the Lake Kalvasjön stand. The trees grew on
peat surrounding the mined graves. A stand with
shorter trees located south of Lake Kalvasjön was also
sampled termed the Svensdal stand. Only eight trees
were sampled in this stand due to a major drill
malfunction.
Two stands of trees sampled in the spring of
2009 have also been incorporated into this study, one
stand on the eastern part of the bog circa 500 m west
of the eastern dry ground named the Ekeberg stand,
and one stand on the western edge just north of
transect B. The Ekeberg stand contains 21 trees while
the western stand has 10 trees. Due to its location the
western stand has been incorporated into the marginal
hummock stand in transect B.
3 Methods 3.1 Field work The initial field work was performed during two days
in October 2012, along the western edge of Store
Mosse. Two transects (A and B) running from the
solid ground out onto the raised bog were chosen after
exploring the western edge of the bog for suitable
stand sites. Each transect consists of four Scots Pine
stands; a solid ground stand, a marginal fen stand, a
marginal hummock stand and a bog plain margin stand
(Fig. 7). Each stand contains at least 10 trees. Each
tree was drilled with a hand driven 40 cm long
increment borer at around 70 cm height. Two radii
were sampled for each tree. Either by a single through
going core, or by two individual cores some 180
degrees apart. The tree cores were drilled in a north-
south direction, except in a handful of cases due to
inaccessibility. A first estimation of the distance to the
pith and the presence of bark were made for each
sample. GPS position and the diameter of each tree
were also measured. The samples were then labelled
and stored in plastic tubes.
The two transects were levelled with a long
ruler and a levelling instrument. The peat depth was
measured with a depth probe along each transect.
Four peat cores were sampled with a Russian corer in
order to investigate the peat stratigraphy of the bog.
The dominant flora at the sampling sites was noted.
The depth to the water table were measured in a hole
that was dug down to the depth of the water table.
Water table measurements were performed at sample
point 5 and 9 at transect A and sample point 3, 5 and 9
at transect B.
Complementary field work took place in
November 2012. A third transect (C) further to the
north at the western edge of the peat bog was sampled.
Due to time restraints the third transect lacks its solid
ground stand. A profile of the third transect was
levelled. Two stands at the eastern edge of the bog
were also sampled; one stand of bog plain margin type
trees from the same latitude as the western stands
(Svensdal stand), and a stand of marginal hummock
type trees in an area of previous peat mining further to
the north (Lake Kalvasjön stand). Ten additional bog
plain margin trees at the southernmost transect were
also sampled.
In all, a total of 141 trees were sampled.
Adding 31 trees sampled in the spring 2009 by Edvar-
dsson, the total number of sampled trees available for
this study amounts to 172 (Table 1).
3.2 Lab work and chronological proc- essing 3.2.1 Preparation and measuring In the lab each sample was further labelled and
examined more closely for presence of bark and
estimation of missing rings between the innermost ring
of the sample and the pith. Moreover, the border
between sapwood (living, outer part of the tree) and
heartwood (dead, inner part of the tree) was marked.
The samples were moistened for a few minutes in
water before preparation. A razor blade was used to
obtain clear surfaces and visibly sharp ring boundaries
on the core samples. The core was cut so that the clear
surface faced either the ground or the tree top.
Most of the core samples were measured in a
Leica MZ6 stereomicroscope and a Rinntech Lintab 6
tree ring station with a precision of 0.01 mm.
The measuring software used was TSAPWin.
Some samples were measured with a Wild Heerbrugg
stereomicroscope connected to an Isel-automation
measuring table with a precision of 0.01 mm. If the
ring borders were unclear, a layer of chalk was applied
to the cores enhancing the visibility. Two radii of each
sample were measured in order to get the mean
thickness of each year’s ring. For example, if a pine
grows on sloping ground, the side of the pine facing
the slope will grow thicker (Nilsson 1990). In some
Fig. 6. Profile describing the location of the marginal fen, marginal hummock and bog plain margin sample sites along a typical
raised bog edge.

11
Stand Location Samples Sample date
Solid ground West 20 Autumn 2012
Marginal fen West 30 Autumn 2012
Marginal hummock West 40 Autumn 2012
Bog plain margin West 31 Autumn 2012
Ekeberg East 21 Spring 2009
Svensdal East 8 Autumn 2012
Lake Kalvasjön East 10 Autumn 2012
Other ----- 3 Autumn 2012
cases the same radius was measured more than once,
when the initial measurement was not satisfactory.
During the measurements notes were taken on possible
false rings, frost damages and other irregularities.
A false ring occurs when a ring starts to develop but
stops due to deteriorating growth conditions. Later the
proper ring develops when growth conditions return to
normal. This leads to two rings being formed the same
year (Fritts 1976).
3.2.2 Cross-dating samples Cross-dating is dependent on the number of available
tree rings. A high number of rings increases the chance
of a successful cross-dating (Eckstein 1984).
Cross-dating and evaluation of the samples were
performed in TSAPWin. Ocular matching of the two
measured radii from each sample was performed along
with statistical analyses in order to make a correct
cross-dating. The measured curves were plotted on a
logarithmic scale which amplifies the narrow rings and
dampens the thick (Fig. 8) (Eckstein 1984). The two
statistical components used was T-value and sign test.
A sign test, also known as gleichläufigkeit,
checks the similarity between two curves (Schwe-
ingruber 1988). The sign test was developed specially
for dendrochronological cross-dating (Rinn 2003).
Each point along the curves represent one year. If the
two curves increase or decrease at a successive point,
the value 1 is given for that year, independent of the
magnitude of change (Fritts 1976). If one curve
decreases and the other increases the value given is 0.
If one curve has not increased nor decreased from the
previous year, the given value is 0.5. All values are
summed and compared to the total number of
overlapping years. For example if 7 out of 10 points
increase or decrease synchronously the total sign value
is 70% (Schwein-gruber 1988), and so the total sign
value represents the trend agreement between the two
curves. In TSAPwin the compared curves are tested
for all possible intervals and the five best matches are
presented for further evaluation (Rinn 2003). The sign
value is accompanied by a significance value of 1, 2 or
3 representing the 95%, 99% and the 99.9%
significance level, where 99.9% is the best correlation.
The T-value is a common statistical parameter
for correlation significance (Rinn 2003). The T-value
is calculated in a similar way as the sign test and is
related to the correlation coefficient (Eckstein 1984).
Contrary to the sign test, the T-value can be overest-
imated if extreme ring width values happen to match.
A T-value above 3 is assumed to be non-random
Fig. 7. Photographs showing typical environments at the (A) solid ground, (B) marginal fen, (C) marginal hummock and (D)
bog plain margin stands. (Photograph: (A),(C) & (D) Johannes Edvardsson 2012 (B) Anton Hansson 2012).
Table 1. Summary of the sample locality (west or east side
of the bog), the number of samples from each stand type and
the date of sampling.

12
(Eckstein 1984).
The two radii from a sample were after a
satisfactory statistical analysis and visual scrutiny
merged into a single curve (Fig. 8). The mean curve
was then cross-dated against some already dated
reference series. The reference series originated from
earlier field work from Store Mosse and bog sites
south of Store Mosse; Åbuamossen, Saxnäs Mosse,
Hästhults Mosse, Mycklemossen and Buxabygds
Mosse (Edvardsson, J. unpublished data). Since the
samples were collected in the autumn of 2012, the
outermost ring should represent the 2012 growth
season. Mean sample curves with a good correlation to
the dated reference curve were given a start year.
When mean curves had been created for each tree in
the specific stand and given a dating, the mean curves
were cross-dated against each other to build a single
mean stand curve. A mean stand curve best represents
the local growth conditions and some of the growth
irregularities of the trees are averaged out (Edvardsson
2006). Some trees experienced growth collapses
(several years with very narrow rings). In order to
build a better chronology these collapse years were left
out of the mean stand curve when possible. The
chronologies were then run in the softwares Cofecha,
Arstan and Dendroclim for further analysis and
climatic correlations. 3.2.3 Cofecha Cofecha is a software designed for cross-dating of
tree-ring records and to find possible measuring and
dating errors (Holmes 1999). Cofecha creates a master
curve of all the curves in the stand and tests the master
curve against each of the sample curves (Holmes
1999). The tested sample is removed from the master
curve to avoid autocorrelation. A cubic smoothing
spline is fit to the curves with a 50% cut-off of 32
years. This removes the low-frequency variance from
the curves (Holmes 1999). The persistence is then
removed by autoregressive modelling. After log
transformation of the values only the high frequency is
left. Each sample is then split in 50-year segments and
correlated against the created master curve. The segm-
ents are also tested to fit up to 10 years later or earlier
than the suggested dated year to discover any missing
or false rings, or other measuring errors (Holmes
1999). The program presents a text file with a
chronology intercorrelation value and alerts if some
samples seem to be incorrectly dated, and leaves
suggestions for alternate dating. 3.2.4 Arstan The Arstan software creates a single chronology from
tree-ring curves by detrending and indexing (Cook &
Holmes 1999). Arstan removes the low frequency
variance in the tree-ring curves. The remaining high
frequency variance is the part that contains the
cl imatic var iat ions (Cook & Holmes 1999) .
Arstan detrends each input curve and then applies
autoregressive modelling, first multivariate and then
univariate. The Friedman variable span smoother was
chosen for the detrending. Arstan computes three
different versions of the chronology, the STNDRD,
RESID and ARSTAN versions. The STNDRD version
consists of a mean value function of all detrended
input curves (Cook & Holmes 1999). The RESID
chronology is built up in the same way as the
STNDRD chronology but with the residual values
created in the univariate autoregression mentioned
above (Cook & Holmes 1999). The ARSTAN
chronology consists of the sum of the RESID
chronology and the pooled autoregression model
created in the multivariate autoregression. The
ARSTAN chronology has the intention to represent the
strongest climate signal (Cook & Holmes 1999).
3.2.5 Chronologies Out of the 141 measured samples, nine could not be
dated properly and were left out of the stand chrono-
logy analysis. One chronology for each stand was
created in the Arstan software. The samples with the
highest intercorrelation in Cofecha were selected for
the stand type chronology created in Arstan, leaving
out samples with high growth irregularities. An inter-
Fig. 8. A cross-dating example where the white line represents the ring widths of one radius and the yellow line those of the
other. The green line shows the averaged curve for this sample. This match has a sign test value of 74% at the 99.9%
significance level and a T-value of 15.5.

13
correlation value of 1 would mean identical tree-ring
curves. The first 20 years from the estimated germi-
nation year were removed from the measurements.
This removes the adolescent years when the tree-ring
width does not signal climate variation to any
noticable extent. A running EPS (Expressed Popu-
lation Signal) threshold value of 0.85 was chosen in
accordance with Wigley et al. (1984). The running
EPS value is dependent on the number of samples in
the chronology and the degree of intercorrelation.
3.2.6 Germination year All sampled trees were given an estimated germination
year. A sample collected at the height of 50 cm misses
the rings up until the year the tree reached 50 cm.
Trees growing at the marginal fen and the marginal
hummock are given an estimation of 14 rings per
meter and trees in the bog plain margin 21 rings per
meter (Linderson, H. personal communication).
A germination year is calculated based on the sample
height, number of missing rings to the pith at sample
height and the dated year of the innermost ring at
sample height. The estimation allows an uncertainty of
±5 years. All trees were living at the time of sampling,
therefore the last ring in all undamaged samples
represents the year 2012. 3.2.7 Dendroclim Dendroclim is a software for identifying climate
signals in tree-ring chronologies (Biondi & Waikul
2004). The program compares annual tree-ring width
with monthly climate parameters such as temperature
and precipitation. Dendroclim uses two statistical
models, the correlation function and the response
function (Biondi & Waikul 2004). The correlation
function was used in this study.
The correlation function used is the univariate
estimates of Pearson’s product moment correlation
(Biondi & Waikul 2004). Pearson’s product compares
the linear relationship between two variables (Kutner
et al. 2005). Pearson’s product gives a value between
+1 and -1, where +1 is a total positive correlation
between the two variables, and -1 a total negative
correlation. Values near 0 show no significant
correlation (Kutner et al. 2005). A positive correlation
value indicates that the climate parameter and tree-ring
width both have a high value, for example a high
temperature correlates with a thick tree ring. A nega-
tive correlation indicates that one value is high and
another low, for example high precipitation correlates
with a thin tree ring. Dendroclim uses bootstraps for
more accurate results (Biondi & Waikul 2004).
According to Efron (1979) bootstraps estimate the
error rates, and introduce a way of testing the
significance of the correlations produced (Guiot 1991).
All chronologies were correlated against monthly
precipitation measurements from Växjö and Kävsjö,
temperature measurements from Växjö and river
discharge measurements from Rörvik from June of the
previous year until September of the current year.
Annual precipitation and river discharge
measure-ments were added for up to ten years back in
time. Multiannual total precipitation from Växjö and
Kävsjö and river discharge measurements from Rörvik
were then correlated with the chronologies. The annual
and multiannual correlations were calculated in the
Excel software. The Matlab software was used to
calculate the significance level of the Pearson’s
product. A significance level of 95% was considered
high and all correlations beneath that were nullified.
Current year total, previous year total and added total
of two up to 10 years of precipitation and river
discharge measurements were correlated with the
chronologies in order to determine any long term
changes in the bog hydrology.
4 Results
4.1 Peat stratigraphy 4.1.1 Transect A The peat depth at sample site 6 is 240 cm and is
situated circa 90 m from the marginal fen stream
(Fig. 5). The lowermost part of the stratigraphy, unit 1-
7, is dominated by fen communities such as Carex
(sedges) and brown mosses (Table 2). The upper part
of the stratigraphy consists of unit 8-12 and is domi-
nated by raised bog plants such as Sphagnum with a
varying degree of humification (Table 2). The domi-
nant present-day flora consists of Pinus sylvestris,
Sphagnum spp., Eriophorum vaginatum, Vaccinium
myrtillus (bilberry) and Betula nana.
170 m from the marginal fen stream lies sample
site 9 with a peat depth of 5 m (Fig. 5). Fen commu-
nities dominate unit 1-6, particularly Carex peat
(Table 3). Sphagnum peat dominate unit 7-19
indicating a raised bog community (Table 3).
The degree of humification varies between medium
and low throughout the raised bog community units.
Calluna vulgaris, Sphagnum spp. and Eriophorum
vaginatum dominate the present-day flora.
4.1.2 Transect B Sample site 3 is located 40 m from the marginal fen
stream and is 240 cm deep (Fig. 5). A fen community
dominates the lower part of the stratigraphy consisting
of unit 1-3 (Table 4). A raised bog community
dominated by Sphagnum spp. builds up unit 4-10
(Table 4). The degree of humification varies from
medium to low. Pinus sylvestris, Vaccinium myrtillus
and brown mosses represent the dominant flora.
Sample site 5 is situated 90 m from the
marginal fen stream. Its peat depth is 385 cm (Fig. 5).
Unit 1-7 is a fen community dominated by Carex
(Table 5). A raised bog community is present at unit 8-
13 dominated by Sphagnum spp (Table 5). The degree
of humification varies between medium and low in the
stratigraphy. The dominant present-day plants are
Calluna vulgaris, Empetrum nigrum (black crowberry)
and Eriophorum vaginatum.

14
Depth (cm) Unit Stratigraphy Degree of humification
0-2 13 Living Sphagnum.
2-9 12 Sphagnum peat. Medium
9-22 11 Sphagnum peat with Eriophorum vaginatum. Low
22-95 10 Sphagnum peat. Low
95-126 9 Sphagnum peat with Eriophorum vaginatum. Low
126-174 8 Sphagnum peat. Low
174-287 7 Carex-Sphagnum peat with E. vagianatum with roots and branches. Medium
287-329 6 Carex peat with Eriophorum vaginatum and coal layers.
329-336 5 Carex peat with brown mosses.
336-361 4 Carex peat with Eriophorum vaginatum.
361-367 3 Carex peat with brown mosses.
367-380 2 Carex peat with Eriophorum vaginatum.
380-385 1 Brown moss peat with Carex.
Table 4. Stratigraphic description of the peat core from transect B, sample point 3.
Depth (cm) Unit Stratigraphy Degree of humification
0-17 10 Sphagnum peat with branches and roots. Medium
17-27 9 Sphagnum peat with Eriophorum vaginatum. Medium
27-59 8 Sphagnum peat. Low
59-63 7 Sphagnum peat with branches and roots. Medium
63-87 6 Sphagnum peat. Low
87-115 5 Sphagnum peat with Eriophorum vaginatum. Low
115-131 4 Sphagnum peat. Low
131-145 3 Carex-Sphagnum peat. Low
145-153 2 Carex-Sphagnum peat. Medium
153-240 1 Carex peat with coal layers and alder wood.
Table 5. Stratigraphic description of the peat core from transect B, sample point 5.
Depth (cm) Unit Stratigraphy Degree of humification
0-14 12 Sphagnum peat with branches and roots. Medium
14-22 11 Sphagnum peat with Eriophorum vaginatum. Low
22-68 10 Sphagnum peat. Medium
68-73 9 Sphagnum-Carex peat. Medium
73-135 8 Sphagnum peat with Carex. Low
135-167 7 Eriophorum vaginatum peat.
167-191 6 Carex peat. Many roots in the lower 6 cm.
191-203 5 Brownmoss peat with Carex.
203-214 4 Carex peat.
214-222 3 Brownmoss peat.
222-239 2 Carex peat with Eriophorum vaginatum.
239-240 1 Charcoal.
Table 2. Stratigraphic description of the peat core from transect A, sample point 6.
Table 3. Stratigraphic description of the peat core from transect A, sample point 9.
Depth (cm) Unit Stratigraphy Degree of humification
0-6 19 Sphagnum peat with Carex. Medium
6-57 18 Sphagnum peat. Low
57-138 17 Sphagnum peat with Eriophorum vaginatum. Low
138-220 16 Sphagnum peat with Eriophorum vaginatum. Medium
220-229 15 Sphagnum peat. Low
229-239 14 Sphagnum peat. Medium
239-298 13 Sphagnum peat with Eriophorum vaginatum. Medium
298-314 12 Sphagnum peat Medium
314-322 11 Sphagnum peat with Eriophorum vaginatum. Medium
322-330 10 Sphagnum peat. Low
330-350 9 Sphagnum peat with Eriophorum vaginatum. Medium
350-374 8 Sphagnum peat. Medium
374-390 7 Sphagnum peat. Low
390-405 6 Carex-Sphagnum peat. Medium
405-410 5 Carex peat with branches and roots.
410-413 4 Fen peat.
413-417 3 Carex peat.
417-431 2 Fen peat with branches and roots.
431-500 1 Carex peat with layers of coal and alder wood.

15
4.2 Tree ages Out of 172 trees, 166 have been given a germination
year. The oldest sample has been given the germi-
nation year 1774±5. It was sampled on the centre of
the bog, outside the stand localities. The youngest tree
sampled has the germination year 1978±5. The mean
year of germination of the sampled trees is 1911±5.
The most frequent germination year is 1906±5 with
eight samples. 28 of the samples have a germination
year in the 1900’s, making it the most productive
decade with 17% of the germination years.
The solid ground stands include 20 trees and
has a mean germination year of 1913±5. The oldest
tree has a germination year of 1887±5 and the
youngest tree 1955±5 (Fig. 9). The three most frequent
germination years in the solid ground stand are
1920±5, 1927±5 and 1931±5, each with two samples.
The marginal fen stands have 28 dated trees.
The mean germination year is 1920±5. The oldest tree
in the stand has a germination year of 1856±5, and the
youngest tree 1978±5 (Fig. 9). The most frequent
germination years of the stand are 1905±5, 1945±5
and 1948±5, with two samples each.
The marginal hummock stands have a mean
germination year of 1899±5. The oldest tree has a
germination year of 1825±5 and the youngest tree
1944±5 (Fig. 9). The total number of dated trees in the
stand is 40. The most frequent germination years are
1905±5 and 1906±5 with four samples each.
The bog plain margin stands have a total of 39
dated trees. The mean germination year is 1926±5.
The oldest tree has a germination year of 1871±5
(Fig. 9). The youngest tree in the stand has a germin-
ation year of 1965±5. The most frequent year of
germination is 1937±5 with four samples.
The Ekeberg stand has a mean germination
year of 1877±5. The oldest tree has a germination year
of 1816±5 and the youngest tree 1915±5 (Fig. 9).
21 samples were dated in the Ekeberg stand. The most
frequent germination year is 1864±5 with three
samples.
The Svensdal stand has seven dated trees.
Fig. 9. Number of trees in the solid ground (black), marginal fen (orange), marginal hummock (red), bog plain margin (blue),
Ekeberg (green), Svensdal (olive green) and Lake Kalvasjön (brown) stands based on the estimated germination year. The
extended fields on each side of the lines represent a five year uncertainty span.
Fig. 10. Number of trees in transect A (grey), transect B (purple) and transect C (gold) based on the estimated germination year.
The extended field on each side of the lines represents a five year uncertainty span.
16
The mean germination year of the stand is 1935±5.
The oldest tree has a germination year of 1925±5
while the youngest tree has a germination year of
1947±5 (Fig. 9). There is no frequent germination year
in the Ekeberg stand since all trees have a unique
germination year.
The Lake Kalvasjön stand consists of ten dated
trees. The mean germination year of the stand is
1937±5. The oldest tree has a germination year of
1923±5 while the youngest tree has a germination year
of 1946±5 (Fig. 9). The most frequent germination
year is 1937±5 with two samples.
The oldest stand is the Ekeberg stand on the
eastern side of the bog followed by the marginal
hummock stand (Fig. 9). The bog plain margin trees,
the marginal fen trees and the solid ground trees are of
roughly the same age. The youngest stands are the
Svensdal and Lake Kalvasjön stands in the north-
eastern part of the sample area, which are roughly of
the same age. The marginal hummock and bog plain
margin tree stands show defined sprouting events
around 1905 and 1925, whereas the marginal fen stand
show a more constant addition of new trees (Fig. 8).
Around 1910-1915 all stands experience almost no
new growth.
Transect B is the oldest transect with a mean
germination year of 1903±5, which is 14 years older
than transect A with a mean germination year of
1917±5 (Fig. 10). The youngest transect is conse-
quently transect C with a mean germination year of
1927±5, although the oldest tree from transect B and C
is only one year apart, 1856±5 and 1857±5 (Fig. 10).
The solid ground stands has been left out of transect A
and B since they are located outside the bog. All
transects experience a sprouting event around 1905
(Fig. 10). The marginal fen stand also has a high
increase of trees around 1945-1950. Almost no new
growth of trees is visible around 1910-1915 (Fig. 10)
4.3 Chronologies
The solid ground chronology consists of 18 samples
covering 104 years, from 1909 to 2012 (Fig. 11).
The total number of samples in this stand is 20.
90% of the available samples are included in the
chronology. The intercorrelation value of the chrono-
logy is 0.583, the highest intercorrelation value
together with the Svensdal chronology. The running
EPS value is constantly above the critical value of 0.85
(Fig. 11).
The marginal fen stand chronology consists of
15 dated samples stretching 124 years, from 1889 to
2012 (Fig. 11). The total number of samples available
is 30, making this stand the worst in terms of included
samples with only 50% of the available samples used
in the chronology. The intercorrelation value of the
chronology is 0.494. The running EPS value is above
the threshold of 0.85 from 1960 to 1990 (Fig. 11).
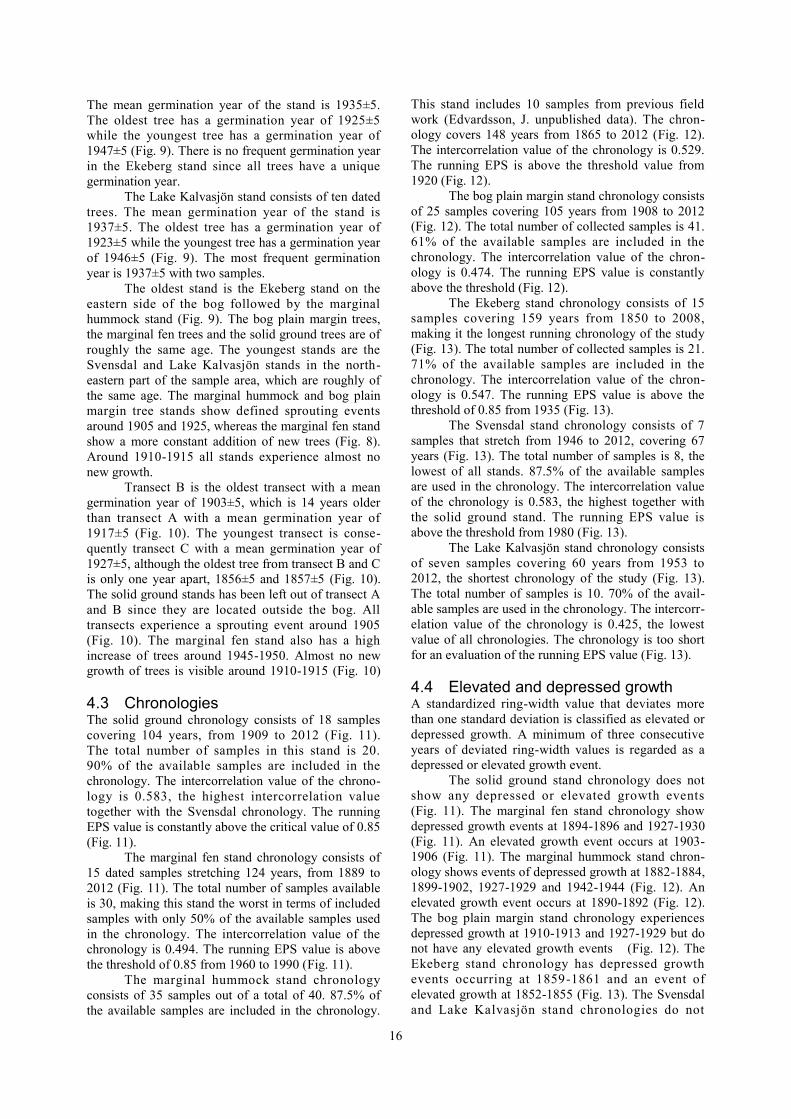
The marginal hummock stand chronology
consists of 35 samples out of a total of 40. 87.5% of
the available samples are included in the chronology.
This stand includes 10 samples from previous field
work (Edvardsson, J. unpublished data). The chron-
ology covers 148 years from 1865 to 2012 (Fig. 12).
The intercorrelation value of the chronology is 0.529.
The running EPS is above the threshold value from
1920 (Fig. 12).
The bog plain margin stand chronology consists
of 25 samples covering 105 years from 1908 to 2012
(Fig. 12). The total number of collected samples is 41.
61% of the available samples are included in the
chronology. The intercorrelation value of the chron-
ology is 0.474. The running EPS value is constantly
above the threshold (Fig. 12).
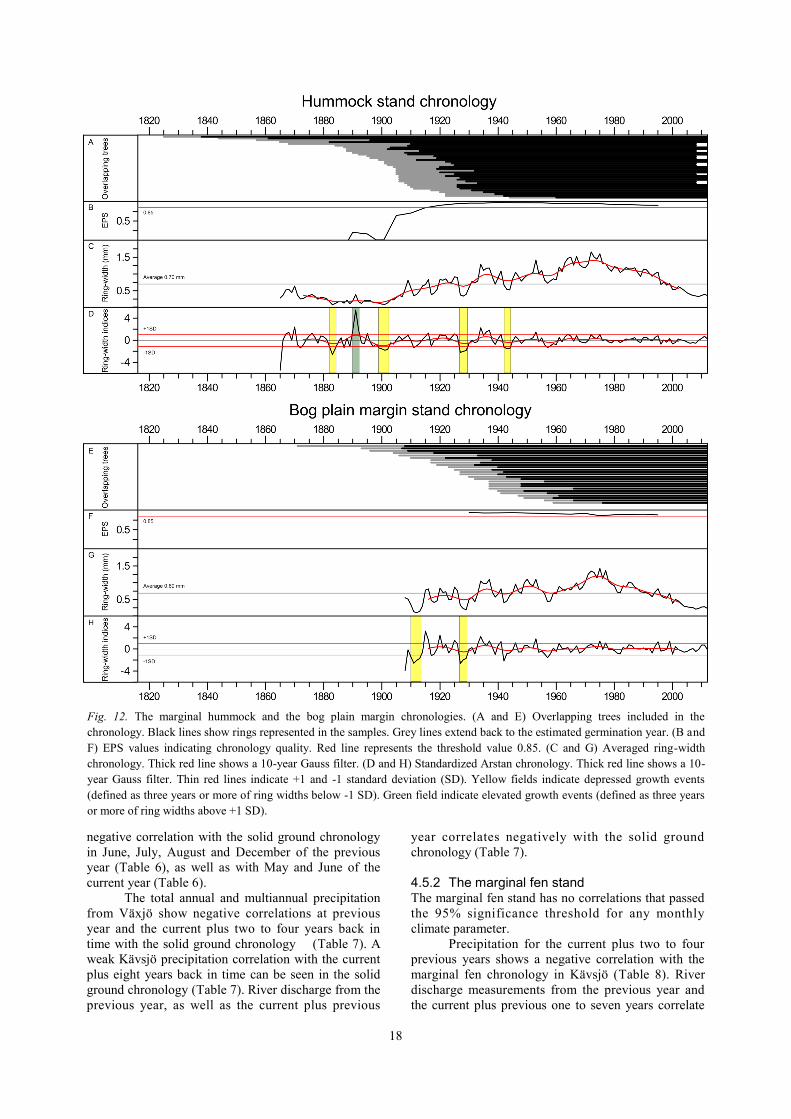
The Ekeberg stand chronology consists of 15
samples covering 159 years from 1850 to 2008,
making it the longest running chronology of the study
(Fig. 13). The total number of collected samples is 21.
71% of the available samples are included in the
chronology. The intercorrelation value of the chron-
ology is 0.547. The running EPS value is above the
threshold of 0.85 from 1935 (Fig. 13).
The Svensdal stand chronology consists of 7
samples that stretch from 1946 to 2012, covering 67
years (Fig. 13). The total number of samples is 8, the
lowest of all stands. 87.5% of the available samples
are used in the chronology. The intercorrelation value
of the chronology is 0.583, the highest together with
the solid ground stand. The running EPS value is
above the threshold from 1980 (Fig. 13).
The Lake Kalvasjön stand chronology consists
of seven samples covering 60 years from 1953 to
2012, the shortest chronology of the study (Fig. 13).
The total number of samples is 10. 70% of the avail-
able samples are used in the chronology. The intercorr-
elation value of the chronology is 0.425, the lowest
value of all chronologies. The chronology is too short
for an evaluation of the running EPS value (Fig. 13).
4.4 Elevated and depressed growth A standardized ring-width value that deviates more
than one standard deviation is classified as elevated or
depressed growth. A minimum of three consecutive
years of deviated ring-width values is regarded as a
depressed or elevated growth event.
The solid ground stand chronology does not
show any depressed or elevated growth events
(Fig. 11). The marginal fen stand chronology show
depressed growth events at 1894-1896 and 1927-1930
(Fig. 11). An elevated growth event occurs at 1903-
1906 (Fig. 11). The marginal hummock stand chron-
ology shows events of depressed growth at 1882-1884,
1899-1902, 1927-1929 and 1942-1944 (Fig. 12). An
elevated growth event occurs at 1890-1892 (Fig. 12).
The bog plain margin stand chronology experiences
depressed growth at 1910-1913 and 1927-1929 but do
not have any elevated growth events (Fig. 12). The
Ekeberg stand chronology has depressed growth
events occurring at 1859-1861 and an event of
elevated growth at 1852-1855 (Fig. 13). The Svensdal
and Lake Kalvasjön stand chronologies do not

17
experience any events of either depressed or elevated
growth (Fig. 13).
The marginal fen stand, the marginal hummock
stand and the bog plain margin stand all experience an
event of depressed growth at 1927-1929. Including the
two years of depressed growth at 1928-1929 in the
Ekeberg stand, all stands located on the bog and
marginal fen experience depressed growth in the late
1920’s.
4.5 Meteorological correlations
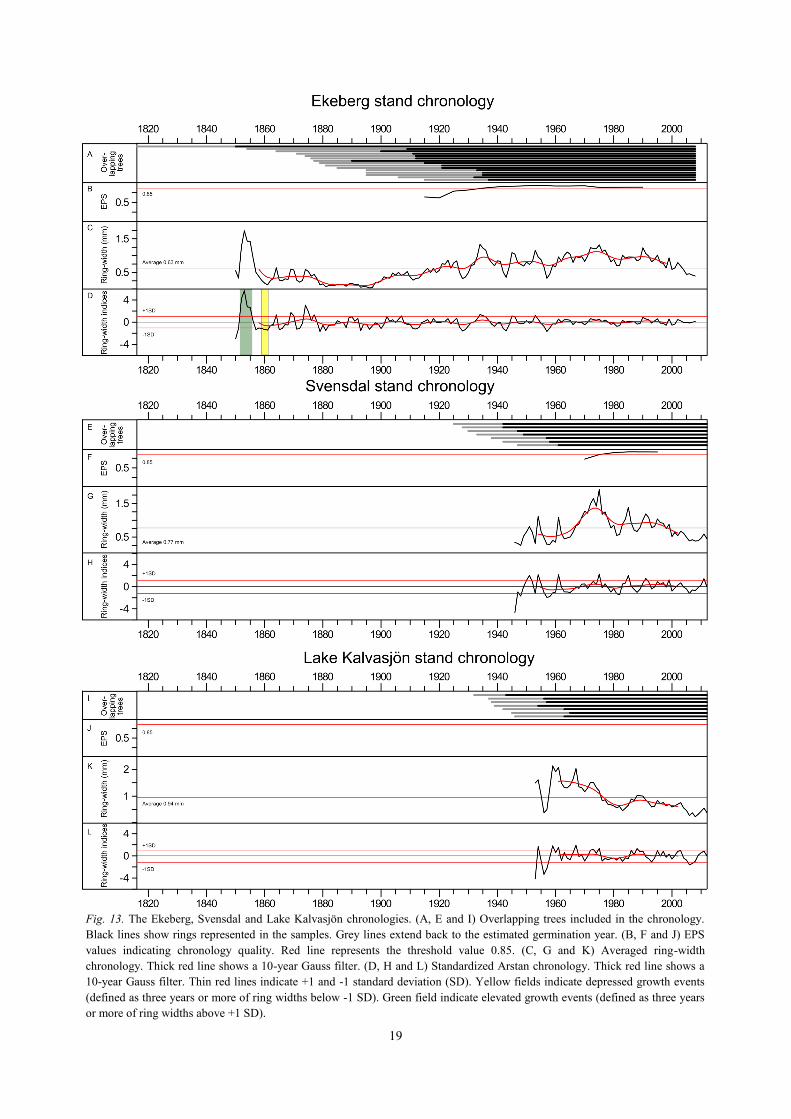
4.5.1 The solid ground stand
The solid ground stand has a high positive correlation
with spring temperature of the current year (Table 6).
November precipitation correlates negatively with the
solid ground chronology both in Kävsjö and Växjö
(Table 6). May precipitation from Växjö correlates
negatively with the solid ground chronology (Table 6).
A weak positive Kävsjö September precipitation of the
current year correlates with the solid ground chrono-
logy (Table 6). River discharge measurements show a
Fig. 11. The solid ground and marginal fen chronologies. (A and E) Overlapping trees included in the chronology. Black lines
show rings represented in the samples. Grey lines extend back to the estimated germination year. (B and F) EPS values
indicating chronology quality. Red line represents the threshold value 0.85. (C and G) Averaged ring-width chronology. Thick
red line shows a 10-year Gauss filter. (D and H) Standardized Arstan chronology. Thick red line shows a 10-year Gauss filter.
Thin red lines indicate +1 and -1 standard deviation (SD). Yellow fields indicate depressed growth events (defined as three
years or more of ring widths below -1 SD). Green field indicate elevated growth events (defined as three years or more of ring
widths above +1 SD).
18
negative correlation with the solid ground chronology
in June, July, August and December of the previous
year (Table 6), as well as with May and June of the
current year (Table 6).
The total annual and multiannual precipitation
from Växjö show negative correlations at previous
year and the current plus two to four years back in
time with the solid ground chronology (Table 7). A
weak Kävsjö precipitation correlation with the current
plus eight years back in time can be seen in the solid
ground chronology (Table 7). River discharge from the
previous year, as well as the current plus previous
year correlates negatively with the solid ground
chronology (Table 7).
4.5.2 The marginal fen stand
The marginal fen stand has no correlations that passed
the 95% significance threshold for any monthly
climate parameter.
Precipitation for the current plus two to four
previous years shows a negative correlation with the
marginal fen chronology in Kävsjö (Table 8). River
discharge measurements from the previous year and
the current plus previous one to seven years correlate
Fig. 12. The marginal hummock and the bog plain margin chronologies. (A and E) Overlapping trees included in the
chronology. Black lines show rings represented in the samples. Grey lines extend back to the estimated germination year. (B and
F) EPS values indicating chronology quality. Red line represents the threshold value 0.85. (C and G) Averaged ring-width
chronology. Thick red line shows a 10-year Gauss filter. (D and H) Standardized Arstan chronology. Thick red line shows a 10-
year Gauss filter. Thin red lines indicate +1 and -1 standard deviation (SD). Yellow fields indicate depressed growth events
(defined as three years or more of ring widths below -1 SD). Green field indicate elevated growth events (defined as three years
or more of ring widths above +1 SD).
19
Fig. 13. The Ekeberg, Svensdal and Lake Kalvasjön chronologies. (A, E and I) Overlapping trees included in the chronology.
Black lines show rings represented in the samples. Grey lines extend back to the estimated germination year. (B, F and J) EPS
values indicating chronology quality. Red line represents the threshold value 0.85. (C, G and K) Averaged ring-width
chronology. Thick red line shows a 10-year Gauss filter. (D, H and L) Standardized Arstan chronology. Thick red line shows a
10-year Gauss filter. Thin red lines indicate +1 and -1 standard deviation (SD). Yellow fields indicate depressed growth events
(defined as three years or more of ring widths below -1 SD). Green field indicate elevated growth events (defined as three years
or more of ring widths above +1 SD).
20
Monthly J J A S O N D J F M A M J J A S
Växjö T 0.33 0.34 0.29
Växjö P -0.21 -0.20
Kävsjö P -0.23 0.21
Rörvik D -0.19 -0.23 -0.21 -0.23 -0.20 -0.21
Annual C Pr. C+ Pr. C+2 Pr. C+3 Pr. C+4 Pr. C+5 Pr. C+6 Pr. C+7 Pr. C+8 Pr. C+9 Pr.
Växjö P
Kävsjö P
Rörvik D -0.22 -0.24 -0.30 -0.29 -0.27 -0.27 -0.26 -0.20
negatively with the marginal fen chronology (Table 8).
The strongest correlation appears at the current plus
two previous years. The correlation value then
decreases and disappears after the current plus prev-
ious six years.
4.5.3 The marginal hummock stand
The marginal hummock chronology shows no tempe-
rature correlations, and only shows a weak positive
correlation with precipitation in September of the
current year (Table 9). Previous July river discharge
measurements show a negative correlation with the
marginal hummock stand (Table 9).
There is no correlation with annual precipi-
tation in the chronology (Table 10). River discharge
measurements from the current and previous year as
well as the current plus one to six previous years
correlates negatively with the marginal hummock
chronology, with the strongest correlation at the
current plus previous year (Table 10).
Table 7. Annual and multiannual precipitation (P) and river discharge (D) correlations for the solid ground stand. The table
contains correlations from the current (C) year and up to nine previous (Pr.) years added together. No value indicate correlations
below the 95% significance level.
Table 6. Monthly temperature (T), precipitation (P) and river discharge (D) correlations for the solid ground stand. The table
ranges from June of the previous year to September of the current year. No value indicate correlations below the 95%
significance level.
Annual C Pr. C+ Pr. C+2 Pr. C+3 Pr. C+4 Pr. C+5 Pr. C+6 Pr. C+7 Pr. C+8 Pr. C+9 Pr.
Växjö P
Kävsjö P -0.20 -0.22 -0.22
Rörvik D -0.22 -0.19 -0.26 -0.30 -0.29 -0.24 -0.22
Annual C Pr. C+ Pr. C+2 Pr. C+3 Pr. C+4 Pr. C+5 Pr. C+6 Pr. C+7 Pr. C+8 Pr. C+9 Pr.
Växjö P -0.22 -0.20 -0.20 -0.20
Kävsjö P -0.21
Rörvik D -0.25 -0.20
Table 8. Annual and multiannual precipitation (P) and river discharge (D) correlations for the marginal fen stand. The table
contains correlations from the current (C) year and up to nine previous (Pr.) years added together. No value indicate correlations
below the 95% significance level.
The solid ground stand
The solid ground stand
The marginal fen stand
Table 9. Monthly temperature (T), precipitation (P) and river discharge (D) correlations for the marginal hummock stand. The
table ranges from June of the previous year to September of the current year. No value indicate correlations below the 95%
significance level.
The marginal hummock stand
Monthly J J A S O N D J F M A M J J A S
Växjö T
Växjö P 0.18
Kävsjö P
Rörvik D -0.22
Table 10. Annual and multiannual precipitation (P) and river discharge (D) correlations for the marginal hummock stand. The
table contains correlations from the current (C) year and up to nine previous (Pr.) years added together. No value indicate
correlations below the 95% significance level.
The marginal hummock stand
21
Annual C Pr. C+ Pr. C+2 Pr. C+3 Pr. C+4 Pr. C+5 Pr. C+6 Pr. C+7 Pr. C+8 Pr. C+9 Pr.
Växjö P
Kävsjö P
Rörvik D -0.24 -0.24 -0.21
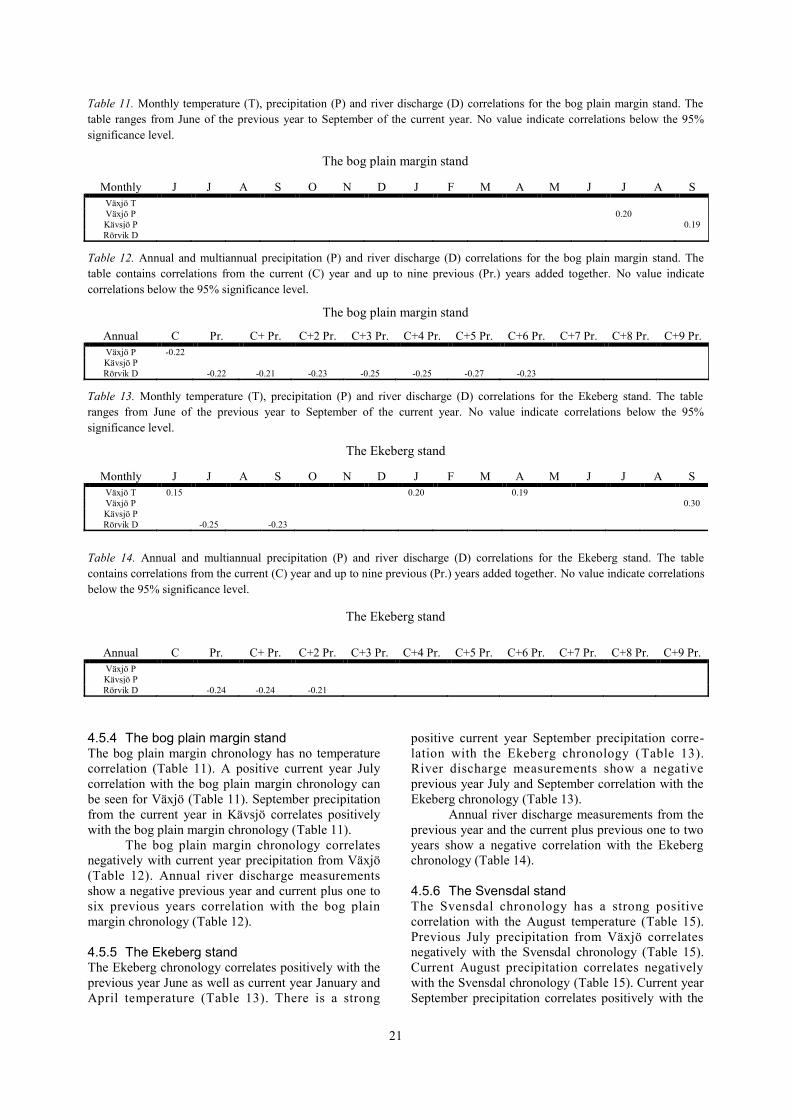
4.5.4 The bog plain margin stand
The bog plain margin chronology has no temperature
correlation (Table 11). A positive current year July
correlation with the bog plain margin chronology can
be seen for Växjö (Table 11). September precipitation
from the current year in Kävsjö correlates positively
with the bog plain margin chronology (Table 11).
The bog plain margin chronology correlates
negatively with current year precipitation from Växjö
(Table 12). Annual river discharge measurements
show a negative previous year and current plus one to
six previous years correlation with the bog plain
margin chronology (Table 12).
4.5.5 The Ekeberg stand The Ekeberg chronology correlates positively with the
previous year June as well as current year January and
April temperature (Table 13). There is a strong
positive current year September precipitation corre-
lation with the Ekeberg chronology (Table 13).
River discharge measurements show a negative
previous year July and September correlation with the
Ekeberg chronology (Table 13).
Annual river discharge measurements from the
previous year and the current plus previous one to two
years show a negative correlation with the Ekeberg
chronology (Table 14).
4.5.6 The Svensdal stand
The Svensdal chronology has a strong positive
correlation with the August temperature (Table 15).
Previous July precipitation from Växjö correlates
negatively with the Svensdal chronology (Table 15).
Current August precipitation correlates negatively
with the Svensdal chronology (Table 15). Current year
September precipitation correlates positively with the
Table 11. Monthly temperature (T), precipitation (P) and river discharge (D) correlations for the bog plain margin stand. The
table ranges from June of the previous year to September of the current year. No value indicate correlations below the 95%
significance level.
The bog plain margin stand
Monthly J J A S O N D J F M A M J J A S
Växjö T
Växjö P 0.20
Kävsjö P 0.19
Rörvik D
Table 12. Annual and multiannual precipitation (P) and river discharge (D) correlations for the bog plain margin stand. The
table contains correlations from the current (C) year and up to nine previous (Pr.) years added together. No value indicate
correlations below the 95% significance level.
The bog plain margin stand
Annual C Pr. C+ Pr. C+2 Pr. C+3 Pr. C+4 Pr. C+5 Pr. C+6 Pr. C+7 Pr. C+8 Pr. C+9 Pr.
Växjö P -0.22
Kävsjö P
Rörvik D -0.22 -0.21 -0.23 -0.25 -0.25 -0.27 -0.23
Table 13. Monthly temperature (T), precipitation (P) and river discharge (D) correlations for the Ekeberg stand. The table
ranges from June of the previous year to September of the current year. No value indicate correlations below the 95%
significance level.
The Ekeberg stand
Monthly J J A S O N D J F M A M J J A S
Växjö T 0.15 0.20 0.19
Växjö P 0.30
Kävsjö P
Rörvik D -0.25 -0.23
Table 14. Annual and multiannual precipitation (P) and river discharge (D) correlations for the Ekeberg stand. The table
contains correlations from the current (C) year and up to nine previous (Pr.) years added together. No value indicate correlations
below the 95% significance level.
The Ekeberg stand

22
Monthly J J A S O N D J F M A M J J A S
Växjö T -0.24 0.34 0.27
Växjö P
Kävsjö P
Rörvik D
Svensdal chronology (Table 15).
The Svensdal chronology does not correlate
with any annual measurement.
4.5.7 The Lake Kalvasjön stand
The Lake Kalvasjön chronology correlates negatively
with previous year September temperature and
correlates positively with March and current year
August temperature (Table 16).
The Lake Kalvasjön chronology does not
correlate with any monthly precipitation or annual
precipitation or river discharge measurements.
5 Discussion
5.1 Chronologies When selecting samples in order to build the different
stand chronologies, the samples which together have
the highest intercorrelation values were selected.
Samples with a large number of rings that can extend
the chronology further back in time have also been
favoured. The rejected trees generally have some
missing rings and occasionally very thin ring-widths.
Leaving these samples out of the chronology will
enhance the possibility of a better correlation with
meteorological measurements. In order to adjust for
this climate-oriented bias, the number of rejected trees
per chronology must be assessed. The series inter-
correlation values are 0.5±0.08 in all chronologies, in
accordance with other studies on bog pine trees in
Sweden and Lithuania (Linderholm 1999; Linderholm
et al. 2002; Vitas 2004). The solid ground stand and
the Svensdal stand have the highest intercorrelation
value (0.583). The solid ground stand should have a
higher series intercorrelation than the bog stands
because the environment is not as extreme for tree
growth at the solid ground, and therefore the tree
growth should be more homogenized. The low amount
of rejected trees, only 10%, in the solid ground stand
validates the stand uniformity. The high inter -
correlation value in the Svensdal stand could be an
effect of the low number of samples in the chronology,
and that the sampled trees grew on a small area
without much change in the microenvironment. In
general the Svensdal and Lake Kalvasjön chronologies
are short and contain few samples, so interpretation of
these s tands i s no t as re l iab le as the o ther
chronologies.
Wigley et al. (1984) proposed a running EPS
value above 0.85 as acceptable for correlating chrono-
logies and meteorological measurements. Therefore, to
correlate the chronologies with meteorological para-
meters only at periods when the EPS threshold is
reached would seem appropriate. However all chrono-
logies, apart from the marginal hummock chronology,
do not reach a high enough EPS value until the
1920’s-1930’s (Fig. 11, Fig. 12, Fig. 13). This could
be explained by the low number of samples in the
early part of the chronologies, as the EPS value is also
dependent on the number of samples (Wigley et al.
1984). Rather than removing the early parts of the
chronologies, in some cases more than 50 rings,
another method was applied. The juvenile growth of
trees is characterized by thick ring widths (Fritts
1976). 20-30 years after germination the ring width
starts to decrease with age (Schweingruber 1996).
The juvenile tree-ring widths do not reflect the climate
to a large extent, and so these rings can be left out of
the samples in order to improve the chronologies.
Therefore the first 20 years from the estimated germi-
nation year was removed from the samples before the
chronologies were built. The advantage of this method
is that the chronologies extend further back in time
than they would have done if the EPS value had
determined the chronology length. The EPS value
should instead be used as a quality control for the
period when all of the samples in the chronology are
present.
Table 15. Monthly temperature (T), precipitation (P) and river discharge (D) correlations for the Svensdal stand. The table
ranges from June of the previous year to September of the current year. No value indicate correlations below the 95%
significance level.
The Svensdal stand
Monthly J J A S O N D J F M A M J J A S
Växjö T 0.25
Växjö P -0.19 -0.25 0.28
Kävsjö P
Rörvik D
Table 16. Monthly temperature (T), precipitation (P) and river discharge (D) correlations for the Lake Kalvasjön stand. The table
ranges from June of the previous year to September of the current year. No value indicate correlations below the 95%
significance level.
The Lake Kalvasjön stand
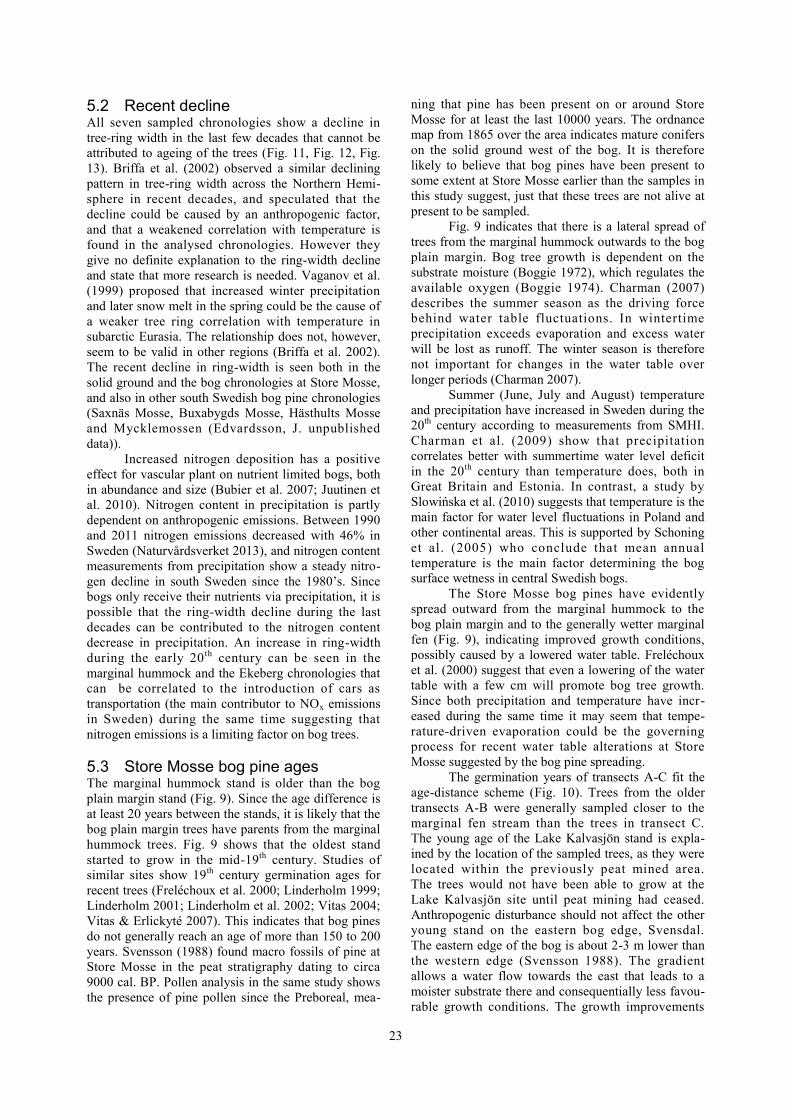
23
5.2 Recent decline
All seven sampled chronologies show a decline in
tree-ring width in the last few decades that cannot be
attributed to ageing of the trees (Fig. 11, Fig. 12, Fig.
13). Briffa et al. (2002) observed a similar declining
pattern in tree-ring width across the Northern Hemi-
sphere in recent decades, and speculated that the
decline could be caused by an anthropogenic factor,
and that a weakened correlation with temperature is
found in the analysed chronologies. However they
give no definite explanation to the ring-width decline
and state that more research is needed. Vaganov et al.
(1999) proposed that increased winter precipitation
and later snow melt in the spring could be the cause of
a weaker tree ring correlation with temperature in
subarctic Eurasia. The relationship does not, however,
seem to be valid in other regions (Briffa et al. 2002).
The recent decline in ring-width is seen both in the
solid ground and the bog chronologies at Store Mosse,
and also in other south Swedish bog pine chronologies
(Saxnäs Mosse, Buxabygds Mosse, Hästhults Mosse
and Mycklemossen (Edvardsson, J. unpublished
data)).
Increased nitrogen deposition has a positive
effect for vascular plant on nutrient limited bogs, both
in abundance and size (Bubier et al. 2007; Juutinen et
al. 2010). Nitrogen content in precipitation is partly
dependent on anthropogenic emissions. Between 1990
and 2011 nitrogen emissions decreased with 46% in
Sweden (Naturvårdsverket 2013), and nitrogen content
measurements from precipitation show a steady nitro-
gen decline in south Sweden since the 1980’s. Since
bogs only receive their nutrients via precipitation, it is
possible that the ring-width decline during the last
decades can be contributed to the nitrogen content
decrease in precipitation. An increase in ring-width
during the early 20 th century can be seen in the
marginal hummock and the Ekeberg chronologies that
can be correlated to the introduction of cars as
transportation (the main contributor to NOx emissions
in Sweden) during the same time suggesting that
nitrogen emissions is a limiting factor on bog trees.
5.3 Store Mosse bog pine ages
The marginal hummock stand is older than the bog
plain margin stand (Fig. 9). Since the age difference is
at least 20 years between the stands, it is likely that the
bog plain margin trees have parents from the marginal
hummock trees. Fig. 9 shows that the oldest stand
started to grow in the mid-19th century. Studies of
similar sites show 19th century germination ages for
recent trees (Freléchoux et al. 2000; Linderholm 1999;
Linderholm 2001; Linderholm et al. 2002; Vitas 2004;
Vitas & Erlickyté 2007). This indicates that bog pines
do not generally reach an age of more than 150 to 200
years. Svensson (1988) found macro fossils of pine at
Store Mosse in the peat stratigraphy dating to circa
9000 cal. BP. Pollen analysis in the same study shows
the presence of pine pollen since the Preboreal, mea-
ning that pine has been present on or around Store
Mosse for at least the last 10000 years. The ordnance
map from 1865 over the area indicates mature conifers
on the solid ground west of the bog. It is therefore
likely to believe that bog pines have been present to
some extent at Store Mosse earlier than the samples in
this study suggest, just that these trees are not alive at
present to be sampled.
Fig. 9 indicates that there is a lateral spread of
trees from the marginal hummock outwards to the bog
plain margin. Bog tree growth is dependent on the
substrate moisture (Boggie 1972), which regulates the
available oxygen (Boggie 1974). Charman (2007)
describes the summer season as the driving force
behind water table fluctuations. In wintertime
precipitation exceeds evaporation and excess water
will be lost as runoff. The winter season is therefore
not important for changes in the water table over
longer periods (Charman 2007).
Summer (June, July and August) temperature
and precipitation have increased in Sweden during the
20th century according to measurements from SMHI.
Charman et al. (2009) show that precipitation
correlates better with summertime water level deficit
in the 20th century than temperature does, both in
Great Britain and Estonia. In contrast, a study by
Slowińska et al. (2010) suggests that temperature is the
main factor for water level fluctuations in Poland and
other continental areas. This is supported by Schoning
et al. (2005) who conclude that mean annual
temperature is the main factor determining the bog
surface wetness in central Swedish bogs.
The Store Mosse bog pines have evidently
spread outward from the marginal hummock to the
bog plain margin and to the generally wetter marginal
fen (Fig. 9), indicating improved growth conditions,
possibly caused by a lowered water table. Freléchoux
et al. (2000) suggest that even a lowering of the water
table with a few cm will promote bog tree growth.
Since both precipitation and temperature have incr-
eased during the same time it may seem that tempe-
rature-driven evaporation could be the governing
process for recent water table alterations at Store
Mosse suggested by the bog pine spreading.
The germination years of transects A-C fit the
age-distance scheme (Fig. 10). Trees from the older
transects A-B were generally sampled closer to the
marginal fen stream than the trees in transect C.
The young age of the Lake Kalvasjön stand is expla-
ined by the location of the sampled trees, as they were
located within the previously peat mined area.
The trees would not have been able to grow at the
Lake Kalvasjön site until peat mining had ceased.
Anthropogenic disturbance should not affect the other
young stand on the eastern bog edge, Svensdal.
The eastern edge of the bog is about 2-3 m lower than
the western edge (Svensson 1988). The gradient
allows a water flow towards the east that leads to a
moister substrate there and consequentially less favou-
rable growth conditions. The growth improvements

24
seen in the western part of Store Mosse was therefore
delayed in the eastern part.
The Ekeberg stand consists of scattered trees
300-500 m from the eastern bog edge (Fig. 4). Parts of
the eastern marginal fen, where the Ekeberg stand is
located, have been drained sometime during the 19th
century (Naturvårdsverket 1996). According to Schw-
eingruber (1996) drainage affects tree growth up to
approximately 250 m from the trench. However, it
might be more likely that trees in the Ekeberg stand
germinated on drier peat hummocks on the bog, since
they are not located at the actual bog edge and that
anthro-pogenic disturbance therefore should have had
no or only minor influence on trees in the Ekeberg
stand.
5.4 Bog setting and pine growth
Peatlands consist of two layers, the upper acrotelm and
the lower catotelm (Fig. 14). The acrotelm is active,
where most of growth and decay processes occur
(Charman 2002). The catotelm is constantly saturated
and anaerobic with very slow water movement
(Ingram 1983). In contrast, the acrotelm has a fluct-
uating water table and is periodically aerobic with a
considerably faster water flow than in the catotelm
(Charman 2002). Kilian et al. (1995) concluded that
there is a time lag in bog reaction to climate changes.
The central part of the bog reacts first, and as the water
flow is directed towards the edges hydrological chan-
ges will occur over time. The water table in the
acrotelm seldom drops more than a few decimetres
below the bog surface (Evans et al. 1999). Recharge of
the water table is instantaneous and excess water exits
mainly as runoff or as a flow in the upper 10 cm
(Holden & Burt 2003). Tree growth on the bog surface
is limited by the water table controlled oxygen availa-
bility, and as a consequence bog trees adapt with a
shallow root system (Fig. 14) (Lieffers & Rothwell
1987). There is therefore a risk that a summer drought
could lower the water table to such an extent that
water uptake is inhibited by the shallow root system
(Dang & Lieffers 1989).
The trees on the western edge of Store Mosse
show a height gradient, similar to the study by
Freléchoux et al. (2000). The tallest trees are located
close to the solid ground and trees get progressively
shorter outwards on the bog. The bog tree size seems
to mainly depend on the height of the water table and
the nutrient availability (Fig. 14). Even though the
marginal fen is often waterlogged, due to the water
flow directed towards the marginal fen stream, trees
are taller there than at the actual raised bog. This could
be explained by the nutrient availability that is greater
in a fen as nutrient inflow occurs from the surrounding
solid ground as well (Fig. 14). This is supported by the
average ring width, which is greater in the marginal
fen chronology than in the bog chronologies (Fig. 11,
Fig. 12, Fig. 13). The peat depth in the marginal fen is
approximately 50 cm. Shallow root systems prevent
trees to grow tall, as the risk of windthrow is greater
(Lieffers & Rothwell 1987). The tall trees in the
marginal fen must therefore be anchored in the solid
Fig. 14. Schematic profile of a typical raised bog edge. The borders of the marginal fen, marginal hummock and bog plain
margin stands are defined at the figure top. Note that the height of the bog marginal hummock is exaggerated. Water flow is
directed towards the marginal fen stream to the left. Dashed line (A) represents the general water table sloping slightly towards
the marginal fen stream. (B) Indicates the possible root depth depending on the position of the water table. The arrow (C) shows
an inflow of water and nutrients to the marginal fen from the adjacent solid ground. The only moisture input to the raised bog
comes from precipitation (D). In the marginal fen area the distance between peat surface and substrate (E) is short allowing roots
to penetrate the solid ground. The catotelm (dark brown) is anaerobic and has an almost constant water content. The Acrotelm
(light brown) has a fluctuating water content and is periodically aerobic. Note the height gradient of the trees.
25
ground, where their height can be supported and nutri-
ents are readily accessible.
As peat depth increases tree height is reduced.
The peat surface profiles (Fig. 5) show a hummocky
landform reaching about 100 m out on the bog.
The water table is relatively low here as the marginal
hummock reaches about 30-50 cm above the main bog
surface (Fig. 14). A measurement in October 2012
shows that the water table was standing 23 cm below
the surface in an excavated observational hole in
transect A, sample point 6. The relatively low water
table allows roots to penetrate deeper and anchor in the
substrate (Fig. 14). The aver-age ring width is
considerably smaller in the bog trees than in the solid
ground and marginal fen trees, sugge-sting nutrient
deficiency. A relatively low water table and poor
nutrient availability is reflected in the interm-ediate
height of the bog trees growing on the marginal
hummock.
At the bog plain margin trees occur more scatt-
ered and are both shorter and show smaller stem
diameter. Here the water table was only 3 cm below
the bog surface at transect A, sample point 9 when
measured in October 2012. The pH and nutrient avail-
ability is low, thus limiting tree growth together with
the high water table that prevents any deeper root
penetration (Fig. 14). Tree growth in this environment
is more dependent on the microtopography, as small
hummocks can provide dry sanctuaries for bog trees.
The number of samples that are absent from the
chronologies is reflected in the site conditions. 50% of
the samples are lacking from the marginal fen
chronology, which suggests that even though nutrient
availability is high and trees grow tall, frequent water-
logging affects the growth homogeneity of the stand.
Observations by the author from the site describe the
marginal fen trees as having hunched and twisted
stems, suggesting periodically deteriorating growth
conditions. The growth homogeneity is greatest in the
marginal humm-ock stand, where 87.5% of the
samples are present in the chronology, due to the
relatively favourable water table conditions. As the
water table gets closer to the bog surface at the bog
plain margin waterlogging incr-eases and growth
homogeneity is reduced. Here 61% of the samples are
present in the stand chronology.
5.5 Possible anthropogenic impact
There are several studies regarding drainage impact on
bog pines (eg, Freléchoux et al. 2000; Grünig 1955;
Linderholm 1999). However, these studies have been
performed on substantially smaller bogs where the
sampled trees have been situated close to the drained
or peat mined area. Axbom (2012) found a correlation
between anthropogenic drainage and tree replication
on three bogs in Småland, south Sweden. It is tempting
to draw similar conclusions for Store Mosse as rapid
tree replication fits with the start of peat mining in the
early 1900’s according to Dahlberg (1988). However,
Schweingruber (1996) described that a drainage
channel affects tree growth at a distance of up to 250
m. The situation on Store Mosse is quite different.
The area where peat mining occurred is located over 3
km from the nearest transect (transect C). Also the
large fen soak Blådöpet lies between the mined area
and the sample sites (Fig. 4). Blådöpet should act as a
hydrological neutraliser leaving the southern part of
Store Mosse unaffected by drainage caused by peat
mining. The drainage channel on the eastern side is
located about 1.5 km from the western edge. Here the
distance also seems too great for having an effect on
the sampled bog trees.
5.6 Climate and hydrology
Climatic parameters are not the only factors that
govern tree-ring width. Another factor influencing ring
width variations is tree density, resulting in compe-
tition within the stand for light and available nutrients
and water (Linares et al. 2009; Michelot et al. 2012).
The age of a tree also affects the ring-width pattern
(Fritts 1976). Reproduction limits ring width as
extensive cone production some years allows less
energy for growing thick rings than years where fewer
cones are produced (Linderson, H. personal commun-
ication). Although on a bog environment competition
for light and water will not be as limiting due to the
low density of trees.
The solid ground chronology shows a high
positive correlation with spring temperature. A warm
spring extends the growth period as winter dormancy
is broken earlier, and a thicker ring-width is obtained.
Linderson (1992) presented similar results and
suggests that pine metabolism requires a high
temperature. The Ekeberg chronology shows corres-
ponding results, with warm January and April
resulting in thicker tree-rings. None of the stands from
transects A-C show a temperature correlation
exceeding the 95% significance level. Similar results
were described in the study by Linderholm (2001).
The two eastern stands, Svensdal and Lake Kalvasjön,
correlate positively with August temperature.
Lake Kalvasjön correlates positively with March as
well. A higher than normal summer temperature
increases evaporation, resulting in a slightly lowered
water table and better growth conditions that could
explain the temperature correlations at the eastern bog
edge. A higher than normal summer temperature
would also mean less precipitation as high sun
insolation is a result of a less extensive cloud cover.
Due to the peatland surface slope the eastern bog edge
should be more prone to waterlogging conditions. This
might explain why the western stands show no
temperature correlation.
All the chronologies have a normal distribution,
defined as when at least two thirds of the values lie
within one standard deviation from the average ring
width (Schweingruber 1988). Three years or more of
tree-ring widths deviating one standard deviation also
defines depressed and elevated growth events, in
accordance with Edvardsson et al. (2012). There are
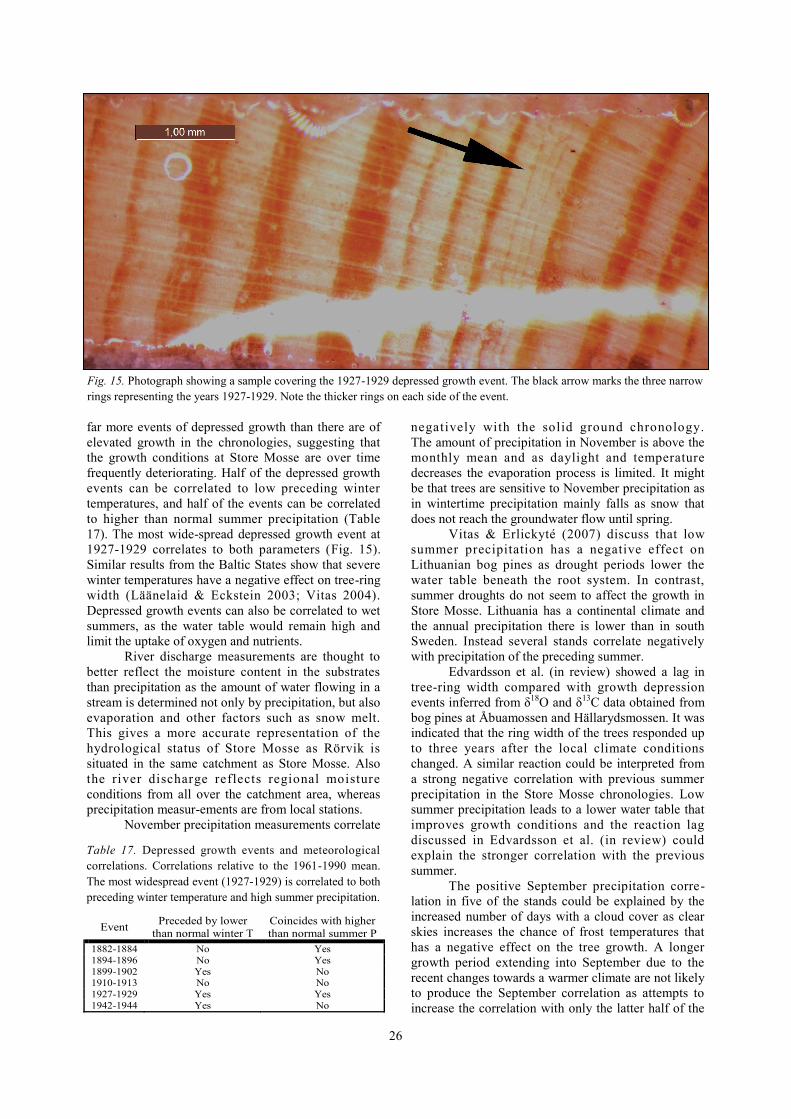
26
far more events of depressed growth than there are of
elevated growth in the chronologies, suggesting that
the growth conditions at Store Mosse are over time
frequently deteriorating. Half of the depressed growth
events can be correlated to low preceding winter
temperatures, and half of the events can be correlated
to higher than normal summer precipitation (Table
17). The most wide-spread depressed growth event at
1927-1929 correlates to both parameters (Fig. 15).
Similar results from the Baltic States show that severe
winter temperatures have a negative effect on tree-ring
width (Läänelaid & Eckstein 2003; Vitas 2004).
Depressed growth events can also be correlated to wet
summers, as the water table would remain high and
limit the uptake of oxygen and nutrients.
River discharge measurements are thought to
better reflect the moisture content in the substrates
than precipitation as the amount of water flowing in a
stream is determined not only by precipitation, but also
evaporation and other factors such as snow melt.
This gives a more accurate representation of the
hydrological status of Store Mosse as Rörvik is
situated in the same catchment as Store Mosse. Also
the river discharge reflects regional moisture
conditions from all over the catchment area, whereas
precipitation measur-ements are from local stations.
November precipitation measurements correlate
negatively with the solid ground chronology.
The amount of precipitation in November is above the
monthly mean and as daylight and temperature
decreases the evaporation process is limited. It might
be that trees are sensitive to November precipitation as
in wintertime precipitation mainly falls as snow that
does not reach the groundwater flow until spring.
Vitas & Erlickyté (2007) discuss that low
summer precipitation has a negative effect on
Lithuanian bog pines as drought periods lower the
water table beneath the root system. In contrast,
summer droughts do not seem to affect the growth in
Store Mosse. Lithuania has a continental climate and
the annual precipitation there is lower than in south
Sweden. Instead several stands correlate negatively
with precipitation of the preceding summer.
Edvardsson et al. (in review) showed a lag in
tree-ring width compared with growth depression
events inferred from δ18O and δ13C data obtained from
bog pines at Åbuamossen and Hällarydsmossen. It was
indicated that the ring width of the trees responded up
to three years after the local climate conditions
changed. A similar reaction could be interpreted from
a strong negative correlation with previous summer
precipitation in the Store Mosse chronologies. Low
summer precipitation leads to a lower water table that
improves growth conditions and the reaction lag
discussed in Edvardsson et al. (in review) could
explain the stronger correlation with the previous
summer.
The positive September precipitation corre-
lation in five of the stands could be explained by the
increased number of days with a cloud cover as clear
skies increases the chance of frost temperatures that
has a negative effect on the tree growth. A longer
growth period extending into September due to the
recent changes towards a warmer climate are not likely
to produce the September correlation as attempts to
increase the correlation with only the latter half of the
Fig. 15. Photograph showing a sample covering the 1927-1929 depressed growth event. The black arrow marks the three narrow
rings representing the years 1927-1929. Note the thicker rings on each side of the event.
Event Preceded by lower
than normal winter T
Coincides with higher
than normal summer P
1882-1884 No Yes
1894-1896 No Yes
1899-1902 Yes No 1910-1913 No No
1927-1929 Yes Yes
1942-1944 Yes No
Table 17. Depressed growth events and meteorological
correlations. Correlations relative to the 1961-1990 mean.
The most widespread event (1927-1929) is correlated to both
preceding winter temperature and high summer precipitation.

27
River
discharge C Pr. C+ Pr. C+2 Pr. C+3 Pr. C+4 Pr. C+5 Pr. C+6 Pr. C+7 Pr. C+8 Pr. C+9 Pr.
S.G. -0.25 -0.20
M.F. -0.22 -0.19 -0.26 -0.30 -0.28 -0.24 -0.22
M.H. -0.22 -0.24 -0.30 -0.29 -0.27 -0.27 -0.26 -0.20
B.P.M. -0.22 -0.21 -0.23 -0.25 -0.25 -0.27 -0.23
E. -0.24 -0.24 -0.21
S.
L.K.
chronologies gave insignificant improvements.
The monthly temperature, precipitation and
river discharge measurements can explain some of the
tree-ring width variations but the results are incon-
clusive and fragmentary. Two to four years of added
annual river discharge measurements show coherent
results from four of the six fen and bog stands,
including all stands at the western edge (Table 18).
The strongest correlation occurs with two to four years
of added annual measurements. This is a clear
indication of that there is a response lag to water level
changes in tree-ring width, as suggested by Edvard-
sson et al. (in review). River discharge better reflects
the hydro logical se t t ing in the bog as both
precipitation and evaporation is accounted for in the
river discharge measurements.
Annual climatic and environmental variations
are better reflected in the tree-ring records than
monthly precipitation and temperature measurements.
Several similar studies have suggested that water level
changes over several years are an important factor
determining bog-tree growth (eg, Boggie 1972;
Linderholm 2001; Linderholm et al. 2002). Therefore,
chronologies from bog trees seem to be more reliable
for studies regarding annual to decadal water level
changes than for studying high-frequency recon-
structions of precipitation and temperature. Since the
chronologies show a consistent correlation with annual
river discharge the bog water table is seemingly the
governing factor for bog-tree growth regardless of the
location of the stand. However, studies aiming to
reconstruct temperature or precipitation based on trees
growing on bogs should focus on marginal hummock
trees, where the growth conditions are tolerable (a
relatively lowwater table) and homogeneity among the
trees is large. Trees residing in marginal fens are least
suitable for climatic recons-tructions as the frequent
waterlogging severely disturbs the regional climatic
signal.
6 Conclusions The peat depth and topography govern the
height and size of the bog pines at Store Mosse
as nutrient availability, water table fluctuations
and shallow root depth limits tree growth.
Bog pines situated at the marginal hummock
have relatively good growth conditions and
uniform ring patterns that indicate a relatively
good climate signal. The frequently water-
logged marginal fen is least suitable for climate
correlations. Anthropogenic disturbance such as peat mining
and drainage on Store Mosse has had no visible
effect on the ring width of the sampled bog
pines. Therefore, ring widths should reflect
hydrological and climatological changes. Depressed growth events can be correlated with
cold winters and wet summers including the
most wide-spread depressed growth event 1927
-1929.
River discharge measurements show better
correlations with the chronologies than
precipitation, indicating that river discharge
should better represent the actual substrate
moisture conditions.
Monthly temperature and precipitation correlate
inconsistently with the different stands, sugg-
esting that the main factor governing tree
growth is water table fluctuations. Monthly
correlations with previous summer precipitation
and river discharge indicates a lag response in
the tree-ring records. This is confirmed by
annual water flow measurements that indicate a
response lag of two to four years between
substrate moisture conditions and tree-ring
records from Store Mosse.
7 Acknowledgements
I would like thank my supervisor Dan Hammarlund
for help with the field work, for reviewing and
commenting on my manuscript and for interesting
discussions regarding this project. Thanks to my
supervisor Johannes Edvardsson for help with the field
work, lab work, for introducing me to various dendro-
softwares and for dendro-discussions. I would also like
to thank my supervisor Hans Linderson for teaching
me the basics of dendrochronology, for always taking
time to discuss and challenge my questions. Also,
thanks for lending me a spot in the dendro lab. Thanks
to Mats Rundgren and Christine Åkesson for
invaluable help with the field work. I would also like
to thank the county administrative board in Jönköping
Table 18. Compilation of water flow correlations with the solid ground (S.G.), marginal fen (M.F.), marginal hummock (M.H.),
bog plain margin (B.P.M), Ekeberg (E), Svensdal (S) and Lake Kalvasjön (L.K.) chronologies. The results show a peak in
negative correlation at two to four years of added water flow measurements. The marginal fen, marginal hummock and bog
plain margin chronologies show the highest correlations. The strength of the correlation fades away after four years of added
water flow measurements.
28
for giving permit to work at the Store Mosse national
park. Thanks to Ellen Persson for translation of the old
German paper and thanks to Lennart Fritz at
Föreningen Store Mosse nationalpark for providing
information regarding the peat mining industry at
Store Mosse.
8 References Andréasson, P . G.(ed), 2006: Geobiosfären .
Studentlitteratur; Lund. 604 pp.
Axbom, J., 2012: Klimatets och människans inverkan
på tallens etablering på sydsvenska mossar
under de senaste århundradena - en
dendrokronologisk och torvstratigrafisk
analys av tre småländska mossar. Examens-
arbeten i Geologi vid Lunds universitet –
kandidatarbete, nr 321; Lund. 21 pp.
Biondi, F. & Waikul, K., 2004: DENDROCLIM2002:
A C++ program for statistical calibration of
climate signals in tree-ring chronologies.
Computers & Geosciences 30, 303-311.
Boggie, R., 1972: Effect on Water-table Height on
Root Development of Pinus Contorta on Deep
Peat in Scotland. Oikos 23, 3, 304-312.
Boggie, R., 1974: Response of seedlings of Pinus
contorta and Picea sitchensis to oxygen
concentration in culture solution. New
phytologist 73, 3, 467-473.
Borgmark, W. & Wastegård, S., 2008: Regional and
local patterns of peat humification in three
raised peat bogs in Värmland, south-central
Sweden. GFF 130, 161-176.
Briffa, K. R., Osborn, T. J., Schweingruber, F. H.,
Jones, P. D., Shiyatov, S. G. & Vaganov, E.
A., 2002: Tree-ring width and density data
around the Northern Hemisphere: Part 1,
local and regional climate signals. The
Holocene 12, 6, 737-757.
Bubier, J. L., Moore, T. R. & Bledzki, L. A., 2007:
Effects of nutrient addition on vegetation and
carbon cycling in an ombrotrophic bog.
Global Change Biology 13, 1168-1186.
Charman, D., 2002: Peatlands and Environmental
Change. John Wiley & Sons; Chichester. 301
pp.
Charman, D. J., 2007: Summer water deficit variability
controls on peatland water-table changes:
implications for Holocene palaeoclimate
reconstructions. The Holocene 17, 2, 217-
227.
Charman, D. J., Barber, K. E., Blaauw, M., Langdon,
P. G., Mauquoy, D., Daley, T. J., Hughes, P.
D. M. & Karofeld, E., 2009: Climate drivers
fo r p ea t l and p a laeo c l ima te r eco rd s .
Quaternary Science Reviews 28, 1811-1819.
Cook, E. R. & Holmes, L. R., 1999: Users manual for
program ARSTAN. Laboratory of Tree-Ring
Research, University of Arizona. Tucson,
Arizona, USA. (https://www2.nancy.inra.fr/
unites/lerfob/ecologie-forestiere/pages-perso/f
-lebourgeois/documents/docrecherche/
Manuel_ARSTAN.pdf) (2013-04-02)
Dahlberg, B., 1988: Historik över Hädinge Torfströ
AB. Unpublished. 4 pp.
Dang, Q. L. & Lieffers, V. J., 1989: Climate and
annual ring growth of black spruce in some
Alberta peatlands. Canadian Journal of
Botany 67, 6, 1885-1889.
Debain, S., Curt, T., Lepart, T. & Prevosto, B., 2003:
Reproductive variability in Pinus sylvestris in
southern France: Implications for invasion.
Journal of Vegetation Science 14, 509-516.
Eckstein, D., 1984: Handbooks for archeologists N.2
Dendrochronological dating . European
Science Foundation; Strasbourg. 55 pp.
Eckstein, J., Leuschner, H. H., Bauerochse, A. & Sass-
Klaassen, U., 2009: Subfossil bog-pine
horizons document climate and ecosystem
c h a n g e s d u r i n g t h e M i d -H o l o c e n e .
Dendrochronologia 27, 129-146.
E d v a r d s s o n , J . , 2 0 0 6 : D e n d r o k r o n o l o g i s k
undersökning av tallbestånds etablering,
tillväxtdynamik och degenerering orsakat av
klimatrelaterade hydrologiska variationer på
Viss mosse och Åbuamossen, Skåne, södra
Sverige, 7300-3200 cal. BP. Examensarbeten
i Geologi vid Lunds universitet – Kvartär-
geologi, nr. 206; Lund. 28 pp.
Edvardsson, J., Linderson, H., Rundgren, M. &
Hammarlund, D., 2012: Holocene peatland
development and hydrological variability
inferred from bog-pine dendrochronology and
peat stratigraphy – a case study from southern
Sweden. Journal Of Quaternary Science 27,
553-563.
Edvardsson, J., Edwards, T. W. D., Linderson, H. &
Hammarlund, D., Climate forcing of growth
depression in subfossil South Swedish bog
p ines in fer red fro m s t ab le i so topes .
Dendrochronologia, in review.
Efron, B., 1979: Bootstrap methods: another look at
the jackknife. Annals of Statistics 7, 1, 1-26.
Evans, M. G., Burt, T. P., Holden, J. & Adamson, J.
K., 1999: Runoff generation and water table
fluctuations in blanket peat: evidence from
UK data spanning the dry summer of 1995.
Journal of Hydrology 221, 141-160.
Freléchoux, F., Buttler, A., Schweingruber, H. &
Gobat, J.-M., 2000: Stand structure, invasion,
and growth dynamics of bog pine (Pinus
uncinata var. rotundata) in relation to peat
cutting and drainage in the Jura Mountains,
Switzerland. Canadian Journal of Forest
Research 30, 1114-1126.
Fritts, H. C., 1976: Tree rings and climate. Academic
Press; London. 552 pp.
Grünig, P . E . , 1955: Über den Einf luß der
Entwässerung auf die Flachmoorvegetation
und auf den Zuwachs der Ficthe und

29
Bergföhre im Flyschgebiet der Voralpen.
Mitteilungen der Schweizerischen Anstalt für
das forstliche Versuchswesen 31, 419-492.
Guiot, J., 1991: The bootstrapped response function.
Tree-ring bulletin 51, 39-41.
Gunnarson, B. E., 1999: A 200-year tree-ring
chronology of pine from a raised bog in
Sweden: Implication for climate change?
Geografiska Annaler 81 A (3), 421-430.
Holden, J. & Burt, T. P., 2003: Runoff production in
blanket peat covered catchments. Water
resources research 39, 7, 1-9.
Holmes, R. L., 1999: Users manual for program
COFECHA. Laboratory of Tree -Ring
Research, University of Arizona. Tucson,
Arizona, USA. (https://www2.nancy.inra.fr/
unites/lerfob/ecologie-forestiere/pages-perso/f
-lebourgeois/documents/docrecherche/
Manuel_ARSTAN.pdf) (2013-04-02)
Ingram, H. A. P., 1983: Hydrology. In: Gore, A. J. P.
(ed). Ecosystems of the world 4A, Mires:
Swamp, Bog, Fen and Moor. Elsevier;
Oxford. 67-158.
IPCC, 2007: Climate Change 2007: Synthesis Report.
Contribution of Working Groups I, II and III
to the Fourth Assessment Report of the Inter-
governmental Panel on Climate Change
[Core Writing Team, Pachauri, R.K and
Reisinger, A.(eds.)]. IPCC; Geneva. 104 pp.
Juutinen, S., Bubiel, J. L. & Moore, T. R., 2010:
Responses of Vegetation and Ecosystem CO2
Exchange to 9 Years of Nutrient Addition at
Mer Bleue Bog. Ecosystems 13, 874-887.
Karlsson, C., 2000: Seed production of Pinus
sylvestris after release cutting. Canadian
Journal of Forest Research 30, 982-989.
Kilian, M. R., van der Plicht, J. & Van Geel, B., 1995:
Dating raised bogs: new aspects of AMS 14
C
wiggle matching, a reservoire effect and
climatic change. Quaternary Science Reviews
14, 959-966.
Kutner, M. H., Nachtsheim, C. J., Neter, J. & Li, W.,
2005: Applied Linear Statistical Models –
fifth edition. McGraw-Hill/Irwin; New York.
1396 pp.
Lieffers, V. J. & Rothwell, R. L., 1987: Rooting of
peatland black spruce and tamarack in
relation to depth of water table. Canadian
Journal of Botany 65, 5, 817-821.
Linares, J. C., Camarero, J. J. & Carreira, J. A., 2009:
Plastic responses of Abies pinsapo xylo-
genesis to drought and competition. Tree
Physiology 29, 1525-1536.
Linderholm, H. W., 1999: Climatic and anthropogenic
influences on radial growth of Scots pine at
Hanvedsmossen, a raised peat bog, in south
central Sweden. Geografiska Annaler 81 A
(1), 75-86.
Linderholm, H. W., 2001: Climatic Influence on Scots
Pine Growth on Dry and Wet Soils in the
Central Scandinavian Mountains, Interpreted
from Tree-Ring Widths. Silva Fennica 35,
415-424.
Linderholm, H. W., Moberg, A. & Grudd, H., 2002:
Peatland pines as climate indicators? A
regional comparison of the climatic influence
on Scots pine growth in Sweden. Canadian
Journal of Forest Research 32, 1400-1410.
Linderso n, H. , 1992: Dendrocl imato lo gica l
investigation in Southern Sweden. Tree rings
and environment. Proceedings of the Inter-
national Dendrochronological Symposium
1990, Lundqua report 34; Lund, 198-201.
Ljungqvist, F. C., 2010: A new reconstruction of
temperature variability in the extra-tropical
Northern Hemisphere during the last two
millennia. Geografiska Annaler 92 A (3) 339-
351.
Lundqvist, J. & Wohlfarth, B., 2001: Timing and east-
west correlation of south Swedish ice
marginal lines during the Late Weichselian.
Quaternary Science Reviews 20, 1127-1148.
Länsstyrelsen i Jönköpings län, 2010: Hydrologi ,
vegetation och fågelliv i Store mosse national
-park. Meddelande nr 2010:22. 50 pp.
Läänelaid, A. & Eckstein, D., 2003: Development of a
Tree-ring Chronology of Scots Pine (Pinus
sylvestris L.) for Estonia as a Dating Tool and
Climatic Proxy. Baltic Forestry 9 (2), 76-82.
Michelot, A., Simard, S., Rathbeger, C., Dufrêne, E. &
Damesin, C., 2012: Comparing the intra-
annual wood formation of three European
species (Fagus sylvatica, Quercus petraea
and Pinus sylvestris) as related to leaf
phenology and non-structural carbohydrate
dynamics. Tree Physiology 32, 1033-1043.
Naturvårdsverket, 1996: Berggrund, Jordarter och
Geomorfologi, Store Mosse nationalpark .
Rapport 4465. 2 pp.
Naturvårdsverket, 2013: Informative Inventory Report
Sweden 2013. 144 pp.
Nilsson, E., 1953: Om södra Sveriges senkvartära
historia. Geologiska Föreningens i Stockholm
Förhandlingar 75, 155-246.
Nilsson, N. E.(ed), 1990: Skogen – Sveriges National-
atlas. Bokförlaget Bra Böcker; Höganäs. 144
pp.
Persson, M., 2008: Beskrivning till jordartskartan 5D
V ä r n a m o N O . S v e r i g e s G e o l o g i s k a
Undersökningar Serie K 113, 12 pp.
R i n n , F . , 2 0 0 3 : T S AP W i n u se r r e f e r e n ce .
Unpublished. 110 pp.
Runefelt, L.(ed), 2008: Svensk mosskultur. Odling,
torvanvändning och landskapets förändring
1 7 5 0 - 2 0 0 0 . K u n g l i g a s k o g s - o c h
lantbruksakademien: Skogs- och lantbruks-
historiska meddelanden nr 41; Stockholm.
526 pp.

30
Rydin, H., Sjörs, H. & Löfroth, M., 1999: Mires. In:
Rydin, H., Snoeijs, P., and Diekmann, M.
(ed). Swedish plant geography. Svenska
Växtgeografiska Sällskapet; Uppsala. 91-112
pp.
Schoning, K., Charman, D. J. & Wastegård, S., 2005:
Reconstructed water tables from two ombro-
trophic mires in eastern central Sweden
compared with instrumental meteorological
data. The Holocene 15, 1, 111-118.
Schweingruber, F. H., 1988: Tree rings – Basics and
Applications of Dendrochronology. Kluwer
Academic Publishers Group; Dordrecht. 276
pp.
Schweingruber, F. H., 1996: Tree Rings and
Environment. Dendroecology. Haupt; Bern.
609 pp.
Slowińska, S., Slowiński, M. & Lamentowicz, M.,
2010: Relationships between Local Climate
a n d H yd r o l o g y i n S p h a g n u m M i r e :
Implications for Palaeohydrological Studies
and Ecosystem Management. Polish Journal
of Environmental Studies 19, 4, 779-787.
Svensso n, G. , 198 8: B og deve lop ment and
environmental conditions as shown by the
stratigraphy of Store Mosse mire in southern
Sweden. Boreas 17, 89-111.
Vaganov, E. A., Hughes, M. K., Kirdyanov, A. V.,
Schweingruber, F. H. & Silkin, P. P., 1999:
Influence of snowfall and melt timing on tree
growth in subarctic Eurasia. Nature 400, 149-
151.
van der Linden, M., Vickery, E., Charman, D. J. & van
Geel, B., 2008: Effects of human impact and
climate change during the last 350 years
recorded in a Swedish raised bog deposit.
Palaeogeography, Palaeoclimatology,
Palaeoecology 262, 1-31.
Vattenmyndigheterna, 2009: Avrinningsområde nr 98-
Lagan. 80 pp.
Wigley, T. M. L., Briffa, K. R. & Jones, P. D., 1984:
On the Avarage Value of Correlated Time
Series, with Applicat ions in Dendro -
climatology and Hydrometeorology. Journal
of Climate and Applied Meteorology 23, 201-
213.
Vitas, A., 2004: Dendroclimatological Research of
Scots Pine (Pinus sylvestris L.) in the Baltic
Coastal Zone of Lithuania. Baltic Forestry 10
(1), 65-71.
Vitas, A. & Erlickyté, R., 2007: Influence of Droughts
to the Radial Growth of Scots Pine (Pinus
sylvestris L.) in Different Site Conditions.
Baltic Forestry 13, 10-16.
Ångström, A., 1974: Sveriges klimat. Generalstabens
litografiska Anstalts förlag; Stockholm. 188
pp.
Øyen, B.-H., Blom, H. H., Gjerde, I., Myking, T.,
Sætersdal, M. & Thunes, K. H., 2006:
Ecology, history and silviculture of Scots
pine (Pinus sylvestris L.) in western Norway
– a literature review. Forestry 79, 3, 319-329.

Tidigare skrifter i serien ”Examensarbeten i Geologi vid Lunds universitet”:
287. Lindskog, Anders, 2011: A Russian record of a Middle Ordovician meteorite shower: Extraterrestrial chromite in Volkhovian-Kundan (lower Darriwilian) strata at Lynna River, St. Petersburg region. (45 hp)
288. Gren, Johan, 2011: Dental histology of Cretaceous mosasaurs (Reptilia, Squamata): incremental growth lines in dentine and implications for tooth replacement. (45 hp)
289. Cederberg, Julia, 2011: U-Pb baddelyit dateringar av basiska gångar längs Romeleåsen i Skåne och deras påverkan av plastisk deformation i Protoginzonen (15 hp)
290. Ning, Wenxing, 2011: Testing the hypothesis of a link between Earth’s magnetic field and climate change: a case study from southern Sweden focusing on the 1st
millennium BC. (45 hp)291. H o l m Ö s t e rg a a r d , S ö r e n , 2 0 11 :
Hydrogeology and groundwater regime of the Stanford Aquifer, South Africa. (45 hp)
292. Tebi, Magnus Asiboh, 2011: Metamorphosed and partially molten hydrothermal alteration zones of the Akulleq glacier area, Paamiut gold province, South-West Greenland. (45 hp)
293. Lewerentz, Alexander, 2011: Experimental zircon alteration and baddeleyite formation in silica saturated systems: implications for dating hydrothermal events. (45 hp)
294. Flodhammar, Ingrid, 2011: Lövestads åsar: En isälvsavlagring bildad vid inlandsisens kant i Weichsels slutskede. (15 hp)
295. Liu, Tianzhuo, 2012: Exploring long-term trends in hypoxia (oxygen depletion) in Western Gotland Basin, the Baltic Sea. (45 hp)
296. Samer, Bou Daher, 2012: Lithofacies analysis and heterogeneity study of the subsurface Rhaetian–Pliensbachian sequence in SW Skåne and Denmark. (45 hp)
297. Riebe, My, 2012: Cosmic ray tracks in chondritic material with focus on silicate mineral inclusions in chromite. (45 hp)
298. Hjulström, Joakim, 2012: Återfyllning av
borrhål i geoenergisystem: konventioner, metod och material. (15 hp)
299. Letellier, Mattias, 2012: A practical assessment of frequency electromagnetic inversion in a near surface geological environment. (15 hp)
300. Lindenbaum, Johan, 2012: Identification of sources of ammonium in groundwater using stable nitrogen and boron isotopes in Nam Du, Hanoi. (45 hp)
301. Andersson, Josefin, 2012: Karaktärisering av arsenikförorening i matjordsprofiler kring Klippans Läderfabrik. (45 hp)
302. L u m e t z b e r g e r , M i k a e l , 2 0 1 2 : H y d r o g e o l o g i s k k a r t l ä g g n i n g a v inf i l t ra t ionsvat ten t ranspor t genom resistivitetsmätningar. (15 hp)
303. Martin, Ellinor, 2012: Fossil pigments and pigment organelles – colouration in deep time. (15 hp)
304. Rådman, Johan, 2012: Sällsynta jordarts-metaller i tungsand vid Haväng på Österlen. (15 hp)
305. Karlstedt, Filippa, 2012: Jämförande geokemisk studie med portabel XRF av obehandlade och sågade ytor, samt pulver av Karlshamnsdiabas. (15 hp)
306. Lundberg, Frans, 2012: Den senkambriska alunskiffern i Västergötland – utbredning, mäktigheter och faciestyper. (15 hp)
307. T h u l i n O l a n d e r , H e n r i c , 2 0 1 2 : Hydrogeologisk kartering av grund-vattenmagasinet Ekenäs-Kvarndammen, Jönköpings län. (15 hp)
308. Demirer, Kursad, 2012: U-Pb baddeleyite ages from mafic dyke swarms in Dharwar craton, India – l inks to an ancient supercontinent. (45 hp)
309. Leskelä, Jari , 2012: Loggning och återfyllning av borrhål – Praktiska försök och utveckling av täthetskontroll i fält. (15 hp)
310. Eriksson, Magnus, 2012: Stratigraphy, facies and depositional history of the Colonus Shale Trough, Skåne, southern Sweden. (45 hp)
311. Larsson, Amie, 2012: Kartläggning, beskrivning och analys av Kalmar läns regionalt viktiga vattenresurser. (15 hp)
312. Olsson, Håkan, 2012: Prediction of the degree of thermal breakdown of limestone: A case study of the Upper Ordovician Boda Limestone, Siljan district, central Sweden. (45 hp)
Geologiska institutionenLunds universitet
Sölvegatan 12, 223 62 Lund
313. Kampmann, Tobias Christoph, 2012: U-Pb geochronology and paleomagnetism of the Westerberg sill, Kaapvaal Craton – support for a coherent Kaapvaal-Pilbara block (Vaalbara). (45 hp)
314. Eliasson, Isabelle Timms, 2012: Arsenik: förekomst, miljö och hälsoeffekter. (15 hp)
315. Badawy, Ahmed Salah, 2012: Sequence stratigraphy, palynology and biostratigraphy across the Ordovician-Silurian boundary in the Röstånga-1 core, southern Sweden. (45 hp)
316. Knut, Anna, 2012: Resistivitets- och IP-mätningar på Flishultsdeponin för lokalisering av grundvattenytor. (15 hp)
317. Nylén, Fredrik, 2012: Förädling av ballast-material med hydrocyklon, ett fungerande alternativ? (15 hp)
318. Younes, Hani, 2012: Carbon isotope chemostratigraphy of the Late Silurian Lau Event, Gotland, Sweden. (45 hp)
319. Weibull, David, 2012: Subsurface geological setting in the Skagerrak area – suitability for storage of carbon dioxide. (15 hp)
320. Petersson, Albin, 2012: Förutsättningar för geoenergi till idrottsanläggningar i Kallerstad, Linköpings kommun: En förstudie. (15 hp)
321. Axbom, Jonna, 2012: Klimatets och människans inverkan på tallens etablering på sydsvenska mossar under de senaste århundradena – en dendrokronologisk och torvstratigrafisk analys av tre småländska mossar. (15 hp)
322. Kumar, Pardeep, 2012: Palynological investigation of coal-bearing deposits of the Thar Coal Field Sindh, Pakistan. (45 hp)
323. Gabrielsson, Johan, 2012: Havsisen i arktiska bassängen – nutid och framtid i ett globalt uppvärmningsperspektiv. (15 hp)
324. Lundgren, Linda, 2012: Variation in rock quality between metamorphic domains in the lower levels of the Eastern Segment,
Sveconorwegian Province. (45 hp)325. Härling, Jesper, 2012: The fossil wonders
of the Silurian Eramosa Lagerstätte of Canada: the jawed polychaete faunas. (15 hp)
326. Qvarnström, Martin, 2012: An interpretation of oncoid mass-occurrence during the Late Silurian Lau Event, Gotland, Sweden. (15 hp)
327. Ulmius, Jan, 2013: P-T evolution of paragneisses and amphibolites from Romeleåsen, Scania, southernmost Sweden. (45 hp)
328. Hultin Eriksson, Elin, 2013: Resistivitets-mätningar för avgränsning av lak-vattenplym från Kejsarkullens deponis infiltrationsområde. (15 hp)
329. Mozafari Amiri, Nasim, 2013: Field relations, petrography and 40Ar/39Ar cooling ages of hornblende in a part of the eclogite-bearing domain, Sveconorwegian Orogen. (45 hp)
330. Saeed, Muhammad, 2013: Sedimentology and palynofacies analysis of Jurassic rocks Eriksdal, Skåne, Sweden. (45 hp)
331. Khan, Mansoor, 2013: Relation between sediment flux variation and land use patterns along the Swedish Baltic Sea coast. (45 hp)
332. Bernhardson, Martin, 2013: Ice advance-retreat sediment successions along the Logata River, Taymyr Peninsula, Arctic Siberia. (45 hp)
333. Shrestha, Rajendra, 2013: Optically Stimulated Luminescence (OSL) dating of aeolian sediments of Skåne, south Sweden. (45 hp)
334. Fullerton, Wayne, 2013: The Kalgoorlie Gold: A review of factors of formation for a giant gold deposit. (15 hp)
335. Hansson, Anton, 2013: A dendroclimatic study at Store Mosse, South Sweden – climatic and hydrologic impacts on recent Scots Pine (Pinus sylvestris) growth dynamics. (45 hp)