Embed Size (px)
Citation preview

doi.org/10.26434/chemrxiv.8217758.v2
A Deep Neural Network Model for Packing Density Predictions and itsApplication in the Study of 1.5 Million Organic MoleculesMohammad Atif Faiz Afzal, Aditya Sonpal, Mojtaba Haghighatlari, Andrew J. Schultz, Johannes Hachmann
Submitted date: 08/07/2019 • Posted date: 08/07/2019Licence: CC BY 4.0Citation information: Afzal, Mohammad Atif Faiz; Sonpal, Aditya; Haghighatlari, Mojtaba; Schultz, Andrew J.;Hachmann, Johannes (2019): A Deep Neural Network Model for Packing Density Predictions and itsApplication in the Study of 1.5 Million Organic Molecules. ChemRxiv. Preprint.
The process of developing new compounds and materials is increasingly driven by computational modelingand simulation, which allow us to characterize candidates before pursuing them in the laboratory. One of thenon-trivial properties of interest for organic materials is their packing in the bulk, which is highly dependent ontheir molecular structure. By controlling the latter, we can realize materials with a desired density (as well asother target properties). Molecular dynamics simulations are a popular and reasonably accurate way tocompute the bulk density of molecules, however, since these calculations are computationally intensive, theyare not a practically viable option for high-throughput screening studies that assess material candidates on amassive scale. In this work, we employ machine learning to develop a data-derived prediction model that is analternative to physics-based simulations, and we utilize it for the hyperscreening of 1.5 million small organicmolecules as well as to gain insights into the relationship between structural makeup and packing density.Wealso use this study to analyze the learning curve of the employed neural network approach and gain empiricaldata on the dependence of model performance and training data size, which will inform future investigations.
File list (4)
download fileview on ChemRxiv09_ml_numberdensity_clean.pdf (727.57 KiB)
download fileview on ChemRxivMD_screening_density_data.xlsx (4.89 MiB)
download fileview on ChemRxivML_screening_density_data.csv (95.77 MiB)
download fileview on ChemRxivden_MD_predict.joblib.pkl (909.63 KiB)

A Deep Neural Network Model for Packing Density Predictions
and its Application in the Study of 1.5 Million Organic Molecules
Mohammad Atif Faiz Afzal,1, ∗ Aditya Sonpal,1 Mojtaba
Haghighatlari,1 Andrew J. Schultz,1 and Johannes Hachmann1, 2, 3, †
1Department of Chemical and Biological Engineering, University at Buffalo,
The State University of New York, Buffalo, NY 14260, United States2Computational and Data-Enabled Science and Engineering Graduate Program,
University at Buffalo, The State University of New York, Buffalo, NY 14260, United States3New York State Center of Excellence in Materials Informatics, Buffalo, NY 14203, United States
The process of developing new compounds and materials is increasingly driven by computationalmodeling and simulation, which allow us to characterize candidates before pursuing them in thelaboratory. One of the non-trivial properties of interest for organic materials is their packing inthe bulk, which is highly dependent on their molecular structure. By controlling the latter, we canrealize materials with a desired density (as well as other target properties). Molecular dynamicssimulations are a popular and reasonably accurate way to compute the bulk density of molecules,however, since these calculations are computationally intensive, they are not a practically viableoption for high-throughput screening studies that assess material candidates on a massive scale.In this work, we employ machine learning to develop a data-derived prediction model that is analternative to physics-based simulations, and we utilize it for the hyperscreening of 1.5 million smallorganic molecules as well as to gain insights into the relationship between structural makeup andpacking density. We also use this study to analyze the learning curve of the employed neural networkapproach and gain empirical data on the dependence of model performance and training data size,which will inform future investigations.
I. INTRODUCTION
The packing of atoms, molecules, and polymers in agiven volume – either in crystalline or amorphous form –is a fundamental and long-standing issue that has beenconsidered by various disciplines for over a century [1].The packing density directly impacts properties such asthe ionic conductivity [2], mobility in solvents [3], me-chanical [4] and optical behavior [5, 6], as well as numer-ous other physical and chemical properties [7]. Today,the packing density has gained renewed attention in thecontext of developing advanced materials that fulfill veryspecific property requirements. Molecular materials andpolymers are of particular interest as their packing inthe bulk is directly affected by their molecular structure[8]. Manipulating and tailoring the latter offers many op-portunities (and challenges) to achieve targeted densityvalues.Traditional, experimentally-driven trial-and-error
searches for new compounds with desired sets of prop-erties have proved to be time consuming and resourceintensive. The advent of powerful modeling and sim-ulation techniques as well as readily available time onhigh-performance computing systems have brought com-putational and computationally-guided studies to theforefront of the chemical and materials domain. Thesestudies allow us to make increasingly accurate predic-tions for compounds of interest and uncover promising
∗ [email protected]† [email protected]
leads for experimentalist partners to follow up on (see,e.g., Refs. [9–20]). An even more recent developmenthas been the emergence of machine learning techniquesthat empower us to advance, augment, correct, or evenreplace physics-based modeling and simulation [21]. Inthe latter scenario, machine learning is used to createdata-derived property prediction models that serve assurrogates for physics-based models in order to dramati-cally accelerate the compound characterization and thusthe overall discovery process. In addition to enablinghyperscreening studies, we can employ machine learningto gain a better understanding of the structure-propertyrelationships that determine the behavior of compoundsin the corresponding domains of chemical space. Thecreation of new machine learning prediction models forvarious target properties and the advancement of theunderlying methodology is an active field of research[22]. Key considerations are accuracy, cost, robustness,and range of applicability. Artificial neural networksare a popular and efficient machine learning approach[23]. Multi-layer ’deep’ neural networks (DNNs) yieldparticularly flexible models that have been used topredict an array of chemical properties, including refrac-tive indices [24], dielectric constants [25], atomizationenergies [26], chemical reactivities [27], melting points[28, 29], viscosities [30], solubilities [31], and others.
In this work, we develop a DNN prediction modelfor the packing density of small organic molecules in anamorphous bulk phase and conduct a hyperscreening of1.5 million candidate compounds. Our interest in thistarget property originates from our ongoing in silico dis-covery and design efforts for polymers with high refrac-tive index (RI) [32–34] to be used in optic and optoelec-

2
tronic applications [35, 36]. We previously establishedan RI modeling protocol based on the Lorentz-Lorenzequation and parametrized with the polarizability andnumber density [32, 33]. For the number density, we in-troduced a hybrid physics-based/data-derived predictionmodel using the van der Waals volume computed via theSlonimskii method and the packing coefficient from a sup-port vector regression machine learning model [37]. Analternative and commonly employed route to computingthe (number) density, is the use of molecular dynamics(MD) simulations, which we recently started exploring inour study of high-RI polymers. However, as these MDcalculations are computationally expensive and techni-cally challenging, they are not particularly well suited forthe large-scale assessment of compounds in the course ofhigh-throughput screening studies. To bypass this prob-lem, we develop a DNN surrogate model for the MD den-sity predictions. It allows us to rapidly and accuratelycompute the density values of the 1.5 million moleculesof a virtual screening library we create for proof of con-cept. For this, we perform MD simulations on a subsetof 100,000 compounds, use the results to train our DNNmodel, and subsequently employ it to compute the pack-ing density of the remaining 1.4 million molecules. Wemine the density results to identify patterns that lead todesirable outcomes (i.e., different density regimes). Wealso evaluate the learning curve for the density predictionto assess the dependence of training set size and modelaccuracy.In Sec. II, we detail the methods employed in our work.
We describe the MD modeling protocol we use to com-pute the density values (Sec. II A), discuss the molecu-lar design space we consider and the application of ourvirtual high-throughput screening tools on the resultingcompound library (Sec. II B), introduce our DNN predic-tion model (Sec. II C), and establish our pattern analysisapproaches to mine the obtained results (Sec. II D). Sec.III presents and discusses the outcomes of our study, inparticular the density predictions from MD and DNN(Sec. III A), the efficiency of the DNN approach (Sec.III B), and the emerging structure-property relationships(Sec. III C). Our findings are summarized in Sec. IV.
II. METHODS AND COMPUTATIONALDETAILS
A. Molecular Dynamics Modeling Protocol
We employ the following MD modeling protocol togenerate the data for the training and testing of theDNN density prediction model at the center of thiswork. Starting from the simplified molecular-input line-entry system (SMILES) [38] string of a given com-pound, we employ the OpenBabel code [39] to createa 3-dimensional structure guess, and then pre-optimizeit using the MMFF94s force field [40] via steepest de-scent. We then compute the packing density with the
general Amber force field (GAFF) [41]. For this, weobtain the GAFF parameters in automated fashion [42]using the Antechamber toolkit that is part of Amber-Tools [43], and carry out the MD simulations within theGROMACS package [44]. We employ GROMACS’ sol-vate tool to create a (10 nm)3 simulation box and fillit with the pre-optimized target molecules. The numberof molecules in the simulation box depends on the givenmolecule size, but a typical system contains around 1,000molecules (e.g., 972 for benzylcyclopentane). The sys-tem is first subjected to a minimization of the internalenergy, which is associated with the relaxation of bonds,bond angles, and dihedral bond angles. This is followedby NVT and NPT equilibration steps for 100 and 240 ps,respectively. Both NVT and NPT ensembles use a Nose-Hoover thermostat at 298.15 K for temperature control.The NPT ensemble uses the Parinello-Rahman barostatfor pressure control. We conclude the MD protocol with afinal 40 ps NPT production run. We use an MD timestepof 0.2 fs. We obtain the density by averaging the densityvalues of the system at intervals of 0.2 ps during this finalrun. We note that this protocol is expected to yield ki-netically stable amorphous phases rather than thermody-namically stable crystal structures or meta-stable poly-morphs. GAFF is known to underestimate the densityvalues compared to those from experiment, especially forhigh-density compounds [45]. We employ a linear fit be-tween the calculated and experimental values to accountfor the systematic differences and empirically calibratethe MD results.
B. Candidate Library Generation andHigh-Throughput Screening
We create a virtual library of 1.5 million small organicmolecules using our library generator code ChemLG
[46, 47] in constrained combinatorial mode. This libraryis constructed based on the sequential combinatorial link-ing of the 15 molecular building blocks shown in Fig. 1for four generations, while enforcing certain constraints,i.e., a molecular weight within the range of 150 to 400Dalton and limiting the number of ring-moieties to four.The hydrogen atoms in each building block are used aslinker handles. Our proof-of-principle library is designedto feature different connections between simple moieties,most of which are commonly used in organic materials(except B5, B8, and B9). We use the eToxPred softwareto compute the synthetic accessibility score (SAscore) ofall 15 building blocks [48] and obtain similarly favorablevalues between 2.4 and 2.9 on the 1-10 scale (with 1 be-ing the most synthetically accessible). We provide thedetails of the accessibility analysis in the SupplementaryMaterial. Our generation approach limits the size of thelibrary while yielding both a diverse set of compoundsas well as candidates with more subtle differences for themodel to distinguish. The complete library is providedin the Supplementary Material.

3
FIG. 1. Molecular building blocks used to create the candi-date library of 1.5 million compounds studied in this work.
To facilitate the density evaluation for a large num-ber of compounds via the MD modeling protocol intro-duced in Sec. II A, we employ our automated virtual high-throughput screening framework ChemHTPS [46, 49].ChemHTPS creates inputs for the MD simulations, ex-ecutes the modeling protocol, monitors the calculations,parses and assesses the results, and extracts and pro-cesses the information of interest. Of the 1.5 millioncompounds in our screening library, we randomly selecta subset of 100,000 for study at the MD level.
C. Neural Network Prediction Model
We use the MD results for these 100,000 molecules asthe ground truth for our data-derived density predictionmodel. For this, we pursue a DNN approach within a fea-ture space of molecular descriptors. We build the DNNmodel using ChemML [46, 50, 51], our program suite formachine learning and informatics in chemical and ma-terials research. In this work, ChemML employs thescikit-learn 0.18.2 library for the multi-layer perceptronregressor 1.17.1 [52] and 197 descriptors from Dragon 7[53]. These descriptors include constitutional indices andfunctional group counts. If two descriptors are mutuallycorrelated, they are not independent and thus redundant.In the cases where the Pearson correlation coefficient R
is > 95%, Dragon removes one of them, i.e., the one thatshows more correlation with the rest of the descriptors.(A detailed list of the descriptors is provided in the Sup-plementary Material.) We apply the grid search methodfor a coarse optimization of the DNN model hyperpa-rameters. The hyperparameter search space includes anumber of activation functions (identity, tanh, rectifiedlinear unit, and logistic), L2 regularization parameters(0.1, 0.01, 0.001, 0.0001, and 0.00001), solvers for theoptimization of the weights (sgd and adam), and learn-ing rate types (constant, invscaling, and adaptive). Thebest model from the hyperparameter optimization fea-tures the rectified linear unit as the activation function,’adam’ solver, adaptive learning rate, and an L2 regular-ization parameter of 0.0001. The final DNN has two fully
connected hidden layers with 100 neurons each. For theinitial model evaluation, we randomly divide the 100,000-molecule data set into 80% training and 20% test set.To assess the learning curve, we evaluate the model per-formance for incrementally increasing training set sizefrom 0.05% to 100% of the entire data set (i.e., from50 to 100,000 data points). We apply the bootstrappingmethod, i.e., for each training set size, we obtain thetraining set by randomly sampling the entire data set.The remaining data points serve as test set. For everytraining set size, we repeat the process (with replace-ment) 50 times, i.e., all 50 repetitions are independentof each other. We subsequently calculate statistics overthe results of the 50 models that are based on these train-ing sets for each training set size.
D. Data Mining and Pattern Recognition
In addition to identifying candidates with particulardensity values from our MD screening and DNN hyper-screening studies, we mine the compiled results to betterunderstand the correlation between molecular structureand packing density. One pattern recognition approachwe pursue is the hypergeometric distribution analysis, inwhich we determine the Z-scores (Zi) of each buildingblock i used in the creation of the molecular library as
Zi =ki −mKi
M
σi
,
with
σi =
[
mKi
M×
(
M −Ki
M
)
×
(
M −m
M − 1
)]1
2
,
where M is the total number of molecules in the entirelibrary, m is the subset of molecules under considera-tion (e.g., the compounds in a certain density regime),Ki is the number of occurrences of building block i inM molecules and ki its occurrences in the subset of mmolecules. A large Z-score indicates that a building blockappears more frequently in that subset compared to therest of the library (or a random sample). By applying thehypergeometric distribution analysis, we can thus iden-tify the building blocks with the largest impact on thetarget property and the degree to which they correlatewith desired density values. Furthermore, we identify thebuilding blocks that are prominent in particular densityregimes and assess Z-score trends in density-ordered can-didate subsets across the entire density range. In addi-tion, we compute the average density values of the candi-dates derived from each building block, and analyze thisdata for trends. We employ the ChemML package for alldata mining and pattern recognition tasks.The following metrics are used in the error analy-
ses of our modeling approaches: mean absolute error
4
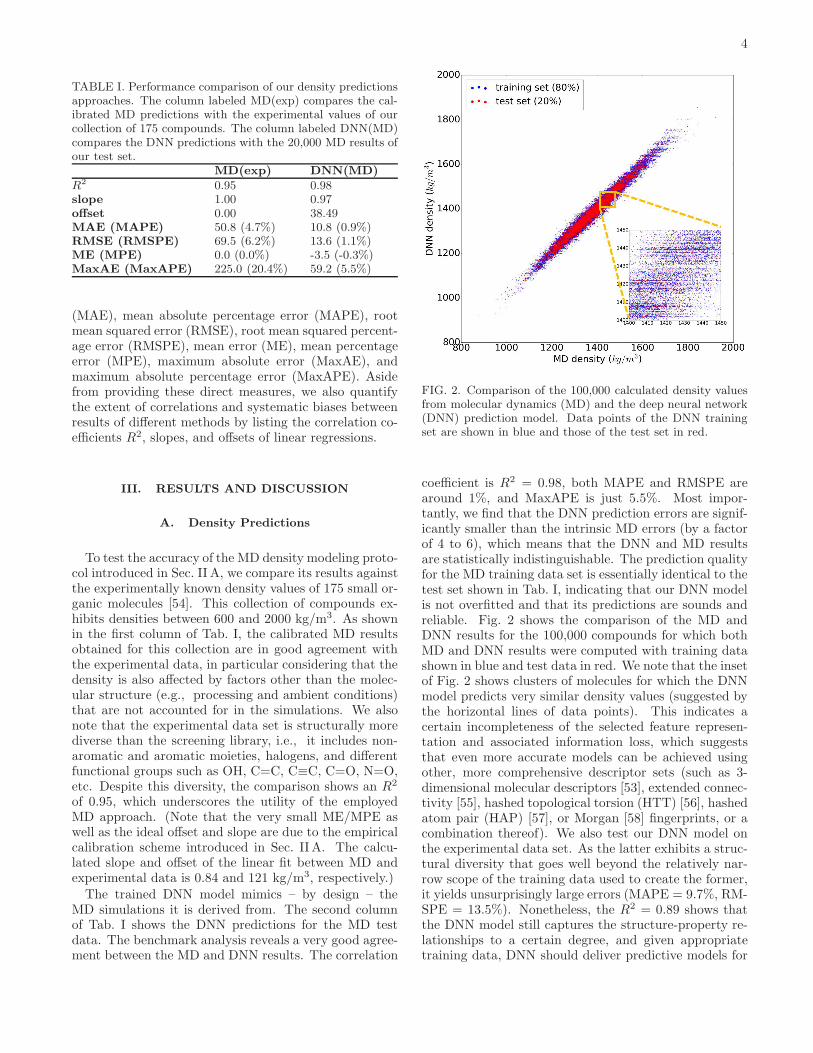
TABLE I. Performance comparison of our density predictionsapproaches. The column labeled MD(exp) compares the cal-ibrated MD predictions with the experimental values of ourcollection of 175 compounds. The column labeled DNN(MD)compares the DNN predictions with the 20,000 MD results ofour test set.
MD(exp) DNN(MD)R
2 0.95 0.98slope 1.00 0.97offset 0.00 38.49MAE (MAPE) 50.8 (4.7%) 10.8 (0.9%)RMSE (RMSPE) 69.5 (6.2%) 13.6 (1.1%)ME (MPE) 0.0 (0.0%) -3.5 (-0.3%)MaxAE (MaxAPE) 225.0 (20.4%) 59.2 (5.5%)
(MAE), mean absolute percentage error (MAPE), rootmean squared error (RMSE), root mean squared percent-age error (RMSPE), mean error (ME), mean percentageerror (MPE), maximum absolute error (MaxAE), andmaximum absolute percentage error (MaxAPE). Asidefrom providing these direct measures, we also quantifythe extent of correlations and systematic biases betweenresults of different methods by listing the correlation co-efficients R2, slopes, and offsets of linear regressions.
III. RESULTS AND DISCUSSION
A. Density Predictions
To test the accuracy of the MD density modeling proto-col introduced in Sec. II A, we compare its results againstthe experimentally known density values of 175 small or-ganic molecules [54]. This collection of compounds ex-hibits densities between 600 and 2000 kg/m3. As shownin the first column of Tab. I, the calibrated MD resultsobtained for this collection are in good agreement withthe experimental data, in particular considering that thedensity is also affected by factors other than the molec-ular structure (e.g., processing and ambient conditions)that are not accounted for in the simulations. We alsonote that the experimental data set is structurally morediverse than the screening library, i.e., it includes non-aromatic and aromatic moieties, halogens, and differentfunctional groups such as OH, C=C, C≡C, C=O, N=O,etc. Despite this diversity, the comparison shows an R2
of 0.95, which underscores the utility of the employedMD approach. (Note that the very small ME/MPE aswell as the ideal offset and slope are due to the empiricalcalibration scheme introduced in Sec. II A. The calcu-lated slope and offset of the linear fit between MD andexperimental data is 0.84 and 121 kg/m3, respectively.)The trained DNN model mimics – by design – the
MD simulations it is derived from. The second columnof Tab. I shows the DNN predictions for the MD testdata. The benchmark analysis reveals a very good agree-ment between the MD and DNN results. The correlation
FIG. 2. Comparison of the 100,000 calculated density valuesfrom molecular dynamics (MD) and the deep neural network(DNN) prediction model. Data points of the DNN trainingset are shown in blue and those of the test set in red.
coefficient is R2 = 0.98, both MAPE and RMSPE arearound 1%, and MaxAPE is just 5.5%. Most impor-tantly, we find that the DNN prediction errors are signif-icantly smaller than the intrinsic MD errors (by a factorof 4 to 6), which means that the DNN and MD resultsare statistically indistinguishable. The prediction qualityfor the MD training data set is essentially identical to thetest set shown in Tab. I, indicating that our DNN modelis not overfitted and that its predictions are sounds andreliable. Fig. 2 shows the comparison of the MD andDNN results for the 100,000 compounds for which bothMD and DNN results were computed with training datashown in blue and test data in red. We note that the insetof Fig. 2 shows clusters of molecules for which the DNNmodel predicts very similar density values (suggested bythe horizontal lines of data points). This indicates acertain incompleteness of the selected feature represen-tation and associated information loss, which suggeststhat even more accurate models can be achieved usingother, more comprehensive descriptor sets (such as 3-dimensional molecular descriptors [53], extended connec-tivity [55], hashed topological torsion (HTT) [56], hashedatom pair (HAP) [57], or Morgan [58] fingerprints, or acombination thereof). We also test our DNN model onthe experimental data set. As the latter exhibits a struc-tural diversity that goes well beyond the relatively nar-row scope of the training data used to create the former,it yields unsurprisingly large errors (MAPE = 9.7%, RM-SPE = 13.5%). Nonetheless, the R2 = 0.89 shows thatthe DNN model still captures the structure-property re-lationships to a certain degree, and given appropriatetraining data, DNN should deliver predictive models for

5
those compound pools as well.
FIG. 3. Range and distribution of the DNN density predic-tions for our proof-of-concept screening library of 1.5 millionsmall organic molecules with a corresponding normal distri-bution overlayed.
With the accuracy of the trained DNN model estab-lished, we apply it to the remaining 1.4 million com-pounds of the screening library introduced in Sec. II Bwith the expectation of obtaining similar results as MDwould yield. The DNN density predictions are summa-rized in Fig. 3. The density values of the molecules athand range from 902 to 1851 kg/m3 with an average of1384 kg/m3. The results show a t- or Gaussian-like dis-tribution and most of the compounds in the library havedensity values between 1200 to 1600 kg/m3, with onlyvery few examples at the extreme high and low densityregime. It is worth noting that these extreme packingdensity values may be desirable for certain material appli-cations (e.g., light-weight plastics with large strength-to-density ratio or rigid, impact-resistant thermo-plastics).The sparsity of instances for extreme density values em-phasizes the valuable role that high-throughput screeningstudies via physics-based modeling and/or data-derivedprediction models can play in the discovery of suitablematerials candidates.
B. Neural Network Efficiency
After confirming that the DNN prediction model canaccurately reproduce MD-level results (which we in turnshowed to accurately reproduce experimental data), wenow investigate its efficiency, in particular relative toMD. Our MD calculations for the subset of 100,000molecules took a total of 5 million core hours of com-pute time on a modern high-performance computing clus-ter. For the entire screening library, this extrapolates toapproximately 75 million core hours (In addition to thecompute time, there is generally a considerable amount
of human time required for the setup and execution ofthese calculations. In our study, many of these taskswere performed by ChemHTPS without manual inter-vention.) The demand on disk space is another issue, andwe estimate a need for 120 terabytes for the entire library(15 terabytes without trajectories). The DNN predictionmodel produces essentially the same results in less than10 core hours of compute time (without performance op-timization), with all but 10 minutes of the time requiredto generate the feature matrix of the compound library.Disk use is marginal. This corresponds to a speed-up ofabout seven orders of magnitude, with negligible loss inaccuracy. A speed-up of that magnitude allows a corre-sponding increase in the scale and scope that is affordablefor screening studies.
FIG. 4. Dependence of the model accuracy (measured bythe correlation coefficient R
2) on the training set size (1%corresponds to 1,000 data points). The learning curve showsthe mean R
2 from 50 bootstrap repetitions and the standarddeviation is given in the error bars. The accuracy for thetraining set is plotted in green, that for the test set in red.
The bottleneck of our DNN prediction model is thegeneration of the training data needed for its creation. Itis worth noting, though, that this is a fixed cost ratherthan an effort that scales with the number of compoundsstudied. The size of the employed training set (100,000compounds corresponding to 5 million core hours) wasoriginally chosen ad hoc. We now assess the learningcurve as a function of training set size to gain insightsinto the actual data needs of our DNN model, which isone of the key questions in applying machine learning toany given problem setting. Our goal is to establish, howmany data points are necessary to converge the learningprocess and/or achieve a desired accuracy. By minimiz-ing the training set size requirement, we minimize the in-vestment in computational resources needed to performthe expensive MD simulations. To address this question,we successively increase the size of the training set from

6
50 to 100,000 molecules. The resulting learning curve isshown in Fig. 4. We observe that all models trained onfewer than 2,000 data points (i.e., 2% of the availabledata) perform poorly. Models based on 2,000 to 4,000data points offer acceptable accuracy. Those based on4,000 to 6,000 data points offer very good accuracy, andat 10,000 data points, the training is essentially saturatedand the learning curve plateaus off. Additional trainingdata does not lead to an improvement of the DNN modeland is essentially wasted. Thus, we do not require a largedata set of 100,000 molecules to learn the packing densityof organic molecules. We can develop an accurate modelusing MD data of just 5,000 molecules (or more conser-vatively 10,000). This reduces our demand of computingtime from 5 million to less than 0.25 (or 0.5) million corehours (including additional data for the test set), whichhas significant implications for the cost-benefit analysisand viability of this approach.We stress that the data demand is highly dependent on
the nature of the data and the employed machine learn-ing approach (including the feature representation), andthere are distinct limits to generalizing our findings. In-stead of a postmortem analysis of the learning curve asprovided here, we will use an on-the-fly assessment ofthe learning curve combined with a just-in-time termina-tion of the training data generation to minimize our datafootprint in future studies.
FIG. 5. Density value distribution around the respective aver-age density values (points) of the molecules containing a givenbuilding block. The bands refer to one standard deviation.
C. Relationship between Molecular Structure andPacking Density
When considering the screening results, we are not onlyin a position to assess a large number of compounds, butwe can also learn patterns from the data set in its en-tirety. Our analysis in Fig. 5 shows the average density
values and distributions of all compounds containing agiven building block (cf. Fig. 1). On the high density end,we find sulfur-heterocyclic moieties; the nitrogen- andoxygen-heterocycles yield medium density systems; andthe low-density regime is dominated by carbon-based,non-heteroatomic building blocks. Molecules with B7
(1,3,4-thiadiazole) and B12 (1,2,5-thiadiazole) have thehighest average densities, while those that incorporateB1 (CH2-linker) and B9 (cyclopentane) exhibit the low-est values. Aside from the linker groups, there is a clearcorrelation between density value and the heteroatomtype and fraction in a corresponding moiety.
FIG. 6. Variation of density values as a function of weightpercentage of sulfur and nitrogen in the molecules.
Based on the construction of our library, more than80% of the candidate compounds contain sulfur and morethan 90% contain nitrogen. Fig. 6 demonstrates how thedensity values depend on the weight percentage of thesulfur and nitrogen atoms in the compounds at hand.Our library thus yields the highest density values formolecules that by weight contain 30 to 50% sulfur and20 to 30% nitrogen.While the average density values indicate the cumula-
tive impact of a particular building block, we find rela-tively large standard deviations (cf. Fig. 5). For a moredetailed picture of the occurrences of building blocks ina particular subset of the library, we perform the Z-score analysis introduced in Sec. II D. Fig. 7 shows thecorresponding results for the molecules with the high-est density values (i.e., the top 10% subset) with clearand distinct trends. Consistent with our previous anal-ysis, we observe very large Z-score values for and thusa strong overexpression of B7 and B12. B13 (thiazole)also shows a large Z-score, and so do to a lesser extentB2
(S-linker) and B3 (O-linker) as well. These moieties areclearly favorable if high-density compounds are desired.In addition to assessing the high-density regime, we em-ploy the hypergeometric distribution analysis to identifythe prevalence of building blocks in the complete spec-trum of density values. For this, we sort our virtual li-

7
FIG. 7. Z-scores of each building block in the compounds withthe highest density values (top 10% of the library). Greenrepresents positive Z-scores, and negative ones are shown inred.
brary by increasing density values, divide it into ten equalsegments, and perform our analysis within each of thesesubsets as shown in Fig. 8. Based on the data from thisanalysis, we can identify trends in the impact of individ-ual building blocks on the density of organic molecules.The Z-score of building blocks B2, B7, B12, and B13
increases with increasing density values, indicating a di-rect correlation, whereas it decreases for B1, B4, B9,B10, and B15, indicating an inverse correlation. Theformer are thus suitable to design organic molecules withhigher density, and the latter could be used to achievecompounds with lower density. These findings are con-sistent with our prior analysis.
IV. CONCLUSIONS
The ability to predict the properties of novel com-pounds prior to synthesis, and to understand how theseproperties depend on their structure, is of considerableimportance in materials discovery and design. In this pa-per, we showed that MD simulations can accurately pre-dict experimental packing density values of small organicmolecules and we provided corresponding benchmark re-sults to quantify this finding. We conducted a high-throughput MD screening of 100,000 compounds, whichallowed us to train a DNN density prediction model. ThisDNN model accurately reproduces the MD data withinthe margins of MD’s intrinsic error, while being nearlyseven orders of magnitude faster than MD. This exceed-ingly efficient approach allowed us to rapidly obtain thedensity values of a 1.5 million compound screening li-brary, which would have been prohibitively time consum-ing and well out of reach for MD. By analysing the largedata set resulting from this study, we could elucidatestructure-property relationships that determine the den-
sity values. We identified prevalent moieties in the highand low density regime and could quantify the impact ofheteroatoms (sulfur and nitrogen). Further, we evaluatedthe DNN learning curve for the density prediction withrespect to the available training data and found a con-siderably lower data demand than we had anticipated.Following this lesson, we will in future studies employan on-the-fly assessment of the learning curve and ter-minate the training data generation once we observe sat-isfactory saturation. This will allow us to alleviate thedata generation bottleneck and make machine learningmodels an even more viable and attractive proposition.Overall, our study underscores the value of combiningpowerful machine learning approaches with traditionalcomputational modeling for the generation of the neces-sary data. It also demonstrates the utility of our softwareecosystem (including the ChemLG molecular library gen-erator code, the ChemHTPS automated high-throughputin silico screening program, and the ChemML machinelearning package) in facilitating and supporting researchefforts of this nature.
SUPPLEMENTARY MATERIAL
Electronic supplementary material accompanies thispaper and is available through the journal website. Itprovides the SMILES of the virtual compound library,SAscores of the 15 building blocks, and details of thecomputational and experimental data underlying the fig-ures and tables throughout this paper and that were usedin the statistical analysis. We also provide the list of de-scriptors used to develop the DNN model and the trainedmodel in scikit-learn’s pickle (.pkl) format. We note thatthis and other trained density models as well as the cor-responding ML workflows are available as part of theChemML package’s template and model collection (e.g.,for retraining, customization, or transfer learning) [51].Finally, we give detailed definitions of all statistical met-rics employed in this work.
COMPETING FINANCIAL INTERESTS
The authors declare to have no competing financialinterests.
ACKNOWLEDGMENTS
This work was supported by the National ScienceFoundation (NSF) CAREER program (grant No. OAC-1751161), and the New York State Center of Excel-lence in Materials Informatics (grants No. CMI-1140384and CMI-1148092). Computing time on the high-performance computing clusters ’Rush’, ’Alpha’, ’Beta’,and ’Gamma’ was provided by the UB Center for Com-putational Research (CCR). The work presented in this

8
FIG. 8. Z-score of each building block in all library subsets with increasing density values. Green color indicates positiveZ-scores and red negative values. The last cell shows the average density values in each of the ten segment with increasingtrend from 1200 to 1600 kg/m3.
paper is part of MAFA’s PhD thesis [59]. MH gratefullyacknowledges support by Phase-I and Phase-II SoftwareFellowships (grant No. ACI-1547580-479590) of the NSFMolecular Sciences Software Institute (grant No. ACI-1547580) at Virginia Tech [60, 61]. We are grateful toProf. Chong Cheng for valuable discussions and insights.
REFERENCES
[1] A. K. H. Kwan and W. W. S. Fung, “Packing densitymeasurement and modelling of fine aggregate and mor-tar,” Cem. Concr. Compos. 31, 349–357 (2009).
[2] J. Swenson and L. Borjesson, “Correlation between freevolume and ionic conductivity in fast ion conductingglasses,” Phys. Rev. Lett. 77, 3569–3572 (1996).
[3] Y. Shen, X. He, and F. R. Hung, “Structural and dynam-ical properties of a deep eutectic solvent confined insidea slit pore,” J. Phys. Chem. C 119, 24489–24500 (2015).
[4] H. E. H. Meijer and L. E. Govaert, “Mechanical perfor-mance of polymer systems: The relation between struc-ture and properties,” Prog. Polym. Sci. 30, 915–938(2005).
[5] S. Ando, “DFT calculations on refractive index disper-sion of fluoro-compounds in the DUV-UV-visible region,”J. Photopolym. Sci. Technol. 19, 351–360 (2006).
[6] Y. Terui and S. Ando, “Coefficients of molecular packingand intrinsic birefringence of aromatic polyimides esti-mated using refractive indices and molecular polarizabil-ities,” J. Polym. Sci. B 42, 2354–2366 (2004).
[7] F. R. Sheu and R. T. Chern, “Effects of packing densityon the gas-transport properties of poly (phenolphthaleinphthalate) s,” J. Polym. Sci., Part B: Polym. Phys. 27,1121–1133 (1989).
[8] N. Tanio and M. Irie, “Refractive index of organic pho-tochromic dye-amorphous polymer composites,” Jpn. J.Appl. Phys. 33, 3942 (1994).
[9] J. Hachmann, R. Olivares-Amaya, S. Atahan-Evrenk,C. Amador-Bedolla, R. S. Sanchez-Carrera, A. Gold-Parker, L. Vogt, A. M. Brockway, and A. Aspuru-Guzik,“The Harvard Clean Energy Project: Large-scale com-putational screening and design of organic photovoltaicson the world community grid,” J. Phys. Chem. Lett. 2,2241–2251 (2011).
[10] R. Olivares-Amaya, C. Amador-Bedolla, J. Hachmann,S. Atahan-Evrenk, R. S. Sanchez-Carrera, L. Vogt, andA. Aspuru-Guzik, “Accelerated computational discoveryof high-performance materials for organic photovoltaicsby means of cheminformatics,” Energy Environ. Sci. 4,4849–4861 (2011).
[11] C. Amador-Bedolla, R. Olivares-Amaya, J. Hachmann,and A. Aspuru-Guzik, “Organic Photovoltaics,” in In-
formatics for materials science and engineering: Data-
driven discovery for accelerated experimentation and
application, edited by Krishna Rajan (Amsterdam:Butterworth-Heinemann, 2013) Chap. 17, pp. 423–442.
[12] J. Hachmann, R. Olivares-Amaya, A. Jinich, A. L. Ap-pleton, M. A. Blood-Forsythe, L. R. Seress, C. Roman-Salgado, K. Trepte, S. Atahan-Evrenk, S. Er, S. Shrestha,R. Mondal, A. Sokolov, Z. Bao, and A. Aspuru-Guzik,“Lead candidates for high-performance organic photo-voltaics from high-throughput quantum chemistry - the

9
Harvard Clean Energy Project,” Energy Environ. Sci. 7,698–704 (2014).
[13] E. O. Pyzer-Knapp, C. Suh, R. Gomez-Bombarelli,J. Aguilera-Iparraguirre, and A. Aspuru-Guzik, “Whatis high-throughput virtual screening? A perspective fromorganic materials discovery,” Annu. Rev. Mater. Res. 45,195–216 (2015).
[14] S. A. Lopez, R. O. Pyzer-Knapp, G. N. Simm, T. Lutzow,K. Li, L. R. Seress, J. Hachmann, and A. Aspuru-Guzik,“The Harvard organic photovoltaic dataset,” Sci. Data 3,160086 (2016).
[15] S. Curtarolo, G. L. Hart, M. B. Nardelli, N. Mingo,S. Sanvito, and O. Levy, “The high-throughput high-way to computational materials design,” Nat. Mater. 12,191 (2013).
[16] P. Strasser, Q. Fan, M. Devenney, W. H. Weinberg,P. Liu, and J. K. Nørskov, “High throughput experi-mental and theoretical predictive screening of materials-a comparative study of search strategies for new fuel cellanode catalysts,” J. Phys. Chem. B 107, 11013–11021(2003).
[17] A. Jain, Y. Shin, and K. A. Persson, “Computationalpredictions of energy materials using density functionaltheory,” Nat Rev. Mater. 1, 15004 (2016).
[18] G. Hautier, C. Fischer, V. Ehrlacher, A. Jain, andG. Ceder, “Data mined ionic substitutions for the dis-covery of new compounds,” Inorg. Chem. 50, 656–663(2010).
[19] S. Li, Y. G. Chung, and R. Q. Snurr, “High-throughputscreening of metal–organic frameworks for co2 capturein the presence of water,” Langmuir 32, 10368–10376(2016).
[20] K. T. Butler, D. W. Davies, H. Cartwright, O. Isayev,and A. Walsh, “Machine learning for molecular and ma-terials science,” Nature 559, 547 (2018).
[21] J. Hachmann, T. L. Windus, J. A. McLean, V. All-wardt, A. C. Schrimpe-Rutledge, M. A. F. Afzal, andM. Haghighatlari, Framing the role of big data and mod-
ern data science in chemistry, Tech. Rep. (2018) NSFCHE Workshop Report.
[22] M. Haghighatlari and J. Hachmann, “Advances of ma-chine learning in molecular modeling and simulation,”Curr. Opin. Chem. Eng. 23, 51–57 (2019).
[23] X. Yao, “Evolving artificial neural networks,” Proc. IEEE87, 1423–1447 (1999).
[24] A. Alexandridis, E. Chondrodima, K. Moutzouris, andD. Triantis, “A neural network approach for the predic-tion of the refractive index based on experimental data,”J. Mater. Sci. 47, 883–891 (2012).
[25] A. Mannodi-Kanakkithodi, G. Pilania, T. D. Huan,T. Lookman, and R. Ramprasad, “Machine learningstrategy for accelerated design of polymer dielectrics,”Sci. Rep. 6, 20952 (2016).
[26] G. Montavon, K. Hansen, S. Fazli, M. Rupp, F. Biegler,A. Ziehe, A. Tkatchenko, A. V. Lilienfeld, and K. Muller,“Learning invariant representations of molecules for at-omization energy prediction,” in Advances in neural in-
formation processing systems 25, edited by F. Pereira,C. J. C. Burges, L. Bottou, and K. Q. Weinberger (Cur-ran Associates, Inc., 2012) pp. 440–448.
[27] V. Simon, J. Gasteiger, and J. Zupan, “A combined ap-plication of two different neural network types for the pre-diction of chemical reactivity,” J. Am. Chem. Soc. 115,9148–9159 (1993).
[28] M. Karthikeyan, R. C. Glen, and A. Bender, “Generalmelting point prediction based on a diverse compounddata set and artificial neural networks,” J. Chem. Inf.Model. 45, 581–590 (2005).
[29] A. Sonpal, Predicting melting points of deep eutectic sol-
vents, Master’s thesis, University at Buffalo (2018).[30] F. Gharagheizi, “QSPR analysis for intrinsic viscosity of
polymer solutions by means of GA-MLR and RBFNN,”Computational materials science 40, 159–167 (2007).
[31] J. Huuskonen, M. Salo, and J. Taskinen, “Aqueous sol-ubility prediction of drugs based on molecular topologyand neural network modeling,” J. Chem. Inf. Comput.Sci. 38, 450–456 (1998).
[32] M. A. F. Afzal, C. Cheng, and J. Hachmann, “Combin-ing first-principles and data modeling for the accurateprediction of the refractive index of organic polymers,”J. Chem. Phys. 148, 241712 (2018).
[33] M. A. F. Afzal and J. Hachmann, “Benchmarking DFTapproaches for the calculation of polarizability inputs forrefractive index predictions in organic polymers,” Phys.Chem. Chem. Phys. 21, 4452–4460 (2019).
[34] M. A. F. Afzal, M. Haghighatlari, S. P. Ganesh,C. Cheng, and J. Hachmann, “Accelerated discoveryof high-refractive-index polyimides via first-principlesmolecular modeling, virtual high-throughput screening,and data mining,” J. Phys. Chem. C 123, 14610–14618(2019).
[35] T. Higashihara and M. Ueda, “Recent progress in high re-fractive index polymers,” Macromolecules 48, 1915–1929(2015).
[36] E. K. Macdonald and M. P. Shaver, “Intrinsic high re-fractive index polymers,” Polym. Int. , n/a–n/a (2014).
[37] G. L. Slonimskii, A. A. Askadskii, and A. I. Kitaigorod-skii, “The packing of polymer molecules,” Polym. Sci.(USSR) 12, 556–577 (1970).
[38] D. Weininger, “SMILES, a chemical language and infor-mation system. 1. Introduction to methodology and en-coding rules,” J. Chem. Inf. Model. 28, 31–36 (1988).
[39] N. M. O’Boyle, M. Banck, C. A. James, C. Morley,T. Vandermeersch, and G. R. Hutchison, “Open Babel:An open chemical toolbox,” J. Cheminf. 3, 33–33 (2011).
[40] T. A. Halgren, “MMFF VI. MMFF94s option for energyminimization studies,” J. Comput. Chem. 20, 720–729(1999).
[41] J. Wang, R. M. Wolf, J. W. Caldwell, P. A. Kollman, andD. A. Case, “Development and testing of a general amberforce field,” J. Comput. Chem. 25, 1157–1174 (2004).
[42] J. Wang, W. Wang, P. A. Kollman, and D. A. Case, “Au-tomatic atom type and bond type perception in molecu-lar mechanical calculations,” J. Mol. Graph. Model. 25,247–60 (2006).
[43] D. A. Case, I. Y. Ben-Shalom, S. R. Brozell, D. S.Cerutti, T. E. Cheatham, V. W. D. Cruzeiro III, T. A.Darden, R. E. Duke, D. Ghoreishi, M. K. Gilson,H. Gohlke, A. W. Goetz, D. Greene, R. Harris, N. Home-yer, S. Izadi, A. Kovalenko, T. Kurtzman, T. S. Lee,S. LeGrand, P. Li, C. Lin, J. Liu, T. Luchko, R. Luo,D. J. Mermelstein, K. M. Merz, Y. Miao, G. Monard,C. Nguyen, H. Nguyen, I. Omelyan, A. Onufriev,F. Pan, R. Qi, D. R. Roe, A. Roitberg, C. Sagui,S. Schott-Verdugo, J. Shen, C. L. Simmerling, J. Smith,R. Salomon-Ferrer, J. Swails, R. C. Walker, J. Wang,H. Wei, R. M. Wolf, X. Wu, L. Xiao, D. M. York, andP. A. Kollman, “Amber 2018,” (2018).

10
[44] H. J. C. Berendsen, D. van der Spoel, and R. vanDrunen, “GROMACS: A message-passing parallel molec-ular dynamics implementation,” Comput. Phys. Com-mun. 91, 43–56 (1995).
[45] C. Caleman, P. J. van Maaren, M. Hong, J. S. Hub, L. T.Costa, and D. van der Spoel, “Force field benchmarkof organic liquids: density, enthalpy of vaporization,heat capacities, surface tension, isothermal compressibil-ity, volumetric expansion coefficient, and dielectric con-stant,” J. Chem. Theory Comput. 8, 61–74 (2011).
[46] J. Hachmann, M. A. F. Afzal, M. Haghighatlari, andY. Pal, “Building and deploying a cyberinfrastructurefor the data-driven design of chemical systems and theexploration of chemical space,” Mol. Simul. 44, 921–929(2018).
[47] Mohammad Atif Faiz Afzal, Gaurav Vishwakarma, Jan-havi Abhay Dudwadkar, Mojtaba Haghighatlari, andJohannes Hachmann, “ChemLG – A Program Suite forthe Generation of Compound Libraries and the Surveyof Chemical Space,” (2019).
[48] L. Pu, M. Naderi, T. Liu, H. Wu, S. Mukhopadhyay,and M. Brylinski, “eToxPred: a machine learning-basedapproach to estimate the toxicity of drug candidates,”BMC Pharmacol Toxicol. 20, 2 (2019).
[49] Yudhajit Pal, William S. Evangelista, MohammadAtif Faiz Afzal, Mojtaba Haghighatlari, and JohannesHachmann, “ChemHTPS – An Automated Virtual High-Throughput Screening Platform,” (2019).
[50] Mojtaba Haghighatlari, Gaurav Vishwakarma, Doaa Al-tarawy, Ramachandran Subramanian, Bhargava UralaKota, Aditya Sonpal, Srirangaraj Setlur, and JohannesHachmann, “ChemML: A Machine Learning and Infor-matics Program Package for the Analysis, Mining, andModeling of Chemical and Materials Data,” ChemRxiv ,8323271 (2019).
[51] Mojtaba Haghighatlari, Gaurav Vishwakarma, Doaa Al-tarawy, Ramachandran Subramanian, Bhargava UralaKota, Aditya Sonpal, Srirangaraj Setlur, and JohannesHachmann, “ChemML – A Machine Learning and Infor-matics Program Package for the Analysis, Mining, andModeling of Chemical and Materials Data,” (2019).
[52] F. Pedregosa, G. Varoquaux, A. Gramfort, V. Michel,B. Thirion, O. Grisel, M. Blondel, P. Prettenhofer,R. Weiss, V. Dubourg, J. Vanderplas, A. Passos, D. Cour-napeau, M. Brucher, M. Perrot, and E. Duchesnay,“Scikit-learn: Machine learning in python,” J. Mach.Learn. Res. 12, 2825–2830 (2011).
[53] Talete srl, “DRAGON (Software for molecular descriptorcalculation),” (2011).
[54] G. Piacenza, G. Legsai, B. Blaive, and R. Gallo, “Molec-ular volumes and densities of liquids and solids by molec-ular mechanics estimation and analysis,” J. Phys. Org.Chem. 9, 427–432 (1996).
[55] David Rogers and Mathew Hahn, “Extended-Connectivity Fingerprints,” Journal of ChemicalInformation and Modeling 50, 742–754 (2010).
[56] Ramaswamy Nilakantan, Norman Bauman, J ScottDixon, and R Venkataraghavan, “Topological torsion:a new molecular descriptor for SAR applications. Com-parison with other descriptors,” Journal of Chemical In-formation and Computer Sciences 27, 82–85 (1987).
[57] Raymond E Carhart, Dennis H Smith, andR Venkataraghavan, “Atom pairs as molecular fea-tures in structure-activity studies: definition and
applications,” Journal of Chemical Information andComputer Sciences 25, 64–73 (1985).
[58] H L Morgan, “The Generation of a Unique MachineDescription for Chemical Structures-A Technique Devel-oped at Chemical Abstracts Service.” Journal of Chemi-cal Documentation 5, 107–113 (1965).
[59] M. A. F. Afzal, From virtual high-throughput screening
and machine learning to the discovery and rational de-
sign of polymers for optical applications, Ph.D. thesis,University at Buffalo (2018).
[60] A. Krylov, T. L. Windus, T. Barnes, E. Marin-Rimoldi,J. A. Nash, B. Pritchard, D. G. A. Smith, D. Altarawy,P. Saxe, C. Clementi, T. D. Crawford, R. J. Harrison,S. Jha, V S. Pande, and T. Head-Gordon, “Perspective:Computational chemistry software and its advancementas illustrated through three grand challenge cases formolecular science,” J. Chem. Phys. 149, 180901 (2018).
[61] N. Wilkins-Diehr and T. D. Crawford, “NSF’s inaugu-ral software institutes: The science gateways communityinstitute and the molecular sciences software institute,”Comput. Sci. Eng. 20, 26–38 (2018).

download fileview on ChemRxiv09_ml_numberdensity_clean.pdf (727.57 KiB)

Other files
download fileview on ChemRxivMD_screening_density_data.xlsx (4.89 MiB)
download fileview on ChemRxivML_screening_density_data.csv (95.77 MiB)
download fileview on ChemRxivden_MD_predict.joblib.pkl (909.63 KiB)


![Split Packing: An Algorithm for Packing Circles with up to ... · Packing squares in a square The critical density for packing squares is 1=2 [Moon & Moser, 1967] Sebastian Morr Split](https://img.dokumen.tips/doc/110x75/5f057bf67e708231d41330ff/split-packing-an-algorithm-for-packing-circles-with-up-to-packing-squares-in.jpg)