Embed Size (px)
Citation preview

HAL Id: lirmm-01884005https://hal-lirmm.ccsd.cnrs.fr/lirmm-01884005
Submitted on 29 Sep 2018
HAL is a multi-disciplinary open accessarchive for the deposit and dissemination of sci-entific research documents, whether they are pub-lished or not. The documents may come fromteaching and research institutions in France orabroad, or from public or private research centers.
L’archive ouverte pluridisciplinaire HAL, estdestinée au dépôt et à la diffusion de documentsscientifiques de niveau recherche, publiés ou non,émanant des établissements d’enseignement et derecherche français ou étrangers, des laboratoirespublics ou privés.
A Deep learning method for accurate and fastidentification of coral reef fishes in underwater imagesSebastien Villon, David Mouillot, Marc Chaumont, Emily Darling, Gérard
Subsol, Thomas Claverie, Sébastien Villéger
To cite this version:Sebastien Villon, David Mouillot, Marc Chaumont, Emily Darling, Gérard Subsol, et al.. A Deeplearning method for accurate and fast identification of coral reef fishes in underwater images. EcologicalInformatics, Elsevier, 2018, 48, pp.238-244. �10.1016/j.ecoinf.2018.09.007�. �lirmm-01884005�

Draft Version - Accepted in Elsevier Ecological Informatics the 3th
of September 2018
A Deep Learning method for accurate and fast identification of
coral reef fishes in underwater images
Sébastien Villona,b
, David Mouillota,g
, Marc Chaumontb,c
, Emily S. Darlingd,e
, Gérard Subsolb, 5
Thomas Claveriea,f
, Sébastien Villégera
10
a MARBEC, University of Montpellier,CNRS, IRD, Ifremer, Montpellier, France
b LIRMM, University of Montpellier/CNRS, France
c University of Nîmes, Nîmes, France
d Department of Ecology and Evolutionary Biology, University of Toronto, Toronto, Canada
e Marine Program, Wildlife Conservation Society, Bronx, United States 15
f CUFR Mayotte, France
g Australian Research Council Centre of Excellence for Coral Reef Studies, James Cook University,
Townsville, QLD 4811 Australia.
20
Abstract
Identifying and counting fish individuals on photos and videos is a crucial task to cost-effectively
monitor marine biodiversity, yet it remains difficult and time-consuming. In this paper, we present a 25
method to assist the identification of fish species on underwater images, and we compare our model
performances to human ability in terms of speed and accuracy. We first tested the performance of a
convolutional neural network (CNN) trained with different photographic databases while
accounting for different post-processing decision rules to identify 20 fish species. Finally, we
compared the performance of species identification of our best CNN model with that of humans on 30
a test database of 1197 fish images representing nine species. The best CNN was the one trained
with 900 000 images including (i) whole fish bodies, (ii) partial fish bodies and (iii) the
environment (e.g. reef bottom or water). The rate of correct identification was 94.9%, greater than
the rate of correct identification by humans (89.3%). The CNN was also able to identify fish
individuals partially hidden behind corals or behind other fish and was more effective than humans 35
to identify fish on smallest or blurry images while humans were better to identify fish individuals in
unusual positions (e.g. twisted body). On average, each identification by our best CNN using a
common hardware took 0.06 seconds. Deep Learning methods can thus perform efficient fish
identification on underwater images and offer promises to build-up new video-based protocols for
monitoring fish biodiversity cheaply and effectively. 40
Keywords: marine fishes, convolutional neural network, underwater pictures, machine learning,
automated identification 45

Draft Version - Accepted in Elsevier Ecological Informatics the 3th
of September 2018
Introduction
Coral reefs host a massive and unique biodiversity with, for instance, more than 6,000 fish species
(Mouillot et al., 2014) and provide key services to millions of people worldwide (Rogers et al.,
2017). Yet, coral reefs are increasingly impacted by global warming, pollution and overfishing 50
(Graham et al., 2011; Robinson et al., 2017; Scott and Dixson, 2016; Hughes et al., 2017; Cinner et
al. 2018). The monitoring of fish biodiversity through space and time on coral reefs (Halpem et al.,
2008; Jackson et al., 2001) is thus a critical challenge in marine ecology in order to better
understand the dynamics of these ecosystems, predict fisheries productivity for dependent human
communities, and improve conservation and management strategies to ensure their sustainability 55
(Krueck et al., 2017; Pandolfi et al., 2003).
Most surveys of coral reef fishes are based on underwater visual censuses (UVC) carried out by
scuba divers (Brock, 1954; Cinner et al., 2016, 2018; Thresher and Gunn, 1986). While non-
destructive, this protocol requires the identification and enumeration of hundreds of individuals 60
belonging to hundreds of species so it can only be performed by highly trained scientific divers
while being time consuming. In addition, the accuracy of such visual-based assessments is highly
dependent on conditions (depth, dive duration) and divers experience while the presence of diver
biases the detection of some furtive species (Chapman and Atkinson, 1986; Harvey et al., 2004;
Sale and Sharp, 1983; Watson and Harvey, 2007; Willis, 2001). 65
Over the last decade, underwater cameras have been increasingly used to record fish individuals on
fixed videos, along belt transects (Cappo, 2003; Langlois et al., 2010; Mallet and Pelletier, 2014), or
around baits to attract predators (Harvey et al., 2007; Watson et al., 2005; Willis and Babcock,
2000). Video-based surveys provide estimations of fish abundance and species diversity similar to 70
UVC-based surveys (Pelletier et al., 2011). Video-based methods can be used to overcome the
limitations of human-based surveys (depth, time underwater). They also provide a permanent record
that could later be re-analyzed. However, assessing fish biodiversity and abundance from videos
requires annotation by highly trained specialists and is a demanding, time-consuming and expensive
task with up to several hours required to identify fish individuals per hour of video (Francour et al. 75
1999). There is thus an urgent need to develop new tools for automatic identification of fish
individuals on photos and videos to provide accurate, efficient, repeatable and cost-effective
monitoring of reef ecosystems.
Automatic and accurate identification of organisms on photos is crucial to move toward automatic 80
video processing. In addition, automatic identification of species on photos is especially relevant for
citizen science. For instance, the application pl@ntNet (https://plantnet.org/) automatized the
identification of 13,000 species of plants. For fishes, some public tools like inaturalist.org or fishpix
(http://fishpix.kahaku.go.jp) offer the possibility to upload images that will be manually identified
by experts. These valuable initiatives would benefit from the support of automatic identification 85
algorithms to save time of experts.
The performance of recent methods dedicated to the automatic identification of objects on images
has drastically increased over the last decade (Siddiqui et al, 2017; Lowe, 1999). However, some of
these methods have been tested only on images recorded in standardized conditions, in terms of 90
light and/or fish position (e.g. only lateral views) (Levi, 2008; Alsmadi et al, 2010). Identification of
fish individuals on ‘real-life’ underwater images is more challenging because (i) color and
brightness are highly variable between images and even within a given image, (ii) the environment
is textured and has a complex 3-dimentional architecture, (iii) fish can be recorded in various
positions and are often hidden behind other fish or corals, and (iv) the acquisition camera and its 95
internal parameters can be variable.
Draft Version - Accepted in Elsevier Ecological Informatics the 3th
of September 2018
Recently, an accurate automation of detection and identification of fish individuals has been
obtained (Shortis et al., 2016) using machine-learning methods such as support vectors machines 100
(Blanc et al. 2014), nearest neighbor classifiers (Levi, 2008), discriminant analysis classifiers
(Spampinato et al., 2010) or Deep Learning (Li et al., 2015). The latest competitions (Joly et al.,
2106) and comparisons (Villon et al., 2016) show that Deep Learning based methods, which are a
type of neural network combining simultaneously automatic image descriptor and descriptor
classification, tend to achieve the highest performance, particularly convolutional neural network 105
(CNN) that add deep layers to classical neural networks (Lecun et al., 2015).
However, the accuracy of CNN methods is highly dependent on the extent and the quality of data
used during the training phase, i.e. the set of images annotated by experts for all classes to identify.
The effects of the extent of the training database (i.e. the number of images per class) and 110
associated post-processing decision rules on the performance of the whole identification process
remain untested. Since real-life videos of coral reef fishes and thus images extracted from those
videos are highly diverse in terms of surrounding conditions (environment, light, contrast) and fish
positions, the performance of identification methods must be carefully tested using an independent
dataset to assess its robustness over changing conditions. 115
Furthermore, the performance of models should be compared to the performance of humans to
determine whether machine-based assessment of fish biodiversity provides an advantage over
traditional human processing of images (Matabos et al., 2017). Here we tested the performance of 4
models, built with the same CNN architecture, for automatic identification of fish species on coral 120
reefs. Specifically, we assessed the effect of several training image datasets and several decision
rules, with a particular focus to identify fish partially hidden behind the coral habitat. We then
compared the performances of the best CNN models to those of humans.
125
Methods
Image acquisition for training and testing CNN models
We used GoPro Hero3+ black and GoPro Hero4+ black cameras to record videos at 30 fps over 50
reef sites around the Mayotte island (Mozambique Channel, Western Indian Ocean) including 130
fringing and barrier reefs, and at depth from 1 to 25m. Videos were recorded from April to
November 2015. Recording conditions varied between sites and days, especially in term of light and
environment (i.e. proportion of hard and soft corals, sand and water visible). All videos were
recorded with a resolution of 1280x720 (HD) and 1920x1080 pixels (full HD) with default settings
for color temperature and exposure (i.e. no use of protune or automatic color balance adjustment). 135
For all recordings, the cameras remained stationary and no artificial light or filter were used. We
recorded 116 videos representing a total of 25 hours.
For all videos, 5 frames per second were extracted leading to a database of 450,000 frames. Fish
individuals were delineated and identified by undergraduate, master degree students and PhD 140
students in marine biology trained for fish identification on videos with the support of identification
keys and under the supervision of experts (Froese and Pauly, 2000; Taquet and Diringer, 2007).
Each annotation consisted in drawing a rectangle bounding box around a single fish individual,
including only its very close context as illustrated on Fig.1.a, and associating a label (i.e. species
name) to this individual. We call those specific images “thumbnails”. 145
The criteria for the annotation were:
1) Annotate a fish only if there is no more than 10% of its surface covered by another object (fish,
coral, or substrate).

Draft Version - Accepted in Elsevier Ecological Informatics the 3th
of September 2018
2) Annotate a fish only if it can be identified at the species level in the frame (i.e. independently
from previous or next frames where the same fish could have a better position for identification). 150
3) Annotate a fish only if its apparent size is larger than 3,000 squared pixels, i.e. ignoring fish
individuals too far from the camera.
4) Annotate images from different habitats and depths to represent a broad range of light conditions
and environment, and target at least 1,200 thumbnails per species.
155
We did not consider thumbnails of individuals in positions where they are hard to identify (such as
fish seen from front) since they would bring more noise than relevant information for the algortihm
as the discriminating parts of the fish are hidden (specific color pattern, marks, etc). We did not
process the image with background subtraction for 2 reasons:
1) We did assume that in our case the context helps to identify fish species, as some species tend to 160
be associated with some particular environment such as Amphiprion in sea anemone, Chromis
viridis on Acroporas, Caesionidae in plain water etc...
2) We wanted our process to be used on full images. In such context, separating fish individuals
from their background would be either manual or not reliable.
165
This annotation procedure yielded a training dataset (T0) with 44,625 annotated fish thumbnails
belonging to 20 species (Table 1). The 20 species present in the training dataset represent the most
common species appearing in the videos and belong to 12 families among the most diverse and
abundant on coral reefs worldwide (e.g. Pomacentridae, Acanthuridae, Chaetodontidae, Labridae).
Models were then tested using a set of images independent from the ones used for the training phase 170
to ensure a cross validation procedure and that model performance reflects real-life study case.
More specifically, the test dataset was built using 6 videos recorded in contexts different from those
of videos used for training (i.e. sites or days not included in the training database). Annotations of
these videos were made like the training dataset except that it included fish individuals partially
hidden by other fish or by corals as well as fish individuals viewed from front or back (their identity 175
being checked using when necessary previous or next frames). As our goal is to identify fish species
on images and photos, the test without any filter allows to assess to which extent our algorithm is
performing to help users to take a picture good enough for fish identification.
We obtained a test dataset of 4,405 annotated fish thumbnails belonging to 18 out of the 20 species 180
present in the training dataset (Table S3). We then randomly selected a subset of 1,197 fish
thumbnails belonging to 9 species to compare the performance of humans vs. obtained models
(Table S3).
185
Deep-learning algorithm
We used a convolutional neural network (CNN) architecture to build a fish identification model
(Schmidhuber, 2015). CNNs are a class of deep learning algorithms used to analyze data and
particularly to classify objects from images (Krizhevsky et al., 2012).
190
CNNs are made of layers of interconnected neurons and each neuron includes a ‘convolutional
kernel’ that computes a set of mathematical operations (defined by ‘weights’) on the matrices of
values describing the image (i.e. values for each color channel for each pixel).
Convolutional features are combinations of pixel values that encode information about target
classes. Low level features can detect edges or color patterns, while, high level features might 195
differentiate different fish shapes.
This process yielded ‘feature maps’, i.e. a vector describing image characteristics (shapes, colors,
statistical information of the image).

Draft Version - Accepted in Elsevier Ecological Informatics the 3th
of September 2018
The main difference between CNNs and other classifiers is that CNNs build the “feature extractors” 200
(convolutions in the case of CNN) and the classifier conjointly.
Then the last layer of the network classifies those feature maps with a soft-max method and gives as
output scores corresponding to the “probability” that each image belongs to each of the learned
classes (Lecun et al., 2015). More precisely, the training phase of the network consists in iteratively
modifying the weights of the convolutional kernels (hence features maps) to optimize the 205
classification score of all classes.
We used a GoogLeNet architecture as it was the winner of the 2015 competition imageNet (Szegedy
et al., 2015), an identification challenge on 1,000 different classes. This CNN is composed of 22
layers. It uses inception modules. Inception modules allow the network to use convolutions of 210
different sizes (1*1, 3*3 and 5*5 pixels) and to weight each of these convolutions. This network
could thus account more or less strongly for the context of each pixel, which increases the range of
possibilities to improve its performance during the training.
A link to a depository with architecture details is given at the end of references. We stopped the 215
network training after 70 epochs (i.e. a complete scope of the dataset where each image is used only
once), to prevent overfitting. We used a learning rate of 10-5
, an exponential learning decay with a
Gamma of 0.95, a dropout of 50% and an Adam Solver type as learning parameters. Those are
classic hyper-parameters for a fast convergence of the network without over-fitting (Srivastava,
2014). The weight initialization is also classic with a random Gaussian initialization. The training 220
lasted 8 days on our configuration; we trained and ran our code on a computer with 64GB of RAM,
an i7 3.50GHz CPU and a Titan X GPU card for 900,000 images.
We used at least 2200 thumbnails per fish species class, and batches of 16 images to train our
network. We ran this architecture on Caffe (Jia et al, 2014). To focus on the impact of the training 225
data, we used the same CNN architecture for our training and test procedures.
Building the training datasets
Using the raw training dataset of 20 fish species (Table S1) we built 4 different datasets to assess
the influence of the dataset building on classification results (Table S2). 230
The first training dataset T1 contained raw fish thumbnails (T0) and their respective mirror images.
More precisely, we doubled the number of thumbnails per fish individual by flipping each
thumbnail with respect to the vertical axis. Such a procedure homogenizes the proportion of left-
oriented and right-oriented individuals in the database and we hypothesize it could improve the 235
average identification rate since fish individuals are seen in all positions.
The second training dataset T2 contained fish thumbnails from T1 plus “part of fish” thumbnails.
Thumbnails of this class were obtained by splitting each thumbnail of T0 into 4 parts: upper part,
lower part, right part, and left part as shown on Fig.1. b. We hypothesized that this class can prevent 240
from misidentification of partially hidden individuals. For instance, if a black and white fish is
partially hidden so that only its dark part is visible it would likely be confounded with a full dark
fish.
The third training dataset T3 contained fish thumbnails from T2 plus thumbnails of a single class 245
“Environment”. Environment thumbnails were extracted at random in portion of frames where no
fish was detected. We hypothesized that such a procedure can help distinguishing between fish
species given the high diversity of environments present around them, i.e. allowing CNN models to
find more efficiently features discriminating fishes whatever the background around them.
250

Draft Version - Accepted in Elsevier Ecological Informatics the 3th
of September 2018
The fourth training dataset T4 contained thumbnails from T3 minus the “part of fish”, which is
replaced by 20 classes “part of species” obtained by splitting thumbnails from each species. The
difference between T3 and T4 was that T3 contained only one global class “part of fish” whereas T4
contained as many “part of species” classes as there were “fish” species.
255
Figure 1: Thumbnails samples.
a) Examples of thumbnails of whole fish individuals from the training database and b) examples of
thumbnails extracted from whole fish picture to build “part of fish” and “part of species” classes.
260
Testing the performance of models
We first compared the performance of the 4 models trained using each of the 4 training datasets. In
addition, we tested the performance of models after correcting their raw outputs using two a 265
posteriori decision rules. First, since the networks trained with T2, T3 or T4 are likely to recognize
environment samples with a high confidence score (over 99%) they could thus classify some fish as
an environment class (i.e. false positive). We therefore defined a decision rule (r1): when the first
proposition of the network was ‘environment’ with a confidence lower than 99% we provide, as
final output, the fish class with the highest probability. 270
Similarly, as “part of species” classes present in T4 were just a methodological choice to improve
model performance (and hence were absent from the test database), we defined a second decision
rule (r2): when the result given by the network is “part of species X”, we provide, as final output,
“species X”.
275
We then compared the performance of the best model with the performance of humans, in terms of
accuracy and time needed to identify fish thumbnails. This experiment aimed to compare the results
obtained by humans to those obtained by the CNN using a fair method. This means that during the
comparison procedure both CNN and humans were shown thumbnails without any contextual
information (there was no general view of the scene), and the thumbnails were never seen before 280
the test procedure. The procedure could even be slightly in favor of humans because they knew that
there were only 9 species to classify, whereas the CNN worked from the 21 species learned and
misclassification could occur with a higher probability.
Our goal was to allow humans to identify species as fast as possible in this particular context. For 285
this purpose, we developed an online survey tool operating in Chrome web browser which allowed
users to easily and quickly identify a fish on a picture displayed at the center of the window by
either writing the name of the species (with auto-completion) or to select it from a list. A “help”
Draft Version - Accepted in Elsevier Ecological Informatics the 3th
of September 2018
sheet showing a reference picture of the fish species to identify was available in the same window
(Fig. S1). Once a user selected a species, time to perform the identification was saved and a new 290
randomly chosen fish picture was displayed.
This comparison was performed on 1197 randomly chosen thumbnails of only 9 species present in
the test thumbnail dataset (Table S3) to ease the test for humans. The test lasted 20 minutes with the
help of 10 undergraduate students, 2 Master Degree and 2 PhD student in biology from the 295
University of Montpellier who were previously trained to identify these fish species. Such a short
test duration for humans reduces tiredness that could decrease identification accuracy and rapidity.
We then compared the answers to the ground truth (i.e. identification made by experts in fish
taxonomy) and computed the time needed to perform each identification. We finally compared
correct identification rate and time per fish individual between humans and the best CNN model. 300
Results
Influence of the training database and of post-processing on model performance
The 4 CNN models obtained with 4 different datasets (T1, T2, T3, T4) had similar mean 305
identification success rate, close to 87% (Table 1). However, there were marked differences in
correct identification rate between models for several species. For instance, Dascyllus carneus was
correctly identified in only 4% of the cases by model trained with only whole fish thumbnails (T1)
while it was correctly identified in more than 90% of cases by the three other models. Conversely,
Pomacentus sulfureus was more often correctly identified by the models trained with T1 than by 310
models trained with environment thumbnails (T3 and T4).
Table 1:
Raw success rate (%) of the 4 CNN models trained with different thumbnails datasets for
identifying 18 fish species. See details about training databases in Table S2. 315
Species Only whole fish (T1) Whole fish and part of fish
(T2)
Whole fish, environment
and part of fish (T3)
Whole fish, environment
and part of species (T4)
Abudefduf sparoides 80.8 94.9 85.8 82.8
Abudefduf vaigiensis 94.5 89.0 89.0 80.0
Chaetodon trifascialis 94.7 90.4 91.0 85.1
Chromis weberi 98.8 96.6 92.9 98.8
Dascyllus carneus 4.0 91.5 92.3 91.5
Monotaxis grandoculis 90.0 68.0 77.7 79.1
Myripristis botche 100 80.0 75.0 95.0
Naso elegans 96.2 92.4 89.7 95.1
Naso vlamingii 92.6 95.3 89.1 95.8
Nemateleotris magnifica 100 98.2 99.5 99.1
Odonus niger 79.5 91.4 92.6 81.8
Plectroglyphidodon lacrymatus 100 100 74.2 94.0
Pomacentrus sulfureus 97.8 67.6 82.5 73.8
Pterocaesio tile 100 100 100 99.5
Pygoplytes diacanthus 84.2 91.5 84.2 86.8
Thalassoma hardwicke 83.9 82.7 88.0 87.3
Zanclus cornutus 93.3 84.3 86.4 89.0
Zebrasoma scopas 89.0 88.8 88.8 92.7
Mean identification success rate
87.6 87.9 87.7 86.9
Draft Version - Accepted in Elsevier Ecological Informatics the 3th
of September 2018
Post-processing raw outputs of the model T4 following decision rule r1 (i.e. environment not
considered as a correct result), improved correct identification rate from 86.9 to 90.2% (Table 2). 320
Adding decision rule r2 (i.e. identification of a part of a species considered as a correct answer)
increased this success rate to 94.1% (Table 2). Hence, post-processing raw outputs of the model
trained with the most complete dataset provided the best identification rate. Among the 18 species,
success rate ranged from 85.2 to 100%, with only 3 species being correctly identified in less than
90% of cases and 9 species being correctly identified in more than 95% of cases, including 3 with a 325
correct identification rate >99%.
Confusions between 2 fish species were lower than 4% (Table 3). Confusion between a fish and the
environment was common when no post-processing was applied with for instance up to 20.9% of
Pomacentrus sulfureus individuals misidentified as environment (Tables S4, S5). However, 330
applying decision rule r1 decreased this error rate to less than 4% (Table 3).
Table 2:
Success rate (%) of 3 CNN models for identifying 18 fish species. First column presents accuracy
based on raw output of a deep-learning model trained with thumbnails of whole fish, part of species 335
and environment (as last column of Table 2). Second column presents accuracy after applying a
decision rule ‘r1’ keeping most likely fish class if ‘environment’ was the most likely class. Third
column presents results after applying decision rule ‘r1’ plus decision rule ‘r2’: “part of species X”
is equivalent to “species X”. Numbers are percentages of correct fish identification.
340
Species Raw output Decision Rule r1 Decision Rules r1 and
r2
Abudefduf sparoides 82 88 91.9
Abudefduf vaigiensis 80 89 98
Chaetodon trifascialis 85.1 87.8 91.5
Chromis weberi 98.8 98.8 99.2
Dascyllus carneus 91.5 91.5 91.5
Monotaxis grandoculis 79.1 83.3 86.1
Myripristis botche 95 95 95
Naso elegans 95.1 96.7 97.8
Naso vlamingii 95.8 96 96
Nemateleotris magnifica 99.1 100 100
Odonus niger 81.8 81.8 85.2
Plectroglyphidodon lacrymatus 94 94 96
Pomacentrus sulfureus 73.7 78.1 87.9
Pterocaesio tile 99.5 100 100
Pygoplytes diacanthus 86.8 89.4 92.1
Thalassoma hardwicke 87.3 89.6 94.2
Zanclus cornutus 89 95.3 98.4
Zebrasoma scopas 92.7 92.7 92.7
Average success rate 86.9 90.2 94.1

Draft Version - Accepted in Elsevier Ecological Informatics the 3th
of September 2018
Table 3:
Performance and confusion rates of CNN model for 9 fish species.The CNN was trained with
dataset T4 (see Table 1), including thumbnails of whole fish, part of species and environment. Raw 345
CNN outputs were post-processed with following decision rules:
‘r1’: If the highest probability is lower than 99% and is for class “environment” then the fish class
with the second highest probability is kept.
‘r2’: Outputs “part of species X” are considered as equivalent to “species X” (i.e. the scores of A.
sparoides and part of A. sparoides were merged). 350
Columns indicate the species to classify, and rows indicate the results (most probable species) given
by the model (i.e. percentages on the diagonal indicate success rate). Only values over 1% are
shown. Full names of species are in Table 1
Species A.sparoides A. vaigiensis C. Trifascialis N. elegans P. sulfureus P. diacanthus T. hardwicke Z. cornutus Z. scopas A.sparoides 91.9 1.3
A. vaigiensis 1.1 98.2
C. Trifascialis 91.5 1.0 C. Weberi 2.2 1.1 1.5
D. caruleus 3.9 N. elegans 97.8 P. sulfureus 1.0 1.8 1.0 87.9 2.5
P. diacanthus 3.8 92.1
P. lacrymatus 2.6 T. Hardwicke 2.0 1.5 94.2
Z. cornutus 1.0 98.5
Z. scopas 92.7 Environment 3.6 2.6 1.0
355
Performance of CNN models vs. humans
On average, each human identified 270 fish thumbnails during the 20-minute test. Mean rate of 360
correct classification for humans was of 89.3% with a standard deviation of 6% (Table 4). Rate of
correct classification achieved by the best model on the same thumbnails was of 94.9% with a
standard deviation of 3.3%. Correct classification rate by the best model ranged from 88.2%
(Abudefduf sparoides) to 98.2% (Abudefduf vaigiensis). For only one species (Zanclus cornutus),
the best model had a lower performance than humans but both were higher than 97%. The mean 365
time needed to identify a fish by humans was 5 seconds, with the fastest answer given in 2 seconds
and the longest in 9 seconds. On average, each classification by our final model took 0.06 seconds
with hardware detailed above.
When tested against humans using a challenge with only 9 potential species, the network was more
effective on smaller or blurrier thumbnails, while humans were better to recognize unusual positions 370
(Fig. 2). There were only 2% of fish individuals which were neither identified by humans nor by the
network (Fig. 2).
However, experts with more than 10 years of experience in the field may have outperformed the
CNN model in terms of correct identification particularly for hidden or unusually positioned fish.
375

Draft Version - Accepted in Elsevier Ecological Informatics the 3th
of September 2018
Table 4: Accuracy (success rate in %) of fish identification by humans and by the best CNN model
for 9 species. The model was trained using thumbnails of whole fish, part of fish species and
environment (T?). Raw outputs were post-processed applying two decision rules: (r1) keeping most 380
likely fish class if “environment” was the most likely class, and (r2) considering “part of species X”
equivalent to “species X”.
Species Number of thumbnails tested Deep-learning model Humans
Abudefduf sparoides 88 93.4 87.7
Abudefduf vaigiensis 47 97.3 84.7
Chaetodon trifascialis 149 95.1 89.4
Naso elegans 165 98.4 94.8
Pomacentrus sulfureus 443 97.9 93.2
Pygoplites diacanthus 35 90.4 77.4
Thalassoma hardwicke 73 96 91
Zanclus cornutus 53 97.1 97.8
Zebrasoma scopas 144 96.2 88.3
Average success rate 1197 95.7 89.3
385
Discussion
Assessing the performance of the same CNN trained with four different datasets demonstrates that
correct identification rates were all close to 87% . Thus, a training dataset made of more than 1300 390
thumbnails of each species could yield a success rate similar to the ones obtained in image
identification challenges in more controlled conditions (Siddiqui et al., 2017). Beyond their number,
thumbnails of each species used to train the network were extracted from different videos and
different sites to include as many orientations of fish as possible and to embrace a strong
environmental variability in terms of light, colors and depth. However, our best CNN model may 395
perform more poorly with a broader range of species across other locations and environments. Our
18 species belong to 12 different families so are likely to differ in shape or color. With much more
congeneric species these differences would make the identification much more challenging.
Despite a similar mean success rate, the performance of the four models differed markedly for some 400
species. Ten out of the 18 species were more often correctly identified when CNN models were
trained using thumbnails of part of fish or environment, and eight other species were better
identified by the model trained with only whole fish picture. Additionally, some species were often
misidentified as environment (Table S5), even if the probability of this class was lower than
99%.Such confusion could be explained by the fact that some small species are always close to 405
corals and of similar colors, e.g. the yellow benthic fish Pomacentrus sulfureus. Similarly, for the
small Dascyllus carneus case, which is often misclassified with almost all fish species when
background was not included in the training dataset, the addition of environment thumbnails
certainly helps the network to focus on features unique to the fish body rather than to its
surrounding. 410
We demonstrate that the best results were obtained after applying two a posteriori decision rules on
raw outputs from the neural network trained with the most complete set of thumbnails. This model

Draft Version - Accepted in Elsevier Ecological Informatics the 3th
of September 2018
reached a success rate of 94.1% for the 18 species tested, with only 3 species being correctly
identified in less than 90% of cases. Therefore, training a neural network with thumbnails from 415
surrounding environment and thumbnails of part of each fish species is important to reach a high
correct identification rate in real-life cases. The class “Environment” adds versatility to the training
and hence helps the network to select features that are robust to the context around fish. Including
classes “part of species” allows the network to classify correctly individuals partially hidden by
other fish or corals. Such situations were common in the test dataset as illustrated by the fact that up 420
to 9% of individuals of Abudefduf vaigiensis were classified as “part of A. vaigensis” rather than
“whole A. vaigensis”.
The success rate of the best model is similar to that of the model of Siddiqui et al. (2016) which
reached a success rate of 94.3% on 16 species. This latter model was trained on a much smaller 425
training dataset of 1309 thumbnails than our model (> 900 000 thumbnails). However, Siddiqui’s
model was designed to identify fish on videos recorded in partially controlled conditions (i.e. fish
swimming close to a baited camera) while in our case we tested the ability of the model to identify
fish partially hidden by corals as well as shot in all positions and orientations. The few
misidentifications by our best model mostly occurred when only the face or back of fish was 430
visible. Such an issue could be easily circumvented in practice when analyzing videos because it is
likely that each fish will be seen from the side on at least one frame (out of the 25 frames recorded
per second by most cameras).
435
Figure 2: Samples of thumbnails recognized by the CNN model and not recognized by humans (a),
samples of thumbnails recognized by humans and not recognized by the CNN model (b) and sample
of thumbnails misidentified by both humans and the CNN model (c).
440

Draft Version - Accepted in Elsevier Ecological Informatics the 3th
of September 2018
Identification methods such as the ones presented here pave the way towards new ecological
applications. First, such methods can work continuously and their performance is constant through
time and hence reproducible, contrary to human experts who work discontinuously and are likely to
perform differently through time. Given the high rate of correct identifications, the best model could 445
be used to pre-process a massive number of thumbnails: up to 1 million thumbnails per day.
Furthermore, additional post processing procedures could be used. For example, under a certain
threshold (e.g. 98% certainty), human experts could be asked to check the thumbnails identified by
CNN models. Such a two-step workflow would ensure a very high identification rate while saving
time of experts in fish taxonomy who will not have to identify “obvious” fish that can be accuratly 450
identified by models. In addition, identification methods could also be used as a tool to initiate
citizen science programs, for example where divers upload images of fish and obtain the most likely
taxonomic identification from a CNN model. Therefore, the continued development of these
identification tools could potentially offer benefits for both professional scientists collecting
massive raw data from the field, and for citizens to improve their awareness and knowledge about 455
biodiversity (e.g. Bradley et al., 2017)
The method tested here is one step towards the identification of hundreds or thousands of fish
species that occur on coral reefs (Kulbicki et al., 2013). Since the performance of CNNs is known to
increase with the number of classes (i.e. the 1000 classes of ImageNet) (Krizhevsky et al., 2012), 460
there is no theoretical limit to such upscaling, the main challenge being to increase the size of the
training dataset and the computer power. However, the identification of rare species will remain
challenge given the difficulty to collect enough thumbnails of such species in different conditions to
train the model. Future work is also needed to broaden the range of conditions where the model is
efficient for most of species. In this paper, we considered only fixed videos recorded between 1m 465
and 25m for both our training and testing datasets. It would relevant to include deeper videos as
well as videos recorded with other protocols (e.g. baited remote underwater videos, transects).
Ultimately, the goal of automatic identification is not only to classify fish into species, but also to
localize and count them, and estimate their size (body length) on videos. The detection task in 470
underwater videos remains challenging as the context is particularly complex. Towards this aim,
including “environment” and “part of species” classes in the training of models will enhance the
accurate detection of fish inidividuals partially hidden behind corals or other fish, for instance using
a sliding windows approach over a video frame. We could also associate a classifier with a detector
(Weinstein et al., 2015, Price Tack et al, 2016). Such algorithms focus on the detection of objects of 475
interest (such as fish individuals) in images. Ultimately, deep-learning based methods could help
marine ecologists to develop new video-based protocols for a massive monitoring of increasingly
imperiled reef fish biodiversity, in the same way as next-generation sequencing of DNA has
revolutionized several research domains including biodiversity monitoring (Deiner et al., 2017). 480
Acknowledgement
We want to thank the CEMEB Label of Excellency of Montpellier for funding this work.
We want to thank the reviewers of our work for their insightful remarks which help us for this work. 485

Draft Version - Accepted in Elsevier Ecological Informatics the 3th
of September 2018
References
Alsmadi, M. K., Omar, K. B., Noah, S. A., & Almarashdeh, I. (2010). Fish recognition based on
robust features extraction from size and shape measurements using neural network. Journal of
Computer Science, 6(10), 1088. 490
Blanc, K., Lingrand, D., & Precioso, F. (2014, November). Fish species recognition from video
using SVM classifier. In Proceedings of the 3rd ACM International Workshop on Multimedia
Analysis for Ecological Data (pp. 1-6). ACM.
Bradley M. Norman, Jason A. Holmberg, Zaven Arzoumanian, Samantha D. Reynolds, Rory P.
Wilson, Dani Rob, Simon J. Pierce, Adrian C. Gleiss, Rafael de la Parra, Beatriz Galvan, Deni 495
Ramirez-Macias, David Robinson, Steve Fox, Rachel Graham, David Rowat, Matthew Potenski,
Marie Levine, Jennifer A. Mckinney, Eric Hoffmayer, Alistair D. M. Dove, Robert Hueter,
Alessandro Ponzo, Gonzalo Araujo, Elson Aca, David David, Richard Rees, Alan Duncan,
Christoph A. Rohner, Clare E. M. Prebble, Alex Hearn, David Acuna, Michael L. Berumen,
Abraham Vázquez, Jonathan Green, Steffen S. Bach, Jennifer V. Schmidt, Stephen J. Beatty, David 500
L. Morgan; Undersea Constellations: The Global Biology of an Endangered Marine Megavertebrate
Further Informed through Citizen Science, 2017/11/29, BioScience, bix127.
Brock, V. E. (1954). A preliminary report on a method of estimating reef fish populations. The
Journal of Wildlife Management, 18(3), 297-308.
Cappo, M., Harvey, E., Malcolm, H., & Speare, P. (2003). Potential of video techniques to monitor 505
diversity, abundance and size of fish in studies of marine protected areas. Aquatic Protected Areas-
what works best and how do we know, 455-464.
Chapman, C.J. & Atkinson, R.J.A. (1986). Fish behaviour in relation to divers. Prog Underw Sci,
11, l–14.
Cinner, J. E., Huchery, C., MacNeil, M. A., Graham, N. A., McClanahan, T. R., Maina, J., ... & 510
Allison, E. H. (2016). Bright spots among the world’s coral reefs. Nature, 535(7612), 416.
Cinner, J. E., Maire, E., Huchery, C., MacNeil, M. A., Graham, N. A., Mora, C., ... & D’Agata, S.
(2018). Gravity of human impacts mediates coral reef conservation gains. Proceedings of the
National Academy of Sciences, 201708001.
Deiner, K., Bik, H. M., Mächler, E., Seymour, M., Lacoursière‐Roussel, A., Altermatt, F., ... & 515
Pfrender, M. E. (2017). Environmental DNA metabarcoding: Transforming how we survey animal
and plant communities. Molecular ecology,26(21), 5872-5895.
Francour, P., Liret, C. & Harvey, E. (1999). Comparison of fish abundance estimates made by
remote underwater video and visual census. Naturalista sicil, 23, 155–168.
Froese, R., & Pauly, D. (Eds.). (2000). FishBase 2000: Concepts Designs and Data Sources(Vol. 520
1594). WorldFish
Graham, N. A., Chabanet, P., Evans, R. D., Jennings, S., Letourneur, Y., Aaron MacNeil, M., ... &
Wilson, S. K. (2011). Extinction vulnerability of coral reef fishes. Ecology Letters, 14(4), 341-348.
Halpern, B. S., Walbridge, S., Selkoe, K. A., Kappel, C. V., Micheli, F., D'agrosa, C., ... & Fujita, R.
(2008). A global map of human impact on marine ecosystems. Science, 319(5865), 948-952. 525
Harvey, E., Fletcher, D., Shortis, M. R., & Kendrick, G. A. (2004). A comparison of underwater
visual distance estimates made by scuba divers and a stereo-video system: implications for
underwater visual census of reef fish abundance. Marine and Freshwater Research, 55(6), 573-580.
Harvey, E.S., Cappo, M., Butler, J., Hall, N. & Kendrick, G. (2007). Bait attraction affects the
performance of remote underwater video stations in assessment of demersal fish community 530
structure. Mar. Ecol. Prog. Ser., 350, 245–254
Hughes, T. P., Barnes, M. L., Bellwood, D. R., Cinner, J. E., Cumming, G. S., Jackson, J. B., ... &
Palumbi, S. R. (2017). Coral reefs in the Anthropocene. Nature, 546(7656), 82.
Jackson, J. B., Kirby, M. X., Berger, W. H., Bjorndal, K. A., Botsford, L. W., Bourque, B. J., ... &
Hughes, T. P. (2001). Historical overfishing and the recent collapse of coastal ecosystems. Science, 535
293(5530), 629-637.

Draft Version - Accepted in Elsevier Ecological Informatics the 3th
of September 2018
Javed, O., & Shah, M. (2002, May). Tracking and object classification for automated surveillance.
In European Conference on Computer Vision (pp. 343-357). Springer, Berlin, Heidelberg.
Jia, Y., Shelhamer, E., Donahue, J., Karayev, S., Long, J., Girshick, R., ... & Darrell, T. (2014,
November). Caffe: Convolutional architecture for fast feature embedding. In Proceedings of the 540
22nd ACM international conference on Multimedia (pp. 675-678). ACM.
Joly, A., Goëau, H., Glotin, H., Spampinato, C., Bonnet, P., Vellinga, W. P., ... & Müller, H. (2016,
September). LifeCLEF 2016: multimedia life species identification challenges. In International
Conference of the Cross-Language Evaluation Forum for European Languages (pp. 286-310).
Springer International Publishing. 545
Krizhevsky, A., Sutskever, I., & Hinton, G. E. (2012). Imagenet classification with deep
convolutional neural networks. InAdvances in neural information processing systems (pp. 1097-
1105).
Krueck, N. C., Ahmadia, G. N., Possingham, H. P., Riginos, C., Treml, E. A., & Mumby, P. J.
(2017). Marine reserve targets to sustain and rebuild unregulated fisheries. PLoS biology, 15(1), 550
e2000537.
Kulbicki, M., Parravicini, V., Bellwood, D. R., Arias-Gonzàlez, E., Chabanet, P., Floeter, S. R., ... &
Mouillot, D. (2013). Global biogeography of reef fishes: a hierarchical quantitative delineation of
regions.PLoS One,8(12), e81847.
Langlois, T.J., Harvey, E.S., Fitzpatrick, B., Meeuwig, J., Shedrawi, G. & Watson, D. (2010). Cost-555
efficient sampling of fish assemblages: comparison of baited video sta=tions and diver video
transects. Aquat. Biol., 9, 155–168.
LeCun, Y., Bengio, Y., & Hinton, G. (2015). Deep learning. nature,521(7553), 436.
Levi, D. M. (2008). Crowding—An essential bottleneck for object recognition: A mini-review.
Vision research, 48(5), 635-654. 560
Li, X., Shang, M., Qin, H., & Chen, L. (2015, October). Fast accurate fish detection and
recognition of underwater images with fast r-cnn. In OCEANS'15 MTS/IEEE Washington (pp. 1-5).
IEEE.
Lowe, D. G. (1999). Object recognition from local scale-invariant features. In Computer vision,
1999. The proceedings of the seventh IEEE international conference on (Vol. 2, pp. 1150-1157). 565
Ieee.
Mallet, D., & Pelletier, D. (2014). Underwater video techniques for observing coastal marine
biodiversity: a review of sixty years of publications (1952–2012). Fisheries Research, 154, 44-62.
Matabos, M., Hoeberechts, M., Doya, C., Aguzzi, J., Nephin, J., Reimchen, T. E., ... &
Fernandez‐Arcaya, U. (2017). Expert, Crowd, Students or Algorithm: who holds the key to deep‐sea 570
imagery ‘big data’processing?.Methods in Ecology and Evolution.
Mouillot, D., Villéger, S., Parravicini, V., Kulbicki, M., Arias-González, J. E., Bender, M., ... &
Bellwood, D. R. (2014). Functional over-redundancy and high functional vulnerability in global fish
faunas on tropical reefs. Proceedings of the National Academy of Sciences, 111(38), 13757-13762.
Pandolfi, J. M., Bradbury, R. H., Sala, E., Hughes, T. P., Bjorndal, K. A., Cooke, R. G., & Warner, 575
R. R. (2003). Global trajectories of the long-term decline of coral reef ecosystems. Science,
301(5635), 955-958.
Pelletier, D., Leleu, K., Mou-Tham, G., Guillemot, N. & Chabanet, P. (1/2011). Comparison of
visual census and high definition video transects for monitoring coral reef fish assemblages. Fish.
Res., 107, 84–93. 580
Price Tack, J. L. et al. 2016. AnimalFinder: A semi-automated system for animal detection in time-
lapse camera trap images. - Ecol. Inform. 36: 145–151.
Robinson, J. P., Williams, I. D., Edwards, A. M., McPherson, J., Yeager, L., Vigliola, L., & Baum, J.
K. (2017). Fishing degrades size structure of coral reef fish communities. Global change biology,
23(3), 1009-1022. 585
Rogers, A., Blanchard, J. L., & Mumby, P. J. (2017). Fisheries productivity under progressive coral
reef degradation. Journal of Applied Ecology.
Sale, P. F., & Sharp, B. J. (1983). Correction for bias in visual transect censuses of coral reef fishes.

Draft Version - Accepted in Elsevier Ecological Informatics the 3th
of September 2018
Coral reefs, 2(1), 37-42.
Schmidhuber, J. (2015). Deep learning in neural networks: An overview.Neural networks,61, 85-590
117
Scott, A., & Dixson, D. L. (2016, May). Reef fishes can recognize bleached habitat during
settlement: sea anemone bleaching alters anemonefish host selection. In Proc. R. Soc. B (Vol. 283,
No. 1831, p. 20152694). The Royal Society
Shortis, M. R., Ravanbakhsh, M., Shafait, F., & Mian, A. (2016). Progress in the automated 595
identification, measurement, and counting of fish in underwater image sequences. Marine
Technology Society Journal, 50(1), 4-16.
Siddiqui, S. A., Salman, A., Malik, M. I., Shafait, F., Mian, A., Shortis, M. R., & Harvey, E. S.
(2017). Automatic fish species classification in underwater videos: exploiting pre-trained deep
neural network models to compensate for limited labelled data. ICES Journal of Marine Science, 600
fsx109.
Spampinato, C., Giordano, D., Di Salvo, R., Chen-Burger, Y. H. J., Fisher, R. B., & Nadarajan, G.
(2010, October). Automatic fish classification for underwater species behavior understanding. In
Proceedings of the first ACM international workshop on Analysis and retrieval of tracked events
and motion in imagery streams (pp. 45-50). ACM. 605
Srivastava, N., Hinton, G., Krizhevsky, A., Sutskever, I., & Salakhutdinov, R. (2014). Dropout: A
simple way to prevent neural networks from overfitting. The Journal of Machine Learning
Research, 15(1), 1929-1958.
Szegedy, C., Liu, W., Jia, Y., Sermanet, P., Reed, S., Anguelov, D. & Rabinovich, A. (2015). Going
deeper with convolutions. InProceedings of the IEEE conference on computer vision and pattern 610
recognition (pp. 1-9).
Taquet, M., & Diringer, A. (2007). Poissons de l'océan Indien et de la mer Rouge. Editions Quae.
Thresher, R. E., & Gunn, J. S. (1986). Comparative analysis of visual census techniques for highly
mobile, reef-associated piscivores (Carangidae). Environmental Biology of Fishes, 17(2), 93-116.
Villon, S., Chaumont, M., Subsol, G., Villéger, S., Claverie, T., & Mouillot, D. (2016, October). 615
Coral reef fish detection and recognition in underwater videos by supervised machine learning:
Comparison between Deep Learning and HOG+ SVM methods. In International Conference on
Advanced Concepts for Intelligent Vision Systems (pp. 160-171). Springer International Publishing.
Watson, D.L., Harvey, E.S., Anderson, M.J. & Kendrick, G.A. (12/2005). A comparison of
temperate reef fish assemblages recorded by three underwater stereo-video techniques. Mar. Biol., 620
148, 415–425
Watson, D.L. & Harvey, E.S. (2007). Behaviour of temperate and sub-tropical reef fishes towards a
stationary SCUBA diver. Mar. Freshw. Behav. Physiol., 40, 85–103
Weinstein, B. G. 2015. MotionMeerkat: Integrating motion video detection and ecological
monitoring (S Dray, Ed.). - Methods Ecol. Evol. 6: 357–362. 625
Willis, T. J., & Babcock, R. C. (2000). A baited underwater video system for the determination of
relative density of carnivorous reef fish. Marine and Freshwater research, 51(8), 755-763.
Willis, T. J. (2001). Visual census methods underestimate density and diversity of cryptic reef
fishes. Journal of Fish Biology, 59(5), 1408-1411.
630
https://github.com/NVIDIA/DIGITS/blob/master/digits/standard-networks/caffe/googlenet.prototxt
2018
635
640

Draft Version - Accepted in Elsevier Ecological Informatics the 3th
of September 2018
SUPPLEMENTARY TABLES
Table S1. Raw fish thumbnails training dataset
645
Classes Number of thumbnails
Abudefduf sparoides 1241
Abudefduf vaigiensis 5674
Chaetodon trifascialis 1456
Chromis weberi 3576
Dascyllus carneus 2276
Lutjanus kasmira 1652
Monotaxis grandoculis 1239
Myripristis botche 1264
Naso elegans 2068
Mulloidichtys vanicolensis 1264
Naso vlamingii 1789
Nemateleotris magnifica 1189
Odonus niger 2986
Plectroglyphidodon lacrymatus 652
Pomacentrus sulfureus 5176
Preocaesio tile 3088
Pygoplytes diacanthus 1106
Thalassoma hardwicke 1579
Zanclus cornutus 1886
Zebrasoma scopas 1835

Table S2. The four thumbnails datasets used to train the four models, with for each the number of
thumbnails per class in the training datasets, with class “environment” gathering thumbnails of 650
water and substrate (sand, corals) while “Part of fish” gathers all thumbnails of half of a fish
individual and the "part of species" classes contain thumbnails of half of individuals for each
species.
655
Species Only whole fish
(T1)
Whole fish + “Part of
fish” (T2)
Whole fish + Environment +
“Part of fish” (T3)
Whole fish + environment + “Part of
species” (T4)
Abudefduf sparoides 2482 2482 2482 2482 Abudefduf vaigiensis 11328 11328 11328 11328
Chaetodon trifascialis 2912 2912 2912 2912 Chromis weberi 7152 7152 7152 7152
Dascyllus carneus 4552 4552 4552 4552 Lutjanus kasmira 3300 3300 3300 3300
Monotaxis grandoculis 2478 2478 2478 2478 Mulloidichtys
vanicolensis
2528 2528 2528 2528
Myripristis botche 2528 2528 2528 2528 Naso elegans 4138 4138 4138 4138
Naso vlamingii 3578 3578 3578 3578 Nemateleotris magnifica 2378 2378 2378 2378
Odonus niger 5972 5972 5972 5972 Plectroglyphidodon
lacrymatus
1304 1304 1304 1304
Pomacentrus sulfureus 10352 10352 10352 10352 Preocaesio tile 6176 6176 6176 6176
Pygoplytes diacanthus 2212 2212 2212 2212 Thalassoma hardwicke 3158 3158 3158 3158
Zanclus cornutus 3772 3772 3772 3772 Zebrasoma scopas 3670 3670 3670 3670
Part of
Abudefduf sparoides
4964
Part of
Abudefduf vaigiensis
22656
Part of
Chaetodon trifascialis
5824
Part of
Naso elegans
14304
Part of
Pomacentrus sulfureus
20704
Part of
Lutjanus kasmira
6600
Part of
Pygoplites diacanthus
4424
Part of
Thalassoma hardwicke
6316
Part of
Zanclus cornutus
7544
Part of
Zebrasoma scopas
7340
Part of
Chromis weberi
14034
Part of
Monotaxis grandoculis
4956
Part of
Plectroglyphidodon
lacrymatus
1304
Part of
Dascyllus carneus
9097
Part of
Myripristis botche
5056
Part of
Naso vlamingii
7156
Part of
Nemateleotris magnifica
4744
Part of
Odonus niger
11944
Part of
Pterocaesio tile
12352
Part of
Mulloidichtys
vanicolensis
7528
Part of Fish
521555 521555
Environment 862174 862174

Table S3: Number of thumbnails of each fish species present in test datasets used in this study
660
Class Dataset for testing models
performance
Dataset for testing model
performance vs human
performance
Abudefduf sparoides 103 88
Abudefduf vaigiensis 59 47
Chaetodon trifascialis 208 146
Chromis weberi 269
Dascyllus carneus 269
Monotaxis grandoculis 72
Myripristis botche 20
Naso elegans 189 165
Naso vlamingii 358
Nemateleotris magnifica 246
Odonus niger 176
Plectroglyphidodon lacrymatus 150
Pomacentrus sulfureus 1567 443
Pterocaesio tile 215
Pygoplytes diacanthus 39 35
Thalassoma hardwicke 111 73
Zanclus cornutus 64 53
Zebrasoma scopas 184 144
Total 4405 1197
Table S4. Performance of CNN model trained with T4 thumbnails set to identify nine fish species
with no post processing; species are identified in columns and rows refer to whole fish and parts of
fish present in the training dataset.
Part of species X means that some individual were recognized as part of a fish species. 665
Only percentages of over 1% are shown.
Species A.sparo
ides
A.vaigiensis C.trifascialis N.elegans P.sulfureus P.diacanthus T.hardwicke Z.cornutus Z.scopas
A. sparoides 82.8
A .vaigiensis 1.1 80.0
C. trifascialis 85.1
C. weberi 1.1
N. elegans 95.1 3.9
P. sulfureus 73.8 2.6
P. diacanthus 86.8
T. hardwicke 87.3
Z. cornutus 89.0
Z. scopas 92.7
Part of A.
sparoides
6.0
Part of A.
vaigiensis
1.0 9.1
Part of C.
trifascialis
2.6
Part of N. elegans 1.6
Part of P.
sulfureus
1.1 4.3
Part of P.
diacanthus
Part of T.
hardwicke
2.6
Part of Z. cornutus
6.2
Part of Z. scopas
Environment 8.0 10.9 9.5 2.2 20.9 7.9 9.2 4.6 2.8

Table S5. Performance of our final CNN model to identify 9 fish species.
Raw model output was post-processed with following decision rule: outputs “ part of species X” 670
and “species X” are considered the same (i.e., the results of A. sparoides and part of A. sparoides
are added together); species are in columns with rows indicating the percentage of good
identification for each species and only values over 1% are shown.
675
Species A.
sparoides
A.
vaigiensis
C.
trifascialis
N.elegans P.sulfureus P.diacanthus T.hardwicke Z.cornutus Z.scopas
A. sparoides 89.0
A. vaigiensis 2.1 89.1
C.
trifascialis
97.7
C. weberi 1.1
D. caruleus 3.9
N. elegans 95.7
P. sulfureus 3.1 78.1 2.6
P. diacanthus 86.8
T. hardwicke 89.4
Z.cornutus 95.2
Z. scopas 92.7
Environment 8.0 10.9 9.5 2.1 20.9 7.9 9.2 4.6 2.8
SUPPLEMENTARY FIGURES
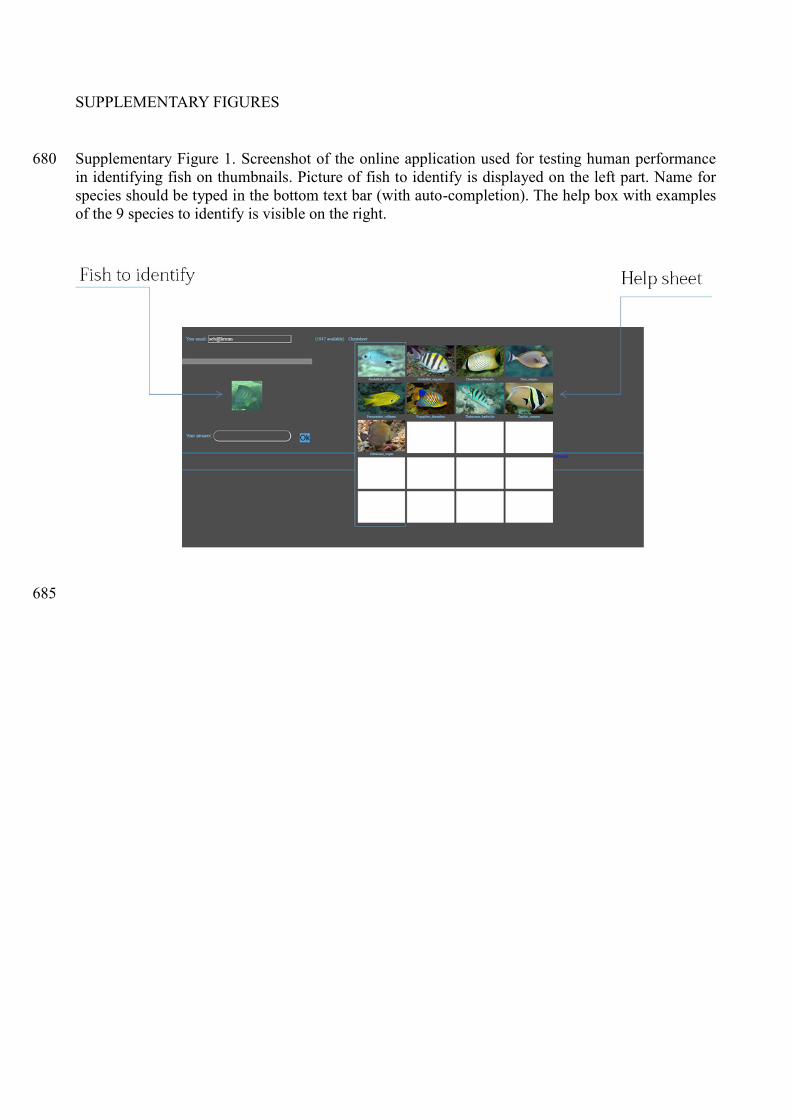
Supplementary Figure 1. Screenshot of the online application used for testing human performance 680
in identifying fish on thumbnails. Picture of fish to identify is displayed on the left part. Name for
species should be typed in the bottom text bar (with auto-completion). The help box with examples
of the 9 species to identify is visible on the right.
685