Embed Size (px)
Citation preview

Revista Brasileira de Computação Aplicada, July, 2020
DOI: 10.5335/rbca.v12i2.10866Vol. 12, No 2, pp. 54–66Homepage: seer.upf.br/index.php/rbca/index
O R I G I N A L P A P E R
A data mining approach for prediction of quality attributes inPalmer mango from images
Daniele Silva Reis ,1, Rosalvo Ferreira de Oliveira Neto ,1, Josenara Daianede Souza Costa ,3, Acácio Figueiredo Neto ,1, Marylia de Sousa Costa ,2
1Federal University of São Francisco Valley, 2Federal University of Campina Grande, 3Federal Institute of Piauí*[email protected]; [email protected]; [email protected]; [email protected];[email protected]
Received: 2020-04-17. Revised: 2020-06-09. Accepted: 2020-06-30.
AbstractThe monitoring of quality attributes such as, total soluble solids (TSS), mass, acidity and firmness are essential fora better postharvest conservation of mango. This work proposes a non destructive approach for prediction of thosequality attributes using digital images. The proposed approach is composed by three stages: 1) specification of thesampling parameters of mango, 2) identification of digital images pre-processing techniques and 3) utilization ofthe Random Forest technique as estimator of the quality attributes. In order to validate the proposed approach, astudy comparing its performance with models found in literature was carried out. The study used two metricsof performance evaluation: the correlation coefficient (R) and the root mean square error (RMSE). In order tocompare the differences of performance between the proposed approach and approaches found in literature, apaired t-student’s hypothesis test was carried out. Results show that the proposed approach has a superiorperformance regarding the existing ones, with confidence level of 95%.Keywords: Image processing, Non-destructive methods, Random forest, RegressionResumoO monitoramento de atributos de qualidade tais como sólidos solúveis totais (SST), massa, acidez e firmezasão essenciais para uma melhor conservação pós-colheita da manga. Este trabalho propõe uma abordagemnão-destrutiva para predição desses atributos de qualidade usando imagens digitais. A abordagem proposta écomposta de três etapas: 1) especificação dos parâmetros de amostragem da manga, 2) identificação de técnicasde processamento digital de imagens e 3) utilização da técnica Random Forest como estimador dos atributosde qualidades. Para validar a abordagem proposta, foi feito um estudo comparativo entre sua performance emodelos encontrados na literatura. O estudo empregou duas métricas de avaliação de performance: o coeficientede correlação (R) e a raiz do erro quadrático médio (RMSE). De forma a comparar a diferença de performance entrea abordagem proposta e as encontradas na literatura, foi realizado um teste t de Student pareado. Os resultadosmostram que a abordagem proposta teve uma performance superior quando comparada às demais, com um nívelde confiança a 95%.Palavras-Chave: Métodos não-destrutivos; Processamento de imagens; Random Forest; Regressão
1 Introduction
Mango was classified as the most produced tropicalfruit in 2017, responding for more than half of the world
production of tropical fruits in that year (Altendorf,2019). On the next year it was among the four moreexported fruits in the world, with huge demand in thetwo more importing markets, the United States and the

Reis et al. | Revista Brasileira de Computação Aplicada (2020), v.12, n.2, pp.54–66 55
European Union, supported by the flavor and consumerpreference when compared with more common fruits,such as banana and ananas (FAO, 2018). In Brazilthe exports reached 179.7 thousand tons in 2017 (FAO,2019), being in first place on the world ranking, mainlydue to the capacity of perennially producing mango(Altendorf, 2019).Production of mango is an activity of largeexpression in the Brazilian fruit growing scene. Thegreater planted area of mango in Brazil is in the regionof the “Vale do São Francisco” and the advancementof the production and exportation resulted in theexpansion of this area, going from 27.17 ha in 2017to 30.30 ha in 2018 (HFBRASIL, 2018). Among thevarieties cultivated in the country, the plantation ofmango without fiber such as the ‘Palmer’, ‘Keitt’ and‘Kent’, mainly destined for the European block wasgreater regarding ‘Tommy Atkins’ (HFBRASIL, 2019),a scene confirmed in the region of the Valley where‘Palmer’ is gaining space, due to new plantations and,also, of the over-grafting in plantation of the variety‘Tommy Atkins’ (Trindade et al., 2015).Having the external market as one of the mainconsumers of Brazilian mango and at the same timebeing it a demanding and competitive market, there isa need of doing studies about the maturation process,in order to reach a quality level acceptable for theconsumer and a better post-harvest conservation ofthe mango (Cardoso-Almeida et al., 2017). Traditionaland more used methods in the determination ofthe maturity and quality of the fruits are basedin destructive processes. Thus, the developmentand study of alternative techniques allowing thedetermination of quality attributes, in a precise andnon-invasive way, is of extreme importance (Goulartet al., 2013), making the quality evaluation of thefruits faster, more economical and consistent (Donis-González et al., 2013).The potential of non-destructive techniques such astools for evaluation and classification of fruits is beingthe target of different studies. Modalities of imageswere investigated for the quality evaluation, fromimages of the near infrared (NIR) to multi and hyper-spectral images, images of reflection of structuredillumination, visible images based on monochromelight or black/white to images in color or RGB (red,green and blue) (Li et al., 2015). With the analysisand processing of digital images it is possible toevaluate the change of coloration of the fruits in anobjective, integral and representative way, as well asto correlate with the physical-chemical attributes ofthe pulp (Nagle et al., 2016).This paper aims to solve the following researchquestion: “How to preview the quality attributes ofPalmer mango?”. The problem of estimating qualityattributes of a mango from an image is a regressionproblem, since the target variables TSS, Mass, Firmnessand Acidity are continuous. Thus, this work proposesa data mining solution in order to solve this problem.The remaining of this paper is organized asfollows. Section 2 presents the related works.Section 3 describes the stages of sample collection,
image acquisition and obtention of reference values.Section 4 presents the experimental results and theirinterpretation. Finally, Section 5 concludes this paperand proposes future works.
2 Related WorksStudies with mango from different cultivars usingimage are being developed, however, differencesbetween them and also in the cultivation environmentmay affect the performance and consistence ofmaturation indexes, not existing a unanimity orstandardization regarding the extracted variables andestimated quality attributes, as summarized in Table 1.
Yahaya et al. (2015) determined attributes totalsoluble solids, titratable acidity and firmness in mangoSala, extracting the mean values in the RGB space andusing as inference technique the MLR (Multiple LinearRegression) (James et al., 2013), obtaining correlationcoefficients of 0.814, 0.913 and 0.875, respectively.In studies with mango of variety Carabao, (Abarraet al., 2018) determined the attributes titratable acidity,total sugars, total starch, firmness, TSS and total ofreduced sugar, without using image pre-processing.The extracted variables consisted in the mean values ofthe intensity of pixels in RGB, HSV and L*a*b* spaces,being used as input in models of linear regressionfor each quality attribute. The best achieved resultswere for titratable acidity and firmness, when using L*channel only, obtaining correlation coefficients equalto 0.977 and 0.968, respectively. (Khairunniza-Bejoand Kamarudin, 2011) determined TSS in Chokananmango by the HSB color space, without using pre-processing. Each channel was used as an input ina linear regression, in order to determine the mostadequate one. The best result was obtained for hue,with R equal to 0.92. For determination of the massin mango of Chokanan variety (Teoh and Syaifudin,2007), 100 mature and green samples were used, whoseimages were pre-processed by the median filter andsegmentation. The extracted variable was the numberof pixels corresponding to the mango, being used asinput in a linear regression. The obtained value for thecorrelation coefficient was 0.9769.It is possible to perceive that there is no consensusabout the choice of techniques of image pre-processingand input variables, which may depend upon theanalyzed variety and nature of the problem. Thisreinforces that for every variety the studies may resultin a differentiated model, with not being found inliterature related works to the ‘Palmer’ variety, whichhas a highlight in the international scene.
3 Material and MethodsOn the next subsection the stages of sample collection,image acquisition and obtention of reference valuesare described, needed for the process of knowledgediscovery.

56 Reis et al. | Revista Brasileira de Computação Aplicada (2020), v.12, n.2, pp.54–66
Table 1: Developed works with image variables extraction for different varieties of mango.Authors Outputvariable Variety RGBmean
Meandifferencesand RGBgradientR/G,R/B eS/H
HSVmean DominantHSV color L*a*b*mean Numberof pixels Fractalvariables DiameterTeoh andSyaifudin(2007) Mass Chokanan X
Khairunniza-Bejo andKamarudin(2011)TSS Chokanan X
Zheng and Lu(2012) Browningdegree Sannianmang X XNandi et al.(2014) Maturity
Kumrapali,Amrapali,Sori, Langra,HimsagarX X
Vélez-Riveraet al. (2014) Maturity Manila X XPandey et al.(2014) Size anddisease
Totapuri,Badami eNeelam X X X
Yahaya et al.(2015)TSS,titratableacidityandfirmness
Sala X
Salunkhe andPatil (2015) Maturity Alphonso X X XYossy et al.(2017) Maturity Gincu X
Abarra et al.(2018)TSS,titrableacidityandfirmness
Carabao X X X

Reis et al. | Revista Brasileira de Computação Aplicada (2020), v.12, n.2, pp.54–66 57
Figure 1: System of image acquisition.
3.1 Samples
Mango cv. ‘Palmer’ manually collected in acommercial orchard of the “Fazenda Special FruitImportação e Exportação Ltda.”, located in the city ofPetrolina–Pernambuco were used, region of climatetype BSwh (semiarid, type steppe, very hot, withraining season in summer), according to Koppen’sclassification, located in 9º18’13,5”S and 40º40’04,7”O,with approximate altitude of 380 m.The Farm has 114 hectares planted with mango‘Palmer’. The batch being studied has 3.47 ha, withspacing of culture of 6 X 4 m and the system ofirrigation with micro-aspersion is used, with dailywatering shift and blade adjusted along the cycle. Themango plants received all cultural treatments accordingto the demands of the culture.Thirty plants were selected, distributed in five rowsof plantation from a batch of the orchard. A total of 750fruits were collected, in different stages: 35, 50, 65, 80,95, 110, 125, 140, 165 and 180 days after flowering (DAF),point of commercial harvest adopted by the Farm.
3.2 Image acquisition
The system of acquisition of reflectance images wasconstituted by the photo camera Canon T5i, box withinterior matte black, adjustable power source and acontrol box for LED lightning, shown in Fig. 1. Theillumination system consisted in 3 Solderless LEDsXPE2 of 3W from CREE, cold white 5000K to 8300K,disposed in an angular distance of 120º between them.For the process of image acquisition one imagewas obtained for each side of each fruit (consideringthe resting position), by means of camera adjustedwith manual focus, ISO-100; exposition time 1/2s;F/5.6; focal distance of 48mm. The process ofimage acquisition was made in partnership with theLaboratory of Energy in Agriculture (LENA) from theFederal University of the Valley of São Francisco.
3.3 Obtention of reference values
Before doing the chemical analysis, the fruits werewashed in running water, one by one, and immersedin solution of 150mg of chlorine per liter of waterduring 15 minutes, with posterior rinsing for removalof the excess of chlorine and drying in environmentaltemperature. Then, the mass of the fruits wasdetermined with the help of a semi-analytical scalewith precision of 0.01 g.Fruit firmness was determined with the help ofdigital penetrometer model PTR 300, with tip of 6 mmof diameter. One reading by fruit was made, in theequatorial portion, and the result expressed in Newtons(N). The Total Soluble Solids (TSS) were determined,destructively, with the filtered centrifuged pulp, usinga digital refractometer (Hanna – HI 96804), resultsbeing expressed in ºBrix. Finally, the titratable aciditywas determined by titration with sodium hydroxidesolution (0.1 M NaOH) with 1% of phenolphthalein asindicator, also according to the methodology of AOAC(1997).
3.4 Proposed approach
This section describes the approach proposed for thesolution of the problem of previewing the qualityattributes of mango Palmer. Since it is a solution ofdata mining, it will be described according to the stagesof the process of knowledge discovery KDD (Fayyad andStolorz, 1997).3.4.1 SelectionThis stage, also known as data sampling, is the processthat defines what data will be used for building thesolution. Data must represent all diversity of thepopulation of interest. Because of that, this solutionproposes to do the capture of the images of mangoin each stage of maturation, more specifically, it isproposed that the sample has images of mango with35, 50, 65, 80, 95, 110, 125, 140, 165 and 180 days afterflowering.3.4.2 Pre-processing
The stage of pre-processing the data is responsibleby cleaning the data, in order to eliminate noiseand irrelevant information existing in the capturedimages. For that, the solution used the followingsequence of techniques of digital image processing:1) Median filtering, in order to remove stain containedin the images, 2) Otsu’s algorithm to remove theimage background, 3) Opening operation to restoresmall pixels from the image that were removedby previous operations, 4) Simple thresholding forcomplete removal of the remaining shadows and 5)Closing Morphologic operation for filling contoursremoved by the previous stage. Fig. 2 illustrates theeffect of each technique during the pre-processingstage.

58 Reis et al. | Revista Brasileira de Computação Aplicada (2020), v.12, n.2, pp.54–66
Figure 2: Pre-processing stages of images.
Reis et al. | Revista Brasileira de Computação Aplicada (2020), v.12, n.2, pp.54–66 59
3.4.3 TransformationAccording to Pyle (1999), besides the data cleaning,another goal of the pre-processing stage is to transformthe data in a format that allows the application ofan data mining algorithm. According to (Krogel,2005), normally this task represents the process ofFeature Construction. This process was responsibleby building variables from the original data base. Forthis problem, each digital image was transformed in avector containing variables with information about themango. The construction of new input variables is asystematic way of embedding knowledge of the domainin a KDD project. According to Neto et al. (2017), thetask of building new variables is much more dependenton the knowledge of the domain than the constructionof an estimator. Because of that, domain knowledge isa requirement. Existing approaches use only a small setof input variables as can be seen in the literature review.This approach proposes to enlarge the space of inputvariables. The strategy of amplification of the samplespace of the vector of input variables in order to reach agreater discriminating power is even more common inareas such as Image and Sound Recognition, as can beseen in Gao et al. (2008). The best performing solutionsin international competitions used this strategy, as canbe seen in Adeodato et al. (2008). From the literaturereview made, the proposed approach indicates theconstruction of the following input variables:• Mean of intensity of pixels in spaces RGB, HSV,L*a*b* (Abarra et al., 2018)• Dominant HSV color (Yossy et al., 2017)• Mean of RGB intensities in the whole mango, inregions apex, equator and summit, difference ofmeans and longitudinal gradient (Nandi et al., 2014)• Number of pixels corresponding to the mango (Teohand Syaifudin, 2007)• Mean of intensity of pixels in space RGB (Yahayaet al., 2015)• Mean of intensity of pixels in space L*a*b* andfractal variables (box counting dimension, dilationdimension and correlation dimension) (Zheng andLu, 2012)• Mean of intensity of pixels in space HSV(Khairunniza-Bejo and Kamarudin, 2011)• Mean of intensity of pixels in spaces HSV and L*a*b*Vélez-Rivera et al. (2014)• Mean of intensity of pixels in space RGB and HSV andrates R/G, R/B and S/H (Salunkhe and Patil, 2015)• Mean of intensity of pixels in channel b*, numberof pixels and diameter (Pandey et al., 2014)3.4.4 Data miningThere is a huge variety of data mining techniques.Ngai et al. (2009) indicate in literature more than 30methods frequently used in scientific papers. Becauseof that, the identification of a proper technique forthe problem of previewing the quality attributes of amango from an image is a relevant contribution.The solution proposed in this paper suggests theuse of the Random Forest technique as estimator. Thistechnique is based in decision tree, which is one of
the most used classifying models in literature due tothe easiness of understanding its response, which isorganized as a tree and from that one it is possibleto easily extract rules of type “If-Then” (Polat andGunes, 2007). A decision tree uses the strategy ofdivide and conquer. A problem is decomposed in sub-problems and recursively the same strategy is used foreach sub-problem. The simplicity of the decision treealso brings disadvantages. The main one of them is theinstability caused by noise on the data (Hastie et al.,2009). The Random Forest technique improves stabilityand precision of the decision tree by incorporating alarge number of trees in a single estimator (Breiman,2001). Random Forest is an ensemble of decision trees,in which the variables that will be used in each tree arerandomly selected. The strategy of ensemble used byRandom Forest is Bagging. Bagging is an acronym forbootstrap aggregating. Its main idea is to build severalindividual estimators from a bootstrap sample (samplewith replacement of the same size of the training set,in which each example has the same chance of beingchosen). The objective is to reduce the variance errorof the final estimator, calculating the response as themean between the estimators of each tree.3.4.5 EvaluationThis stage includes the validation of the mined contentby means of metrics of performance evaluation. Toachieve this, the k-fold cross validation method wasused, as it is a widely accepted way to split a singlesample (Jain et al. (2000)) in k statistically independenttest sets, allowing the construction of confidenceintervals for the evaluation metric, as recommendedby traditional authors Witten and Frank (2005).
The metrics selected in this study were thecorrelation coefficient and the root mean squareerror (RMSE). Those indicators measure, respectively,the degree of dependence between input and outputvariables and the mean magnitude of the estimatederrors, according to the following equations:
R =∑ni=1(xi – x)(yi – y)√∑n
i=1(xi – x)2√∑ni=1(yi – y)2 (1)
RMSE =√√√√ 1n
n∑i=1
(yi – yi)2 (2)
Where xi is the value of the input variable, x is themean of values of x, yi is the real value of the outputvariable, y is the mean of y values, n is the number ofsamples and yi i is the predicted value for the outputvariable.3.5 Reference approaches
In order to verify the efficiency of the proposedapproach, the achieved results were compared to the

60 Reis et al. | Revista Brasileira de Computação Aplicada (2020), v.12, n.2, pp.54–66
Table 2: Quality attributes, input variables and inference techniques used in literature.Quality attribute Input variables Inference technique AuthorsMass Number of pixels Linear regression Teoh and Syaifudin (2007)TSS Hue mean value Linear regression Khairunniza-Bejo and Kamarudin (2011)Firmness L* mean value Linear regression Abarra et al. (2018)Titratable acidity L* mean value Linear regression Abarra et al. (2018)
best results found in the literature review made in thisstudy. Since a unique reference model was not foundto estimate all quality attributes, the best models foreach attribute were selected, as specified in Table 2.3.6 Statistical analysis
In order to compare the performance of the twoapproaches a Student’s paired t-test was used(Montgomery and Runger (2010)). In this work twohypothesis tests were made: (1) using the differenceof the mean value of RMSE (2) using the difference ofthe mean value of R. Those metrics were obtained foreach one of the 5 folds. The configurations of the testsapplied were:Test I• Null Hypothesis: µ1 = µ2• Alternative Hypothesis : µ1 < µ2
In which:• µ1 represents the RMSE mean for the 5 folds of theproposed approach;• µ2 represents the RMSE mean for the 5 folds of theliterature approach
Test II• Null Hypothesis: µ1 = µ2• Alternative Hypothesis : µ1 > µ2
In which:• µ1 represents the R mean for the 5 folds of theproposed approach;• µ2 represents the R mean for the 5 folds of theliterature approach
In Fig. 3, the stages for solving the problem ofprediction of the quality attributes in mango of varietyPalmer are shown.
4 Results and discussionThe descriptive statistics obtained from referenceanalysis of mass, total soluble solids, titratable acidityand firmness are shown in Table 3. A large variabilityon data is perceived, insuring a greater robustness tothe built models, which made predictions for ‘Palmer‘mango in different stages of maturation.In Figs. 4 to 7 the metrics obtained by fold forattributes mass, TSS, firmness and titratable acidityare shown. It is noted that by means of the proposedapproach it was possible to achieve more precise modelsfor all quality attributes. The proposed models achieved
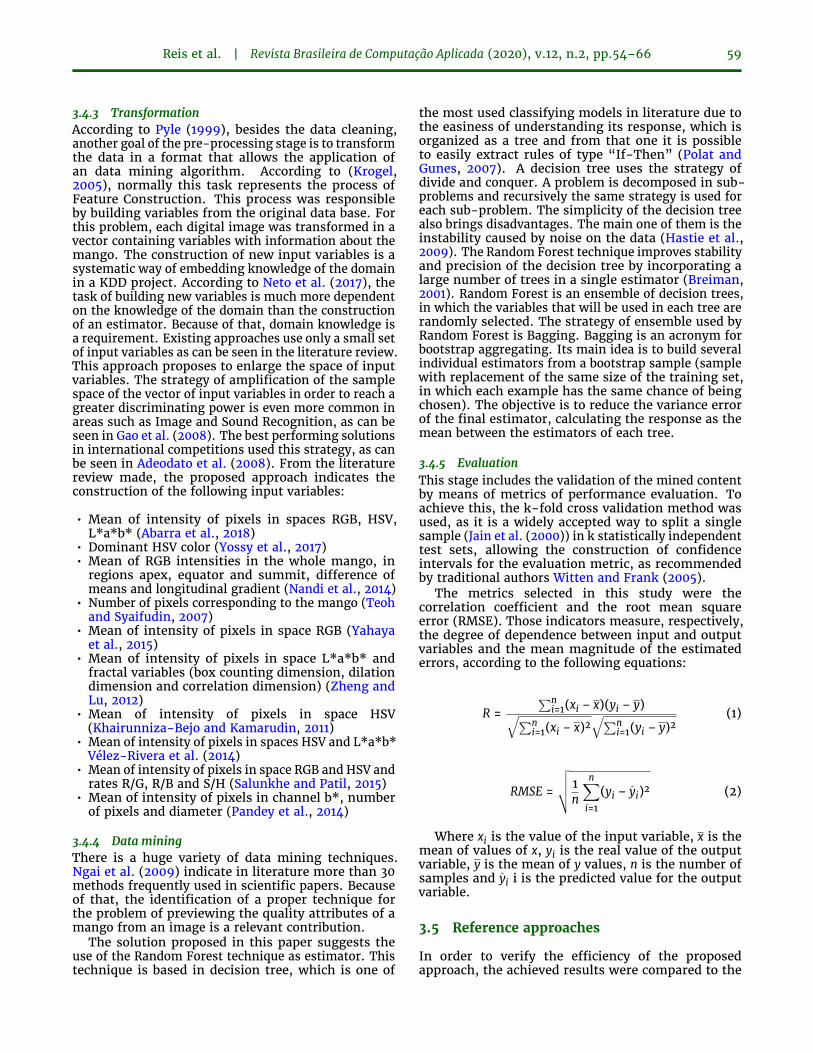
greater values of R for all folds of the four attributes.The RMSE values for the proposed approach weresmaller for all folds except for the second one in thetitrable acidity.For the mass attribute, the proposed approach andthe literature model had a slight difference in bothmetrics considering the amplitude of the real values asdisplayed in Table 3. Although the proposed model bythe authors Khairunniza-Bejo and Kamarudin (2011)delivered good results with one size based variable, it’snoticeable that the addition of color and texture basedvariables improved the results.As for the TSS, firmness and titrable acidity results,it’s clear that the literature models weren’t able tocapture the variability of the attributes. By using alinear model with only one color based variable, theauthors Teoh and Syaifudin (2007) and Abarra et al.(2018) may have achieved good results for their studiedvarieties, but for the ’Palmer’ mango the model hadpoor results, such as correlation coefficients close to 0.In Table 4, the results of the hypothesis test forthe problem of estimating the quality attributes mass,TSS, firmness and titratable acidity are displayed. Formass, the obtained metrics by means of the proposedapproach were better than the ones in literature, withmean values of RMSE and R equal to 16.483 and0.992, respectively, while by means of literature thevalues 29.847 and 0.975 were achieved. For the otherattributes the proposed approach was also superior, butwith differences in metrics being more discrepant. ForTSS, the means of RMSE were 0.907 vs 4.479 and forcorrelation coefficient 0.979 vs 0.045. For titratableacidity, the means of error were 0.256 and 0.589 andthe means of the correlation coefficient were 0.908 vs0.388. As all p-values were under 0.05 it is proved thatthe proposed approach was superior in the predictionof mass, TSS, firmness and titratable acidity in mangoof ‘Palmer’ variety with a confidence level at 95%.By means of the scatter plots of Figs. 8 to 11, itis visually proved the superiority of the proposedapproach regarding literature, as there is a betteradjustment to the line.The plots for the TSS, firmness and titarable acidityliterature models had poor adjustments as it wasexpected considering the obtained metrics by fold. Themass literature model provided better results for the’Palmer’ mango than the other three literature models,but it is still inferior to the proposed approach. With thecombination of size, color and texture based variablesand a non-linear estimator it was possible to correlatethe input variables to the quality attributes with higheraccuracy.

Reis et al. | Revista Brasileira de Computação Aplicada (2020), v.12, n.2, pp.54–66 61
Figure 3: Applied stages for problem solution.Table 3: Descriptive statistics of real values of mass, solids, total soluble solids, titratable acidity and firmness.
Attributes Samples Mean Min Max Amp SD VarMass 750 436,51 26,7 757,35 730,65 136,22 18557,30TSS 750 9,83 3,8 19,7 15,9 4,49 20,24Firmness 750 74,048 2,95 181,4 178,45 60,80 3697,50Titratable acidity 750 0,69 0,03 9,97 9,93 0,64 0,42
Figure 4: Obtained metrics in the prediction of mass in ‘Palmer’ mango (R to the left and RMSE to the right).

62 Reis et al. | Revista Brasileira de Computação Aplicada (2020), v.12, n.2, pp.54–66
Figure 5: Obtained metrics in the prediction of TSS in ‘Palmer’ mango (R to the left and RMSE to the right).
Figure 6: Obtained metrics in the prediction of firmness in ‘Palmer’ mango (R to the left and RMSE to the right).
Figure 7: Obtained metrics in the prediction of titrable acidity in ‘Palmer’ mango (R to the left and RMSE to theright).

Reis et al. | Revista Brasileira de Computação Aplicada (2020), v.12, n.2, pp.54–66 63
Table 4: Hypothesis tests summary.Attribute Metric µ1 µ2 µ1 – µ2 p-value
Mass RMSE 16.483 29.847 -13.364 0.000256R 0.992 0.975 0.017 0.0001953TSS RMSE 0.907 4.479 -3.572 1.449 ∗ 10–6
R 0.979 0.089 0.890 1.693 ∗ 10–6Firmness RMSE 16.065 60.820 -44.754 5.515 ∗ 10–7
R 0.964 0.045 0.919 1.555 ∗ 10–7Titrable acidity RMSE 0.256 0.589 -0.334 0.01831R 0.908 0.388 0.520 0.0004158
Figure 8: Scatter plots for mass in Palmer mangoes (Literature model to the left and Proposed model to theright).
Figure 9: Scatter plots for TSS in Palmer mangoes (Literature model to the left and Proposed model to the right).
64 Reis et al. | Revista Brasileira de Computação Aplicada (2020), v.12, n.2, pp.54–66
Figure 10: Scatter plots for firmness in Palmer mangoes (Literature model to the left and Proposed model to theright).
Figure 11: Scatter plots for titrable acidity in Palmer mangoes (Literature model to the left and Proposed model tothe right).
Reis et al. | Revista Brasileira de Computação Aplicada (2020), v.12, n.2, pp.54–66 65
5 ConclusionThe use of digital images for prediction of total solublesolids, acidity, mass and firmness associated to theproposed approach overcame the methods found inliterature in a statistically significant way. Besides,the proposed approach provides a non-destructiveevaluation of the quality attributes of the mango ofPalmer variety. The four characteristics of this workjustifying its superior performance regarding methodsfound in literature are: 1) sampling process allowing agreat variability for the different stages of maturation,ensuring a greater robustness to the built models; 2)precise specification of pre-processing techniques ofdigital images; 3) enlargement of the space of inputvariables for the estimator, by using 40 variablesidentified as significant ones and 4) use of the RandomForest technique as estimator. The models used asreference use linear regression and assume a linearrelationship between input variables and the qualityattribute. However, the relationships between thosevariables may not be linear, and Random Forest couldcapture this type of relationship with a great number ofinput variables. As a future work the authors suggestthat the proposed approach is evaluated in differentvarieties of mango.
ReferencesAbarra, M. S. J., Serrano, E. P., Sabularse, V. C.,Mendoza, H. E. T. and del Rosario, E. J. (2018).Determination of fruit ripeness degree of‘carabao’mango (mangifera indica l.) using digitalphotometry, Philippine Journal of Science 147(2): 249–253. Available at https://bityli.com/X642K.Adeodato, P. J. L., Vasconcelos, G. C., Arnaud, A. L.,Cunha, R. C. L. V., Monteiro, D. S. M. P. andNeto, R. F. O. (2008). The power of sampling andstacking for the pakdd2007 cross-selling problem,International Journal of Data Warehousing and Mining4: 22–31. https://doi.org/10.4018/jdwm.2008040104.
Altendorf, S. (2019). Major tropical fruits marketreview 2017. Available at http://www.fao.org/fileadmin/templates/est/COMM_MARKETS_MONITORING/Tropical_Fruits/Documents/CA2895EN.pdf.
AOAC (1997). Official methods of analysis of theAssociation of Official Analytical Chemists, Associationof Official Analytical Chemists, Arlington.
Breiman, L. (2001). Random forests, Machinelearning 45(1): 5–32. https://doi.org/10.1023/A:1010933404324.
Cardoso-Almeida, F. D. A., Figueiredo-Neto, A.,Lucena-Cavalcante, Í. H. et al. (2017). Physical andmechanical parameters correlated to the ripening ofmangoes (mangifera indica l.) cv.’tommy atkins’,Acta Agronómica 66(2): 186–192. http://dx.doi.org/10.15446/acag.v66n2.54757.
Donis-González, I. R., Guyer, D. E., Leiva-Valenzuela,G. A. and Burns, J. (2013). Assessment of chestnut(castanea spp.) slice quality using color images,Journal of Food Engineering 115(3): 407–414. https://doi.org/10.1016/j.jfoodeng.2012.09.017.
FAO (2018). Developments in bananas and majortropical fruits. Available at http://www.fao.org/fileadmin/templates/est/COMM_MARKETS_MONITORING/Tropical_Fruits/Documents/Developments_in_bananas_and_major_tropical_fruits.pdf.
FAO (2019). Major tropical fruits - statisticalcompendium 2017. Available at http://www.fao.org/fileadmin/templates/est/COMM_MARKETS_MONITORING/Tropical_Fruits/Documents/CA2909EN.pdf.
Fayyad, U. and Stolorz, P. (1997). Data mining and kdd:Promise and challenges, Future generation computersystems 13(2-3): 99–115. https://doi.org/10.1016/S0167-739X(97)00015-0.
Gao, X., Lu, W., Li, X. and Tao, D. (2008). Wavelet-based contourlet in quality evaluation of digitalimages, Neurocomput. 72(1-3): 378–385. https://doi.org/10.1016/j.neucom.2007.12.031.
Goulart, C., Loy, F. S., Galarça, S. P., Giovanaz, M. s.,Malgarim, M. B. and Fachinello, J. C. (2013). Evoluçãodo índice da e coloração da epiderme de mangasda cultivar tommy atkins, Revista Iberoamericana deTecnología Postcosecha 14: 8–13. Available at https://www.redalyc.org/articulo.oa?id=81327871003.
Hastie, T., Tibshirani, R. and Friedman, J. (2009). TheElements of Statistical Learning: Data Mining, Inference,and Prediction, Second Edition, Springer Series inStatistics, Springer.
HFBRASIL (2018). Anuário 2017-2018. Availableat https://www.hfbrasil.org.br/br/revista/acessar/completo/anuario-2017-2018.aspx.
HFBRASIL (2019). Anuário 2018-2019. Availableat https://www.hfbrasil.org.br/br/revista/acessar/completo/anuario-2018-2019.aspx.
Jain, A. K., Duin, R. P. W. and Mao, J. (2000). Statisticalpattern recognition: A review, IEEE Transactions onpattern analysis and machine intelligence 22(1): 4–37.https://dx.doi.org/10.1109/34.824819.
James, G., Witten, D., Hastie, T. and Tibshirani, R.(2013). An introduction to statistical learning, Vol. 112,Springer.Khairunniza-Bejo, S. and Kamarudin, S. (2011).Chokanan mango sweetness determination usinghsb color space, 2011 Third International Conferenceon Computational Intelligence, Modelling & Simulation,IEEE, pp. 216–221. https://doi.org/10.1109/CIMSim.2011.45.
Krogel, M.-A. (2005). On propositionalization forknowledge discovery in relational databases.

66 Reis et al. | Revista Brasileira de Computação Aplicada (2020), v.12, n.2, pp.54–66
Li, J., Huang, W. and Zhao, C. (2015). Machinevision technology for detecting the externaldefects of fruits—a review, The Imaging ScienceJournal 63(5): 241–251. https://doi.org/10.1179/1743131X14Y.0000000088.
Montgomery, D. C. and Runger, G. C. (2010). Appliedstatistics and probability for engineers, John Wiley &Sons.
Nagle, M., Intani, K., Romano, G., Mahayothee, B.,Sardsud, V. and Müller, J. (2016). Determination ofsurface color of ‘all yellow’mango cultivars usingcomputer vision, International Journal of Agriculturaland Biological Engineering 9(1): 42–50. https://doi.org/10.3965/j.ijabe.20160901.1861.
Nandi, C. S., Tudu, B. and Koley, C. (2014). Amachine vision-based maturity prediction systemfor sorting of harvested mangoes, IEEE Transactionson Instrumentation andmeasurement 63(7): 1722–1730.https://doi.org/10.1109/TIM.2014.2299527.
Neto, R., Adeodato, P. J. and Salgado, A. C. (2017).A framework for data transformation in creditbehavioral scoring applications based on modeldriven development, Expert Systems with Applications72: 293 – 305. https://doi.org/10.1016/j.eswa.2016.10.059.
Ngai, E. W. T., Xiu, L. and Chau, D. C. K. (2009).Application of data mining techniques in customerrelationship management: A literature review andclassification, Expert Syst. Appl. 36(2): 2592–2602.https://doi.org/10.1016/j.eswa.2008.02.021.
Pandey, R., Gamit, N. and Naik, S. (2014). Non-destructive quality grading of mango (mangiferaindica l) based on cielab colour model andsize, 2014 IEEE International Conference on AdvancedCommunications, Control and Computing Technologies,IEEE, pp. 1246–1251. https://doi.org/10.1109/ICACCCT.2014.7019298.
Polat, K. and Gunes, S. (2007). Classification ofepileptiform {EEG} using a hybrid system based ondecision tree classifier and fast fourier transform,Applied Mathematics and Computation 187(2): 1017–1026. https://doi.org/10.1016/j.amc.2006.09.022.
Pyle, D. (1999). Data preparation for data mining,morgan kaufmann.Salunkhe, R. P. and Patil, A. A. (2015). Imageprocessing for mango ripening stage detection: Rgband hsv method, 2015 Third International Conferenceon Image Information Processing (ICIIP), IEEE, pp. 362–365. https://doi.org/10.1109/ICIIP.2015.7414796.
Teoh, C. and Syaifudin, A. M. (2007). Image processingand analysis techniques for estimating weight ofchokanan mangoes, Journal of Tropical Agriculture andFood Science 35(1): 183. Available at https://bityli.com/pP3Iu.
Trindade, D. C. G. d. T., Lima, M. A. C. andAssis, J. S. (2015). Ação do 1-metilciclopropenona conservação pós-colheita de manga ’palmer’em diferentes estádios de maturação, PesquisaAgropecuária Brasileira 50(9): 753–762. https://doi.org/10.1590/S0100-204X2015000900003.
Vélez-Rivera, N., Blasco, J., Chanona-Pérez, J.,Calderón-Domínguez, G., de Jesús Perea-Flores,M., Arzate-Vázquez, I., Cubero, S. and Farrera-Rebollo, R. (2014). Computer vision system applied toclassification of “manila” mangoes during ripeningprocess, Food and bioprocess technology 7(4): 1183–1194. https://doi.org/10.1007/s11947-013-1142-4.Witten, I. H. and Frank, E. (2005). Data mining:Practical machine learning tools and techniques,Morgan Kaufmann, San Francisco . Available at https://bityli.com/GWyxY.
Yahaya, O. K. M., Jafri, M. Z. M., Aziz, A. A. and Omar,A. F. (2015). Determining sala mango qualities withthe use of rgb images captured by a mobile phonecamera, AIP Conference Proceedings, Vol. 1657, AIPPublishing, p. 060003. https://doi.org/10.1063/1.4915190.
Yossy, E. H., Pranata, J., Wijaya, T., Hermawan, H. andBudiharto, W. (2017). Mango fruit sortation systemusing neural network and computer vision, Procediacomputer science 116: 596–603. https://doi.org/10.1016/j.procs.2017.10.013.
Zheng, H. and Lu, H. (2012). A least-squares supportvector machine (ls-svm) based on fractal analysisand cielab parameters for the detection of browningdegree on mango (mangifera indica l.), Computersand Electronics in Agriculture 83: 47–51. https://doi.org/10.1016/j.compag.2012.01.012.


![Original Research A data mining Approach to the prediction of … Data Mining... · and k-nearest neighbour [12-14]. In the methods, at the training stage, the model structure is](https://img.dokumen.tips/doc/110x75/60e2e80c812d8851b43fbb66/original-research-a-data-mining-approach-to-the-prediction-of-data-mining-and.jpg)