Embed Size (px)
Citation preview

Global Business Failures ReportGlobal Business Failures—Insights
• Reflecting the uneven pattern of global growth, business failures continued to show mixed resultsacross world regions in Q1 2012.
• Business failures decreased strongly in North America, but rose sharply in Eastern Europe in Q1 2012.
• Insolvencies fell in Euroland, although this was largely due to strong improvement in Germany.
• Insolvency levels will remain elevated in H2 2012 due to adverse global economic conditions.
• Rising insolvency levels: Australia, Hungary, Netherlands, Poland, Portugal, Spain.
• Falling insolvency levels: Finland, Germany, Latvia, Lithuania, Norway, US.
A D&B Special ReportJune 2012
Recent Developments: Global Business Failures Fall Year on Year
Outlook: Insolvency Risk Will Remain Elevated in H2 2012
3
Key Insight: Insolvency Risk Rises In Indebted Euro-zone Economies and Elsewhere
3
3
Sectoral Developments in Advanced Countries
3
3
Developments in other Countries
Contents
© Dun & Bradstreet Limited 2
Country Risk ServicesA D&B Special ReportJune 2012
80
90
100
110
120
Q112
Q3Q111
Q3Q110
Q3Q109
Q3Q108
Q3Q107
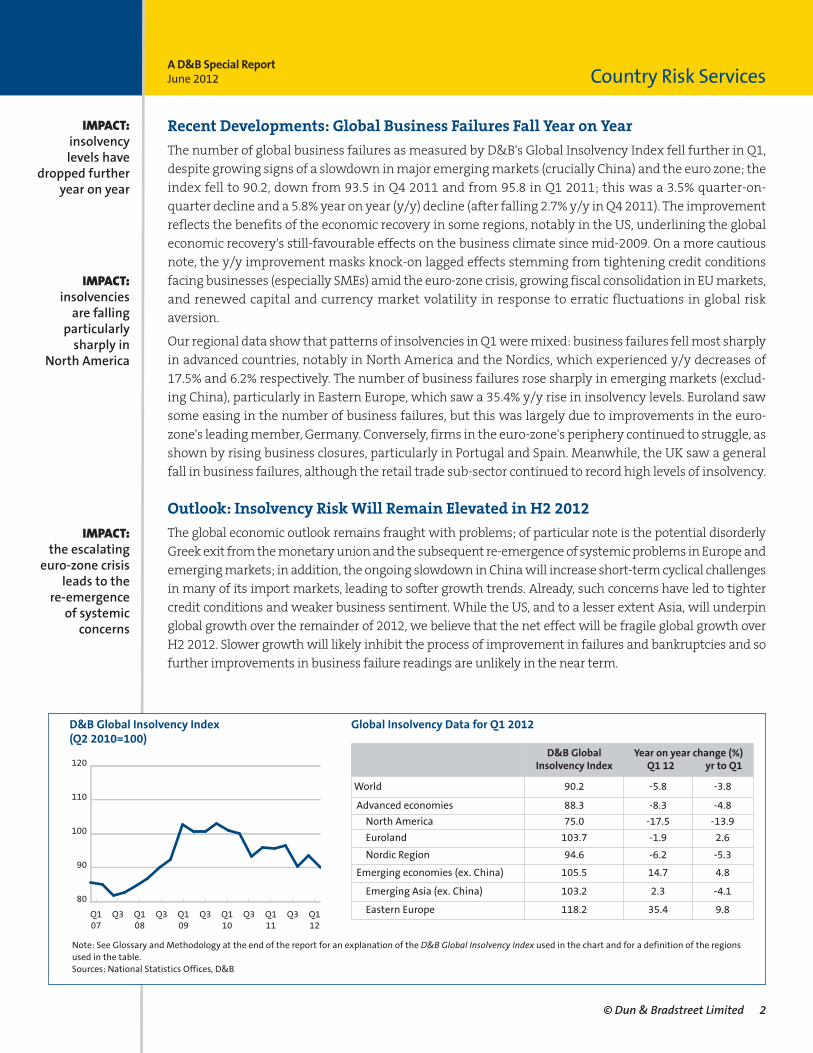
Global Insolvency Data for Q1 2012D&B Global Insolvency Index (Q2 2010=100)
Note: See Glossary and Methodology at the end of the report for an explanation of the D&B Global Insolvency Index used in the chart and for a definition of the regionsused in the table. Sources: National Statistics Offices, D&B
D&B Global Insolvency Index
Year on year change (%)Q1 12 yr to Q1
World 90.2 -5.8 -3.8
Advanced economies 88.3 -8.3 -4.8
North America 75.0 -17.5 -13.9
Euroland 103.7 -1.9 2.6
Nordic Region 94.6 -6.2 -5.3
Emerging economies (ex. China) 105.5 14.7 4.8
Emerging Asia (ex. China) 103.2 2.3 -4.1
Eastern Europe 118.2 35.4 9.8
Recent Developments: Global Business Failures Fall Year on Year
The number of global business failures as measured by D&B's Global Insolvency Index fell further in Q1,despite growing signs of a slowdown in major emerging markets (crucially China) and the euro zone; theindex fell to 90.2, down from 93.5 in Q4 2011 and from 95.8 in Q1 2011; this was a 3.5% quarter-on-quarter decline and a 5.8% year on year (y/y) decline (after falling 2.7% y/y in Q4 2011). The improvementreflects the benefits of the economic recovery in some regions, notably in the US, underlining the globaleconomic recovery's still-favourable effects on the business climate since mid-2009. On a more cautiousnote, the y/y improvement masks knock-on lagged effects stemming from tightening credit conditionsfacing businesses (especially SMEs) amid the euro-zone crisis, growing fiscal consolidation in EU markets,and renewed capital and currency market volatility in response to erratic fluctuations in global risk aversion.
Our regional data show that patterns of insolvencies in Q1 were mixed: business failures fell most sharplyin advanced countries, notably in North America and the Nordics, which experienced y/y decreases of17.5% and 6.2% respectively. The number of business failures rose sharply in emerging markets (exclud-ing China), particularly in Eastern Europe, which saw a 35.4% y/y rise in insolvency levels. Euroland sawsome easing in the number of business failures, but this was largely due to improvements in the euro-zone's leading member, Germany. Conversely, firms in the euro-zone's periphery continued to struggle, asshown by rising business closures, particularly in Portugal and Spain. Meanwhile, the UK saw a generalfall in business failures, although the retail trade sub-sector continued to record high levels of insolvency.
Outlook: Insolvency Risk Will Remain Elevated in H2 2012
The global economic outlook remains fraught with problems; of particular note is the potential disorderlyGreek exit from the monetary union and the subsequent re-emergence of systemic problems in Europe andemerging markets; in addition, the ongoing slowdown in China will increase short-term cyclical challengesin many of its import markets, leading to softer growth trends. Already, such concerns have led to tightercredit conditions and weaker business sentiment. While the US, and to a lesser extent Asia, will underpinglobal growth over the remainder of 2012, we believe that the net effect will be fragile global growth overH2 2012. Slower growth will likely inhibit the process of improvement in failures and bankruptcies and sofurther improvements in business failure readings are unlikely in the near term.
IMPACT:insolvency levels have
dropped furtheryear on year
IMPACT:insolvencies are falling
particularly sharply in
North America
IMPACT:the escalating
euro-zone crisisleads to the
re-emergence of systemic concerns
© Dun & Bradstreet Limited 3
Country Risk ServicesA D&B Special ReportJune 2012
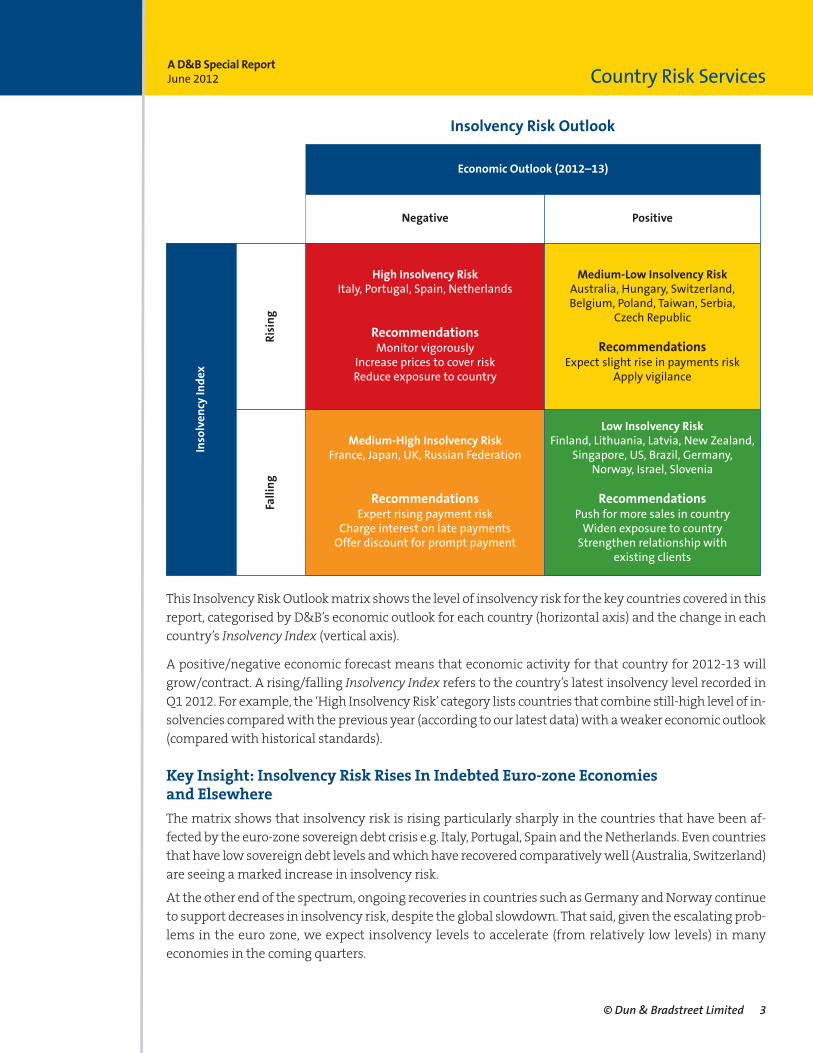
This Insolvency Risk Outlook matrix shows the level of insolvency risk for the key countries covered in thisreport, categorised by D&B’s economic outlook for each country (horizontal axis) and the change in eachcountry’s Insolvency Index (vertical axis).
A positive/negative economic forecast means that economic activity for that country for 2012-13 willgrow/contract. A rising/falling Insolvency Index refers to the country’s latest insolvency level recorded inQ1 2012. For example, the ‘High Insolvency Risk’ category lists countries that combine still-high level of in-solvencies compared with the previous year (according to our latest data) with a weaker economic outlook(compared with historical standards).
Key Insight: Insolvency Risk Rises In Indebted Euro-zone Economies and Elsewhere
The matrix shows that insolvency risk is rising particularly sharply in the countries that have been af-fected by the euro-zone sovereign debt crisis e.g. Italy, Portugal, Spain and the Netherlands. Even countriesthat have low sovereign debt levels and which have recovered comparatively well (Australia, Switzerland)are seeing a marked increase in insolvency risk.
At the other end of the spectrum, ongoing recoveries in countries such as Germany and Norway continueto support decreases in insolvency risk, despite the global slowdown. That said, given the escalating prob-lems in the euro zone, we expect insolvency levels to accelerate (from relatively low levels) in manyeconomies in the coming quarters.
Insolvency Risk Outlook
Economic Outlook (2012–13)
Negative Positive
Insolven
cy In
dex
Rising
High Insolvency RiskItaly, Portugal, Spain, Netherlands
RecommendationsMonitor vigorously
Increase prices to cover riskReduce exposure to country
Medium-Low Insolvency RiskAustralia, Hungary, Switzerland, Belgium, Poland, Taiwan, Serbia,
Czech Republic
RecommendationsExpect slight rise in payments risk
Apply vigilance
Falling
Medium-High Insolvency RiskFrance, Japan, UK, Russian Federation
RecommendationsExpert rising payment risk
Charge interest on late paymentsOffer discount for prompt payment
Low Insolvency RiskFinland, Lithuania, Latvia, New Zealand,
Singapore, US, Brazil, Germany, Norway, Israel, Slovenia
RecommendationsPush for more sales in countryWiden exposure to countryStrengthen relationship with
existing clients

© Dun & Bradstreet Limited 4
Country Risk ServicesA D&B Special ReportJune 2012
Sectoral Developments in Advanced Countries
Key Sector: Manufacturing
• business insolvencies in the key manufacturing sector dropped inQ1, although the outlook remains weak due to softer economicgrowth;
• among the advanced countries, the number of business failures inthe manufacturing sector fell by 13.0% y/y in Q1 and by 12.3%over the past four quarters;
• this is significantly down on the peak seen in Q3 2009, when business failures rose by 167.7% y/y in the wake of the global recession.
Developments in Other Sectors
• particularly strong decreases were recorded in the construction,telecommunications & transportation, real estate and natural resources sectors;
• the remaining sectors also saw declines in insolvencies in Q1;
• meanwhile, the net effect of the weak outlook for demand in Euroland and the mild recovery for demand in the US is likely to be an increase in insolvency risk in the services sector.
-40
0
40
80
120
160
200
240
Q112
Q3Q111
Q3Q110
Q3Q109
Q3Q108
Business Failures in the Manufacturing Sector (y/y change, %)
Business Failures by Sector
Share of Total
Y/Y Change (%)Q1 12 yr to Q1
Construction 20.2 -15.0 -10.0
Financial Services & Insurance 2.3 -8.3 -6.4
Manufacturing 10.6 -13.0 -12.3
Natural Resources 3.0 -17.8 -4.5
Real Estate 3.2 -14.1 -10.4
Retail 13.6 -4.6 -4.0
Other Services 36.0 -13.9 -5.1
Telecommunications & Transportation 5.6 -20.1 -15.4
Wholesale 5.5 -8.3 -7.7
Insolvency Index of Advanced Countries 100.0 -8.3 -4.8
United States
Latest Developments:
• the number of business failures fell for a sixth consecutive quarterin Q1, by 17.5% y/y, compared with a 14.9% y/y fall in Q4 2011;
• the easing in business insolvency levels is due to the slowly embedding economic recovery;
• all sectors recorded y/y improvement in Q1, led by natural resources and transportation, but with real estate improving less strongly.
• in the last four quarters combined, all sectors have shown an impressive improvement in the rate of business failures.
Outlook:
• external factors could derail the recovery, which we expect to remain uneven across various states;
• as such, we advise caution when dealing with sectors with a high dependency on sales to Asia and Europe.
-20
-15
-10
-5
0
5
10
15
Q112
Q3Q111
Q3Q110
Q3Q109
Q3Q108
Business Failures by Sector in Q1 2012
Share of Total
Y/Y Change (%)Q1 12 yr to Q1
Business Services 25.9 -20.1 -13.5
Construction 13.7 -21.6 -18.3
Retail 11.2 -20.3 -17.4
Real Estate 4.6 -16.2 -25.2
Transportation 4.0 -25.3 -16.9
Natural Resources 3.6 -25.9 -24.5
Manufacturing 3.5 -17.6 -17.6
Others 33.7 -10.3 -6.8
Total 100.0 -17.5 -13.9
Change in Business Failures (y/y, %)

© Dun & Bradstreet Limited 5
Country Risk ServicesA D&B Special ReportJune 2012
United Kingdom
Latest Developments:
• the number of business failures declined by 17.5% y/y in Q1 2012,marking the first quarter of decrease in bankruptcies since Q22011;
• aggressive restructuring and productivity gains are offsetting theongoing drag from sluggish recovery;
• the worst performing sector was retail trade;
• finance, insurance, real estate and personal services experiencedthe largest drop in business failures.
Outlook:
• despite the decline in business failures, we expect insolvency riskto remain high in the coming quarters, as downside risks linked tothe euro zone have risen;
• UK exports and import substitution industries will feel the full impact of the euro-zone crisis in coming quarters.
-60
-40
-20
0
20
40
60
80
Q112
Q3Q111
Q3Q110
Q3Q109
Q3Q108
Change in Business Failures (y/y, %)
Business Failures by Sector in Q1 2012
Share of Total
Y/Y Change (%)Q1-12 yr to Q1
Business Services 21.6 -25.3 10.1
Finance, Insurance and Real Estate 3.9 -48.9 -7.7
Retail Trade 26.5 93.9 -14.1
Construction 14.4 -27.0 -0.5
Personal Services 7.0 -39.4 -20.5
Transport, Communic., Utilities 4.2 -30.2 -9.9
Food and Drink 6.7 -26.9 -1.2
Others 15.7 -36.1 -14.0
Total 100.0 -17.5 -5.0
Spain
Latest Developments:
• the number of business failures rose for the fifth consecutive quarter in Q1 2012, by 26.2% y/y;
• the high level of business failures reflect the severely recessionarymacroeconomic environment;
• transport and storage, construction, and wholesale trade saw thelargest increases in bankruptcies;
• by contrast, agriculture and fishing saw a decline in bankruptcies.
Outlook:
• a further increase in the number of business failures is likely givendepressed demand and ongoing fiscal consolidation;
• the outlook for almost all sectors looks weak.
-50
0
50
100
150
200
250
300
Q112
Q3Q111
Q3Q110
Q3Q109
Q3Q108
Change in Business Failures (y/y, %)
Business Failures by Sector in Q1 2012
Share of Total
Y/Y Change (%)Q1-12 yr to Q1
Construction 31.3 22.9 21.5
Industry and Energy 18.7 20.3 13.8
Wholesale Trade 15.4 33.0 28.1
Transport and Storage 5.4 56.7 13.2
Hotel and Catering 2.8 22.7 14.0
Finance, Insurance and Real Estate 2.4 11.9 13.1
Agriculture and Fishing 0.6 -25.0 20.0
Others 23.4 30.0 39.3
Total 100.0 26.2 23.9
© Dun & Bradstreet Limited 6
Country Risk ServicesA D&B Special ReportJune 2012
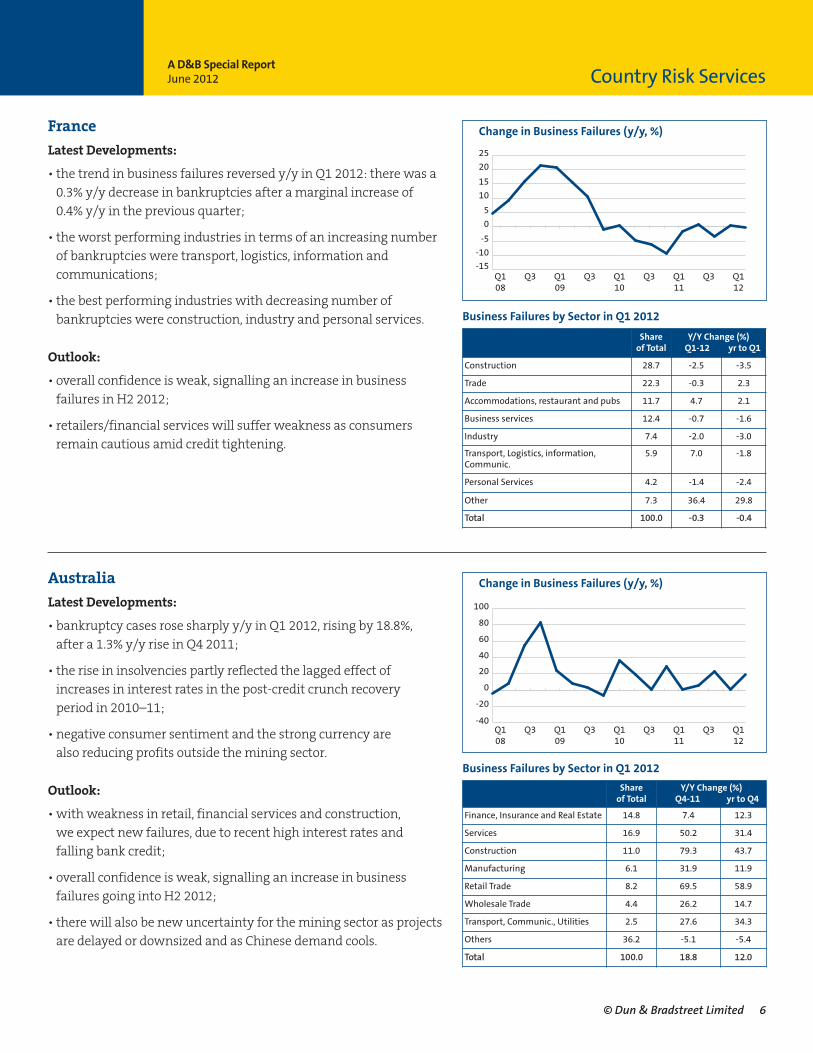
France
Latest Developments:
• the trend in business failures reversed y/y in Q1 2012: there was a0.3% y/y decrease in bankruptcies after a marginal increase of 0.4% y/y in the previous quarter;
• the worst performing industries in terms of an increasing numberof bankruptcies were transport, logistics, information and communications;
• the best performing industries with decreasing number of bankruptcies were construction, industry and personal services.
Outlook:
• overall confidence is weak, signalling an increase in business failures in H2 2012;
• retailers/financial services will suffer weakness as consumers remain cautious amid credit tightening.
-15
-10
-5
0
5
10
15
20
25
Q112
Q3Q111
Q3Q110
Q3Q109
Q3Q108
Change in Business Failures (y/y, %)
Business Failures by Sector in Q1 2012
Share of Total
Y/Y Change (%)Q1-12 yr to Q1
Construction 28.7 -2.5 -3.5
Trade 22.3 -0.3 2.3
Accommodations, restaurant and pubs 11.7 4.7 2.1
Business services 12.4 -0.7 -1.6
Industry 7.4 -2.0 -3.0
Transport, Logistics, information, Communic.
5.9 7.0 -1.8
Personal Services 4.2 -1.4 -2.4
Other 7.3 36.4 29.8
Total 100.0 -0.3 -0.4
Australia
Latest Developments:
• bankruptcy cases rose sharply y/y in Q1 2012, rising by 18.8%, after a 1.3% y/y rise in Q4 2011;
• the rise in insolvencies partly reflected the lagged effect of increases in interest rates in the post-credit crunch recovery period in 2010–11;
• negative consumer sentiment and the strong currency are also reducing profits outside the mining sector.
Outlook:
• with weakness in retail, financial services and construction, we expect new failures, due to recent high interest rates and falling bank credit;
• overall confidence is weak, signalling an increase in business failures going into H2 2012;
• there will also be new uncertainty for the mining sector as projectsare delayed or downsized and as Chinese demand cools.
-40
-20
0
20
40
60
80
100
Q112
Q3Q111
Q3Q110
Q3Q109
Q3Q108
Change in Business Failures (y/y, %)
Business Failures by Sector in Q1 2012
Share of Total
Y/Y Change (%)Q4-11 yr to Q4
Finance, Insurance and Real Estate 14.8 7.4 12.3
Services 16.9 50.2 31.4
Construction 11.0 79.3 43.7
Manufacturing 6.1 31.9 11.9
Retail Trade 8.2 69.5 58.9
Wholesale Trade 4.4 26.2 14.7
Transport, Communic., Utilities 2.5 27.6 34.3
Others 36.2 -5.1 -5.4
Total 100.0 18.8 12.0

© Dun & Bradstreet Limited 7
Country Risk ServicesA D&B Special ReportJune 2012
Japan
Latest Developments
• the number of business failures dropped by 0.8% y/y in Q1, afterdeclining 5.9% y/y in Q4, despite the economic shock of the GreatEast Japan Earthquake;
• the continued decline in bankruptcy cases reflected recovery fromthe lagged recovery after the shock of 2009, and the fact that creditconditions improved and government support to SMEs continued;
• the manufacturing sector saw the largest y/y drop in Q1, followedby the retail sector, even as services failures rose 11.9%.
Outlook:
• government support and guarantees shielded firms from the Great East Japan Earthquake in March 2011 and the economy is on a post-quake expansion path;
• having survived natural disasters in Japan and Thailand and astrong yen in 2011, 2012 could prove difficult for exporters asglobal demand stagnates;
• grace periods for debtors in stricken areas will expire and raisebusiness failures in 2012.
-20
-15
-10
-5
0
5
10
15
20
Q112
Q3Q111
Q3Q110
Q3Q109
Q3Q108
Change in Business Failures (y/y, %)
Business Failures by Sector in Q1 2012
Share of Total
Y/Y Change (%)Q1-12 yr to Q1
Construction 24.5 -1.9 -1.8
Services 23.9 11.9 7.3
Manufacturing 13.6 -11.6 -9.8
Wholesale Trade 14.5 4.5 -4.9
Retail Trade 11.5 -11.4 -6.5
Information and Communication 4.3 9.5 -0.2
Transportation 3.5 2.8 -10.9
Others 4.1 -15.6 -9.0
Total 100.0 -0.8 -2.7
South Africa
Latest Developments:
• the number of business failures fell by 10.0% y/y in Q1 2012, after a 31.6% y/y increase in the previous quarter;
• despite this, the business climate continues to suffer from tightlending conditions, rising input costs and weaker exports;
• wholesale trade was the best-performing sector, both in y/y termsand in the 12 months to Q1;
• the agriculture, forestry, fishing, mining and services sectorsshowed sharp increases in insolvency risk.
Outlook:
• we expect business insolvency risk to remain elevated amid subdued domestic activity and a downturn in the key trade partner, the EU;
• however, gold mining will benefit from strong external demanddue to ongoing global uncertainty.
-60-40
-200204060
80100120
Q112
Q3Q111
Q3Q110
Q3Q109
Q3Q108
Change in Business Failures (y/y, %)
Business Failures by Sector in Q1 2012
Share of Total
Y/Y Change (%)Q1-12 yr to Q1
Services 28.3 -11.3 -6.3
Retail Trade 28.0 -21.2 9.5
Finance, Insurance and Real Estate 17.3 9.8 21.4
Manufacturing 11.5 8.4 8.9
Construction 6.8 6.8 22.5
Wholesale Trade 2.7 -45.2 -3.7
Transport, Communic., Utilities 3.5 -22.0 2.6
Agric., Forestry, Fishing, Mining 1.8 25.7 1.1
Total 100.0 -10.0 5.9

© Dun & Bradstreet Limited 8
Country Risk ServicesA D&B Special ReportJune 2012
Russian Federation
Latest Developments
• the number of business failures declined for the seventh consecutive quarter in Q1 2012, by 2.5% y/y;
• decreasing business failures reflect an improved economic environment (especially buoyant private and government demand) and improved credit conditions;
• finance, insurance and real estate saw the largest y/y increase inbankruptcies in Q1;
• agriculture, forestry, fishing, mining and manufacturing showedsharp drops in insolvency risk.
Outlook:
• business insolvency risk is likely to rise in the coming quartersamid rising inflation and a downturn in the key trade partner, the EU;
• however, the oil industry will benefit from high oil prices.
-20
-10
0
10
20
30
40
Q112
Q3Q111
Q3Q110
Change in Business Failures (y/y, %)
Business Failures by Sector in Q1 2012
Share of Total
Y/Y Change (%)Q1-12 yr to Q1
Wholesale and retail trade 26.2 -4.9 -14.6
Construction 19.6 -0.2 -5.7
Manufacturing 15.2 -9.7 -9.9
Finance, insurance, real estate 13.0 12.0 10.4
Agriculture, forestry, fishing, mining 12.9 -5.7 -9.4
Transport and Telecommunications 5.1 2.5 -8.6
Hotel and restaurants 1.0 0.0 -4.9
Other 7.1 -3.1 -4.9
Total 100.0 -2.5 -7.7

© Dun & Bradstreet Limited 9
Country Risk ServicesA D&B Special ReportJune 2012
China
• business failures rose 15.2% y/y in Q1, reflecting higher credit riskamong firms affected by a tightening of credit conditions in 2011;
• by Q4, real estate and the export sector were already noticeably affected, and the outlook for credit quality in 2012 is negative inseveral sectors;
• the incomplete development of the bankruptcy framework meansthat business failures data tend not to capture all involuntary business cessations.
-50-40-30-20-1001020
Q112
Q3Q111
Q3Q110
Change in Business Failures (y/y, %)
Singapore
• the number of business failures fell 16.7% y/y in Q1, compared to a10.8% y/y rise in Q4;
• Singapore's economic growth has slowed down appreciably from2010-11, but this has not yet translated into sharply higher creditrisks;
• weaker demand prospects in 2012 in trade partners such as the EUand China will lower profits in cyclically exposed sectors.
-40-20020406080
100120
Q112
Q3Q111
Q3Q110
Q3Q109
Q3Q108
Change in Business Failures (y/y, %)
Taiwan
• the number of business failures rose for the second consecutivequarter in Q1 2012, by 13.4% y/y;
• the continued increase reflects renewed difficulties in the businessclimate, especially weakening export orders, falling manufacturingoutput (mainly in high-tech industry) and subdued consumerspending;
• given these factors, we expect a further deterioration in businessinsolvency risk, and advise caution when dealing with manufacturing firms in particular.
-80
-60
-40
-20
0
20
40
Q112
Q3Q111
Q3Q110
Q3Q109
Q3Q108
Change in Business Failures (y/y, %)
Brazil
• the number of business failures fell by 5.6% y/y in Q1 2012, after a7.3% y/y rise in Q4 2011;
• the amelioration reflects positive economic performance, althoughthe majority of important sectors in the economy remain weak;
• a reversal in trend in the number of business failures is likely over2012 as economic momentum slows.
-40-30-20-10010203040
Q112
Q3Q111
Q3Q110
Q3Q109
Q3Q108
Change in Business Failures (y/y, %)
Developments in Other Countries

© Dun & Bradstreet Limited 10
Country Risk ServicesA D&B Special ReportJune 2012
Netherlands
• the number of business failures increased by 24.1% y/y in Q1 2012,up from an increase of 10.9% in Q4 2011;
• the increase in business failures reflects tougher lending terms anda deteriorating economic climate amid low domestic demand andsluggish export performance;
• the weakening economic outlook is likely to see a further rise in insolvencies in H2 2012.
-40-20020406080
100120
Q112
Q3Q111
Q3Q110
Q3Q109
Q3Q108
Change in Business Failures (y/y, %)
Germany
• the number of business failures fell by 31.4% y/y in Q1 2012, compared with a 5.7% y/y drop in Q4 2011;
• the decline reflects the economic recovery, with credit conditionsand companies’ payments performance improving notably;
• however, the escalating euro-zone crisis is a threat to further improvements, and we expect an increase in insolvency rates from late 2012 onwards.
-40
-30
-20
-10
0
10
20
Q112
Q3Q111
Q3Q110
Q3Q109
Q3Q108
Change in Business Failures (y/y, %)
Portugal
• the number of business failures increased by 46.5% y/y in Q1 2012,up from 23.9% y/y in Q4;
• the deterioration reflects the ongoing economic downturn amidcompanies' weak performance and the government's sharp budget cuts;
• a further increase in the number of business failures is likely given the fragile economic outlook and the ongoing need for fiscal consolidation.
0
10
20
30
40
50
60
Q112
Q3Q111
Q3Q110
Q3Q109
Q3Q1-08
Change in Business Failures (y/y, %)
Switzerland
• the number of business failures rose by 6.5% y/y in Q1 2012, afteran expansion by 3.4% y/y in Q4 2011;
• the increase since Q3 2011 reflects the franc's sharp appreciationand the aggravation of the euro-zone crisis;
• although the franc's upward trend has been curbed by the intervention of the Swiss central bank, price competitiveness problems for export-orientated businesses remain.
-15
-10
-5
0
5
10
15
Q112
Q3Q111
Q3Q110
Q3Q109
Q3Q108
Change in Business Failures (y/y, %)
© Dun & Bradstreet Limited 11
Country Risk ServicesA D&B Special ReportJune 2012
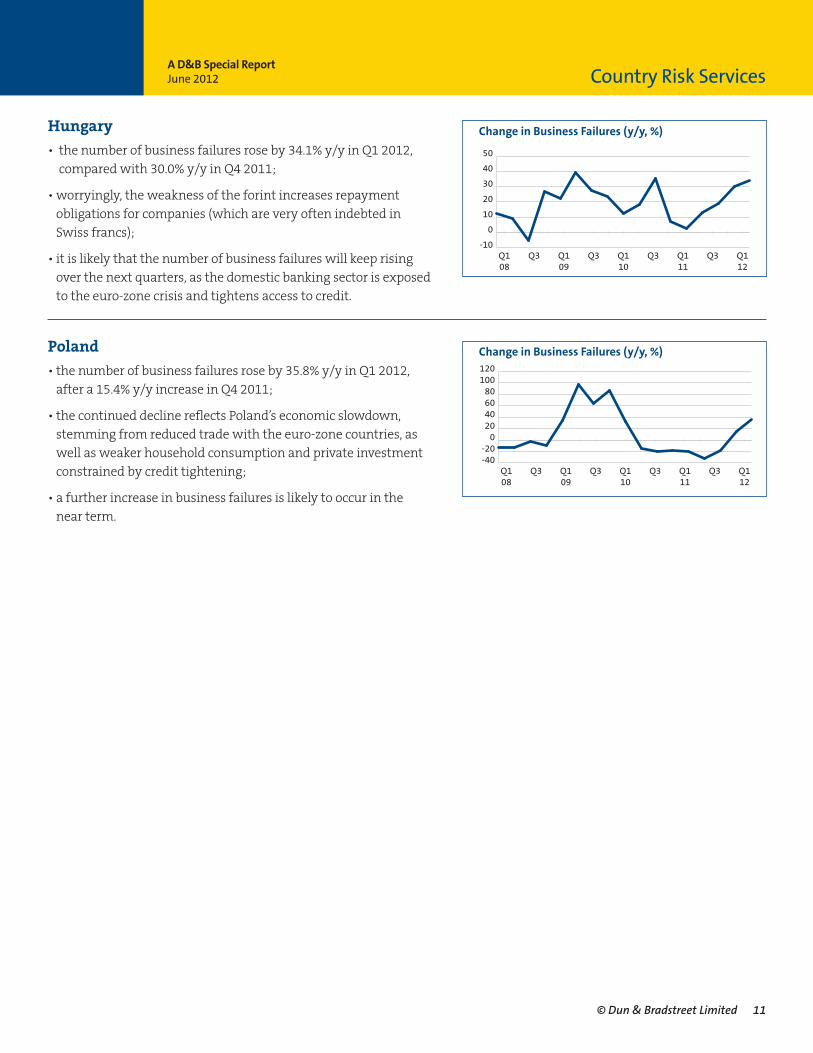
Poland
• the number of business failures rose by 35.8% y/y in Q1 2012, after a 15.4% y/y increase in Q4 2011;
• the continued decline reflects Poland’s economic slowdown, stemming from reduced trade with the euro-zone countries, as well as weaker household consumption and private investmentconstrained by credit tightening;
• a further increase in business failures is likely to occur in the near term.
-40-20020406080
100120
Q112
Q3Q111
Q3Q110
Q3Q109
Q3Q108
Change in Business Failures (y/y, %)
Hungary
• the number of business failures rose by 34.1% y/y in Q1 2012, compared with 30.0% y/y in Q4 2011;
• worryingly, the weakness of the forint increases repayment obligations for companies (which are very often indebted in Swiss francs);
• it is likely that the number of business failures will keep rising over the next quarters, as the domestic banking sector is exposed to the euro-zone crisis and tightens access to credit.
-10
0
10
20
30
40
50
Q112
Q3Q111
Q3Q110
Q3Q109
Q3Q108
Change in Business Failures (y/y, %)

Macroeconomic Context The table below summarises the D&B Insolvency Index (Q2 2010 = 100), the year-on-year change in thenumber of business failures, and the real GDP growth forecast (2012–16 average) for a selected list of countries; it also indicates the trend for each country’s risk rating (▲= ‘improving’, n = ‘stable’, and ▼ = ‘deteriorating’). The countries shaded in grey are covered in more detail in the preceding pages.
© Dun & Bradstreet Limited 12
Country Risk ServicesA D&B Special ReportJune 2012
CountryD&B Insolvency Index
Q2 2010year-on-year change
in Q1 2012 Real GDP GrowthAverage 2012–16
Risk Rating Trend
Australia 104.2 18.8 1.9 ▼
Belgium 133.3 0.9 1.5 ▼
Brazil 87.8 -5.6 5.0 n
China 59.9 15.2 7.4 ▼
Czech Republic 107.5 9.04 1.4 ▼
Denmark 82.6 -1.4 1.6 n
Finland 119.1 -5.6 2.2 ▼
France 112.3 -0.3 1.4 ▼
Germany 63.0 -31.4 1.6 ▼
Hong Kong 85.3 0.6 3.9 ▼
Hungary 127.7 34.1 1.7 ▼
Iceland 133.3 -20.9 2.4 n
Ireland 85.5 -14.8 2.4 ▼
Israel 181.6 -11.0 3.6 n
Italy 100.4 0.8 0.5 ▼
Japan 95.8 -0.8 1.1 n
Latvia 33.0 -20.1 3.7 n
Lithuania 67.1 -18.5 3.3 ▼
Netherlands 122.3 24.1 0.7 ▼
New Zealand 75.1 -4.4 3.0 n
Norway 86.7 -8.7 2.0 ▼
Russian Federation 74.9 -2.5 3.4 n
Serbia 134.5 70.1 2.4 n
Poland 116.2 35.8 4.5 n
Portugal 160.2 46.5 -0.3 ▼
Singapore 100.0 -16.7 4.1 ▼
Slovenia 162.5 -4.5 1.6 ▼
South Africa 95.4 -10.0 3.1 ▼
Spain 157.5 26.2 0.4 ▼
Switzerland 104.7 6.5 1.7 ▼
Taiwan 104.6 13.4 4.3 ▼
United Kingdom 69.1 -17.5 1.2 ▼
United States of America 75.0 -17.5 2.1 n
Glossary of Terms
D&B Global Insolvency Index: A proprietary D&B Country Risk Services index that assesses the performance of business failures globally (more details available below). The terms ‘bankruptcy’, ‘business failure’ and ‘insolvency’ are used interchangeably in this report.Eastern Europe: Czech Republic, Hungary, Latvia, Lithuania, Poland and Serbia.Emerging Asia (excl. China): Taiwan and SingaporeNordic Region:Denmark, Finland, Iceland and NorwayNorth America:United States of America
MethodologyThe D&B Global Insolvency Index is a D&B Country Risk Services product calculated as the weighted average of the insolvency index for each country based on the information available. The D&B Global Insolvency Index aggregates the indices for 33 countries organised in seven regions covering more than70% of global GDP. The country’s GDP (nominal terms) in US dollars provides the weighting for each national insolvency index. The D&B Global Insolvency Index benchmark value is 100 for Q2 2010. An increase in the index implies more negative events concerning insolvencies, while a decrease representsa positive development. More information is available upon request.

Sources
This report has been compiled with the kind support of the following D&B offices and partners:
© Dun & Bradstreet Limited 13
Country Risk ServicesA D&B Special ReportJune 2012
AustraliaDun & Bradstreet (Australia) Pty LtdTel: +61 3 9828 3333Email: [email protected]
BelgiumDun & Bradstreet Belgium NV/SATel: +32 2 481 83 00Email: [email protected]
ChinaHuaxia D&B China Tel: +86 (0) 21 2321 3636 Email: [email protected]
Czech Republic D&B Czech RepublicTel: +420 274 000 600Email: [email protected]
D&B EMCTel: +44 1628 492430Email: [email protected]
DenmarkD&B DenmarkTel: +45 36 73 80 60Email: [email protected]
FranceAltares-D&BTel: +33 1 41 37 50 00 Email: [email protected]
GermanyD&B Deutschland GmbHTel: +49 (0) 6151.1375.777Email: [email protected]
HungaryDun & Bradstreet Hungary Ltd.Tel: +36 1 347 6700Email: [email protected]
IrelandD&B Tel: +44 (0)1628 492000Email: [email protected]
IsraelD&B IsraelTel: 03-7330333Email: [email protected]
ItalyCRIBIS D&BTel: 800-82 10 58Email: [email protected]
JapanTokyo Shoko Research Ltd.Tel: +81-3-6910-3140Email: [email protected]
NetherlandsD&B NederlandTel: +3110 710 9560Email: [email protected]
PolandDun and Bradstreet Poland Sp. z o.o.Tel: +48 22 533 24 00Email: [email protected]
PortugalInforma D&BTel: +351 213 500 300Email: [email protected]
Russian FederationD&B InterfaxTel: +7-495-646 2114Email: [email protected]
SloveniaBonitetna hiša i, d.o.o.,Tel: +386 1 234 29 40Email: [email protected]
South AfricaTransUnion Credit Bureau (Pty) LtdTel: +27 11 214 6000
SwitzerlandD&B Schweiz AG Tel: +41 (0)44 735 61 11Email: [email protected]
UKD&B UK Ltd.Tel: +44 (0)1628 492000Email: [email protected]
U.S. D&BTel: 1-800-234-3867Email: [email protected]
D&B Country Risk ServicesAt D&B Country Risk Services we have a team of economists dedicated to analysing the risks of doingbusiness across the world (we currently cover 132 countries). We monitor each of these countries on a daily basis and produce both shorter analytical pieces (Country RiskLine Reports; at least one per country per month for most countries), as well as more detailed 50-page Country Reports. For furtherdetails please contact Country Risk Services on +44 (0)1628 492595 or email [email protected].
Additional ResourcesThe information contained in this publication was correct at the time of going to press. For the most up-to-date information on any country covered here, refer to D&B’s monthly International Risk & PaymentReview. For comprehensive, in-depth coverage, refer to the relevant country’s Full Country Report.
Credits: This paper was produced by D&B Country Risk Services, and contains contributions by Dr. Ilona Dmitrieva, Daniele Fraietta, Dr. WarwickKnowles, Markus Kuger, Isaac Leung, Gaimin Nonyane and Andres Tacsir.
While the editors endeavour to ensure the accuracy of all information and data contained in this D&B report, neither they nor Dun & Bradstreet Limited accept responsibility for any loss or damage (whether direct or indirect) whatsoever to the customer or any third party resulting or arisingtherefrom.
© All rights reserved. No part of this publication may be reproduced or used in any form or by any means graphic, electronic or mechanical, including photocopying, recording, taping, or information storage and retrieval systems without permission of the publisher.