Embed Size (px)
Citation preview
A crude awakeningWho’s driving the oil price?
9 August 2017
www.pwc.com
PwC • 2
Important notice
The following market benchmarking exercise has been performed as at 30 June 2017.
Given the rapidly evolving views of market participants, certain views can become quickly outdated.
As part of our analysis, it should be noted that we are not providing an independent view on the oil & gas price forecasts. Instead, we are collating market participant views.
Our market benchmarking data and conclusions should not be applied mechanistically. Instead, careful consideration should be given to the purpose of the valuation and to the price forecasts and sensitivity analysis used.
A crude awakening | Who's driving the oil price?
PwC • 3PwC • 3
Same old?
Since our last update in February, our benchmarking has shown that in the short term, market participants have been revising downwards their Brent oil price forecasts. Longer term however, we have seen that there hasn’t been a significant change in long term Brent oil price expectations (average $82/bbl in 2026) as estimated by brokers and consultants.
We observe that the market seems resigned that ‘lower for longer’ is likely to last even longer and have seen some market participants reflecting this sentiment in downward revisions in the longer term Brent oil price, unlike the brokers and consultants that we have benchmarked. Oil companies have continued to adapt to this by resizing their operations, managing their costs, and concentrating on necessary rather than discretionary capital investment.
The influence of OPEC
We commented last time about OPEC’s attempts to cut production, which were initiated at its November 2016 meeting, and expressed some scepticism about whether all the members would abide by it. There have been two further meetings now, and it seems our concerns were justified: while countries like Saudi Arabia and Russia are fully on board, others have been rather more lukewarm, including Algeria, Ecuador, and Iraq. It’s no surprise, then, that OPEC’s language has hardened of late, with phrases like ‘forcefully demand participation’ and ‘crackdown on members’ used after the most recent meeting on 24 July.
Alongside the efforts of OPEC’s member states to cut production, we have seen an increase in US shale production which has undermined OPEC and it’s attempts to increase prices.
Even if such blanket ‘participation’ can be achieved, there are questions about how effective this will be in the longer term, given the number of complex factors in play: inventory levels, unconventional and renewable production levels, and regulatory/fiscal policy to name only the most obvious.
In the meantime, Brent oil price is now hovering around the psychological $50/bbl mark. We look later at the OPEC countries which will struggle to balance their fiscal deficits at that level.
The deal environment
The relative stability we have seen in the past few months in the long term Brent oil price however, does seem to have been sufficient to prompt more deal activity. We have seen both buyers and sellers undertaking M&A transactions, and have observed that the gap between their relative price expectations has narrowed. Additionally, many deals are building in contingent price mechanisms to share the upside benefit and minimise risk on the downside in the event that the oil price moves. Now that prices seem to have settled we expect to see a slowdown in upstream M&A while companies assess the long term price environment.
In the next issue, we will look in more detail at the themes of how low oil prices impact governments’ fiscal deficits and the potential implications of this.
Jacqueline Chow(Director- Natural Resources Valuations)
A crude awakening | Who's driving the oil price?
Charm short-lived
PwC • 3
PwC • 4
1Brent Oil – Price & deal market
A crude awakening | Who's driving the oil price?
PwC • 5
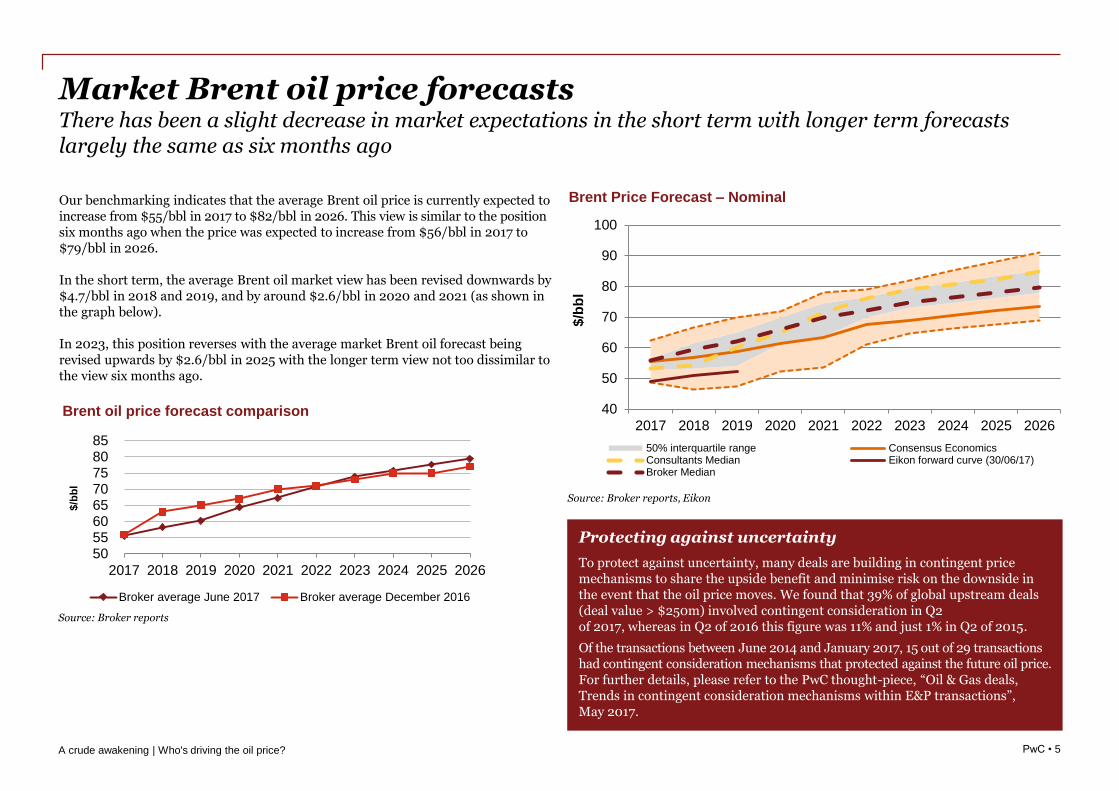
Our benchmarking indicates that the average Brent oil price is currently expected to increase from $55/bbl in 2017 to $82/bbl in 2026. This view is similar to the position six months ago when the price was expected to increase from $56/bbl in 2017 to $79/bbl in 2026.
In the short term, the average Brent oil market view has been revised downwards by $4.7/bbl in 2018 and 2019, and by around $2.6/bbl in 2020 and 2021 (as shown in the graph below).
In 2023, this position reverses with the average market Brent oil forecast being revised upwards by $2.6/bbl in 2025 with the longer term view not too dissimilar to the view six months ago.
A crude awakening | Who's driving the oil price?
Source: Broker reports, Eikon
50 55 60 65 70 75 80 85
2017 2018 2019 2020 2021 2022 2023 2024 2025 2026
$/b
bl
Brent oil price forecast comparison
Broker average June 2017 Broker average December 2016
Protecting against uncertainty
To protect against uncertainty, many deals are building in contingent price mechanisms to share the upside benefit and minimise risk on the downside in the event that the oil price moves. We found that 39% of global upstream deals (deal value > $250m) involved contingent consideration in Q2 of 2017, whereas in Q2 of 2016 this figure was 11% and just 1% in Q2 of 2015.
Of the transactions between June 2014 and January 2017, 15 out of 29 transactions had contingent consideration mechanisms that protected against the future oil price. For further details, please refer to the PwC thought-piece, “Oil & Gas deals, Trends in contingent consideration mechanisms within E&P transactions”, May 2017.
40
50
60
70
80
90
100
2017 2018 2019 2020 2021 2022 2023 2024 2025 2026
$/b
bl
Brent Price Forecast – Nominal
50% interquartile range Consensus EconomicsConsultants Median Eikon forward curve (30/06/17)Broker Median
Source: Broker reports
Market Brent oil price forecastsThere has been a slight decrease in market expectations in the short term with longer term forecasts largely the same as six months ago
PwC • 6PwC • 6
Price performance
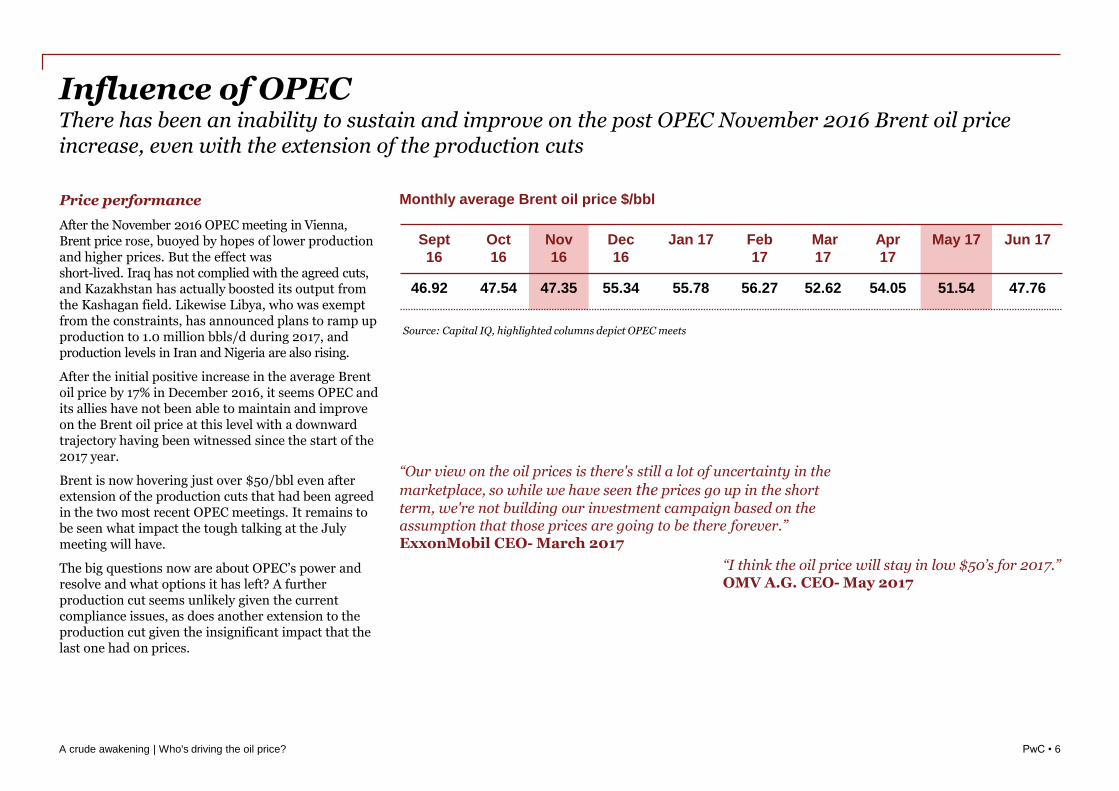
After the November 2016 OPEC meeting in Vienna, Brent price rose, buoyed by hopes of lower production and higher prices. But the effect was short-lived. Iraq has not complied with the agreed cuts, and Kazakhstan has actually boosted its output from the Kashagan field. Likewise Libya, who was exempt from the constraints, has announced plans to ramp up production to 1.0 million bbls/d during 2017, and production levels in Iran and Nigeria are also rising.
After the initial positive increase in the average Brent oil price by 17% in December 2016, it seems OPEC and its allies have not been able to maintain and improve on the Brent oil price at this level with a downward trajectory having been witnessed since the start of the 2017 year.
Brent is now hovering just over $50/bbl even after extension of the production cuts that had been agreed in the two most recent OPEC meetings. It remains to be seen what impact the tough talking at the July meeting will have.
The big questions now are about OPEC’s power and resolve and what options it has left? A further production cut seems unlikely given the current compliance issues, as does another extension to the production cut given the insignificant impact that the last one had on prices.
A crude awakening | Who's driving the oil price?
Influence of OPECThere has been an inability to sustain and improve on the post OPEC November 2016 Brent oil price increase, even with the extension of the production cuts
Source: Capital IQ, highlighted columns depict OPEC meets
Sept
16
Oct
16
Nov
16
Dec
16
Jan 17 Feb
17
Mar
17
Apr
17
May 17 Jun 17
46.92 47.54 47.35 55.34 55.78 56.27 52.62 54.05 51.54 47.76
“Our view on the oil prices is there's still a lot of uncertainty in the
marketplace, so while we have seen the prices go up in the short
term, we're not building our investment campaign based on the assumption that those prices are going to be there forever.”ExxonMobil CEO- March 2017
“I think the oil price will stay in low $50’s for 2017.”OMV A.G. CEO- May 2017
Monthly average Brent oil price $/bbl
PwC • 7
0
10
20
30
40
50
60
70
80
90
OPEC fiscal deficitThe prevailing Brent oil price of around $50/bbl adds additional strain on the national budgets of the OPEC members
OPEC fiscal deficit:
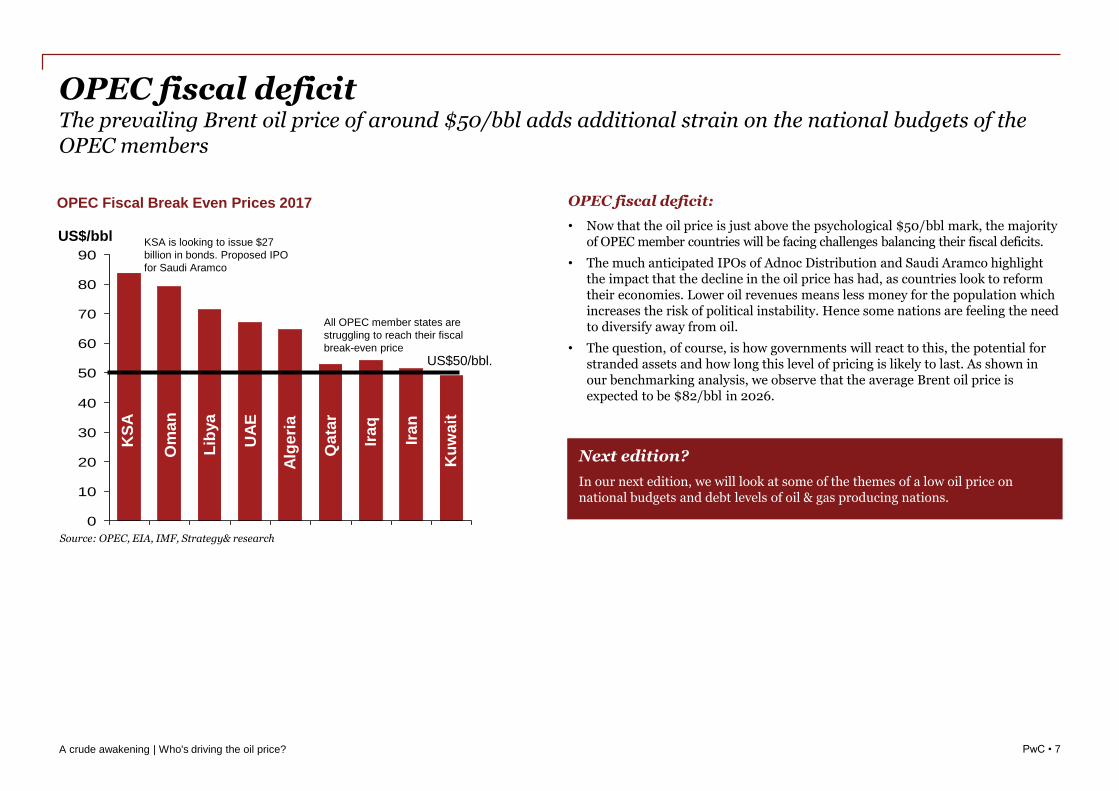
• Now that the oil price is just above the psychological $50/bbl mark, the majority of OPEC member countries will be facing challenges balancing their fiscal deficits.
• The much anticipated IPOs of Adnoc Distribution and Saudi Aramco highlight the impact that the decline in the oil price has had, as countries look to reform their economies. Lower oil revenues means less money for the population which increases the risk of political instability. Hence some nations are feeling the need to diversify away from oil.
• The question, of course, is how governments will react to this, the potential for stranded assets and how long this level of pricing is likely to last. As shown in our benchmarking analysis, we observe that the average Brent oil price is expected to be $82/bbl in 2026.
A crude awakening | Who's driving the oil price?
Non OPEC
Crude
OPEC
Crude
Next edition?
In our next edition, we will look at some of the themes of a low oil price on national budgets and debt levels of oil & gas producing nations.
KS
A
Om
an
Lib
ya
UA
E
Alg
eri
a
Qa
tar
Ira
q
Ira
n
Ku
wa
it
OPEC Fiscal Break Even Prices 2017
US$50/bbl.
US$/bbl KSA is looking to issue $27
billion in bonds. Proposed IPO
for Saudi Aramco
All OPEC member states are
struggling to reach their fiscal
break-even price
Source: OPEC, EIA, IMF, Strategy& research
PwC • 8
The disruption of electric cars on oil pricesElectric vehicles have been growing in popularity for some time, but now that the UK has announced plans to ban the sale of new diesel and petrol cars by 2040, it’s a good time to look at the impact this could have on the oil price
Background
• Given that roughly half of the world’s oil demand is for road transport, new electric technologies could have a huge impact on the industry.
• The number of global car manufacturers which have already announced plans to ‘go green’ could suggest we have reached a tipping point and that this could be a disruptor to the future oil price. Volkswagen have announced that they will only manufacture hybrid vehicles by 2020, all new Volvo models will have electric motors from 2019, and by 2019 BMW will build a fully electric Mini.
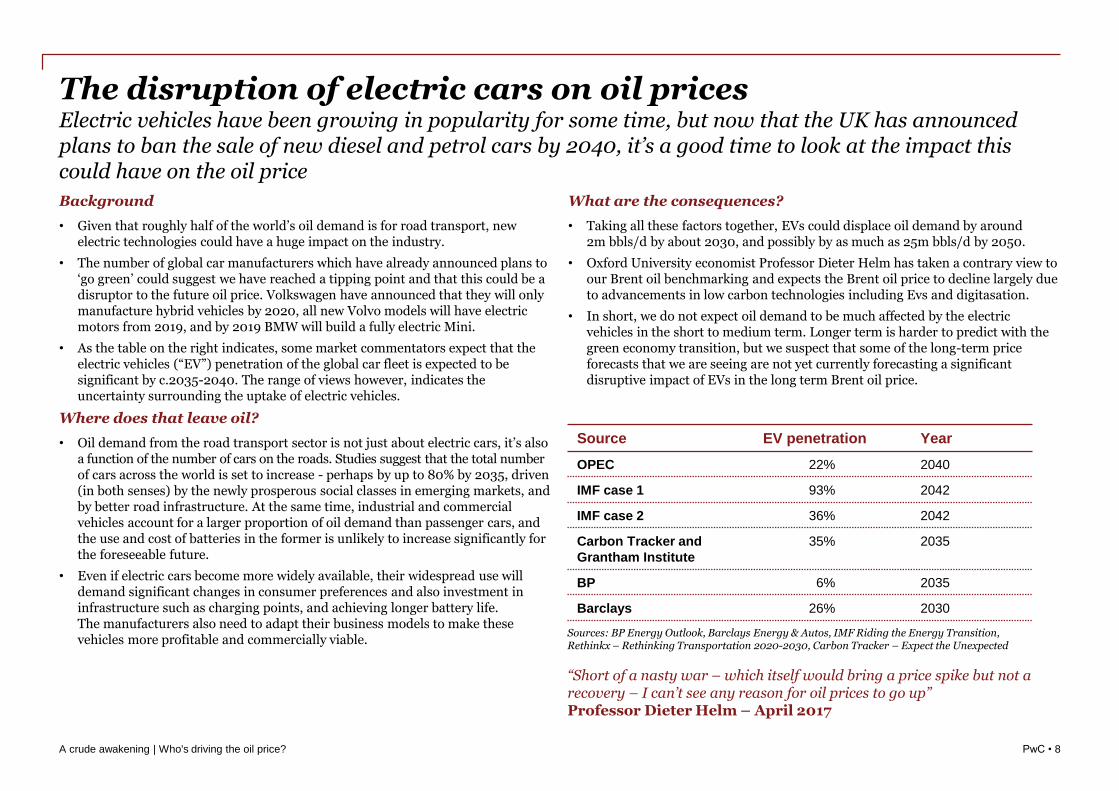
• As the table on the right indicates, some market commentators expect that the electric vehicles (“EV”) penetration of the global car fleet is expected to be significant by c.2035-2040. The range of views however, indicates the uncertainty surrounding the uptake of electric vehicles.
Where does that leave oil?
• Oil demand from the road transport sector is not just about electric cars, it’s also a function of the number of cars on the roads. Studies suggest that the total number of cars across the world is set to increase - perhaps by up to 80% by 2035, driven (in both senses) by the newly prosperous social classes in emerging markets, and by better road infrastructure. At the same time, industrial and commercial vehicles account for a larger proportion of oil demand than passenger cars, and the use and cost of batteries in the former is unlikely to increase significantly for the foreseeable future.
• Even if electric cars become more widely available, their widespread use will demand significant changes in consumer preferences and also investment in infrastructure such as charging points, and achieving longer battery life. The manufacturers also need to adapt their business models to make these vehicles more profitable and commercially viable.
What are the consequences?
• Taking all these factors together, EVs could displace oil demand by around 2m bbls/d by about 2030, and possibly by as much as 25m bbls/d by 2050.
• Oxford University economist Professor Dieter Helm has taken a contrary view to our Brent oil benchmarking and expects the Brent oil price to decline largely due to advancements in low carbon technologies including Evs and digitasation.
• In short, we do not expect oil demand to be much affected by the electric vehicles in the short to medium term. Longer term is harder to predict with the green economy transition, but we suspect that some of the long-term price forecasts that we are seeing are not yet currently forecasting a significant disruptive impact of EVs in the long term Brent oil price.
A crude awakening | Who's driving the oil price?
Source EV penetration Year
OPEC 22% 2040
IMF case 1 93% 2042
IMF case 2 36% 2042
Carbon Tracker and
Grantham Institute
35% 2035
BP 6% 2035
Barclays 26% 2030
Sources: BP Energy Outlook, Barclays Energy & Autos, IMF Riding the Energy Transition, Rethinkx – Rethinking Transportation 2020-2030, Carbon Tracker – Expect the Unexpected
“Short of a nasty war – which itself would bring a price spike but not a recovery – I can’t see any reason for oil prices to go up” Professor Dieter Helm – April 2017
PwC • 9
Brent Oil benchmarking
2A crude awakening | Who's driving the oil price?
PwC • 10
Broker and consultant Brent oil price forecasts (30 June 2017)
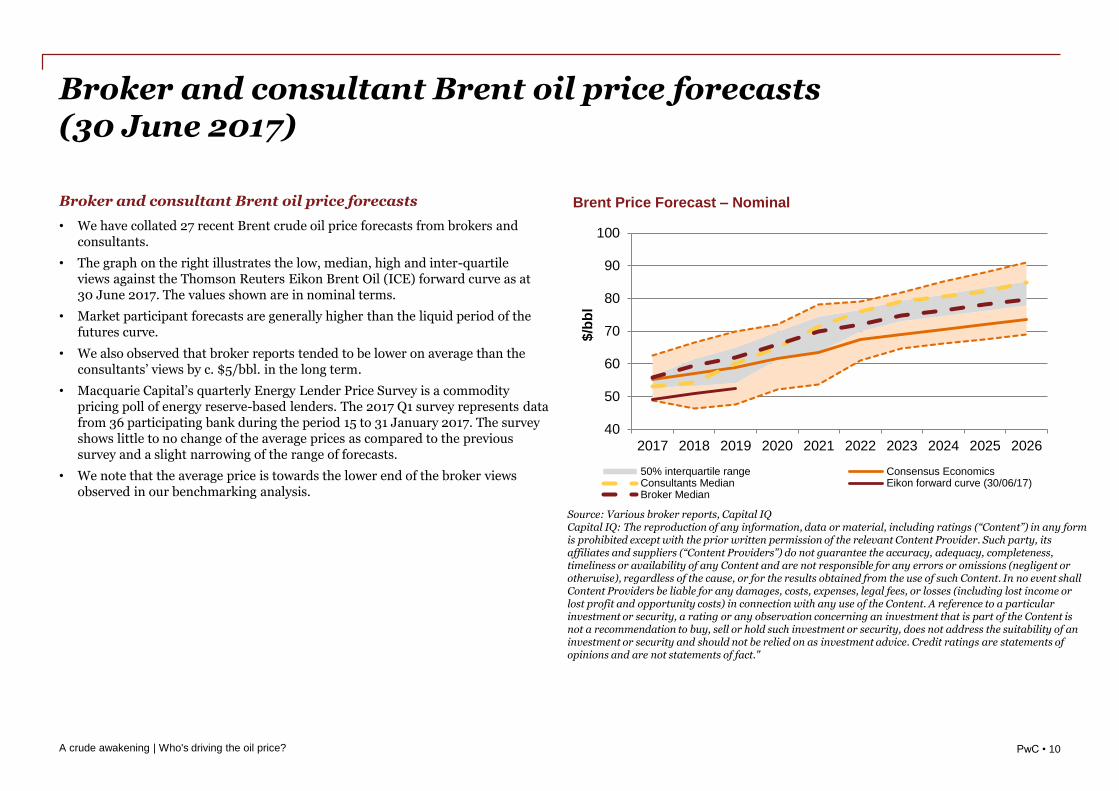
Broker and consultant Brent oil price forecasts
• We have collated 27 recent Brent crude oil price forecasts from brokers and consultants.
• The graph on the right illustrates the low, median, high and inter-quartile views against the Thomson Reuters Eikon Brent Oil (ICE) forward curve as at 30 June 2017. The values shown are in nominal terms.
• Market participant forecasts are generally higher than the liquid period of the futures curve.
• We also observed that broker reports tended to be lower on average than the consultants’ views by c. $5/bbl. in the long term.
• Macquarie Capital’s quarterly Energy Lender Price Survey is a commodity pricing poll of energy reserve-based lenders. The 2017 Q1 survey represents data from 36 participating bank during the period 15 to 31 January 2017. The survey shows little to no change of the average prices as compared to the previous survey and a slight narrowing of the range of forecasts.
• We note that the average price is towards the lower end of the broker views observed in our benchmarking analysis.
A crude awakening | Who's driving the oil price?
Source: Various broker reports, Capital IQCapital IQ: The reproduction of any information, data or material, including ratings (“Content”) in any form is prohibited except with the prior written permission of the relevant Content Provider. Such party, its affiliates and suppliers (“Content Providers”) do not guarantee the accuracy, adequacy, completeness, timeliness or availability of any Content and are not responsible for any errors or omissions (negligent or otherwise), regardless of the cause, or for the results obtained from the use of such Content. In no event shall Content Providers be liable for any damages, costs, expenses, legal fees, or losses (including lost income or lost profit and opportunity costs) in connection with any use of the Content. A reference to a particular investment or security, a rating or any observation concerning an investment that is part of the Content is not a recommendation to buy, sell or hold such investment or security, does not address the suitability of an investment or security and should not be relied on as investment advice. Credit ratings are statements of opinions and are not statements of fact."
40
50
60
70
80
90
100
2017 2018 2019 2020 2021 2022 2023 2024 2025 2026
$/b
bl
Brent Price Forecast – Nominal
50% interquartile range Consensus EconomicsConsultants Median Eikon forward curve (30/06/17)Broker Median
PwC • 11
Broker /Source Date
Original broker
unit 2017 2018 2019 2020 2021 2022 2023 2024 2025 2026
Deutsche Bank 22/06/2017 US$/bbl 54 54 56 58 60 61 n/a n/a n/a n/a
Macquarie 22/06/2017 US$/bbl 54 49 53 65 66 68 69 71 72 74
UBS Research 06/07/2017 US$/bbl 56 60 65 70 70 72 74 75 77 78
Wells Fargo Securities LLC 30/06/2017 US$/bbl 53 58 62 61 n/a n/a n/a n/a n/a n/a
Barclays 06/07/2017 US$/bbl 52 57 63 64 65 n/a n/a n/a n/a n/a
Credit Suisse 28/06/2017 US$/bbl 58 66 68 69 n/a n/a n/a n/a n/a n/a
RBC 16/06/2017 US$/bbl 57 63 67 71 75 79 81 82 84 86
HSBC 03/07/2017 US$/bbl 56 65 70 71 73 74 76 78 79 81
Evercore 16/06/2017 US$/bbl 60 65 n/a n/a n/a n/a n/a n/a n/a n/a
BMO 26/06/2017 US$/bbl 51 53 53 58 63 n/a n/a n/a n/a n/a
JP Morgan 07/07/2017 US$/bbl 55 55 60 66 78 78 79 81 83 84
ING 21/06/2017 US$/bbl 49 46 50 n/a n/a n/a n/a n/a n/a n/a
Societe Generale 19/06/2017 US$/bbl 57 59 65 70 75 n/a n/a n/a n/a n/a
Jefferies 29/06/2017 US$/bbl 56 64 67 70 n/a n/a n/a n/a n/a n/a
ABN AMRO - Consensus Economics 19/06/2017 US$/bbl 58 63 68 n/a n/a n/a n/a n/a n/a n/a
GKI research - Consensus Economics 19/06/2017 US$/bbl 56 61 65 67 70 70 71 73 74 76
Moody's Analytics - Consensus Economics 19/06/2017 US$/bbl 55 59 64 67 70 74 77 80 84 87
BNP Paribas - Consensus Economics 19/06/2017 US$/bbl 62 63 60 63 n/a n/a n/a n/a n/a n/a
Citi Group - Consensus Economics 19/06/2017 US$/bbl 63 60 52 n/a n/a n/a n/a n/a n/a n/a
Commonwealth Bank - Consensus Economics 19/06/2017 US$/bbl 55 52 48 53 55 63 65 66 68 69
Morgan Stanley - Consensus Economics 19/06/2017 US$/bbl 52 52 51 52 54 n/a n/a n/a n/a n/a
GLJ (Consultants) 01/07/2017 US$/bbl 52 55 60 65 69 72 75 78 81 85
Oxford Economics (Consultants) 13/07/2017 US$/bbl 52 52 59 68 75 79 82 85 88 91
EIU (Consultants) 01/07/2017 US$/bbl 54 52 54 58 60 n/a n/a n/a n/a n/a
IHS (Consultants) 14/06/2017 US$/bbl 55 54 62 n/a n/a n/a n/a n/a n/a n/a
McDaniel (Consultants) 01/07/2017 US$/bbl 52 57 61 65 72 76 80 82 83 85
Sproule (Consultants) 31/05/2017 US$/bbl 55 57 67 72 75 77 78 80 81 83
Overall - High US$/bbl 63 66 70 72 78 79 82 85 88 91
Overall - Low US$/bbl 49 46 48 52 54 61 65 66 68 69
Overall - Average US$/bbl 55 57 60 65 68 72 76 78 80 82
Overall - Median US$/bbl 55 57 61 66 70 74 76 79 81 84
Broker - Median US$/bbl 56 59 62 66 70 72 75 76 78 80
Consultants - Median US$/bbl 53 54 60 65 72 76 79 81 82 85
Consensus Economics 19/06/2017 US$/bbl 55 57 59 62 63 68 69 71 72 74
Eikon Forward curve 30/06/2017 US$/bbl 49 51 52 n/a n/a n/a n/a n/a n/a n/a
Benchmarked Overall Median (December 2016) US$/bbl 57 65 68 71 73 77 79 80 82 84
Energy Lender Price Survey (Q1 2017) US$/bbl 46 49 52 54 55 n/a n/a n/a n/a n/a
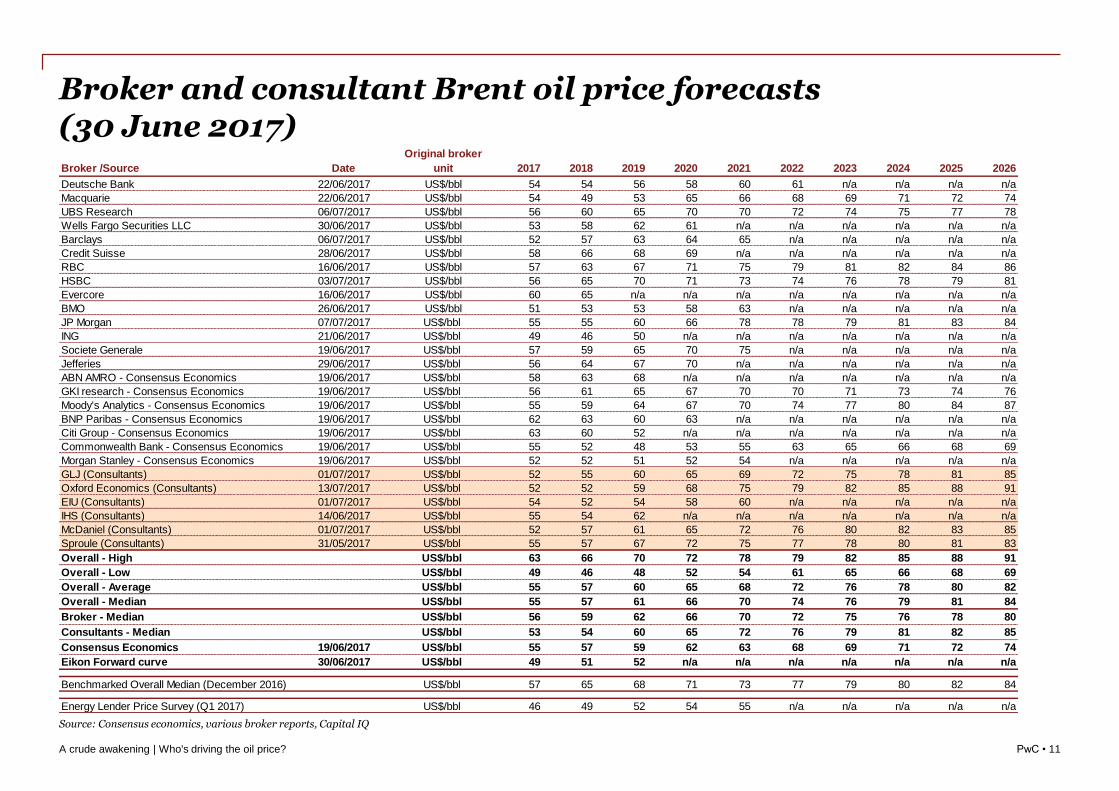
Broker and consultant Brent oil price forecasts (30 June 2017)
Source: Consensus economics, various broker reports, Capital IQ
A crude awakening | Who's driving the oil price?
PwC • 12
WTI benchmarking
3A crude awakening | Who's driving the oil price?
PwC • 13
Broker and consultant WTI oil price forecasts (30 June 2017)
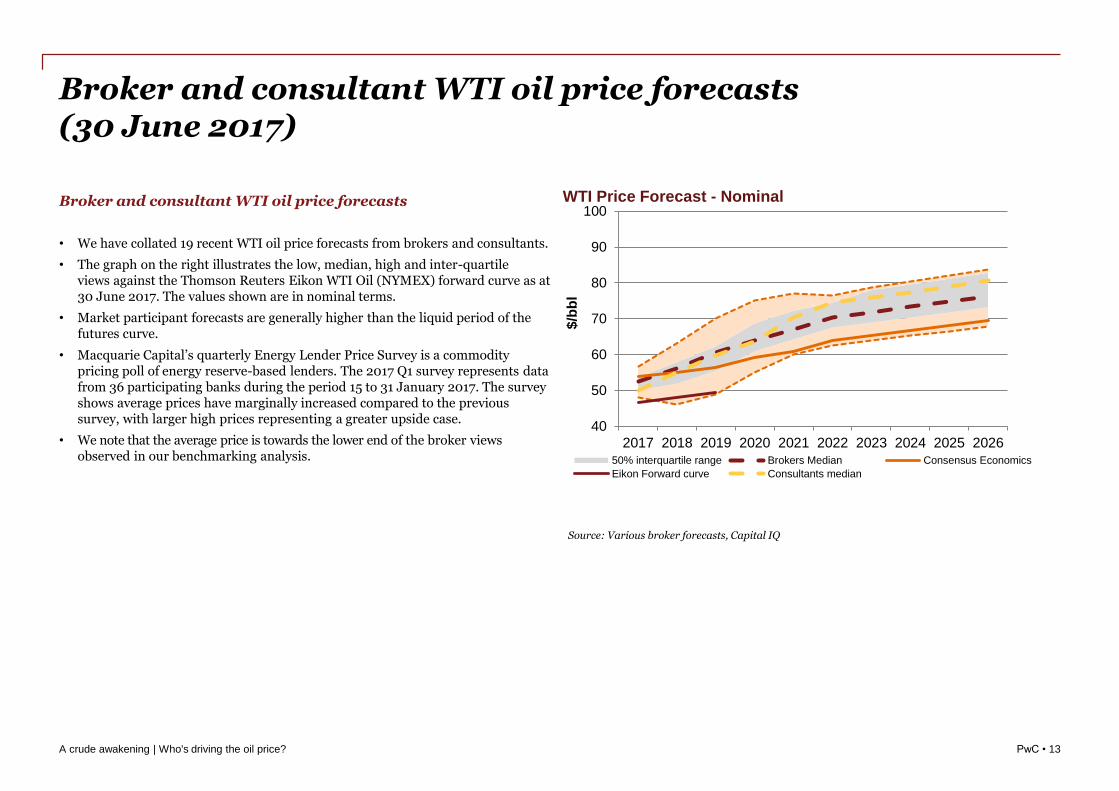
Broker and consultant WTI oil price forecasts
• We have collated 19 recent WTI oil price forecasts from brokers and consultants.
• The graph on the right illustrates the low, median, high and inter-quartile views against the Thomson Reuters Eikon WTI Oil (NYMEX) forward curve as at 30 June 2017. The values shown are in nominal terms.
• Market participant forecasts are generally higher than the liquid period of the futures curve.
• Macquarie Capital’s quarterly Energy Lender Price Survey is a commodity pricing poll of energy reserve-based lenders. The 2017 Q1 survey represents data from 36 participating banks during the period 15 to 31 January 2017. The survey shows average prices have marginally increased compared to the previous survey, with larger high prices representing a greater upside case.
• We note that the average price is towards the lower end of the broker views observed in our benchmarking analysis.
A crude awakening | Who's driving the oil price?
Source: Various broker forecasts, Capital IQ
40
50
60
70
80
90
100
2017 2018 2019 2020 2021 2022 2023 2024 2025 2026
$/b
bl
WTI Price Forecast - Nominal
50% interquartile range Brokers Median Consensus Economics
Eikon Forward curve Consultants median
PwC • 14
Broker /Source Date
Original broker
unit 2017 2018 2019 2020 2021 2022 2023 2024 2025 2026
Deutsche Bank 04/07/2017 US$/bbl 52 51 53 n/a n/a n/a n/a n/a n/a n/a
Wells Fargo 30/06/2017 US$/bbl 55 58 62 n/a n/a n/a n/a n/a n/a n/a
Barclays 03/07/2017 US$/bbl 48 53 n/a n/a n/a n/a n/a n/a n/a n/a
UBS 06/07/2017 US$/bbl 53 57 62 67 67 69 70 71 73 74
HSBC 03/07/2017 US$/bbl 54 63 68 69 71 72 74 75 77 78
Credit Suisse 28/06/2017 US$/bbl 57 63 63 64 65 n/a n/a n/a n/a n/a
Macquarie 02/07/2017 US$/bbl 52 46 49 n/a n/a n/a n/a n/a n/a n/a
RBC 04/07/2017 US$/bbl 55 60 70 75 75 77 78 80 81 83
Morgan Stanley 26/06/2017 US$/bbl 52 57 60 60 n/a n/a n/a n/a n/a n/a
BMO 26/06/2017 US$/bbl 49 50 50 55 60 n/a n/a n/a n/a n/a
Jefferies 21/06/2017 US$/bbl 54 62 65 70 n/a n/a n/a n/a n/a n/a
JP Morgan 26/06/2017 US$/bbl 53 53 58 64 77 76 78 80 81 83
Societe Generale 19/06/2017 US$/bbl 50 55 62 67 72 n/a n/a n/a n/a n/a
ING 21/06/2017 US$/bbl 48 46 50 n/a n/a n/a n/a n/a n/a n/a
GKI Research - Consensus Economics 19/06/2017 US$/bbl 54 58 61 63 67 68 69 70 72 73
Moody's Analytics - Consensus Economics 19/06/2017 US$/bbl 52 55 58 60 62 63 65 66 68 69
Sproule (Consultants) 30/04/2017 US$/bbl 53 55 65 70 73 74 76 77 79 81
McDaniel (Consultants) 01/07/2017 US$/bbl 50 56 60 64 70 75 79 80 82 84
GLJ (Consultants) 01/07/2017 US$/bbl 50 51 55 58 61 63 64 65 67 68
Overall - High US$/bbl 57 63 70 75 77 77 79 80 82 84
Overall - Low US$/bbl 48 46 49 55 60 63 64 65 67 68
Overall - average US$/bbl 52 55 59 65 68 71 72 74 75 77
Overall - median US$/bbl 52 55 60 64 69 72 74 75 77 78
Broker - Median US$/bbl 52 56 61 64 67 70 72 73 75 76
Consultants - Median US$/bbl 50 55 60 64 70 74 76 77 79 81
Consensus Economics 19/06/2017 US$/bbl 54 55 56 59 61 64 65 67 68 69
Eikon Forward curve 30/06/2017 US$/bbl 47 48 49 n/a n/a n/a n/a n/a n/a n/a
Benchmarked Overall Median (December 2016) US$/bbl 55 62 67 71 71 74 76 77 79 80
Energy Lender Price Survey (Q1 2017) US$/bbl 47 49 51 53 54 n/a n/a n/a n/a n/a
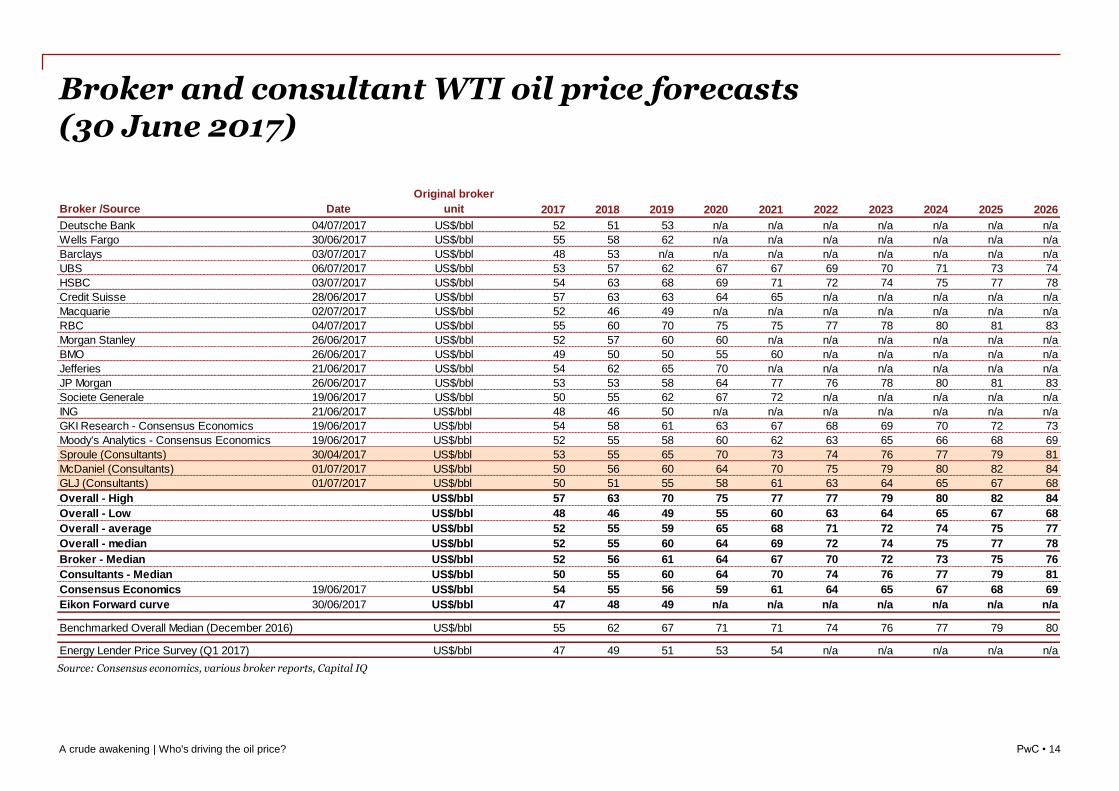
Broker and consultant WTI oil price forecasts (30 June 2017)
Source: Consensus economics, various broker reports, Capital IQ
A crude awakening | Who's driving the oil price?
PwC • 15
Henry Hub benchmarking
4A crude awakening | Who's driving the oil price?
PwC • 16
Broker and consultant Henry Hub gas price forecasts (30 June 2017)
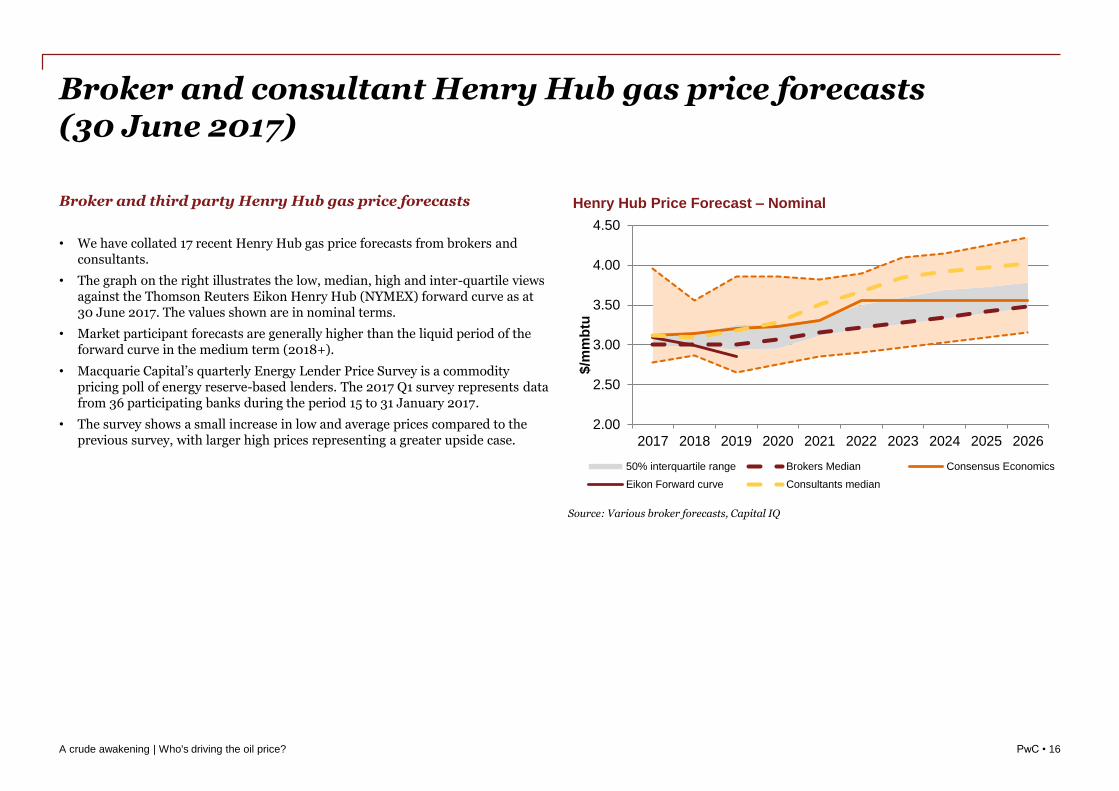
Broker and third party Henry Hub gas price forecasts
• We have collated 17 recent Henry Hub gas price forecasts from brokers and consultants.
• The graph on the right illustrates the low, median, high and inter-quartile views against the Thomson Reuters Eikon Henry Hub (NYMEX) forward curve as at 30 June 2017. The values shown are in nominal terms.
• Market participant forecasts are generally higher than the liquid period of the forward curve in the medium term (2018+).
• Macquarie Capital’s quarterly Energy Lender Price Survey is a commodity pricing poll of energy reserve-based lenders. The 2017 Q1 survey represents data from 36 participating banks during the period 15 to 31 January 2017.
• The survey shows a small increase in low and average prices compared to the previous survey, with larger high prices representing a greater upside case.
A crude awakening | Who's driving the oil price?
Source: Various broker forecasts, Capital IQ
2.00
2.50
3.00
3.50
4.00
4.50
2017 2018 2019 2020 2021 2022 2023 2024 2025 2026
$/m
mb
tu
Henry Hub Price Forecast – Nominal
50% interquartile range Brokers Median Consensus Economics
Eikon Forward curve Consultants median
PwC • 17
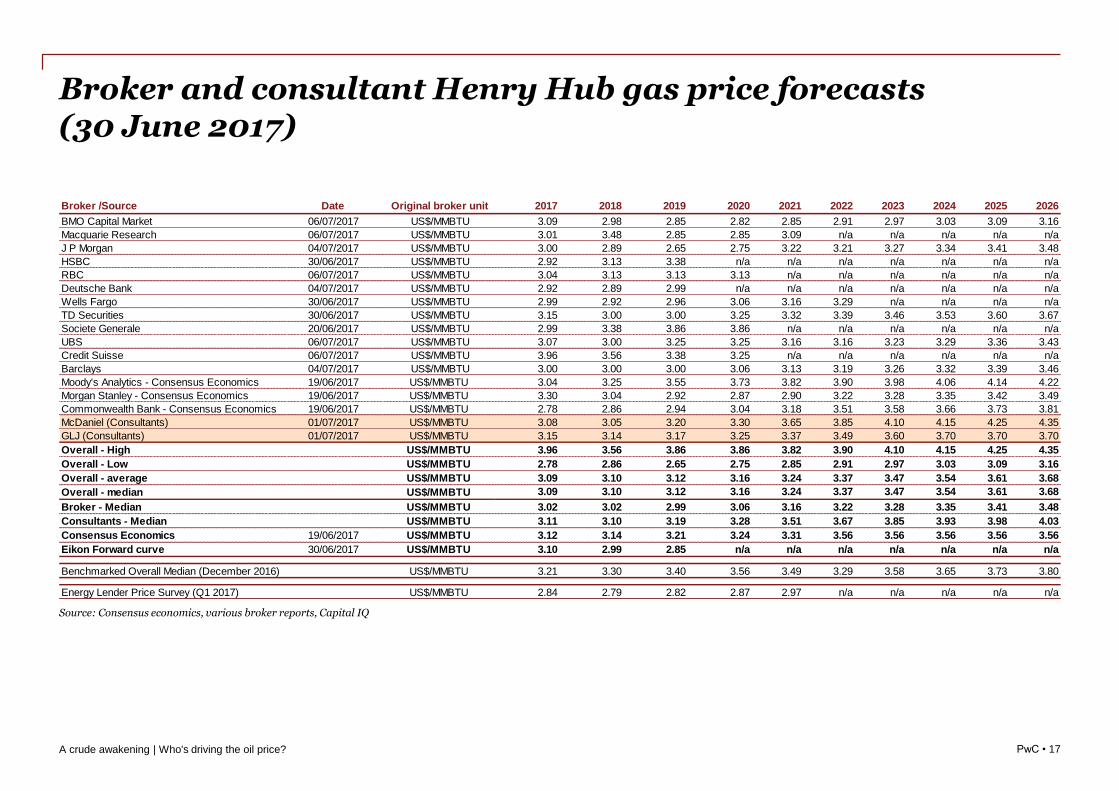
Broker and consultant Henry Hub gas price forecasts (30 June 2017)
Source: Consensus economics, various broker reports, Capital IQ
A crude awakening | Who's driving the oil price?
Broker /Source Date Original broker unit 2017 2018 2019 2020 2021 2022 2023 2024 2025 2026
BMO Capital Market 06/07/2017 US$/MMBTU 3.09 2.98 2.85 2.82 2.85 2.91 2.97 3.03 3.09 3.16
Macquarie Research 06/07/2017 US$/MMBTU 3.01 3.48 2.85 2.85 3.09 n/a n/a n/a n/a n/a
J P Morgan 04/07/2017 US$/MMBTU 3.00 2.89 2.65 2.75 3.22 3.21 3.27 3.34 3.41 3.48
HSBC 30/06/2017 US$/MMBTU 2.92 3.13 3.38 n/a n/a n/a n/a n/a n/a n/a
RBC 06/07/2017 US$/MMBTU 3.04 3.13 3.13 3.13 n/a n/a n/a n/a n/a n/a
Deutsche Bank 04/07/2017 US$/MMBTU 2.92 2.89 2.99 n/a n/a n/a n/a n/a n/a n/a
Wells Fargo 30/06/2017 US$/MMBTU 2.99 2.92 2.96 3.06 3.16 3.29 n/a n/a n/a n/a
TD Securities 30/06/2017 US$/MMBTU 3.15 3.00 3.00 3.25 3.32 3.39 3.46 3.53 3.60 3.67
Societe Generale 20/06/2017 US$/MMBTU 2.99 3.38 3.86 3.86 n/a n/a n/a n/a n/a n/a
UBS 06/07/2017 US$/MMBTU 3.07 3.00 3.25 3.25 3.16 3.16 3.23 3.29 3.36 3.43
Credit Suisse 06/07/2017 US$/MMBTU 3.96 3.56 3.38 3.25 n/a n/a n/a n/a n/a n/a
Barclays 04/07/2017 US$/MMBTU 3.00 3.00 3.00 3.06 3.13 3.19 3.26 3.32 3.39 3.46
Moody's Analytics - Consensus Economics 19/06/2017 US$/MMBTU 3.04 3.25 3.55 3.73 3.82 3.90 3.98 4.06 4.14 4.22
Morgan Stanley - Consensus Economics 19/06/2017 US$/MMBTU 3.30 3.04 2.92 2.87 2.90 3.22 3.28 3.35 3.42 3.49
Commonwealth Bank - Consensus Economics 19/06/2017 US$/MMBTU 2.78 2.86 2.94 3.04 3.18 3.51 3.58 3.66 3.73 3.81
McDaniel (Consultants) 01/07/2017 US$/MMBTU 3.08 3.05 3.20 3.30 3.65 3.85 4.10 4.15 4.25 4.35
GLJ (Consultants) 01/07/2017 US$/MMBTU 3.15 3.14 3.17 3.25 3.37 3.49 3.60 3.70 3.70 3.70
Overall - High US$/MMBTU 3.96 3.56 3.86 3.86 3.82 3.90 4.10 4.15 4.25 4.35
Overall - Low US$/MMBTU 2.78 2.86 2.65 2.75 2.85 2.91 2.97 3.03 3.09 3.16
Overall - average US$/MMBTU 3.09 3.10 3.12 3.16 3.24 3.37 3.47 3.54 3.61 3.68
Overall - median US$/MMBTU 3.09 3.10 3.12 3.16 3.24 3.37 3.47 3.54 3.61 3.68
Broker - Median US$/MMBTU 3.02 3.02 2.99 3.06 3.16 3.22 3.28 3.35 3.41 3.48
Consultants - Median US$/MMBTU 3.11 3.10 3.19 3.28 3.51 3.67 3.85 3.93 3.98 4.03
Consensus Economics 19/06/2017 US$/MMBTU 3.12 3.14 3.21 3.24 3.31 3.56 3.56 3.56 3.56 3.56
Eikon Forward curve 30/06/2017 US$/MMBTU 3.10 2.99 2.85 n/a n/a n/a n/a n/a n/a n/a
Benchmarked Overall Median (December 2016) US$/MMBTU 3.21 3.30 3.40 3.56 3.49 3.29 3.58 3.65 3.73 3.80
Energy Lender Price Survey (Q1 2017) US$/MMBTU 2.84 2.79 2.82 2.87 2.97 n/a n/a n/a n/a n/a
PwC • 18
NBP benchmarking
5A crude awakening | Who's driving the oil price?
PwC • 19
Broker and consultant NBP gas price forecasts (30 June 2017)
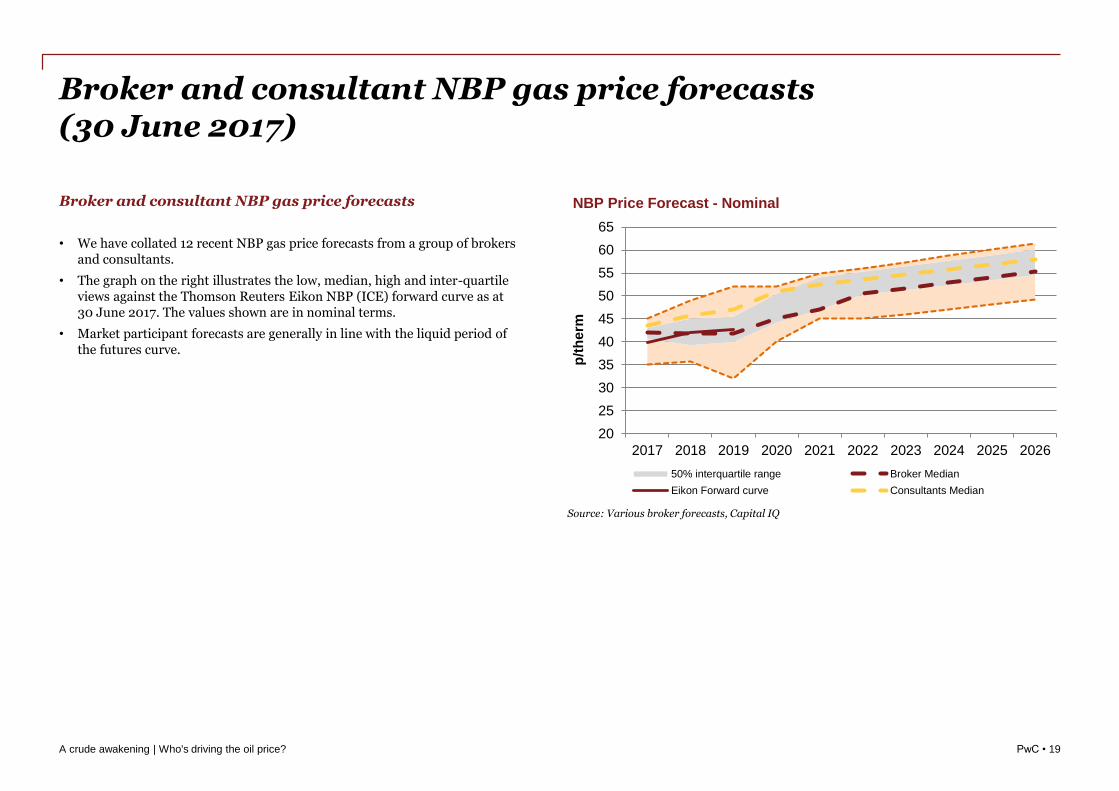
Broker and consultant NBP gas price forecasts
• We have collated 12 recent NBP gas price forecasts from a group of brokers and consultants.
• The graph on the right illustrates the low, median, high and inter-quartile views against the Thomson Reuters Eikon NBP (ICE) forward curve as at 30 June 2017. The values shown are in nominal terms.
• Market participant forecasts are generally in line with the liquid period of the futures curve.
A crude awakening | Who's driving the oil price?
Source: Various broker forecasts, Capital IQ
20
25
30
35
40
45
50
55
60
65
2017 2018 2019 2020 2021 2022 2023 2024 2025 2026
p/t
he
rm
NBP Price Forecast - Nominal
50% interquartile range Broker Median
Eikon Forward curve Consultants Median
PwC • 20
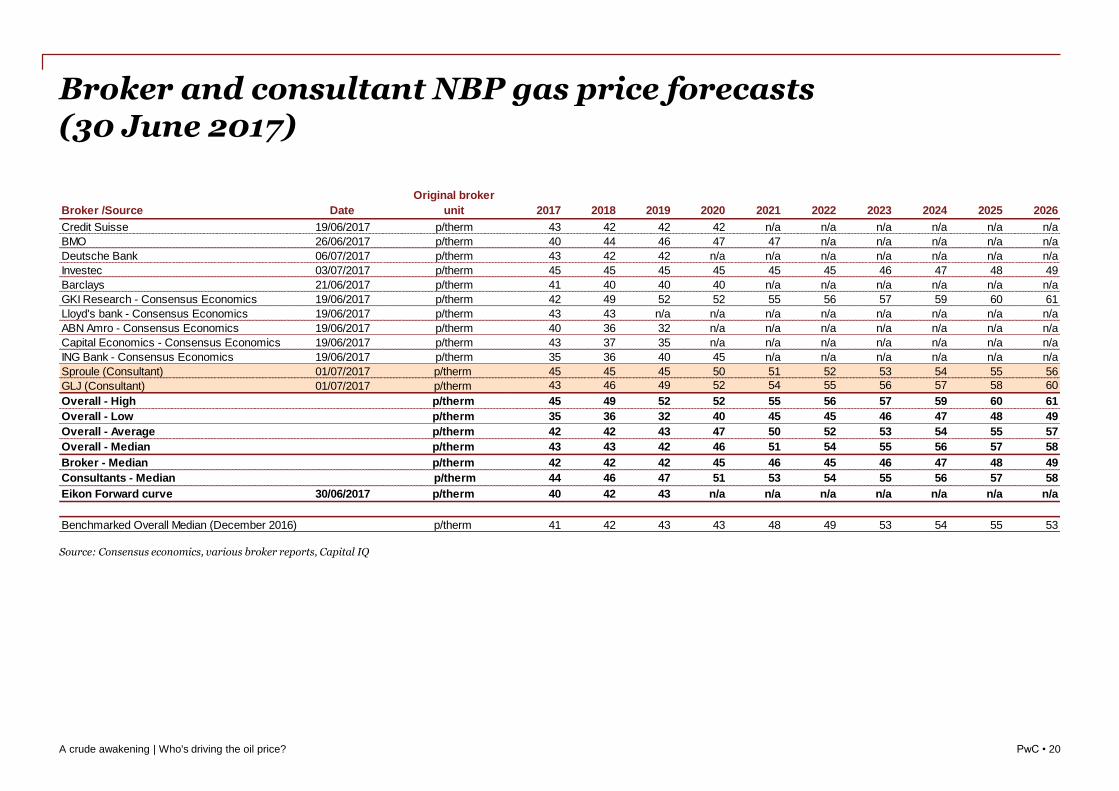
Broker and consultant NBP gas price forecasts (30 June 2017)
Source: Consensus economics, various broker reports, Capital IQ
Broker /Source Date
Original broker
unit 2017 2018 2019 2020 2021 2022 2023 2024 2025 2026
Credit Suisse 19/06/2017 p/therm 43 42 42 42 n/a n/a n/a n/a n/a n/a
BMO 26/06/2017 p/therm 40 44 46 47 47 n/a n/a n/a n/a n/a
Deutsche Bank 06/07/2017 p/therm 43 42 42 n/a n/a n/a n/a n/a n/a n/a
Investec 03/07/2017 p/therm 45 45 45 45 45 45 46 47 48 49
Barclays 21/06/2017 p/therm 41 40 40 40 n/a n/a n/a n/a n/a n/a
GKI Research - Consensus Economics 19/06/2017 p/therm 42 49 52 52 55 56 57 59 60 61
Lloyd's bank - Consensus Economics 19/06/2017 p/therm 43 43 n/a n/a n/a n/a n/a n/a n/a n/a
ABN Amro - Consensus Economics 19/06/2017 p/therm 40 36 32 n/a n/a n/a n/a n/a n/a n/a
Capital Economics - Consensus Economics 19/06/2017 p/therm 43 37 35 n/a n/a n/a n/a n/a n/a n/a
ING Bank - Consensus Economics 19/06/2017 p/therm 35 36 40 45 n/a n/a n/a n/a n/a n/a
Sproule (Consultant) 01/07/2017 p/therm 45 45 45 50 51 52 53 54 55 56
GLJ (Consultant) 01/07/2017 p/therm 43 46 49 52 54 55 56 57 58 60
Overall - High p/therm 45 49 52 52 55 56 57 59 60 61
Overall - Low p/therm 35 36 32 40 45 45 46 47 48 49
Overall - Average p/therm 42 42 43 47 50 52 53 54 55 57
Overall - Median p/therm 43 43 42 46 51 54 55 56 57 58
Broker - Median p/therm 42 42 42 45 46 45 46 47 48 49
Consultants - Median p/therm 44 46 47 51 53 54 55 56 57 58
Eikon Forward curve 30/06/2017 p/therm 40 42 43 n/a n/a n/a n/a n/a n/a n/a
Benchmarked Overall Median (December 2016) p/therm 41 42 43 43 48 49 53 54 55 53
A crude awakening | Who's driving the oil price?
This publication has been prepared for general guidance on matters of interest only, and
does not constitute professional advice. You should not act upon the information contained in
this publication without obtaining specific professional advice. No representation or warranty
(express or implied) is given as to the accuracy or completeness of the information contained
in this publication, and, to the extent permitted by law, PricewaterhouseCoopers LLP, its
members, employees and agents do not accept or assume any liability, responsibility or duty
of care for any consequences of you or anyone else acting, or refraining to act, in reliance on
the information contained in this publication or for any decision based on it.
© 2017 PricewaterhouseCoopers LLP. All rights reserved. In this document, "PwC" refers to
the UK member firm, and may sometimes refer to the PwC network. Each member firm is a
separate legal entity. Please see www.pwc.com/structure for further details.
170804-104733-CB-UK
Jacqueline ChowDirector – ValuationsEnergy, Utilities, Mining & Infrastructure+44 7818 427 [email protected]
Mayank SharmaSenior Associate – ValuationsEnergy, Utilities, Mining & Infrastructure+44 7718 979 [email protected]
Chris BallerAssociate – ValuationsEnergy, Utilities, Mining & Infrastructure+44 7718 978 [email protected]
A crude awakening | Who's driving the oil price?