Embed Size (px)
Citation preview

A country-level genetic survey of the IUCN critically endangered western chimpanzee (Pan troglodytes verus) in Guinea-Bissau
Filipa Franco da Silva Borges
Master’s Degree in Biodiversity, Genetics and Evolution CIBIO-InBIO (Research Center in Biodiversity and Genetic Resources)/Department of Biology, University of Porto 2017
Supervisor Maria Joana Ferreira da Silva, Postdoctoral Researcher, CIBIO-InBIO/CAPP/Cardiff University


Todas as correções determinadas pelo júri, e só essas, foram efetuadas. O Presidente do Júri,
Porto, ______/______/_________

Mílios
“What makes the desert beautiful, said the little prince,
is that somewhere it hides a well…”
Antoine de Saint-Exupéry, in The Little Prince


FCUP A country-level genetic survey of the IUCN critically endangered western chimpanzee (Pan troglodytes
verus) in Guinea-Bissau
vii
Acknowledgements
I remember my father saying the stars always shined brighter in the little village where he was from.
It was not until later that I have fully understood what he meant by that. Every day my heart has
shined throughout this year. That certainly would not have been the case had I not been surrounded
by so many people that contributed, in so many different ways, to make this project so meaningful
and successful. I could not, thus, finish this journey without expressing my deepest and most sincere
thank you to:
My supervisor, Joana Silva, for giving me the chance to be part of such an amazing project.
For teaching me so much more than I could have hoped for. For always encouraging me to go
further. And for pulling me off for air when I needed to breathe. For giving me enough space to
fly on my own. And for always being ready to hold my hand and stop me from falling. For
believing in me. For trusting me. For always valuing my thoughts and ideas. It has been a
privilege to have that huge passion of yours shared with me. And it has been even a bigger
privilege to walk this path by your side for a whole year.
Isa Pais, for having shared so much experience and wisdom with me. For always being
available to discuss all my questions and concerns. For becoming a friend in such a short
time. And, most of all, for inspiring me. That huge smile of yours could light up the whole
world.
Professor Michael W. Bruford, Professor Catarina Casanova, and Professor Tânia Minhós, for
being a key element of this project since its very beginning.
Susana Lopes, Diana Castro, Patrícia Ribeiro, Sofia Mourão, and everyone at CTM, CIBIO-
InBIO, for all the support during the laboratory work.
Dr. Lounès Chikhi and all the Population and Conservation Genetics group, at Instituto
Gulbenkian de Ciência, for making me feel so welcome and for all the advices and support. I
will always cherish the time I have spent with you at IGC.
Professor Rui Sá, for having facilitated the genotypes and raw files for the broad scale
analyses, without which we could not have done this work, and for all the logistical support
during our stay in Bissau.
Dr. Mafalda Costa and Dr. Isa-Rita Russo, for having provided the laboratory supplies used for
this study.
The Guinea-Bissau governmental agencies Direcção Geral de Florestas e Fauna and Instituto
da Biodiversidade e das Áreas Protegidas (IBAP), for samples exportation permits and
logistical support during fieldwork. We are very grateful for all the help provided by IBAP’s
staff, in particular by Abel Vieira, Benjamim, Dr. Augusto Cá, Dr. Joãozinho Mané, Dr. Aissa
Regala, Dr. Abilio Said, and Dr. Alfredo Simão da Silva. The NGOs CHIMBO and Acção para
o Desenvolvimento, for the logistical support during fieldwork. We are extremely grateful for all
the support and care provided by the European Union-Bissau, in particular for the practical

FCUP A country-level genetic survey of the IUCN critically endangered western chimpanzee (Pan troglodytes
verus) in Guinea-Bissau
viii
help, (many) words of encouragement, tasty meals, and excellent example of problem solving
by Dr. Helena Foito and Dr. Vitor Santos. The project is very grateful for the work of the field
assistants Sadjo Camará and Mamadu Soares, and of the all the guards and guides of Cufada
Lagoons Natural Park, namely Idrissa Camará, Umaru Galissa, Agostinho, Bakari, Mussa,
Bafodê, Abu, Denba, and Mussa de Bubatchingue, and of all the guards and guides of
Dulombi National Park. We would like to acknowledge the amazing work of the research
assistants Mamadú Djaló and Nelson Fernandes, and the logistical support at Bissau provided
by Isabella Espinosa, Helena Foito, Dr. Aissa Regala, Rui Sá, and J. Huet.
Instituto da Conservação da Natureza e das Florestas (ICNF), Portugal, for the samples
importation permits.
My mom and my dad. I wish I could fit the whole world in a sentence, because that is how
much I want to thank you for. Instead, I choose to thank you for the most beautiful thing in it. I
thank you for the love. You taught me the greatest lessons I have ever learned. I am forever
thankful.
My brothers, Bruno and Ivo, for being my safe haven since the day I was born. You are
extraordinary in everything you do. I could not have asked for a better example in life.
Cátia, Céline, Daniela, Gatões, Lara, Maria, Rita, Sophia, and Sté. It has been a privilege to
grow up next to people I admire so much for all these years now. How lucky am I that I can
count my best friends on both hands?
Each of the eighteen amazing scientists that started this master’s adventure with me two
years ago. You made it all worth it.
All my family and friends, for being home to me every single day.
Field and laboratory work was supported by The Born Free Foundation, Chester Zoo Conservation
and Research Grant, Primate Conservation Incorporated (Ref: PCI# 1400), and Portuguese Science
and Technology Foundation (FCT), through the project: PRIMATOMICS (PTDC/IVC-
ANT/3058/2014). MJFS worked under a FCT postdoctoral fellowship (SFRH/BPD/88496/2012),
funded by Ministério da Educação e Ciência and European Social Funds through POPH – QREN –
Tipologia 4.1 Formação Avançada. The field and laboratory work to collect and generate the
genotypes by R. Sá was supported by the U.S. Fish and Wildlife Service Great Apes Conservation
Fund (2010-2011, Ref. GA-0678).

FCUP A country-level genetic survey of the IUCN critically endangered western chimpanzee (Pan troglodytes
verus) in Guinea-Bissau
ix
This dissertation should be cited as: Borges, F. (2017) A country-level genetic survey
of the IUCN critically endangered western chimpanzee (Pan troglodytes verus) in
Guinea-Bissau. MSc thesis, 159 pp. University of Porto, Portugal.

FCUP A country-level genetic survey of the IUCN critically endangered western chimpanzee (Pan troglodytes
verus) in Guinea-Bissau
x
Abstract
Guinea-Bissau is considered one of the most important areas for the global
conservation of the IUCN critically endangered western chimpanzee (Pan troglodytes
verus). Rapid deforestation, habitat fragmentation, and hunting for pet trade threaten
this subspecies in the country, which is further augmented by an atmosphere of
political instability and a low level of human development. The lack of baseline
information was hindering the development of a complete assessment of the viability
and conservation status of P. t. verus.
The present study used 665 non-invasively collected faecal samples from five different
geographic populations in Guinea-Bissau and a fragment of the mitochondrial DNA
control region, a set of 21 autosomal microsatellite markers, and one Y-chromosome-
associated microsatellite locus to assess genetic diversity and population structure,
and to examine signatures of recent demographic history. A total of 185 unique
genotypes and 165 mitochondrial DNA sequences were obtained and used in the
analyses.
The results for all types of genetic markers suggested that gene flow between the
chimpanzee population inhabiting Boé National Park and the coastal areas of Guinea-
Bissau is limited. This result is in accordance to what had been found for the
populations of baboons in the country. To assure this population does not go extinct, it
is essential to recover the ecological corridors linking it to the southern part of Guinea-
Bissau.
The patterns of population structure unravelled across the country were not strong,
which suggests chimpanzees tend to disperse across almost all of their range.
Contrary to what had been previously found for the majority of chimpanzee
populations, males do not seem to be strictly philopatric in Guinea-Bissau. Evidences
of population subdivision within Guinea-Bissau have been found based on the
mitochondrial DNA marker, which is in agreement to the evolutionary history of the
western chimpanzee clade.
A fine-scale analysis has been conducted to assess whether there is gene flow
between the chimpanzee populations at Cufada Lagoons Natural Park and at Dulombi
National Park. Dispersal between these populations seems to follow a pattern of
isolation by distance, although the Corubal River, which is located between them,
probably constitutes a relevant barrier to dispersal. This analysis showed a relatively

FCUP A country-level genetic survey of the IUCN critically endangered western chimpanzee (Pan troglodytes
verus) in Guinea-Bissau
xi
high degree of genetic variation within Cufada, which may occur due to the presence of
immigrants in the population.
The results of this study suggest that human-related barriers to dispersal, such as
roads and villages, may be negatively impacting chimpanzees’ dispersal across the
country. The subtle degree of genetic structure found at a broad scale, along with the
patterns unravelled at the fine-scale analysis, suggests that local-scale studies may be
used as a powerful method to detect potential barriers to dispersal at an early stage,
which may help plan management actions more efficiently.
The present research constituted the most complete genetic survey of chimpanzees in
Guinea-Bissau to date and highlighted the need to enhance law enforcement and to
work alongside local communities to improve chimpanzee conservation in the future.
Keywords: Western chimpanzee, Guinea-Bissau, Non-invasive sampling,
Conservation genetics, Mitochondrial DNA, Microsatellites, Genetic diversity,
Population structure, Demographic history, Gene flow.

FCUP A country-level genetic survey of the IUCN critically endangered western chimpanzee (Pan troglodytes
verus) in Guinea-Bissau
xii
Resumo
A Guiné-Bissau é considerada uma das áreas mais importantes, a nível global, para a
conservação do chimpanzé-ocidental (Pan troglodytes verus), classificado como
estando em perigo crítico de extinção pela IUCN. As principais ameaças a esta
subespécie no país são desflorestação rápida, fragmentação de habitat e caça para
tráfico como animal de estimação, o que é agravado por uma atmosfera de
instabilidade política e um baixo nível de desenvolvimento humano. A falta de
informação de base estava a impedir o desenvolvimento de uma avaliação completa
da viabilidade e estado de conservação da subespécie.
O presente estudo utilizou 665 amostras fecais recolhidas de forma não-invasiva em
cinco populações geográficas na Guiné-Bissau, assim como um fragmento da região
controlo do ADN mitocondrial, um conjunto de 21 microssatélites autossómicos e um
microssatélite associado ao cromossoma Y para avaliar a diversidade genética,
estrutura populacional e história demográfica recente. Um total de 185 genótipos
únicos e 165 sequências de ADN mitocondrial foram obtidos e utilizados nas análises.
Os resultados de todos os tipos de marcadores genéticos sugeriram que o fluxo génico
entre a população de chimpanzés do Parque Nacional de Boé e as áreas costeiras da
Guiné-Bissau é limitado. Este resultado vai de encontro ao que havia sido proposto
para as populações de babuínos do país. De forma a assegurar que esta população
não é extinta, é essencial recuperar os corredores ecológicos que a ligam à zona mais
a Sul da Guiné-Bissau.
Os padrões de estrutura populacional no país não se revelaram marcados, o que
sugere que os chimpanzés tendem a dispersar ao longo de quase toda a sua área de
distribuição. Ao contrário dos resultados publicados para a maioria das populações de
chimpanzés, os machos parecem não ser estritamente filopátricos na Guiné-Bissau.
Evidências de subdivisão da população da Guiné-Bissau foram encontradas com base
no ADN mitocondrial, o que está de acordo com a história evolucionária do clade do
chimpanzé-ocidental.
Foi realizada uma análise a uma escala menor para examinar se existiria ou não fluxo
génico entre as populações de chimpanzés do Parque Natural das Lagoas de Cufada
e do Parque Nacional de Dulombi. Dispersão entre estas populações parece seguir um
padrão de isolamento por distância, apesar de ser provável que o Rio Corubal, que se
localiza entre as duas, constitua uma relevante barreira à dispersão. Esta análise

FCUP A country-level genetic survey of the IUCN critically endangered western chimpanzee (Pan troglodytes
verus) in Guinea-Bissau
xiii
revelou um nível elevado de variação genética na Cufada, o que poderá ocorrer devido
à presença de imigrantes na população.
Os resultados deste estudo sugerem que as barreiras à dispersão relacionadas com a
actividade humana, como estradas e aglomerados populacionais, poderão ter um
impacto negativo sobre a dispersão dos chimpanzés no país. Para além do nível de
estrutura genética subtil encontrado à escala nacional, os padrões revelados a uma
escala menor sugerem que estudos a uma escala local poderão ser utilizados como
um método robusto para detectar potenciais barreiras à dispersão numa fase inicial, o
que poderá ajudar a planear medidas de gestão de forma mais eficiente.
A presente investigação constituiu o mais completo estudo genético de chimpanzés na
Guiné-Bissau realizado até ao momento e enfatizou a necessidade de efectivar a
aplicação da lei e de trabalhar em cooperação com as comunidades locais para
melhorar a conservação do chimpanzé no futuro.
Palavras-chave: Chimpanzé-ocidental, Guiné-Bissau, Amostragem não-invasiva,
Genética da conservação, ADN mitocondrial, Microssatélites, Diversidade genética,
Estrutura populacional, História demográfica, Fluxo génico.

FCUP A country-level genetic survey of the IUCN critically endangered western chimpanzee (Pan troglodytes
verus) in Guinea-Bissau
xiv
Table of Contents
Acknowledgements ............................................................................................................................. vii
Abstract ................................................................................................................................................. x
Resumo ............................................................................................................................................... xii
Table of Contents ............................................................................................................................... xiv
List of Tables ..................................................................................................................................... xvii
List of Figures ...................................................................................................................................... xx
List of Abbreviations ......................................................................................................................... xxvi
1. Introduction ................................................................................................................................. 29
1.1. Biodiversity in West Africa and primates’ conservation ........................................................ 29
1.2. The common chimpanzee (Pan troglodytes) ....................................................................... 29
1.3. The western chimpanzee (Pan troglodytes verus) in Guinea-Bissau .................................. 32
1.3.1. Cufada Lagoons Natural Park .................................................................................... 34
1.3.2. Cantanhez Forest National Park ................................................................................ 35
1.3.3. Complex Dulombi-Boé-Tchetche ............................................................................... 36
1.4. Population and conservation genetics ................................................................................. 37
1.5. Non-invasive sampling ......................................................................................................... 37
1.6. Microsatellite markers .......................................................................................................... 38
1.7. Mitochondrial DNA markers ................................................................................................. 40
1.8. Past genetic studies on chimpanzees .................................................................................. 40
1.9. Relevance, research questions, and hypotheses ................................................................ 42
2. Materials and Methods ................................................................................................................ 45
2.1. Study Area ........................................................................................................................... 45
2.2. Genetic Data ........................................................................................................................ 46
2.2.1. Genetic data generated by the present study ............................................................ 46
2.2.1.1. Sampling ................................................................................................................ 46
2.2.1.2. DNA Extraction....................................................................................................... 47
2.2.1.3. Genetic markers ..................................................................................................... 48
2.2.1.3.1. Mitochondrial DNA ........................................................................................... 49
2.2.1.3.1.1. DNA barcoding .......................................................................................... 49
2.2.1.3.1.2. Mitochondrial DNA control region ............................................................. 50
2.2.1.3.2. Sex molecular determination ............................................................................ 52
2.2.1.3.3. Microsatellite loci .............................................................................................. 52
2.2.1.4. Optimisation of the microsatellite loci multiplex PCR ............................................. 52
2.2.1.5. Genotyping, quality control, and identification of repeated genotypes ................... 55
2.2.1.5.1. Genotyping ....................................................................................................... 55
2.2.1.5.2. Quality control procedures ............................................................................... 56
2.2.1.5.3. Detection of repeated individuals ..................................................................... 59
2.2.2. Genetic data produced by Sá (2013) ......................................................................... 60
2.2.3. Merging the mitochondrial DNA datasets ................................................................... 61

FCUP A country-level genetic survey of the IUCN critically endangered western chimpanzee (Pan troglodytes
verus) in Guinea-Bissau
xv
2.2.4. Merging the datasets of genotypes ............................................................................ 61
2.2.4.1. Quality control procedures and identification of repeated genotypes .................... 63
2.3. Genetic diversity, population structure, and demographic history at a broad geographic
scale in Guinea-Bissau ................................................................................................................... 64
2.3.1. Genetic diversity ......................................................................................................... 64
2.3.2. Population structure ................................................................................................... 65
2.3.3. Demographic history .................................................................................................. 68
2.4. Genetic diversity and estimation of population structure at a geographic fine-scale in
Guinea-Bissau................................................................................................................................. 70
3. Results ........................................................................................................................................ 72
3.1. Genetic data generated by the present study ...................................................................... 72
3.1.1. DNA Extraction ........................................................................................................... 72
3.1.2. DNA Barcoding .......................................................................................................... 72
3.1.3. Mitochondrial DNA control region .............................................................................. 73
3.1.4. Microsatellite loci ........................................................................................................ 73
3.1.4.1. Genotyping, quality control procedures, and identification of repeated genotypes 73
3.1.5. Molecular sex determination ...................................................................................... 77
3.2. Merging datasets .................................................................................................................. 77
3.2.1. Mitochondrial DNA control region .............................................................................. 77
3.2.2. Microsatellite loci ........................................................................................................ 78
3.3. Genetic diversity, population structure, and demographic history at a broad geographic
scale in Guinea-Bissau ................................................................................................................... 82
3.3.1. Genetic diversity ......................................................................................................... 82
3.3.2. Population structure ................................................................................................... 84
3.3.3. Demographic history ................................................................................................ 102
3.4. Genetic diversity and population structure at a geographic fine-scale in Guinea-Bissau .. 105
4. Discussion ................................................................................................................................. 112
4.1. Overview of main results, limitations, and further research ............................................... 112
4.1.1. Laboratory procedures, genotypes quality, and sample selection ........................... 112
4.1.2. Genetic Diversity ...................................................................................................... 114
4.1.3. Population structure ................................................................................................. 115
4.1.3.1. Patterns of gene flow, potential barriers to dispersal, and population isolation ... 115
4.1.3.2. Sex-specific dispersal patterns ............................................................................ 119
4.1.3.3. Fine-scale analysis in CLNP and DNP................................................................. 121
4.1.4. Demographic history ................................................................................................ 122
4.1.5. Further research ....................................................................................................... 123
4.2. Conservation considerations .............................................................................................. 124
5. Concluding Remarks ................................................................................................................. 127
6. References ................................................................................................................................ 128
7. Supplementary Material ............................................................................................................ 148

FCUP A country-level genetic survey of the IUCN critically endangered western chimpanzee (Pan troglodytes
verus) in Guinea-Bissau
xvi

FCUP A country-level genetic survey of the IUCN critically endangered western chimpanzee (Pan troglodytes
verus) in Guinea-Bissau
xvii
List of Tables
Table I. Details on the four primer pairs used for mitochondrial DNA barcoding of the samples
included in the study: mitochondrial region – cytochrome c oxidase subunit I (COI), cytochrome b,
and ribosomal subunit 12S –, primers and respective sequences, and references. ........................... 50
Table II. Details on the primer pair amplifying a fragment of the mitochondrial DNA control region,
previously used by Sá (2013). ............................................................................................................. 51
Table III. Description of the five Multiplex Polymerase Chain Reactions after the optimisation
process. Annealing temperature (AT), loci in each multiplex, primer sequences, repeat type/motif,
fluorescent dye, and final PCR concentration (C). N.A. – not applicable. Repeat types identified with
a “4” refer to tetranucleotide loci for which the repetition motifs have not been identified. Note that
amelogenin was the molecular method used to determine the sex of the samples and is not a
microsatellite locus (see section 2.2.1.3.2.). ....................................................................................... 54
Table IV. Summary diversity statistics for the 21 autosomal microsatellite loci used: N (sample size);
Na (number of different alleles); Ne (effective number of alleles); HO (observed heterozygosity); HE
(expected heterozygosity); HWE (Hardy-Weinberg equilibrium); Bonferroni (significance adjusted by
the Bonferroni correction for multiple comparisons); FIS (inbreeding coefficient). Loci in non-
conformity to HWE are in bold and significance accounts for the Bonferroni correction. .................... 75
Table V. Summary diversity statistics for the 10 autosomal microsatellite loci used: N (sample size);
Na (number of different alleles); Ne (effective number of alleles); HO (observed heterozygosity); HE
(expected heterozygosity); HWE (Hardy-Weinberg equilibrium); Bonferroni (significance adjusted by
the Bonferroni correction for multiple comparisons); FIS (inbreeding coefficient). Loci in non-
conformity to HWE are in bold and significance accounts for the Bonferroni’s correction for multiple
comparisons. ....................................................................................................................................... 79
Table VI. Genetic diversity statistics using the mtDNA sequences: N (number of sequences); nH
(number of haplotypes); Hd (haplotype diversity); S (number of polymorphic sites); (nucleotide
diversity). Standard deviations are between brackets. ........................................................................ 83
Table VII. Mean summary diversity statistics for the five geographic populations and the overall
dataset: N (sample size); Na (number of different alleles); Ne (effective number of alleles); HO
(observed heterozygosity); HE (expected heterozygosity); FIS (inbreeding coefficient). Standard errors
are between brackets. ......................................................................................................................... 83
Table VIII. Pairwise fixation index (FST) values. Significant values (p < 0.05) are marked with an
asterisk (*). N corresponds to the number of samples used per geographic population. Downer
diagonal (left part of the table) corresponds to mtDNA and upper diagonal (right part of the table)
corresponds to microsatellites data. .................................................................................................... 84
Table IX. AMOVA results. The p-value indicates the probability of finding a more extreme variance
component and FST value than observed by chance alone after 10,000 permutations. ...................... 85

FCUP A country-level genetic survey of the IUCN critically endangered western chimpanzee (Pan troglodytes
verus) in Guinea-Bissau
xviii
Table X. Mean summary diversity statistics for the two clusters identified based on the STRUCTURE
analysis: N (sample size); Na (number of different alleles); Ne (effective number of alleles); HO
(observed heterozygosity); HE (expected heterozygosity); FIS (inbreeding coefficient). Standard errors
are between brackets. ......................................................................................................................... 91
Table XI. AMOVA results for the Y-linked microsatellite marker. The p-value indicates the probability
of finding a more extreme variance component and FST value than observed by chance alone after
10,000 permutations. ........................................................................................................................ 102
Table XII. Statistical indices calculated to analyse demographic history: Tajima’s D, Fu’s Fs. Fu and
Li’s D*, Fu and Li’s F*, and Ramos-Onsins and Rozas’ R2. N is the number of samples used per
sampling site. Significant values are indicated by one asterisk (*; p < 0.05) or two asterisks (**; p <
0.02). ................................................................................................................................................. 102
Table XIII. Mean summary diversity statistics for the two geographic populations and the overall
dataset of samples included in the fine-scale analysis: N (sample size); Na (number of different
alleles); Ne (effective number of alleles); HO (observed heterozygosity); HE (expected
heterozygosity); FIS (inbreeding coefficient). Standard errors are between brackets. ....................... 105
Table XIV. AMOVA results. The p-value indicates the probability of finding a more extreme variance
component and FST value than observed by chance alone after 10,000 permutations. .................... 106
Table SI. Allelic Dropout and False Allele rates estimated in Pedant v. 1.0 using 50 samples
collected at CLNP and Consensus Threshold for four Polymerase Chain Reaction repetitions after
the GEMINI v. 1.3.0 analyses. .......................................................................................................... 150
Table SII. Details of the three Multiplex Polymerase Chain Reactions used by Sá (2013). Annealing
temperature (AT), loci in each multiplex, primer sequences, repeat motif, allele range size,
fluorescent dye, and final PCR concentration (C). N.A. – not applicable. Sá (2013) does not specify
the AT used for M3. Note that amelogenin was the molecular method used to determine the sex of
the samples and is not a microsatellite locus. ................................................................................... 151
Table SIII. Comparison of error rates (allelic dropout and false alleles) as estimated in Pedant v. 1.0
using two replicates per sample and per locus and as calculated using all the data following the
approach by Broquet and Petit (2004). All values are presented in percentage. .............................. 152
Table SIV. Allele size range per locus for the samples of western chimpanzee amplified by the
present study. .................................................................................................................................... 153
Table SV. Comparison of allele frequencies between the dataset produced by the present study (FB
dataset) and the dataset produced by Rui Sá (RS dataset), using the samples from CLNP with a QI >
0.5. N corresponds to the number of samples from each dataset used for the comparison. ............ 153

FCUP A country-level genetic survey of the IUCN critically endangered western chimpanzee (Pan troglodytes
verus) in Guinea-Bissau
xix

FCUP A country-level genetic survey of the IUCN critically endangered western chimpanzee (Pan troglodytes
verus) in Guinea-Bissau
xx
List of Figures
Figure 1. Geographic range and distribution of the four subspecies of common chimpanzee (Pan
troglodytes) – western chimpanzee (P. t. verus), Nigeria-Cameron chimpanzee (P. t. ellioti), central
chimpanzee (P. t. troglodytes), and eastern chimpanzee (P. t. schweinfurthii). Sources: IUCN SSC
A.P.E.S. database, Drexel University, and Jane Goodall Institute (2016). Produced using QGIS v.
2.18.0. ................................................................................................................................................. 31
Figure 2. Four main protected areas in mainland Guinea-Bissau, where chimpanzees are mostly
found, and subspecies distribution according to the 2016 IUCN assessment. Sources: IBAP; INEP;
IUCN SSC A.P.E.S. database, Drexel University, and Jane Goodall Institute (2016). Produced using
QGIS v. 2.18.0. ................................................................................................................................... 34
Figure 3. Location of the Republic of Guinea-Bissau in West Africa. The Bijagós archipelago is
highlighted by an arrow. Produced using QGIS v. 2.18.0. .................................................................. 45
Figure 4. Study area and sampling sites, which include the four protected areas marked in brown
and Empada. Sources: IBAP, INEP, C. Sousa. Produced using QGIS v. 2.18.0. .............................. 46
Figure 5. Average DNA concentration and standard deviation (shown by the back bars) obtained
using 21 samples extracted with the two different extraction protocols – Costa et al. (in revision) and
Vallet et al. (2008, adapted by Quéméré et al. 2010) – tested by this study. ...................................... 72
Figure 6. Location of the 70 unique genotypes included in the final FB dataset. Produced using
QGIS v. 2.18.0. ................................................................................................................................... 74
Figure 7. Cumulative probability of identity (PI) and probability of identity between siblings (PIsibs).
Distinction of individuals is reliable with five loci, when the PIsibs curve approaches zero. .................. 76
Figure 8. Genotype accumulation curve showing a plateau at five loci, the minimum number of loci
necessary to distinguish between different individuals. ...................................................................... 77
Figure 9. Location of the 168 samples collected from unique individuals for which the mitochondrial
DNA control region was amplified and used in the analyses. Produced using QGIS v. 2.18.0. ......... 78
Figure 10. Location of the samples collected from the 185 unique individuals genotyped for a
maximum of 10 microsatellite loci included in the final combined dataset. Produced using QGIS v.
2.18.0. ................................................................................................................................................. 81
Figure 11. Location of the 96 samples collected from the males successfully genotyped for the
DYs439 locus. Produced using QGIS v. 2.18.0. ................................................................................. 82
Figure 12. Median-joining haplotype network reconstruction using mtDNA. Node size is proportional
to haplotype frequency and each number on the links corresponds to a mutation. The four
haplogroups are circled by the dashed black lines. ............................................................................ 85
Figure 13. Median-joining haplotype network reconstruction using the mtDNA dataset divided per
geographic population. Node size is proportional to haplotype frequency and each number on the
links corresponds to a mutation. A) Cantanhez Forest National Park (CFNP). B) Empada. C) Cufada
Lagoons Natural Park (CLNP). D) Boé National Park (BNP). ............................................................. 86

FCUP A country-level genetic survey of the IUCN critically endangered western chimpanzee (Pan troglodytes
verus) in Guinea-Bissau
xxi
Figure 14. Principal component analysis (PCA) based on mtDNA. The first and second axes
explained 41.0% and 18.9%, respectively, of the observed variation. Each point represents an
individual and colours distinguish between sampling sites (Green: CFNP; Brown: Empada; Orange:
CLNP; Purple: DNP; Blue: BNP). Inertia ellipses include two thirds of the individuals from each
sampling site. ...................................................................................................................................... 87
Figure 15. Spatial principal component analysis (sPCA) constructed using the mtDNA sequences. A)
Plot of the eigenvalues across the principal components. The first global structure was maintained.
B) First global principal component on the geographic space represented in a scale from red
(maximum score) to black (minimum score). Each point represents an individual and its colour
indicates the score. ............................................................................................................................. 88
Figure 16. Mantel test performed to test the hypothesis of isolation by distance using the mtDNA
data. The black dot standing outside the simulated range under a model of random distribution of
haplotypes across the landscape agrees with the hypothesis of isolation by distance (p < 0.05). ..... 89
Figure 17. Individual Bayesian clustering analysis performed in STRUCTURE using microsatellite
data (185 unique genotypes). A) Inference of the most likely number of clusters (K) using K and
LnP(K) values across all runs. B) Bar plot output assuming K = 2. C) Bar plot output assuming K = 6.
............................................................................................................................................................ 90
Figure 18. Map representation of the output of the individual Bayesian clustering analysis
implemented in STRUCTURE. The five geographic populations harbour individuals assigned to two
clusters identified using STRUCTURE and a proportion of admixed individuals. NCFNP = 78; NEmpada =
12; NCLNP = 67; NDNP = 11; NBNP = 17. Circles are proportional to sample size in each locality. Main
water courses are represented in blue, roads in white, and villages in grey. Produced using QGIS v.
2.18.0. ................................................................................................................................................. 92
Figure 19. Individual Bayesian clustering analysis performed in STRUCTURE for the 43 unique
genotypes grouped in cluster 2. A) Inference of the most likely number of clusters (K) using K and
LnP(K) values across all runs. B) Bar plot output assuming K = 4. ..................................................... 93
Figure 20. Output of the individual Bayesian clustering analysis performed in BAPS, assuming K = 3.
The genotypes are represented on the geographic space. ................................................................. 94
Figure 21. Principal component analysis (PCA) based on the microsatellite data. The x-axis and the
y-axis explain 3.1% and 3.0%, respectively, of the observed variation. Each point represents an
individual and colours distinguish between sampling sites (Green: CFNP; Brown: Empada; Orange:
CLNP; Purple: DNP; Blue: BNP). Inertia ellipses include two thirds of the individuals from each
sampling site. ...................................................................................................................................... 95
Figure 22. Spatial principal component analysis (sPCA) constructed using the microsatellite
database. A) Plot of the eigenvalues across the principal components. The first two global structures
were maintained. B) The first principal component is represented in a scale from red (maximum
score) to black (minimum score) and the second principal component in a scale from green
(maximum score) to black (minimum score). Each point represents an individual and its colour
indicates the combination of the two scores........................................................................................ 96

FCUP A country-level genetic survey of the IUCN critically endangered western chimpanzee (Pan troglodytes
verus) in Guinea-Bissau
xxii
Figure 23. Mantel test performed to test the hypothesis of isolation by distance using the
microsatellite data. Each point represents an individual, the x-axis represents the geographic
distance between each pair of individuals in km, and the y-axis represents the linear genetic
distance. No significant correlation between Euclidean geographical and genetic distances was
obtained (p > 0.05). ............................................................................................................................. 97
Figure 24. Graphical representation of the Mantel test performed to analyse the hypothesis of
isolation by distance for each pair of geographic populations. Each point represents an individual.
The x-axis represents the geographic distance between each pair of individuals in km and the y-axis
represents the linear genetic distance. Significant correlation between Euclidean geographical and
genetic distances was obtained for the pairs CFNP/CLNP, CFNP/DNP, CFNP/BNP, and DNP/BNP
(p < 0.05). ............................................................................................................................................ 98
Figure 25. Spatial autocorrelation analysis (N = 185) – correlogram of the correlation coefficient (r)
between genetic and geographic distance at 18 distance classes (km, end point) with an even
number of samples (c. 1,000 pairwise comparisons per distance class). U and L are upper and lower
limits of the 95% confidence band under the null hypothesis of random distribution of genotypes
across the landscape. Error bars represent 95% confidence intervals around each mean correlation
coefficient. Distance classes with significant pairwise genetic distances are the ones standing outside
the dashed lines. ................................................................................................................................. 99
Figure 26. Spatial autocorrelation analyses performed for every pair of geographic populations. The
y-axis represents the correlation coefficient (r) between genetic and geographic distance at the
distance classes (km, end point), with an even number of samples, represented in the x-axis. U and
L are upper and lower limits of the 95% confidence band under the null hypothesis of random
distribution of genotypes across the landscape. Error bars represent 95% confidence intervals
around each mean correlation coefficient. Distance classes with significant pairwise genetic
distances are the ones standing outside the dashed lines. ............................................................... 100
Figure 27. Allele frequencies for the Y-linked microsatellite marker across Guinea-Bissau. Circle size
is proportional to the number of genotypes obtained from each site (40 in CFNP, 14 in Empada, 29 in
CLNP, and 13 in BNP). Main water courses are represented in blue, roads in white, and villages in
grey. Produced using QGIS v. 2.18.0. .............................................................................................. 101
Figure 28. Mismatch distribution based on the mitochondrial DNA control region. The back line
represents the observed distribution and the grey lines represent expected distributions under
models of constant population size and of population growth. The data did not significantly deviate
from a model of population growth, based on the raggedness index (r; p > 0.05). ........................... 103
Figure 29. Mismatch distributions for the geographic populations under study. A) CFNP; B) Empada;
C) CLNP; D) BNP. The raggedness index (r) value was non-significant (p > 0.05) in all cases,
suggesting a history of population growth. ........................................................................................ 104
Figure 30. L-shaped allele-frequency distributions (mode-shift indicators), which are typical of stable
populations, obtained from the BOTTLENECK analysis. A) Whole dataset of 185 unique genotypes.
B) Cluster 1 identified in the STRUCTURE analysis (45 genotypes). C) Cluster 2 identified in the
STRUCTURE analysis (43 genotypes). ............................................................................................ 105

FCUP A country-level genetic survey of the IUCN critically endangered western chimpanzee (Pan troglodytes
verus) in Guinea-Bissau
xxiii
Figure 31. Individual Bayesian clustering analysis performed in STRUCTURE (70 unique
genotypes). A) Inference of the most likely number of clusters (K) using K and LnP(K) values across
all runs. B) Bar plot output assuming K = 2. C) Bar plot output assuming K = 3. .............................. 107
Figure 32. Map representation of the first partitioning of genotypes into two clusters using an
individual Bayesian clustering analysis implemented in STRUCTURE. The individuals from CLNP are
divided into clusters 1 (22 individuals) and 2 (36 individuals). The 12 individuals from DNP were
assigned to cluster 1. Circles are proportional to sample size in each locality. Main water courses are
represented in blue, roads in white, and villages in grey. Produced using QGIS v. 2.18.0. .............. 108
Figure 33. Principal component analysis (PCA) performed using the 70 unique genotypes included in
the fine-scale analysis. The x-axis and the y-axis explain 6.3% and 6.0%, respectively, of the
observed variation. Each point represents an individual and colours distinguish between sampling
sites (Pink: CLNP; Orange: DNP). Inertia ellipses include two thirds of the individuals from each
sampling site. .................................................................................................................................... 109
Figure 34. Spatial principal component analysis (sPCA) performed based on the 70 unique
genotypes included in the fine-scale analysis. A) Plot of the eigenvalues across the principal
components. The first three global components were maintained. B) First three global principal
components on the geographic space. The first principal component is represented in a scale from
red (maximum score) to black (minimum score), the second principal component in a scale from
green (maximum score) to black (minimum score), and the third principal component is represented
in a scale from blue (maximum score) to black (minimum score). Each point represents an individual
and its colour indicates the combination of the three scores. ........................................................... 110
Figure 35. Spatial autocorrelation analysis – correlogram of the correlation coefficient (r) between
genetic and geographic distance at 10 distance classes (km, end point) with an even distribution of
samples. U and L are upper and lower limits of the 95% confidence band under the null hypothesis of
random distribution of genotypes across the landscape. Error bars represent 95% confidence
intervals around each mean correlation coefficient. Distance classes with significant pairwise genetic
distances are the ones standing outside the dashed lines. ............................................................... 111
Figure 36. Graphical representation of the Mantel test performed to analyse the hypothesis of
isolation by distance, using the dataset of 70 genotypes included in the fine-scale analysis.
Significant correlation between Euclidean geographical and genetic distances was obtained (p <
0.05). ................................................................................................................................................. 111
Figure S1. Authorization, by the Director General of the General Directorate for Food and Veterinary,
for the import of tissue, blood, and faecal samples of primate species from Guinea-Bissau to
Portugal. ............................................................................................................................................ 148
Figure S2. Authorization, by the Convention on International Trade in Endangered Species of Wild
Fauna and Flora (CITES)/Instituto da Conservação da Natureza e das Florestas (ICNF), for the
transport of tissue and blood samples of chimpanzee from Guinea-Bissau to Portugal. .................. 149
Figure S3. Comparison of two Bayesian clustering analyses to assess the effect of missing data
assuming K=4 for the same 201 samples from five different geographic populations in Guinea-

FCUP A country-level genetic survey of the IUCN critically endangered western chimpanzee (Pan troglodytes
verus) in Guinea-Bissau
xxiv
Bissau. A) 21 loci, with missing data for RS samples across 11 loci. B) 10 loci; the clusters seem to
be better defined, which is especially evident for the one represented in yellow. ............................. 155
Figure S4. Comparison of two Factorial Component Analyses for the same 201 samples from five
different geographic populations in Guinea-Bissau, in order to assess the effect of missing data. A)
21 loci; the cluster on the right includes samples from RS dataset, with missing data only for 11 loci,
and the cluster on the left comprises samples from FB dataset, with a low amount of missing data;
the horizontal and vertical axes explain, respectively, 7.69% and 2.85% of the observed variation. B)
10 loci; the horizontal and vertical axes explain, respectively, 3.82% and 3.50% of the observed
variation. ............................................................................................................................................ 156
Figure S5. Cumulative probability of identity (PI) and probability of identity between siblings (PIsibs)
for the 10 loci included in the combined dataset of genotypes. Distinction of different individuals is
reliable with a minimum of five loci, when the PIsibs curve approaches zero. .................................... 157
Figure S6. Genotype accumulation curve for the 10 loci included in the combined dataset showing a
plateau at five loci, the minimum number necessary to distinguish between different individuals. ... 157
Figure S7. Individual Bayesian clustering analysis performed in STRUCTURE for the 45 unique
genotypes grouped in cluster 1. No evidence of substructure appears. A) Inference of the most likely
number of clusters (K) using K and LnP(K) values across all runs. B) Bar plot output assuming K =
2. C) Bar plot output assuming K = 4. D) Bar plot output assuming K = 7. ....................................... 158
Figure S8. Output of the individual Bayesian clustering analysis performed in BAPS for the fine-scale
analysis among CLNP and DNP, assuming K = 1. The genotypes (N = 70) are represented on the
geographic space. ............................................................................................................................. 159

FCUP A country-level genetic survey of the IUCN critically endangered western chimpanzee (Pan troglodytes
verus) in Guinea-Bissau
xxv

FCUP A country-level genetic survey of the IUCN critically endangered western chimpanzee (Pan troglodytes
verus) in Guinea-Bissau
xxvi
List of Abbreviations
ADO – Allelic dropout
AMOVA – Hierarchical analysis of molecular significance
BNP – Boé National Park
bp – Base pair
CFNP – Cantanhez Forest National Park
CLNP – Cufada Lagoons Natural Park
cyt b – Cytochrome b
DNP – Dulombi National Park
FA – False allele
FCA – Factorial correspondence analysis
FIS – Inbreeding coefficient
FST – Fixation index
GPS – Global positioning system
Hd – Haplotype diversity
HE – Expected heterozygosity
HO – Observed heterozygosity
HWE – Hardy-Weinberg equilibrium
IUCN – International Union for Conservation of Nature
K – Optimal number of genetic clusters
LD – Linkage disequilibrium
MCMC – Markorv chain Monte Carlo
mtDNA – Mitochondrial DNA
Na – Number of different alleles
Ne – Effective number of alleles
NUMT – Nuclear mitochondrial DNA segment
PCA – Principal component analysis

FCUP A country-level genetic survey of the IUCN critically endangered western chimpanzee (Pan troglodytes
verus) in Guinea-Bissau
xxvii
PCR – Polymerase Chain Reaction
PI – Probability of identity
PIsibs – Probability of identity between siblings
Q – Probability of assignment
QI – Quality index
S – Number of variable positions
sPCA – Spatial principal component analysis
UV – Ultra-violet
– Nucleotide diversity

FCUP A country-level genetic survey of the IUCN critically endangered western chimpanzee (Pan troglodytes
verus) in Guinea-Bissau
xxviii

FCUP A country-level genetic survey of the IUCN critically endangered western chimpanzee (Pan troglodytes
verus) in Guinea-Bissau
29
1. Introduction
1.1. Biodiversity in West Africa and primates’ conservation
The West African forests are considered one of world’s hotspots of biodiversity, where
a large number of endemic species are threatened by habitat loss (Myers et al., 2000).
Scientists are expressing an increasing concern about the level of population size
declines and losses of species in this area (Brooks et al., 2002). Since the beginning
of the twentieth century, above 50% of the mammals’ populations have become extinct
in what is sometimes referred to as the ongoing sixth mass extinction (Ceballos, Ehrlich
and Dirzo, 2017). Therefore, conservation priorities must be directed towards this
region (Myers et al., 2000).
Primates, in particular, are currently facing an extinction crisis that threatens 37% of
extant species in mainland Africa alone (Estrada et al., 2017). Indeed, the first
document reporting a primate species going extinct in the twenty-first century has been
published in the year 2000, referring to Miss Waldron’s red colobus monkey, which is
endemic to the forests of West Africa (Oates et al., 2000). This conservation crisis can
be assigned mainly to environmentally unsustainable human activities (Estrada et al.,
2017), which are markedly influenced by disrupted social and political contexts typical
of African biodiversity rich areas (Hanson et al., 2009). Indeed, countries harbouring
West African forests were marked by a recent history of civil wars (Dudley et al., 2002).
The consequences of such political and economic instability for wildlife have emerged
through a rise in logging, poaching, and bushmeat consumption, namely of primate
species (Draulans and Van Krunkelsven, 2002; Dudley et al., 2002).
1.2. The common chimpanzee (Pan troglodytes)
The common or robust chimpanzee (Pan troglodytes) is a non-human primate included
in the Hominidae family (Groves, 2001; Mittermeier, Rylands and Wilson, 2013).
Chimpanzees live in fission-fusion communities, in which individuals form parties that
change continually (Morin et al., 1993). The species has a long generation time
(approximately 25 years; Langergraber et al., 2012). Males are usually philopatric and
females may emigrate as adolescents or migrate temporally as adults to other groups
in order to reproduce (Morin et al., 1993). Although being the most widely distributed of
all African’ apes (Butynski, 2003), the species has a current decreasing population
trend and is classified as Endangered by the International Union for Conservation of

FCUP A country-level genetic survey of the IUCN critically endangered western chimpanzee (Pan troglodytes
verus) in Guinea-Bissau
30
Nature (IUCN) Red List of Threatened Species (Humle, Maisels, et al., 2016). It is
expected that the population reduction will continue over the next 30 to 40 years
(Humle, Maisels, et al., 2016). The main threats to the species conservation are
poaching, habitat loss and fragmentation, and diseases (Humle, Maisels, et al., 2016).
The extinction of chimpanzees may represent a great impact, not only on their
ecosystem, but also on the understanding of subjects such as human evolution and
cognition, considering some traits characteristic of this taxon, such as 1) the capacity
for long-distance seed dispersal, which has very important evolutionary consequences
for plant species (Chapman and Russo, 2002) and for other taxa; 2) the complex social
interactions that individuals exhibit and that include cooperation, reconciliation, and
coalition formation (Humle, 2003); 3) the skills for social cognition (Tomonaga et al.,
2004); 4) the high memory capacity (Kawai and Matsuzawa, 2000) and culture
(McGrew, 1998); and 5) the fact that it is, along with bonobos, the closest living relative
of humans (Prüfer et al., 2012), which renders it a model of reference for human
evolution (Sayers and Lovejoy, 2008), health, and physiology (e.g. Thompson et al.,
2007). Additionally, chimpanzees can act as an umbrella, flagship, and bio-indicator
species, and are, thus, particularly important for biodiversity and nature conservation at
a broader scale (Wrangham et al., 2008; Hockings and Sousa, 2013).
The chimpanzee is native to 21 African countries (Figure 1) and four subspecies are
usually considered: the western chimpanzee (P. t. verus), the Nigeria-Cameron
chimpanzee (P. t. ellioti), the central chimpanzee (P. t. troglodytes), and the eastern
chimpanzee (P. t. schweinfurthii) (Groves, 2001; Mittermeier, Rylands and Wilson,
2013; Humle, Maisels, et al., 2016).

FCUP A country-level genetic survey of the IUCN critically endangered western chimpanzee (Pan troglodytes
verus) in Guinea-Bissau
31
Figure 1. Geographic range and distribution of the four subspecies of common chimpanzee (Pan troglodytes) – western
chimpanzee (P. t. verus), Nigeria-Cameron chimpanzee (P. t. ellioti), central chimpanzee (P. t. troglodytes), and eastern
chimpanzee (P. t. schweinfurthii). Sources: IUCN SSC A.P.E.S. database, Drexel University, and Jane Goodall Institute
(2016). Produced using QGIS v. 2.18.0.
From an evolutionary point of view, the Western African chimpanzee clade seems to
present an earlier divergence and isolation from the lineage that gave rise to the other
subspecies, which are more closely related (Morin et al., 1994; Becquet et al., 2007;
Prado-Martinez et al., 2013). Although there is little evidence of gene flow between the
four subspecies (Becquet et al., 2007), evidences from mitochondrial DNA (mtDNA)
sequences indicate an historical pattern of gene flow between populations of western
chimpanzees separated by up to 900 km (Morin et al., 1994).
A review of past studies on wild chimpanzees, namely on their population genetic
structure and movement patterns, can be found in section 1.4.

FCUP A country-level genetic survey of the IUCN critically endangered western chimpanzee (Pan troglodytes
verus) in Guinea-Bissau
32
1.3. The western chimpanzee (Pan troglodytes verus) in
Guinea-Bissau
The western chimpanzee, due to its long-term evolutionary separation from the other
subspecies, has been indicated as meriting elevation to full species rank (Morin et al.,
1994). In fact, of the four subspecies of common chimpanzee, it is the only one whose
IUCN conservation status has risen to Critically Endangered in the latest assessment,
in 2016 (Humle, Boesch, et al., 2016), and, as such, efforts must be especially
allocated to ensure its long-term survival and conservation (Kormos and Boesch,
2003).
With a population estimate of 15,000 to 65,000 individuals, the western chimpanzee
suffered a decline of over 80% in abundance between 1990 and 2014 (Kühl et al.,
2017). Although there are many described threats affecting this taxon, the major
determinant of its patchy distribution and decrease in population size seems to be
human-related deforestation and hunting (Kormos and Boesch, 2003; Carvalho,
Marques and Vicente, 2013), which is linked to the already mentioned political
instability in the countries where the subspecies occurs (Draulans and Van
Krunkelsven, 2002; Dudley et al., 2002).
The western chimpanzees are native to Côte d’Ivoire, Ghana, Guinea, Guinea-Bissau,
Liberia, Mali, Senegal, and Sierra Leone (Humle, Boesch, et al., 2016). Among these
eight countries, the populations in Ghana, Senegal, and Guinea-Bissau are the most
threatened ones (Butynski, 2003). The population in Guinea-Bissau is considered a
priority for the conservation of the subspecies (Kormos and Boesch, 2003), as the
estimated number of individuals in the country lies between 600 and 1,000 (Gippoliti,
Embalo and Sousa, 2003), which is below the number expected to guarantee the long-
term survival of the population (i.e. 5,000; Lande, 1995).
Guinea-Bissau is one of the world’s poorest countries (CCLME Project, 2016), has a
low level of human development (UNDP, 2016), and has been listed by the
Organisation for Economic Co-operation and Development since 2007 as an unstable
state with a fragile economy (OECD, 2015). In that sense, it has been argued that
biological conservation should be combined with economic growth in the country
(Gippoliti, Embalo and Sousa, 2003). However, the civil war triggered in 1988 created
hundreds to thousands of displaced people, which, coupled with high population growth
and a poor economic situation, has brought biodiversity conservation to a second place
(Gippoliti, Embalo and Sousa, 2003). Although the chimpanzee is classified as

FCUP A country-level genetic survey of the IUCN critically endangered western chimpanzee (Pan troglodytes
verus) in Guinea-Bissau
33
Critically Endangered by IUCN (Humle, Boesch, et al., 2016), is included in Appendix I
by the Convention on International Trade in Endangered Species of Wild Fauna and
Flora (CITES, 2017a), to which Guinea-Bissau joined as a party in 1990 (CITES,
2017b), and is protected by Guinea-Bissau national laws (e.g. Lei de Bases do
Ambiente; Imprensa Nacional, 2011), many hazardous actions threaten the long-term
conservation of the subspecies within the country. These include habitat loss by illegal
deforestation (Carvalho, 2014), hunting for trade of skins and body parts for traditional
medicine (Sá et al., 2012), and pet trade (Ferreira da Silva, 2012; Hockings and Sousa,
2013).
In Guinea-Bissau, P. t. verus is mostly distributed south of the Corubal River in the
regions of Quinara, Tombali, and Gabú (Gippoliti and Dell’Omo, 1996). Although the
northern limit for the distribution of the species in Guinea-Bissau is not clear, it has
been hypothesised to extend above the Corubal River (Brugiere et al., 2009). While
confirmation with actual data from those areas was lacking until recently (Sousa, 2014),
the latest assessment by IUCN already included the presence of chimpanzees in
Dulombi National Park (DNP), which is located north of the Corubal River (Humle,
Maisels, et al., 2016; Figure 2). Moreover, the observation of individuals and nests, and
the collection of faecal samples at DNP (Ferreira da Silva, 2016b) definitely confirms
the presence of a chimpanzee population in that site.
The largest communities of P. t. verus are found in the protected areas of Cufada
Lagoons Natural Park (CLNP; region of Quinara), Cantanhez Forest National Park
(CFNP; Tombali region) and the complex Dulombi-Boé-Tchetche (Gabú and Boé
sectors) (Carvalho, 2014; Figure 2). Each of the protected areas is briefly described in
the following sections.

FCUP A country-level genetic survey of the IUCN critically endangered western chimpanzee (Pan troglodytes
verus) in Guinea-Bissau
34
Figure 2. Four main protected areas in mainland Guinea-Bissau, where chimpanzees are mostly found, and subspecies
distribution according to the 2016 IUCN assessment. Sources: IBAP; INEP; IUCN SSC A.P.E.S. database, Drexel
University, and Jane Goodall Institute (2016). Produced using QGIS v. 2.18.0.
1.3.1. Cufada Lagoons Natural Park
CLNP was included in the national system of protected areas in the year 2000 and
covers 890 km2 (IBAP, 2017). The park was named after a lagoon, which has been
classified as a Ramsar site (Ramsar, 2017). There are 3,534 people inhabiting the
park, mostly concentrated along the road between Buba and Fulacunda, and in the
northern part of the park near the Corubal River (IBAP, 2017). Because the park is
inhabited by local communities, the liaison of biodiversity and primates’ conservation
with local practices and traditions must be prioritised (Carvalho, Marques and Vicente,
2013; Amador, 2014; Amador, Casanova and Lee, 2015).
A great variety of animal species inhabit the park (IBAP, 2017), including the non-
human primates chimpanzees, lesser white-nosed guenons (Cercopithecus petaurista),
Guinea baboons (Papio papio), and patas monkeys (Erytrocebus patas) (Gippoliti and
Dell’Omo, 2003).
The CLNP chimpanzee population is of major importance to the conservation of P. t.
verus in the country (Carvalho, 2014). Firstly, CLNP represents an important refuge for

FCUP A country-level genetic survey of the IUCN critically endangered western chimpanzee (Pan troglodytes
verus) in Guinea-Bissau
35
chimpanzees at the westernmost margin of its geographic distribution (Carvalho,
2014). Secondly, it is thought to be the smallest population in Guinea-Bissau. The most
recent estimate of 0.22 chimpanzees/km2, corresponding to 137 individuals (Carvalho,
2014), contrasts with estimations made for the Tombali sector – 2.340 individuals/km2
(CFNP; Sousa, 2007) and 0.897 individuals/km2 (Gadamael, outside CFNP; Sousa,
2009). Furthermore, it has been described that chimpanzees nesting behaviour in
CLNP is limited by the presence of major human settlements (Carvalho, 2014). The
fact that more than half of the primary forest of CLNP has been cleared for the
construction of a road and a deep water port in 2009 by Bauxite Angola S.A. to enable
the exportation of bauxite from the country (Salgado, Fedi and Leitão, 2009) highlights
the urgency to improve chimpanzee conservation in this area (Sousa et al., 2013;
Carvalho, 2014).
1.3.2. Cantanhez Forest National Park
Created in the year 2008 and officially regulated by a decree in 2011 (Decreto
14/2011), CFNP covers an area of 1,068 km2 and is inhabited by approximately 20,000
people (IBAP, 2017). CFNP is considered the last patch of sub-humid forest in Guinea-
Bissau, harbouring the greatest diversity of flora and fauna (IBAP, 2017). Seven
species of non-human primates are native to CFNP: chimpanzee, Guinea baboon
(Papio papio), Campbell’s monkey (Cercopithecus campbelli), black-and-white colobus
(Colobus polykomos), Senegal bushbaby (Galago senegalensis), Temmink’s red
colobus (Procolobus badius temmincki), and vervet monkey (Chlorocebus aethiops)
(Gippoliti and Dell’Omo, 2003). National governmental agencies managing protected
areas have delimitated two wildlife corridors from CFNP to Guinea-Conakry (i.e.
Gandambel and Bendugo) and three wildlife corridors connecting CFNP to other
protected areas within the country – CLNP and DNP (IBAP, 2017). Despite the official
protection status conveyed to these forests, some difficulties in enforcing regulations
have been reported and formal protection has been described as minimal (Hockings
and Sousa, 2013). Roads and paths associated to human activities have been
fragmenting the forests (Hockings and Sousa, 2013), which is thought to negatively
affect the connectivity between groups of chimpanzees (Torres et al., 2010). Torres et
al. (2010) estimated that 11% of the area of suitable habitats for the species has been
cleared between 1986 and 2003, which corresponds mainly to a decrease of primary
forest and of landscape spatial heterogeneity (Sousa, 2009; Torres et al., 2010). The
impact of deforestation upon the chimpanzees’ populations in the Tombali region is

FCUP A country-level genetic survey of the IUCN critically endangered western chimpanzee (Pan troglodytes
verus) in Guinea-Bissau
36
confirmed by the lower density of individuals found outside the declared protected
perimeter of CFNP, where secondary forests prevail (Sousa, 2009), in comparison to
figures for the forested areas inside the park (Sousa, 2007). Additionally, human-
chimpanzee conflicts that arise mainly due to overlap of forest use and to resource
competition, which often leads to crop-raiding by chimpanzees, frequently lead to
negative perceptions, lack of willingness to engage in conservation efforts (Costa et al.,
2013), and retaliatory killings by farmers (e.g. Hockings and Sousa, 2013). The
chimpanzees’ population size in CFNP could be under 400 individuals, considering a
low density scenario (Torres et al., 2010).
1.3.3. Complex Dulombi-Boé-Tchetche
The complex Dulombi-Boé-Tchetche extends over an area of 3,190 km2, which
includes two national parks (Boé and Dulombi) and three ecological corridors
(Tchetche, Salifo, and Cuntabani) (IBAP, 2017), being there present the ten non-
human primate species which are known to occur in Guinea-Bissau (chimpanzee,
black-and-white colobus, Campbell’s monkey, Guinea baboon, lesser white-nosed
guenon, patas monkey, Senegal bushbaby, sooty mangabey, Temmink’s red colobus,
and vervet monkey; Gippoliti and Dell’Omo, 2003). According to the Institute of
Biodiversity and Protected Areas of Guinea-Bissau (IBAP, 2017), the aim of the
complex is to assure connectivity between national protected areas, as well as
between Guinea-Bissau’s protected areas and parks in bordering countries. Boé’s
biodiversity seems to be mainly affected by fires, hunting, human population growth,
and construction of roads (CHIMBO, 2017). Furthermore, the already mentioned
company Bauxite Angola S.A. intends to extract bauxite in this area (Wit, 2011) and to
construct a road for transportation of the mineral (van der Hoeven, 2011). This has
been shown to pose a negative impact on the chimpanzees living in proximity to that
area (Wenceslau, 2014). Estimations of chimpanzees’ population size in Boé vary
between 710 individuals (Serra, Silva and Lopes, 2007) and up to 4,415 individuals
(Binczic et al., 2017), which are the highest figures for the whole of Guinea-Bissau.
DNP is an understudied area, but is considered an important site for conservation and,
at the same time, a location very affected by threats such as non-sustainable hunting
(Casanova and Sousa, 2007).

FCUP A country-level genetic survey of the IUCN critically endangered western chimpanzee (Pan troglodytes
verus) in Guinea-Bissau
37
1.4. Population and conservation genetics
Biodiversity should be conserved at three levels: genetic diversity, species diversity,
and ecosystem diversity (Frankham, 1995). The importance of preserving genetic
diversity has led to the formalization of conservation genetics as a research field
(Primmer, 2009). The birth of conservation genetics was catalysed by the advances in
molecular biology technologies that occurred in the past decades, namely the use of
highly polymorphic markers, such as microsatellites and mtDNA, amplified by
Polymerase Chain Reaction (PCR) associated to the non-invasive DNA sampling of
wild populations (Primmer, 2009; Ferreira da Silva and Bruford, 2017). Conservation
genetics makes use of the principles of the discipline of population genetics to help
decrease the extinction risk and preserve the species’ potential to adapt to future
environmental changes (Ferreira da Silva and Bruford, 2017).
Parameters such as genetic variation, gene flow, effective population size, and
population structure can be evaluated through several techniques using the tools of
population genetics (Allendorf, 2017). Threats such as habitat fragmentation can lead
to a reduction in dispersal and consequently may increase reproductive isolation which,
in turn, can increase the risk of extinction (Frankham, 1995). As a consequence of
isolation, individuals may start to reproduce with kin, leading to compromised fertility,
growth, and survival, as well as to increased susceptibility to diseases (Frankham,
Briscoe and Ballou, 2002; Ferreira da Silva et al., 2012; Ferreira da Silva and Bruford,
2017). Therefore, information on the genetic diversity and inbreeding levels of
populations is of major importance for the conservation genetics of the western
chimpanzee considering the high habitat fragmentation found along its range (Humle,
2003).
Primate genetic surveys make use of non-invasive sources of DNA and PCR-based
genetic markers, of which microsatellite loci and mtDNA are the most extensively used
(Ferreira da Silva and Bruford, 2017).
1.5. Non-invasive sampling
Non-invasive genetic surveys enabled conservationists to estimate parameters such as
population effective size, levels of genetic variation, and structure of wild populations
with minimum human interference (Schwartz, Luikart and Waples, 2006). This is of
especial importance when studying wild primates because the collection of samples
such as blood and tissue may negatively affect the individuals, is limited by practical

FCUP A country-level genetic survey of the IUCN critically endangered western chimpanzee (Pan troglodytes
verus) in Guinea-Bissau
38
constraints, and rises ethical questions (Ferreira da Silva and Bruford, 2017). After the
first genetic survey of free-ranging primates using non-invasively collected samples
was published in 1993 on chimpanzees (Morin et al., 1993), a huge step within the field
of primate conservation genetics was achieved. Nowadays, faeces are by far the most
common source of DNA for genetic studies involving primate species, as they can be
found relatively easily in the field (Ferreira da Silva and Bruford, 2017).
Sex identification of individuals using non-invasively collected DNA has been used in
conservation genetic studies to improve census methods, determine the sex
composition of social groups and populations, and incorporate sex data into macro-
analyses (Bradley, Chambers and Vigilant, 2001; Koops et al., 2007). The amelogenin
system (Sullivan et al., 1993) is one of the effective ways to distinguish between males
and females for the majority of the great ape species (Roeder, Jeffery and Bruford,
2006). Amelogenin is a XY-homologous locus with a 6 base pair (bp) deletion within
intron one of the X homologue, which results in 6 bp longer fragments for the Y
chromosome when compared to the X chromosome (Sullivan et al., 1993). Therefore,
DNA from males amplifies two fragment sizes, separated by 6 bp, while DNA from
females amplifies only one fragment size, which allows identifying the sex of
unobserved individuals by gel electrophoresis or sequencing reactions (Sullivan et al.,
1993).
1.6. Microsatellite markers
Microsatellites (also known as Simple Sequence Repeats – SSRs) are short DNA
fragments in which a motif containing one to five base pairs is monotonously repeated
(Schlötterer, 2000). The high polymorphism levels encountered among different
individuals arise due to the variable number of repeats of the motif being considered
(Bruford and Wayne, 1993). The large number of repeat motifs in microsatellites is a
consequence of DNA replication slippage and of the mismatch repair system
(Schlötterer, 2000). Although the great majority of mutations in microsatellites are
neutral, in some cases these markers play functional roles in organisms (Tautz and
Schlötterer, 1994; Duran et al., 2009). In fact, they are thought to be involved in gene
expression and transcription (Duran et al., 2009).
Due to the presence of microsatellites across the whole genome in eukaryotes (Tautz
and Schlötterer, 1994), their highly polymorphic nature and relatively simple
amplification and genotyping, including from non-invasive sources of DNA, these

FCUP A country-level genetic survey of the IUCN critically endangered western chimpanzee (Pan troglodytes
verus) in Guinea-Bissau
39
markers have become the molecular tool of choice in studies of population genetics,
social structure, mating success, and population movement (Schlötterer, 2000;
Sunnucks, 2000), including of primate species (Coote and Bruford, 1996). In fact,
microsatellite markers have been successfully employed in several studies of
chimpanzee populations. For example, Goossens et al. (2000, 2003) used ten
microsatellite loci for paternity analyses in wild-released orphan chimpanzees in the
Conkouati-Douli National Park, Republic of Congo, and Vigilant et al. (2001) used nine
loci to analyse the social structure of three chimpanzee communities inhabiting Taï
National Park, Côte d’Ivoire. It is very common for these studies to make use of
microsatellite loci that have been firstly described in humans, since they cross-amplify
in samples from chimpanzees and other primate species (Coote and Bruford, 1996).
Despite all the above mentioned advantages of this type of genetic marker, genotyping
errors associated to the use of microsatellite loci exist and need to be considered.
Genotyping errors occur when the genotype determined after molecular analysis does
not correspond to the real genotype (Bonin et al., 2004). They are very commonly
associated to the use of non-invasive DNA (Pompanon et al., 2005) and can be
generated at all stages of a genetic study, namely DNA amplification, scoring, and data
analysis, due to a variety of causes, including chance, human error, and technical
artefacts (Bonin et al., 2004). Allelic dropouts (ADO) and false alleles (FA) constitute
the two main sources of microsatellite genotyping errors and are among the hardest
ones to monitor (Broquet and Petit, 2004). ADO is defined as the stochastic non-
amplification of one of the two alleles present at an heterozygous locus and FA are
allele-like artefacts generated by PCR that can be confounded and scored as actual
alleles (Pompanon et al., 2005). Although a complete suppression of genotyping errors
is impossible to achieve (Bonin et al., 2004), it is possible to quantify them (e.g.
Broquet and Petit, 2004) and to control and minimise their effect (e.g. Taberlet et al.,
1996). Taberlet et al. (1996), for instance, purposed a two-step procedure to obtain
reliable genotypes with a confidence level of 99%: PCRs must be conducted until three
positive amplifications are obtained and each allele should be recorded if observed at
least twice; for samples from homozygous individuals, four additional positive
amplifications must be obtained and individuals should only be considered
homozygous if the same allele is present across the seven repetitions.
A commonly employed method to evaluate the reliability of the genotypes obtained
from non-invasive sources of DNA and to make comparisons among samples, loci, and
studies is the quality index (QI) proposed by Miquel et al. (2006). In this system, scores

FCUP A country-level genetic survey of the IUCN critically endangered western chimpanzee (Pan troglodytes
verus) in Guinea-Bissau
40
between zero and one are assigned to the consensus genotypes depending on their
level of concordance to the replicates.
1.7. Mitochondrial DNA markers
mtDNA is a duplex, covalently closed circular molecule (Moritz and Dowling, 1987) that
possesses 37 highly conserved genes and a control region in animal species (Avise et
al., 1987). In vertebrates, this control region contains a displacement loop structure (D-
loop) that has a function in the replication process (Moritz and Dowling, 1987). mtDNA
is a useful marker in population and evolutionary studies: unlike nuclear DNA, pure
mtDNA can be easily obtained from samples containing low amounts and/or degraded
DNA (Harrison, 1989), such as those collected non-invasively; it lacks recombination,
which allows access to clear genealogies and ancestry data; and it presents a high
evolutionary rate when compared to nuclear DNA (Avise et al., 1987). The control
region is the most commonly used fragment of mtDNA in intraspecific primate studies,
due to the fact that it is the most variable portion of the molecule (Morin and Goldberg,
2004).
The utility of mtDNA as a genetic marker is limited by the fact that it is exclusively
maternally inherited and does not reveal patterns associated to the paternal line.
However, it has been commonly used to assess primate population structure at the
intraspecific or intra-generic level and to determine units for conservation (Ferreira da
Silva and Bruford, 2017).
mtDNA markers are also commonly used for DNA barcoding. DNA barcoding is the use
of a sequence from a standard part of the genome of the individual under investigation
(e.g. cytochrome oxidase subunit I, cytochrome b), which is compared against a library
of reference barcode sequences from individuals of known origins and species to
achieve the species identification of the sample (Hajibabaei et al., 2007). These
sequences can be used for identification only or can also be used to analyse diversity
and be part of larger population genetic studies, if enough genetic variation is present
(Hajibabaei et al., 2007).
1.8. Past genetic studies on chimpanzees
Genetic studies on chimpanzees are common and diverse, and include assessments of
intraspecific diversity (e.g. Gonder et al., 1997; Becquet et al., 2007; Oates, Groves

FCUP A country-level genetic survey of the IUCN critically endangered western chimpanzee (Pan troglodytes
verus) in Guinea-Bissau
41
and Jenkins, 2009) and of genetic diversity and relatedness of individuals (e.g. for
planning reintroductions into native habitats, see Tutin et al., 2001), of sociality (e.g.
Morin et al., 1994; Langergraber, Mitani and Vigilant, 2009), and of intestinal
parasitology (e.g. Lilly, Mehlman and Doran, 2002) and symbiotic relationships (e.g. Sá
et al., 2013).
However, research of wild populations aiming at investigating patterns of diversity,
structure, and gene flow is still scarce, mainly due to the fact that obtaining accurate
genotypes from non-invasive collected samples is a costly and time-consuming
process (Vigilant, 2003).
The eastern chimpanzees have been studied at Gombe National Park and at Ugalla, in
Tanzania, and in Uganda, Rwanda, and the Democratic Republic of Congo. Morin et al.
(1993) amplified microsatellite loci and used mtDNA to study the eastern chimpanzees
from Gombe National Park, and found high levels of historical gene flow between
populations based on mtDNA. However, analyses based on microsatellites pointed to a
reduction of gene flow between populations and increased inbreeding, and suggested
a negative effect of habitat fragmentation or other type of human pressure upon genetic
structure (Morin et al., 1993). Constable et al. (2001) found no evidence of extra-group
paternity at Gombe National Park based on microsatellite data and suggested females
are usually capable of avoiding inbreeding even in the presence of relatives. Moore,
Langergraber and Vigilant (2015), who studied the group composition and the dispersal
patterns of the chimpanzees in Ugalla found evidences for male philopatry and
territorial communities, based on autosomal and Y-linked microsatellite markers. In this
population, the rarer Y-chromosome haplotypes were found in geographic proximity, in
locations which were identified by autosomal microsatellite markers analyses as
communities, while being distant from other geographic clusters of Y-chromosome
haplotypes. Chimpanzees in Uganda, Rwanda, Tanzania, and the Democratic Republic
of Congo display low haplotypic variance mainly within each population and signs of a
recent demographic expansion (Goldberg and Ruvolo, 1997), which was justified by
the authors as a likely consequence of the changes in the distribution of Eastern
African forests during the recent Pleistocene. The authors suggest that the cyclic
contraction and expansion of equatorial forests could have induced demographic
bottlenecks and a pattern of low genetic variability, whereas the subsequent global
warming and reforestation of those areas could have created a wavelike mismatch
distribution typical of growing populations.

FCUP A country-level genetic survey of the IUCN critically endangered western chimpanzee (Pan troglodytes
verus) in Guinea-Bissau
42
Population genetics research on the western chimpanzee includes the study by Vigilant
et al. (2001), who analysed the population at Taï National Park, Côte d’Ivoire. Similarly
to what was found for the Gombe National Park chimpanzee population in Tanzania by
Constable et al. (2001), Vigilant et al. (2001) found low levels of extra-group paternity.
Average relatedness for males was not significantly higher than for females, which
suggests that the social structure is bonded through relationships between males and
females, instead of being primarily male-bonded (Vigilant et al., 2001). Shimada et al.
(2004) used a fragment of the mtDNA to study the population structure of the western
chimpanzee populations at the Nimba Mountains, Guinea and Côte d’Ivoire, and in
Bossou, Guinea. The pattern of the AMOVA analysis conducted, which shows that the
majority of genetic variance is present within populations, suggests no clear patterns of
structure for any of the populations. The authors hypothesised that the studied
populations have diverged recently from a panmictic western chimpanzee ancestral
population, and not enough time has passed for the populations to accumulate
differences and acquire genetic structure.
In Guinea-Bissau, the only genetic assessment of chimpanzees is the one by Sá
(2013). This study made use of non-invasive DNA methods and mtDNA to study the
populations at Tombali, Quinara, and Gabú, with a special focus on the population at
CFNP. Sá (2013) accomplished a huge advance for the level of information available
on these specific populations, particularly to assess their demographic history and
historical patterns of dispersal. The author found high levels of mitochondrial genetic
diversity for the three populations, but a non-significant level of genetic differentiation.
The majority of genetic variance was found to arise from differences within populations
and could be explained by a pattern of isolation by distance. Furthermore, the author
found that the three most important barriers to gene flow in Guinea-Bissau were
located in the south of CFNP, between CFNP and Empada, and in the Gabú region.
Finally, demographic analyses revealed a pattern of recent expansion for the Guinea-
Bissau chimpanzees in the three populations considered.
1.9. Relevance, research questions, and hypotheses
The western chimpanzee conservation is urgent and of high relevance given the
intensity of threats faced by the subspecies in West Africa. This is especially true for
the population in Guinea-Bissau, which is highly threatened by factors of
environmental, political, and social nature. However, even being acknowledged that the
long-term conservation of chimpanzees in Guinea-Bissau is uncertain, only one genetic

FCUP A country-level genetic survey of the IUCN critically endangered western chimpanzee (Pan troglodytes
verus) in Guinea-Bissau
43
assessment based on mtDNA has been conducted for the species in the country (Sá,
2013). As such, a country-level complete genetic assessment of the western
chimpanzees is lacking, in particular information on the degree of gene flow between
the threatened population of CLNP and the understudied population of DNP is missing.
Absence of genetic baseline information based on different types of genetic markers is
limiting the design of management plans for these regions.
The present study aims at answering the following questions:
i) What are the levels of genetic diversity of the western chimpanzee in Guinea-
Bissau and how is the population structured?
ii) Was chimpanzee gene flow limited over the last generations in Guinea-Bissau?
What is the scale of effect of physical barriers upon chimpanzee dispersal
and gene flow?
iii) What are the historical demographic patterns of chimpanzees in Guinea-
Bissau?
iv) Is there current gene flow between Cufada Lagoons Natural Park and Dulombi
National Park?
I hypothesize the following:
i) Levels of genetic diversity are high and levels of population genetic structure
are low at both microsatellite and mtDNA markers.
Support: chimpanzee gene flow between localities have just recently
started to decrease (chimpanzees have a long generation time; and
putative physical barriers to dispersal, i.e. deforestation and habitat loss,
are recent and were aggravated during the last few years; Cassamá,
2006; Torres et al., 2010).
ii) mtDNA show less polymorphism than microsatellites.
Support: chimpanzees constitute a female-biased dispersing species.
FCUP A country-level genetic survey of the IUCN critically endangered western chimpanzee (Pan troglodytes
verus) in Guinea-Bissau
44
This research was conducted with the final goal of proposing management actions. The
chimpanzee populations presenting a higher risk of extinction, based on proxies such
as low genetic diversity and differentiation, are to be identified and investment can be
adjusted and directed on that basis. Conservation actions might include the creation of
new ecological corridors and an increased investment in education for local
communities with a focus on environmental responsibility and biodiversity conservation.
Broader law enforcement in the country may also be necessary, so that actions that
pose extinction risk for certain species, including chimpanzees, can be limited or
prevented.
This study represents the most complete genetic survey of chimpanzees in Guinea-
Bissau to date, which is expected to add great value to the current knowledge on
primate conservation in West Africa.

FCUP A country-level genetic survey of the IUCN critically endangered western chimpanzee (Pan troglodytes
verus) in Guinea-Bissau
45
2. Materials and Methods
2.1. Study Area
The Republic of Guinea-Bissau is located in West Africa (11º 46’ 20.45” N, -15º 10’
10.63” W) and is bordered to the north by Senegal, to the east and the south by the
Republic of Guinea, and to the west by the Atlantic Ocean. The country occupies a
surface area of 36,125 km2, which include a continental mainland and one archipelago,
the Bijagós (Figure 3).
The study area comprises four protected areas located in the southern region of the
country – Cantanhez Forest National Park (CFNP), Cufada Lagoons Natural Park
(CLNP), Dulombi National Park (DNP), and Boé National Park (BNP) – and areas
outside the parks located in the region of Empada, near the village of Catió and on the
southern margin of the Buba River (Figure 4).
Figure 3. Location of the Republic of Guinea-Bissau in West Africa. The Bijagós archipelago is highlighted by an arrow.
Produced using QGIS v. 2.18.0.

FCUP A country-level genetic survey of the IUCN critically endangered western chimpanzee (Pan troglodytes
verus) in Guinea-Bissau
46
2.2. Genetic Data
Genetic data was obtained from two sources: 1) generated by the present study from
samples collected in 2015 and 2016 in CLNP and DNP by M.J. Ferreira da Silva and
collaborators (Ferreira da Silva, 2016b, 2016c); and 2) a genetic database generated
by Rui Sá during his Ph.D. studies (2008 – 2013) at the Cardiff University School of
Biosciences, in the United Kingdom, from samples collected in 2008 and 2010 in
Guinea-Bissau (at CFNP, Empada, CLNP, and BNP; Sá, 2013; Figure 4).
Figure 4. Study area and sampling sites, which include the four protected areas marked in brown and Empada.
Sources: IBAP, INEP, C. Sousa. Produced using QGIS v. 2.18.0.
2.2.1. Genetic data generated by the present study
2.2.1.1. Sampling
Two expeditions were carried out in December 2015 and February 2016 to the Guinea-
Bissau protected areas of CLNP and DNP to collect samples of primate species as part
of a larger study entitled PRIMACTION: Protecting the Western Chimpanzee and
primates species from illegal logging and bushmeat hunting in Guinea-Bissau (Ferreira
da Silva, 2015, 2016a, 2017). During those expeditions, 165 faecal samples putatively

FCUP A country-level genetic survey of the IUCN critically endangered western chimpanzee (Pan troglodytes
verus) in Guinea-Bissau
47
assigned to P. t. verus – 127 from CLNP and 38 from DNP – were collected. Faecal
samples were collected below or in close proximity to chimpanzee nests and/or
chimpanzee footprints and areas used by the animals, such as crop areas, roads, and
freshwater courses (Ferreira da Silva, 2016b, 2016c). Samples were preserved
following the procedure described by Roeder et al. (2004): approximately 5 g of the
outer layer of the faecal material was collected and stored at room temperature in 98%
ethanol during 24 hours, after which the faecal material was transferred to a second
tube containing silica gel (Type III, S-7625, indicating for desiccation, Sigma-Aldrich®
Company Ltd, Dorset, U.K.). For each sample collected in the field, it was registered an
individual code, region, place, Global Positioning System (GPS) coordinates, status of
freshness, and the sex and age of the individuals if the group was observed. Eleven
faecal samples collected by park guards in CLNP for which GPS information was not
registered were excluded from the dataset at a later stage. Additionally, one tissue
sample was obtained from a run over individual found in the road connecting CLNP to
Quebo – Mampatã – (Figure 4) in 2010 by a park guide (Figure S1 and Figure S2,
Supplementary Material). The tissue sample was preserved in 98% ethanol.
2.2.1.2. DNA Extraction
Two different DNA extraction protocols – Costa et al. (in revision) and Vallet et al.
(2008, adapted by Quéméré et al., 2010) – were used in order to compare the relative
extraction success and select the best extraction protocol considering the faecal
samples to be used. Therefore, 21 faecal samples were randomly selected and two
different approaches were used to evaluate the extraction success of the two protocols:
1) total DNA concentration was measured in a Thermo ScientificTM NanoDrop 2000
spectrophotometer; and 2) the amplification success of a set of 11 microsatellite loci
used by Sá (2013) was compared between protocols.
After assessing that the method by Vallet et al. (2008, adapted by Quéméré et al.,
2010) was more efficient (see Results section), the remaining 144 samples were
extracted following this protocol.
DNA extraction was carried out at Instituto Gulbenkian de Ciência (Oeiras, Lisbon,
Portugal) between August and October 2016. The procedure was conducted in a
laboratory dedicated to non-invasive DNA extractions, inside a laminar flow hood. Each
batch of DNA extractions was formed by 23 samples and took three days to complete.
In the first day, a bean size portion of the surface of the faecal samples was cut and left

FCUP A country-level genetic survey of the IUCN critically endangered western chimpanzee (Pan troglodytes
verus) in Guinea-Bissau
48
to incubate overnight in a heated CTAB 2% solution with agitation, which would
promote lysis of the cells. During the second day of extraction, phenol-chloroforme-
isoamyl solution, CTAB 10%, proteinase k, and chloroforme-isoamyl were used to
promote a second lysis. The DNA was left to precipitate overnight in isopropanol at -20
ºC and purified twice with 70% ethanol. DNA was eluted in 60 to 80 l of preheated TE
(Tris and EDTA) solution. Vallet et al. (2008, adapted by Quéméré et al., 2010) use
phase separation to capture the DNA instead of the spin columns employed in
commercial kits, which makes this protocol more cost-efficient.
After extraction, the DNA concentration was quantified in a Thermo ScientificTM
NanoDrop 2000 spectrophotometer. DNA extracts with a concentration above 1,000
ng/L were diluted to a final DNA concentration of between 500 and 1,000 ng/l. The
dilution with elution solution intended to prevent inhibition of the PCR reactions with
excess of total DNA present in the extracts (which includes DNA extracted from diet
items and bacterial DNA). The dilution volumes to be used according to the DNA
concentration measured in the Thermo ScientificTM NanoDrop 2000 spectrophotometer
have been defined by previous studies that used primate faecal DNA (I.A. Pais,
personal communication).
Special precautions were taken to avoid contamination from exogenous sources of
DNA, which included: 1) decontamination of the laminar hood where the extractions
took place by a 30 minutes ultra-violet (UV) light irradiation prior to DNA extraction and
when necessary between steps of the extraction protocol; 2) frequent change of
gloves; 3) DNA decontamination of the hood and extraction material (i.e. pipettes,
supports, and aluminium foil) with 30% bleach and 98% ethanol, carried out between
each step of the protocol; 4) use of sterile blazers, tweezers, and filter tips; and 5) use
of blank solutions to control for possible contamination from other sources of DNA
(such as human DNA) and/or for cross-contamination between samples.
DNA was extracted from the tissue sample (Figure 4) using the EasySpin® Extraction
Kit in columns for tissue and blood samples (QIAGEN, Germany). The sample was
used as a positive control and was included in all the procedures described below.
2.2.1.3. Genetic markers
Three types of genetic markers were used in the study – mtDNA, sexual chromosome-
linked markers, and autosomal microsatellite loci.

FCUP A country-level genetic survey of the IUCN critically endangered western chimpanzee (Pan troglodytes
verus) in Guinea-Bissau
49
2.2.1.3.1. Mitochondrial DNA
mtDNA was used to confirm the identification of the samples to the species level done
at the field (see section 2.2.1.3.1.1. – DNA Barcoding) and to study the genetic
diversity, population structure, and demographic history at a country-level scale (see
section 2.2.1.3.1.2. – Mitochondrial DNA control region).
2.2.1.3.1.1. DNA barcoding
Although the great majority of the faecal samples putatively assigned to chimpanzees
were collected below or in close proximity to chimpanzee nests, misidentification of the
species in the field is possible given that several primates in Guinea-Bissau occupy
and use the same geographical locations within protected areas (e.g. crop areas).
Therefore, to improve the optimisation phase of the microsatellite genotyping protocol
(i.e. definition of chimpanzee alleles and binning; see section 2.2.1.5.), it was
necessary to identify reference samples that had been molecularly confirmed to be
from chimpanzees. Thus, a molecular identification using mtDNA was carried out for
five samples, which were chosen based on the high amplification success for the
majority of the microsatellite markers (i.e. four samples) or because their multi-locus
genotype was very different from the remaining and could represent a different species
(i.e. one sample).
To perform DNA barcoding, four different primer pairs were tested: 1) OWMCOI
(Lorenz et al., 2005), which amplified a fragment of the cytochrome c oxidase subunit I
of approximately 700 bp, following the PCR protocols described by Minhós et al. (2013)
for tissue samples and by Teixeira (2016) for faecal samples; 2) GVL14724-H15149
(Gaubert et al., 2015), which amplified the first 402 bp of the cytochrome b (cyt b)
gene; 3) bush-COI (Gaubert et al., 2015), which are mammalian universal primers for a
400 bp fragment of the cytochrome c oxidase subunit I; and 4) bush-12S (Gaubert et
al., 2015), which are mammalian universal primers for a 500 bp fragment of the
ribosomal subunit 12S (Table I).
The mtDNA fragments were amplified in 10 L volume, using 5 L of 1x MyTaqTM Mix
(Bioline, England), 1 l of 10 M primer pair mix, and 1 L of DNA extract. PCRs were
performed in a T100TM BIO-RAD 96 Well Thermal Cycler, following the PCR cycling
conditions described by Gaubert et al. (2015): initial denaturation at 94 ºC for 2
minutes, followed by 35 cycles of denaturation at 92 ºC for 30 seconds, annealing at 50

FCUP A country-level genetic survey of the IUCN critically endangered western chimpanzee (Pan troglodytes
verus) in Guinea-Bissau
50
ºC for 30 seconds, and extension at 72 ºC for 30 seconds, with a final extension step of
15 minutes at 72 ºC. PCRs were tested using gel electrophoresis (300 V), 2% agarose
gels, and 0.1% bromophenol blue. The results were visualized using an UV
transilluminator with camera (BIO-RAD Gel DocTM XR+ Gel Documentation System).
PCR products were subjected to an enzymatic clean-up by ExoSAP-ITTM PCR Product
Cleanup (Exonuclease I and Shrimp Alkaline Phosphatase) by Applied BiosystemsTM,
which included a step of 15 minutes at 37 ºC and of 15 minutes at 85 ºC, following the
manufacturer’s instructions, to remove excess primers and nucleotides. Samples were
sequenced bi-directionally using the BigDye® Terminator Cycle Sequencing Kit,
following the manufacturer’s protocol, and run on a 3130xl Applied Biosystems®
automated sequencer.
Table I. Details on the four primer pairs used for mitochondrial DNA barcoding of the samples included in the study:
mitochondrial region – cytochrome c oxidase subunit I (COI), cytochrome b, and ribosomal subunit 12S –, primers and
respective sequences, and references.
Mitochondrial
Region Primers Sequence (5’-3’) Reference
COI OWMCOIF (A/G)CT(G/C)TTTTCAACAAA(C/T)CA(C/T)AAAGAC
Lorenz et al., 2005 OWMCOIR GTA(A/G)ACTTC(G/C)GGGTG(A/G)CC(A/G)AAGAATC
Cytochrome b GVL14724 GATATGAAAAACCATCGTTG
Gaubert et al., 2015 H15149 CTCAGAATGATATTTGTCCTCA
COI bush-COIF CACAAACCACAAAGAYATYGG
Gaubert et al., 2015 bush-COIR TCAGGGTGTCCAAARAAYCA
Ribosomal
subunit 12S
bush-12SF GGGATTAGATACCCCACTATGC Gaubert et al., 2015
bush-12SR GTGACGGGCGGTGTGT
Sequences were visually corrected and manually edited using the software Geneious
v. 4.8.5 (Kearse et al., 2012). The cyt b fragments (Gaubert et al., 2015) were
subjected to a Basic Local Alignment Search Tool (BLAST; Altschul et al., 1990) in the
National Center for Biotechnology Information (U.S. National Library of Medicine,
available at http://www.ncbi.nlm.nih.gov) to search for vouchers presenting the highest
scores of identity when compared to the samples.
2.2.1.3.1.2. Mitochondrial DNA control region
Eleven samples (nine from CLNP and two from DNP), which presented high
amplification success for the majority of the microsatellite markers and that were from
different individuals, were sequenced for a 600 bp fragment of the mtDNA control

FCUP A country-level genetic survey of the IUCN critically endangered western chimpanzee (Pan troglodytes
verus) in Guinea-Bissau
51
region (D-loop) using the primers L15926 and H16555 (Shimada et al., 2004). This
genetic marker was previously used by Sá (2013) to analyse samples collected in
Guinea-Bissau (Table II).
The fragments were amplified in 10 L volume, using 5 L of 1x MyTaqTM Mix (Bioline,
England), 1 l of 10 M primer pair mix, and 1 L of DNA extract. PCRs were
performed in a T100TM BIO-RAD 96 Well Thermal Cycler, following the PCR cycling
conditions described by Sá (2013): initial denaturation at 95 ºC for 15 minutes, followed
by 45 cycles of denaturation at 94 ºC for 30 seconds, annealing at 51 ºC for 60
seconds, and extension at 72 ºC for 60 seconds, with a final extension step of 10
minutes at 72 ºC. PCRs were tested using gel electrophoresis (300 V), 2% agarose
gels, and 0.1% bromophenol blue. The results were visualized using an UV
transilluminator with camera (BIO-RAD Gel DocTM XR+ Gel Documentation System).
PCR products were subjected to an enzymatic clean-up using ExoSAP-ITTM PCR
Product Cleanup (Exonuclease I and Shrimp Alkaline Phosphatase) by Applied
BiosystemsTM to remove excess primers and nucleotides. PCR product clean-up by
ExoSAP-ITTM included a step of 15 minutes at 37 ºC and of 15 minutes at 85 ºC,
following the manufacturer’s instructions. Samples were sequenced bi-directionally
using the BigDye® Terminator Cycle Sequencing Kit, following the manufacturer’s
protocol, and run on a 3130xl Applied Biosystems® automated sequencer.
Table II. Details on the primer pair amplifying a fragment of the mitochondrial DNA control region, previously used by Sá
(2013).
Mitochondrial
Region Primers Sequence (5’-3’) Reference
Control region
(D-loop)
L15926 TACACTGGTCTTGTAAACC Sá, 2013, following Shimada
et al., 2004 H16555 TGATCCATCGTGATGTCTTA
Sequences were visually corrected and manually edited using the software Geneious
v. 4.8.5 (Kearse et al., 2012). All polymorphic positions were re-checked manually at
each chromatogram. The consensus sequence for each sample was created by
aligning the forward and reverse sequences.
The presence of nuclear mitochondrial DNA segments (NUMTs) was tested by
comparison with the sequences deposited in the chimpanzees’ NUMTs database
MITOMAP (Lott et al., 2013). The assignment of the sequences to the species was

FCUP A country-level genetic survey of the IUCN critically endangered western chimpanzee (Pan troglodytes
verus) in Guinea-Bissau
52
confirmed by comparison with the reference sequence for Pan troglodytes [GenBank
Access No.: X93335] (Arnason, Xu and Gullberg, 1996).
2.2.1.3.2. Sex molecular determination
The sex of the individuals was determined using the amelogenin system (Sullivan et
al., 1993; also used by Sá, 2013). This marker was included in multiplex PCR 3 (M3;
see section 2.2.1.4. and Table III), and amplified and sequenced together with the
microsatellite loci. For the sex determination marker, the result was considered correct
if observed at least three times over the four repetitions performed (see section
2.2.1.5.2.).
2.2.1.3.3. Microsatellite loci
A set of 21 autosomal and one Y-associated microsatellite markers were used to
genotype the samples. The microsatellite loci used in this study are human-derived
with cross-amplification in Pan troglodytes verus samples (Sá, 2013, after Gusmão et
al., 2002 and Roeder, Jeffery and Bruford, 2006) and in other non-human primate taxa,
such as Papio papio (Ferreira da Silva et al., 2014), and Colobus polykomos and
Procolobus badius temminckii (Minhós et al., 2013). 12 markers (including the sex
determination system) to be included in this study were selected to match the loci used
by Sá (2013) in order to analyse the genotypes generated by this study together with
the genotypes generated by Sá (2013). However, two of the 14 markers used by Sá
(2013) – D1s550 and DQCAR – were not included in this study as their amplification
success had been reported to be very low (Sá, 2013).
The microsatellite loci included in this study were amplified in multiplex PCRs. The
multiplex PCRs including loci in common to those used by Sá (2013) were re-optimised
to improve amplification success and to account for differences in comparison to the
procedure carried out by Sá (2013; see section 2.2.1.4.). These differences included
the type of fluorescence and equipment used.
2.2.1.4. Optimisation of the microsatellite loci multiplex PCR
Multiplex Manager v. 1.2 (Holleley and Geerts, 2009) was used to assemble 22
microsatellite loci in five multiplex PCRs (M1, M2, M3, M4, and M5). Multiplex Manager

FCUP A country-level genetic survey of the IUCN critically endangered western chimpanzee (Pan troglodytes
verus) in Guinea-Bissau
53
uses information on expected annealing temperature, fragment size, and fluorescence
colour of each locus to select the loci that should be assembled in the same multiplex
PCR, in order to successfully co-amplify loci using the same annealing temperature
and identify the loci with an overlapping amplified size. Expected annealing
temperatures of the loci were estimated based on the nucleotide sequences of the
primers using Multiplex Manager and on the optimum annealing temperatures
described by Sá (2013) for the multiplex PCRs optimised for Guinea-Bissau
chimpanzees. To account for the possibility of new alleles in samples from unstudied
populations, 20 bp were added in each extremity of the fragment sizes estimated by Sá
(2013). The concentration of each primer pair started by being equal in each multiplex
but was adjusted during the optimisation process to counterbalance the differences
visible in the chromatograms in amplification success between loci. At the end of this
process, the microsatellite loci used by Sá (2013) were grouped in three multiplex
PCRs (M1, M2, and M3; 11 microsatellite loci and the sex determination system) and
the microsatellite loci used by Ferreira da Silva et al. (2014) and Minhós et al. (2013)
for other primate species were grouped in M4 (six loci) and M5 (five loci).
Non-fluorescent primers, fluorescent universal primers, and primer tails (Schuelke,
2000) were used in M1, M2, and M3 instead of fluorescent-labelled specific primers, in
order to improve cost-effectiveness of the amplification phase (see Table III for details
on the composition of each multiplex). Primers included in M4 and M5 were
fluorescent-labelled.

FCUP A country-level genetic survey of the IUCN critically endangered western chimpanzee (Pan troglodytes
verus) in Guinea-Bissau
54
Table III. Description of the five Multiplex Polymerase Chain Reactions after the optimisation process. Annealing
temperature (AT), loci in each multiplex, primer sequences, repeat type/motif, fluorescent dye, and final PCR
concentration (C). N.A. – not applicable. Repeat types identified with a “4” refer to tetranucleotide loci for which the
repetition motifs have not been identified. Note that amelogenin was the molecular method used to determine the sex of
the samples and is not a microsatellite locus (see section 2.2.1.3.2.).
Multiplex AT (ºC) Locus Forward Primer (5’-3’)
Reverse Primer (5’-3’)
Repeat
Type/Motif Dye C (M)
M1 64 ºC
D5s1457 TAGGTTCTGGGCATGTCTGT
GATA FAM 0.0875 TGCTTGGCACACTTCAGG
D13s159 AGGCTGTGACTTTTAGGCCA
CA FAM 0.2 CCAGGCCACTTTTGATCTGT
D2s1326 AGACAGTCAAGAATAACTGCCC
TCTA NED 0.175 CTGTGGCTCAAAAGCTGAAT
M2 Touchdown
62.5 ºC – 55 ºC
D10s1432 CAGTGGACACTAAACACAATCC
TCTA VIC 0.15 TAGATTATCTAAATGGTGGATTTCC
D16s2624 TGAGGCAATTTGTTACAGAGC
TCTA NED 0.15 TAATGTACCTGGTACCAAAAACA
D1s207 CACTTCTCCTTGAATCGCTT
CA PET 0.175 GCAAGTCCTGTTCCAAGTCT
D14s306 AAAGCTACATCCAAATTAGGTAGG
GATA PET 0.2 TGACAAAGAAACTAAAATGTCCC
DYs439 TCCTGAATGGTACTTCCTAGGTTT
GATA PET 0.3125 GCCTGGCTTGGAATTCTTTT
M3 59.5 ºC
D6s311 ATGTCCTCATTGGTGTTGTG
CA FAM 0.1 GATTCAGAGCCCAGGAAGAT
D4s1627 AGCATTAGCATTTGTCCTGG
GATA VIC 0.125 GACTAACCTGACTCCCCCTC
amelogenin CCTGGGCTCTGTAAAGAATAGTG
N.A. VIC 0.0625 ATCAGAGCTTAAACTGGGAAGCTG
HUMFIBRA GCCCCATAGGTTTTGAACTCA
CTTT NED 0.075 TGATTTGTCTGTAATTGCCAGC
M4 58 ºC
D6s501 GCTGGAAACTGATAAGGGCT
CTAT FAM 0.075 GCCACCCTGGCTAAGTTACT
D7s2204 TCATGACAAAACAGAAATTAAGTG
AGAT FAM 0.125 AGTAAATGGAATTGCTTGTTACC
D4s2408 AATAAACTTCAACTTCAATTCATCC
ATCT HEX 0.075 AGGTAAAGGCTCTTCTTGGC
D1s548 GAACTCATTGGCAAAAGGAA
4 PET 0.075 GCCTCTTTGTTGCAGTGATT
D11s2002 CATGGCCCTTCTTTTCATAG
4 NED 0.1 CCTCCCCCTAATGCTGGTAT
Fesps GGAAGATGGAGTGGCTGTTA
4 HEX 0.0625 CTCCAGCCTGGCGAAAGAAT
M5 58 ºC
D13s765 TGTAACTTACTTCAAATGGCTCA
GATA NED 0.075 TTGAAACTTACAGACAGCTTGC
D6s474 TGTACAAAAGCCTATTTAGTCAGG
4 HEX 0.0875 TCATGTGAGCCAATTCCTCT-
D6s1056 ACAAGAACAGCATGGGGTAA
4 FAM 0.1 GCATGGTGGACTATTTGGAT
D1s1665 TAAGTAAGTTCAAATTCATCAGTGC
4 PET 0.1125 TTCCAAGCTTCACAGTGTCA
D6s503 CGGTTCAGTCCATAGCAACT
4 HEX 0.075 TCCAAACTTTAAAATGTCCTAACAA

FCUP A country-level genetic survey of the IUCN critically endangered western chimpanzee (Pan troglodytes
verus) in Guinea-Bissau
55
Microsatellite loci were amplified in 10 L final volume PCR, using 2 L of DNA extract.
PCR final concentrations were 1x QIAGEN Multiplex PCR Master Mix® (QIAGEN,
Germany) or MyTaqTM Mix (Bioline, England) and 1 L of the respective multiplex
primer mixture. All multiplex PCR cycling conditions started with a HotStart DNA
Polymerase activation step of 15 minutes at 95 ºC, followed by 40 cycles of a
denaturation step of 30 seconds at 94 ºC, an annealing step of 60 seconds with varying
temperatures depending on the multiplex (see Table III for annealing temperatures of
each multiplex PCR), and an extension step of 60 seconds at 72 ºC. Each PCR ended
with a final extension of 10 minutes at 72 ºC and a deactivation step of 15 minutes at 4
ºC. Negative controls were included in all reactions to control for contaminations. PCRs
were performed in a T100TM BIO-RAD 96 Well Thermal Cycler. PCRs were conducted
in a room dedicated to non-invasive PCRs available at CIBIO-InBIO (University of
Porto, Portugal) facilities. Several precautions were taken to limit cross-contamination
between samples and contamination from external sources of DNA, which included the
decontamination of all the material used by UV light for a minimum of 20 minutes and
the use of sterile filter tips, disposable lab coats, head caps, face masks, and two pairs
of gloves, which were replaced frequently. Moreover, both extraction and PCR negative
controls were included, as well a DNA sample from the person extracting the DNA and
carrying out the PCRs (F. Borges).
PCRs were tested using gel electrophoresis (300 V), 2% agarose gels, and 0.1%
bromophenol blue. The results were visualized using an UV transilluminator with
camera (BIO-RAD Gel DocTM XR+ Gel Documentation System). PCR products from
M1, M2, and M3 were multi-loaded (12 markers, Table III), and M4 and M5 were each
run separately. All PCR products were run on a 3130xl Applied Biosystems® automated
sequencer using GeneScanTM 500 LIZTM size standard (Thermo Fisher Scientific,
United States of America).
2.2.1.5. Genotyping, quality control, and identification of
repeated genotypes
2.2.1.5.1. Genotyping
Bins were created for each allele of each locus using the software GeneMapper® v.
5.0. The bins were created based on alleles from samples molecularly identified as
chimpanzees (see section 2.2.1.3.1.1. – DNA barcoding) and allowed for a variance of

FCUP A country-level genetic survey of the IUCN critically endangered western chimpanzee (Pan troglodytes
verus) in Guinea-Bissau
56
0.4 to 0.8, in order to account for variance of allele sizes related to different runs. Allele
scoring followed a semi-automated procedure, i.e. automated allele calling was
followed by visual confirmation, which allowed minimising the level of scoring-related
errors.
2.2.1.5.2. Quality control procedures
A series of procedures were employed to minimise the errors that are associated with
the genotyping process of non-invasive samples collected from unhabituated
individuals. These errors are acknowledged to potentially affect and bias the results
and conclusions attained (Bonin et al., 2004; Pompanon et al., 2005) and comprise the
inclusion of genotypes from other species and of low quality genotypes in the database
and the presence of null alleles, ADO, and FA (Pompanon et al., 2005).
To discard the possibility that alleles from different species were wrongly included in
the dataset, bins specific of chimpanzees were created. For this, a set of samples from
different species was used, which included the samples from chimpanzees identified by
the DNA barcoding method (see section 2.2.1.3.1.1.), human DNA samples, and other
samples belonging to different primate species (i.e. baboons).
To discard the samples with low amplification potential and/or genotypes of lower
quality at an early phase of the genotyping procedure, the following strategy was
adopted. All the samples extracted were amplified three times for multiplexes 1, 2 and
3, and sequenced. A preliminary quality index (QI, i.e. a standard metric to assess the
quality of the consensus genotype when using the multi-tubes approach; Miquel et al.,
2006) was estimated. Each replicate received a classification of zero or one when the
genotype was different or equal to a preliminary consensus genotype, respectively. The
mean across the three replicates was calculated per locus and across loci per sample.
Samples with a QI < 0.5 across loci or that had amplified less than six out of the 12
markers (including the Y-associated microsatellite and the sex determination system)
were discarded.
A multi-tubes approach (Taberlet et al., 1996) was followed to define the consensus
genotype of each sample per locus. For this procedure, each sample was amplified
multiple times for each locus and the different replicates were compared to reach a
consensus genotype (Dewoody, Nason and Hipkins, 2006). A maximum likelihood
approach implemented in Pedant v. 1.0 (Johnson and Haydon, 2007a) was used to
determine the number of repetitions necessary to obtain reliable consensus genotypes

FCUP A country-level genetic survey of the IUCN critically endangered western chimpanzee (Pan troglodytes
verus) in Guinea-Bissau
57
(Table SI, Supplementary Material). To estimate preliminary ADO and FA error rates,
50 samples from CLNP that exhibited the highest QI (i.e. QI > 0.56) across three
repeats were selected. Samples from DNP were not included given that potential
population substructure between the two geographic populations could affect the
calculations described below (Johnson and Haydon, 2007a, 2007b). However, since all
the samples were collected, stored, and processed using similar procedures, it was
assumed that samples collected at DNP would show similar preliminary ADO and FA
error rates as those estimated for samples collected at CLNP. The analyses conducted
using Pedant require only two replicates but information for three replicates from the 50
samples was available at this point. Therefore, two replicates showing the highest
variability in alleles were selected for each locus, in order to include the highest
possible rate of genotyping errors in the analyses.
The software GEMINI v. 1.3.0 (Valière et al., 2002) was used to estimate the minimum
number of PCR repetitions across loci which would guarantee a high level of
confidence in the genotypes. The analyses in GEMINI use the preliminary ADO and FA
rates estimated by Pedant and the expected heterozygosity per locus, which was
estimated using Excel-Microsatellite-Toolkit (Park, 2001). A total of 100 simulations
were run in GEMINI v. 1.3.0 for values between two and 12 replicates. An asymptote
was reached at four replicates (95% confidence level), which suggests that the
reliability of the genotypes could not be significantly increased by performing more than
four repetitions. This software was also used to calculate the consensus threshold per
locus, i.e. the minimum number of times an allele needs to be observed over the four
replicates to be considered as a true allele. After the fourth amplification per locus and
per sample was carried out, a consensus genotype was reached based on the
consensus threshold generated by GEMINI and following a preliminary set of rules: i)
an allele was confirmed if appearing at least the number of times indicated by the
consensus threshold across the four amplifications; ii) homozygote individuals were
confirmed by a minimum of three amplifications if the consensus threshold was of two
and by a minimum of two amplifications if the consensus threshold was of three; iii)
special attention was given to loci with a consensus threshold of one, as non-
amplifications could more severely affect the outcomes; in these cases, homozygote
individuals were only genotyped in the case of four positive amplifications and
heterozygote individuals were genotyped in the case of at least three consistent
positive amplifications. For the Y-associated microsatellite marker, the consensus
genotype was achieved if the allele was observed at least twice across the four
repetitions, even if two non-amplifications occurred.

FCUP A country-level genetic survey of the IUCN critically endangered western chimpanzee (Pan troglodytes
verus) in Guinea-Bissau
58
The samples that have remained in the analyses pipeline (i.e. samples with a QI > 0.5
across loci in M1, M2, and M3 or that had amplified in more than six out of 12 markers)
were amplified for M1, M2, and M3 multiplex PCRs for a fourth replica and four times
for M4 and M5, and scored using the rules defined after the analyses in Pedant and
GEMINI.
After reaching the final consensus genotype using four replicates per locus for 22
microsatellite loci (including the Y-linked microsatellite) and for the amelogenin sex
determination marker, a final QI across loci was calculated per sample. However, it
was observed that non-amplifications were markedly affecting the consensus genotype
attained. This was regarded as a potential source of bias for discarding the genotypes
that had a high proportion of missing data but high quality in the consensus genotypes
of scored loci.
To assess the impact of including samples with a QI < 0.5 across the 21 autosomal
microsatellite loci in the final dataset, three datasets including samples with a minimum
QI of 0.40, 0.50, and 0.55 were created. The presence of typing and genotyping errors
was tested for the three datasets using a series of analyses. Excel-Microsatellite-
Toolkit (Park, 2001), which tests for typing errors, and Micro-Checker v. 2.2.3 (Van
Oosterhout et al., 2004), which allows the detection of putative null alleles and of
scoring errors due to stuttering and large ADO, were used. Departures from Hardy-
Weinberg Equilibrium (HWE; Crow and Dove, 1988) were tested for each locus using
GenAlEx v. 6.503 (Peakall and Smouse, 2006, 2012) and the significance level was
corrected using the Bonferroni correction for multiple comparisons (Dunn, 1958, 1961).
Departures from HWE were estimated to identify heterozygosity deficiency, which can
indicate high levels of ADO (Dewoody, Nason and Hipkins, 2006; Selkoe and Toonen,
2006). A Factorial Correspondence Analysis (FCA) was conducted in GENETX v. 4.0
(Belkhir et al., 1996) for each dataset to identify the most distinctive samples, which
could be wrongly genotyped. STRUCTURE v. 2.3.4 (Pritchard, Stephens and Donnelly,
2000) was used to evaluate the possible differences between the three datasets in
genetic clustering of individuals caused by the inclusion of genotypes of different
reliability levels. A total of five independent simulations with 50,000 Markov Chain
Monte Carlo (MCMC) steps following a burn-in of 50,000 iterations were conducted,
with K (optimal number of genetic clusters) set to be from 1 to 10. The admixture model
was chosen, allele frequencies were considered as correlated, and the initial value of
alpha was set to 1.0 (Falush, Stephens and Pritchard, 2003). The results were
processed in Structure Harvester v. 0.6.94 (Earl and vonHoldt, 2012) and the most

FCUP A country-level genetic survey of the IUCN critically endangered western chimpanzee (Pan troglodytes
verus) in Guinea-Bissau
59
probable K was estimated using the Evanno method (Evanno, Regnaut and Goudet,
2005) and the posterior probability of K (Pritchard, Stephens and Donnelly, 2000).
Results of STRUCTURE for the datasets of minimum QI of 0.40, 0.50, and 0.55 were
compared.
Additionally, ADO and FA rates were calculated per locus following Broquet and Petit
(2004) and using all the replicates per sample. ADO was calculated as the ratio
between the number of amplifications involving the non-amplification of one allele and
the number of positive amplifications of individuals determined as heterozygous. The
FA rate was determined by dividing the number of amplifications in which one or more
faulty allele was detected by the number of positive amplifications for both homozygous
and heterozygous individuals. Amplification success per locus was also calculated, by
dividing the sum of positive amplifications across samples by the sum of the total
number of amplifications (positive and negative) across samples.
Following the results of the comparison between the three datasets and of the
calculation of error rates (see section 3.1.4.1), a new set of rules was applied to reach
the consensus genotype for all the samples: i) an allele was confirmed if appearing at
least the number of times indicated by the consensus threshold across the four
amplifications; ii) homozygote individuals were confirmed by the minimum of two
coherent amplifications if the consensus threshold was of one or two, disregarding non-
amplifications; iii) for loci with a consensus threshold of one, heterozygote individuals
were genotyped only in the case of at least two positive amplifications. The rules for the
Y-associated marker were maintained as described before. The QI (Miquel et al., 2006)
was recalculated per sample. Samples with QI above 0.4 were maintained in the final
dataset and all other samples were removed.
2.2.1.5.3. Detection of repeated individuals
Excel-Microsatellite-Toolkit (Park, 2001) was used to identify duplicate genotypes.
Samples with the same genotype for all the loci scored and samples only distinguished
by one homozygote locus were considered as repeated genotypes. The duplicated
sample with the lowest QI and/or higher amount of missing data was removed from the
dataset.
To guarantee that the 10 autosomal microsatellite loci had the power to distinguish
between unique individuals, three tests were conducted. The probability of identity (PI)
– the probability that two individuals sampled randomly from the population have the
FCUP A country-level genetic survey of the IUCN critically endangered western chimpanzee (Pan troglodytes
verus) in Guinea-Bissau
60
same genotype at all typed loci (Waits, Taberlet and Luikart, 2001) – and the
probability of identity between siblings (PIsibs) were estimated in GenAlEx v. 6.503
(Peakall and Smouse, 2006, 2012). A genotype accumulation curve was generated in
the R v. 3.3.2 software environment (R Development Core Team, 2016), using RStudio
v. 1.0.143 (RStudio Team, 2016) and the packages adegenet (Jombart, 2008), poppr
(Kamvar, Tabima and Grünwald, 2014), and ggplot2 (Wickham, 2009). The genotype
accumulation curve is a function that randomly samples loci without replacement and
counts the number of multi-locus genotypes observed. As the PI and PIsibs curves, it
reaches an asymptote at the number of loci necessary to discriminate between
different individuals.
2.2.2. Genetic data produced by Sá (2013)
Rui Sá (hereafter RS) – currently Professor at the Lusophone University of Guinea,
Guinea-Bissau, and Associate Researcher at the Research Centre for Anthropology
and Health, University of Coimbra, Portugal – gently provided the author of the present
study with a genetic dataset to be used for comparative purposes and to provide
genetic information for a wider area of the country.
RS analysed 500 faecal samples putatively assigned to chimpanzee during his Ph.D.
project between 2008 and 2010 (Sá, 2013). Samples were collected across Guinea-
Bissau, in CFNP, Empada, CLNP, and BNP (Figure 4). RS dataset includes 185
mtDNA control region (D-Loop) sequences from unique individuals (Sá, 2013) and 369
unpublished microsatellite loci genotypes (Sá, 2013). RS geo-referenced 326 samples.
Samples for which GPS information was unavailable were excluded from the analyses.
The samples were extracted and genotyped for 12 autosomal microsatellite loci, for
one Y-associated microsatellite locus, and for the amelogenin sex determination
system by RS at the Cardiff University School of Biosciences (Table SII,
Supplementary Material). M.J. Ferreira da Silva allele called the samples and
implemented a set of rules to score the alleles, using a similar methodology to that
described in 2.2.1.5.2. (i.e. based on a maximum likelihood approach implemented in
the software Pedant v. 1.0 (Johnson and Haydon, 2007a) and GEMINI v. 1.3.0 (Valière
et al., 2002) and using a consensus threshold per locus). To be able to use the genetic
data produced by RS and the data produced during this project together (see 2.2.4. for
details on allele calibration), preliminary tests similar to those outlined in 2.2.1.5. were
performed using RS dataset and the final consensus genotype was defined following

FCUP A country-level genetic survey of the IUCN critically endangered western chimpanzee (Pan troglodytes
verus) in Guinea-Bissau
61
the set of rules described in 2.2.1.5.2. The QI was calculated following Miquel et al.
(2006) per sample across loci.
2.2.3. Merging the mitochondrial DNA datasets
The mtDNA sequences generated by RS (157 samples) and during this study (11
samples) were aligned together with the chimpanzee reference sample [GenBank
Access No.: X93335] (Arnason, Xu and Gullberg, 1996), as described by Sá (2013).
Sequences were trimmed to the length of the shortest sequence in Geneious v. 4.8.5
(Kearse et al., 2012).
2.2.4. Merging the datasets of genotypes
To be able to use the genetic dataset of genotypes generated by this study (hereafter
named FB dataset) and the one comprising the genotypes by RS (hereafter RS
dataset) together, a procedure to control for possible shifts of allele sizes was
implemented. Although both genetic datasets use a set of common genetic markers
(see section 2.2.1.3.3.), allele size shifts are expected since RS genotyped the
samples collected in 2008 and 2010 at the Cardiff University School of Biosciences,
United Kingdom, using primers with incorporated fluorescence, whereas FB genotyped
the samples collected in 2015 and 2016 at CIBIO-InBIO, University of Porto, Portugal,
using fluorescent universal primers and primer tails. Allele size shifts may arise from
differences between the genotyping procedures, including the fluorescence of the
primers, the protocols employed, the equipment used, and the size standard included
in the sequencing reaction. The conversion of allele sizes was performed for the 12 loci
included in M1, M2, and M3 (Table III).
28 samples were used to make the conversion of alleles between datasets. During this
process, the same genetic markers (i.e. sex determination protocol and microsatellite
loci) were amplified for samples included in RS dataset using FB amplification system
to test for deviations in allele size.
Since the DNA extracts obtained by RS were unavailable, the DNA from 11 faecal
samples collected by RS in 2008 and from 17 faecal samples collected in 2010 was re-
extracted. Both sets of samples were collected in CFNP and stored at the Cardiff
University School of Biosciences for the last seven and nine years, respectively. For
the 2008 samples, the DNA was extracted using Vallet et al. (2008, adapted by

FCUP A country-level genetic survey of the IUCN critically endangered western chimpanzee (Pan troglodytes
verus) in Guinea-Bissau
62
Quéméré et al., 2010) method at Instituto Gulbenkian de Ciência (Oeiras, Lisbon,
Portugal). For the 2010 samples, the DNA was extracted at a non-invasive DNA
extraction laboratory in CIBIO-InBIO (University of Porto, Portugal) using the QIAGEN
QIAamp DNA Stool Mini Kit (Qiagen, Germany) and following a modified DNA
extraction protocol (described in detail by Ferreira da Silva, 2012) and the precautions
to avoid contamination by other sources of DNA described in section 2.2.1.2.
After extraction, the DNA was amplified for M1, M2, and M3, whose composition is
indicated in Table III. However, the amplification of the loci in multiplex PCRs failed
consistently, and six samples from 2008 and five from 2010 were chosen to be
amplified in singleplex PCRs. Each locus was amplified in 10 L final volume PCR,
using 4 L of DNA extract. PCR final concentrations were 1x MyTaqTM Mix (Bioline,
England) and 1 L of a mixture containing the pair of primers (final PCR concentration
of 0.1 M) and the fluorescent tail. All singlepex PCR cycling conditions started with a
HotStart DNA Polymerase activation step of 15 minutes at 95 ºC, followed by 40 cycles
of a denaturation step at 94 ºC, an annealing step of 60 seconds, with the temperature
depending on the locus (see Table III), and an extension step of 60 seconds at 72 ºC.
The PCRs ended with a final extension of 15 minutes at 72 ºC. PCRs were performed
in a T100TM BIO-RAD 96 Well Thermal Cycler. Negative controls were included in all
reactions and a series of precautions to control for contaminations, which are described
in detail in section 2.2.1.4., were employed. PCR products were tested by gel
electrophoresis and then multi-loaded and sequenced as described in section 2.2.1.4.
The comparison between allele sizes for each locus among datasets was conducted
using a minimum of two reference samples per marker. The Y-linked microsatellite
exhibited only two alleles in Guinea-Bissau (Sá, 2013) and, therefore, one sample per
allele was used as reference for this locus.
Marker D14s306 was additionally amplified using HEX fluorescence incorporated
primers (Ferreira da Silva, 2012) because it was suspected that primers with PET
fluorescent tails were decreasing the amplification success of this marker. Therefore, a
double conversion was performed: firstly, samples from 2015/2016 were used to
convert between alleles using fluorescent tails (FB primers) and using incorporated
fluorescence (Ferreira da Silva, 2012 primers); afterwards, conversion was made
between FB and RS systems.
To test the accuracy of the conversion process, genotypes from samples collected at
CLNP from both datasets and that exhibited a QI of at least 0.5 were used to determine

FCUP A country-level genetic survey of the IUCN critically endangered western chimpanzee (Pan troglodytes
verus) in Guinea-Bissau
63
allele frequencies per locus. It was expected that the allele frequencies per locus were
similar between the two corresponding genotyping procedures (FB and RS) for
samples collected in the same geographic location (CLNP) but in different years. Allele
frequencies were estimated using Excel-Microsatellite-Toolkit (Park, 2001).
2.2.4.1. Quality control procedures and identification of
repeated genotypes
Samples included in RS dataset were genotyped for a maximum of 10 autosomal
microsatellite loci whereas samples included in FB dataset were genotyped for a
maximum of 21 autosomal microsatellite loci. When using a dataset combining FB and
RS data and including 21 autosomal microsatellite loci, RS genotypes have a higher
level of missing data (for 11 out of 21 loci), which could potentially have an effect on
the estimation of genetic diversity and population structure.
To test the effect of missing data on the combined dataset (FB + RS), preliminary
analyses of genetic diversity and population structure were performed using: 1) RS
dataset with 10 autosomal microsatellite loci and missing data for the remaining 11 loci,
and 2) FB + RS dataset including only the 10 loci for which the RS samples were
initially genotyped and that are common between the two datasets (therefore excluding
11 autosomal microsatellite loci from FB dataset).
Population substructure was estimated by a FCA carried out in Genetix (Belkhir et al.,
1996) and using STRUCTURE v. 2.3.4 (Pritchard, Stephens and Donnelly, 2000).
STRUCTURE was run using the same parameters as in 2.2.1.5.2. Departures from
HWE were tested using GenAlEx v. 6.503 (Peakall and Smouse, 2006, 2012) and
significant departures from HWE were corrected using the Bonferroni adjustment for
multiple comparisons (Dunn, 1958, 1961).
The analyses of genetic diversity and population structure were also compared for
different sets of samples using a minimum mean QI of 0.30, 0.40, and 0.45 across loci.
Additionally, the effect of non-amplifications on the QI value was tested by re-
calculating the QI (Miquel et al., 2006) using only the loci for which a consensus
genotype had been reached.
The presence of typing and genotyping errors was assessed for the combined dataset
using Excel-Microsatellite-Toolkit (Park, 2001) and Micro-Checker v. 2.2.3 (Van
Oosterhout et al., 2004), respectively. Micro-Checker tests for locus-specific

FCUP A country-level genetic survey of the IUCN critically endangered western chimpanzee (Pan troglodytes
verus) in Guinea-Bissau
64
heterozygosity deficiency due to null alleles, stutter band-related scoring errors, and
large ADO. Summary diversity statistics per locus and departures from HWE were
estimated using GenAlEx v. 6.503 (Peakall and Smouse, 2006, 2012), as
heterozygosity deficiency or excess can indicate possible genotyping errors. Linkage
disequilibrium (LD) between all pairs of loci was computed in Genepop v. 4.2
(Raymond and Rousset, 1995; Rousset, 2008), with a dememorization number of
10,000, using 1,000 batches and 1,000 iterations per batch.
Excel-Microsatellite-Toolkit (Park, 2001) was used to identify duplicate genotypes in RS
dataset, applying the rules described in section 2.2.1.5.3. The PI and the PIsibs were
estimated in GenAlEx v. 6.503 (Peakall and Smouse, 2006, 2012). A genotype
accumulation curve was generated in the R v. 3.3.2 software environment (R
Development Core Team, 2016), using RStudio v. 1.0.143 (RStudio Team, 2016) and
the packages adegenet (Jombart, 2008), poppr (Kamvar, Tabima and Grünwald,
2014), and ggplot2 (Wickham, 2009). The PI, the PIsibs, and the genotype accumulation
curve assessed the power of the set of loci of the combined dataset (21 loci) to
discriminate between unique individuals.
2.3. Genetic diversity, population structure, and
demographic history at a broad geographic scale in
Guinea-Bissau
To estimate chimpanzee’s genetic diversity and population structure in Guinea-Bissau,
as well as to investigate the effect of possible barriers to gene flow, a broad scale
estimation of genetic diversity and population substructure was carried out using
different types of markers – the mtDNA control region, autosomal microsatellite loci,
and the Y-linked microsatellite locus – and samples collected at CFNP, Empada,
CLNP, DNP, and BNP. To analyse demographic patterns, the mtDNA control region
sequences from the five geographic populations were used.
2.3.1. Genetic diversity
mtDNA sequences were grouped by the geographic locations where the samples were
collected (CFNP, Empada, CLNP, DNP, and BNP) and genetic diversity was estimated
as the number of haplotypes, haplotype diversity (Hd; Nei, 1987), number of variable
positions (S), and nucleotide diversity (Nei, 1987), using DnaSP v. 5.10 (Librado and

FCUP A country-level genetic survey of the IUCN critically endangered western chimpanzee (Pan troglodytes
verus) in Guinea-Bissau
65
Rozas, 2009). Hd is defined as the probability that two randomly chosen haplotypes
(i.e. a combination of alleles at one or more loci) are different in the sample and is the
average number of nucleotide differences per site between two randomly chosen DNA
sequences (Nei, 1987).
Descriptive diversity statistics – number of different alleles (Na), effective number of
alleles (Ne), observed heterozygosity (HO), expected heterozygosity (HE), inbreeding
coefficient (FIS) – were estimated for the microsatellite dataset using GenAlEx v. 6.503
(Peakall and Smouse, 2006, 2012). Ne is calculated as the inverse of the sum of the
squared allele frequencies (Peakall and Smouse, 2006, 2012) and provides a measure
of diversity independent of sample size and under the assumption of random mating
(Tajima, Tokunaga and Miyashita, 1994). HO is the proportion of samples that are
heterozygous at a given locus, whereas HE is calculated as the proportion of
heterozygosity expected under random mating using information on observed allele
frequency (Peakall and Smouse, 2006, 2012). FIS is calculated as the proportion
between HE – HO and HE, and ranges from -1 (excess of heterozygosity) to 1
(heterozygosity deficiency), with values close to zero being the expected under the
assumption of random mating (Peakall and Smouse, 2006, 2012).
2.3.2. Population structure
Population substructure was investigated in population and individual-based analyses
using mtDNA and microsatellite loci.
Samples were divided according to the geographic region where sampled (CFNP,
Empada, CLNP, DNP, and BNP). A hierarchical analysis of molecular significance
(AMOVA) was performed and the pairwise fixation index (FST) was estimated using
Arlequin v. 3.5.2.2 (Excoffier and Lischer, 2010). Significant genetic differentiation
between geographic localities was tested using a total of 10,000 permutations. The
analyses were based on haplotype frequencies for the mtDNA sequences and on the
number of different alleles for the microsatellite database.
A median-joining mtDNA haplotype network reconstruction using Network v. 5.0.0.1
(Bandelt, Forster and Röhl, 1999) was performed. An initial network was constructed
with equal weights for each character but rapidly evolving characters were down
weighted to improve resolution. The value of epsilon was set to 10 and the maximum-
parsimony post-processing option was used (Polzin and Daneshmand, 2003).
Haplotypes were coloured according to the geographic population where sampled.
FCUP A country-level genetic survey of the IUCN critically endangered western chimpanzee (Pan troglodytes
verus) in Guinea-Bissau
66
Two individual-based Bayesian clustering algorithms were used to investigate
population substructure using microsatellite loci data. Firstly, STRUCTURE v. 2.3.4
(Pritchard, Stephens and Donnelly, 2000) was run for a total of five independent
simulations, starting with a burn-in of 100,000 iterations, which was followed by
1,000,000 MCMC steps, with K set to vary between 1 and 10, following procedures
previously used by Ferreira da Silva et al. (2014) and Minhós et al. (2016) to analyse
the population structure of other primate species in Guinea-Bissau. The admixture
model was chosen, allele frequencies were considered as correlated, and the initial
value of alpha was set to 1.0 (Falush, Stephens and Pritchard, 2003), as
recommended for expected subtle population structure (Falush, Stephens and
Pritchard, 2003; Evanno, Regnaut and Goudet, 2005). The results were processed
using Structure Harvester v. 0.6.94 (Earl and vonHoldt, 2012) and the most probable
number of K was estimated through the Evanno method (Evanno, Regnaut and
Goudet, 2005) and through the posterior probability of K (Pritchard, Stephens and
Donnelly, 2000). Individuals were assigned to clusters following an arbitrary threshold:
if the probability of assignment (Q) averaged across the five runs was at least 0.8, the
individual was allocated to a cluster or, otherwise, it was considered as admixed
between clusters. The proportion of individuals assigned to each cluster was calculated
per geographic population and mapped using Quantum GIS v. 2.18.0 (QGIS
Development Team, 2015). Secondly, BAPS v. 5.2 (Corander and Marttinen, 2006;
Corander et al., 2008) was run considering 20, 15, 10, 5, 2, and 1 as the most probable
number of K, each repeated five times. A total of 10 independent runs were performed
to assess repeatability of results.
Non-Bayesian multivariate techniques were also employed to assess population
structure, using both types of genetic markers. A Principal Component Analysis (PCA)
and a spatial PCA (sPCA) were performed to analyse and visualise the spatial
distribution of the genetic variation. PCA and sPCA summarise the data into
uncorrelated components – PCA decomposes the total variance into decreasing
additive components, while sPCA uses the product of the variance and the spatial
autocorrelation to form positive, null, and negative components (Jombart et al., 2008).
PCA and sPCA were performed in the R v. 3.3.2 software environment (R
Development Core Team, 2016), using RStudio v. 1.0.143 (RStudio Team, 2016) and
the packages adegenet (Jombart, 2008) and ade4 (Dray and Dufour, 2007). Missing
data was replaced by the mean allele frequency, using the function scaleGen .For the
mtDNA, all single nucleotide polymorphisms (SNPs), i.e. all nucleotide positions for
which at least two alleles were present, were used. For the PCA, the two first principal

FCUP A country-level genetic survey of the IUCN critically endangered western chimpanzee (Pan troglodytes
verus) in Guinea-Bissau
67
components were maintained. In the sPCA, the connection network used was the K
nearest neighbourhoods, with the number of neighbourhoods for comparison set to 10.
The retained axes were chosen based on the bar plot of eigenvalues. This plot exhibits
positive and negative values, which correspond to global and local patterns,
respectively. The actual structures, which must be maintained, are those that result in
more extreme values, either positive or negative, and an abrupt change indicates the
boundary between interpretable and non-interpretable structures. The principal
components maintained were represented onto the geographic space using different
channels of colour.
Mantel tests and spatial autocorrelation analyses were carried out to test for a
significant correlation between Euclidean (geographic) distances and linear genetic
distances (Mantel, 1967). Mantel tests based on mtDNA data were analysed in the R v.
3.3.2 software environment (R Development Core Team, 2016), using RStudio v.
1.0.143 (RStudio Team, 2016) and the package adegenet (Jombart, 2008). Missing
data was replaced by the mean allele frequency (scaleGen) and significance of the
correlation (p < 0.05) was assessed using 10,000 permutations, estimated in adegenet.
Mantel tests carried out using microsatellite data were performed in GenAlEx v. 6.503
(Peakall and Smouse, 2006, 2012). Significant correlation was tested using all the data
and the ten possible pairs of geographic populations. Significance of the correlation (p
< 0.05) was assessed using 10,000 permutations.
Spatial autocorrelation analyses were run using the microsatellite dataset in GenAlEx
v. 6.503 (Peakall and Smouse, 2006, 2012) to test the null hypothesis of random
distribution of the genotypes across the study area and to analyse their degree of
genetic similarity across distance classes. These analyses allow comparing the
autocorrelation coefficient (r) generated at each distance class, which include all pairs
of individuals separated by distances that fall within the boundaries of the intervals. r
ranges from -1 (genetic dissimilarity) to 1 (genetic similarity; Banks and Peakall, 2012).
Pairwise comparison between samples was conducted in eighteen even sample class
sizes (0-5 km, 5-9 km, 9-12 km, 12-16 km, 16-21 km, 21-26 km, 26-33 km, 33-40 km,
40-45 km, 45-49 km, 49-52 km, 52-57 km, 57-61 km, 61-70 km, 70-101 km, 101-115
km, 115-134 km, 134-148 km; c. 1,000 pairwise comparisons per distance class).
Additionally, ten spatial autocorrelation analyses were conducted considering each pair
of populations. Four to ten even sample class sizes were used, with a number that
depended on the distances encompassed within each dataset. 1,000 permutations and
1,000 bootstraps were performed in all analyses.

FCUP A country-level genetic survey of the IUCN critically endangered western chimpanzee (Pan troglodytes
verus) in Guinea-Bissau
68
To investigate male-specific gene flow and population structure among geographic
regions, the frequency of each genotype encountered for the Y-linked microsatellite
locus was calculated and mapped for each of the sampling sites using Quantum GIS v.
2.18.0 (QGIS Development Team, 2015). An AMOVA was performed using Arlequin v.
3.5.2.2 (Excoffier and Lischer, 2010). Significant genetic differentiation between
geographic localities was tested using a total of 10,000 permutations and the analyses
were based on the number of different alleles.
The presence of first-generation migrants within each geographic region was
investigated using GeneClass v. 2.0 (Piry et al., 2004). GeneClass uses microsatellite
data to compute the probability of each individual being a resident (i.e. not a first-
generation migrant) of the population where sampled and of belonging to each of the
other populations. Two statistical criteria were computed for likelihood estimation:
L_home and L_home/L_max. L_home computes the likelihood of each genotype
belonging to the population where sampled, without considering the other potential
source populations, while L_home/L_max computes the likelihood of L_home to the
highest value of likelihood value among all potential source populations. The likelihood
estimations followed the Rannala and Mountain (1997) Bayesian method. The Paetkau
et al. (2004) Monte Carlo resampling algorithm was employed and significance (p <
0.01) was assessed through 1,000 simulations.
2.3.3. Demographic history
Demographic history was analysed using the mtDNA sequences from the five
geographic populations – CFNP, Empada, CLNP, DNP, and BNP. Mutation-drift
equilibrium was tested using the neutrality tests Tajima’s D (Tajima, 1989), Fu’s Fs (Fu,
1997), Fu and Li’s D* (Fu and Li, 1993), Fu and Li’s F* (Fu and Li, 1993), and Ramos-
Onsins and Rozas’ R2 (Ramos-Onsins and Rozas, 2002), estimated in DnaSP v. 5.10
(Librado and Rozas, 2009). The significance of Fu’s Fs and Ramos-Onsins and Rozas’
R2 was tested using 1,000 coalescent simulations based on theta with a 95%
confidence interval.
Tajima’s D is based on the differences between the number of segregating sites and
the average number of nucleotide differences (Librado and Rozas, 2009). Fu’s Fs uses
information on haplotype distribution (Ramos-Onsins and Rozas, 2002). Fu and Li’s D*
test is based on the differences between the number of singletons (i.e. mutations
appearing only once) and the total number of mutations among the sequences,

FCUP A country-level genetic survey of the IUCN critically endangered western chimpanzee (Pan troglodytes
verus) in Guinea-Bissau
69
whereas Fu and Li’ F* is based on the differences between the number of singletons
and the average number of nucleotide differences between pairs of sequences
(Librado and Rozas, 2009). Significant negative values of these statistics are mainly
explained by an excess of low frequency mutations due to evolutionary forces such as
selective sweeps and population growth. On the other hand, significant positive values
are mostly due to processes that produce an excess of older mutations and that may
include population subdivision and balancing selection (Alonso and Armour, 2001;
Ramos-Onsins and Rozas, 2002; Ramírez-Soriano et al., 2008). Ramos-Onsins and
Rozas’ R2 uses the difference between the number of singleton mutations and the
average pairwise number of mutations, and small positive values of this statistic are
expected after a recent severe population growth (Ramos-Onsins and Rozas, 2002).
Tajima’s and Fu’s tests are more powerful in the case of population growth and genetic
hitchhiking, whereas Fu and Li’s tests are especially powerful against background
selection (Fu, 1997). Ramos-Onsins and Rozas’ R2 test is particularly powerful in
detecting population growth for small sample sizes (Ramos-Onsins and Rozas, 2002).
The mismatch distribution was investigated to assess pairwise nucleotide site
differences. Mismatch distributions were computed for the whole population in Guinea-
Bissau and divided per geographic population, and compared against models of
constant population size and of population expansion in DnaSP v. 5.10 (Librado and
Rozas, 2009). Distributions are expected to be ragged and erratic in populations that
have been stationary for a long time, and smooth and usually unimodal in populations
that have been growing for a long time or that have experienced a single burst of
growth in the past (Harpending, 1994). The goodness of fit of the comparison was
tested based on the raggedness index, whose significance was estimated performing
1,000 coalescent simulations based on theta with a 95% confidence interval. The
raggedness index offers a method to quantify the smoothness of the observed
mismatch distribution, by normalizing the distribution to unit area and computing the
sum of the square differences between adjacent ordinates (Harpending et al., 1993;
Harpending, 1994). Lower values of the raggedness index are expected under the
population growth model (Ramos-Onsins and Rozas, 2002).
BOTTLENECK v. 1.2.02 (Cornuet and Luikart, 1996) was run for the whole dataset and
for the clusters identified by the STRUCTURE analysis (see section 2.3.2.) to test for
recent population bottlenecks. The analysis is based on the principle that, after a
genetic bottleneck, the number of different alleles at polymorphic loci drops, which
renders HE smaller than otherwise. However, the actual levels of heterozygosity (HO)

FCUP A country-level genetic survey of the IUCN critically endangered western chimpanzee (Pan troglodytes
verus) in Guinea-Bissau
70
do not drop as fast. Consequently, if HO > HE, there are evidences that a genetic
bottleneck might have occurred. 1,000 simulations were carried out to obtain the HE
distribution under the Infinite Allele Model (Kimura and Crow, 1964) and under the
Stepwise Mutation Model (Kimura and Ohta, 1978). To determine if the number of loci
with heterozygosity excess was significant, sign tests, standardized differences tests
(Cornuet and Luikart, 1996), and Wilcoxon sign-rank tests (Luikart, Sherwin, et al.,
1998) were performed. The mode-shift indicator proposed by Luikart et al. (1998) was
also used as a descriptor of the allele frequency distribution.
2.4. Genetic diversity and estimation of population
structure at a geographic fine-scale in Guinea-Bissau
Fine-scale population analyses were carried out using samples from CLNP and DNP,
which were genotyped for a maximum of 21 microsatellite loci (FB dataset). These
analyses were conducted to investigate the presence of gene flow between the two
geographic populations. Furthermore, given that CLNP is highly threatened by human
activities while acting as an important refuge for chimpanzees and DNP is an unstudied
population (see Introduction chapter), analyses to study diversity and substructure at
this smaller scale within Guinea-Bissau were performed.
Genetic diversity was estimated as Na, Ne, HO, HE, and FIS using GenAlEx v. 6.503
(Peakall and Smouse, 2006, 2012) for the whole FB dataset and for CLNP and DNP
separately.
Population-based analyses were conducted to estimate population structure. Samples
were divided according to the geographic location where sampled. FST between
populations was estimated and AMOVA, PCA, sPCA analyses, and Mantel test and
spatial autocorrelation tests were carried out following a similar procedure to that
described in section 2.3.2.
Individual-based Bayesian clustering algorithms were implemented in STRUCTURE v.
2.3.4 (Pritchard, Stephens and Donnelly, 2000) and BAPS v. 5.2. (Corander and
Marttinen, 2006; Corander et al., 2008) using the same parameters as in section 2.3.2.
A progressive partitioning approach was used in STRUCTURE, following the
proceedings described by Hobbs et al. (2011), to unravel a possible subtle pattern of
substructure. In this procedure, each individual is allocated to the cluster for which Q is
larger than 0.5 when K = 2 and no admixture is considered. STRUCTURE was run 5

FCUP A country-level genetic survey of the IUCN critically endangered western chimpanzee (Pan troglodytes
verus) in Guinea-Bissau
71
independent times using 1,000,000 MCMC steps after a burn-in of 100,000 iterations.
K = 2 was successively assumed for each of the sub-clusters and the procedure was
repeated several times until all the individuals were assigned to the same cluster or
until the probability of assignment to each sub-cluster was exactly 0.5 across all
individuals for the average of the 5 runs.

FCUP A country-level genetic survey of the IUCN critically endangered western chimpanzee (Pan troglodytes
verus) in Guinea-Bissau
72
3. Results
3.1. Genetic data generated by the present study
3.1.1. DNA Extraction
Two methods to extract faecal DNA (Costa et al., in revision; Vallet et al., 2008,
adapted by Quéméré et al., 2010) were tested using 21 samples collected in 2015 and
2016 in CLNP and DNP. Average DNA concentration across the 21 samples measured
in the Thermo ScientificTM NanoDrop 2000 spectrophotometer was higher when using
Vallet et al. (2008, adapted by Quéméré et al., 2010) method (1946.2 ± 1735.4 ng/L)
than when using Costa et al. (in revision) protocol (434.0 ± 374.1 ng/L; Figure 5).
Figure 5. Average DNA concentration and standard deviation (shown by the back bars) obtained using 21 samples
extracted with the two different extraction protocols – Costa et al. (in revision) and Vallet et al. (2008, adapted by
Quéméré et al. 2010) – tested by this study.
3.1.2. DNA Barcoding
Four out of the five samples amplified and sequenced for the cyt b gene fragment were
99% similar to the chimpanzee reference sample [GenBank Access No.: X93335]
(Arnason, Xu and Gullberg, 1996). The fifth sample had 99% similarity to a Guinea
baboon (Papio papio) sample [GenBank Access No.: EU885462] (Zinner et al., 2009).

FCUP A country-level genetic survey of the IUCN critically endangered western chimpanzee (Pan troglodytes
verus) in Guinea-Bissau
73
3.1.3. Mitochondrial DNA control region
The eleven samples sequenced for the mtDNA control region were successful in
providing good quality fragments for analysis. The size of the fragments varied
between 559 bp and 674 bp. No evidence of NUMTs was found and all sequences
displayed a high identity percentage to a chimpanzee voucher in GenBank [GenBank
Access No.: X93335; identity ≥ 93%, varying between 93% and 99%].
3.1.4. Microsatellite loci
3.1.4.1. Genotyping, quality control procedures, and
identification of repeated genotypes
Out of the 165 faecal samples extracted for this study, 46 samples were excluded from
the dataset after amplifying M1, M2, and M3 three times because of the low quality of
the preliminary consensus genotypes (i.e. QI across loci < 0.5) and/or high level of
missing data (i.e. non-amplification for more than half of the loci included in the
multiplexes) and 17 samples were excluded from the dataset because were considered
duplicate genotypes. At the end of the genotyping process and before classifying the
genotypes based on the average QI across loci, the genetic dataset produced by this
study (FB dataset) was formed by 102 unique genotypes obtained from faecal DNA
extracts (78 from CLNP and 25 from DNP) and one genotype obtained from a tissue
sample.
Average amplification success across the 21 autosomal microsatellite loci was of
68.3% and varied between 40.2% (for locus D7s2204) and 88.7% (for locus Fesps).
Average ADO and FA rates across loci estimated following Broquet and Petit (2004)
were higher and lower, respectively (ADO rate 4% higher; FA rate 0.04% lower), than
when estimated through a maximum likelihood approach implemented in Pedant v. 1.0,
(Table SIII, Supplementary Material).
Tests comparing datasets with minimum QI of 0.40 (N = 70), 0.50 (N = 50), and 0.55 (N
= 46) suggested that the estimation population substructure would become more
inaccurate and less resolute with the simultaneous increase in QI and decrease in
number of samples. The most probable number of clusters after the STRUCTURE runs
based on the Evanno method was of five, eight, and nine, with the datasets with
minimum QI of 0.40, 0.50, and 0.55, respectively. Visual inspection of the bar plots

FCUP A country-level genetic survey of the IUCN critically endangered western chimpanzee (Pan troglodytes
verus) in Guinea-Bissau
74
showed that the probability of assignment to clusters was higher for the majority of the
individuals for the dataset with minimum QI of 0.40 (i.e. assignment of individuals to
clusters was possible considering a minimum Q of 0.8), whereas, for the datasets with
minimum QI of 0.50 and 0.55, Q ≈ 0.5 for all individuals, when K = 2. FCA graphical
outputs showed a decrease in genetic variation within each geographic population with
the simultaneous increase in QI and decrease in number of samples.
For samples with a QI between 0.40 and 0.60, the average QI across loci was
recalculated using only the markers for which a consensus genotype had been
reached, to test how missing data was affecting this statistic. The recalculated QI was
higher for all samples, presenting a minimum value of 0.50.
The final FB dataset includes 70 samples (58 from CLNP and 12 from DNP) genotyped
for a maximum of 21 microsatellite loci (minimum of 11 loci, average of 18 loci; Figure
6). The average QI across loci and samples is of 0.73 and varies between 0.40 and
1.00 (14% of missing data). Allele range size varied between 114 bp for locus D5s1457
and 300 bp for locus D6s1056 (Table SIV, Supplementary Material). The locus D6s503
(M5) was found not to vary as a tetranucleotide, as expected. The two alleles found in
the populations (260 and 273) differed by 13 bp.
Figure 6. Location of the 70 unique genotypes included in the final FB dataset. Produced using QGIS v. 2.18.0.

FCUP A country-level genetic survey of the IUCN critically endangered western chimpanzee (Pan troglodytes
verus) in Guinea-Bissau
75
Summary genetic diversity statistics were estimated using the 21 microsatellite loci
scored for the 70 genotypes included in the final FB dataset (Table IV). Na varied
between 2 alleles (for loci Fesps and D6s503) and 11 alleles (for locus D13s159),
presenting an average of 6 alleles. Ne varied between 1.472 (locus D6s474) and 8.112
(locus D2s1326), presenting an average of 3.744. HO (average = 0.622) varied from
0.286 (for Fesps) to 0.908 (for D13s159) and HE (average = 0.677) varied from 0.321
(for D6s474) to 0.877 (for D2s1326). The locus D1s1665 was the only to deviate from
HWE after the multiple comparisons adjustment (Bonferroni p = 0.003). FIS presented
an average of 0.079, varying between -0.134 (D1s548) and 0.282 (D1s1665).
Table IV. Summary diversity statistics for the 21 autosomal microsatellite loci used: N (sample size); Na (number of
different alleles); Ne (effective number of alleles); HO (observed heterozygosity); HE (expected heterozygosity); HWE
(Hardy-Weinberg equilibrium); Bonferroni (significance adjusted by the Bonferroni correction for multiple comparisons);
FIS (inbreeding coefficient). Loci in non-conformity to HWE are in bold and significance accounts for the Bonferroni
correction.
Locus N Na Ne HO HE HWE Bonferroni FIS
D5s1457 68 6 2.972 0.618 0.663 0.662 NS 0.069
D13s159 65 11 8.055 0.908 0.876 0.321 NS -0.036
D2s1326 57 10 8.112 0.667 0.877 0.001 NS 0.240
D10s1432 55 4 2.719 0.709 0.632 0.838 NS -0.122
D16s2624 66 5 3.566 0.727 0.720 0.726 NS -0.011
D1s207 51 9 3.580 0.627 0.721 0.396 NS 0.129
D14s306 35 6 3.673 0.600 0.728 0.101 NS 0.176
D6s311 66 6 3.898 0.636 0.743 0.006 NS 0.144
D4s1627 60 8 5.792 0.700 0.827 0.363 NS 0.154
HUMFIBRA 65 6 3.610 0.754 0.723 0.871 NS -0.043
Fesps 70 2 1.654 0.286 0.396 0.020 NS 0.278
D6s501 70 5 2.197 0.471 0.545 0.203 NS 0.135
D1s548 67 5 2.716 0.716 0.632 0.920 NS -0.134
D11s2002 70 9 4.128 0.743 0.758 0.864 NS 0.020
D7s2204 40 7 3.893 0.600 0.743 0.032 NS 0.193
D4s2408 59 6 3.186 0.712 0.686 0.987 NS -0.037
D6s474 64 5 1.472 0.359 0.321 0.994 NS -0.121
D13s765 66 5 2.635 0.621 0.621 0.474 NS -0.001
D1s1665 52 5 3.613 0.519 0.723 0.000 0.003 0.282

FCUP A country-level genetic survey of the IUCN critically endangered western chimpanzee (Pan troglodytes
verus) in Guinea-Bissau
76
D6s503 62 2 1.928 0.387 0.481 0.123 NS 0.196
D6s1056 62 8 5.226 0.694 0.809 0.146 NS 0.142
Repeating the test of HWE when samples were divided according to the two
geographic populations where sampled revealed that locus D1s1665 and the loci
Fesps and D6s503 were out of equilibrium after the Bonferroni’s adjustment in CLNP
and in DNP datasets, respectively. No pairs were in LD (Bonferroni p = 2.381 × 10⁻⁴),
considering the whole dataset and dividing the genotypes by the two geographic
populations where sampled.
Analyses performed using Micro-Checker showed an excess of homozygotes for the
loci D2s1326, D1s207, D6s311, D4s1627, D7s2204, D1s1665, and D6s1056 for the
whole genetic dataset. When dividing the samples by geographic population, loci
D2s1326, D4s1627, D1s1665, and D6s1056 in CLNP showed an excess of
homozygotes.
PI and PIsibs plotted against an increasing number of loci (Figure 7) showed that any
two different individuals could be distinguished using a minimum of five loci for PIsibs
(more conservative) and of two loci for PI (less conservative).
Figure 7. Cumulative probability of identity (PI) and probability of identity between siblings (PIsibs). Distinction of
individuals is reliable with five loci, when the PIsibs curve approaches zero.
The genotype accumulation curve exhibits a plateau when reaching five randomly
sampled loci (Figure 8), which is a similar result to what was obtained using PIsibs.

FCUP A country-level genetic survey of the IUCN critically endangered western chimpanzee (Pan troglodytes
verus) in Guinea-Bissau
77
Figure 8. Genotype accumulation curve showing a plateau at five loci, the minimum number of loci necessary to
distinguish between different individuals.
3.1.5. Molecular sex determination
The sex determination protocol successfully determined the sex of 69 of the 70 unique
genotypes included in the final FB dataset (i.e. 98.6%). The QI of the amelogenin
system was high (83.0%). Of the samples for which the sex was identified, 35
individuals were identified as males (32 individuals sampled in CLNP and 3 in DNP)
and 34 individuals were identified as females (25 from CLNP and 9 from DNP).
3.2. Merging datasets
3.2.1. Mitochondrial DNA control region
168 mtDNA control region sequences, obtained from unique individuals (157 produced
by RS study and 11 generated by this study) were trimmed to 476 bp, which was the
length of the shortest sequence. In total, 93 sequences were obtained from CFNP, 17
from Empada, 26 from CLNP, 2 from DNP, and 30 from BNP (Figure 9).

FCUP A country-level genetic survey of the IUCN critically endangered western chimpanzee (Pan troglodytes
verus) in Guinea-Bissau
78
Figure 9. Location of the 168 samples collected from unique individuals for which the mitochondrial DNA control region
was amplified and used in the analyses. Produced using QGIS v. 2.18.0.
3.2.2. Microsatellite loci
The allele frequencies for 10 loci estimated using 51 samples of FB dataset and 13
samples of RS dataset collected at the same geographical region (CLNP) and with a QI
> 0.5 were compared in order to test the accuracy of the conversion process. As
expected, the alleles with the highest frequency were the same for both datasets for
most of the loci (D2s1326, D10s1432, D16s2624, D1s207, D14s306, D6s311,
HUMFIBRA). However, for three loci, the allele with highest frequency in RS dataset
was the second (D5s1457 and D4s1627) or third (D13s159) most frequent allele in FB
dataset (Table SV, Supplementary Material).
The tests performed to assess the effect of missing data using the combined dataset
FB (scored to a maximum of 21 microsatellite loci) + RS (scored to a maximum of 10
microsatellite loci + 11 loci with missing data) revealed that the high level of missing
data in RS dataset had a strong effect on the estimation of population structure. The
output of the STRUCTURE analysis showed poorly defined genetic units, visible as
cluster smears badly defined per individual (Figure S3, Supplementary Material). In the

FCUP A country-level genetic survey of the IUCN critically endangered western chimpanzee (Pan troglodytes
verus) in Guinea-Bissau
79
FCA, two independent clusters of samples were visible and corresponded to RS and
FB datasets (i.e. very high and low level of missing data, respectively; Figure S4,
Supplementary Material).
Tests were conducted using three datasets varying the minimum QI across loci (QI ≥
0.30, N = 226; QI ≥ 0.40, N = 201; QI ≥ 0.45, N = 185). Using the database of QI ≥
0.30, a higher level of population substructure was found in the STRUCTURE analysis
than when using the QI ≥ 0.40 database (K = 4 and K = 2 as the most likely number of
genetic clusters as inferred using the Evanno method, respectively). Using the QI ≥
0.45 database, the Evanno method indicated K = 7 as the most likely number of
clusters, which is clearly an overestimation. The tests suggested that the estimation of
population structure was influenced by the minimum QI and sample size. Thus,
samples with a minimum QI of 0.40 and the 10 microsatellite loci common to FB and
RS dataset were used in the combined dataset.
Table V shows the summary genetic diversity statistics for the 10 loci used. All loci
were polymorphic. The number of different alleles varied between four (D10s1432) and
11 (D13s159, D2s1326, and D1s207), presenting an average of eight alleles. Ne varied
between 2.426 (D10s1432) and 7.899 (D13s159), presenting an average of 4.510. HO
(average = 0.711) varied between 0.599 (D10s1432) and 0.908 (D13s159) and HE
(average = 0.748) varied between 0.588 (D10s1432) and 0.873 (D13s159). Loci
D13s159 and D2s1326 significantly departed from HWE after the significance
adjustment for multiple comparisons (Bonferroni p = 0.001). FIS presented an average
of 0.048 and varied between -0.039 (D13s159) and 0.195 (D2s1326).
Table V. Summary diversity statistics for the 10 autosomal microsatellite loci used: N (sample size); Na (number of
different alleles); Ne (effective number of alleles); HO (observed heterozygosity); HE (expected heterozygosity); HWE
(Hardy-Weinberg equilibrium); Bonferroni (significance adjusted by the Bonferroni correction for multiple comparisons);
FIS (inbreeding coefficient). Loci in non-conformity to HWE are in bold and significance accounts for the Bonferroni’s
correction for multiple comparisons.
Locus N Na Ne HO HE HWE Bonferroni FIS
D5s1457 159 6 3.303 0.679 0.697 0.117 NS 0.026
D13s159 173 11 7.899 0.908 0.873 0.000 0.001 -0.039
D2s1326 161 11 7.778 0.702 0.871 0.000 0.001 0.195
D10s1432 162 4 2.426 0.599 0.588 0.918 NS -0.019
D16s2624 173 5 3.936 0.717 0.746 0.322 NS 0.039
D1s207 166 11 4.093 0.747 0.756 0.173 NS 0.012

FCUP A country-level genetic survey of the IUCN critically endangered western chimpanzee (Pan troglodytes
verus) in Guinea-Bissau
80
D14s306 144 8 3.974 0.701 0.748 0.003 NS 0.063
D6s311 179 7 3.345 0.637 0.701 0.827 NS 0.092
D4s1627 140 9 4.972 0.721 0.799 0.049 NS 0.097
HUMFIBRA 155 6 3.373 0.697 0.704 0.191 NS 0.010
Two pairs of loci (D16s2624/D1s207 and D1s207/D6s311) were in LD after the
Bonferroni’s adjustment (Bonferroni p = 0.001) using the whole dataset and only in
CFNP when dividing the dataset into geographic populations. CFNP was also the only
geographic population to have a locus deviating from HWE: D13s159.
The Micro-Checker analysis carried out using the merged dataset (10 microsatellite
loci, minimum QI = 0.4) suggested excess of homozygotes for the loci D2s1326,
D6s311, and D4s1627. When dividing the samples according to the geographic
population of origin (i.e. CFNP, Empada, CLNP, DNP, and BNP), D2s1326 was again
highlighted as having homozygote excess for CFNP and CLNP datasets.
Plotting PI and PIsibs against an increasing number of loci, it was shown that two
different individuals could be identified using a minimum of five loci out of the ten loci
scored (Figure S5, Supplementary Material). Concordantly, the genotype accumulation
curve plateaus when a combination of five loci is reached (Figure S6, Supplementary
Material).
At the end of the process that merged FB and RS datasets, a total of 185 unique
genotypes scored to a maximum of 10 loci (minimum of 5 loci) from different individuals
were included in the combined dataset: 78 from CFNP, 12 from Empada, 67 from
CLNP, 11 from DNP, and 17 from BNP (Figure 10). Mean QI across all loci and
samples was of 0.72, varying between 0.40 and 1.00 (13% of missing data).

FCUP A country-level genetic survey of the IUCN critically endangered western chimpanzee (Pan troglodytes
verus) in Guinea-Bissau
81
Figure 10. Location of the samples collected from the 185 unique individuals genotyped for a maximum of 10
microsatellite loci included in the final combined dataset. Produced using QGIS v. 2.18.0.
96 males were successfully genotyped for the marker DYs439 (84 and 12 samples
genotyped by RS and during the present study, respectively) – 40 males sampled in
CFNP, 14 in Empada, 29 in CLNP, and 13 in BNP (Figure 11). Males sampled in DNP
failed to amplify the DYs439 locus.
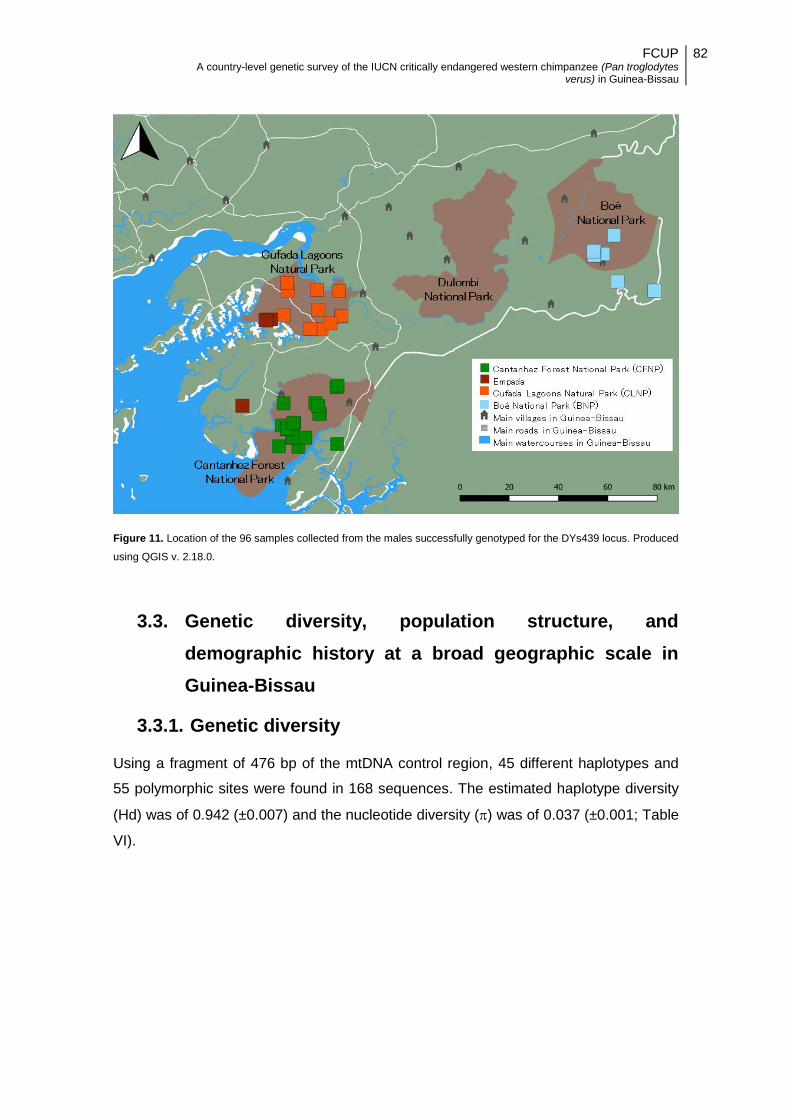
FCUP A country-level genetic survey of the IUCN critically endangered western chimpanzee (Pan troglodytes
verus) in Guinea-Bissau
82
Figure 11. Location of the 96 samples collected from the males successfully genotyped for the DYs439 locus. Produced
using QGIS v. 2.18.0.
3.3. Genetic diversity, population structure, and
demographic history at a broad geographic scale in
Guinea-Bissau
3.3.1. Genetic diversity
Using a fragment of 476 bp of the mtDNA control region, 45 different haplotypes and
55 polymorphic sites were found in 168 sequences. The estimated haplotype diversity
(Hd) was of 0.942 (±0.007) and the nucleotide diversity () was of 0.037 (±0.001; Table
VI).

FCUP A country-level genetic survey of the IUCN critically endangered western chimpanzee (Pan troglodytes
verus) in Guinea-Bissau
83
Table VI. Genetic diversity statistics using the mtDNA sequences: N (number of sequences); nH (number of
haplotypes); Hd (haplotype diversity); S (number of polymorphic sites); (nucleotide diversity). Standard deviations are
between brackets.
Geographic
population N nH Hd S
CFNP 93 22 0.899 (±0.016) 53 0.036 (±0.001)
Empada 17 9 0.912 (±0.042) 45 0.037 (±0.003)
CLNP 26 16 0.948 (±0.027) 50 0.034 (±0.004)
BNP 30 16 0.933 (±0.026) 45 0.037 (±0.002)
Overall 168 45 0.942 (±0.007) 55 0.037 (±0.001)
All the geographic populations presented high levels of Hd, varying between 0.899
(CFNP) and 0.948 (CLNP). values were similar in all populations and varied between
0.034 (CLNP) and 0.037 (Empada and BNP). DNP presented higher values of Hd and
(1.000±0.500 and 0.055±0.027, respectively) but the high levels of standard deviation
associated to these statistics suggest that the estimation of genetic diversity is not
accurate given the small sample size (N = 2).
Table VII shows the genetic diversity statistics using the 185 unique genotypes. The
mean number of different alleles across loci was of 7.800 for the whole dataset. Ne
averaged 4.510 for the 185 unique genotypes. HO was of 0.711 and HE was of 0.748.
FIS was of 0.047 across the 185 genotypes. When dividing the combined dataset per
geographic population where sampled, Na varied between 5.000 (Empada) and 7.300
(CFNP and CLNP). HO varied from 0.702 (CLNP) to 0.749 (Empada), while HE varied
from 0.679 (Empada) to 0.746 (CLNP). FIS varied between -0.108 (Empada) and 0.054
(CLNP).
Table VII. Mean summary diversity statistics for the five geographic populations and the overall dataset: N (sample
size); Na (number of different alleles); Ne (effective number of alleles); HO (observed heterozygosity); HE (expected
heterozygosity); FIS (inbreeding coefficient). Standard errors are between brackets.
Population N Na Ne HO HE FIS
CFNP 66.800(±3.372) 7.300(±0.857) 3.986(±0.464) 0.707(±0.033) 0.721(±0.028) 0.019(±0.026)
Empada 11.700(±0.153) 5.000(±0.577) 3.461(±0.387) 0.749(±0.047) 0.679(±0.035) -0.108(±0.045)
CLNP 57.300(±2.463) 7.300(±0.790) 4.497(±0.614) 0.702(±0.028) 0.746(±0.027) 0.054(±0.033)
DNP 9.700(±0.423) 5.300(±0.539) 4.018(±0.501) 0.731(±0.028) 0.717(±0.033) -0.030(±0.037)
BNP 15.700(±0.260) 6.100(±0.640) 4.099(±0.372) 0.707(±0.038) 0.735(±0.026) 0.041(±0.033)
Overall 161.200(±3.955) 7.800(±0.827) 4.510(±0.593) 0.711(±0.026) 0.748(±0.027) 0.047(±0.021)

FCUP A country-level genetic survey of the IUCN critically endangered western chimpanzee (Pan troglodytes
verus) in Guinea-Bissau
84
3.3.2. Population structure
Significant genetic differentiation (p < 0.05) was found for more pairs of geographic
populations using mtDNA as compared with microsatellites (Table VIII). Using the
mtDNA dataset, FST was significantly different from zero when comparing BNP with the
populations located at the coastal region of the country (CFNP, Empada, and CLNP;
FST varying between 0.04485 and 0.06844). Significant values of FST were also
obtained between CFNP and Empada and CLNP (FST varying between 0.03127 and
0.04497). Using the microsatellite data, FST was significantly different from zero for the
pairs of geographic populations BNP/CLNP (FST = 0.05792) and CFNP/CLNP (FST =
0.03666).
Population-based estimations of population substructure suggest that BNP is the
population with higher levels of genetic differentiation. mtDNA revealed more power
than microsatellites in showing this trend.
Table VIII. Pairwise fixation index (FST) values. Significant values (p < 0.05) are marked with an asterisk (*). N
corresponds to the number of samples used per geographic population. Downer diagonal (left part of the table)
corresponds to mtDNA and upper diagonal (right part of the table) corresponds to microsatellites data.
mtDNA CFNP Empada CLNP DNP BNP Microsatellites
CFNP (N=93) -0.01074 0.03666* -0.00414 0.00425 CFNP (N=78)
Empada (N=17) 0.04497* 0.03008 -0.02453 0.02729 Empada (N=12)
CLNP (N=26) 0.03127* -0.00758 -0.00761 0.05792* CLNP (N=67)
DNP (N=2) 0.06184 0.00640 0.02008 0.03160 DNP (N=11)
BNP (N=30) 0.06844* 0.05477* 0.04485* -0.05717 BNP (N=17)
The hierarchical AMOVA based on mtDNA haplotype frequencies revealed that
95.38% of the total variation was present within geographic populations and only
4.62% was present between populations. The analysis based on microsatellite loci
revealed a similar trend – 97.55% variation within populations and 2.45% variation
between populations (Table IX).

FCUP A country-level genetic survey of the IUCN critically endangered western chimpanzee (Pan troglodytes
verus) in Guinea-Bissau
85
Table IX. AMOVA results. The p-value indicates the probability of finding a more extreme variance component and FST
value than observed by chance alone after 10,000 permutations.
Genetic marker Source of
variation
Sum of
squares
Variance
components
Percentage of
variation FST p-value
mtDNA
Among
populations 4.162 0.02214 4.62
0.04618 0.00000
Within
populations 74.528 0.45723 95.38
Microsatellites
Among
populations 3.319 0.00811 2.45
0.02445 0.00594
Within
populations 118.097 0.32355 97.55
The median-joining network constructed using 168 mtDNA control region sequences
showed that the haplotypes can be grouped in four haplogroups (Figure 12). However,
no clear geographical structure pattern emerges from the analysis.
Figure 12. Median-joining haplotype network reconstruction using mtDNA. Node size is proportional to haplotype
frequency and each number on the links corresponds to a mutation. The four haplogroups are circled by the dashed
black lines.

FCUP A country-level genetic survey of the IUCN critically endangered western chimpanzee (Pan troglodytes
verus) in Guinea-Bissau
86
Median-joining networks constructed for each of the geographic populations showed
that several mutations (up to nineteen, after down-weighting) separate the various
haplotypes, a pattern which is common to all populations (Figure 13). Note that no
network was constructed for the DNP population as only two sequences were
available.
Figure 13. Median-joining haplotype network reconstruction using the mtDNA dataset divided per geographic
population. Node size is proportional to haplotype frequency and each number on the links corresponds to a mutation.
A) Cantanhez Forest National Park (CFNP). B) Empada. C) Cufada Lagoons Natural Park (CLNP). D) Boé National
Park (BNP).
In the PCA, haplotypes were also clustered into four distinct groups (Figure 14). As in
the haplotype network, the clustering pattern of the haplotypes in the PCA does not
follow the geographic pattern where the samples were collected and individuals from all
sampling locations are spread across the two axes.

FCUP A country-level genetic survey of the IUCN critically endangered western chimpanzee (Pan troglodytes
verus) in Guinea-Bissau
87
Figure 14. Principal component analysis (PCA) based on mtDNA. The first and second axes explained 41.0% and
18.9%, respectively, of the observed variation. Each point represents an individual and colours distinguish between
sampling sites (Green: CFNP; Brown: Empada; Orange: CLNP; Purple: DNP; Blue: BNP). Inertia ellipses include two
thirds of the individuals from each sampling site.
The sPCA performed using mtDNA, for which one component of variation was
maintained, showed that a great degree of genetic variation is present within all
geographic populations. However, the analysis did not clearly separate between
geographic populations (Figure 15).

FCUP A country-level genetic survey of the IUCN critically endangered western chimpanzee (Pan troglodytes
verus) in Guinea-Bissau
88
Figure 15. Spatial principal component analysis (sPCA) constructed using the mtDNA sequences. A) Plot of the
eigenvalues across the principal components. The first global structure was maintained. B) First global principal
component on the geographic space represented in a scale from red (maximum score) to black (minimum score). Each
point represents an individual and its colour indicates the score.
The Mantel test performed for the mtDNA dataset suggests a pattern of isolation by
distance (p < 0.05), i.e. positive correlation between genetic distance and geographic
distance (Figure 16).

FCUP A country-level genetic survey of the IUCN critically endangered western chimpanzee (Pan troglodytes
verus) in Guinea-Bissau
89
Figure 16. Mantel test performed to test the hypothesis of isolation by distance using the mtDNA data. The black dot
standing outside the simulated range under a model of random distribution of haplotypes across the landscape agrees
with the hypothesis of isolation by distance (p < 0.05).
The individual Bayesian clustering analysis performed in STRUCTURE using the
microsatellite loci database suggests the presence of two genetic clusters (posterior
probabilityK=2 = 1; KK=2 = 594; Figure 17). When dividing the dataset into the two
clusters, setting the minimum threshold for assignment to each of the clusters at Q ≥
0.8, 45 individuals could be assigned to cluster 1 (average Q1 = 0.8, varying between
0.8 and 0.9), 43 individuals to cluster 2 (average Q2 = 0.8, varying between 0.8 and
0.9), and 97 individuals could not be assigned to either one of the clusters and were
considered admixed between clusters (average Qadmixed = 0.5, varying between 0.3 and
0.7). LnP(K) and K values also increase at K = 6 (Figure 17), a number of clusters
that clearly groups 11 samples within CFNP. When investigating why these samples
appeared grouped in the STRUCTURE output, it was found that they 1) are not
geographically separated from the others but were not sampled in close proximity to
each other within CFNP, and 2) do not present unique alleles at any locus.

FCUP A country-level genetic survey of the IUCN critically endangered western chimpanzee (Pan troglodytes
verus) in Guinea-Bissau
90
Figure 17. Individual Bayesian clustering analysis performed in STRUCTURE using microsatellite data (185 unique
genotypes). A) Inference of the most likely number of clusters (K) using K and LnP(K) values across all runs. B) Bar
plot output assuming K = 2. C) Bar plot output assuming K = 6.
Main genetic diversity statistics were recalculated for clusters 1 and 2, using the groups
of individuals assigned to each cluster with a probability Q ≥ 0.8 (Table X). Cluster 2
presents a higher average number of different alleles across loci (7.400) when
compared to cluster 1 (5.700), which is also true for the effective number of alleles
(4.366 for cluster 2 and 3.252 for cluster 1). HO and HE are the same for cluster 1
(0.669). For cluster 2, HO and HE present higher values than for cluster 1 (0.739 and
0.753, respectively). FIS is of -0.001 for cluster 1 and of 0.026 for cluster 2. Overall,
cluster 2 seems to possess higher genetic diversity.
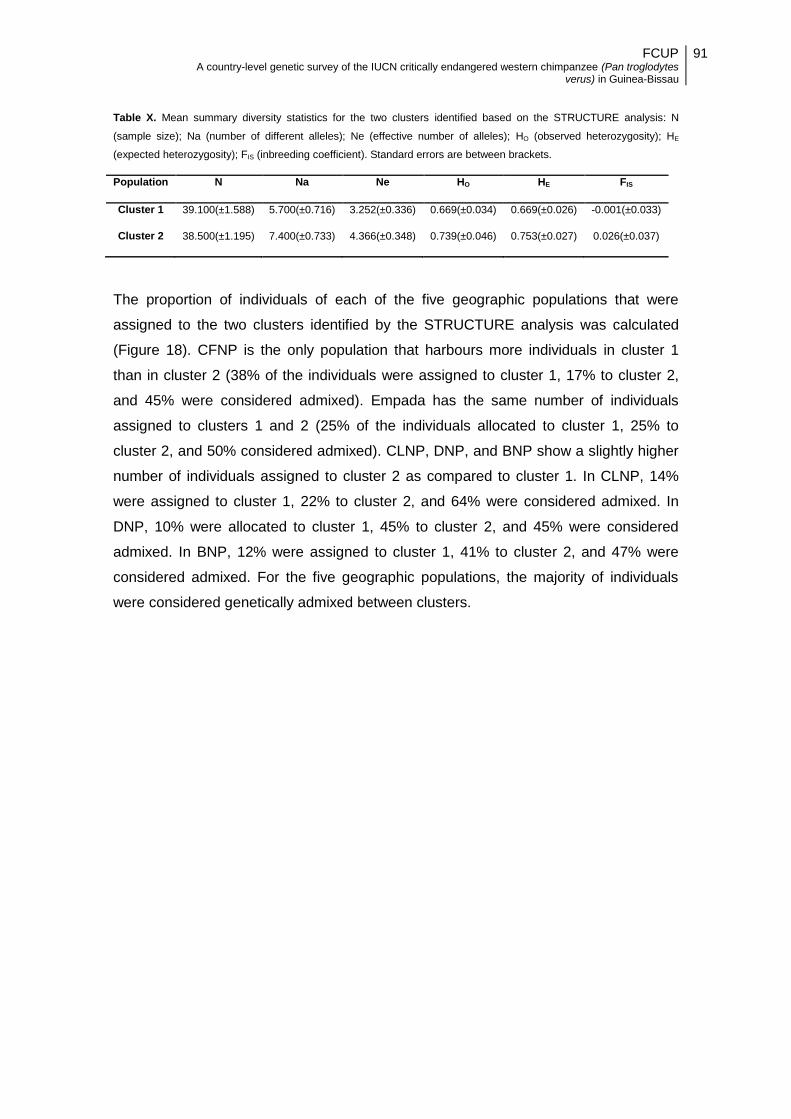
FCUP A country-level genetic survey of the IUCN critically endangered western chimpanzee (Pan troglodytes
verus) in Guinea-Bissau
91
Table X. Mean summary diversity statistics for the two clusters identified based on the STRUCTURE analysis: N
(sample size); Na (number of different alleles); Ne (effective number of alleles); HO (observed heterozygosity); HE
(expected heterozygosity); FIS (inbreeding coefficient). Standard errors are between brackets.
Population N Na Ne HO HE FIS
Cluster 1 39.100(±1.588) 5.700(±0.716) 3.252(±0.336) 0.669(±0.034) 0.669(±0.026) -0.001(±0.033)
Cluster 2 38.500(±1.195) 7.400(±0.733) 4.366(±0.348) 0.739(±0.046) 0.753(±0.027) 0.026(±0.037)
The proportion of individuals of each of the five geographic populations that were
assigned to the two clusters identified by the STRUCTURE analysis was calculated
(Figure 18). CFNP is the only population that harbours more individuals in cluster 1
than in cluster 2 (38% of the individuals were assigned to cluster 1, 17% to cluster 2,
and 45% were considered admixed). Empada has the same number of individuals
assigned to clusters 1 and 2 (25% of the individuals allocated to cluster 1, 25% to
cluster 2, and 50% considered admixed). CLNP, DNP, and BNP show a slightly higher
number of individuals assigned to cluster 2 as compared to cluster 1. In CLNP, 14%
were assigned to cluster 1, 22% to cluster 2, and 64% were considered admixed. In
DNP, 10% were allocated to cluster 1, 45% to cluster 2, and 45% were considered
admixed. In BNP, 12% were assigned to cluster 1, 41% to cluster 2, and 47% were
considered admixed. For the five geographic populations, the majority of individuals
were considered genetically admixed between clusters.

FCUP A country-level genetic survey of the IUCN critically endangered western chimpanzee (Pan troglodytes
verus) in Guinea-Bissau
92
Figure 18. Map representation of the output of the individual Bayesian clustering analysis implemented in
STRUCTURE. The five geographic populations harbour individuals assigned to two clusters identified using
STRUCTURE and a proportion of admixed individuals. NCFNP = 78; NEmpada = 12; NCLNP = 67; NDNP = 11; NBNP = 17.
Circles are proportional to sample size in each locality. Main water courses are represented in blue, roads in white, and
villages in grey. Produced using QGIS v. 2.18.0.
After assigning samples to each of the clusters identified using STRUCTURE, HWE
was reassessed per locus to investigate the presence of possible substructure within
each cluster. No locus showed significant departures from the HWE for any of the two
clusters after the Bonferroni’s adjustment. Significant LD (Bonferroni p = 0.001) was
not found for any pair of loci for cluster 1, but for cluster 2 three pairs of loci were in LD
after the Bonferroni’s correction (D10s1432/D1s207, D1s207/D14s306, and
D1s207/D6s311).
STRUCTURE clustering was repeated for each cluster (with the samples grouped
based on the criterion Q ≥ 0.8). Evidence of substructure was not found for cluster 1
(Figure S7, Supplementary Material) but, for cluster 2, K = 4 was considered the most
probable solution (posterior probabilityK=4 = 5 × 10-12; K = 56), and K = 1 was
considered the second most likely solution (posterior probabilityK=1 = 1; Figure 19). The
K = 4 solution clusters three genotypes from Empada, one from CLNP, and two from
BNP (assignment at Q ≥ 0.8), whereas all other genotypes appear to be admixed

FCUP A country-level genetic survey of the IUCN critically endangered western chimpanzee (Pan troglodytes
verus) in Guinea-Bissau
93
between clusters. A more conservative clustering solution (e.g. K = 2) does not allow
the assignment of any individuals to the clusters using the same threshold (Q ≥ 0.8).
Removing the six individuals clustering together within cluster 2 and reassessing LD,
no pairs of loci were in significant disequilibrium (Bonferroni p = 0.001).
Figure 19. Individual Bayesian clustering analysis performed in STRUCTURE for the 43 unique genotypes grouped in
cluster 2. A) Inference of the most likely number of clusters (K) using K and LnP(K) values across all runs. B) Bar plot
output assuming K = 4.
The individual Bayesian clustering analysis performed in BAPS with all the 185
genotypes, including the geographic position of the samples as a prior in the model,
suggested that K = 3 was the most probable clustering solution (posterior probabilityK=3
= 0.51). At K = 3, BAPS analysis clustered 9 individuals from CFNP in cluster 1, 5
individuals from BNP in cluster 2, and the remaining 171 individuals in cluster 3 (Figure
20). However, the analysis could not converge in an accurate solution, which would
present a higher posterior probability (i.e. closer to 1).

FCUP A country-level genetic survey of the IUCN critically endangered western chimpanzee (Pan troglodytes
verus) in Guinea-Bissau
94
Figure 20. Output of the individual Bayesian clustering analysis performed in BAPS, assuming K = 3. The genotypes
are represented on the geographic space.
Although the most likely number of genetic units is different between Bayesian
individual-based clustering analyses, some concordance between results can be
observed. For instance, the five individuals assigned to cluster 2 using BAPS had also
been clustered together using STRUCTURE (cluster 2; Figure 17 and Figure 18).
These five individuals were all sampled in BNP and, when further partitioning cluster 2
identified by the STRUCTURE analysis, two individuals were part of the group of six
genotypes that were clustered together (Q ≥ 0.8). The other three individuals from BNP
grouped by STRUCTURE and BAPS also presented a high probability (0.6 ≤ Q ≤ 0.7)
of belonging to the cluster composed by Empada and BNP individuals (yellow bars in
Figure 19). Nevertheless, the nine individuals assigned to cluster 1 using BAPS had
been either grouped in the same cluster by STRUCTURE (six out of the nine were
grouped in cluster 2; Figure 17 and Figure 18) or had not been assigned to any cluster
by STRUCTURE and were considered admixed (three out of the nine individuals).
Four first-generation migrants have been identified, using the L_home/L_max criterion
for likelihood estimation (p < 0.01). One male sampled in Empada was identified as
belonging to CFNP (p = 0.0018), one female sampled in DNP as belonging to CLNP (p
= 0.0000), and two males sampled in BNP as belonging to CFNP (p = 0.0052) and to
DNP (p = 0.0026). The first two were also identified using the L_home criterion. These

FCUP A country-level genetic survey of the IUCN critically endangered western chimpanzee (Pan troglodytes
verus) in Guinea-Bissau
95
four individuals had been identified as admixed following the STRUCTURE analysis
and as belonging to cluster 3 following the BAPS analysis.
Individuals from all sampling sites appear scattered across the plot of the PCA
performed using microsatellite data (Figure 21). Individuals seem to present a similar
genetic variation based on their distribution along the first axis. However, individuals
from CFNP appear to exhibit a greater variation since they are distributed throughout
the whole span of second axis of the PCA. Individuals from DNP present the smallest
variation, which is indicated by the smaller area of the inertia ellipse.
Figure 21. Principal component analysis (PCA) based on the microsatellite data. The x-axis and the y-axis explain 3.1%
and 3.0%, respectively, of the observed variation. Each point represents an individual and colours distinguish between
sampling sites (Green: CFNP; Brown: Empada; Orange: CLNP; Purple: DNP; Blue: BNP). Inertia ellipses include two
thirds of the individuals from each sampling site.
Concordantly to what was found using mtDNA, the sPCA performed using
microsatellite loci data showed that a great degree of genetic variation is present within
all geographic populations, especially in CFNP and CLNP. More patterns emerge from
this plot when compared to the mtDNA plot, because two components were
maintained. However, separation between geographic populations was also not clear
(Figure 22).

FCUP A country-level genetic survey of the IUCN critically endangered western chimpanzee (Pan troglodytes
verus) in Guinea-Bissau
96
Figure 22. Spatial principal component analysis (sPCA) constructed using the microsatellite database. A) Plot of the
eigenvalues across the principal components. The first two global structures were maintained. B) The first principal
component is represented in a scale from red (maximum score) to black (minimum score) and the second principal
component in a scale from green (maximum score) to black (minimum score). Each point represents an individual and
its colour indicates the combination of the two scores.
The Mantel test performed using the microsatellite dataset did not suggest a significant
pattern of isolation by distance (p > 0.05; Figure 23), which is not in agreement to what
had been obtained using the mtDNA data.

FCUP A country-level genetic survey of the IUCN critically endangered western chimpanzee (Pan troglodytes
verus) in Guinea-Bissau
97
Figure 23. Mantel test performed to test the hypothesis of isolation by distance using the microsatellite data. Each point
represents an individual, the x-axis represents the geographic distance between each pair of individuals in km, and the
y-axis represents the linear genetic distance. No significant correlation between Euclidean geographical and genetic
distances was obtained (p > 0.05).
Mantel tests were also performed for every pair of geographic populations, using
microsatellite data (Figure 24). Significant correlation between genetic and geographic
distances was obtained for the pairs CFNP/CLNP, CFNP/DNP, CFNP/BNP, and
DNP/BNP. Non-significant correlation was found for the pairs CFNP/Empada,
Empada/CLNP, Empada/DNP, Empada/BNP, CLNP/DNP, and CLNP/BNP.

FCUP A country-level genetic survey of the IUCN critically endangered western chimpanzee (Pan troglodytes
verus) in Guinea-Bissau
98
Figure 24. Graphical representation of the Mantel test performed to analyse the hypothesis of isolation by distance for
each pair of geographic populations. Each point represents an individual. The x-axis represents the geographic distance
between each pair of individuals in km and the y-axis represents the linear genetic distance. Significant correlation
between Euclidean geographical and genetic distances was obtained for the pairs CFNP/CLNP, CFNP/DNP,
CFNP/BNP, and DNP/BNP (p < 0.05).

FCUP A country-level genetic survey of the IUCN critically endangered western chimpanzee (Pan troglodytes
verus) in Guinea-Bissau
99
In the spatial autocorrelation analysis (Figure 25), significant genetic similarity between
individuals was found for the distance classes between 0 and 16 km (p < 0.05). This
corresponds to the distance between samples within each geographic population and
includes pairwise comparisons between Empada and CLNP. In the distance classes
between 40 and 70 km, the individuals are significantly dissimilar (p < 0.05). These
distance classes correspond to the pairwise comparisons between the pairs
CFNP/Empada, CFNP/CLNP, Empada/CLNP, and DNP/BNP.
Figure 25. Spatial autocorrelation analysis (N = 185) – correlogram of the correlation coefficient (r) between genetic and
geographic distance at 18 distance classes (km, end point) with an even number of samples (c. 1,000 pairwise
comparisons per distance class). U and L are upper and lower limits of the 95% confidence band under the null
hypothesis of random distribution of genotypes across the landscape. Error bars represent 95% confidence intervals
around each mean correlation coefficient. Distance classes with significant pairwise genetic distances are the ones
standing outside the dashed lines.
The spatial autocorrelation analysis was also performed using divided datasets per
every pair of geographic populations (Figure 26). Significant genetic similarity (p <
0.05) was always found for the first distance classes, corresponding to the distances
within social groups or among social groups within populations. With the exception of
the pair CLNP/DNP, significant genetic dissimilarity (p < 0.05) was encountered for all
pairs for at least one distance class corresponding to the distance between geographic
populations. For the pair CFNP/BNP, genetic similarity was found for the distance class
35-140 km (r = 0.007; p < 0.05), which constitutes the only case where significant
genetic similarity was found within a class including the distance between geographic
populations. Nevertheless, this is the largest distance class considered (105 km) and
also includes three pairwise comparisons within CFNP.
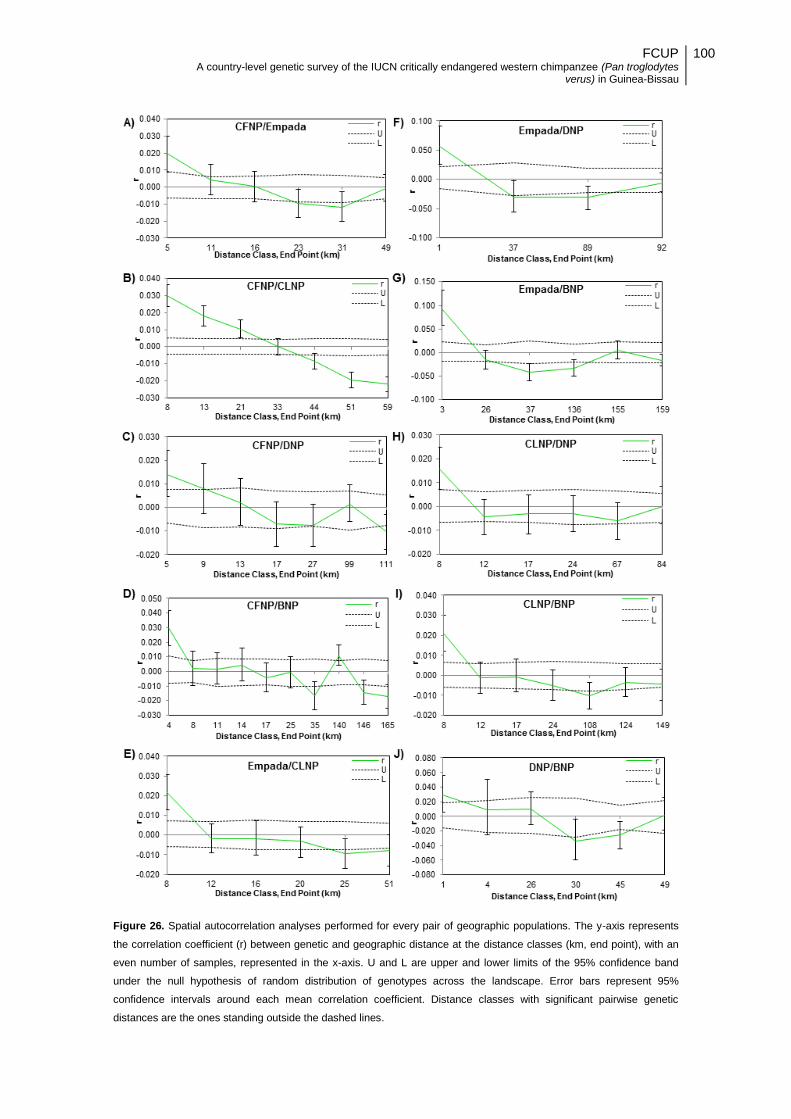
FCUP A country-level genetic survey of the IUCN critically endangered western chimpanzee (Pan troglodytes
verus) in Guinea-Bissau
100
Figure 26. Spatial autocorrelation analyses performed for every pair of geographic populations. The y-axis represents
the correlation coefficient (r) between genetic and geographic distance at the distance classes (km, end point), with an
even number of samples, represented in the x-axis. U and L are upper and lower limits of the 95% confidence band
under the null hypothesis of random distribution of genotypes across the landscape. Error bars represent 95%
confidence intervals around each mean correlation coefficient. Distance classes with significant pairwise genetic
distances are the ones standing outside the dashed lines.

FCUP A country-level genetic survey of the IUCN critically endangered western chimpanzee (Pan troglodytes
verus) in Guinea-Bissau
101
At the Y-linked microsatellite locus, two alleles (264 and 268, as genotyped by the
present study) were found. The distribution of the alleles was not homogeneous across
geographic regions (Figure 27). Each allele was present in 50% of the males at CFNP
and Empada. In CLNP, 83% and 17% of the males were genotyped for alleles 264 and
268, respectively. In contrast, allele 1 was not found in BNP males, which presented
100% of allele 2.
Figure 27. Allele frequencies for the Y-linked microsatellite marker across Guinea-Bissau. Circle size is proportional to
the number of genotypes obtained from each site (40 in CFNP, 14 in Empada, 29 in CLNP, and 13 in BNP). Main water
courses are represented in blue, roads in white, and villages in grey. Produced using QGIS v. 2.18.0.
The hierarchical AMOVA performed for Y-linked locus suggests that most of the
variation encountered at this marker derives from within the populations (67.67%) and
that 32.33% is found among populations (Table XI).

FCUP A country-level genetic survey of the IUCN critically endangered western chimpanzee (Pan troglodytes
verus) in Guinea-Bissau
102
Table XI. AMOVA results for the Y-linked microsatellite marker. The p-value indicates the probability of finding a more
extreme variance component and FST value than observed by chance alone after 10,000 permutations.
Source of
variation
Sum of
squares
Variance
components
Percentage of
variation FST p-value
Among
populations 12.537 0.08966 32.33
0.32334 0.00000
Within
populations 35.276 0.18764 67.67
3.3.3. Demographic history
In the demographic history analyses, as estimated using mtDNA, 168 sequences from
the five geographic populations were used (see 3.2.1. for details). The main statistical
indices were estimated for the overall dataset and per population, except for the two
sequences from DNP, which were not sufficient for the calculations (Table XII).
Table XII. Statistical indices calculated to analyse demographic history: Tajima’s D, Fu’s Fs. Fu and Li’s D*, Fu and Li’s
F*, and Ramos-Onsins and Rozas’ R2. N is the number of samples used per sampling site. Significant values are
indicated by one asterisk (*; p < 0.05) or two asterisks (**; p < 0.02).
Population N Tajima’s D Fu’s Fs Fu and Li’s D* Fu and Li’s F* R2
CFNP 93 2.01 5.64 0.75 1.51 0.16
Empada 17 1.33 3.78 0.61 0.95 0.19
CLNP 26 0.88 0.22 1.26 1.34 0.16
BNP 30 1.90 1.53 1.81** 2.17** 0.20
Overall 168 2.20* -1.02 2.13** 2.60** 0.16
For the overall dataset, Tajima’s D was positive and significant (Tajima’s D = 2.20; p <
0.05). Fu and Li’s D* and F* values were positive and significant for BNP (Fu and Li’s
D* = 1.81, Fu and Li’s F* = 2.17; p < 0.02) and for the overall dataset (Fu and Li’s D* =
2.13, Fu and Li’s F* = 2.60; p < 0.02). Positive and significant statistics suggest
population subdivision for the overall dataset and for BNP.
The overall mismatch distribution is multimodal, suggesting a history of stable
population size over time (Figure 28). However, the raggedness index did not indicate
a significant deviation from the model of population growth. Based on the graphic, two
stable and multimodal lineages seem to be present, possibly one older (higher pairwise
differences between sequences) and one more recent (with lower number of pairwise

FCUP A country-level genetic survey of the IUCN critically endangered western chimpanzee (Pan troglodytes
verus) in Guinea-Bissau
103
differences between sequences). The mismatch distributions conducted per
geographic population exhibit a very similar pattern, with the CFNP and Empada
distributions resembling more the roughly bimodal pattern (Figure 29).
Figure 28. Mismatch distribution based on the mitochondrial DNA control region. The back line represents the observed
distribution and the grey lines represent expected distributions under models of constant population size and of
population growth. The data did not significantly deviate from a model of population growth, based on the raggedness
index (r; p > 0.05).
r = 0.0092; P = 0.4170

FCUP A country-level genetic survey of the IUCN critically endangered western chimpanzee (Pan troglodytes
verus) in Guinea-Bissau
104
Figure 29. Mismatch distributions for the geographic populations under study. A) CFNP; B) Empada; C) CLNP; D) BNP.
The raggedness index (r) value was non-significant (p > 0.05) in all cases, suggesting a history of population growth.
The BOTTLENECK analysis showed similar results for the whole dataset and for each
of the two clusters identified by the STRUCTURE analysis (see section 3.3.2.).
Significant heterozygosity excess was found under the Infinite Allele Model (p < 0.05
for the sign tests, the standardized differences tests, and the Wilcoxon sign-rank test),
but not under the Stepwise mutation model (p > 0.05 in the three tests). The mode-shift
indicator was consistent with what was expected under the mutation-drift equilibrium
(L-shape), showing no evidences of recent bottlenecks for any of the three datasets
(Figure 30).

FCUP A country-level genetic survey of the IUCN critically endangered western chimpanzee (Pan troglodytes
verus) in Guinea-Bissau
105
Figure 30. L-shaped allele-frequency distributions (mode-shift indicators), which are typical of stable populations,
obtained from the BOTTLENECK analysis. A) Whole dataset of 185 unique genotypes. B) Cluster 1 identified in the
STRUCTURE analysis (45 genotypes). C) Cluster 2 identified in the STRUCTURE analysis (43 genotypes).
3.4. Genetic diversity and population structure at a
geographic fine-scale in Guinea-Bissau
70 individuals, 58 from CLNP and 12 from DNP, genotyped for a maximum of 21
microsatellite loci (mean QI across loci = 0.73, varying between 0.40 and 1.00) were
included in the fine scale analyses (see 3.1.4. for details).
Main genetic diversity statistics were calculated for each of the two populations and for
the overall dataset, considering the means across all loci (Table XIII). Na and Ne
presented values of 4.190 and of 3.404, respectively, for the whole dataset. HO was of
0.622 and HE of 0.677. FIS was of 0.079. CLNP seems to present more diversity than
DNP. Significant departures from the HWE were found for two loci for the DNP
population – Fesps and D6s503 (Bonferroni p = 0.017). No pairs of loci were in LD in
any of the populations (Bonferroni p = 2.924 × 10⁻⁴).
Table XIII. Mean summary diversity statistics for the two geographic populations and the overall dataset of samples
included in the fine-scale analysis: N (sample size); Na (number of different alleles); Ne (effective number of alleles); HO
(observed heterozygosity); HE (expected heterozygosity); FIS (inbreeding coefficient). Standard errors are between
brackets.
Population N Na Ne HO HE FIS
CLNP 50.619(±1.752) 6.095(±0.487) 3.644(±0.374) 0.628(±0.030) 0.671(±0.031) 0.056(±0.027)
DNP 9.857(±0.469) 4.476(±0.376) 3.164(±0.287) 0.582(±0.055) 0.634(±0.031) 0.119(±0.070)
Overall 60.476(±2.067) 6.190(±0.510) 3.404(±0.236) 0.622(±0.032) 0.677(±0.031) 0.079(±0.029)

FCUP A country-level genetic survey of the IUCN critically endangered western chimpanzee (Pan troglodytes
verus) in Guinea-Bissau
106
Significant genetic differentiation between the two populations was found (FST =
0.05991, p < 0.05). The AMOVA performed (Table XIV) suggests the greater degree of
variation is within populations (94.01%), instead of among populations (5.99%).
Table XIV. AMOVA results. The p-value indicates the probability of finding a more extreme variance component and FST
value than observed by chance alone after 10,000 permutations.
Source of
variation Sum of squares
Variance
components
Percentage of
variation FST p-value
Among
populations 5.075 0.09150 5.99
0.05991 0.00059
Within
populations 198.139 1.43579 94.01
The Bayesian individual-based clustering analysis performed in STRUCTURE did not
suggest sub-clusters of individuals (posterior probabilityK=1 = 1; Figure 31).
Nevertheless, K = 3 was the most probable solution using the Evanno method (KK=3 =
14) and the second most probable using the posterior probability method (posterior
probabilityK=3 = 4 × 10-20). Visual inspection of the bar plots suggests clustering of five
individuals in one cluster when K = 3 (Figure 31-C, green bars).

FCUP A country-level genetic survey of the IUCN critically endangered western chimpanzee (Pan troglodytes
verus) in Guinea-Bissau
107
Figure 31. Individual Bayesian clustering analysis performed in STRUCTURE (70 unique genotypes). A) Inference of
the most likely number of clusters (K) using K and LnP(K) values across all runs. B) Bar plot output assuming K = 2. C)
Bar plot output assuming K = 3.
To test the hypothesis of subtle substructure, a progressive partitioning analysis was
attempted. The samples were divided using as threshold Q > 0.5, considering the K = 2
solution (Figure 31-B). This partition grouped 22 individuals sampled at CLNP and the
12 individuals sampled at DNP in cluster 1 (average Q1 = 0.571, varying between 0.510
and 0.617), and 36 individuals from CLNP in cluster 2 (average Q2 = 0.552, varying
between 0.501 and 0.602; Figure 32). Each of the two initial clusters was divided into
two sub-clusters. The partition of cluster 1 gave rise to two sub-clusters with a

FCUP A country-level genetic survey of the IUCN critically endangered western chimpanzee (Pan troglodytes
verus) in Guinea-Bissau
108
probability of assignment of 0.5 across all individuals and, thus, the procedure was
discontinued. Cluster 2 was subdivided in cluster 2A (24 individuals; average Q2A =
0.570, varying between 0.505 and 0.586) and cluster 2B (12 individuals; average Q2B =
0.554, varying between 0.505 and 0.587). Partitioning of clusters 2A and 2B originated
clusters with probabilities of assignment of 0.5 across all individuals, so partitioning
was not further continued. Clusters 2A and 2B are not geographically clustered nor
separated by the main roads or other potential barriers in CLNP.
Figure 32. Map representation of the first partitioning of genotypes into two clusters using an individual Bayesian
clustering analysis implemented in STRUCTURE. The individuals from CLNP are divided into clusters 1 (22 individuals)
and 2 (36 individuals). The 12 individuals from DNP were assigned to cluster 1. Circles are proportional to sample size
in each locality. Main water courses are represented in blue, roads in white, and villages in grey. Produced using QGIS
v. 2.18.0.
The individual Bayesian clustering analysis performed in BAPS did not show evidences
of substructure (posterior probabilityK=1 = 0.86; Figure S8, Supplementary Material).
The two geographic populations appear differentiated to some extent in the PCA
(Figure 33). Although the inertia ellipses partially overlap, the CLNP geographic
population is approximately equally spread across the two axes while the variation at

FCUP A country-level genetic survey of the IUCN critically endangered western chimpanzee (Pan troglodytes
verus) in Guinea-Bissau
109
the DNP geographic population is mostly explained by the y-axis. Furthermore, some
individuals from CLNP appear quite differentiated, mainly along the x-axis, from the
main cluster.
Figure 33. Principal component analysis (PCA) performed using the 70 unique genotypes included in the fine-scale
analysis. The x-axis and the y-axis explain 6.3% and 6.0%, respectively, of the observed variation. Each point
represents an individual and colours distinguish between sampling sites (Pink: CLNP; Orange: DNP). Inertia ellipses
include two thirds of the individuals from each sampling site.
Differences between CLNP and DNP are not noticeable based on the sPCA, as there
is a geographic overlap of all individuals from DNP. High levels of genetic diversity are
present across the landscape (Figure 34).

FCUP A country-level genetic survey of the IUCN critically endangered western chimpanzee (Pan troglodytes
verus) in Guinea-Bissau
110
Figure 34. Spatial principal component analysis (sPCA) performed based on the 70 unique genotypes included in the
fine-scale analysis. A) Plot of the eigenvalues across the principal components. The first three global components were
maintained. B) First three global principal components on the geographic space. The first principal component is
represented in a scale from red (maximum score) to black (minimum score), the second principal component in a scale
from green (maximum score) to black (minimum score), and the third principal component is represented in a scale from
blue (maximum score) to black (minimum score). Each point represents an individual and its colour indicates the
combination of the three scores.
The spatial autocorrelation analysis (Figure 35) indicates that genotypes are not
randomly distributed across the study area but present a pattern of isolation by
distance. Within social units (at the distance class of 0 – 1 km), individuals are
significantly genetically similar (r = 0.033, p < 0.05) and pairwise genetic dissimilarity
increased significantly with the increase of distance. At distance classes corresponding
to pairwise comparisons between the two populations (i.e. 22 to 70 km and 70 to 84
km), individuals are significantly genetic dissimilar (r = -0.008 and r = -0.014,
respectively; p < 0.05).

FCUP A country-level genetic survey of the IUCN critically endangered western chimpanzee (Pan troglodytes
verus) in Guinea-Bissau
111
Figure 35. Spatial autocorrelation analysis – correlogram of the correlation coefficient (r) between genetic and
geographic distance at 10 distance classes (km, end point) with an even distribution of samples. U and L are upper and
lower limits of the 95% confidence band under the null hypothesis of random distribution of genotypes across the
landscape. Error bars represent 95% confidence intervals around each mean correlation coefficient. Distance classes
with significant pairwise genetic distances are the ones standing outside the dashed lines.
The Mantel test performed corroborates the hypothesis of isolation by distance, i.e.
there is a significant correlation (95% confidence) between geographic and genetic
distances (Figure 36).
Figure 36. Graphical representation of the Mantel test performed to analyse the hypothesis of isolation by distance,
using the dataset of 70 genotypes included in the fine-scale analysis. Significant correlation between Euclidean
geographical and genetic distances was obtained (p < 0.05).
FCUP A country-level genetic survey of the IUCN critically endangered western chimpanzee (Pan troglodytes
verus) in Guinea-Bissau
112
4. Discussion
This research studied the genetic diversity and structure of the western chimpanzee
(Pan troglodytes verus) in Guinea-Bissau, with emphasis on the Cufada Lagoons
Natural Park and on the Dulombi National Park populations, analysed the presence of
possible barriers to dispersal and gene flow, and examined the demographic history of
the populations. Furthermore, it was the first genetic research to include chimpanzee
samples collected north of the Corubal River, in Dulombi National Park. The genetic
dataset based on the non-invasive faecal samples collected by the present study was
merged with the one generated by Sá (2013) and 185 unique genotypes were used for
the analyses. Five different geographic populations were studied using a fragment of
the mitochondrial DNA control region, a maximum of 21 autosomal microsatellite
markers, and one Y-linked microsatellite locus. The sex of the individuals was
determined using a molecular protocol. The present study constituted the most
complete genetic survey of the western chimpanzee in Guinea-Bissau conducted to
date.
4.1. Overview of main results, limitations, and further
research
4.1.1. Laboratory procedures, genotypes quality, and sample
selection
The main difficulty encountered during the development of this project was the low
amplification success (68%) of the microsatellite markers and the low ratio of samples
with genotypes of sufficient quality to be included in the final dataset (58% of the
samples from which DNA was extracted were not included in the final dataset of
genotypes due to the low quality of the genotypes, the impossibility to distinguish
among them, or to the lack of GPS information). This constraint is common in genetic
studies on wild populations of primates (e.g. Bergl and Vigilant, 2007; Ferreira da Silva
et al., 2014).
More difficulties were faced when using the markers that did not have incorporated
fluorescence, which might be due to the use of universal tails. The ones that attached
to PET fluorescence were especially hard to amplify. This was the case of the Y-linked

FCUP A country-level genetic survey of the IUCN critically endangered western chimpanzee (Pan troglodytes
verus) in Guinea-Bissau
113
microsatellite marker locus, for which very few samples amplified successfully and for
which it was not possible to obtain results from DNP.
Optimising the amplification protocols revealed to be a time demanding task. The fact
that the amplification success was low also increased the monetary costs associated to
the process. The cost-efficiency of the laboratory procedures were, however, increased
due to the use of universal tails and especially due to the multi-loading of up to 12
markers for sequencing. This process has been successful and can be used to reduce
the costs associated to the genotyping process.
The selection of the quality index minimum threshold for the samples to be included in
the final dataset was an issue that was dealt with very cautiously. Although one might
argue only very high quality samples must be included in final analyses – for instance,
Miquel et al. (2006) defined their threshold at 0.6 –, relevant information might be lost
by excluding lower quality samples. For the present study, the QI was recalculated
using only the markers for which a consensus genotype had been attained. This
increased the value for all markers and revealed that the low QI observed for many
samples was mainly a result of non-amplifications instead of inconsistent amplifications
(i.e. of poor quality of the samples). Thus, the threshold of QI for the present study was
defined at 0.40. A lower QI added noise to the analyses, leading to poorly defined
genetic units, and a higher QI removed trends.
At an earlier stage, genotyping rules had been altered after it was realized that non-
amplifications were having too much of an effect lowering the QI of the markers and of
the samples and/or were not allowing to reach a consensus genotype. At that stage, it
was considered useful to calculate the actual error rates (ADO and FA; Broquet and
Petit, 2004) as it allowed including all performed replicates . Although this may be
considered a circular analysis, as it used reference genotypes obtained with a
threshold calculated based on previously estimated error rates, it was helpful to have
an extra tool to analyse the quality of the samples.
Another question that arose during the development of the project was how missing
data could impact on the results. When merging the two sets of data (RS and FB
datasets), one containing information for 10 microsatellite markers and another for 21,
tests were performed to verify whether it was preferable to use more markers and
include missing data for most of the samples or to loose information for more than half
the markers and minimise the amount of missing data. It was confirmed that the
second option was more desirable as missing data affected the analyses considerable

FCUP A country-level genetic survey of the IUCN critically endangered western chimpanzee (Pan troglodytes
verus) in Guinea-Bissau
114
by introducing patterns that reflected the number of informative markers instead of the
differences among samples.
4.1.2. Genetic Diversity
Genetic diversity levels of the Guinea-Bissau chimpanzees as estimated by a fragment
of the mtDNA control region (overall Hd = 0.94 and = 0.04, N = 168 sequences) can
be considered high. For instance, Stone et al. (2010) report levels of nucleotide
diversity of = 0.01 (N = 6 sequences) for western chimpanzees, using the same
mtDNA region, although with very different sample sizes.
Levels of genetic diversity were very uniform among the geographic populations when
considering the mtDNA data: haplotype diversity was of 0.9 for all populations and
nucleotide diversity varied between 0.03 and 0.04. Sá (2013) obtained the same value
of haplotype diversity for the populations of Guinea-Bissau (0.9), but slightly higher
values of nucleotide diversity (0.05). Nevertheless, the present study, which includes
more samples and one more population (DNP) than those used by Sá (2013),
uncovered more unique haplotypes (45 different haplotypes), when compared to the 42
identified by Sá (2013). The levels of nucleotide diversity obtained by the present study
and by Sá (2013) are within the range estimated by Shimada et al. (2004) – 0.03 to
0.05 – for the western chimpanzee populations in Guinea and Côte d’Ivoire, using the
same region of the mtDNA. Comparing with other subspecies, the values of nucleotide
diversity found are higher than those reported for the eastern chimpanzees ( = 0.02;
Goldberg, 1998), but lower than those reported for the central chimpanzees ( = 0.06;
Yu et al., 2003).
The population of chimpanzees of Guinea-Bissau also displayed relatively high levels
of genetic diversity as estimated using microsatellite loci data (HE = 0.75, N = 185
genotypes). Comparing the values of HE obtained with the average value obtained by
Becquet et al. (2007) for wild-caught western chimpanzees from Sierra Leone and of
unknown origin (HE = 0.61, N = 34), a higher diversity was found by the present study
(please note the different sample sizes between studies). However, Becquet et al.
(2007) did not use the same set of microsatellite loci as the present study and,
therefore, the differences in variability of the loci set can account for the differences in
estimated values of genetic diversity. Comparing with other subspecies, Ne and HE
values obtained by this study are within the range found for eastern chimpanzees (3.17
≤ Ne ≤ 4.95; 0.685 ≤ HE ≤ 0.798; Moore and Vigilant, 2013). Becquet et al. (2007)

FCUP A country-level genetic survey of the IUCN critically endangered western chimpanzee (Pan troglodytes
verus) in Guinea-Bissau
115
found an average value of HE of 0.697 for central chimpanzees, which is also within the
range of values obtained by this study. High levels of genetic diversity may be a result
of large population size, immigration, and weak levels of isolation (Frankham, 1996;
Eckert, Samis and Lougheed, 2008).
CLNP presented the highest genetic diversity (HE = 0.75, N = 67 genotypes) whereas
Empada presented the lowest genetic diversity (HE = 0.68, N = 12 genotypes) of all
populations. Accordingly, Ne presented the highest value for CLNP (Ne = 4.50) when
compared to Empada (Ne = 3.46). Given that CLNP is considered a threatened
population in Guinea-Bissau (thought to be the smallest population in the country,
limited by the presence of major human settlements, and exposed to heavy
deforestation; see section 1.3.1.), the fact that it shows high levels of genetic diversity
may indicate not enough time has passed since threats were aggravated for diversity
statistics to reflect it. The lower level of autosomal genetic diversity in Empada could be
explained by a small sample size (12 samples). Nevertheless, given that Empada is the
only population under study outside a protected area, a better estimation of genetic
diversity should be attempted in future studies, to examine the possibility of Empada
being more threatened than other populations.
4.1.3. Population structure
4.1.3.1. Patterns of gene flow, potential barriers to dispersal,
and population isolation
A fragment of the mtDNA control region, up to 21 autosomal microsatellite markers,
and one Y-linked microsatellite locus were used to investigate how the western
chimpanzee population was structured in Guinea-Bissau. The results of the median-
joining network constructed using mtDNA data, of the Bayesian individual-based
clustering methods (STRUCTURE and BAPS) using microsatellite data, and of the
multivariate techniques applied to obtain the PCAs using both types of genetic markers
suggest a weak population structure in Guinea-Bissau and no clear geographical
structure pattern emerges from the analyses.
The hierarchical AMOVA revealed that most of the total genetic variation is present
within populations (95% – 98%) instead of among populations (2% – 5%), using
mtDNA and microsatellite data (respectively). This pattern had already been described
in other studies of wild populations of chimpanzees from Uganda, Rwanda, Tanzania,

FCUP A country-level genetic survey of the IUCN critically endangered western chimpanzee (Pan troglodytes
verus) in Guinea-Bissau
116
the Democratic Republic of Congo (Goldberg and Ruvolo, 1997), Guinea, and Côte
d'Ivoire (Shimada et al., 2004).
In Guinea-Bissau, Sá (2013), using mtDNA data only, found a similar pattern to this
study in that the majority of total genetic variation was present within populations,
although the figures between the two studies do not totally agree. Sá (2013) estimated
a total of 74% of total variation within populations, which is lower when compared to the
value of 95% estimated by the present study. However, Sá (2013) included a
population from the Nimba Mountains, in Guinea, when estimating the total variation
within populations, which is probably the reason why the percentage of variation
among populations is higher in Sá (2013) study. Moreover, the four haplogroups
uncovered by the present study, both in the network and in the PCA, were not identified
in the study by Sá (2013), probably because the median-joining haplotype network
obtained by Sá (2013) comprised a higher level of inter-population variation. This
network included samples from Guinea-Bissau, but also from Guinea, Nigeria, and
Cameroon, and thus comprised two subspecies (the western and the Nigeria-
Cameroon).
When analysing the geographic distribution of the 42 haplotypes identified in Guinea-
Bissau by Sá (2013), the clusters of haplotypes are not geographically structured. This
is in accordance to what the present study has encountered and is a pattern that
suggests historical female gene flow throughout the whole country, which is similar to
what has been found for Temmink’s red colobus (Procolobus badius temminckii) at the
scale of CFNP (Minhós et al., 2013) and for Guinea baboon (Papio papio) in the
southern region of Guinea-Bissau (Ferreira da Silva et al., 2014). The median-joining
haplotype network reconstructions per geographic population show a similar shape and
at least four different lineages distanced by up to nineteen mutations are present in all
the populations. This is in accordance to what was expected based on the values of ,
which are very similar across populations and relatively high (see section 4.1.2.). As Sá
(2013) had highlighted, it is essential to have an analysis of Guinea-Bissau’s
chimpanzees using nuclear markers, as those provide more power than mtDNA
markers to detect contemporary alterations in genetic structure. As such, the
microsatellite analysis by the present study represents an advance to the
understanding of the population structure pattern of the chimpanzees in Guinea-
Bissau.
When considering population pairwise comparisons of genetic differentiation, a pattern
in which the populations located at coastal areas are slightly more differentiated from

FCUP A country-level genetic survey of the IUCN critically endangered western chimpanzee (Pan troglodytes
verus) in Guinea-Bissau
117
the BNP population can be observed. The only two pairs of geographic populations
with a value of FST significantly different from zero at both types of markers are
CFNP/CLNP and CLNP/BNP. While the CFNP/CLNP significant FST value can be
explained by a pattern of isolation by distance as revealed by a Mantel test, the
CLNP/BNP pair did not reveal a significant correlation between genetic and geographic
distances. The pair Empada/BNP also has an associated significant FST value not
explained by a pattern of isolation by distance. Overall, these results suggest a slightly
higher genetic differentiation between the coastal areas of Empada and CLNP and the
most distant population of BNP. The distance between CLNP, Empada, and BNP
would not fully explain this result. CFNP and BNP, which are located at similar
distances to those that separate CLNP and Empada from BNP (i.e. CFNP and BNP are
distanced by 142 km, and CLNP and BNP are distanced by 122 km), exchange
individuals (two first-generation migrants sampled in BNP but originally from CFNP and
DNP were identified) and significant genetic similarity was found for distances of up to
140 km, which corresponds to distance classes between CFNP and BNP.
Ferreira da Silva et al., (2014) also found that the baboons (Papio papio) population
sampled at BNP were significantly differentiated from the coastal sampling sites in
Guinea-Bissau. Nevertheless, gene flow between CLNP and BNP is ongoing for
baboons, as the authors found evidences for first-generation migrants present in CLNP
originated in BNP and significant genetic similarity between samples separated by up
to 116 km, which corresponds to distance classes between CLNP and BNP.
One possible explanation for gene flow between BNP and coastal areas of Empada
and CLNP to be more constrained is the high number of roads and villages that
surround those localities. Empada population is formed by two geographically distinct
localities (see Figure 4) and is closely located to one of the main roads connecting the
south of the country to the capital. That specific road seems to have an effect on the
CLNP population of chimpanzees, since a tissue sample form a run-over individual was
obtained from there. To migrate from Empada and CLNP to BNP, or the opposite,
individuals would have to cross a high number of human infrastructures or travel larger
distances (e.g. along the wildlife corridor to BNP along the border to Guinea) or,
alternatively, cross the Corubal River and then re-cross it, as all samples from BNP
were collected south of the river. Ferreira da Silva et al. (2014) suggested that baboons
could potentially cross the river near the Saltinho village, which is between CLNP and
DNP and where the river is only 130 m wide. However, chimpanzees seem to be more
reluctant to cross water courses than baboons (Nishida, 1980). On the other hand,

FCUP A country-level genetic survey of the IUCN critically endangered western chimpanzee (Pan troglodytes
verus) in Guinea-Bissau
118
CFNP is located at one extremity of a wildlife corridor connected to BNP (IBAP, 2017),
which could potentially facilitate movements between the two areas.
The only pair of populations including BNP for which no significant FST values were
found for at least one type of genetic marker was DNP/BNP. IBAP (2017) considers
these two populations to form a complex (Dulombi-Boé-Tchetche) that includes the
Tchetche wildlife corridor, which should guarantee connectivity between the parks.
Although significant genetic dissimilarity was found at the distance classes that include
the distance between DNP and BNP, the Mantel test indicated a pattern of isolation by
distance and one individual sampled in BNP was found to be a first-generation migrant
from DNP. Thus, it seems that DNP and BNP exchange individuals.
The comparisons between CFNP and Empada revealed a significant FST value at the
mtDNA marker and a non-significant pattern of isolation by distance for this pair of
populations using microsatellite data. When examining the spatial autocorrelation
pattern (Figure 25), significant genetic dissimilarity exists at the distance classes
including pairwise comparisons between CFNP and Empada. Between the isthmus of
the Peninsula where CFNP is located and Empada, a number of roads and human
settlements are present, which includes the town of Catió. Those landscape features
may hinder dispersal of individuals and, consequently, gene flow.
The Bayesian clustering analyses suggested a weak degree of structure among the
five geographic populations, although the majority of individuals was considered
admixed (using STRUCTURE analyses outputs) or was part of a main cluster (BAPS
analyses). In this regard, the STRUCTURE analysis was considered more reliable in
the scope of the present study, given the low posterior probability of K provided by
BAPS (p = 0.51). It is worth noticing, however, that the results of the two algorithms
converged in clustering together five individuals sampled in BNP.
Using STRUCTURE, K = 2 was the most probable clustering solution. The two clusters
seem to have gone through similar demographic processes and neither of them
displayed signs of recent bottlenecks. Using a threshold of Q ≥ 0.8, a greater
proportion of individuals from CFNP were assigned to cluster 1 than to cluster 2 (38%
compared to 17%, respectively), whereas in CLNP, DNP, and BNP a lower number of
individuals were assigned to cluster 1 (14%, 10%, and 12%, respectively) and a greater
number of individuals were assigned to cluster 2 (22%, 45%, and 41%, respectively).
The eleven individuals within CFNP that were clustered together at K = 6 were grouped
in cluster 2 at K = 2 and no reason was found for these individuals to be clustered apart
from the others. This might arise as a result of high levels of relatedness, which would

FCUP A country-level genetic survey of the IUCN critically endangered western chimpanzee (Pan troglodytes
verus) in Guinea-Bissau
119
bias the STRUCTURE analysis by clustering those individuals together. However, the
great majority of the individuals could not be assigned to the two clusters with a high
probability and all the populations share individuals assigned to both clusters.
Overall, these results suggest a subtle level of population substructure of the
chimpanzees in Guinea-Bissau. Cryptic genetic structure corresponds to weak and/or
hidden genetic patterns (Basto et al., 2016) and occurs at a local scale (Latch et al.,
2011) as a result of low genetic variation (Jombart et al., 2008) and differentiation
between populations (Basto et al., 2016). Lack of a stronger population structure is
probably not related to a small sample size (for instance, DNP N = 11 genotypes),
since cryptic structure can be unravelled even with limited sampling (6-10 individuals;
Fogelqvist et al., 2010). Although most studies focus on patterns of gene flow and
spatial genetic structure at a regional scale, different and unique landscape features
may influence structure at finer scales (Latch et al., 2011). In the context of the present
study, where no country-scale structuring is clear, the study of gene flow and dispersal
barriers patterns at a smaller scale is especially relevant.
4.1.3.2. Sex-specific dispersal patterns
Male chimpanzees are usually philopatric and females tend to disperse (Morin et al.,
1993). The comparison between the pattern of population structure obtained using
mtDNA (maternal lineage) and Y-linked microsatellite markers (paternal lineage) is
especially relevant to understand dispersal patterns when sex-biased gene flow is
present. In a female-biased dispersal species, it is expected that lower levels of genetic
structure are found for the mtDNA marker when compared to microsatellite loci and, in
particular, higher levels of structure for the Y-linked microsatellite markers are
expected.
In this study, more significant pairwise FST values, which reveal genetic differentiation
between geographic populations, were found with the mtDNA data (five pairs of
populations) than with the microsatellite data (two pairs of populations). Given the fact
that, in chimpanzees, females usually constitute the dispersing sex, an opposite trend
was expected at the mtDNA marker. It was expected that the maternal lineage would
not reveal more patterns of differentiation than the autosomal markers and that,
instead, revealed more evidences of gene flow. Although having found less evidences
of population structure than the present study, Shimada et al. (2004) found low
evidences of gene flow at the same fragment of the mtDNA for the western

FCUP A country-level genetic survey of the IUCN critically endangered western chimpanzee (Pan troglodytes
verus) in Guinea-Bissau
120
chimpanzees in Guinea and Côte d’Ivoire. Shimada et al. (2004) hypothesised that the
ancestral population was panmictic and not enough time had passed to accumulate a
significant pattern of structure. This could be the case for the chimpanzees in Guinea-
Bissau. However, since subtle structure was found using microsatellites, one plausible
explanation in the scope of this study is that females are not the only dispersing sex.
Male-specific gene flow patterns were analysed through the Y-linked microsatellite
locus. Two alleles were obtained for the Guinea-Bissau chimpanzee populations using
this marker, and those were found to be present in all the populations under study with
the exception of BNP. BNP was the only population for which only one of the two
alleles was present, although sample size might be accountable for the result (N = 13
males in BNP, N = 40 males in CFNP, N = 14 males in Empada, and N = 29 males in
CLNP). The hierarchical AMOVA performed shows that the majority of the total
variation found is within populations (67.67%), which is contrary to what was expected
under the male philopatry scenario. Results suggest some level of male-mediated gene
flow is present among the chimpanzee populations in Guinea-Bissau.
Although only one Y-linked marker was used in the present study, considering the
expected male philopatry typical of chimpanzee populations and for which support was
found in similar studies, especially on eastern chimpanzees (Langergraber et al., 2007,
2014; Moore, Langergraber and Vigilant, 2015), evidences of clustering were expected.
Moore, Langergraber and Vigilant (2015), who used the same marker to genotype the
eastern chimpanzees from Ugalla, Tanzania, also found low genetic diversity (two
alleles for the locus). However, the authors found an evident spatial clustering at the Y-
chromosome in that population.
A pattern of male-mediated gene flow may be present as a subspecies specificity
unique of western chimpanzees or of some populations of chimpanzees, as inferred by
Schubert et al. (2011). Schubert et al. (2011) found lower levels of differentiation at Y-
chromosome microsatellites than expected in the absence of male gene flow in
chimpanzees sampled at Taï National Park, Côte d’Ivoire. That study suggested extra-
group paternities to be a likely mechanism for male-mediated gene flow. This
mechanism includes coercive mating by males from neighbouring groups at times
when females are solitary and visits by females to neighbouring groups over weeks or
months. Vigilant et al. (2001) had also found some offspring in Taï National Park to
have extra-group paternity. An alternative explanation could be the dispersal of adult
males and of breeding females carrying male offspring (Schubert et al., 2011).

FCUP A country-level genetic survey of the IUCN critically endangered western chimpanzee (Pan troglodytes
verus) in Guinea-Bissau
121
4.1.3.3. Fine-scale analysis in CLNP and DNP
The fine-scale analysis allowed further investigating the patterns of structure among
CLNP and DNP, using a higher number of nuclear markers than those available for the
broad scale analysis.
Levels of genetic diversity were higher in CLNP – HE = 0.671; Ne = 3.644 –, as
expected based on the values from the broad scale analysis and on the conclusion that
the complex formed by DNP and BNP is, to some extent, isolated from the other
geographic populations in Guinea-Bissau. The values of genetic diversity for CLNP and
DNP obtained using 21 markers were lower than those obtained using 10 markers,
although the figures obtained in both analyses were within the expected range for
chimpanzee populations (Becquet et al., 2007; Moore and Vigilant, 2013).
The set of results obtained suggested genetic structure is present to some extent
among CLNP and DNP, although it is not strong. Despite the significance of the genetic
differentiation value (FST), the hierarchical AMOVA revealed that the majority of the
total variation is present within populations, as opposed to between populations, which
is in accordance to what had been found in the broad scale analysis. Indeed, the sPCA
performed reveals a great degree of genetic variation within CLNP, although it is not
useful in distinguishing the two populations. The Mantel test performed revealed a
significant pattern of isolation by distance, which is in agreement with the significant
levels of genetic dissimilarity at the distance classes separating CLNP from DNP in the
spatial autocorrelation analysis. This could be sufficient to explain the differentiation
encountered between populations.
Some immigrants might be present in CLNP, which is suggested by the PCA
performed. This would explain some of the genetic variation present within the
population and would suggest a not very large degree of isolation of this population, at
least until recently.
The progressive partitioning approach conducted in STRUCTRE revealed itself as very
useful in unravelling patterns of structure that are not evident (i.e. cryptic structure; see
section 4.1.3.1.). The fact that all the individuals sampled at DNP were assigned to the
same genetic cluster suggests this population is somewhat isolated and that a barrier
separating it from CLNP is likely to be constraining gene flow between the two
populations. Corubal River is the most probable physical barrier separating these
populations. Following Ferreira da Silva et al. (2014) and as mentioned in section
4.1.3.1., chimpanzees could potentially cross the river in Saltinho village, where the

FCUP A country-level genetic survey of the IUCN critically endangered western chimpanzee (Pan troglodytes
verus) in Guinea-Bissau
122
width is of 130 m, but evidences of this happening do not exist and it is unlikely to be
possible during many periods of the year.
This fine-scale analysis, besides revealing patterns not visible at the broader scale,
highlights the relevance of local-scale analyses of this sort. If, as suspected, the effect
of barriers to dispersal and gene flow are just beginning to pose an effect, cryptic
structure analyses may be a powerful method to detect their presence at an early stage
and to plan management actions accordingly.
4.1.4. Demographic history
The neutrality tests Tajima’s D, Fu and Li’s D*, and Fu and Li’s F* significantly departed
from neutrality and presented positive values, which suggests population subdivision.
The mismatch distribution did not significantly depart from a model of population
growth, but presented a roughly bimodal shape, which can suggest secondary contact
between divergent lineages (Grant and Bowen, 1998; Minhós et al., 2013), possibly
separated by a long period of time (Slatkin and Hudson, 1991; Rogers and Harpending,
1992). A similar pattern of mismatch distribution was found for Temmink’s red colobus
(Procolobus badius temminckii) (Minhós et al., 2013), which suggests this may be
feature of predominantly female-biased dispersing primates and deserves further
investigation.
This is in accordance to the results of the mismatch distribution and of the phylogenetic
analyses conducted by Sá (2013), who concluded the western chimpanzees in Guinea-
Bissau had passed through a history of population growth. Although the neutrality tests
performed in this study do not reveal such pattern, the BOTTLENECK analysis
conducted using microsatellites did not reveal evidences of recent bottlenecks and the
mismatch distribution did not significantly depart from that model. Also, the mismatch
distribution obtained is wide, which is in accordance to the results obtained by
Gagneux et al. (1999), supporting an earlier divergence of the clade that gave rise to
the western chimpanzee (Morin et al., 1994; Becquet et al., 2007; Prado-Martinez et
al., 2013). Recent population expansion had also been found for eastern chimpanzees
(Goldberg and Ruvolo, 1997; Gagneux et al., 1999), but not for Nigeria-Cameroon and
central chimpanzees, which display signs of stable populations over time (Mitchell et
al., 2015).
BNP seems to have gone through a recent population contraction, considering the
significant positive values for the Fu and Li’s tests of neutrality. However, the mismatch

FCUP A country-level genetic survey of the IUCN critically endangered western chimpanzee (Pan troglodytes
verus) in Guinea-Bissau
123
distribution fits the model of population growth, which is not in accordance to the results
suggested by the neutrality tests. In cases when recent genetic bottlenecks have
occurred, mismatch distributions present similarities to those typical of population
expansions (Rogers and Harpending, 1992). At this point, it is not completely clear
what demographic events may have occurred in BNP.
4.1.5. Further research
It would be important to amplify the Y-associated microsatellite marker for the samples
collected in DNP. This was the only population for which no genotypes of the locus
were obtained. Since DNP and BNP are thought to exchange individuals and BNP only
presented one allele, it would be important to understand if that is also the case for
DNP or if this population presents both alleles. This would improve the understanding
of the hypothesis of male gene flow in Guinea-Bissau. Also for the male-specific
analysis, rarefaction of alleles to the smallest sample size (Leberg, 2002) could provide
a basis for a more robust comparison between geographic populations (Pruett and
Winker, 2008). The calculation of individual assignment indices for males and females
could also provide an additional useful means of testing this hypothesis, as differences
are expected between the philopatric and the dispersing sex (Paetkau et al., 1995;
Favre et al., 1997; Goudet, Perrin and Waser, 2002).
Moreover, obtaining mtDNA control region fragments for DNP, for which only two
sequences were available, would allow a better estimation of the genetic diversity
indices, the reconstruction of a population-specific median-joining network, and the
estimation of demographic history parameters. Since the DNP population is particularly
understudied, further examination of these parameters would be especially informative.
Fine-scale analyses of other populations similar to the one performed for CLNP and
DNP, using a large number of microsatellite loci, could unravel new population
structure patterns. This would provide evidences for the presence of potential barriers
that are now starting to prevent dispersal and gene flow, for example.
Analyses of relatedness, particularly among females and males, and within each
geographic population sampled, would provide further access to parameters such as
sex-specific dispersal patterns, social group and community structure, paternity, and
maternity. For instance, Minhós et al. (2013, 2016) analysed relatedness in two
colobus species (Colobus polykomos and Procolobus badius temminckii) sampled in
CFNP, using up to fourteen autosomal microsatellite loci. The authors were able to

FCUP A country-level genetic survey of the IUCN critically endangered western chimpanzee (Pan troglodytes
verus) in Guinea-Bissau
124
successfully study levels of relatedness within dyads and to find evidences for
extensive female dispersal for P. b. temminckii. Studies of relatedness are a common
theme in the literature on wild chimpanzees (e.g. Morin et al., 1993; Vigilant et al.,
2001; Inoue et al., 2008; Langergraber, Mitani and Vigilant, 2009) and comparison of
results would be of interest, particularly considering the evidences for male-mediated
gene flow in Guinea-Bissau found by the present study. Analyses of relatedness were
not conducted due to time limitations.
Bottlenecks could be further investigated using other software besides BOTTLENCK,
such as Msvar (Beaumont, 1999; Storz and Beaumont, 2002; Storz, Beaumont and
Alberts, 2002), which provides a likelihood Bayesian method and makes use of MCMC
simulations to estimate current and ancestral effective population sizes, having been
used in other studies on primates’ demographic history (e.g. Bonhomme et al., 2008;
Minhós et al., 2016). Additionally, BOTTLENECK could be tested under the Two Phase
Model, which allows multiple-step mutations and may provide another level of
accuracy.
Finally, a trend is noticeable for conservation genetics to be at present shifting to
conservation genomics, which has the power to provide more accurate estimations of
several genetic diversity and structure parameters, through the use of techniques such
as next-generation DNA sequencing (Ferreira da Silva and Bruford, 2017). The use of
a limited number of neutral loci, such as done for the present study, introduces bias
into the estimations, which would be more precise using whole-genome data (Allendorf,
Hohenlohe and Luikart, 2010). Low quantity and quality DNA obtained from non-
invasively collected samples of primate species has the potential be used in genome-
level analyses if approaches such as the one developed by Perry et al. (2010) on
chimpanzee samples reveal the power to be routinely used.
4.2. Conservation considerations
Western chimpanzee conservation in Guinea-Bissau has been acknowledged to be of
great urgency (Butynski, 2003; Gippoliti, Embalo and Sousa, 2003; Kormos and
Boesch, 2003; Sousa, Gippoliti and Akhlas, 2005; Sá, 2013). The present study
emphasizes the growing threats that are affecting this subspecies in the country,
particularly habitat fragmentation, which poses barriers to dispersal and limits gene
flow.

FCUP A country-level genetic survey of the IUCN critically endangered western chimpanzee (Pan troglodytes
verus) in Guinea-Bissau
125
The results emphasise that the ecological corridors established by IBAP to connect
BNP to southern areas of the country, which are degraded due to the frequent practice
of slash-and-burn agriculture by the locals in these sites (Casanova and Sousa, 2007;
Ferreira da Silva et al., 2014), should be recovered. Moreover, buffer zones can be
established around the parks, in order to allow connectivity with chimpanzees living
outside the protected areas (Carvalho, 2014).
The lack of information on DNP is a concern, as this area may be even more subjected
to isolation than considered. The assurance of connectivity between DNP, which is
located north of the Corubal River, to southern areas is of major importance, as it is not
evident that chimpanzees can cross the river in Saltinho village given their possible
instinctive fear of water (Nishida, 1980). However, the reduced width of the river in that
segment could be used to build an easy-to-cross path for fauna. This could be made of
wood, for example.
Another concern is the crossing of roads by chimpanzees, which may represent
another threat (Hockings, Anderson and Matsuzawa, 2006) in Guinea-Bissau (e.g. the
run over individual included in this study). The development of this type of
constructions, sometimes motivated by the settlement of large companies in the
country (see Introduction section) must be controlled.
Although chimpanzees are usually not targeted for bushmeat consumption (Sousa et
al., 2014), juveniles are caught to be traded as pets (Ferreira da Silva, 2012; Hockings
and Sousa, 2013) and body parts are used for medicinal purposes (Sá et al., 2012).
These practices must be controlled and the animals seized should be transferred to
sanctuaries or rescue centres (Sousa, Gippoliti and Akhlas, 2005; Casanova and
Sousa, 2007; Sá, 2013).
Finally, it is absolutely essential to make sure the local human communities are
enrolled in the conservation and management practices and policies of the protected
areas. As highlighted by Minhós (2012), the majority of people do not acknowledge the
importance of preserving biodiversity as they do not take benefits from it. However,
local communities can and must be employed in research and tourism activities
(Sousa, Gippoliti and Akhlas, 2005; Minhós, 2012). Not less important is the
organisation of education and awareness-raising programs (Sousa, Gippoliti and
Akhlas, 2005). Lack of coordination between residents, institutions, guards, guides,
non-governmental agencies acting in the field, and law enforcement agencies has also
been reported to hinder the implementation of conservation measures (Ferreira da
Silva, 2012). Besides, the guards do not seem to have access to the adequate

FCUP A country-level genetic survey of the IUCN critically endangered western chimpanzee (Pan troglodytes
verus) in Guinea-Bissau
126
equipment, training, and monetary compensation, which is essential to guarantee
effectiveness of conservation measures and must be assured (Sá, 2013).

FCUP A country-level genetic survey of the IUCN critically endangered western chimpanzee (Pan troglodytes
verus) in Guinea-Bissau
127
5. Concluding Remarks
This research constituted the most complete genetic study on the chimpanzees
inhabiting Guinea-Bissau. In sum, it provided new information regarding 1) levels of
genetic diversity and population structure of the subspecies in the country; 2) patterns
of gene flow and existence of potential barriers to dispersal; 3) recent demographic
history; and 4) gene flow between CLNP and DNP. The main conclusions obtained
were:
i) Gene flow between the BNP population and the coastal areas of Empada and
CLNP seems to be more limited, and the maintenance of the ecological
corridors guaranteeing access to the southern part of Guinea-Bissau is
essential;
ii) Males do not seem to be strictly philopatric in Guinea-Bissau, as found for the
majority of other chimpanzee populations;
iii) Dispersal of chimpanzees in Guinea-Bissau occurs at a larger scale than
expected, which weakens broad scale patterns of structure and renders
analyses at a finer scale particularly relevant;
iv) Signatures of population subdivision were found in Guinea-Bissau;
v) Dispersal between CLNP and DNP seems to follow a pattern of isolation by
distance, although the Corubal River probably constitutes a relevant barrier
to dispersal between the two populations.
The present study highlighted the urgency to reinforce management and conservation
actions to protect the chimpanzees in Guinea-Bissau. This subspecies is severely
threatened in the country and the implementation of measures to prevent it from going
extinct must be immediate.

FCUP A country-level genetic survey of the IUCN critically endangered western chimpanzee (Pan troglodytes
verus) in Guinea-Bissau
128
6. References
Allendorf, F. W. (2017) ‘Genetics and the conservation of natural populations:
allozymes to genomes’, Molecular Ecology, 26(2), pp. 420–430.
Allendorf, F. W., Hohenlohe, P. A. and Luikart, G. (2010) ‘Genomics and the future of
conservation genetics’, Nature Reviews Genetics, 11(10), pp. 697–709.
Alonso, S. and Armour, J. A. L. (2001) ‘A highly variable segment of human
subterminal 16p reveals a history of population growth for modern humans
outside Africa’, PNAS, 98(3), pp. 5368–5369.
Altschul, S. F., Gish, W., Miller, W., Myers, E. W. and Lipman, D. J. (1990) ‘Basic Local
Alignment Search Tool’, Journal of molecular biology, pp. 403–410.
Amador, R. C. (2014) Local perceptions and attitudes towards biodiversity in the
Lagoas de Cufada Natural Park (LCNP), Guinea-Bissau. PhD thesis.
Universidade de Lisboa, Portugal.
Amador, R., Casanova, C. and Lee, P. (2015) ‘Ethnicity and Perceptions of Bushmeat
Hunting Inside Lagoas de Cufada Natural Park (LCNP), Guinea-Bissau’, Journal
of Primatology, 3(2).
Arnason, U., Xu, X. and Gullberg, A. (1996) ‘Comparison between the complete
mitochondrial DNA sequences of Homo and the common chimpanzee based on
nonchimeric sequences’, Journal of Molecular Evolution, 42(2), pp. 145–152.
Avise, J. C., Arnold, J., Ball, R. M., Bermingham, E., Lamb, T., Neigel, J. E., Reeb, C.
A. and Saunders, N. C. (1987) ‘Intraspecific Phylogeography: The Mitochondrial
DNA Bridge Between Population Genetics and Systematics’, Annual Review of
Ecology and Systematics, 18, pp. 489–522.
Bandelt, H. J., Forster, P. and Röhl, A. (1999) ‘Median-joining networks for inferring
intraspecific phylogenies’, Molecular Biology and Evolution, 16(1), pp. 37–48.
Banks, S. C. and Peakall, R. (2012) ‘Genetic spatial autocorrelation can readily detect
sex-biased dispersal’, Molecular Ecology, 21(9), pp. 2092–2105.
Basto, M. P., Santos-Reis, M, Simões, L., Grilo, C., Cardoso, L., Cortes, H., Bruford, M.
W. and Fernandes, C. (2016) ‘Assessing genetic structure in common but
ecologically distinct carnivores: The stone marten and red fox’, PLoS ONE, 11(1),
pp. 1–26.

FCUP A country-level genetic survey of the IUCN critically endangered western chimpanzee (Pan troglodytes
verus) in Guinea-Bissau
129
Beaumont, M. A. (1999) 'Detecting Population Expansion and Decline Using
Microsatellites', Genetics, 153(4), pp. 2013-2029.
Becquet, C., Patterson, N., Stone, A. C., Przeworski, M. and Reich, D. (2007) ‘Genetic
Structure of Chimpanzee Populations’, PLoS Genet, 3(4).
Belkhir, K., Borsa, P., Chikhi, L., Raufaste, N. and Bonhomme, F. (1996) ‘GENETIX
4.05, logiciel sous Windows TM pour la génétique des populations, v4 05’,
Laboratoire génome, populations, interactions, Montpellier, France.
Bergl, R. A. and Vigilant, L. (2007) 'Genetic analysis reveals population structure and
recent migration within the highly fragmented range of the Cross River gorilla
(Gorilla gorilla diehli)', Molecular Ecology, 16(3), pp. 501-516.
Binczik, A., Roig-Boixeda, P., Heymann, E. W. and altert, M. (2017) 'Conservation of
chimpanzees Pan troglodytes verus and other primates depends on forest
patches in a West African savannah landscape', Oryx, pp. 1-8.
Bonhomme, M., Blancher, A., Cuartero, S., Chikhi, L. and Crouau-Roy, B. (2008)
'Origin and number of founders in an introduced insular primate: estimation from
nuclear genetic data', Molecular Ecology, 17(4), pp. 1009-1019.
Bonin, A., Bellemain, E., Eidesen, B., Pompanon, F., Brochmann, C. and Taberlet, P.
(2004) ‘How to track and assess genotyping errors in population genetics
studies’, Molecular Ecology, 13(11), pp. 3261–3273.
Bradley, B. J., Chambers, K. E. and Vigilant, L. (2001) ‘Accurate DNA-based sex
identification of apes using non-invasive samples’, Conservation Genetics, 2, pp.
179–181.
Brooks, T. M., Mittermeier, R. A., Mittermeier, C. G, da Fonseca, G. A. B., Rynalds, A.
B., Konstant, W. R., Flick, P., Pilgrim, J., Oldfield, S., Magin, G. and Hilton-Taylor,
C. (2002) ‘Habitat Loss and Extinction in the Hotspots of Biodiversity’,
Conservation Biology, 16(4), pp. 909–923.
Broquet, T. and Petit, E. (2004) ‘Quantifying genotyping errors in noninvasive
population genetics’, Molecular Ecology, 13(11), pp. 3601–3608.
Bruford, M. W. and Wayne, R. K. (1993) ‘Microsatellites and their application to
population genetic studies’, Current Opinion in Genetics and Development, 3, pp.
939-943.
Brugiere, D., Badjinca, I., Silva, C. and Serra, A. (2009) ‘Distribution of chimpanzees
and interactions with humans in Guinea-Bissau and Western Guinea, West

FCUP A country-level genetic survey of the IUCN critically endangered western chimpanzee (Pan troglodytes
verus) in Guinea-Bissau
130
Africa’, Folia Primatologica, 80(5), pp. 353–358.
Butynski, T. M. (2003) ‘The Robust Chimpanzee Pan troglodytes: Taxonomy,
Distribution, Abundance, and Conservation Status’, in Kormos, R. et al. eds (ed.)
West African Chimpanzees. Gland, Switzerland and Cambridge, U.K.: IUCN/SSC
Primate Specialist Group, p. ix+219 pp.
Carvalho, J. (2014) Conservation status of the endangered chimpanzee (Pan
troglodytes verus) in Lagoas de Cufada Natural Park (Republic of Guinea-
Bissau). PhD thesis. Universidade de Lisboa, Portugal.
Carvalho, J. S., Marques, T. A. and Vicente, L. (2013b) ‘Population Status of Pan
troglodytes verus in Lagoas de Cufada Natural Park, Guinea-Bissau’, PLoS ONE,
8(8), pp. 1-10.
Casanova, C. and Sousa, C. (2007) ‘Plano de acção nacional para a conservação das
populações de chimpazés, cólobus vermelhos ocidentais e cólobus brancos e
pretos ocidentais na República da Guiné-Bissau’. IBAP and Ministério do
Desenvolvimento Rural e Agricultura, Recursos Naturais e Ambiente (ed.).
Cassamá, V. (2006) Alterações do coberto so solo na mata do Cantanhez (Guiné-
Bissau) de 1953 a 2003. MSc thesis. Universidade de Lisboa, Portugal.
CCLME Project (2016) Canary Current Large Marine Ecosystem (CCLME)
Transboundary Diagnostic Analysis (TDA). 140 pp. Dakar, Senegal.
Ceballos, G., Ehrlich, P. R. and Dirzo, R. (2017) 'Biological annihilation via the ongoing
sixth mass extinction signaled by vertebrate population losses and declines',
Proceedings of the National Academy of Sciences, 114(30), E6089-E6096.
Chapman, C. a and Russo, S. E. (2002) ‘Primate Seed Dispersal: Linking Behavioral
Ecology with Forest Community Structure’, Primates in Perspective, pp. 523–534.
CHIMBO (2017) Threats in Boé. Available at: http://chimbo.org/?page_id=62&lang=en
(Accessed: 21 August 2017).
CITES (2017a) Appendices I, II and III. Available at:
https://cites.org/eng/app/appendices.php (Accessed: 28 July 2017).
CITES (2017b) List of Contracting Parties. Available at:
https://cites.org/eng/disc/parties/chronolo.php (Accessed: 28 July 2017).
Constable, J. L., Ashley, M. V., Goodall, J. and Pusey, A. E. (2001) ‘Noninvasive
paternity assignment in Gombe chimpanzees’, Molecular Ecology, 10(5), pp.
FCUP A country-level genetic survey of the IUCN critically endangered western chimpanzee (Pan troglodytes
verus) in Guinea-Bissau
131
1279–1300.
Coote, T. and Bruford, M. W. (1996) ‘Human Microsatellites Applicable for Analysis of
Genetic Variation in Apes and Old World Monkeys’, The Journal of Heredity,
87(5), pp. 406–410.
Corander, J., Marttinen, P., Sirén, J. and Tang, J. (2008) ‘Enhanced Bayesian
modelling in BAPS software for learning genetic structures of populations’, BMC
Bioinformatics, 9(1), p. 539.
Corander, J. and Marttinen, P. (2006) ‘Bayesian identification of admixture events
using multilocus molecular markers’, Molecular Ecology, 15(10), pp. 2833–2843.
Cornuet, J. M. and Luikart, G. (1996) ‘Description and power analysis of two tests for
detecting recent population bottlenecks from allele frequency data’, Genetics,
144(4), pp. 2001–2014.
Costa, V., Rosenbom, S., Monteiro, R. and Beja-Pereira, A. ‘Overcoming poor quality
DNA extracted from fecal samples - a simple guide to improve DNA yield’, Under
review.
Costa, S., Casanova, C. Sousa, C. and Lee, P. (2013) 'The Good, The Bad and The
Ugly: Perceptions of Wildlife In Tombali (Guinea-Bissau, West Africa)', Journal of
Primatology, 2(1).
Crow, J. F. and Dove, W. D. (1988) ‘Anecdotal , Historical and Critical Commentaries
on Genetics’, Genetics, pp. 473-476.
Dewoody, J., Nason, J. D. and Hipkins, V. D. (2006) ‘Mitigating scoring errors in
microsatellite data from wild populations’, Molecular Ecology Notes, pp. 951–957.
Draulans, D. and Van Krunkelsven, E. (2002) ‘The impact of war on forest areas in the
Democratic Republic of Congo’, Oryx, 36(1), pp. 18–34.
Dray, S. and Dufour, A. B. (2007) ‘The ade4 Package: Implementing the Duality
Diagram for Ecologists’, Journal of Statistical Software, 22(4), pp. 1–20.
Dudley, J. P. et al. (2002) ‘Effects of War and Civil Strife on Wildlife and Wildlife
Habitats’, Conservation Biology, 16(2), pp. 319–329.
Dunn, O. J. (1958) ‘Estimation of the Medians for Dependent Variables’, The Annals of
Mathematical Statistics, 30, pp. 192–197.
Dunn, O. J. (1961) ‘Multiple Comparisons Among Means’, Journal of the American
Statistical Association, 56(293), pp. 52–64.

FCUP A country-level genetic survey of the IUCN critically endangered western chimpanzee (Pan troglodytes
verus) in Guinea-Bissau
132
Duran, C., Appleby, N., Edwards, D. and Batley, J. (2009) ‘Molecular Genetic Markers:
Discovery, Applications, Data Storage and Visualisation’, Current Bioinformatics,
4(0), pp. 16–27.
Earl, D. A. and vonHoldt, B. M. (2012) ‘STRUCTURE HARVESTER: A website and
program for visualizing STRUCTURE output and implementing the Evanno
method’, Conservation Genetics Resources, 4(2), pp. 359–361.
Eckert, C. G., Samis, K. E. and Lougheed, S. C. (2008) 'Genetic variation across
species' geographical ranges: the central-marginal hypothesis and beyond',
Molecular Ecology, 17(5), pp. 1170-1188.
Estrada, A. et al. (2017) ‘Impending extinction crisis of the world ’ s primates : Why
primates matter’, Science Advances, 3: e1600946.
Evanno, G., Regnaut, S. and Goudet, J. (2005) ‘Detecting the number of clusters of
individuals using the software STRUCTURE: A simulation study’, Molecular
Ecology, 14(8), pp. 2611–2620.
Excoffier, L. and Lischer, H. E. L. (2010) ‘Arlequin suite ver 3.5: A new series of
programs to perform population genetics analyses under Linux and Windows’,
Molecular Ecology Resources, 10(3), pp. 564–567.
Falush, D., Stephens, M. and Pritchard, J. K. (2003) ‘Inference of population structure
using multilocus genotype data: Linked loci and correlated allele frequencies’,
Genetics, 164(4), pp. 1567–1587.
Favre, L., Balloux, F., Goudet, J. and Perrin, N. (1997) 'Female-biased dispersal in the
monogamous mammal Crocidura russula: evidence from field data and
microsatellite patterns', Proceeding of the Royal Society of London B: Biological
Sciences, 264(1378), pp. 127-132.
Ferreira da Silva, M. J. (2012) Hunting pressure and the population genetic patterns
and sex-mediated dispersal in the Guinea Baboon in Guine-Bissau. PhD Thesis.
Cardiff University, United Kingdom.
Ferreira da Silva, M. J., Minhós, T., Sá, R. M. and Bruford, M. W. (2012) ‘Using
Genetics as a Tool in Primate Conservation Using Genetics as a Tool in Primate
Conservation’, Nature Education Knowledge, 3(10):89.
Ferreira da Silva, M. J., Godinho, R., Casanova, C., Minhós, T., Sá, R. M. and Bruford,
M. W. (2014) ‘Assessing the impact of hunting pressure on population structure
of Guinea baboons (Papio papio) in Guinea-Bissau’, Conservation Genetics,

FCUP A country-level genetic survey of the IUCN critically endangered western chimpanzee (Pan troglodytes
verus) in Guinea-Bissau
133
15(6), pp. 1339–1355.
Ferreira da Silva, M. J. (2015) Protecting the Western Chimpanzee and threatened
primates from logging and illegal hunting in Guinea-Bissau: Six months progress
report. 25 pp. The Born Free Foundation.
Ferreira da Silva, M. J. (2016a) Protecting the Western Chimpanzee and threatened
primates from logging and illegal hunting in Guinea-Bissau: One Year progress
report. 31 pp. The Born Free Foundation.
Ferreira da Silva, M. J. (2016b) Protegendo o Chimpanzé Ocidental e primatas
ameaçados da Guiné-Bissau da desflorestação e caça ilegal - Relatório de
Missão da expedição ao Parque Nacional de Dulombi-Boé.11 pp. IBAP.
Ferreira da Silva, M. J. (2016c) Protegendo o Chimpanzé Ocidental e primatas
ameaçados da Guiné-Bissau da desflorestação e caça ilegal - Relatório de
Missão da expedição ao Parque Natural das Lagoas da Cufada. 7 pp. IBAP.
Ferreira da Silva, M. J. (2017) Protecting the Western Chimpanzee and threatened
primates from logging and illegal hunting in Guinea-Bissau: Eighteen months
progress report. The Born Free Foundation.
Ferreira da Silva, M. J. and Bruford, M. W. (2017) ‘Genetics and Primate
Conservation’, The International Encyclopedia of Primatology, pp. 1–6.
Fogelqvist, J. et al. (2010) ‘Cryptic population genetic structure: The number of inferred
clusters depends on sample size’, Molecular Ecology Resources, 10(2), pp. 314–
323.
Frankham, R. (1995) ‘Conservation genetics’, Annual review of genetics, 29(1), pp.
305-327.
Frankham, R. (1996) 'Relationship of Genetic Variation to Population Size in Wildlife',
Conservation Biology, 10(6), pp. 1500-1508.
Frankham, R. Briscoe, D. A. and Ballou, J. D. (2002) Introduction to conservation
genetics. Cambridge university press.
Fu, Y. X. (1997) ‘Statistical tests of neutrality of mutations against population growth,
hitchhiking and background selection’, Genetics, 147(2), pp. 915–925.
Fu, Y. X. and Li, W. H. (1993) ‘Statistical tests of neutrality of mutations’, Genetics,
133(3), pp. 693–709.
Gagneux, P., Wills, C., Gerloff, U., Tautz, D., Morin, P. A., Boesch, C., Fruth, B.,

FCUP A country-level genetic survey of the IUCN critically endangered western chimpanzee (Pan troglodytes
verus) in Guinea-Bissau
134
Hohmann, G., Ryder, O. A. and Woodruff, D. S. (1999) ‘Mitochondrial sequences
show diverse evolutionary histories of African hominoids.’, Proceedings of the
National Academy of Sciences of the United States of America, 96(9), pp. 5077–
5082.
Gaubert, P., Njiokou, F., Olayemi, A., Pagani, P., Dufour, S., Danquah, E., Nutsuakor,
M. K., Ngua, G., Missoup, A., Tedesco, P. A., Dernat, R. and Antunes, A. (2015)
‘Bushmeat genetics: Setting up a reference framework for the DNA typing of
African forest bushmeat’, Molecular Ecology Resources, 15(3), pp. 633–651.
Gippoliti, S. and Dell’Omo, G. (1996) ‘Primates of the Cantanhez Forest and the
Cacine Basin’, Oryx, 30(1), pp. 74–80.
Gippoliti, S., Embalo, D. and Sousa, C. (2003) ‘Guinea-Bissau’, in Kormos, R. et al. eds
(ed.) West African Chimpanzees. Gland, Switzerland and Cambridge, U.K.:
IUCN/SSC Primate Specialist Group, p. ix +219 pp.
Goldberg, T. L. (1998) ‘Biogeographic predictors of genetic diversity in populations of
eastern African chimpanzees (Pan troglodytes schweinfurthi)’, International
journal of primatology, 19(2), pp. 237–254.
Goldberg, T. L. and Ruvolo, M. (1997) ‘The Geographic Apportionment of Mitochondrial
Genetic Diversity in East African Chimpanzees, Pan troglodytes schweinfurthii’,
Molecular biology and evolution, 14(9), pp. 976–984.
Gonder, M. K., Oates, J. F., Disotell, T. R., Forstner, T. R., Morales, J. C. and Melnick,
D. J. (1997) ‘A new west African chimpanzee subspecies?’, Nature, 388(6640), p.
337.
Goossens, B., Latour, S., Vidal, C., Jamart, A., Ancrenaz, M. and Bruford, M. W. (2000)
‘Twenty New Microsatellite Loci for Use with Hair and Faecal Samples in the
Chimpanzee (Pan troglodytes troglodytes)’, Folia Primatologica, 71, pp. 177–180.
Goossens, B., Setchell, J. M., Vidal, C., Dilambaka, E. and Jamart, A. (2003)
‘Successful reproduction in wild-released orphan chimpanzees (Pan troglodytes
troglodytes).’, Primates, 44(1), pp. 67–69.
Goudet, J., Perrin, N. and Waser, P. (2002) 'Tests for sex-biased dispersal using bi-
parentally inherited genetic markers', Molecular Ecology, 11(6), pp. 1103-1114.
Groves, C. P. (2001) Primate taxonomy. Smithsonian Institution Press: Washington,
D.C.
Gusmão, L., González-Neira, A., Alves, C., Lareu, M., Costa, S., Amorim, A. and

FCUP A country-level genetic survey of the IUCN critically endangered western chimpanzee (Pan troglodytes
verus) in Guinea-Bissau
135
Carracedo, A. (2002) ‘Chimpanzee homologous of human Y specific STRs: A
comparative study and a proposal for nomenclature’, Forensic Science
International, 126(2), pp. 129–136.
Hajibabaei, M., Singer, G. A. C., Hebert, P. D. N. and Hickey, D. A. (2007) ‘DNA
barcoding: how it complements taxonomy, molecular phylogenetics and
population genetics’, Trends in Genetics, 23(4), pp. 167–172.
Hanson, T., Brooks, T. M., da Fonseca, G. A. B., Hoffmann, M., Lamoreux, J. F.,
Machlis, G., Mittermeier, R. A. and Pilgrim, J. D. (2009) ‘Warfare in biodiversity
hotspots’, Conservation Biology, 23(3), pp. 578–587.
Harpending, H. C., Sherry, S. T., Rogers, A. R. and Stoneking, M. (1993) ‘The Genetic
Structure of Ancient Human Populations’, Current Anthropology, 34(4), pp. 483–
496.
Harpending, H. C. (1994) ‘Signature of Ancient Population Growth in a Low-Resolution
Mitochondrial DNA Mismatch Distribution’, Human Biology, 66(4), pp. 591–600.
Harrison, R. G. (1989) ‘Animal mitochondrial DNA as a genetic marker in population
and evolutionary biology’, Trends in Ecology and Evolution, 4(1), pp. 6–11.
Hobbs, G. I., Chadwick, E. A., Bruford, M. W. and Slater, F. M. (2011) ‘Bayesian
clustering techniques and progressive partitioning to identify population
structuring within a recovering otter population in the UK’, Journal of Applied
Ecology, 48(5), pp. 1206–1217.
Hockings, K. J., Anderson, J. R. and Matsuzawa, T. (2006) ‘Road crossing in
chimpanzees: A risky business’, Current Biology, 16(17), pp. 668–670.
Hockings, K. J. and Sousa, C. (2013) ‘Human-Chimpanzee Sympatry and Interactions
in Cantanhez National Park, Guinea-Bissau: Current Research and Future
Directions’, Primate Conservation, 26(1), pp. 57–65.
van der Hoeven, J. (2011) Bauxite Mining in the Boé: a Case Study on Local
Knowledge of and Opinions on Bauxite Mining in Misside Boussoura and Guileje,
Guinea-Bissau. Research Report.
Holleley, C. E. and Geerts, P. G. (2009) ‘Multiplex Manager 1.0: A cross-platform
computer program that plans and optimizes multiplex PCR’, BioTechniques,
46(7), pp. 511–517.
Humle, T. (2003) ‘Behavior and Ecology of Chimpanzees in West Africa’, in Kormos, R.
et al. eds (ed.) West African Chimpanzees. Gland, Switzerland and Cambridge,
FCUP A country-level genetic survey of the IUCN critically endangered western chimpanzee (Pan troglodytes
verus) in Guinea-Bissau
136
U.K.: IUCN/SSC Primate Specialist Group, p. ix +219 pp.
Humle, T., Maisels, F., Oates, J. F., Plumptre, A. and Williamson, E. A. (2016) ‘Pan
troglodytes. The IUCN Red List of Threatened Species 2016',
e.T15933A17964454.
Humle, T., Boesch, C., Campbell, G., Junker, J, Koops, K., Kuehl, H. and Sop, T.
(2016) ‘Pan troglodytes ssp. verus. The IUCN Red List of Threatened Species
2016', e.T15935A102327574.
IBAP (2017) Áreas Protegidas. Available at:
https://www.ibapgbissau.org/index.php/areas-protegidas (Accessed: 29 July
2017).
Imprensa Nacional (2011) 2.o Suplemento ao Boletim Oficial da República da Guiné-
Bissau N.o 9. Available at: http://faolex.fao.org/docs/pdf/gbs118164.pdf
(Accessed: 28 July 2017).
Inoue, E., Inoue-Murayama, M., Vigilant, L., Takenaka, O. and Nishida, T. (2008)
‘Relatedness in wild chimpanzees: Influence of paternity, male philopatry, and
demographic factors’, American Journal of Physical Anthropology, 137(3), pp.
256–262.
Johnson, P. and Haydon, D. (2007a) ‘Maximum-likelihood estimation of allelic dropout
and false allele error rates from microsatellite genotypes in the absence of
reference data’, Genetics, 175(2), pp. 827–842.
Johnson, P. and Haydon, D. (2007b) ‘Software for quantifying and simulating
microsatellite genotyping error’, Bioinformatics and Biology iIsights, 1, pp. 71–75.
Jombart, T. (2008) ‘adegenet: a R package for the multivariate analysis of genetic
markers’, Bioinformatics, 24(11), pp. 1403–5.
Jombart, T., Devillard, S., Duford, A. and Pontier, D. (2008) ‘Revealing cryptic spatial
patterns in genetic variability by a new multivariate method.’, Heredity, 101, pp.
92–103.
Kamvar, Z. N., Tabima, J. F. and Grünwald, N. J. (2014) ‘Poppr : an R package for
genetic analysis of populations with clonal, partially clonal, and/or sexual
reproduction’, PeerJ, 2, p. e281.
Kawai, N. and Matsuzawa, T. (2000) ‘Numerical memory span in a chimpanzee’,
Nature, 403, pp. 39–40.

FCUP A country-level genetic survey of the IUCN critically endangered western chimpanzee (Pan troglodytes
verus) in Guinea-Bissau
137
Kearse, M., Moir, R., Wilson, A., Stones-Havas, S., Cheung, M., Sturrock, S., Buxton,
S., Cooper, A., Markowitz, S., Duran, C., Thierer, T., Ashton, B., Meintjes, P. and
Drummond, A. (2012) ‘Geneious Basic: An integrated and extendable desktop
software platform for the organization and analysis of sequence data’,
Bioinformatics, 28(12), pp. 1647–1649.
Kimura, M. and Crow, J. F. (1964) ‘The Number of Alleles That Can Be Maintained in a
Finite Population’, Genetics, 49, pp. 725–738.
Kimura, M. and Ohta, T. (1978) ‘Stepwise mutation model and distribution of allelic
frequencies in a finite population’, Procedings of the National Academy of
Sciences, 75(6), pp. 2868–2872.
Koops, K., Humle, T., Sterck, E. H. M. and Matsuzawa, T. (2007) ‘Ground-nesting by
the chimpanzees of the Nimba Mountains, Guinea: Environmentally or socially
determined?’, American Journal of Primatology, 69(4), pp. 407–419.
Kormos, R. and Boesch, C. (2003) Regional Action Plan for the Conservation of
Chimpanzees in West Africa. Washington DC: IUCN/SSC Primate Specialist
Group and Conservation International.
Kühl, H. S., Sop, T., Williamson, E. A., Mundry, R., Brugière, D., Campbell, G., Cohen,
H., Danquah, E., Ginn, L., Herbinger, I., Jones, S., Junker, J., Kormos, R.,
Kouakou, C. Y., N'Goran, P. K., Normand, E., Shutt-Phillips, K., Tickle, A.,
Vendras, E., Welsh, A., Wessling, E. G. and Boesch, C. (2017) ‘The Critically
Endangered western chimpanzee declines by 80%’, American Journal of
Primatology, 79(9).
Lande, R. (1995) ‘Mutation and conservation’, Conservation Biology, 9(4), pp. 782–
791.
Langergraber, K. E., Siedel, H., Mitani, J. C., Wrangham, R. W., Reynolds, V., Hunt, K.
and Vigilant, L. (2007) ‘The genetic signature of sex-biased migration in patrilocal
chimpanzees and humans’, PLoS ONE, 2(10), pp. 1–7.
Langergraber, K. E., Prüfer, K., Rowney, C., Boesch, C., Crockford, C., Fawcett, K.,
Inoue, E., Inoue-Muruyama, M., Mitani, J. C., Muller, M. N., Robbins, M. M.,
Schubert, G., Stoinski, T. S., Viola, B., Watts, D., Wittig, R. M., Wrangham, R. W.,
Zuberbühler, K., Pääbo, S. and Vigilant, L. (2012) ‘Generation times in wild
chimpanzees and gorillas suggest earlier divergence times in great ape and
human evolution’, Proceedings of the National Academy of Sciences, 109(39),

FCUP A country-level genetic survey of the IUCN critically endangered western chimpanzee (Pan troglodytes
verus) in Guinea-Bissau
138
pp. 15716–15721.
Langergraber, K. E., Rowney, C., Crockford, C., Wittig, R., Zuberbühler, K. and
Vigilant, L. (2014) ‘Genetic analyses suggest no immigration of adult females and
their offspring into the Sonso community of chimpanzees in the Budongo Forest
Reserve, Uganda’, American Journal of Primatology, 76(7), pp. 640–648.
Langergraber, K., Mitani, J. and Vigilant, L. (2009) ‘Kinship and social bonds in female
chimpanzees (Pan troglodytes)’, American Journal of Primatology, 71(10), pp.
840–851.
Latch, E. K., Boarman, W. I., Walde, A. and Fleischer, R. C. (2011) ‘Fine-scale analysis
reveals cryptic landscape genetic structure in desert tortoises’, PLoS ONE, 6(11),
e27794.
Leberg, P. L. (2002) ‘Estimating allelic richness: Effects of sample size and
bottlenecks’, Molecular Ecology, 11(11), pp. 2445–2449.
Librado, P. and Rozas, J. (2009) ‘DnaSP v5: A software for comprehensive analysis of
DNA polymorphism data’, Bioinformatics, 25(11), pp. 1451–1452.
Lilly, A. A., Mehlman, P. T. and Doran, D. (2002) ‘Intestinal parasites in gorillas,
chimpanzees, and humans at Mondika research site, Dzanga-Ndoki National
Park, Central African Republic’, International Journal of Primatology, 23(3), pp.
555–573.
Lorenz, J. G., Jackson, W. E., Beck, J. C. and Hanner, R. (2005) ‘The problems and
promise of DNA barcodes for species diagnosis of primate biomaterials’,
Philosophical Transactions of the Royal Society B: Biological Sciences,
360(1462), pp. 1869–1877.
Lott, M. T., Leipzig, J. N., Derbeneva, O., Xie, H. M., Chalkia, D., Sarmady, M.,
Procaccio, V. and Wallace, D. C. (2013) ‘MtDNA variation and analysis using
Mitomap and Mitomaster’, Current Protocols in Bioinformatics, pp. 1–23.
Luikart, G., Allendorf, F. W., Cornuet, J. and Sherwin, W. (1998) ‘Distortion of allele
frequency distributions provides a test for recent population bottlenecks’, Journal
of Heredity, 89(3), pp. 238–247.
Luikart, G., Sherwin, W. B., Steele, B. M. and Allendorf, F. W. (1998) ‘Usefulness of
molecular markers for detecting population bottlenecks via monitoring genetic
change’, Molecular Ecology, 7(8), pp. 963–974.
Mantel, N. (1967) ‘The Detection of Disease Clustering and a Generalized Regression

FCUP A country-level genetic survey of the IUCN critically endangered western chimpanzee (Pan troglodytes
verus) in Guinea-Bissau
139
Approach’, Cancer Research, 27(2), pp. 209–220.
McGrew, W. C. (1998) ‘Culture in Nonhuman Primates?’, Annual Review of
Anthropology, 27(1), pp. 301–328.
Minhós, T. (2012) Socio-genetics and population structure of two African colobus
monkeys in Cantanhez National Park, Guinea Bissau. PhD thesis. Cardiff
University, United Kingdom.
Minhós, T., Nixon, E., Sousa, C., Vicente, L. M., Ferreira da Silva, M. J., Sá, R. M. and
Bruford, M. W. (2013) ‘Genetic evidence for spatio-temporal changes in the
dispersal patterns of two sympatric African colobine monkeys’, American Journal
of Physical Anthropology, 150(3), pp. 464–474.
Minhós, T., Chikhi, L., Sousa, C., Vicente, L. M., Ferreira da Silva, M. J., Heller, R.,
Casanova and Bruford, M. W. (2016) ‘Genetic consequences of human forest
exploitation in two colobus monkeys in Guinea Bissau’, Biological Conservation,
194, pp. 194–208.
Minhós, T., Wallace, E., Ferreira da Silva, M. J., Sá, R. M., Carmo, M., Barata, A. and
Bruford, M. W. (2013) ‘Molecular Identification of Primate Bushmeat Sold in
Guinea-Bissau’, Folia Primatologica, 82(6), pp. 321–402.
Miquel, C., Bellemain, E., Poillot, C., Bessière, J., Durand, A. and Taberlet, P. (2006)
‘Quality indexes to assess the reliability of genotypes in studies using
noninvasive sampling and multiple-tube approach’, Molecular Ecology Notes,
6(4), pp. 985–988.
Mitchell, M. W., Locatelli, S. Ghobrial, L., Pokempner, A. A., Clee, P. R. S., Abwe, E.
E., Nicholas, A., Nkembi, L., Anthony, N. M., Morgan, B. J., Fotso, R., Peeters,
M., Hahn, B. H. and Gonder, M. K. (2015) ‘The population genetics of wild
chimpanzees in Cameroon and Nigeria suggests a positive role for selection in
the evolution of chimpanzee subspecies’, BMC Evolutionary Biology, 15(1), p. 3.
Mittermeier, R. A., Rylands, A. B. and Wilson, D. E. (2013) Handbook of the Mammals
of the World: Volume 3 Primates. Barcelona: Lynx Edicions.
Moore, D. L., Langergraber, K. E. and Vigilant, L. (2015) ‘Genetic Analyses Suggest
Male Philopatry and Territoriality in Savanna-Woodland Chimpanzees (Pan
troglodytes schweinfurthii) of Ugalla, Tanzania’, International Journal of
Primatology, 36(2), pp. 377–397.
Moore, D. L. and Vigilant, L. (2013) ‘Genetic diversity at the edge: Comparative

FCUP A country-level genetic survey of the IUCN critically endangered western chimpanzee (Pan troglodytes
verus) in Guinea-Bissau
140
assessment of Y-chromosome and autosomal diversity in eastern chimpanzees
(Pan troglodytes schweinfurthii) of Ugalla, Tanzania’, Conservation Genetics,
15(3), pp. 495–507.
Morin, P. A., Wallis, J., Moore, J. J., Chakraborty, R. and Woodruff, D. S. (1993) ‘Non-
invasive Sampling and DNA Amplification for Paternity Exclusion, Community
Structure, and Phylogeography in Wild Chimpanzees’, Primates, 34(3), pp. 347–
356.
Morin, P. A., Moore, J. J., Chakraborty, R., Jin, L., Goodall, J. and Woodruff, D. S.
(1994) ‘Kin Selection , Social Structure , Gene Flow , and the Evolution of
Chimpanzees’, Science, 265(5176), pp. 1193–1201.
Morin, P. A. and Goldberg, T. L. (2004) ‘Determination of Genealogical Relationships
from Genetic Data : A Review of Methods and Applications’, in Chapais, B. and
Bermen, C. (eds) Kinship and Behavior in Primates. Oxford: University Press, pp.
46–68.
Moritz, C. and Dowling, T. (1987) ‘Evolution of animal mitochondrial DNA: relevance for
population biology and systematics’, Annual Review of Ecology and Systematics,
18(1), pp. 269–292.
Myers, N., Mittermeier, C. G., da Fonseca, G. A. B. and Kent, J. (2000) ‘Biodiversity
hotspots for conservation priorities’, Nature, 403(6772), pp. 853–858.
Nei, M. (1987) Molecular Evolutionary Genetics. Columbia University Press.
Nishida, T. (1980) ‘Local Differences in Responses to Water among Wild
Chimpanzees’, Folia Primatologica, 33, pp. 189–209.
Oates, J. F., Abedi-Lartey, M., McGraw, W. S., Struhsaker, T. T. and Whitesides, G. H.
(2000) ‘Extinction of a West African red colobus monkey’, Conservation Biology,
14(5), pp. 1526–1532.
Oates, J. F., Groves, C. P. and Jenkins, P. D. (2009) ‘The type locality of Pan
troglodytes vellerosus (Gray, 1862), and implications for the nomenclature of
West African chimpanzees’, Primates, 50(1), pp. 78–80.
OECD (2015) States of Fragility 2015: Meeting Post-2015 Ambitions. OECD
Publishing, Paris.
Olayemi, A., Oyeyiola, A., Antunes, A., Bonillo, C., Cruaud, C. and Gaubert, P. (2011)
‘Contribution of DNA-typing to bushmeat surveys: Assessment of a roadside
market in south-western Nigeria’, Wildlife Research, 38(8), pp. 696–716.

FCUP A country-level genetic survey of the IUCN critically endangered western chimpanzee (Pan troglodytes
verus) in Guinea-Bissau
141
Van Oosterhout, C., Hutchinson, W. F., Wills, D. P. M. and Shipley, P. (2004) ‘MICRO-
CHECKER: Software for identifying and correcting genotyping errors in
microsatellite data’, Molecular Ecology Notes, 4(3), pp. 535–538.
Paetkau, D., Calvert, W., Stirling, I., Strobeck, C. (1995) 'Microsatellite analysis of
population structure in Canadian polar bears', Molecular Ecology, 4(3), pp. 347-
354.
Paetkau, D., Slade, R., Burden, M. and Estoup, A. (2004) ‘Genetic assignment
methods for the direct, real-time estimation of migration rate: A simulation-based
exploration of accuracy and power’, Molecular Ecology, 13(1), pp. 55–65.
Park, S. (2001) ‘The Excel Microsatellite Toolkit (version 3.1)’. Dublin, Ireland: Animal
Genomics Laboratory, University College.
Peakall, R. and Smouse, P. E. (2006) ‘GENALEX 6: Genetic analysis in Excel.
Population genetic software for teaching and research’, Molecular Ecology Notes,
6(1), pp. 288–295.
Peakall, R. and Smouse, P. E. (2012) ‘GenALEx 6.5: Genetic analysis in Excel.
Population genetic software for teaching and research-an update’, Bioinformatics,
28(19), pp. 2537–2539.
Perry, G. H., Marioni, J. C., Melsted, P. and Gilad, Y. (2010) ‘Genomic-scale capture
and sequencing of endogenous DNA from feces’, Molecular Ecology, 19(24), pp.
5332–5344.
Piry, S., Alapetite, A., Cornuet, J. M., Paetkau, D., Baudouin, L. and Estoup, A. (2004)
‘GENECLASS2: A software for genetic assignment and first-generation migrant
detection’, Journal of Heredity, 95(6), pp. 536–539.
Polzin, T. and Daneshmand, S. V. (2003) ‘On Steiner trees and minimum spanning
trees in hypergraphs’, Operations Research Letters, 32, pp. 12–20.
Pompanon, F., Bonin, A., Bellemain, E. and Taberlet, P. (2005) ‘Genotyping errors:
causes, consequences and solutions.’, Nature reviews, 6(11), pp. 847–859.
Prado-Martinez, J. et al. (2013) ‘Great ape genetic diversity and population history’,
Nature, 499(7459), pp. 471–475.
Primmer, C. R. (2009) ‘From Conservation Genetics to Conservation Genomics’,
Annals of the New York Academy of Sciences, 1162, pp. 357–368.
Pritchard, J. K., Stephens, M. and Donnelly, P. (2000) ‘Inference of population structure

FCUP A country-level genetic survey of the IUCN critically endangered western chimpanzee (Pan troglodytes
verus) in Guinea-Bissau
142
using multilocus genotype data’, Genetics, 155(2), pp. 945–959.
Pruett, C. L. and Winker, K. (2008) ‘The effects of sample size on population genetic
diversity estimates in song sparrows Melospiza melodia’, Journal of Avian
Biology, 39(2), pp. 252–256.
Prüfer, K. et al. (2012) ‘The bonobo genome compared with the chimpanzee and
human genomes’, Nature, 486, pp. 1–5.
QGIS Development Team (2015) ‘QGIS Geographic Information System’, Open
Source Geospatial Foundation Project.
Quéméré, E., Louis Jr., E. E., Ribéron, A., Chikhi, L. and Crouau-Roy, B. (2010) ‘Non-
invasive conservation genetics of the critically endangered golden-crowned sifaka
(Propithecus tattersalli): High diversity and significant genetic differentiation over
a small range’, Conservation Genetics, 11(3), pp. 675–687.
R Development Core Team (2016) R: A Language and Environment for Statistical
Computing. Vienna:Austria: R Foundation for Statistical Computing.
Ramírez-Soriano, A., Ramos-Onsins, S. E., Rozas, J., Calafell, F. and Navarro, A.
(2008) ‘Statistical power analysis of neutrality tests under demographic
expansions, contractions and bottlenecks with recombination’, Genetics, 179(1),
pp. 555–567.
Ramos-Onsins, S. E. and Rozas, J. (2002) ‘Statistical Properties of New Neutrality
Tests Against Population Growth’, Molecular Biology and Evolution, 19(12), pp.
2092–2100.
Ramsar (2017) Guinea-Bissau. Available at:
https://www.ibapgbissau.org/index.php/areas-protegidas (Accessed: 29 July
2017).
Rannala, B. and Mountain, J. L. (1997) ‘Detecting immigration by using multilocus
genotypes.’, Proceedings of the National Academy of Sciences of the United
States of America, 94(17), pp. 9197–9201.
Raymond, M. and Rousset, F. (1995) ‘GENEPOP (version 1.2): population genetics
software for exact tests and ecumenicism’, Journal of Heredity, 86, pp. 248–249.
Roeder, A. D., Archer, F. I., Poinar, H. N. and Morin, P. A. (2004) ‘A novel method for
collection and preservation of faeces for genetic studies’, Molecular Ecology
Notes, 4(4), pp. 761–764.

FCUP A country-level genetic survey of the IUCN critically endangered western chimpanzee (Pan troglodytes
verus) in Guinea-Bissau
143
Roeder, A. D., Jeffery, K. and Bruford, M. W. (2006) ‘A universal microsatellite
multiplex kit for genetic analysis of great apes’, Folia Primatologica, 77(3), pp.
240–245.
Rogers, A. R. and Harpending, H. (1992) ‘Population growth makes waves in the
distribution of pairwise genetic differences’, Molecular Biology and Evolution,
9(3), pp. 552–569.
Rousset, F. (2008) ‘GENEPOP’007: A complete re-implementation of the GENEPOP
software for Windows and Linux’, Molecular Ecology Resources, 8(1), pp. 103–
106.
RStudio Team (2016) RStudio: Integrated Development for R. Boston, MA.
Sá, R. M., Petrásová, J., Pomajbíková, K., Profousová, I., Petrzelková, K. J., Sousa,
C., Cable, J., Bruford, M. W. and Modrý, D. (2013) ‘Gastrointestinal symbionts of
chimpanzees in Cantanhez National Park, Guinea-Bissau with respect to habitat
fragmentation’, American Journal of Primatology, 75(10), pp. 1032–1041.
Sá, R. M., Ferreira da Silva, M. J., Sousa, F. M. and Minhós, T. (2012) ‘The Trade and
Ethnobiological Use of Chimpanzee Body Parts in Guinea-Bissau: Implications
for Conservation’, TRAFFIC Bulletin, 24(1), pp. 31–34.
Sá, R. M. (2013) Phylogeography, conservation genetics and parasitology of
chimpanzees (Pan troglodytes verus) in Guinea-Bissau, West Africa. PhD thesis.
Cardiff University, United Kingdom.
Salgado, A., Fedi, F. and Leitão, F. (2009) Relatório preliminar do processo de
construção do Porto de Buba e seus impactos. Instituto da Biodiversidade e
das Áreas Protegidas (IBAP): Buba, Guinea-Bissau.
Sayers, K. and Lovejoy, C. O. (2008) ‘The Chimpanzee Has No Clothes’, Current
Anthropology, 49(1), pp. 87–114.
Schlötterer, C. (2000) ‘Evolutionary dynamics of microsatellite DNA’, Chromosoma,
109(6), pp. 365–371.
Schubert, G., Stoneking, C. J., Arandjelovic, M., Boesch, C., Eckhardt, N., Hohmann,
G., Langergraber, K., Lukas, D. and Vigilant, L. (2011) ‘Male-Mediated gene flow
in patrilocal primates’, PLoS ONE, 6(7).
Schuelke, M. (2000) ‘An economic method for the fluorescent labeling of PCR
fragments’, Nature Biotechnology, 18(2), pp. 233–234.

FCUP A country-level genetic survey of the IUCN critically endangered western chimpanzee (Pan troglodytes
verus) in Guinea-Bissau
144
Schwartz, M. K., Luikart, G. and Waples, R. S. (2006) ‘Genetic monitoring as a
promising tool for conservation and management’, Trends in ecology and
evolution, 22(1), pp. 25-33.
Selkoe, K. A. and Toonen, R. J. (2006) ‘Microsatellites for ecologists: A practical guide
to using and evaluating microsatellite markers’, Ecology Letters, 9(5), pp. 615–
629.
Serra, A., Silva, C. and Lopes, E. (2007) Étude de faisabilité du projet «Développement
touristique de la Boé au profit de la conservation des Chimpanzés et des
populations locales». CHIMBO: Bissau, Guinea-Bissau.
Shimada, M. K., Hayakawa, S., Humle, T., Fujita, S., Hirata, S., Sugyama, Y. and
Saitou, N. (2004) ‘Mitochondrial DNA genealogy of chimpanzees in the Nimba
Mountains and Bossou, West Africa’, American Journal of Primatology, 64(3), pp.
261–275.
Slatkin, M. and Hudson, R. R. (1991) ‘Pairwise comparisons of mitochondrial DNA
sequences in stable and exponentially growing populations’, Genetics, 129(2),
pp. 555–562.
Sousa, C. (2014) ‘Os primatas não-humanos dos países lusófonos africanos e a sua
conservação’, in Penjon, J. and Pereira, C. (eds) L’animal dans le monde
lusophone. Du réel à l’imaginaire. Presses de Paris, France.
Sousa, C., Gippoliti, S. and Akhlas, M. (2005) ‘Republic of Guinea-Bissau’, in World
Atlas od Great Apes and Their Conservation, pp. 362–365.
Sousa, F. M. (2009) Densidade de Pan troglodytes verus e uso de recursos naturais
pela população local, (Gadamael, República da Guiné-Bissau). MSc Thesis.
Universidade de Lisboa, Portugal.
Sousa, J., Casanova, C., Barata, A. V. and Sousa, C. (2013) ‘The effect of canopy
closure on chimpanzee nest abundance in Lagoas de Cufada National Park ,
Guinea-Bissau’, Primates, 55(2), pp. 283–292.
Sousa, J., Vicente, L., Gippoliti, S., Casanova, C. and Sousa, C. (2014) ‘Local
knowledge and perceptions of chimpanzees in Cantanhez National Park, Guinea-
Bissau’, American Journal of Primatology, 76(2), pp. 122–134.
Sousa, J. (2007) Densidade de Pan troglodytes verus e veículos de sensibilização
ambiental: quatro florestas de Cantanhez, República da Guiné-Bissau. MSc
Thesis. Universidade de Lisboa, Portugal.

FCUP A country-level genetic survey of the IUCN critically endangered western chimpanzee (Pan troglodytes
verus) in Guinea-Bissau
145
Stone, A. C., Battistuzzi, F. U., Kubatko, L. S., Perry Jr., G. H., Trudeau, E., Lin, H. and
Kumar, S. (2010) ‘More reliable estimates of divergence times in Pan using
complete mtDNA sequences and accounting for population structure.’,
Philosophical transactions of the Royal Society of London. Series B, Biological
sciences, 365(1556), pp. 3277–88.
Storz, J. F. and Beaumont, M. A. (2002) 'Testing for genetic evidence of population
expansion and contraction: an empirical analysis of microsatellite DNA variation
using a hierarchical Bayesian model', Evolution, 56(1), pp. 154-166.
Storz, J. F., Beaumont, M. A. and Alberts, S. C. (2002) 'Genetic evidence ofr long-term
population decline in a savannah-dwelling primate: inferences from a hierarchical
Bayesian model', Molecular Biology and Evolution, 19(11), pp. 1981-1990.
Sullivan, K. M., Mannucci, A., Kimpton, C. P. and Gill, P. (1993) ‘A rapid and
quantitative DNA sex test: Fluorescence-based PCR analysis of X-Y homologous
gene amelogenin’, BioTechniques, 15(4), 636-8.
Sunnucks, P. (2000) ‘Efficient genetic markers for population biology’, Trends in
ecology and evolution, 15(5), pp. 199–203.
Taberlet, P., Griffin, S., Goossens, B., Questiau, S., Manceau, V., Escaravage, N.,
Waits, L. P. and Bouvet, J. (1996) ‘Reliable genotyping of samples with very low
DNA quantities using PCR.’, Nucleic acids research, 24(16), pp. 3189–3194.
Tajima, F. (1989) ‘Statistical method for testing the neutral mutation hypothesis by DNA
polymorphism’, Genetics, 123(3), pp. 585–595.
Tajima, F., Tokunaga, T. and Miyashita, N. (1994) 'Statistical methods for estimating
the effective number of alleles, expected heterozygosity and genetic distance in
self-incompatibility locus', The Japanese Journal of Genetics, 69(3), pp. 287-295.
Tautz, D. and Schlötterer, C. (1994) ‘Simple sequences’, Current Opinion in Genetics
and Development, 4, pp. 832–837.
Teixeira, H. (2016) Landscape genetics of Guinea baboon: assessing population
structure, gene flow dynamics, and functional connectivity with molecular and
spatial tools. MSc Thesis. Universidade do Porto, Portugal.
Thompson, M. E., Jones, J. H., Pusey, A. E., Brewer-Marsden, S., Goodall, J.,
Marsden, D., Matsuzawa, T., Nishida, T., Reynolds, V., Sugiyama, Y. and
Wrangham, R. W. (2007) ‘Aging and Fertility Patterns in Wild Chimpanzees
Provide Insights into the Evolution of Menopause’, Current Biology, 17(24), pp.

FCUP A country-level genetic survey of the IUCN critically endangered western chimpanzee (Pan troglodytes
verus) in Guinea-Bissau
146
2150–2156.
Tomonaga, T., Tanaka, M. and Matsuzawa, T. (2004) ‘Development of social cognition
in infant chimpanzees (Pan troglodytes): Face recognition, smiling, gaze, and the
lack of triadic interactions', Japanese Psychological Research, 46(3), pp. 227-
235.
Torres, J., Brito, J. C., Vasconcelos, M. J., Catarino, L., Gongalves, J. and Honrado J.
(2010) ‘Ensemble models of habitat suitability relate chimpanzee (Pan
troglodytes) conservation to forest and landscape dynamics in Western Africa’,
Biological Conservation, 143(2), pp. 416–425.
Tutin, C. E. G., Ancrenaz, M., Paredes, J., Vacher-Vallas, M., Vidal, C., Goossens, B.,
Bruford, M. W. and Jamart, A. (2001) ‘Conservation Biology Framework for the
Release of Wild-Born Orphaned Chimpanzees into the Conkouati Reserve,
Congo’, Conservation Biology, 15(5), pp. 1247–1257.
UNDP (2016) Africa Human Development Report 2016: Accelerating Gender Equality
and Women’s Empowerment in Africa, United Nations Development Programme
Regional Bureau for Africa: New York, United States of America.
Valière, N., Berthier, P., Mouchiroud, D. and Pontier, D. (2002) ‘GEMINI: software for
testing the effects of genotyping errors and multitubes approach for individual
identification’, Molecular Ecology Notes, 2(1), pp. 83–86.
Vallet, D., Petir, E. J., Gatti, S., Levréro, F. and Ménard, N. (2008) ‘A new 2CTAB/PCI
method improves DNA amplification success from faeces of Mediterranean
(Barbary macaques) and tropical (lowland gorillas) primates’, Conservation
Genetics, 9(3), pp. 677–680.
Vigilant, L. (2003) 'Genetic Perspectives on Pan troglodytes verus', in Kormos, R. et al.
eds (ed.) West African Chimpanzees. Gland, Switzerland and Cambridge, U.K.:
IUCN/SSC Primate Specialist Group, p. ix +219 pp.
Vigilant, L., Hofreiter, M., Siedel, H. and Boesch, C. (2001) ‘Paternity and relatedness
in wild chimpanzee communities.’, Proceedings of the National Academy of
Sciences of the United States of America, 98(23), pp. 12890–5.
Waits, L., Taberlet, P. and Luikart, G. (2001) ‘Estimating the probability of identity
among genotypesin natural populations: cautions and guidelines.’, Molecular
Ecology, 10, pp. 249–256.
Wenceslau, J. F. C. (2014) Report : Bauxite Mining and Chimpanzees Population

FCUP A country-level genetic survey of the IUCN critically endangered western chimpanzee (Pan troglodytes
verus) in Guinea-Bissau
147
Distribution, a case study in the Boé sector, Guinea-Bissau. CHIMBO: São José
do Rio Preto, Brazil.
Wickham, H. (2009) 'ggplot2: elegant graphics for data analysis', Journal of Statistical
Software, 35(1), pp. 65-88.
Wit, P. (2011) Démarrage des activités d’exploitation de bauxite dans la Boé par
l’entreprise «Brauxite Angola». Daridibó: Guinea-Bissau.
Wrangham, R. W., Hagel, G., Leighton, M., Marshall, A. J., Waldau, P. and Nishida, T.
(2008) ‘The Great Ape World Heritage Species Project’, in Stoinski, T. S., Steklis,
H. D., and Mehlman, P. T. (eds) Conservation in the 21st Century: Gorillas as a
Case Study. New York, USA: Springer Science+Business Media.
Yu, N., Jensen-Seaman, M. I., Chemnick, L., Kidd, J. R., Deinard, A. S., Ryder, O.,
Kidd, K. K. and Li, W. (2003) ‘Low nucleotide diversity in chimpanzees and
bonobos’, Genetics, 164(4), pp. 1511–1518.
Zinner, D., Groeneveld, L. F., Keller, C. and Roos, C. (2009) ‘Mitochondrial
phylogeography of baboons (Papio spp.): indication for introgressive
hybridization?’, BMC evolutionary biology, 9(1), 83.

FCUP A country-level genetic survey of the IUCN critically endangered western chimpanzee (Pan troglodytes
verus) in Guinea-Bissau
148
7. Supplementary Material
Figure S1. Authorization, by the Director General of the General Directorate for Food and Veterinary, for the import of
tissue, blood, and faecal samples of primate species from Guinea-Bissau to Portugal.

FCUP A country-level genetic survey of the IUCN critically endangered western chimpanzee (Pan troglodytes
verus) in Guinea-Bissau
149
Figure S2. Authorization, by the Convention on International Trade in Endangered Species of Wild Fauna and Flora
(CITES)/Instituto da Conservação da Natureza e das Florestas (ICNF), for the transport of tissue and blood samples of
chimpanzee from Guinea-Bissau to Portugal.

FCUP A country-level genetic survey of the IUCN critically endangered western chimpanzee (Pan troglodytes
verus) in Guinea-Bissau
150
Table SI. Allelic Dropout and False Allele rates estimated in Pedant v. 1.0 using 50 samples collected at CLNP and
Consensus Threshold for four Polymerase Chain Reaction repetitions after the GEMINI v. 1.3.0 analyses.
Locus Allelic Dropout False Allele Consensus Threshold
D5s1457
D13s159
D2s1326
D10s1432
D16s2624
D1s207
D14s306
D6s311
D4s1627
HUMFIBRA
Fesps
D6s501
D1s548
D11s2002
D7s2204
D4s2408
D6s474
D13s765
D1s1665
D6s503
D6s1056
0.031121
0.067214
0.174880
0.041908
0.033693
0.043970
0.065104
0.107993
0.140271
0.082436
0.000000
0.000912
0.016404
0.025183
0.028361
0.066466
0.000000
0.000000
0.000000
0.000000
0.009397
0.008643
0.027697
0.000000
0.026180
0.008955
0.009106
0.029068
0.000000
0.000000
0.009292
0.011160
0.000000
0.000000
2
2
2
1
1
1
1
2
2
2
1
3
2
0.091566
0.123533
0.079772
0.074228
0.057925
0.171531
0.176509
0.122508
2
2
1
1
2
2
1
1
Average across loci 0.081118 0.012357524

FCUP A country-level genetic survey of the IUCN critically endangered western chimpanzee (Pan troglodytes
verus) in Guinea-Bissau
151
Table SII. Details of the three Multiplex Polymerase Chain Reactions used by Sá (2013). Annealing temperature (AT),
loci in each multiplex, primer sequences, repeat motif, allele range size, fluorescent dye, and final PCR concentration
(C). N.A. – not applicable. Sá (2013) does not specify the AT used for M3. Note that amelogenin was the molecular
method used to determine the sex of the samples and is not a microsatellite locus.
Multiplex AT (ºC) Locus Forward Primer (5’-3’)
Reverse Primer (5’-3’) Repeat Motif Size Range Dye C (M)
M1 57ºC
Amelogenin CCTGGGCTCTGTAAAGAATAGTG
N.A. 104-110 FAM 0.2 ATCAGAGCTTAAACTGGGAAGCTG
D16s2624 TGAGGCAATTTGTTACAGAGC
TCTA 119-139 NED 0.2 TAATGTACCTGGTACCAAAAACA
D1s550 CCTGTTGCCACCTACAAAAG
TCTA 147-177 HEX 0.2 TAAGTTAGTTCAAATTCATCAGTGC
D10s1432 CAGTGGACACTAAACACAATCC
TAGATTATCTAAATGGTGGATTTCC TCTA 162-182 FAM 0.2
D2s1326 AGACAGTCAAGAATAACTGCCC
CTGTGGCTCAAAAGCTGAAT TCTA 210-282 FAM 0.2
M2 58ºC
D5s1457 TAGGTTCTGGGCATGTCTGT
GATA 101-133 FAM 0.2 TGCTTGGCACACTTCAGG
HUMFIBRA GCCCCATAGGTTTTGAACTCA
CTTT 171-203 HEX 0.2 TGATTTGTCTGTAATTGCCAGC
D4s1627 AGCATTAGCATTTGTCCTGG
GATA 214-250 FAM 0.2 GACTAACCTGACTCCCCCTC
DYs439 TCCTGAATGGTACTTCCTAGGTTT
GATA 230-258 HEX 0.2 GCCTGGCTTGGAATTCTTTT
M3
DQCAR GAAACATATATTAACAGAGACAGACAAA
CA 99-119 FAM 0.2 CATTTCTCTTCCTTATCACTTCATA
D1s207 CACTTCTCCTTGAATCGCTT
CA 128-160 HEX 0.2 GCAAGTCCTGTTCCAAGTCT
D13s159 AGGCTGTGACTTTTAGGCCA
CA 154-190 TAMRA 0.2 CCAGGCCACTTTTGATCTGT
D14s306 AAAGCTACATCCAAATTAGGTAGG
GATA 196-248 FAM 0.2 TGACAAAGAAACTAAAATGTCCC
D6s311 ATGTCCTCATTGGTGTTGTG
GATTCAGAGCCCAGGAAGAT CA 208-248 HEX 0.2

FCUP A country-level genetic survey of the IUCN critically endangered western chimpanzee (Pan troglodytes
verus) in Guinea-Bissau
152
Table SIII. Comparison of error rates (allelic dropout and false alleles) as estimated in Pedant v. 1.0 using two replicates
per sample and per locus and as calculated using all the data following the approach by Broquet and Petit (2004). All
values are presented in percentage.
Locus Amplification success Allelic Dropout False Allele
Real Estimated Real Estimated
D5s1457
D13s159
D2s1326
D10s1432
D16s2624
D1s207
D14s306
D6s311
D4s1627
HUMFIBRA
Fesps
D6s501
D1s548
D11s2002
D7s2204
D4s2408
D6s474
D13s765
D1s1665
D6s503
D6s1056
68.456
72.851
64.143
60.677
81.156
64.348
45.080
82.232
62.295
79.358
12.9944
06.8182
13.5802
1.8405
2.5316
8.4211
6.5217
14.1553
12.8834
11.8852
2.1429
7.6577
6.1069
16.1383
22.6415
18.9474
9.5588
10.9170
16.0000
36.7521
23.1481
3.1121
6.7214
17.4880
4.1908
3.3693
4.3970
6.5104
10.7993
14.0271
8.2436
1.4337
2.5000
3.6842
0.0000
0.5882
0.4082
0.7634
3.7618
0.9174
2.1944
0.0000
1.9027
0.5814
1.3072
0.5714
0.8130
0.2950
0.5682
1.3514
0.3610
1.0714
2.5183
2.8361
6.6466
0.0000
0.0000
0.0000
0.0000
0.9397
0.8643
2.7697
88.693 0.0000 0.0000
87.744 0.0912 2.6180
74.414 1.6404 0.8955
83.888 9.1566 0.9106
40.217 12.3533 2.9068
56.217 7.9772 0.0000
73.260 7.4228 0.0000
71.691 5.7925 0.9292
49.540 17.1531 1.1160
62.778 17.6509 0.0000
64.510 12.2508 0.0000
Average across loci 68.264 12.4592 8.1118 1.1940 1.2357

FCUP A country-level genetic survey of the IUCN critically endangered western chimpanzee (Pan troglodytes
verus) in Guinea-Bissau
153
Table SIV. Allele size range per locus for the samples of western chimpanzee amplified by the present study.
Multiplex Locus Range Size
M1
D5s1457 114-134
D13s159 181-199
D2s1326 246-282
M2
D10s1432 183-195
D16s2624 137-153
D1s207 155-181
D14s306 224-244
DYs439 264-268
M3
D6s311 231-245
D4s1627 227-259
amelogenin 124-130
HUMFIBRA 203-223
M4
D6s501 152-168
D7s2204 234-258
D4s2408 268-288
D1s548 153-169
D11s2002 170-202
Fesps 125-129
M5
D13s765 185-201
D6s474 146-162
D6s1056 268-300
D1s1665 206-226
D6s503 260-273
Table SV. Comparison of allele frequencies between the dataset produced by the present study (FB dataset) and the
dataset produced by Rui Sá (RS dataset), using the samples from CLNP with a QI > 0.5. N corresponds to the number
of samples from each dataset used for the comparison.
Microsatellite locus FB dataset (N = 51) RS dataset (N = 13)
Allele Frequency (%) Allele Frequency (%)
D5s1457
114 0.98 96 0.00
118 3.92 100 8.33
122 4.90 104 4.17
126 50.00 108 33.33
130 32.35 112 37.50
134 7.84 116 16.67
D13s159
181 19.00 164 5.56
183 0.00 166 5.56
185 16.00 168 11.11
187 2.00 170 5.56
189 8.00 172 5.56
191 14.00 174 16.67
193 13.00 176 11.11
195 14.00 178 27.78
197 1.00 180 5.56

FCUP A country-level genetic survey of the IUCN critically endangered western chimpanzee (Pan troglodytes
verus) in Guinea-Bissau
154
199 9.00 182 0.00
201 4.00 184 5.56
D2s1326
246 20.65 228 25.00
250 13.04 232 12.50
254 3.26 236 6.25
258 15.22 240 12.50
262 4.35 244 25.00
266 10.87 248 6.25
270 7.61 252 0.00
274 4.35 256 0.00
278 8.70 260 6.25
282 11.96 264 6.25
D10s1432
183 3.57 161 0.00
187 32.14 165 25.00
191 41.67 169 60.00
195 22.62 173 15.00
D16s2624
137 43.88 117 30.00
141 6.12 121 10.00
145 15.31 125 20.00
149 15.31 129 25.00
153 19.39 133 15.00
D1s207
155 8.97 132 11.54
161 6.41 138 3.85
163 2.56 140 7.69
165 7.69 142 15.38
171 5.13 148 3.85
177 10.26 154 3.85
179 3.85 156 0.00
181 51.28 158 34.62
183 3.85 160 19.23
D14s306
224 12.96 203 0.00
228 12.96 207 19.23
232 11.11 211 3.85
236 50.00 215 53.85
240 9.26 219 15.38
244 3.70 223 7.69
D6s311
231 34.38 213 38.46
233 21.88 215 23.08
235 2.08 217 7.69
237 2.08 219 0.00
239 27.08 221 15.38
245 12.50 227 15.38
D4s1627
227 5.32 206 4.55
235 23.40 214 13.64
239 7.45 218 0.00
243 13.83 222 31.82
247 21.28 226 31.82
251 18.09 230 13.64

FCUP A country-level genetic survey of the IUCN critically endangered western chimpanzee (Pan troglodytes
verus) in Guinea-Bissau
155
255 7.45 234 0.00
259 3.19 238 4.55
HUMFIBRA
203 3.06 179 8.33
207 21.43 183 4.17
211 31.63 187 16.67
215 36.73 191 62.50
219 5.10 195 4.17
223 2.04 199 4.17
Figure S3. Comparison of two Bayesian clustering analyses to assess the effect of missing data assuming K=4 for the
same 201 samples from five different geographic populations in Guinea-Bissau. A) 21 loci, with missing data for RS
samples across 11 loci. B) 10 loci; the clusters seem to be better defined, which is especially evident for the one
represented in yellow.

FCUP A country-level genetic survey of the IUCN critically endangered western chimpanzee (Pan troglodytes
verus) in Guinea-Bissau
156
Figure S4. Comparison of two Factorial Component Analyses for the same 201 samples from five different geographic
populations in Guinea-Bissau, in order to assess the effect of missing data. A) 21 loci; the cluster on the right includes
samples from RS dataset, with missing data only for 11 loci, and the cluster on the left comprises samples from FB
dataset, with a low amount of missing data; the horizontal and vertical axes explain, respectively, 7.69% and 2.85% of
the observed variation. B) 10 loci; the horizontal and vertical axes explain, respectively, 3.82% and 3.50% of the
observed variation.

FCUP A country-level genetic survey of the IUCN critically endangered western chimpanzee (Pan troglodytes
verus) in Guinea-Bissau
157
Figure S5. Cumulative probability of identity (PI) and probability of identity between siblings (PIsibs) for the 10 loci
included in the combined dataset of genotypes. Distinction of different individuals is reliable with a minimum of five loci,
when the PIsibs curve approaches zero.
Figure S6. Genotype accumulation curve for the 10 loci included in the combined dataset showing a plateau at five loci,
the minimum number necessary to distinguish between different individuals.

FCUP A country-level genetic survey of the IUCN critically endangered western chimpanzee (Pan troglodytes
verus) in Guinea-Bissau
158
Figure S7. Individual Bayesian clustering analysis performed in STRUCTURE for the 45 unique genotypes grouped in
cluster 1. No evidence of substructure appears. A) Inference of the most likely number of clusters (K) using K and
LnP(K) values across all runs. B) Bar plot output assuming K = 2. C) Bar plot output assuming K = 4. D) Bar plot output
assuming K = 7.

FCUP A country-level genetic survey of the IUCN critically endangered western chimpanzee (Pan troglodytes
verus) in Guinea-Bissau
159
Figure S8. Output of the individual Bayesian clustering analysis performed in BAPS for the fine-scale analysis among
CLNP and DNP, assuming K = 1. The genotypes (N = 70) are represented on the geographic space.