Embed Size (px)
Citation preview

A Continuum Mechanical Model of Mechanoreceptive Afferent Responses toIndented Spatial Patterns
Arun P. Sripati,1,2 Sliman J. Bensmaia,1,3 and Kenneth O. Johnson1,3
1Krieger Mind/Brain Institute, and 2Departments of Electrical and Computer Engineering, and 3Neuroscience, Johns Hopkins University,Baltimore, Maryland
Submitted 29 November 2005; accepted in final form 8 February 2006
Sripati, Arun P., Sliman J. Bensmaia, and Kenneth O. Johnson. AContinuum mechanical model of mechanoreceptive afferent responsesto indented spatial patterns. J Neurophysiol 95: 3852–3864, 2006.First published February 15, 2006; doi:10.1152/jn.01240.2005. Infor-mation about the spatial structure of tactile stimuli is conveyed byslowly adapting type 1 (SA1) and rapidly adapting (RA) afferentsinnervating the skin. Here, we investigate how the spatial properties ofthe stimulus shape the afferent response. To that end, we present ananalytical framework to characterize SA1 and RA responses to a widevariety of spatial patterns indented into the skin. This frameworkcomprises a model of the tissue deformation produced by any three-dimensional indented spatial pattern, along with an expression thatconverts the deformation at the receptor site into a neural response.We evaluated 15 candidate variables for the relevant receptor defor-mation and found that physical quantities closely related to localmembrane stretch were most predictive of the observed afferentresponses. The main outcome of this study is an accurate workingmodel of SA1 and RA afferent responses to indented spatial patterns.
I N T R O D U C T I O N
When tactually exploring an object, the deformation pro-duced at the skin’s surface leads to events at the sites ofmechanotransduction that culminate in patterned activity in apopulation of mechanoreceptive afferent fibers. Previous workhas shown that this transformation, from a stimulus displace-ment pattern into a pattern of peripheral neural activity, ishighly nonlinear (Johnson 2001; Phillips and Johnson1981a,b). Neural responses in somatosensory cortex, as well asthe resulting tactile percepts, are shaped, in part, by thisnonlinear transformation at the periphery. A working model ofperipheral afferent responses is therefore an invaluable tool tounderstand how the information about a tactile stimulus istransformed as it ascends the perceptual pathway.
A well-known aspect of this peripheral response nonlinearityis the edge enhancement observed in responses to gratings(Phillips and Johnson 1981a). One approach to modeling theseafferent responses has consisted of using continuum mechanicsto characterize the deformation in the tissue and its eventualimpact on the mechanoreceptor (Phillips and Johnson 1981b).Another approach has consisted of using finite element mod-eling of the fingerpad to arrive at more realistic descriptions ofthe tissue and receptor deformations (Dandekar and Srinivasan1997; Srinivasan and Dandekar 1996; Wu et al. 2004).
In addition to being a useful tool in understanding upstreamprocessing, another benefit from modeling the stimulus/re-sponse transformation is that it may lead to a better under-
standing of mechanotransduction itself. Mechanotransductionhas been studied in Pacinian corpuscles by recording thereceptor and action potentials evoked by direct mechanicalstimulation (Diamond et al. 1956; Gray and Malcolm 1950;Gray and Matthews 1951; Loewenstein and Cohen 1959a,b;Loewenstein and Rathkamp 1958; Loewenstein and Skalak1966). In contrast, little is known about transduction in Merkelreceptors and Meissner corpuscles (innervated by slowlyadapting type 1 and rapidly adapting afferents, respectively),which, unlike the Pacinian (PC) corpuscles, cannot be readilyexcised from the surrounding tissue and thus have not beenstudied in isolation (Ogawa 1996; Takahashi-Iwanaga andShimoda 2003). In the present study, we developed a model ofthe stimulus/response transformation and used it to draw in-ferences regarding mechanotransduction in these fibers (Phil-lips and Johnson 1981b; Srinivasan and Dandekar 1996).
Specifically, we sought to understand the dependence of theafferent response on the spatial properties of the stimulus. Weconfined our study to cutaneous slowly adapting type 1 (SA1)and rapidly adapting (RA) fibers because they are sensitive tothe spatial properties of the stimulus, unlike PC fibers (Johnson2001). We developed an analytical framework to characterizethe stimulus-response transformation. This framework com-prises a model of the tissue deformation produced by anythree-dimensional spatial pattern along with an expression thatconverts the deformation at the receptor site into a neuralresponse. Within this framework, we ascertained which aspectsof the local tissue deformation are most predictive of the neuralresponse. Maximum compressive strain (Phillips and Johnson1981b), strain energy density (Dandekar and Srinivasan 1997;Srinivasan and Dandekar 1996), and stress (Del Prete et al.2003; Khalsa et al. 1996, 1997) have been previously proposedto drive transduction. One finding of the present study is thatthese variables are closely related and can only be distin-guished using a wide variety of stimuli. Overall, physicalquantities closely related to local membrane stretch were foundto be most predictive of the afferent responses. The mainoutcome of this study is a working model of SA1 and RAafferent responses to indented spatial patterns.
M E T H O D S
Stimuli
Stimuli were delivered using a tactile stimulator that consists of 400independently controlled probes in a 20 � 20 array covering a 1-cm2
Address for reprint requests and other correspondence: A. P. Sripati, ZanvylKrieger Mind/Brain Institute, Johns Hopkins University, 3400 N. CharlesStreet, Baltimore, MD 21218 (E-mail [email protected]).
The costs of publication of this article were defrayed in part by the paymentof page charges. The article must therefore be hereby marked “advertisement”in accordance with 18 U.S.C. Section 1734 solely to indicate this fact.
J Neurophysiol 95: 3852–3864, 2006.First published February 15, 2006; doi:10.1152/jn.01240.2005.
3852 0022-3077/06 $8.00 Copyright © 2006 The American Physiological Society www.jn.org
on June 22, 2006 jn.physiology.org
Dow
nloaded from

area. Each probe is cylindrical with a radius of 0.3 mm, and thecenter-to-center spacing between probes is 0.53 mm. Probe ampli-tudes were measured every 2 ms using optical sensors with anaccuracy of 2–5 �m.
We recorded peripheral unit responses to the following indentedstimuli. 1) Two hundred spheres of varying radius of curvature atvarying locations on the array (radii: 1, 2, 4, 8, 16, 32, 64, and 128mm; center amplitude: 0.3 mm; duration: 100 ms; repetitions: 8). 2)One hundred eighty-four square-wave gratings of different periods atvarying spatial offsets within the array (periods: 1, 2, 3, 4, 6, 10, and20 mm; every nonredundant offset in steps of 0.53 mm across thespatial period; amplitude: 0.3 mm; duration: 40 ms; stimulus repeti-tions: 60, 40, 30, 20, 10, 6, and 6 corresponding to the 7 spatialperiods). 3) Eighty-eight bars, each 1.2 mm wide, at varying orienta-tions and locations on the array (orientations: 0–180° in steps of22.5°; amplitude: 0.5 mm; duration: 66 ms; repetitions: 10). 4) Fourhundred individual probes at all locations in the array (amplitude: 0.3mm; duration: 100 ms; repetitions: 5). 5) In 18 of the 24 neurons, 130annuli, centered on the afferent’s point of maximum sensitivity (or“hotspot”), were indented into the skin with different radii andamplitudes (radius, measured to the annulus center: 2, 3, 4, and 6 mm;annulus thickness, 1 mm; amplitudes: 0.1 to 0.8 mm in steps of 0.1mm; duration: 100 ms; repetitions: 5). In 90 of these stimuli, a probewas simultaneously indented at the center of the annulus with varyingamplitudes (amplitudes: 0 – 0.8 mm; repetitions, 5). 6) In 18 of the24 neurons, 90 single-probe indentations were presented at varyingamplitudes (9 probes centered around the afferent’s hotspot; am-plitudes: 0.1– 0.8 mm in steps of 0.1 mm; duration: 100 ms;repetitions: 5).
Overall, 1,092 spatial patterns were indented into the skin. Many ofthese spatial patterns are representative of the types of stimuli en-countered in common tactile experience. On and off ramps at thebeginning and end of each stimulus indentation lasted �20 ms.Relatively short stimulus durations were used so that a large numberof stimuli could be delivered during each recording session. Succes-sive stimulus indentations were separated by a time interval equal tothe stimulus duration. Thus the duration of each trial was twice theduration of the stimulus indentation.
Neurophysiology
Single-unit recordings were made from the ulnar and median nervesof macaque monkeys (Macacca mulatta) using standard methods(Talbot et al. 1968). Stimuli were delivered to the distal fingerpads ofdigits 2–5. Monkeys were anesthetized with intravenous pentobarbitalsodium. A 1-in incision was made on the upper or lower arm, andblunt dissection was used to isolate the ulnar or median nerve. A skinflap pool was formed at the incision site by suturing the skin marginsto a stainless steel ring (35 mm diam). The pool was filled withparaffin oil and a small dissecting mirror was placed under the nerve.The nerve sheath was dissected under a microscope using fine forcepsand a pair of iris scissors. A small bundle of axons was cut proximally,separated from the nerve trunk, and placed on the mirror. This bundleof axons was repeatedly split until it was possible to activate a singlemechanoreceptive afferent when the skin was stimulated with ahandheld probe.
Standard procedures were used to classify mechanoreceptive affer-ents according to their responses to step indentations (Freeman andJohnson 1982a,b; Talbot et al. 1968). If the afferent produced asustained response to an indentation, it was classified as SA1; if itresponded transiently to the onset and offset of the indentation, it wasclassified as RA unless it responded to air puffs and had a largereceptive field, in which case it was classified as PC. However,Pacinian fiber responses were not recorded as they are insensitive tothe fine spatial structure of the stimulus (Johnson 2001). The point of
maximum sensitivity of the afferent was located on the skin using ahandheld probe and marked with a felt-point pen. The probe array wasthen centered on the afferent’s hotspot.
Continuum mechanical model
The model is a natural extension of an existing continuum mechan-ical model applicable to one-dimensional (grating) stimuli (Phillipsand Johnson 1981b). The computation of the afferent response isperformed in three steps as described in RESULTS.
Computation of equivalent forces (step 1)
The skin is assumed to be infinite in extent from the point of viewof the receptor. Individual probes in the stimulus array are taken to bepoint loads acting on the surface of the skin, the net effect of whichis the specified indentation pattern. The displacement D produced inthe skin by a point load P acting at the origin is inversely proportionalto the distance r from the origin (Timoshenko and Goodier 1970)
D�r� ��1 � v2�P
�Er(1)
where E is the modulus of elasticity, and � is Poisson’s ratio, ameasure of compressibility (see following text). This solution wasmodified in two ways. First, because it predicts an infinite displace-ment at the origin (where r � 0), displacements within a radius r0
(� 0.3 mm, half the distance between probe centers) are taken to beconstant. Second, the solution predicts a nonzero skin displacement atall distances from the point of application of the force. In reality,afferent responses are unaffected by forces acting at a distance greaterthan rb � 3 mm from the receptor (Phillips and Johnson 1981b).Accordingly, the displacement solution was modified to find the valueof rb that best approximated the measured skin displacement due to aline load on the monkey fingerpad (Srinivasan 1989) (Fig. 1A). In fact,model predictions were found to be relatively insensitive to changes inrb.
A tactile stimulus is initially specified as a pattern of displacements.However, not all regions of the stimulus contact the skin. For exam-ple, the ridges of a square-wave grating will always contact the skin,whereas the grooves may or may not depending on their depth andwidth. Therefore, to redefine a stimulus as a set of equivalent forces,we need to identify the stimulus elements that contact the skin andcompute the forces these elements exert on the skin.
Afferents adapt to the baseline indentation amplitude (Vega-Ber-mudez and Johnson 1999b). Therefore probes that are level with thebaseline indentation are excluded from the force computations at theoutset. Assuming that the remaining probes indeed contact the skin,the equivalent pattern of forces is computed, following the approachof Phillips and Johnson (1981b). Briefly, the displacement at eachprobe location is taken to be the sum of the effects of the forcesexerted by all the probes. The resulting set of simultaneous equationsfor all probe locations can be written as the matrix equation S � PC,where S is a vector containing the displacement of the d probes, P isa vector of forces exerted by the probes and C is a d � d square matrixthe (i, j)-th entry of which is the displacement produced at location iby a unit force at probe j. The solution to the matrix equation is givenby P � SC-1.
Iterative contact-detection algorithm
The initial force computation assumes that every probe above thebaseline indentation exerts a force on the skin, contributing to theoverall displacement. However, a large-amplitude probe indented intothe skin will prevent a small-amplitude probe from contacting the skin
3853A MODEL OF AFFERENT RESPONSES TO SPATIAL PATTERNS
J Neurophysiol • VOL 95 • JUNE 2006 • www.jn.org
on June 22, 2006 jn.physiology.org
Dow
nloaded from

if the latter is sufficiently nearby. When the small-amplitude probe isincluded in the force computation, a negative load is assigned to thatlocation to force the skin to conform to the stimulus, implyingerroneously that this probe pulls on the skin. Therefore we concludedthat probes to which negative loads were assigned did not contact theskin and thus excluded them from the force computations. However,the removal of one or more probes causes a redistribution of the forcesexerted by the remaining probes. Therefore we iteratively computedthe equivalent pattern of forces as follows: first, we computed theforces including all probes that were above baseline. Next, the forceswere recomputed after excluding probes exerting negative loads. Thisstep was repeated until there were no negative values in the loadvector P.
The contact-detection algorithm was indirectly validated by theclose match between model predictions and afferent responses toannuli with a center probe of varying amplitude. Specifically, themodel was able to predict the smallest amplitude at which the centralprobe begins to affect the neural response (Fig. 1B). The agreementbetween model and data is an indirect demonstration that the actualskin surface deflections are closely approximated by the model.
Stress and strain tensor computation (step 2)
The stress tensor at any point under the skin specifies the forcesacting on an infinitesimal cube centered at that point. Strain is definedas the change in length as a fraction of the original length along aspecified direction. When the material is in static equilibrium, forcesacting on opposing faces of the cube cancel out. Thus the stress tensorconsists of six components: three normal forces (that produce com-pressive or tensile deformations) together with three shearing forces(that result in shearing deformations). Similarly, the strain tensorspecifies the complete state of deformation of an infinitesimal cuberelative to its original dimensions.
We assume the skin to be homogenous, isotropic, infinite, andlinearly elastic. Note that the assumption of an infinite medium isjustified because only nearby forces affect the receptor (see followingtext). We use the convention that compressive strains and stresses arepositive. The stresses and strains due to a point load are naturallyspecified in cylindrical coordinates, with the origin at the point ofindentation and the axis (z) perpendicular to the surface of the skin.Thus the stress tensor � at point (r,�,z) (in cylindrical coordinates) dueto a point load P acting at the origin can be specified as (Timoshenkoand Goodier 1970)
� � � �r �r� �rz
�r� �� ��z
�rz ��z �z
��
P
2� �3r2z
R5 ��1 � 2v�
�R2 � zR)0
3rz2
R5
0 �1 � 2v��1
r2 �z
r2R�
z
R3� 0
3rz2
R5 03z3
R5
� (2)
where, in Cartesian coordinates (x,y,z), r � �x2 � y2, R � �r2 � z2
and � is Poisson’s ratio [set to 0.4; see Wu et al. 2004); Poisson’s ratiofor an incompressible medium is 0.5]. The z axis is orthogonal to thesurface of the skin (with positive values indicating locations beneaththe surface), and the y axis is oriented along the axis of the finger.
The stresses produced by multiple point loads cannot be summeddirectly because each stress tensor belongs to a different cylindricalcoordinate frame. Thus we redefined the stresses in Cartesian coor-dinates using the standard coordinate transformation formula fortensors (Timoshenko and Goodier 1970) before we summed them
� �x �xy �xy
�xy �y �yz
�xz �yz �z
�� � cos� � sin� 0
sin� cos� 00 0 1
�� �r �r� �rz
�r� �� ��z
�rz ��z �z
�� cos� sin� 0� sin� cos� 0
0 0 1�
(3)
Hooke’s law specifies the relationship between stress and strain for alinearly elastic material. This yields the strain tensor in Cartesiancoordinates
ij �1 � v
E�ij �
v
E��x � �y � �z��ij (4)
where �ij is the Kronecker delta function. Because the predictedresponse is a rectified linear function of strain, the elastic modulus ofthe skin does not affect the model predictions and was taken to beunity.
Candidate variables
A mechanoreceptor may, in principle, be sensitive to any combi-nation of stresses or strains described in the preceding text. However,
FIG. 1. A: skin deflection as a function of distance from a line load. Crossesindicate measured data from the monkey finger (Srinivasan 1989). The blackline indicates the surface deflection predicted by the point load model used inthis study. Best fit rb was obtained as 4.26 mm using a nonlinear least-squaresmethod (lsqcurvefit, Matlab 7.0, MathWorks MA). For comparison, predic-tions using previously published line load (Phillips and Johnson 1981b) andwaterbed (Srinivasan 1989) models are shown as dotted and dark gray lines,respectively. B: responses of an SA1 unit (p4b_14_00) and an RA unit(p4b_21_00) to an annulus of height 0.5 mm and radius 3 mm, with varyingcenter probe amplitude. The annulus was centered around the hotspot of theafferent’s receptive field. The gray line with error bars indicates the firing ratecomputed during the trial duration. Error bars represent SE. The black linesindicate the predicted response of the model using maximum tensile strain (forthe SA1 unit) and relative change in area (for the RA unit).
3854 A. P. SRIPATI, S. J. BENSMAIA, AND K. O. JOHNSON
J Neurophysiol • VOL 95 • JUNE 2006 • www.jn.org
on June 22, 2006 jn.physiology.org
Dow
nloaded from

its response cannot depend on the coordinate system orientation either(a) in the plane parallel to the skin surface (i.e., the x-y plane) forvertical or horizontal tensor components or (b) in any direction (i.e.,regardless of the orientation of the axes) for all other tensor compo-nents. Thus we required candidate variables to be invariant to allrotations (except vertical and horizontal tensor components, whichwere required to be invariant to rotations in the x-y plane). Whetherindividual mechanoreceptors are orientation selective is unknown.However, the evidence suggests that they are not and that the observedorientation selectivity in the response is most likely due to afferentbranching (see DISCUSSION). The 15 candidate variables considered inthis study are summarized in Table 1.
Strain (stress) components that are invariant to all rotations arecharacterized by the three eigenvalues of the strain (stress) tensor,together with its sum and product (Timoshenko and Goodier 1970).We included 6 of these 10 stress and strain invariants among theputative variables: the maximum eigenvalue of the strain (stress)tensor, called the maximum compressive strain (stress), represents themaximum compressive deformation (pressure) experienced by thereceptor in any direction. Similarly the minimum eigenvalue, themaximum tensile strain (stress), represents the maximum tensiledeformation (pressure) experienced by the receptor in any direction.The sum of strain eigenvalues is proportional to the mean deformationexperienced by a receptor. For a linearly elastic material, the sum ofthe strain eigenvalues is proportional to the sum of the stress eigen-values, so the two yield identical predictions. The product of the straineigenvalues (i.e., the determinant of the strain tensor) was chosen asan indirect measure of volumetric deformation. The intermediateeigenvalues of the stress and strain tensors as well as the stressdeterminant were discarded from the analysis for lack of a clearphysical interpretation.
In addition to these six candidate variables, we chose nine addi-tional variables that correspond to physical quantities that mightplausibly drive transduction: The vertical strain (stress) represents thedeformation (pressure) in the vertical direction. The maximum hori-zontal strain (stress), i.e., the maximum absolute eigenvalue of thestrain (stress) tensor in the (x-y) plane, represents the deformation(pressure) experienced by the receptor in the plane parallel to thesurface of the skin. The maximum deformative strain (stress) repre-sents the maximum magnitude of the distortion (pressure) experiencedby the receptor regardless of whether it is tensile or compressive. The
strain energy density, given by U �1
2�i,j�ijij, represents the total
energy expended to deform the receptor. Finally, we included therelative change in volume [given by (1 � 1)(1 � 2)(1 � 3) � 1,where 1, 2, 3 are the strain eigenvalues] and the relative change insurface area, �S, when an infinitesimal sphere is deformed into anellipsoid. Because the exact calculation of the surface area of anellipsoid involves elliptical integrals, we used Thomsen’s approxima-tion (http://www.numericana.com/answer/ellipsoid.htm)
�S � �1
3��1 � 1�
p�1 � 2�p � �1 � 2�
p�1 � 3�p � �1 � 3�
p�1 � 1�p��1/p
� 1
(5)
Parameter fitting
The mean firing rate evoked by a stimulus was used as a measureof the afferent response. The firing rate was computed over the entiretrial (rather than over the stimulus duration) to incorporate the OFF
response of RA fibers into the response measure. Note that theduration over which action potentials are counted only affects afferentresponses linearly and thus only affects the linear parameters (thresh-old and sensitivity) in the model. Furthermore, the spatial modulationof SA1 responses to gratings has been found to be independent of theinterval over which spikes are counted (Phillips and Johnson 1981a).
For a given candidate variable, the model parameters include the(x,y,z) location of the point receptor, together with its sensitivity andthreshold. For each stimulus in a given set (e.g., square-wave grat-ings), we computed the equivalent force profiles and used them, alongwith the evoked responses, as input to a standard nonlinear fittingalgorithm (lsqcurvefit, Matlab 7.0, MathWorks, MA) to find theparameter values that minimize the sum of squared differences be-tween predicted and observed responses. The initial parameter valueswere the location of the afferent’s hotspot (estimated using thepunctate probe response map), together with randomized values forreceptor depth, sensitivity, and threshold. Fitted parameter valueswere insensitive to the choice of the stimulus-response set. To com-pute model predictions for one set of stimuli using the parametersobtained from another, the (x,y,z) location of the receptor was fixed.The threshold and sensitivity parameters were, however, modifiedbecause firing rates scaled linearly with stimulus duration, which itselfvaried across stimulus sets. In addition, different stimulus sets mayhave caused varying degrees of adaptation in the afferents (Bensmaiaet al. 2005b). Note that changes in threshold and sensitivity do notaffect the form of the modulation in the neural response; in other
TABLE 1. Summary of candidate variables
Candidate Physical Quantity Effect on the Receptor SA1 (n � 12) RA (n � 8)
Vertical strain, 2 Elongation along the axis perpendicular to the skin surface 0.86 � 0.03 0.94 � 0.01Maximum horizontal strain, h Maximum elongation parallel to the skin surface 0.75 � 0.03 0.89 � 0.01Maximum compressive strain, c Maximum compression in any direction 0.87 � 0.02 0.94 � 0.01Maximum tensile strain, t Maximum elongation in any direction 0.87 � 0.02 0.94 � 0.01Maximum deformative strain, m Maximum deformation in any direction, compressive or tensile 0.87 � 0.02 0.94 � 0.01Mean strain, Tr() Average deformation 0.83 � 0.03 0.94 � 0.01Strain determinant, det() Volumetric deformation (indirect measure) 0.76 � 0.02 0.88 � 0.01Relative change in area, �S Relative change in surface area 0.85 � 0.03 0.95 � 0.01Vertical stress, �V Pressure along the axis perpendicular to the skin surface 0.85 � 0.03 0.94 � 0.01Maximum horizontal stress, �h Maximum pressure parallel to the skin surface 0.87 � 0.02 0.95 � 0.01Maximum compressive stress, �c Maximum pressure in any direction 0.87 � 0.02 0.94 � 0.01Maximum tensile stress, �t Maximum pressure in any direction 0.72 � 0.04 0.88 � 0.01Maximum deformative stress �m Maximum pressure in any direction, compressive or tensile 0.87 � 0.02 0.94 � 0.01Strain energy density, SED Net work done on receptor 0.84 � 0.02 0.92 � 0.01Relative change in volume, V Relative change in receptor volume 0.83 � 0.04 0.94 � 0.01
Candidate variables hypothesized to drive transduction in slowly adapting type 1 (SA1) and rapidly adapting (RA) afferent fibers, along with the averagecorrelations (�SE) between the predictions yielded by each variable and the observed responses to spheres, gratings, bars and punctate probes; 12 SA1 and 8RA units were presented with all of these stimuli. Indented annuli were only presented to a subset of neurons and were therefore not included in thesecomputations. Note that, although several variables (e.g., vertical strain) yielded high correlations, they produced erroneous predictions over a subset of stimuli;these deviations are not reflected in the correlation measure (see Fig. 9).
3855A MODEL OF AFFERENT RESPONSES TO SPATIAL PATTERNS
J Neurophysiol • VOL 95 • JUNE 2006 • www.jn.org
on June 22, 2006 jn.physiology.org
Dow
nloaded from

words, the spatial profile of the response to indented spatial patternsis unaffected by linear scaling.
R E S U L T S
We recorded the responses of 14 SA1 and 10 RA afferentsto a wide variety of spatial patterns delivered to the distalfingerpads of three macaque monkeys. Patterns were generatedusing a newly developed stimulator consisting of 400 individ-ually controlled probes arrayed over a 1-cm2 area. The stim-uli—point probes, bars, square-wave gratings, spheres, andannuli—were indented into the skin, each for �100 ms. Weused the firing rate evoked during each stimulus presentation,averaged across repetitions, as a measure of the afferent re-sponse.
Model predictions were computed in three steps as illus-trated in Fig. 2A. Calculations of stress and strain in continuummechanics require a stimulus to be specified in terms of forcesthat produce a material displacement (Timoshenko andGoodier 1970). Because tactile stimuli are initially specified astwo-dimensional arrays of displacements, we first convert eachpattern of displacements into an equivalent pattern of forces,assuming that each probe contributes linearly to the nearbyskin displacement (see METHODS). Then a candidate variable ofinterest is computed for a given receptor location (x,y,z).Thus mechanotransduction is assumed to effectively take placeat a single point in the skin (however, see DISCUSSION on
multiple receptors). Finally, is linearly scaled and rectified toobtain the predicted afferent response r. The receptor location,threshold, and sensitivity are adjusted to obtain the leastsquared difference between the predicted and observed re-sponses.
An important feature of the conversion from displacementsto forces is that probes along the edges of a stimulus must exertmore force because they displace more skin than probes in thecenter (Fig. 2). Furthermore, stress and strain components arestrongly affected by receptor depth. Figure 2B shows thetensile strain computed for a hypothetical array of receptorslocated in the skin under an indented bar. If the receptors areshallow (z � 0.5 mm), the strain profile resembles the forceprofile and exhibits a natural edge enhancement. If the recep-tors are deeper (z � 2 mm), the edge effect is diffused,enhancement disappears, and the strain is maximal at the centerof the bar instead of at the edges (compare z � 0.5, 2 mm). Thespatial modulation of strain and stress thus decreases withincreasing receptor depth.
We present our results in two parts. We first demonstratethe close correspondence between SA1 responses and pre-dictions from maximum tensile strain (the relative elonga-tion of the receptor) and between RA responses and predic-tions from the relative change in area of the receptor. Wethen present an analysis of 15 physical variables we hypoth-esized to drive mechanotransduction, eliminate 9, and con-clude that, among the remaining 6, measures closely asso-
FIG. 2. A: schematic description of thecomputation of the neural response using thecontinuum mechanical model. First, a 2-di-mensional stimulus (here, an indented bar) isredefined in terms of the forces required toproduce this pattern of indentations (step 1).Next, this equivalent force profile is used tocompute the stress/strain variable at a pointreceptor located at (x,y,z) within the skin(step 2; positive z values indicate depthsbelow the resting skin surface). Finally, thestress/strain variable is scaled linearly andrectified to obtain the predicted neural re-sponse (step 3). The scalars a and b representthe afferent’s sensitivity and threshold, re-spectively. B: maximum tensile strain expe-rienced along the cross-section of an in-dented bar (shaded region) by an array ofreceptors at 3 depths: 0.5 mm (thick line), 1mm (thin line) and 2 mm (dotted line). If aspherical receptor is deformed into an ellip-soid, the length along the major (minor) axisis linearly related to the maximum tensile(compressive) strain; this is schematicallyshown under the abscissa for depths z � 0.5and z � 2 mm. Edge enhancement (e.g., atz � 0.5 mm) occurs in the responses of SA1but not RA afferents (see also Fig. 10).
3856 A. P. SRIPATI, S. J. BENSMAIA, AND K. O. JOHNSON
J Neurophysiol • VOL 95 • JUNE 2006 • www.jn.org
on June 22, 2006 jn.physiology.org
Dow
nloaded from
ciated with receptor membrane stretch best match SA1 andRA responses.
Model predictions of SA1 afferent responses
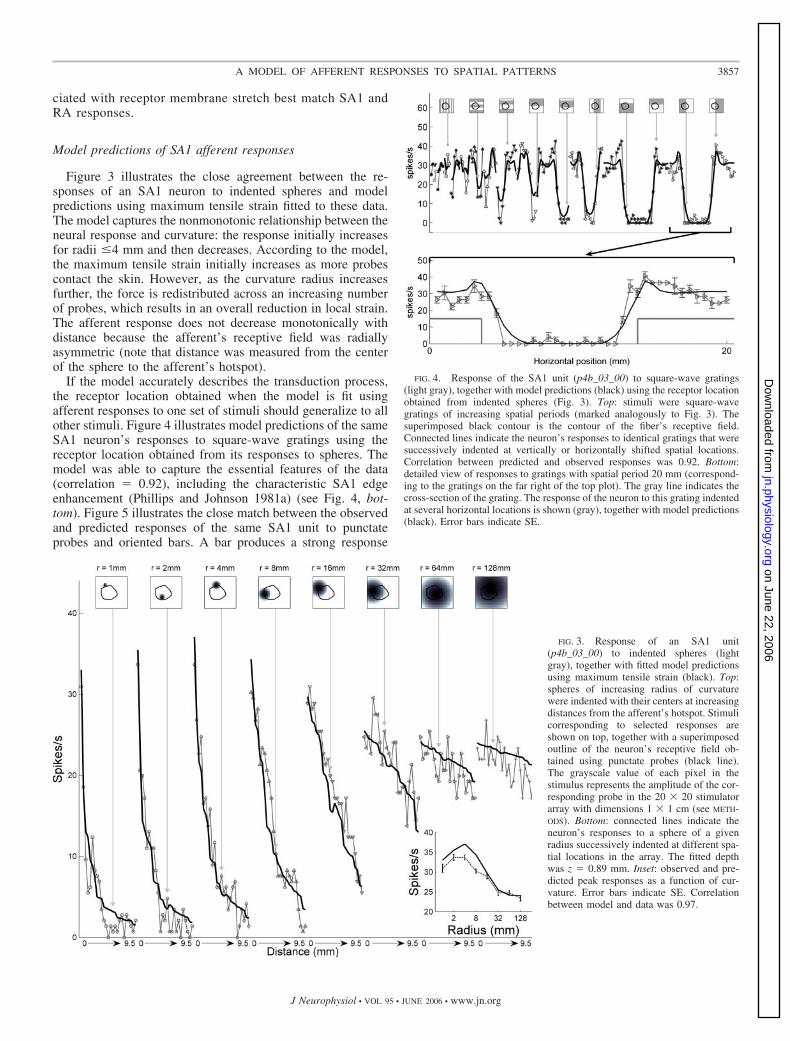
Figure 3 illustrates the close agreement between the re-sponses of an SA1 neuron to indented spheres and modelpredictions using maximum tensile strain fitted to these data.The model captures the nonmonotonic relationship between theneural response and curvature: the response initially increasesfor radii �4 mm and then decreases. According to the model,the maximum tensile strain initially increases as more probescontact the skin. However, as the curvature radius increasesfurther, the force is redistributed across an increasing numberof probes, which results in an overall reduction in local strain.The afferent response does not decrease monotonically withdistance because the afferent’s receptive field was radiallyasymmetric (note that distance was measured from the centerof the sphere to the afferent’s hotspot).
If the model accurately describes the transduction process,the receptor location obtained when the model is fit usingafferent responses to one set of stimuli should generalize to allother stimuli. Figure 4 illustrates model predictions of the sameSA1 neuron’s responses to square-wave gratings using thereceptor location obtained from its responses to spheres. Themodel was able to capture the essential features of the data(correlation � 0.92), including the characteristic SA1 edgeenhancement (Phillips and Johnson 1981a) (see Fig. 4, bot-tom). Figure 5 illustrates the close match between the observedand predicted responses of the same SA1 unit to punctateprobes and oriented bars. A bar produces a strong response
FIG. 3. Response of an SA1 unit(p4b_03_00) to indented spheres (lightgray), together with fitted model predictionsusing maximum tensile strain (black). Top:spheres of increasing radius of curvaturewere indented with their centers at increasingdistances from the afferent’s hotspot. Stimulicorresponding to selected responses areshown on top, together with a superimposedoutline of the neuron’s receptive field ob-tained using punctate probes (black line).The grayscale value of each pixel in thestimulus represents the amplitude of the cor-responding probe in the 20 � 20 stimulatorarray with dimensions 1 � 1 cm (see METH-ODS). Bottom: connected lines indicate theneuron’s responses to a sphere of a givenradius successively indented at different spa-tial locations in the array. The fitted depthwas z � 0.89 mm. Inset: observed and pre-dicted peak responses as a function of cur-vature. Error bars indicate SE. Correlationbetween model and data was 0.97.
FIG. 4. Response of the SA1 unit (p4b_03_00) to square-wave gratings(light gray), together with model predictions (black) using the receptor locationobtained from indented spheres (Fig. 3). Top: stimuli were square-wavegratings of increasing spatial periods (marked analogously to Fig. 3). Thesuperimposed black contour is the contour of the fiber’s receptive field.Connected lines indicate the neuron’s responses to identical gratings that weresuccessively indented at vertically or horizontally shifted spatial locations.Correlation between predicted and observed responses was 0.92. Bottom:detailed view of responses to gratings with spatial period 20 mm (correspond-ing to the gratings on the far right of the top plot). The gray line indicates thecross-section of the grating. The response of the neuron to this grating indentedat several horizontal locations is shown (gray), together with model predictions(black). Error bars indicate SE.
3857A MODEL OF AFFERENT RESPONSES TO SPATIAL PATTERNS
J Neurophysiol • VOL 95 • JUNE 2006 • www.jn.org
on June 22, 2006 jn.physiology.org
Dow
nloaded from

when it spans the long axis of the receptive field and/or whenits edge is near the hotspot. According to the model, thesefactors account for the apparent orientation selectivity ob-served in Fig. 5. The top panels in Fig. 5 illustrate the predicted
and observed punctate probe receptive fields. In general, themodel’s failure to account for the ellipticity of the receptivefield accounted for a significant portion of its lack of fit (seeDISCUSSION).
Model predictions of RA responses
Figure 6 illustrates the close agreement between the re-sponses of an RA afferent fiber to indented spheres and modelpredictions using relative change in area. The model capturesthe monotonic relationship between the neural response andcurvature: as the curvature increases, a larger portion of thereceptive field is stimulated, and the RA response increases.Note that the model makes contrasting predictions about therelationship between neural response and curvature for SA1and RA fibers (Figs. 3 and 6); the parameter that determines theshape of this function is the receptor depth z (see DISCUSSION).
Figure 7 illustrates model predictions of the same RAneuron’s responses to square-wave gratings using the receptorlocation obtained from its responses to spheres (correlation �0.9). In contrast to the edge enhancement observed in the SA1response, RA responses exhibited little edge enhancement, afeature also reflected in model predictions (Fig. 7, bottom; seeDISCUSSION). Figure 8 illustrates the close match between theobserved and predicted responses of this RA unit to punctateprobes and oriented bars. The top panels in Fig. 8 illustrate thepredicted and observed punctate probe receptive fields.
Summary of model performance across neurons
Overall, model predictions derived from maximum tensilestrain matched SA1 responses to a high degree of accuracy,whereas RA responses were best predicted using the relativechange in receptor surface area (minimum, mean, and maxi-
FIG. 5. Response of the same SA1 unit (p4b_03_00) to indented bars andpunctate probes. The afferent response as a function of bar orientation is shownin gray (bars shown below). The model prediction is shown in black. Themodel receptor location was obtained using responses to indented spheres. Thecorrelation coefficient between observed and predicted responses over all 88oriented bars was 0.97. The black contour superimposed on each bar outlinesthe extent of the receptive field as mapped by punctate probe indentations(0.3-mm amplitude). Inset, left: 2-dimensional plot of observed response topunctate probe indentations. The grayscale value indicates the afferent firingrate when the probe in the corresponding pixel was indented 0.3 mm into theskin. Inset, right: predicted response of the model using maximum tensilestrain. In both punctate probe response maps, the black outline denotes theboundary of the observed receptive field. Pixel-by-pixel correlation betweenthe maps was 0.88.
FIG. 6. Responses of an RA unit(p4b_06_03) to indented spheres, togetherwith model predictions obtained from rela-tive change in area. Conventions as in Fig. 3.Correlation between model and data was0.93.
3858 A. P. SRIPATI, S. J. BENSMAIA, AND K. O. JOHNSON
J Neurophysiol • VOL 95 • JUNE 2006 • www.jn.org
on June 22, 2006 jn.physiology.org
Dow
nloaded from

mum correlations between model predictions and observedresponses to spheres, gratings, bars and punctate probes were0.76, 0.86, and 0.96 for SA1 afferents using maximum tensilestrain and 0.90, 0.94 and 0.96 for RA fibers using relativechange in area). Fitted receptor depths for RA afferents weredeeper compared with their SA1 counterparts (minimum, meanand maximum depths were 0.41, 0.77 and 1.76 mm for SA1and 0.47, 1.62 and 4.44 mm for RA fibers). Results wererelatively insensitive to the choice of stimulus-response setused to obtain the receptor location.
Because neural responses are often characterized using lin-ear receptive fields (DiCarlo et al. 1998), we also examined theextent to which a linear model could predict afferent responses.Predictions derived from a displacement-based linear model(comprising 400 parameters, 1 for each probe) were alwaysworse than those from the continuum mechanical model, es-pecially for gratings (mean correlations, linear versus contin-uum mechanical model, spheres: SA1, 0.68 vs. 0.80; RA, 0.80vs. 0.86; gratings: SA1, 0.45 vs. 0.77; RA, 0.55 vs. 0.78). Alinear model is expected to perform poorly in predictinggrating stimuli because it does not take into account theredistribution of forces when several elements contact the skin.
Analysis of candidate variables
Because there is no consensus as to the physical variable thatdrives SA1 and RA mechanotransduction, we generated a listof 15 candidate variables (Table 1) that we hypothesized mightbe implicated in transduction. All previously proposed candi-dates were included in this list (Dandekar and Srinivasan 1997;Del Prete et al. 2003; Ge and Khalsa 2002; Khalsa et al. 1996,1997; Phillips and Johnson 1981b; Srinivasan and Dandekar1996) as well as other potentially relevant quantities; together,these quantities fell into two categories. The first categoryconsisted of basic quantities in continuum mechanics thatspecify meaningful aspects of the state of the receptor (e.g.,
maximum compressive stress is the maximum pressure expe-rienced by the receptor in any direction). The second groupcomprised quantities that are relevant to the specific problem ofreceptor deformation (e.g., relative change in receptor surfacearea).
For each of the 15 candidate variables, we obtained thebest-fitting receptor location for each afferent using its re-sponses to indented spheres. We then evaluated the perfor-mance of each candidate variable based on whether predictionsderived from it were consistent with the data. Table 1 summa-rizes the model performance over all stimuli using each can-didate variable.
As can be inferred from Table 1, most candidate variablesco-vary with the coarse spatial structure of the stimulus as doafferent responses. For example, stresses and strains tend to belarger (and responses stronger) when the receptor is under agrating ridge than when it is under a groove. Thus manycandidate variables yielded similar (and comparably accurate)model predictions. For the SA1 unit described earlier, thecorrelations between observed responses to spheres and pre-dictions derived from the 15 candidate variables were 0.97(vertical stress), 0.97 (vertical strain), 0.97 (maximum tensilestrain), 0.97 (area change), 0.96 (mean strain), 0.96 (maximumhorizontal stress), 0.96 (maximum. deformative stress), 0.96(maximum deformative strain), 0.96 (maximum compressivestress), 0.96 (maximum compressive strain), 0.95 (receptorvolume change), 0.92 (strain energy density), 0.89 (maximumhorizontal strain), 0.86 (maximum. tensile stress), and 0.86(strain determinant). We were able to eliminate maximumtensile stress and the strain determinant from further consider-ation because of their poor performance in predicting theresponses to spheres and gratings for all neurons.
Even though model predictions derived from the remaining13 candidate variables matched the coarse structure of theneural responses to spheres and gratings, they differed in theirfine structure. Therefore we devised stimuli for which at leasta subset of these variables would yield measurably divergentpredictions.
FIG. 8. Responses of the RA unit (p4b_06_03) to bars and punctate probestogether with model predictions from relative change in area. Predictions wereobtained using the responses to indented spheres. Conventions as in Fig. 5.Correlation � 0.91 and 0.80 for bars and punctate probes, respectively.
FIG. 7. Responses of the RA unit (p4b_06_03) to square-wave gratingstogether with model predictions from relative change in area. Predictions wereobtained using parameters obtained from responses to spheres. Conventions asin Fig. 4. Correlation � 0.90.
3859A MODEL OF AFFERENT RESPONSES TO SPATIAL PATTERNS
J Neurophysiol • VOL 95 • JUNE 2006 • www.jn.org
on June 22, 2006 jn.physiology.org
Dow
nloaded from

Spatial response map using punctate probes
Maximum horizontal stress predicts a dip in the neuralresponse when a punctate probe is positioned directly abovethe receptor (i.e., at the hotspot) because the stress at thereceptor is predominantly vertical (Fig. 9A). In contrast, themaximum horizontal strain is large when the probe is above thereceptor (the receptor is compressed in the vertical directionbut elongated along the horizontal) as well as when the probeis nearby but not directly above it (the receptor is compressedby the compressive horizontal force exerted by the probe).Thus maximum horizontal strain dips at a distance from thehotspot at which the vertical and horizontal forces cancel outthe receptor deformation they each produce. These minima inthe responses predicted by maximum horizontal stress andmaximum horizontal strain are inconsistent with the data.
Response as a function of probe amplitude
All but two candidate variables, namely strain energy den-sity and relative change in receptor volume, predict a linear
relationship between afferent firing rate and the amplitude of apunctate probe indented into the skin. We characterized therate-intensity function by indenting probes at various ampli-tudes and at locations on and around the afferent’s hotspot.These rate-intensity functions were fitted significantly better bya line (y � ax � b) than a parabola (y � ax2 � b) for both SA1and RA fibers (i.e., the correlations obtained using a linear fitwere significantly larger than those using a parabolic fit; pairedt-test on Fisher z-transformed correlations: t � 2.91 and 4.51for SA1 and RA, respectively; P 0.005). Indeed, SA1responses are known to be linear over a wide range of inden-tations, and RA responses are linear over the range of inden-tation velocities used here (0–40 mm/s) (Knibestol 1973). Asstrain energy density and relative change in receptor volumepredict a quadratic relationship between neural response andstimulus amplitude, they were regarded as less likely to drivetransduction. Figure 9B illustrates the measured rate-intensityfunctions along with model predictions for an SA1 and an RAunit.
FIG. 9. A, left: cross-section of the ob-served spatial response map of SA1 unitp4b_11_00 using punctate probe indenta-tions (dark gray). Response map predictionsusing receptor location fitted from the spher-ical data are shown for maximum horizontalstrain (light gray, solid), maximum horizon-tal stress (dashed), and maximum tensilestrain (thick black line, solid). Right: corre-sponding plot for RA unit p4b_13_00. Thethick black line indicates predictions ob-tained using relative change in area. B, left:response of SA1 unit p4b_25_01 as a func-tion of the amplitude of a punctate probeindented at the center of the receptive field.Observed response is shown in dark gray;error bars denote SE. Predicted responsesusing maximum tensile strain and relativechange in volume are shown as solid anddotted lines, respectively. Right: correspond-ing plot for RA unit p4b_19_01. Solid anddotted lines indicate relative change in areaand relative change in volume, respectively.Both strain energy density and relativechange in volume were quadratic functionsof probe amplitude. C, left: responses of SA1unit p4b_11_00 to indented annuli of in-creasing radius. Afferent response is shownin dark gray; error bars denote SE. Predictedresponses: thick black, maximum tensilestrain; gray crosses, vertical strain; gray cir-cles, mean strain; gray diamonds, verticalstress. Right: responses of RA unitp4b_19_01 to indented annuli (dark graywith error bars), with predicted responsesusing relative change in area (black), verticalstrain (crosses), mean strain (circles), verti-cal stress (diamonds).
3860 A. P. SRIPATI, S. J. BENSMAIA, AND K. O. JOHNSON
J Neurophysiol • VOL 95 • JUNE 2006 • www.jn.org
on June 22, 2006 jn.physiology.org
Dow
nloaded from
Response to annuli of increasing radius
When the radius of an annulus is increased, the verticalstress and strain at its center decrease rapidly. On the otherhand, tensile and compressive components of strain are af-fected by both vertical and horizontal forces and tend todecrease less rapidly (Fig. 9C). Overall, we found that afferentresponses to annuli of varying radius were matched poorly bypredictions from vertical strain and stress as well as from meanstrain.
Thus 10 of 15 candidate variables were regarded as lesslikely to drive mechanotransduction. The remaining six vari-ables were: maximum compressive strain and stress, maximumdeformative strain and stress, maximum tensile strain, andrelative change in receptor area. These six variables yieldedreliable and very similar predictions of afferent responses tothe stimuli. However, we found slight but consistent differ-ences in their performance. These differences, albeit statisti-cally significant, were present only in the third significant digitof the correlations. Relative change in area more closelymatched RA afferent responses than the remaining five vari-ables (correlation � 0.94; paired t-test on Fisher-transformedcorrelations, P 0.05). For SA1 afferents, maximum tensilestrain performed better overall than the other five variables, butthis difference was significant only for oriented bars (correla-tion � 0.9; paired t-test on Fisher-transformed correlations,P 0.05). Previous studies have also reported comparablyclose correspondence between predictions derived from pairsof candidate variables (Phillips and Johnson 1981b; Srinivasanand Dandekar 1996). Nonetheless, we favor the hypothesesthat maximum tensile strain drives SA1 mechanotransductionand that change in receptor surface area drives RA transduc-tion. Of all the candidate variables, these two quantities aremost closely associated with the local stretch experienced bythe receptor. Further work will be required to conclusivelydisambiguate the predictions yielded by the six hypotheses thatcould not be eliminated outright. Importantly, however, themodel, using any of the above six hypotheses, provides anaccurate working description of the peripheral representationof tactile spatial patterns.
D I S C U S S I O N
In vision, audition, and touch, an external stimulus is trans-formed into an intermediate signal, the proximal stimulus,which impinges on a receptor sheet at the sensory periphery.Whereas it is reasonably well characterized in vision andaudition, this transformation has received considerably lessattention in the tactile modality, in part because it is difficult toobserve. In fact, a consensus has not been reached as to thenature of the proximal stimulus in touch, i.e., the physicalquantity transduced by mechanoreceptors (Dandekar and Srini-vasan 1997; Del Prete et al. 2003; Ge and Khalsa 2002; Khalsaet al. 1996, 1997; Phillips and Johnson 1981b; Srinivasan andDandekar 1996). In the present study, we develop a generalframework characterizing the spatial component of the trans-formation from distal to proximal stimulus. Within this frame-work, we generate and evaluate hypotheses regarding thenature of the proximal stimulus. The resulting model is directlyapplicable to any tactile stimulus whose spatial properties do
not vary over time (see following text). In addition to being atheoretical tool, the model can also be used to characterize theperipheral representation of an arbitrary spatial stimulus in-dented into the skin. This reconstructed representation can thenbe used to understand subsequent cortical processing or psy-chophysical judgments without having to collect relevant pe-ripheral data.
The framework presented in this study builds on previouswork by Phillips and Johnson (1981b) in several ways. First,our model is applicable to any static tactile stimulus, whereasits predecessor only predicts responses to stimuli the profiles ofwhich varied along one dimension (i.e., gratings). Second, wedeveloped an algorithm that identifies stimulus elements thatcontact the skin and excludes elements that do not from thecomputation of equivalent forces. The contact-detection algo-rithm does not affect force computations for stimuli such assquare-wave gratings with all-or-none modulations but plays acritical role for more spatially complex stimuli. Finally, theframework allowed us to systematically evaluate 15 physicalvariables hypothesized to drive mechanotransduction.
The 15 candidate variables included previously proposedquantities as well as others that we deemed physiologicallyplausible. By comparing the predictions with the data, weeliminated maximum horizontal strain, maximum horizontalstress, vertical strain, vertical stress, maximum tensile stress,strain energy density, change in receptor volume, and thedeterminants of stress and strain. The remaining six candidatevariables yielded comparable predictions of SA1 and RAresponses to a wide range of stimuli; we cannot rule outrelative change in receptor area, maximum compressive strainand stress, and maximum deformative strain and stress. Nev-ertheless, using only five parameters derived from responses toa subset of stimuli (the 200 indented spheres), the resultingmodel was able to account for each afferent’s responses to all1,092 stimuli presented in this study with a high degree ofaccuracy.
One constraint on the stimuli was that the probe array wascapable of delivering only forces normal to the surface of theskin. Consequently, all receptor deformations, whether com-pressive or tensile, were produced by normal (i.e., compres-sive) forces. Thus tensile and compressive components ofstress and strain were highly (though not perfectly) correlatedand may be distinguished more efficaciously by independentlymanipulating the tangential and normal forces acting on theskin. The present framework can be used as an analytical basisfor further investigations of the stimulus quantity that drivestransduction. To that end, the stress and strain produced by atangential force must be incorporated into the present model.Such an extension of the model is important in itself, becausethe skin experiences both tangential and normal forces duringscanning, the most common mode of tactile exploration.
In the present study, we tentatively conclude that maximumtensile strain likely drives SA1 mechanotransduction, whereaschanges in receptor surface area drive RA transduction. Dif-ferences in the SA1 and RA receptor organs and their couplingwith surrounding tissues may explain why SA1 and RA fibersare driven by different physical quantities (Johnson 2001).However, both of these quantities are closely related to thestretch experienced by the receptor membrane, which has beenshown in biophysical studies to underlie mechanosensitive ion
3861A MODEL OF AFFERENT RESPONSES TO SPATIAL PATTERNS
J Neurophysiol • VOL 95 • JUNE 2006 • www.jn.org
on June 22, 2006 jn.physiology.org
Dow
nloaded from

channel activation (Sukharev and Corey 2004). On the otherhand, although SA1 afferents respond to skin stretch, they doso only weakly (Hulliger et al. 1979). The relationship betweenreceptor membrane stretch and skin stretch is an empiricalquestion and remains to be adequately characterized.
SA1 and RA fibers exhibit different spatiotemporal responseproperties and terminate in anatomically distinct structures.SA1 fibers have small receptive fields and produce a sustainedresponse to a step indentation, whereas RA fibers have largerreceptive fields and produce a transient response at the onsetand offset of an indentation (Johnson 2001; Talbot et al. 1968).SA1 afferents terminate in Merkel cells, whereas RA afferentsterminate in Meissner corpuscles (Johnson 2001). While Mer-kel cells enfold the nerve ending, Meissner corpuscles consistof encapsulated, vertically stacked discoid nerve endings(Johnson 2001; Takahashi-Iwanaga and Shimoda 2003). Themechanical filtering effected by these structures is thought tocontribute to the temporal response properties of the twoafferent types (Grigg 1986; Johnson 2001). Differences in thetemporal response properties of SA1 and RA fibers do notimply that transduction in their respective receptors is drivenby different physical quantities. Indeed, we hypothesize thatthe two types of receptor transduce different temporal featuresof the same physical quantity, i.e., stretch of the receptormembrane. RA afferents may respond to the rate at which themembrane is stretched, whereas SA1 fibers directly respond tomembrane stretch. Because velocity is proportional to positionfor indented stimuli, sensitivity to membrane stretch or to itsderivative yield identical predictions. Testing this hypothesiswill require analyzing responses to stimuli the position andvelocity of which can be independently manipulated.
The best-fitting depths obtained for SA1 fibers were shal-lower than for their RA counterparts, consistent with the higherspatial selectivity of SA1 relative to RA fibers. As mentionedearlier, the spatial modulation of strain and stress decreaseswith increasing receptor depth (Fig. 2). Figure 9A illustrates thedifference in spatial filtering of SA1 and RA responses: SA1responses exhibit much greater edge enhancement than RAresponses (Phillips and Johnson 1981b). The fitted receptordepths, however, are incompatible with the relative anatomicallocations of Merkel cells and Meissner corpuscles: Merkelcells in the monkey are located at the bottom of the dermalpapillae, roughly 0.6 mm below the surface, whereas Meissnercorpuscles can be found at the tips of the papillary ridges nearthe surface of the skin, (i.e., �0.4 mm deep). On the otherhand, RA afferents branch more widely than SA1 afferents(Pare et al. 2002), which increases the degree of spatial filteringof their responses. Furthermore, the measured receptive fieldsize tends to be larger and grow more rapidly with indentationamplitude for RA than for SA1 fibers. Because RA fibersbranch widely, punctate probe indentations tend to recruit alarger number of receptors compared with SA1 fibers, espe-cially with larger indentations (Vega-Bermudez and Johnson1999a). The model achieves these effects by driving the RAreceptors deeper relative to their SA1 counterparts. This effectcan be counteracted by assuming that each afferent receivesinput from more than one receptor.
Another manifestation of afferent branching is the ellipticityin the receptive fields mapped using punctate probes (Vega-Bermudez and Johnson 1999a). Nearly half of the neurons of
both types exhibited elliptical receptive fields. We found this tobe the largest systematic deviation between the model and thedata: a single point receptor predicts a circular map because ofits inherent symmetry. We extended the model to include twopoint receptors at the same depth, assuming the response to bea weighted sum of the strain experienced by the two. A modelthat incorporates multiple receptors will yield more physiolog-ically plausible depths, particularly for RA fibers in whichwidespread branching occurs (Pare et al. 2002). Furthermore,the evidence suggests that signal integration across receptors isnot linear but rather winner-take-all (Phillips and Johnson1981b). Indeed, when we modified the dual receptor model sothat the afferent response was determined by the maximumactivation across the two receptors, the fit improved beyondthat of the linear summation model. The dual-receptor model,illustrated in Fig. 10B for one unit of each type, yieldedconsiderably better fits and shallower depths, particularly forRA fibers (mean fitted depths: single receptor, SA1, 0.70 mm;RA, 1.23 mm; dual receptor, SA1, 0.44 mm; RA, 0.73 mm).
Within the proposed framework, the skin is assumed to behomogeneous, isotropic, linearly elastic, and infinite in extentfrom the point of view of the receptor. In fact, at least three ofthese assumptions are violated; the skin is finite, multi-layeredand anisotropic (Lanir 1987; Quilliam 1978). This heterogene-ity and the presence of surrounding structures such as nail andbone have been suggested to play a role in shaping afferentresponses (Dandekar and Srinivasan 1995; Dandekar et al.2003; Srinivasan and Dandekar 1992; Wu et al. 2004). How-ever, the remarkable ability of the model to predict neuralresponses to a wide variety of stimuli suggests that the under-lying idealized assumptions constitute a reasonable first ap-proximation (Phillips and Johnson 1981b). We also madeseveral assumptions, motivated by extant neurophysiologicalfindings, about the transduction process. First, the responsewas assumed to be proportional to the underlying physicalvariable, a reasonable assumption given that afferent responsesare proportional to stimulus amplitude (Mountcastle et al.1966). Second, stimuli were specified as deviations from thebaseline indentation because afferent responses have beenshown to be invariant with respect to baseline amplitude(Vega-Bermudez and Johnson 1999b).
The model described in the present study predicts afferentresponses to static spatial patterns. The question remainswhether the same model can make useful predictions aboutafferent responses to dynamic patterns. In a recent study(Bensmaia et al. 2005a), we measured the spatial modulation inafferent responses to static and vibrating gratings and foundthat, although the magnitude of the response varied withvibratory frequency, its spatial profile did not. The indepen-dence of spatial modulation from vibratory frequency suggeststhat the encoding of the spatial and temporal properties of thestimulus can be studied independently. The model may thus beable to account for how the spatial properties of a stimulusshape the afferent response, even though it lacks a dynamiccomponent. We can assess the extent to which the mean ratemodel described in this study predicts the afferent response toa dynamic stimulus by computing model predictions of theresponses to a dynamic stimulus approximated as a series ofstatic stimuli. Figure 11 illustrates the response of an SA1 andan RA unit to a scanned bar and to a spatiotemporal random dot
3862 A. P. SRIPATI, S. J. BENSMAIA, AND K. O. JOHNSON
J Neurophysiol • VOL 95 • JUNE 2006 • www.jn.org
on June 22, 2006 jn.physiology.org
Dow
nloaded from

sequence, together with model predictions. The coarse struc-ture of the response is captured well by the model: the afferenttends to produce an action potential whenever the predictedfiring rate is high.
The model in its present form cannot predict the highlyrepeatable timing of evoked action potentials (Freeman andJohnson 1982a,b; Johansson and Birznieks 2004; Talbot et al.1968; Whitsel et al. 2000). To capture these properties ofafferent responses, biophysical properties of the receptor/affer-ent complex, such as the mechanisms of action potentialgeneration, absolute and relative refractoriness, must be incor-porated into the model. Furthermore evidence suggests that the
physical quantity transduced by the receptor undergoes tem-poral filtering: for instance, both afferents are sensitive tostimulus frequency and perhaps velocity (Freeman and John-son 1982a; Johansson et al. 1982) and RA fibers exhibit acharacteristic off-response when an indented stimulus is with-drawn. The dynamic response properties of mechanoreceptiveafferents have traditionally been modeled independently oftheir spatial properties (Bensmaia 2002; Freeman and Johnson1982a; Slavik and Bell 1995). Although much progress hasbeen made in understanding afferent responses to sinusoidalvibrations, no general framework exists to understand theirresponses to complex dynamic stimuli. Once such a frameworkis developed, the spatial and temporal models may be com-bined to achieve a more complete quantitative understanding ofthe peripheral neural representation.
FIG. 11. Prediction of responses to dynamic stimuli in an SA1 unit(p4b_03_00) and in an RA unit (p4b_06_03). In each plot, the top panelillustrates afferent fiber responses to random probe indentations. Tick marksindicate spike times evoked by the stimulus over 3 repetitions. Model predic-tions using maximum tensile strain are shown in black. The black outline ineach stimulus frame indicates the neuron’s receptive field boundary, and theblack dot is the afferent hotspot. The bottom panel in each plot illustrates theobserved (ticks) and predicted (black) responses for a bar scanned from left toright across the fingerpad at a velocity of 40 mm/s. Sample stimulus frames areshown in both top and bottom. In the random probe indentation stimulus, eachprobe in the array indented the receptive field independently according to aPoisson process with rate of 5 indentations/s. Each probe indentation lasted�30 ms.
FIG. 10. A: differences in edge sensitivity in SA1 and RA afferents. Top:responses of SA1 unit p4b_11_00 (gray) to a square-wave grating of period 20mm stepped across the receptive field. Error bars denote SE. Model predictionsusing maximum tensile strain are shown in black. Bottom: responses of RAunit p4b_06_03 (gray) together with corresponding model predictions usingrelative change in receptor surface area (black). The light gray lines indicatethe position of the grating at the afferent hotspots. B: illustration of thenonlinear dual receptor model for SA1 unit p4b_25_01 (top) and RA unitp4b_06_03 (bottom). The response was taken to be proportional to themaximum of the strains experienced by the 2 receptors. Left: Observedpunctate probe response map. The grayscale values on the left indicate theresponse magnitude in spikes/s. Middle: predicted response map using singlereceptor model. Fitted depths: SA1 unit, 0.76 mm; RA unit, 1.49 mm. Right:predicted response map using the “max” dual receptor model. Fitted depths:SA1 unit, 0.60 mm; RA unit, 1.14 mm.
3863A MODEL OF AFFERENT RESPONSES TO SPATIAL PATTERNS
J Neurophysiol • VOL 95 • JUNE 2006 • www.jn.org
on June 22, 2006 jn.physiology.org
Dow
nloaded from
A C K N O W L E D G M E N T S
We thank P. Denchev for assistance with data collection and for helpfulsuggestions. J. Killebrew and F. Dammann provided invaluable technicalsupport. We also thank R. Raghupathy and A. Andreou for discussions duringthe development of the model.
Present address of A. P. Sripati: Center for Neural Basis of Cognition,Carnegie Mellon University, Pittsburgh, PA 15232.
G R A N T S
This work was supported by National Institute of Neurological Disordersand Stroke Grants NS-38034 and NS-18787.
R E F E R E N C E S
Bensmaia SJ. A transduction model of the Meissner corpuscle. Math Biosci176: 203–217, 2002.
Bensmaia SJ, Craig JC, Yoshioka T, and Johnson KO. SA1 and RAafferent responses to static and vibrating gratings. J Neurophysiol 95:1771–1782, 2006.
Bensmaia SJ, Leung YY, Hsiao SS, and Johnson KO. Vibratory adaptationof cutaneous mechanoreceptive afferents. J Neurophysiol 94: 3023–3036,2005.
Dandekar K, Raju BI, and Srinivasan MA. 3-D finite-element models ofhuman and monkey fingertips to investigate the mechanics of tactile sense.J Biomech Eng 125: 682–691, 2003.
Dandekar K and Srinivasan MA. A 3 dimensional finite element model ofthe monkey fingertip for predicting responses of slowly adapting mechano-receptors. ASME Bioengin Conf BED 29: 257–258, 1995.
Dandekar K and Srinivasan MA. Role of Mechanics in Tactile Sensing ofShape. Cambridge, MA, MIT Press, 1997.
Del Prete Z, Baker SP, and Grigg P. Stretch responses of cutaneous RAafferent neurons in mouse hairy skin. J Neurophysiol 89: 1649–1659, 2003.
Diamond J, Gray JAB, and Sato M. The site of initiation of impulses inPacinian corpuscles. J Physiol 133: 54–67, 1956.
DiCarlo JJ, Johnson KO, and Hsiao SS. Structure of receptive fields in area3b of primary somatosensory cortex in the alert monkey. J Neurosci 18:2626–2645, 1998.
Freeman AW and Johnson KO. A model accounting for effects of vibratoryamplitude on responses of cutaneous mechanoreceptors in macaque mon-key. J Physiol 323: 43–64, 1982a.
Freeman AW and Johnson KO. Cutaneous mechanoreceptors in macaquemonkey: temporal discharge patterns evoked by vibration, and a receptormodel. J Physiol 323: 21–41, 1982b.
Ge W and Khalsa PS. Encoding of compressive stress during indentation byslowly adapting type I mechanoreceptors in rat hairy skin. J Neurophysiol87: 1686–1693, 2002.
Gray JAB and Malcolm JL. The initiation of nerve impulses by mesentericPacinian corpuscles. Proc R Soc Lond B Biol Sci 137: 96–114, 1950.
Gray JAB and Matthews PBC. A comparison of the adaptation of thePacinian corpuscle with accommodation of its own axon. J Physiol 114:454–464, 1951.
Grigg P. Biophysical studies of mechanoreceptors. J Appl Physiol 60: 1107–1115, 1986.
Hulliger M, Nordh E, Thelin AE, and Vallbo ÅB. The responses of afferentfibers from the glabrous skin of the hand during voluntary finger movementsin man. J Physiol 291: 233–249, 1979.
Johansson RS and Birznieks I. First spikes in ensembles of human tactileafferents code complex spatial fingertip events. Nat Neurosci 7: 170–177,2004.
Johansson RS, Landstrom U, and Lundstrom R. Responses of mechano-receptive afferent units in the glabrous skin of the human hand to sinusoidalskin displacements. Brain Res 244: 17–25, 1982.
Johnson KO. The roles and functions of cutaneous mechanoreceptors. CurrOpin Neurobiol 11: 455–461, 2001.
Khalsa PS, Hoffman AH, and Grigg P. Mechanical states encoded bystretch-sensitive neurons in feline joint capsule. J Neurophysiol 76: 175–187, 1996.
Khalsa PS, LaMotte RH, and Grigg P. Tensile and compressive responses ofnociceptors in rat hairy skin. J Neurophysiol 78: 492–505, 1997.
Knibestol M. Stimulus-response functions of rapidly adapting mechanorecep-tors in the human glabrous skin area. J Physiol 232: 427–452, 1973.
Lanir Y. Skin mechanics. In: Handbook of Engineering, edited by Skalak Rand Chien S. New York: McGraw Hill, 1987.
Loewenstein WR and Cohen S. I. After-effects of repetitive activity in anerve ending. J Gen Physiol 43: 335–345, 1959a.
Loewenstein WR and Cohen S. II. Post-tetanic potentiation and depression ofgenerator potential in a single non-myelinated nerve ending. J Gen Physiol43: 347–376, 1959b.
Loewenstein WR and Rathkamp R. The sites for mechano-electric conver-sion in a Pacinian corpuscle. J Gen Physiol 411: 1245–1265, 1958.
Loewenstein WR and Skalak R. Mechanical transmission in a Paciniancorpuscle. An analysis and a theory. J Physiol 182: 346–378, 1966.
Mountcastle VB, Talbot WH, and Kornhuber HH. The neural transforma-tion of mechanical stimuli delivered to the monkey’s hand. In: Touch, Heat,Pain and Itch, edited by de Reuck AV and Knight J. London: Churchill,1966, p. 325–351.
Ogawa H. The Merkel cell as a possible mechanoreceptor cell. Prog Neuro-biol 49: 317–334, 1996.
Pare M, Smith AM, and Rice FL. Distribution and terminal arborizations ofcutaneous mechanoreceptors in the glabrous finger pads of the monkey.J Comp Neurol 445: 347–359, 2002.
Phillips JR and Johnson KO. Tactile spatial resolution. II. Neural represen-tation of bars, edges, and gratings in monkey primary afferents. J Neuro-physiol 46: 1192–1203, 1981a.
Phillips JR and Johnson KO. Tactile spatial resolution. III. A continuummechanics model of skin predicting mechanoreceptor responses to bars,edges, and gratings. J Neurophysiol 46: 1204–1225, 1981b.
Quilliam TA. The structure of finger print skin. In: Active Touch, edited byGordon G. Oxford: Pergamon, 1978, p. 1–18.
Slavik P and Bell J. A mechanoreceptor model for rapidly and slowlyadapting afferents subjected to periodic vibratory stimuli. Math Biosci 130:1–23, 1995.
Srinivasan MA. Surface deflection of primate fingertip under line load.J Biomech 22: 343–349, 1989.
Srinivasan MA and Dandekar K. Role of fingertip geometry in the trans-mission of tactile mechanical signals. Adv Bioeng 22: 569–572, 1992.
Srinivasan MA and Dandekar K. An investigation of the mechanics of tactilesense using two-dimensional models of the primate fingertip. J Biomech Eng118: 48–55, 1996.
Sukharev S and Corey DP. Mechanosensitive channels: multiplicity offamilies and gating paradigms. Sci STKE \?\2004: re4, 2004.
Takahashi-Iwanaga H and Shimoda H. The three-dimensional microanat-omy of Meissner corpuscles in monkey palmar skin. J Neurocytol 32:363–371, 2003.
Talbot WH, Darian-Smith I, Kornhuber HH, and Mountcastle VB. Thesense of flutter-vibration: comparison of the human capacity with responsepatterns of mechanoreceptive afferents from the monkey hand. J Neuro-physiol 31: 301–334, 1968.
Timoshenko S and Goodier JN. Theory of Elasticity. Tokyo: McGraw-HillKogakusha, 1970.
Vega-Bermudez F and Johnson KO. SA1 and RA receptive fields, responsevariability, and population responses mapped with a probe array. J Neuro-physiol 81: 2701–2710, 1999a.
Vega-Bermudez F and Johnson KO. Surround suppression in the responsesof primate SA1 and RA mechanoreceptive afferents mapped with a probearray. J Neurophysiol 81: 2711–2719, 1999b.
Whitsel BL, Kelly EF, Delemos KA, Xu M, and Quibrera PM. Stability ofrapidly adapting afferent entrainment vs responsivity. Somatosens Mot Res17: 13–31, 2000.
Wu JZ, Dong RG, Rakheja S, Schopper AW, and Smutz WP. A structuralfingertip model for simulating of the biomechanics of tactile sensation. MedEng Phys 26: 165–175, 2004.
3864 A. P. SRIPATI, S. J. BENSMAIA, AND K. O. JOHNSON
J Neurophysiol • VOL 95 • JUNE 2006 • www.jn.org
on June 22, 2006 jn.physiology.org
Dow
nloaded from