Embed Size (px)
Citation preview

Copyright is owned by the Author of the thesis. Permission is given for a copy to be downloaded by an individual for the purpose of research and private study only. The thesis may not be reproduced elsewhere without the permission of the Author.

A CONCEPTUAL FRAMEWORK FOR
STARTING THE BUSINESS EXCELLENCE (BE) JOURNEY
IN NEW ZEALAND SERVICE ORGANISATIONS
A dissertation submitted in partial fulfilment of the requirements for
the degree of
QOCTOR OF PHILOSOPHY
in
Technology and Management
at Massey University, Palmerston North,
New Zealand
Joanna lnnes
2005

Copyright © 2005 by Joanna R Innes
All rights reserved
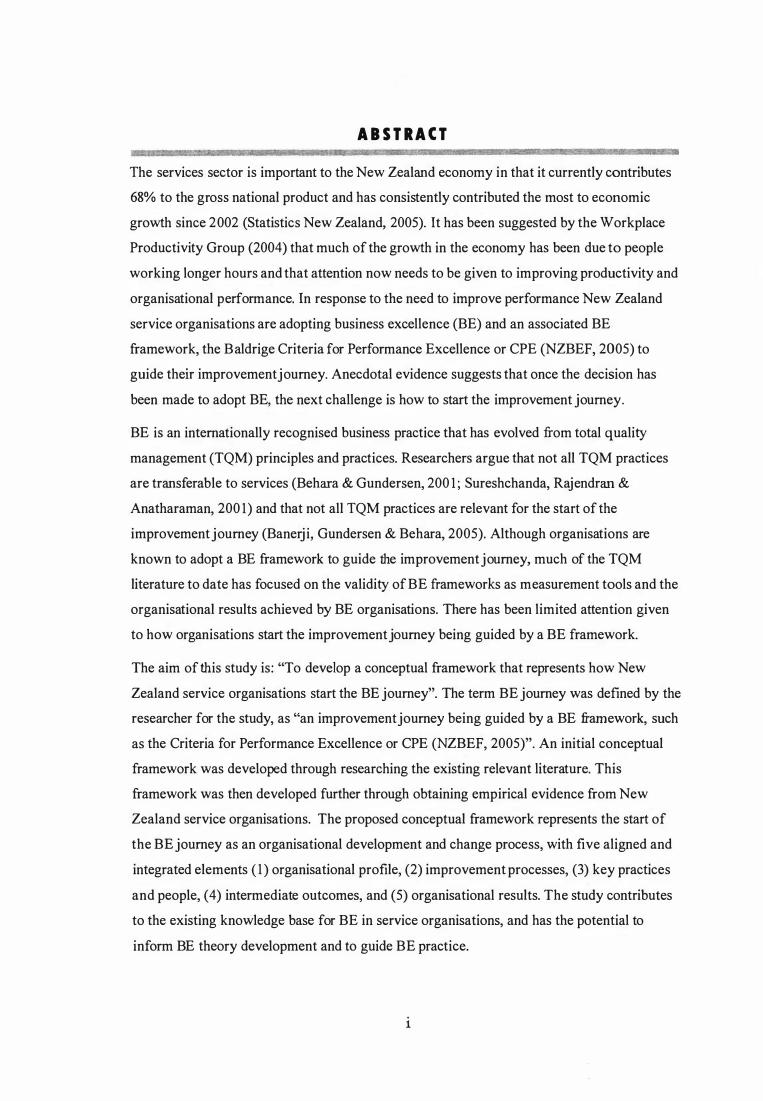
ABSTRACT
The services sector is important to the New Zealand economy in that it currently contributes
68% to the gross national product and has consistently contributed the most to economic
growth since 2002 (Statistics New Zealand, 2005). It has been suggested by the Workplace
Productivity Group (2004) that much of the growth in the economy has been due to people
working longer hours and that attention now needs to be given to improving productivity and
organisational performance. In response to the need to improve performance New Zealand
service organisations are adopting business excellence (BE) and an associated BE
framework, the Baldrige Criteria for Performance Excellence or CPE (NZBEF, 2005) to
guide their improvement journey. Anecdotal evidence suggests that once the decision has
been made to adopt BE, the next challenge is how to start the improvement journey.
BE is an internationally recognised business practice that has evolved from total quality
management (TQM) principles and practices. Researchers argue that not all TQM practices
are transferable to services (Behara & Gundersen, 200 1 ; Sureshchanda, Rajendran &
Anatharaman, 200 1) and that not all TQM practices are relevant for the start of the
improvement journey (Banerji, Gundersen & Behara, 2005). Although organisations are
known to adopt a BE framework to guide the improvement journey, much of the TQM
literature to date has focused on the validity of BE frameworks as measurement tools and the
organisational results achieved by BE organisations. There has been limited attention given
to how organisations start the improvement journey being guided by a BE framework.
The aim of this study is: "To develop a conceptual framework that represents how New
Zealand service organisations start the BE journey". The term BE journey was defined by the
researcher for the study, as "an improvement journey being guided by a BE framework, such
as the Criteria for Performance Excellence or CPE (NZBEF, 2005)". An initial conceptual
framework was developed through researching the existing relevant literature. This
framework was then developed further through obtaining empirical evidence from New
Zealand service organisations. The proposed conceptual framework represents the start of
the BE journey as an organisational development and change process, with five aligned and
integrated elements (1) organisational profile, (2) improvement processes, (3) key practices
and people, (4) intermediate outcomes, and (5) organisational results. The study contributes
to the existing knowledge base for BE in service organisations, and has the potential to
inform BE theory development and to guide BE practice.
1

11

ACKNOWL EDGEMENTS
liMit' &iiM
No one undertakes doctoral study and develops a thesis alone. The study and the thesis are
the product of many people's contributions; their insights and their ongoing support have
been invaluable. Thank you to all of you.
I would particularly like to acknowledge my research team. Dr Robin Mann, who as the
primary supervisor provided the business excellence (BE) perspective; and Associate
Professor Claire Massey who as second supervisor provided the business perspective and the
research design expertise. Both supervisors are from Massey University, New Zealand and
are responsible for research centres concerned with business research.
The study would not have been possible without the interest and co-operation of the case
organisations and their people, the survey respondents and the BE community within New
Zealand. I would particularly like to acknowledge the liaison people within the case
organisations - they brokered access to the organisations, co-ordinated my visits, sourced
documents for me and reviewed case reports.
A number of people provided technical support. Mike Lawrence provided computer support,
Pat Bazeley taught me how to use NVivo for qualitative analysis, and Dr Nigel Grigg
assisted with the design of the quantitative analysis and application of SPSS. Judy Lawrence
introduced me to ProCite, the bibliographical database used throughout the study.
In addition, the Centre for Organisational Excellence Research, Massey University (COER)
assisted with the financial costs associated with field work and attendance at academic
conferences. The New Zealand Business Excellence Foundation (NZBEF) assisted with
distribution of the survey to its members.
The acknowledgements would not be complete without mentioning the wider group of
people who supported me throughout the study. Colleagues from COER and my business
networks provided a valued sounding board as I explored new ideas. Dr Pat Sandbrook my
ever present mentor kept me going. The study and thesis would never have started, not to
mention be complete without the ongoing support and understanding of my husband and
three children.
ill

lV
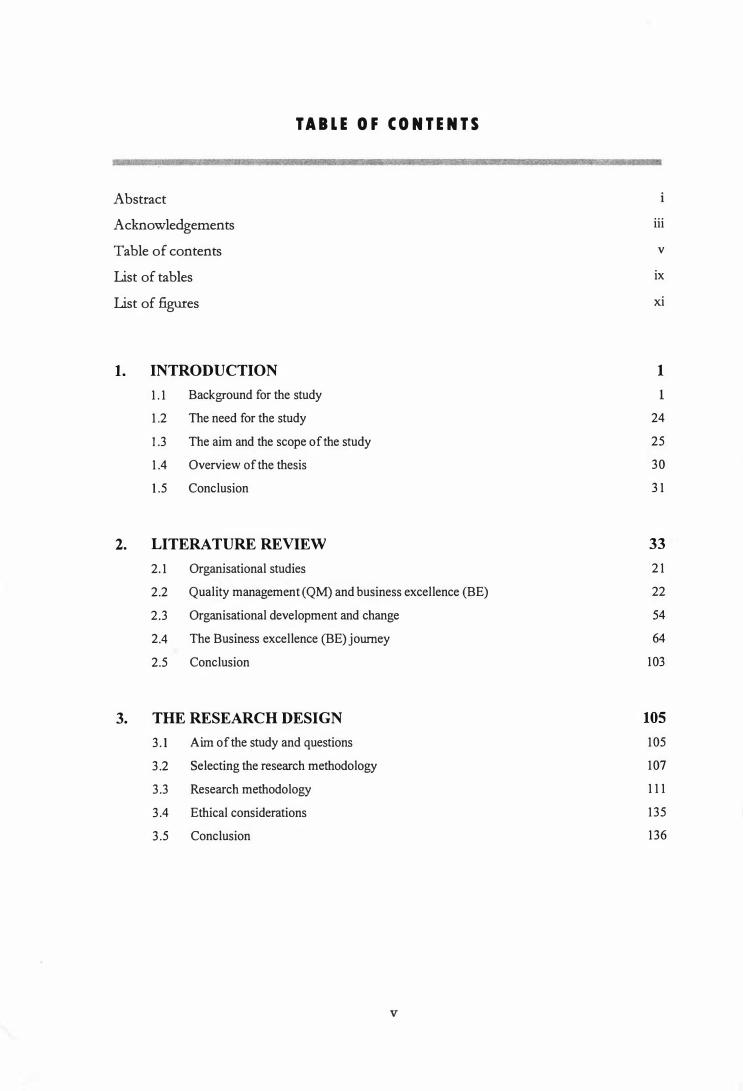
TABLE OF CONTENTS
Abstract Acknowledgements Table of contents List of tables List of figures
1. INTRODUCTION
1.1 Background for the study
1.2 The need for the study
1.3 The aim and the scope of the study
1.4 Overview of the thesis
1.5 Conclusion
2. LITERATURE REVIEW
2.1 Organisational studies
2.2 Quality management (QM) and business excellence (BE)
2.3 Organisational development and change
2.4 The Business excellence (BE) journey
2.5 Conclusion
3. THE RESEARCH DESIGN
3.1 Aim of the study and questions
3.2 Selecting the research methodology
3.3 Research methodology
3.4 Ethical considerations
3.5 Conclusion
v
il¥
iii
v
ix
xi
1
24
25
30
31
33 21
22
54
64
103
105
105
107
III 135
136

4. DESCRIBING THE BUSINESS EXCELLENCE JOURNEY: 137 WITHIN SEVEN SERVICE ORGANISATIONS
4.1 Organisation A: City Council 138
4.2 Organisation B: Information technology services company 144
4.3 Organisation C: Crown Research Institute 150
4.4 Organisation D: Group of technology companies 156
4.5 Organisation E: City Council 161
4.6 Organisation F: National defence organisation 169
4.7 Organisation G: Regional government organisation 177
4.8 Conclusion 184
5. ANALYSING THE BUSINESS EXCELLENCE JOURNEY: 185 ACROSS SEVEN SERVICE ORGANISATIONS
5.1 Organisational profIle 186
5.2 Innprovement processes 191
5.3 Practices and people 193
5.4 How practices and people influence the BE journey 200
5.5 Organisational results 207
5.6 Conclusion 211
6. ANALYSING THE BUSINESS EXCELLENCE JOURNEY: 217 USING DATA FROM THE SURVEY
6.1 Organisational profIle 217
6.2 Innprovement processes 225
6.3 Practices and people 227
6.4 Intermediate outcomes 241
6.5 Organisational results 246
6.6 Conclusion 254
V1
7.
8.
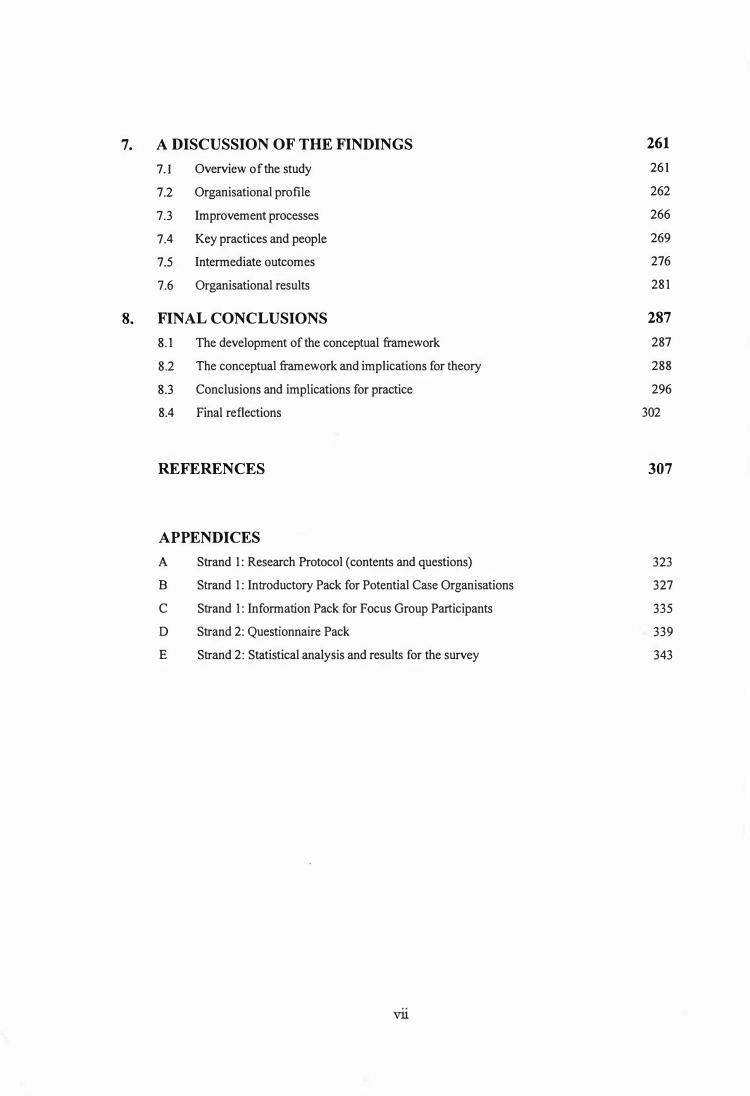
A DISCUSSION OF THE FINDINGS
7.1 Overview of the study
7.2 Organisational profile
7.3 Improvement processes
7.4 Key practices and people
7.5 Intermediate outcomes
7.6 Organisational results
FINAL CONCLUSIONS
8.1 The development of the conceptual framework
8.2 The conceptual framework and implications for theory
8.3 Conclusions and implications for practice
8.4 Final reflections
REFERENCES
APPENDICES
A
B
C
D
E
Strand 1: Research Protocol (contents and questions)
Strand 1: Introductory Pack for Potential Case Organisations
Strand 1: Information Pack for Focus Group Participants
Strand 2: Questionnaire Pack
Strand 2: Statistical analysis and results for the survey
vu
261
261
262
266
269
276
281
287 287
288
296
302
307
323
327
335
339
343

V111

Table 1.1:
Table 1.2:
Table 2.1:
Table 2.2:
Table 2.3:
Table 2.4:
Table 2.5:
Table 2.6:
Table 2.7:
Table 2.8:
Table 2.9:
Table 2.10:
Table 2.11:
Table 3.1:
Table 3.2:
Table 3.3:
Table 3.4:
Table 3.5:
Table 4.1:
Table 4.2:
Table 4.3:
Table 4.4:
Table 4.5:
Table 4.6:
Table 4.7:
Table 5.1:
Table 5.2:
Table 5.3:
Table 5.4:
LIST OF TABLES
Evolution of business excellence - key people or organisations and their contribution
TQM guiding principles, practices and techniques
Developments in organisational studies 1900 - 1960
Developments in organisational studies 1960 - 1990
CPE (NZBEF, 2005) core values and concepts mapped to the key philosophies ofDeming, Juran & Crosby
Summary of empirical research for BE in services
Summary of empirical research for QM in services
Factors within the Model of Organisational Performance and Change
Examples of processes associated with self-assessment
Summary ofQM or BE in services studies that identify key practices that enable the QM or BE journey
Summary of organisational measures applied in QM or BE in services studies
Summary of QM or BE in services studies that identify key practices that constrain the QM or BE journey
Summary of QM or BE in services studies that present evidence for a relationship between QM or BE and a change in organisational performance
Key characteristics of the pilot and the case organisations
The dependability test of quality as applied to the study
The credibility test of quality as applied to the study
The confirm ability test of quality as applied to the study
The transferability test of quality as applied to the study
Practices & people perceived to influence the BE journey (Organisation A)
Practices & people perceived to influence the BE journey (Organisation B)
Practices & people perceived to influence the BE journey (Organisation C)
Practices & people perceived to influence the BE journey (Organisation D)
Practices & people perceived to influence the BE journey (Organisation E)
Practices & people perceived to influence the BE journey (Organisation F)
Practices & people perceived to influence the BE journey (Organisation G)
Key characteristics of the 7 case organisations
Drivers perceived to influence the decision to start the BE j ourney
Practices & people perceived to influence the BE journey over time
Practices perceived to have significantly influenced the start of the BE journey
IX
7
8
35
37
42
46
50
63
75
79
84
91
100
120
122
123
124
125
140
147
152
158
164
171
180
187
189
195
199

Table 5.5:
Table 5.6:
Table 6.1:
Table 6.2:
Table 6.3:
Table 6.4:
Table 6.5:
Table 6.6:
Table 6.7:
Table 6.8:
Table 6.9:
Table 6.10:
Table 6.11:
Table 6.12:
Table 6.13:
Table 6.14:
Table 6.15:
Table 6.16:
Table 6.17:
Table 8.1:
Table 8.2:
Table 8.3:
Table 8.4:
Table 8.5:
People perceived to have significantly influences the start of the BE journey
Perceived change (improvement) in organisational performance over time
Descriptive analysis for key drivers perceived to influence the decision to start the BE journey
Level of significance for key drivers perceived to influence the decision to start the BE journey
Descriptive analysis for key drivers perceived to influence the decision to adopt the CPE
Level of significance for key drivers perceived to influence the decision to adopt the CPE
Cross tabulation for industry challenges and extent of influence
Cross tabulation for CEO's individual performance measures include BE and extent of influence
Cross tabulation for restructuring and extent of influence
Cross tabulation for prior experience of a quality initiative and extent of influence
Cross tabulation for staff are reluctant and extent of influence
Key practices & people perceived to influence the start of the BEjourney
Key practices & people mapped to the CPE system categories
Key practices & people mapped to the Model of Organisational Performance and Change
Relationship between key practices & people and change in organisational performance
Descriptive analysis for the perceived change in organisational performance
Level of significance for the perceived change in organisational performance
Descriptive analysis for the extent to which BE is perceived to have influenced the change dimensions
Level of significance for the extent to which BE is perceived to have influenced the change organisational performance
Element 1- Organisational proflle
Element 2 - Key improvement processes
Element 3 - Key practices and people
Element 4 - Intermediate outcomes
Element 5 - Organisational results
x
201
21 0
222
223
224
225
230
230
231
233
233
237
239
240
242
250
251
253
253
291
292
293
294
295
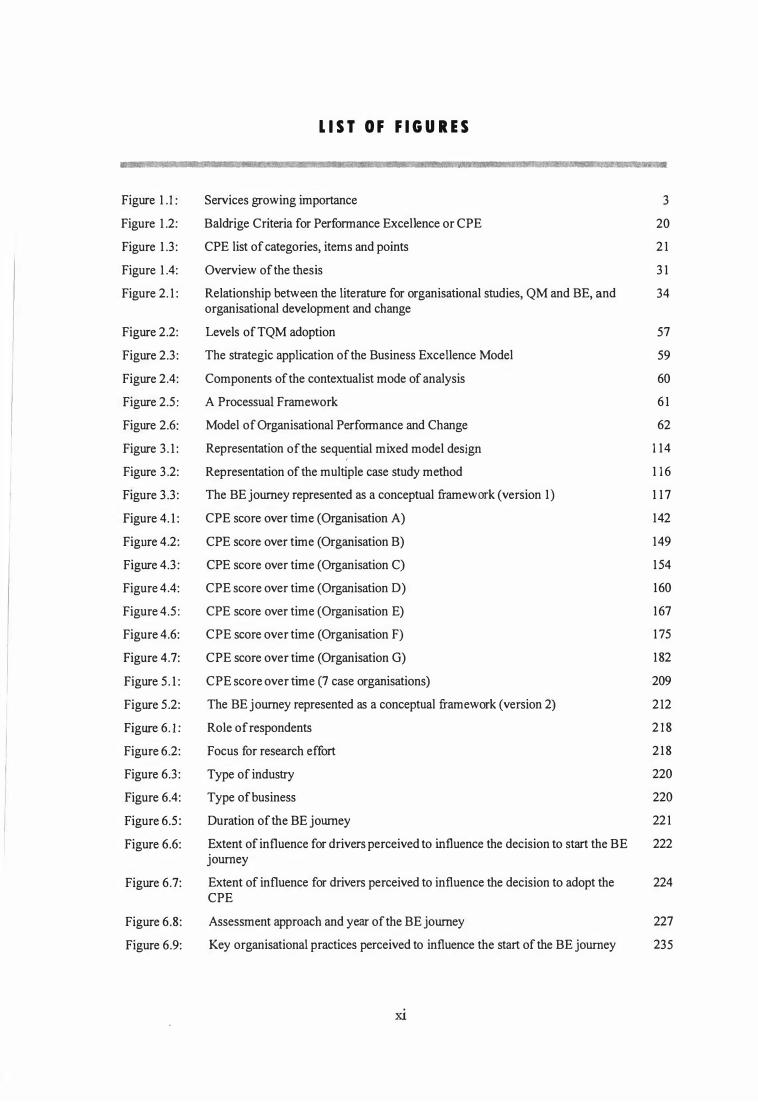
Figure 1.1:
Figure 1.2:
Figure 1.3:
Figure 1.4:
Figure 2.1:
Figure 2.2:
Figure 2.3:
Figure 2.4:
Figure 2.5:
Figure 2.6:
Figure 3.1:
Figure 3.2:
Figure 3.3:
Figure 4.1:
Figure 4.2:
Figure 4.3:
Figure 4.4:
Figure 4.5:
Figure 4.6:
Figure 4.7:
Figure 5.1:
Figure 5.2:
Figure 6.l:
Figure 6.2:
Figure 6.3:
Figure 6.4:
Figure 6.5:
Figure 6.6:
Figure 6.7:
Figure 6.8:
Figure 6.9:
LIST OF FIGURES
Services growing importance
Baldrige Criteria for Performance Excellence or CPE
CPE list of categories, items and points
Overview of the thesis
Relationship between the literature for organisational studies, QM and BE, and organisational development and change
Levels of TQM adoption
The strategic application of the Business Excellence Model
Components of the contextualist mode of analysis
A ProcessuaI Framework
Model of Organisational Performance and Change
Representation of the sequential mixed model design , Representation of the multiple case study method
The BE journey represented as a conceptual framework (version 1) CPE score over time (Organisation A)
CPE score over time (Organisation B)
CPE score over time (Organisation C)
CPE score over time (Organisation D)
CPE score over time (Organisation E)
CPE score over time (Organisation F)
CPE score over time (Organisation G)
CPE score over time (7 case organisations)
The BE journey represented as a conceptual framework (version 2) Role of respondents
Focus for research effort
Type of industry
Type of business
Duration of the BE journey
Extent of influence for drivers perceived to influence the decision to start the BE journey
Extent of influence for drivers perceived to influence the decision to adopt the CPE
Assessment approach and year of the BE journey
Key organisational practices perceived to influence the start of the BE journey
Xl
3
20
21
31
34
57
59
60
61
62
114
116
117
142
149
154
160
167
175
182
209
212
2 18
218
220
220
221
222
224
227
235

Figure 6.10: Key BE practices perceived to influence the start of the BE journey 235
Figure 6.11: Key organisational people perceived to influence the start of the BE journey 236
Figure 6.12: Key BE people perceived to influence the start of the BE journey 236
Figure 6.13: Change in CPE scores over time 248
Figure 6.14: Perceived change in organisational perfonnance 250
Figure 6.15: The extent to which BE is perceived to influence the change in organisational 252 perfonnance
Figure 6.16: The BE journey represented as a conceptual framework (version 3) 257
Figure 8.1: The BE journey represented as a conceptual framework (version 3) 289
xu