Embed Size (px)
Citation preview
Geomorphology 105 (2009) 28–38
Contents lists available at ScienceDirect
Geomorphology
j ourna l homepage: www.e lsev ie r.com/ locate /geomorph
A conceptual framework for dryland aeolian sediment transport along thegrassland–forest continuum: Effects of woody plant canopy cover and disturbance
David D. Breshears a,b,c,⁎, Jeffrey J. Whicker d, Chris B. Zou a, Jason P. Field a, Craig D. Allen e
a School of Natural Resources, University of Arizona, Tucson, AZ 85721-0043 USAb Institute for the Study of Planet Earth, University of Arizona, Tucson, AZ 85721-0043 USAc Department of Ecology and Evolutionary Biology, University of Arizona, Tucson, AZ 85721-0043 USAd Health Physics Measurements Group, Los Alamos National Laboratory, Los Alamos, NM 87545 USAe USGS Jemez Mountains Field Station, Los Alamos, NM 87544 USA
⁎ Corresponding author. School of Natural Resources,AZ 85721-0043 USA. Tel.: +1 520 621 7259; fax: +1 520
E-mail address: [email protected] (D.D. Bres
0169-555X/$ – see front matter © 2008 Elsevier B.V. Aldoi:10.1016/j.geomorph.2007.12.018
A B S T R A C T
A R T I C L E I N F OArticle history:
Aeolian processes are of part Accepted 12 December 2007Available online 20 June 2008Keywords:Aeolian sediment transportDustWind erosionShrublandWoodlandBSNE
icular importance in dryland ecosystems where ground cover is inherently sparsebecause of limited precipitation. Dryland ecosystems include grassland, shrubland, savanna, woodland, andforest, and can be viewed collectively as a continuum of woody plant cover spanning from grasslands with nowoody plant cover up to forests with nearly complete woody plant cover. Along this continuum, the spacingand shape of woody plants determine the spatial density of roughness elements, which directly affects aeoliansediment transport. Despite the extensiveness of dryland ecosystems, studies of aeolian sediment transporthave generally focused on agricultural fields, deserts, or highly disturbed sites where rates of transport arelikely to be greatest. Until recently, few measurements have been made of aeolian sediment transport overmultiple wind events and across a variety of types of dryland ecosystems. To evaluate potential trends inaeolian sediment transport as a function of woody plant cover, estimates of aeolian sediment transport fromrecently published studies, in concert with rates from four additional locations (two grassland and twowoodland sites), are reported here. The synthesis of these reports leads to the development of a newconceptualframework for aeolian sediment transport in dryland ecosystems along the grassland–forest continuum.The findings suggest that: (1) for relatively undisturbed ecosystems, shrublands have inherently greateraeolian sediment transport because of wake interference flow associated with intermediate levels of densityand spacing ofwoody plants; and (2) for disturbed ecosystems, the upper bound for aeolian sediment transportdecreases as a function of increasing amounts of woody plant cover because of the effects of the height anddensity of the canopy on airflow patterns and ground cover associated with woody plant cover. Consequently,aeolian sediment transport following disturbance spans the largest range of rates in grasslands and associatedsystems with no woody plants (e.g., agricultural fields), an intermediate range in shrublands, and a relativelysmall range in woodlands and forests. These trends are consistent with previous observations relating largerates of wind erosion to intermediate values for spatial density of roughness elements. The framework foraeolian sediment transport, which is also relevant to dust fluxes, wind erosion, and related aeolian processes, isapplicable to a diverse suite of environmental challenges, including land degradation and desertification, duststorms, contaminant transport, and alterations of the hydrological cycle.
© 2008 Elsevier B.V. All rights reserved.
1. Introduction
Dryland ecosystems cover a substantial portion of the terrestrialbiosphere (House et al., 2003). Vegetation cover is often relatively sparseand soils are often dry in these ecosystems relative to more mesicecosystems because of less precipitation and greater evaporativedemand (McPherson, 1997; Anderson et al., 1999; Whitford, 2002; Loiket al., 2004). A key consequence of sparser vegetation cover and driersoils is the potential for an increase in aeolian sediment transport and
University of Arizona, Tucson,621 8801.hears).
l rights reserved.
related processes ofwinderosion anddustflux (Toyet al., 2002). Further,many dryland ecosystems are undergoing accelerated land degradation,which affects sediment redistribution and erosional loss through aeolianand fluvial processes (Schlesinger et al., 1990; Aguiar and Sala, 1999;Breshears et al., 2003; Peters et al., 2006). An improved understandingofaeolian processes is required to assess atmospheric, hydrologic, andbiogeochemical processes (Miller and Tegen, 1998; Reynolds et al., 2001,2006a,b,c; Peters et al., 2006), as well as to address a diverse suite ofenvironmental challenges related to soil and water quality (Toy et al.,2002; Lal et al., 2003), land quality and productivity (Lal, 1996; Toy et al.,2002), and human health (Griffin et al., 2001; Whicker et al., 2006b).
Despite the fundamental importance of aeolian sediment transportand erosion processes in dryland systems, few studies have estimated
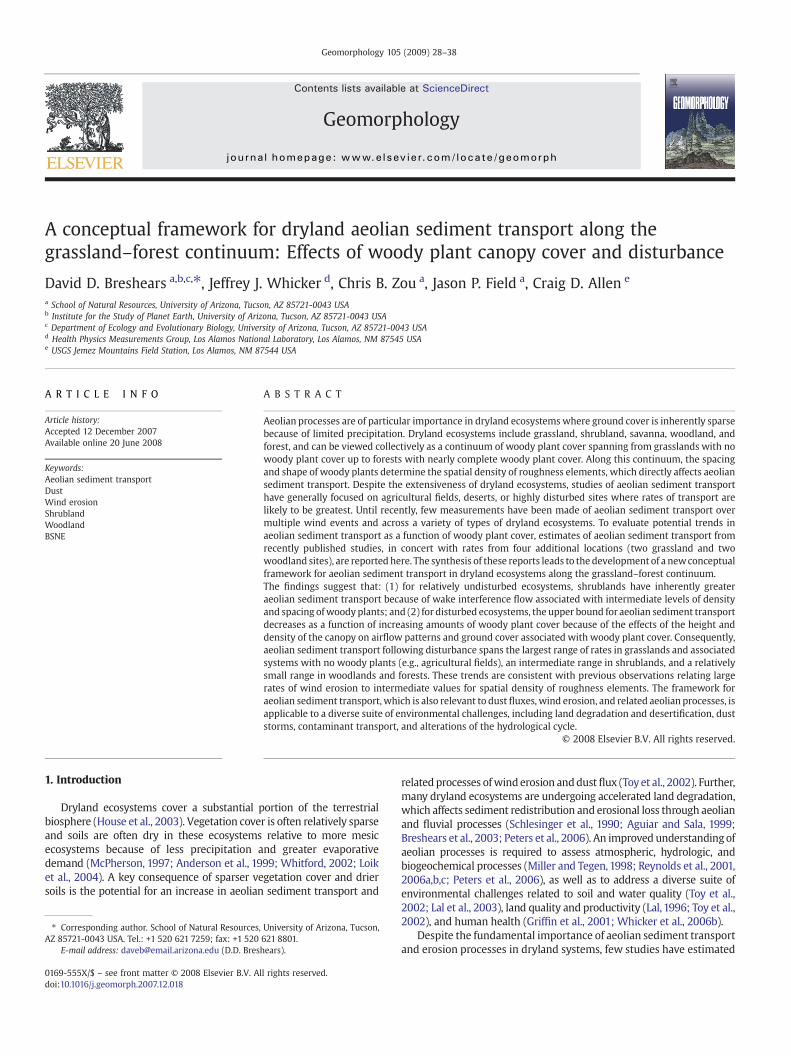
Fig.1. (A)The grassland–forest continuumas agradientof increasingcoverbywoodyplants(and co-occurring increases in woody plant height), spanning shrublands and woodlandswith intermediate levels of woody plant cover. The mean and variance of ecosystemproperties related to energy, water, and biogeochemistry (e.g. carbon) are hypothesized toexhibit trends along the continuum. Relevant environmental issues include encroachmentof woody plants, thicketization in which savannas become woodlands, xerification ordesertification, deforestation, restoration and thinning, die-off of woody plants, and fire.Increases in elevation and/or changes to awetter climate often result in an increase woodyplant canopycover; conversely, decreases inelevation and/ora drier climateoften result in adecrease in woody canopy cover (except in the case of xerification). (B) Variance in manyecosystem properties is hypothesized to be greatest at an intermediate amount of canopycover; this value is often less than 50% woody canopy cover because woody plants havestrong connectivity with the adjacent intercanopy patches, a concept that is applicable tonear-surface wind flows (modified from Breshears, 2006).
29D.D. Breshears et al. / Geomorphology 105 (2009) 28–38
aeolian sediment transport in the field, particularly for periodsspanning multiple events over several months to a few years. Evenfewer measurements have been reported for relatively undisturbedecosystems. Notably, previous debates about rates of erosion indryland ecosystems (and associated policy implications) have notdirectly addressed the large knowledge gap associated with rates ofwind erosion, focusing instead primarily on water erosion (Crosson,1995; Pimentel et al., 1995a,b; Nearing et al., 2000; Trimble andCrosson, 2000a,b).
Dryland ecosystems are extensive globally and encompass a diverseset of major types of vegetation that include grassland, shrubland,savanna, woodland, and forest (House et al., 2003). A first-order des-criptor for these types of vegetation is the amount and stature ofwoody plant cover (Breshears, 2006). These dryland types of vegeta-tion can be viewed collectively as a continuum of woody plant coverspanning from grasslands with no woody plant cover to forests withnearly complete woody plant cover—referred to as the grassland–forest continuum. The height of woody plants often increases withcanopy cover along this conceptual gradient (Martens et al., 2000).Woody plants affect many ecosystem properties beneath the canopiesand around them, and these effects can translate into trends along thegrassland–forest continuum (Fig. 1A) for such properties as near-ground solar radiation (Martens et al., 2000) or soil water content(Breshears and Barnes,1999). This perspective is relevant to numerous,diverse environmental issues such as desertification and forest res-toration (Breshears, 2006). Notably, the height and spacing of woodyplants are key determinants of surface roughness and associatedfactors that are fundamental to aeolian processes. The mean andvariance of numerous ecosystem properties related to energy, water,and biogeochemistry (e.g., carbon) are hypothesized to exhibit trendsalong the continuum. Of particular relevance to aeolian sedimenttransport and associated wind erosion is that the variance of manyecosystemproperties is hypothesized to be greatest at an intermediateamount of canopy cover—at a value that is often less than 50% woodycanopy cover because of the influence that woody plants have onadjacent intercanopy patches (also referred to as the degree of “con-nectivity”; Fig. 1B; Breshears, 2006). Aeolian sediment transport andassociated wind erosion are likely related to the amount of woodyplant cover in an ecosystem because woody plants are generally thepredominant “roughness elements”. The height, width and spacing ofthe main roughness elements in an ecosystem determine the predo-minant way inwhich vegetation influences the vertical wind profile toproduce one of three types of flow: isolated roughness, wake inter-ference, or skimming (Lee and Soliman, 1977; Lee, 1991a,b; Wolfe andNickling, 1993; Fig. 2). In addition to serving as roughness elements,woody plants often increase ground cover via large inputs of litter tothe ground beneath the plant canopy. Consequently, the effects ofwoody plants on aeolian processes (Aguiar and Sala, 1999; Okin andGillette, 2001) represent an important, but perhaps somewhat under-appreciated, linkage between ecology and geomorphology (Urban andDaniels, 2006).
Despite the overall importance of aeolian processes in drylandecosystems, variability in aeolian sediment transport as a functionofwoodyplant cover along the grassland–forest continuumhas yet to besystematically evaluated. The goal of this paper is to address this issue.The specific objectives are: (1) compile measurements of aeolian sedi-ment transport as a function of woody plant canopy cover for undis-turbed and disturbed sites (from published studies and othermeasurements reported here), (2) evaluate relevant interrelationshipsbetween boundary layer flows and land surface characteristics asso-ciatedwith woody plant cover, and (3) propose a general framework foraeolian sediment transport that builds on three key findings thatemerged from objectives 1 and 2—(i) among relatively undisturbedecosystems, shrublands have inherently greater aeolian sedimenttransport; (ii) for disturbed ecosystems, the upper bound for aeoliansediment transport decreases with increasing amounts of woody plant
cover because of the height and density of the canopy effects on airflowpatterns and because the total amount of ground cover generallyincreases with woody plant cover; and, (iii) grasslands and othersystems with few woody plants span the largest range of rates foraeolian sediment transport andhave the largest values afterdisturbance,shrublands have inherently large rates for aeolian sediment transportthat can be increased moderately by disturbance, and woodlands andforests have smaller rates, even following disturbance. The implicationsof the conceptual framework are discussed relative to major environ-mental challenges that include land degradation and desertification,

Fig. 2. Three major types of flow regimes related to woody plant density (top): (a) isolated roughness flow, for b16% canopy cover; (b) wake interference flow, for 16–40% canopycover; and (c) skimming flow, for N40% canopy cover, as seen in profile (center) and from above (bottom; modified from Wolfe and Nickling, 1993).
30 D.D. Breshears et al. / Geomorphology 105 (2009) 28–38
dust storms, contaminant transport, and alterations of the hydrologicalcycle.
2. Compilationofmeasurements along thegrassland–forest continuum
2.1. Methods and measurements
Estimates of aeolian sediment transport, expressed as mass fluxtransported in the horizontal direction (g m−2 d−1), were compiledfrom published studies and from newmeasurements (detailed below)for ecosystems with variable coverage of woody plants. Estimateswere categorized as either relatively undisturbed sites or sites thathad severe recent disturbance, including agricultural sites, scrapedsites, burned sites, sites with extensive military tracks, and sites thatwere so degraded through historical grazing and other land use thatessentially no herbaceous cover remained between woody plants.Estimates were included if field measurements were obtained usingBig Spring Number Eight samplers (BSNE; see Fryrear, 1986). Onestudy that used a Bagnold-type sampler was also included becausea comparison with BSNE samplers indicated that these two types ofsamplers provided estimates of aeolian sediment transport that werewithin 10% of each other (Breshears et al., 2003). Measurementintervals spanned from 3 to 30 months. Studies that focused onindividual events or were conducted using wind tunnels were notincluded. In several cases, estimates of sediment transport werecalculated from data provided in the original studies and converted toa daily basis. Spatial density of roughness elements (see Section 3.1below) was calculated using percent woody plant cover, height, andmean plant diameter, all of which were available for most sites. Forsome sites woody plant cover was estimated from photos of the site orinferred from the text. In two cases where plant height was notreported, an approximate height associated with the woody plantspecies was assumed. Height and mean plant diameter were availablefor several of the sites that spanned from small (∼5%) to large (72%)amounts of canopy cover. A predictive equation, derived from siteswith available data, was applied to sites where mean canopy diameterwas missing: diameter=1.44(height)0.44 (r2=0.97). Where sedimenttransport was reported for multiple measurement heights, the rateswere averaged over the available heights to provide an approximateestimate of mean sediment transport up through 1 m above ground.Disturbed sites were evaluated with respect to pre-disturbancecanopy cover. In particular, canopy cover for burned sites included
standing, burned, and sometimes dead trees as part of canopy cover.Although some woody plants had lost foliage, the woody branchingstructure can still be considered a roughness element. For one typeof less common disturbance, tree thinning with heavy machinery inwhich tree cover and ground cover were substantially reduced, pre-and post-disturbance values of canopy cover were evaluated.
Aggregated estimates of sediment transport from ongoing studieswere included to supplement the overall assessment given the fewsuch measurements in grasslands and woodlands (Breshears et al.,2003; Vermeire et al., 2005; but see Baker and Jemison, 1991; Bakeret al., 1995). These studies focus on estimating aeolian sedimenttransport in the context of land disturbances and contaminant tran-sport (more detailed evaluations of these data sets will be reportedelsewhere). Sediment transport was measured for periods spanning10–12 months for three of the sites and 30 months for the fourth site(Frijolito; see below). Measurements for all four sites were obtainedusing BSNE samplers (Zobeck et al., 2003) at various heights up to 1 mand collected roughly every 1–2 weeks. Samples were collected, dried,and weighed. Sampling intervals that were confounded by rainsplashas described in Whicker et al. (2006a) were eliminated from theanalysis. All four sets of new measurements were obtained during aperiod of intense drought, which was severe enough to trigger ex-tensive mortality of piñon trees at or near the northern New Mexico,USA sites (Breshears et al., 2005a; Rich et al., 2008). Estimates ofsediment transport ranged from 0.17 to 4.85 g m−2 d−1 (Table 1) acrossthe four study sites:
• Santa Rita Experimental Range (SRER), Sonoran desert grassland,Arizona, USA. The first grassland site was a Sonoran desert grasslanddominated by the non-native annual grass Eragrostis lehmanniana(Lehman lovegrass) with a small amount of shrub cover from Pro-sopis velutina (velvet mesquite). The field plots were located withinthe University of Arizona pasture cell at SRER, where long-termvegetation change and grazing and management impacts have beenstudied for more than a century (McClaran, 2003). Sediment tran-sport at SRER was the greatest of the four new estimates, eventhough ground cover was substantial (60%): 4.85 g m−2 d−1 (Fieldet al., manuscript in preparation).
• Area J, semiarid grassland on a landfill at Los Alamos National LaboratoryNewMexico, USA. The secondgrassland site had nowoodyplant cover;much of the herbaceous cover was Bouteloua gracilis (blue grama),which had been established in the topsoil with irrigation in previous

Table 1Sediment transport measured in undisturbed ecosystems using BSNE and Bagnold samplers
Study sites Dominantvegetation
Woodycanopycover (%)
Woodycanopyheight (m)
Canopydiameter(m)
Spatialdensity(C )
Groundcover(%)
Soiltexture
Meanprecipitation(mm)
Mean windspeed(height) (m s−1)
Sedimenttransport(g m−2 d−1)
References
GrasslandRocky Flats,CO,USA
Bouteloua gracilis 0 0 0 N/A 79 Clay 370 2.1 1.67a Breshears et al. (2003)
Area J, NM,USA Bouteloua gracilis 0 0 0 N/A 38 Sandyloam
400 2.3 1.4 This study
SRER, AZ,USA Eragrostislehmanniana
~5 2 2 0.003 ~60 Sandyloam
350 2.7 (1 m) 4.85 Field et al.(in preparation)b
Shrubland and woodlandWIPP, NM, USA Larrea tridentate 28 0.75 1.2 0.09 66 Sand 300 2.6 27.4a Whicker et al. (2002),
Breshears et al. (2003)Oklahoma,USA
Artemisia filifolia 35 1 1.437 0.20 NA Loamyfinesand
602 NA 4.28 Vermeire et al. (2005)
Frijolito, NM,USA
Pinus edulis, Juniperusmonosperma
45 3.21 2.34 0.92 62.12 Sandyloam
400 1.0 (1 m) 3.0 This study
Mesita del Buey,NM,USA
Pinus edulis, Juniperusmonosperma
46 4 3 0.97 NA Sandyloam
400 1.0 (1 m) 1.1 This study
ForestLANL, NM,USA Pinus ponderosa 75 12 4 27.00 98 Silt loam 500 0.8 (1 m) 0.17a Breshears et al. (2003)LANL, NM,USA Pinus ponderosa 75 12 4 27.00 98 Silt loam 500 0.5 (1 m) 0.738 Whicker et al. (2006a,b)
a Dust was collected using Bagnold samplers.b Manuscript in preparation.
31D.D. Breshears et al. / Geomorphology 105 (2009) 28–38
years and then equilibrated with ongoing climate. Vegetation on thelandfill cover included native andnon-native herbaceous species. Earlysuccessional vegetation cover on landfills in this area (Breshears et al.,2005b) is similar to herbaceous vegetation in neighboring woodlands(Martens et al., 2001) and shares the same dominant herbaceousspecies as shortgrass steppe ecosystems within the region (Lauenrothand Sala, 1992). Additional details on the site and measurements areavailable in Whicker and Breshears (2004). Mean daily sedimenttransport at this sitewas less than a third of that at the SRER grassland:1.4 g m−2 d−1.
• Mesita del Buey, piñon–juniper woodland at Los Alamos National Labo-ratory, New Mexico, USA. The Mesita del Buey woodland site is anintensively studied site dominated by piñon (Pinus edulis) and juniper(Juniperus monosperma; see Breshears, 2006, 2007 and referencestherein). The site is located at Technical Area 54 within Los AlamosNational Laboratory Environmental Research Park. Additional detailson site and measurements are reported in Whicker and Breshears(2004). This woodland site had the smallest sediment transport of thefour new estimates: 1.1 g m−2 d−1.
• Frijolito, piñon–juniper woodland site within Bandelier National Monu-ment, New Mexico, USA. The Frijolito woodland site is also an inten-sively studied site that was originally forest dominated by Pinusponderosa (ponderosa pine) but was transformed into piñon–juniperwoodland (Pinus edulis and Juniperus monosperma) when nearly allP. ponderosa trees died during a drought in the 1950s (Allen andBreshears,1998). As noted above, this site was subsequently impactedby a second severe drought beginning around 2000 (as was Area J andMesita del Buey) that resulted in extensive P. edulis mortality duringthe measurement interval (Breshears et al., 2005a). The mean sedi-ment transport at Frijolito was 3.0 g m−2 d−1.
2.2. Relatively undisturbed sites
For relatively undisturbed dryland sites along the grassland–forest continuum, mean sediment transport ranged from as little as0.17 g m−2 d−1 to as much as 27.4 g m−2 d−1 (Table 1). The sites rangedfrom 0 to 75% woody canopy cover and from 38 to 98% ground cover.The maximum measured flux was from a shrubland site that had 28%
woodycanopycover andoverall ground cover thatexceeded65% (Fig. 3).The rate of transport in relatively undisturbed grasslands and wood-lands was less than those for shrubland sites and exceeded those forforests. These results suggest an overall trend in sediment transportrelated to variation in woody plant cover for grasslands, shrublands,woodlands, and forests and are similar to those hypothesized byBreshears et al. (2003) based on a subset of this data set that includedsingle estimates each from a grassland, a shrubland, and a forest.
2.3. Disturbed sites
For disturbed sites along the grassland–forest continuum, sedi-ment transport ranged from 1.1 g m−2 d−1 to 6002 gm−2 d−1 with sitesranging from 0% to 72% canopy cover (Table 2). Sediment transport atdisturbed sites varied substantially among sites with differentamounts of woody plant cover and generally exceeded fluxes forundisturbed sites with comparable amounts of woody plant cover.Notably, observations from disturbed sites suggest that an upperbound exists to sediment transport and this upper bound decreaseswith increasing canopy cover (Fig. 3, solid symbols). Grasslands andother systems with little or no woody canopy cover (e.g., bare areas oragricultural fields) have the widest range of potential sedimenttransport, with the variation within this range being associated withvariation in the amount of intercanopy ground cover from herbaceousplants (Okin et al., 2006) and biological and non-biological soil crusts(Belnap, 2003). Shrublands have inherently larger sediment transportthat can be increased by disturbance. In contrast, woodlands andforests have smaller rates of sediment transport, even followingdisturbance. Sediment transport at the thinned ponderosa pine forestsite (diamonds in Fig. 3) could be associated with either of two valuesof cover, both of which are near the lower limit trend line forundisturbed systems. Overall, the trends are consistent with previousobservations that large sediment transports are associated with aspecific range of values for the spatial density of roughness elements(woody plants in this case), as discussed below.
Surprisingly, no clear trends appeared related to soil texturewithinthe limited available data sets (Tables 1 and 2). Rates of wind erosionfrom wind tunnel studies demonstrate relationships with soil texture

Fig. 3. Aeolian sediment transport, based on multi-month estimates of sediment transport (g m−2 d−1), as related to woody canopy cover along the grassland–forest continuum forrelatively undisturbed sites (open symbols, from Table 1) and disturbed sites (solid symbols, from Table 2). A forest site that was thinned (diamonds) is shown at pre- (solid) and post-(open with x inset) thinning values for canopy cover.
32 D.D. Breshears et al. / Geomorphology 105 (2009) 28–38
(Pye, 1987; Toy et al., 2002), and soil texture differences have beendiscussed relative to rates of wind and water erosion in grassland,shrubland and forest ecosystems (Breshears et al., 2003). The syn-thesis here did not detect any clear effects of soil texture.
3. Interrelationships between boundary layer flows and landsurface characteristics
Variation in landsurfacecharacteristics andassociated effects onflowregimes influences aeolian sediment transport. Of particular relevanceare trends in flow regimes, shear stress, and surface erodibility.
3.1. Flow regimes
Thewoody plantmosaics associatedwith sites along the grassland–forest continuum fundamentally influence airflow regimes (Fig. 2).Woody plants interact with wind flow in the atmospheric boundarylayer, altering speed, direction, and turbulence structure. A single,isolated plant alters wind flow by imparting frictional force againstthewind, which retards the flow and transfers energy andmomentumto branches and leaves. In addition, the fluid is accelerated around thesides and top of the plant, and turbulent eddies are created in thewakeof the plant (this influence provides potential “connectivity” betweenwoody plants and the areas around them, as defined above and inFig. 1; Breshears, 2006). Wind flow through stands of vegetation atlarger ecosystem or landscape scales reflects the combined effects ofindividual plants and generally has been grouped into one of threeflowregimes: 1) isolated roughness flow, 2) wake interference flow, or3) skimmingflow (Wolfe andNickling,1993; Fig. 2). Isolated roughnessflow is characterized as having flows and wakes that act in isolation ofone another and occurs in ecosystemswith small plant densities (b16%canopy cover). Wake interference flow is associated with the wakesthat formwhen thewind and plant interactions begin to interferewithone another, occurring at plant densities of approximately 16 to 40%canopy cover. Skimming flow is associated with conditions in whichwinds skim across the top portions of plants, with little wind energydiverted to the soil surface and, therefore, resulting in little winderosion. This type of flow generally occurs when plant canopy coverexceeds 40%.
In addition towoody plant cover, the shape and spacing of plants areimportant characteristics of canopy architecture that influence windflow through vegetation. Roughness density has been used extensively
to relate canopy architecture and surface roughness (Raupach et al.,1993). Roughness density, λ, is defined as:
λ ¼ nbhA
; ð1Þ
where n is the number of plants, b is the base diameter, h is the plantheight, bh is the frontal area of the plant, and A is total area. Assuminguniformly and isotropically distributed vegetation, the fraction of thearea with canopy cover (Fc), as viewed from above, is exponentiallyrelated to λ (Fryrear, 1985; Findlater et al., 1990):
Fc ¼ 1−e−λ: ð2Þ
Another parameter that describes the interaction of wind andvegetation is the concentration of roughness elements, or thedimensionless C value (Raupach et al., 1980; Warner, 2004). The Cvalue is slightly different from λ in that it normalizes the frontal areaof the plants to the square of the distance (d) between the plantsrather than to the size of the area (as shown in Eq. (1)):
C ¼ hbd2
: ð3Þ
As with λ, the C value is related to canopy cover. Again, byassuming an even and isotropic distribution of woody plants, the Cvalue can be rewritten in terms of Fc:
C ¼ hb2
Fc1−Fc
� �2
; ð4Þ
λ andC are related to Fc, and thus also to shear stress, as shownbelow.
3.2. Shear stress partitioning
Vegetation cover and the soil surface extract momentum fromnear-surface wind, resulting in shear stress (τ), which is defined as atangential force applied per unit surface area. Total shear stress can bepartitioned between the vegetation and the surface soil as (Raupachet al., 1993):
τ ¼ ρu4 ¼ τv þ τs; ð5Þ
where ρ is the density of air, u⁎ is the friction (or shear) velocity, τv isthe shear stress apportioned to vegetation, and τs is the shear stress

Table 2Sediment transport in disturbed ecosystems measured using BSNE samplers
Study sites Dominantvegetation/disturbance
Woodycanopycover (%)
Woodycanopyheight (m)
Canopydiameter(m)
Spatialdensity(C)
Groundcover(%)
Soiltexture
Meanprecipitation(mm)
Mean windspeed(height) (m s−1)
Sedimenttransport(g m−2 d−1)
References
Grassland/cultivatedBanizoumbu,Niger
Hordeum vulgare/cultivated
0 0 0 NA NA Sand 500 10a (2 m) 5060b Bielders et al. (2002)
Emerson Lake,CA, USA
Scrub/militarytracking
0c 0 0 NA NA Clay 70d NA 9.8e van Donk et al. (2003)
Jornada, NM,USA
Prosopis glandulosa/scraped
0 0 0 NA NA Loamy sandto sandyloam
247 3f 6002g Gillette and Pitchford(2004)
Khanasser,Syria
Hordeum vulgare/cultivated
0 0 0 NA NA Sandy loam 200 4h (2 m) 28.5 Masri et al. (2003)
Khanasser,Syria
Grassland/Grazing
0 0 0 NA NA Sandy loam 200 4h (2 m) 8.9 Masri et al. (2003)
Shrubland and woodlandBanizoumbou,Niger
Guierasenegalensis/grazing
4i 2i 0 NA Dense Sand 500 10i (2 m) 154i Bielders et al. (2002)
Lavic Lake,CA, USA
Scrub/militarytracking
5c 0.5c 0 NA NA Sandy loam 70d NA 12.9e van Donk et al. (2003)
Lead Mountain,CA, USA
Scrub /militarytracking
10c 0.5c 1.06 0.006 NA Loamy sand 70d NA 12.2e van Donk et al. (2003)
Gypsum,CA, USA
Scrub/militarytracking
10c 0.8c 1.3 0.008 NA Sand 70d NA 576.5e van Donk et al. (2003)
MWELL site,NM,USA
Prosopisglandulosa,Ephedra trifuca/grazing
15.7 0.5 1.06 0.016 15.7 Fine sandyloam
247 3f 79.2g Gillette and Pitchford(2004)
WIPP, NM, USA Larrea tridentate 18 1.32 1.62 0.057 66 Sand 300 2.6 82.2 Whicker et al. (2002),Breshears et al. (2003)
Prospect,CA, USA
Scrub/militarytracking
20c 0.8c 0.8 1.3 0.038 Sand 70d NA 203.3e van Donk et al. (2003)
MRABB site,NM, USA
Prosopisglandulosa,Ephedra trifuca/grazing
21.4 1.2 1.56 0.057 21.4 Fine sandto loamy finesand
247 3f 173.5g Gillette and Pitchford(2004)
MNORT site,NM, USA
Prosopisglandulosa,Ephedra trifuca/grazing
25.4 1 1.44b 0.081 25.4 Fine sandto loamy finesand
247 3f 412.1g Gillette and Pitchford(2004)
Oklahoma, USA Artemisia filifolia/spring burned
35 1 1.437 0.20 NA Loamy finesand
602 NA 5.9 Vermeire et al. (2005)
Oklahoma, USA Artemisia filifolia/autumn burn
35 1 1.437 0.20 NA Loamy finesand
602 NA 32.1 Vermeire et al. (2005)
ForestLANL, NM, USA Pinus ponderosa/
thinned36j 12 4 0.949 86 Silt loam 500 0.8 (1 m) 1.1k Whicker et al. (2007a)
LANL, NM, USA Pinus ponderosa/thinned
55l 12 4 0.949 86 Silt loam 500 0.8 (1 m) 1.1k Whicker et al. (2007a)
LANL, NM, USA Pinus ponderosa/severe burned
49 12 4 2.769 NA Silt loam 500 0.8 (1 m) 3.4k Whicker et al. (2006a)
LANL, NM, USA Pinus ponderosa/moderate burned
72 12 4 19.837 NA Silt loam 500 0.8 (1 m) 1.3k Whicker et al. (2007a)
a Average over duration from Table 1 in Bielders et al. (2002).b Re-calculated from Tables 2 and 3 in Bielders et al. (2002).c Estimated from Fig. 2 in van Donk et al. (2003).d Average of the range between 35 and 130 mm reported in van Donk et al. (2003).e Daily average re-calculated based on the total sediment discharge in entire period.f Estimated from Dauses et al. (http://usda-ars.nmsu.edu/presentations/DauesAeolianProcesses.pdf; verified Oct. 9, 2007).g Interpolated from Fig. 7 in Gillette and Pitchford (2004).h Average values of wind speed during summer and is re-calculated from Table 3 (Masri et al., 2003).i Estimated from site description in Bielders et al. (2002).j Woody canopy coverage after thinning.k Estimated from mean values for dry periods from data in associated reference.l Woody canopy coverage before thinning.
33D.D. Breshears et al. / Geomorphology 105 (2009) 28–38
apportioned to the surface, or in this case the soil surface. Therelationship between λ and Cwith respect to τ and τv is such that as λand C increase, the ratio of τv to τ goes towards one. That is, asvegetation roughness increases, a greater portion of total shear stressis caused by the vegetation relative to the soil surface.
The parameter τs in Eq. (5) can be rewritten in terms of shearstress normalized to stress on bare surface areas only (Raupach et al.,1993):
τs ¼ τ Vs 1−Fcð Þ; ð6Þ

Fig. 4. A. Estimates of spatial densityC for relatively undisturbed sites (Table 1) as a functionof canopy cover; C as calculated here is based onwoody plants as roughness elements andignores the finer-scale roughness associatedwith herbaceous plants. B. Values of C near 0.1have been hypothesized to be associated with larger rates of sediment transport.
34 D.D. Breshears et al. / Geomorphology 105 (2009) 28–38
where τs′ is the shear stress on bare ground only. Further, the totalshear stress for partially vegetated areas can be portioned into twosurface components, woody (τwoody) and herbaceous vegetation(τgrass):
τv ¼ τwoody þ τgrass; ð7Þ
or in terms of stress only on plant surfaces,
τv ¼ Fc τ Vwoody þ τ Vgrass� �
: ð8Þ
3.3. Relationship between flow regime and erodibility
The interaction between airflow, vegetation and soil surface drivesthe aeolian erodibility of a landscape, and can be described in terms ofthe metrics λ, C, and τ, all of which vary along the grassland–forestcontinuum. In “ideal” grasslands with only herbaceous cover, Eq. (8)can be simplified from τv=Fc(τ′woody+τ′grass) to τv=Fcτ′grass becausewoody plants are largely absent. In undisturbed grasslands, Fc can bequite large although the shear stress from individual herbaceousplants is expected to be small compared to that from woody vege-tation, which is typically taller and wider. In grasslands, λ and C valueshave small h and b values that are counterbalanced by the relativelylarge Fc yielding larger τv values. The large amount of herbaceouscover present in undisturbed grasslands with no woody canopy coverlikely produces skimming type airflow (Lee, 1991a,b).
Shrublands and woodlands are characterized by substantial com-ponents of woody and herbaceous plants (House et al., 2003). Thewoody canopy cover, Fc, in shrublands and woodlands can vary sig-nificantly, which in turn affects the partitioning of the shear stressbetween the woody and herbaceous components. If woody plantcover is sparser, as occurs in many shrublands, the flow regime willlikely correspond to either isolated wake flow or wake interferenceflow, depending on the canopy cover and the height and width of thewoody vegetation. Dryland sites with wake interference flow areexpected to have a greater amount of shear stress transferred to theintercanopy surface, potentially causing greater aeolian sedimenttransport. Woodlands generally have greater amounts of woody plantcover and taller canopy heights than shrublands, such that the shearstress from vegetation generally approaches τv=Fcτ′woody, resulting inskimming flow.
For forests, shear stress further approaches τv=Fcτ′woody fromadditional increases in height and canopy cover, such that only a fewlocations are not beneath woody plants. Taller tree heights and largerbase diameters (including the branches and leaves/needles) result inrelatively large values of roughness, λ, and spatial density, C. Relativelylarge values of basal diameters for forest trees (spanning the woodycanopy patch, not just the trunk diameter) also result in a greater Fcand indicate that airflow above the tree canopy should be skimmingtype flow. Consequently, thickly forested areas would be expected tohave lesser aeolian transport because of the tall and thick vegetationassociated with the greater amount of canopy cover.
Spatial density, C, varied with canopy cover for the undisturbed(Table 1) and disturbed (Table 2) sites. The variation in C, focusingsolely on the woody plants as roughness elements (i.e., ignoring theroughness effects of herbaceous plants) for relatively undisturbedsites along the grassland–forest continuum, highlights how C increa-ses with canopy cover (Fig. 4A). Previous studies of wind erosion havesuggested that values of C near 0.1 are associated with wake inter-ference flow and large rates of wind erosion (Warner, 2004). Resultspresented herein are consistent with this observation (Fig. 4B). Notethat C is near 0.1 for shrublands but generally not for the other types ofecosystems along the grassland–forest continuum. In addition, notethat C is affected by woody canopy cover, spacing, and height andrecall that the height of woody plants often increases with woodyplant cover along the grassland–forest continuum (Fig. 1; e.g., Martens
et al., 2000). Consequently, only shrublands, which often have rela-tively small amounts of woody canopy cover (∼20–30%) and arecomposed of relatively low stature woody plants, intersect the valuesof C near 0.1 (Fig. 5), where aeolian sediment transport and associatedwind erosion are thought to be greatest.
4. A new conceptual framework for aeolian sediment transportalong the grassland–forest continuum
4.1. Model description
The available data suggest two trends in how aeolian sedimenttransport varies along the grassland–forest continuum (Fig. 6). Firstly,for relatively undisturbed ecosystems, shrublands have inherentlygreater sediment transport potential, likely because of wake interfe-rence flow associated with the spatial concentration of roughnesselements. Secondly, for disturbed ecosystems, the upper bound forsediment transport decreases with increasing amount of woody plantcover, probably because of effects of canopy height and density onairflow patterns and because theminimum amount of ground cover ata site tends to increase as woody plant cover increases. That is, groundcover is interrelated with, and directly proportional to, woody plantcover. Because woody plants represent a substantial concentration ofbiomass and generate large amounts of litter, the ground cover di-rectly beneath woody plants generally is completely covered withlitter. Consequently, woody canopy cover also often determines aminimum amount of ground cover for an ecosystem. That is, as woodycanopy cover increases along the grassland–forest continuum, so doesminimum amount of ground cover. For example, a site with 80% treecover, should have at least 80% ground cover, and so intercanopy cover
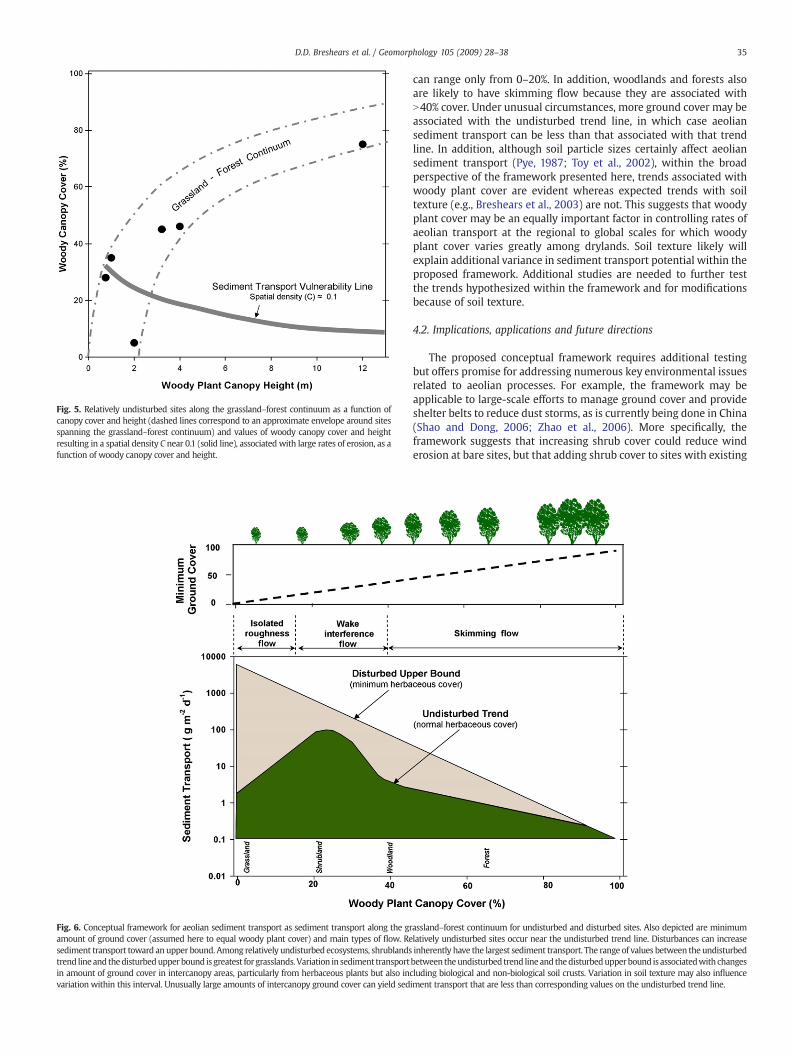
Fig. 5. Relatively undisturbed sites along the grassland–forest continuum as a function ofcanopy cover and height (dashed lines correspond to an approximate envelope around sitesspanning the grassland–forest continuum) and values of woody canopy cover and heightresulting in a spatial density C near 0.1 (solid line), associated with large rates of erosion, as afunction of woody canopy cover and height.
Fig. 6. Conceptual framework for aeolian sediment transport as sediment transport along the gramount of ground cover (assumed here to equal woody plant cover) and main types of flow. Resediment transport toward an upper bound. Among relatively undisturbed ecosystems, shrublandstrend lineand thedisturbedupperbound is greatest forgrasslands. Variation in sediment transportin amount of ground cover in intercanopy areas, particularly from herbaceous plants but also incvariation within this interval. Unusually large amounts of intercanopy ground cover can yield sed
35D.D. Breshears et al. / Geomorphology 105 (2009) 28–38
can range only from 0–20%. In addition, woodlands and forests alsoare likely to have skimming flow because they are associated withN40% cover. Under unusual circumstances, more ground cover may beassociated with the undisturbed trend line, in which case aeoliansediment transport can be less than that associated with that trendline. In addition, although soil particle sizes certainly affect aeoliansediment transport (Pye, 1987; Toy et al., 2002), within the broadperspective of the framework presented here, trends associated withwoody plant cover are evident whereas expected trends with soiltexture (e.g., Breshears et al., 2003) are not. This suggests that woodyplant cover may be an equally important factor in controlling rates ofaeolian transport at the regional to global scales for which woodyplant cover varies greatly among drylands. Soil texture likely willexplain additional variance in sediment transport potential within theproposed framework. Additional studies are needed to further testthe trends hypothesized within the framework and for modificationsbecause of soil texture.
4.2. Implications, applications and future directions
The proposed conceptual framework requires additional testingbut offers promise for addressing numerous key environmental issuesrelated to aeolian processes. For example, the framework may beapplicable to large-scale efforts to manage ground cover and provideshelter belts to reduce dust storms, as is currently being done in China(Shao and Dong, 2006; Zhao et al., 2006). More specifically, theframework suggests that increasing shrub cover could reduce winderosion at bare sites, but that adding shrub cover to sites with existing
assland–forest continuum for undisturbed and disturbed sites. Also depicted are minimumlatively undisturbed sites occur near the undisturbed trend line. Disturbances can increaseinherently have the largest sediment transport. The range of values between the undisturbedbetween theundisturbed trend lineand thedisturbedupperbound isassociatedwith changesluding biological and non-biological soil crusts. Variation in soil texture may also influenceiment transport that are less than corresponding values on the undisturbed trend line.

36 D.D. Breshears et al. / Geomorphology 105 (2009) 28–38
herbaceous cover could, in some cases, result in increased aeoliansediment transport and associated wind erosion. The framework alsosuggests that establishing larger trees with sufficient density, iffeasible, could simultaneously decrease aeolian sediment transport,increase rates of dust deposition and improve soil quality (Shiratoet al., 2004; McGowan and Ledgard, 2005).
The proposed framework also has important implications foratmospheric modeling. One of the central uncertainties in atmo-spheric models is dust flux, yet few field data exist on atmosphericdust flux. The reported synthesis is insufficient to address this issue ina robust way but can serve as a starting point for linking sedimenttransport near the ground to vertical dust flux inputs for atmosphericmodels. The relationship between sediment transport (horizontalflux) and vertical dust flux varies with site conditions (e.g., vegetationcover) and has particle size dependencies (e.g., PM10 as in Gillette,1997; Whicker et al., 2006b). At the risk of oversimplifying theserelationships, estimates from Whicker et al. (2006a) suggest thatvertical dust fluxmay be as large as 5% of sediment transport. Buildingon this assumption, mean daily sediment transport for general landsurface categories are proposed that may be relevant to large-scaleatmospheric models: undisturbed forests, disturbed forests, undis-turbed woodlands, disturbed woodlands, relatively undisturbedshrublands, disturbed shrublands, undisturbed grasslands, moder-ately disturbed grasslands, essentially bare areas (sites with noherbaceous or woody plant cover), and areas that have unusuallylarge amounts of ground cover within semiarid settings (Fig. 7).
The proposed conceptual framework (Fig. 6) and its extension(Fig. 7) also has implications that span from applied issues, related tocontaminant transport and associated risks, to more fundamentalissues related to biogeochemical, hydrological and ecological pro-cesses that underlie challenges related to global climate change andland use. The need to assess potential contaminant transport hasmotivated many of the recent studies of aeolian sediment transport(Whicker et al., 2002; Breshears et al., 2003; Whicker et al., 2006a,b,2007a,b). Findings relevant to contaminant transport that affectrespirable fractions of airborne contaminants and associated doses,in addition to the estimated sediment transport themselves, include
Fig. 7. Categories of vertical dust flux along the grassland–forest continuum, bounded betweetransport=5% of vertical dust flux (Whicker et al., 2006b).
documenting a direct relationship between sediment transport andPM10 concentrations (Whicker et al., 2006a) and quantifying site-specific and particle-size-dependent variation in partition coefficients(Kds) for U in surface soils (Whicker et al., 2007b). The framework alsohas biogeochemical implications relevant to how resources areredistributed within and among ecosystems (Reynolds et al., 2001;Neff et al., 2005; Reynolds et al., 2006a,b,c). Indeed, nutrient lossesand redistribution by aeolian processes are viewed as key componentsof desertification and degradation processes (Schlesinger et al., 1990;Aguiar and Sala, 1999; Peters et al., 2006). In addition, the potentialrelationships between sediment transport and vertical dust flux, des-cribed above in the context of atmospheric processes, has fundamen-tal hydrological implications. For example, vertical dust flux andsubsequent transport at regional scales can lead to inhibition of pre-cipitation (Rosenfeld et al., 2001) and to hastening of snowmelt(Painter et al., 2007).
5. Conclusions
A more comprehensive understanding of how aeolian sedimenttransport and associated wind erosion and dust flux vary along thegrassland–forest continuum is needed to better assess trends across abroad spectrum of ecosystem types and in associated responses todisturbance. Estimates of sediment transport along the grassland–forest continuum,which have been largely lacking until recently, seemto be bounded within an envelope related to woody plant cover andsite disturbance. New data in conjunction with previously reportedestimates for sites along the grassland–forest continuum that have notbeen recently and/or drastically disturbed suggest that aeolian sedi-ment transport may be inherently greater for shrublands. This result isconsistent with recent evaluations of roughness elements focusing onroughness density and height to width ratios of roughness elements,which are associated with woody plants in this case. Notably, becauseheight tends to increase with woody plant cover along the grassland–forest continuum, it is primarily low density shrublands that havemaximal effects on the wind profile and on aeolian sediment tran-sport; greater densities or taller woody plants tend to be associated
n relatively undisturbed and disturbed sites. Estimates are based on assuming sediment

37D.D. Breshears et al. / Geomorphology 105 (2009) 28–38
with skimming flow over the woody plant canopy. In addition, thesynthesis presented here highlights that for disturbed ecosystems, theupper bound for sediment transport potential decreases with increa-sing amount of woody plant cover. Canopy height and density affectsthe airflow patterns and woody plant cover influences the minimumamount of ground cover. Consequently, grasslands or associated sys-temswith nowoody plants can have the largest potential for sedimenttransport and can span the largest range of values. Shrublands haveinherently large sediment transport potential that can be increased bydisturbance, and woodlands and forests have the smallest sedimenttransport potential, even following disturbance. These trends areconsistent with previous observations that wind erosion is greatest forsystems with a specific range of values of spatial density of roughnesselements, woody plants in this case. The proposed framework hasimplications for predictions of land surface inputs of dust for atmo-spheric models, land management planning for reducing dust stormsand associated wind erosion, and biogeochemical and contaminanttransport within and across ecosystems along the grassland–forestcontinuum that span much of the terrestrial biosphere.
Acknowledgements
We thank current and previous sponsors for wind erosion research,including Los Alamos National Laboratory, Department of EnergyEnvironmental Management Science Program, USDA CSREES traininggrant in Ecohydrology (2005-02335; to DDB and supporting JPF), U.S.Geological Survey, U.S. D.I. National Park Service, Arizona AgriculturalExperiment Station.We thank Rebecca J. Oertel and Kay L. Beeley of NPSat Bandelier National Monument for collection of data from Frijolito,Paul Dimmerling of LANL for data analysis, and Jayne Belnap, DaleGillette, Greg Okin, Ted Zobeck, and Xubin Zeng for related discussions.
References
Aguiar, M.R., Sala, O.E., 1999. Patch structure, dynamics and implications for thefunctioning of arid ecosystems. Trends in Ecology & Evolution 14, 273–277.
Allen, C.D., Breshears, D.D., 1998. Drought-induced shift of a forest–woodland ecotone:rapid landscape response to climate variation. Proceedings of the National Academyof Sciences of the United States of America 95, 14839–14842.
Anderson, R.S., Fralish, J.S., Baskin, J.M., 1999. Savannas, Barrens, and Rock Outcrop PlantCommunities of North America. Cambridge University Press, Cambridge, UK.
Baker Jr., M.B., Jemison, R.L., 1991. Soil loss—key to understanding site productivity.Proceedings of the 36th Annual Meeting of the Agencies and Science WorkingTogether for the Future. New Mexico Water Research Institute, pp. 71–76.
Baker, M.B., DeBano, L.F., Ffolliott, P.F., 1995. Soil loss in piñon–juniper ecosystems and itsinfluence on site productivity and desired future condition. In: Shaw, D.W., Aldon, E.F.,LoSapio, C. (Eds.), DesiredFutureConditions for Piñon–Juniper Ecosystems. Proceedingsof Symposium, 8–12 August 1994, Flagstaff, AZ. General Technical Report, RM-258.USDA Forest service, Fort Collins, CO, pp. 9–15.
Belnap, J., 2003. The world at your feet: desert biological soil crusts. Frontiers in Ecologyand the Environment 4, 181–189.
Bielders, C.L., Rajot, J.L., Amadou, M., 2002. Transport of soil and nutrients by wind inbush fallow land and traditionallymanaged cultivated fields in the Sahel. Geoderma109, 19–39.
Breshears, D.D., 2006. The grassland–forest continuum: trends in ecosystem propertiesfor woody plant mosaics? Frontiers in Ecology and the Environment 4, 96–104.
Breshears, D.D., 2007. The structure and function of woodlandmosaics: consequences ofpatch-scale heterogeneity and connectivity along the grassland–forest continuum.In: Van Auken, O.W. (Ed.), Western North American Juniperus Woodlands.Ecological Studies. Springer, New York, pp. 58–92.
Breshears, D.D., Barnes, F.J., 1999. Interrelationships between plant functional types andsoil moisture heterogeneity for semiarid landscapes within the grassland/forestcontinuum: a unified conceptual model. Landscape Ecology 14, 465–478.
Breshears, D.D., Whicker, J.J., Johansen, M.P., Pinder, J.E., 2003. Wind and water erosionand transport in semiarid shrubland, grassland, and forest ecosystems: quantifyingdominance of horizontal wind-driven transport. Special Issue: Wind Erosion FieldStudies: Contributions to a Joint Meeting of ICAR5 and GTCE-SEN. Earth SurfaceProcesses and Landforms 28, 1189–1209.
Breshears, D.D., Cobb, N.S., Rich, P.M., Price, K.P., Allen, C.D., Balice, R.G., Romme, W.H.,Kastens, J.H., Floyd, M.L., Belnap, J., Anderson, J.J., Myers, O.B., Myers, C.W., 2005a.Regional vegetation die-off in response to global-change-type drought. Proceedings ofthe National Academy of Sciences of the United States of America 102, 15144–15148.
Breshears, D.D., Nyhan, J.W., Davenport, D.W., 2005b. Ecohydrology monitoring and exca-vation of semiarid landfill covers a decade after installation. Vadose Zone Journal 4,798–810.
Crosson, P., 1995. Soil erosion estimates and costs. Science 269, 461–464.
Findlater, P.A., Carter, D.J., Scott, W.D., 1990. A model to predict the effects of prostrateground cover on wind erosion. Australian Journal of Soil Research 28, 609–622.
Fryrear, D.W., 1985. Soil cover and wind erosion. Transactions of the ASAE 28, 781–784.Fryrear, D.W., 1986. A field dust sampler. Journal of Soil and Water Conservation 41,
117–120.Gillette, D., 1997. Soil derived dust as a source of silica: aerosol properties, emissions,
deposition, and transport. Journal of Exposure Analysis and Environmental Epide-miology 7, 303–311.
Gillette, D.A., Pitchford, A.M., 2004. Sand flux in the northern Chihuahuan desert, NewMexico, USA, and the influence of mesquite-dominated landscapes. Journal ofGeophysical Research-Earth Surface 109, F04003.
Griffin, D.W., Kellogg, C.A., Shinn, E.A., 2001. Dust in the wind: long range transport ofdust in the atmosphere and its implications for global public and ecosystem health.Global Change and Human Health 2, 20–33.
House, J.I., Archer, S., Breshears, D.D., Scholes, R.J., 2003. Conundrums in mixed woody–herbaceous plant systems. Journal of Biogeography 30, 1763–1777.
Lal, R. (Ed.), 1996. Soil Quality and Soil Erosion. CRC Press, Boca Raton, FL, USA.Lal, R., Sobecki, T.M., Iivari, T., Kimble, J.M., 2003. Soil Degradation in the United States.
CRC Press, Boca Raton, FL, USA.Lauenroth, W.K., Sala, O.E., 1992. Long-term forage production of North American
shortgrass steppe. Ecological Applications 2, 397–403.Lee, J.A., 1991a. Near-surface wind flow around desert shrubs. Physical Geography 12,
140–146.Lee, J.A., 1991b. The role of desert shrub size and spacing on wind-profile parameters.
Physical Geography 12, 72–89.Lee, B.E., Soliman, B.F., 1977. Investigation of forces on 3 dimensional bluff bodies in
rough wall turbulent boundary-layers. Journal of Fluids Engineering-Transactionsof the ASME 99, 503–510.
Loik, M.E., Breshears, D.D., Lauenroth, W.K., Belnap, J., 2004. Amulti-scale perspective ofwater pulses in dryland ecosystems: climatology and ecohydrology of the westernUSA. Oecologia 14, 269–281.
Martens, S.N., Breshears, D.D., Meyer, C.W., 2000. Spatial distributions of understorylight along the grassland/forest continuum: effects of cover, height, and spatialpattern of tree canopies. Ecological Modelling 126, 79–93.
Martens, S.N., Breshears, D.D., Barnes, F.J., 2001. Development of species dominancealong an elevational gradient: population dynamics of Pinus edulis and Juniperusmonosperma. International Journal of Plant Sciences 162, 777–783.
Masri, Z., Zobisch, M., Bruggeman, A., Hayek, P., Kardous, M., 2003. Wind erosion in amarginal Mediterranean dryland area: a case study from the Khanasser Valley,Syria. Earth Surface Processes and Landforms 28, 1211–1222.
McClaran,M.P. 2003. A centuryof vegetation changeon theSanta Rita ExperimentalRange.Pages 16–33. In: McClaran, M.P., Ffolliott, P.F., Edminster, C.B. (Eds.). Santa RitaExperimental Range: 100 years (1903–2003) of accomplishments and contributions.RMRS-P-30. U.S. Department of Agriculture, Forest Service, Rocky Mountain ResearchStation, Ogden UT.
McGowan, H., Ledgard, N., 2005. Enhanced dust deposition by trees recently establishedon degraded rangeland. Journal of the Royal Society of New Zealand 35, 269–277.
McPherson, G.R., 1997. Ecology and Management of North American Savannas. Universityof Arizona Press, Tucson, AZ, USA.
Miller, R.L., Tegen, I., 1998. Climate response to soil dust aerosols. Journal of Climate 11,3247–3267.
Nearing, M.A., Romkens, M.J.M., Norton, L.D., Stott, D.E., Rhoton, F.E., Laflen, J.M., Flanagan,D.C., Alonso, C.V., Binger, R.L., Dabney, S.M., Doering, O.C., Huang, C.H., McGregor, K.C.,Simon, A., 2000. Measurements andmodels of soil loss rates. Science 290,1300–1301.
Neff, J.C., Reynolds, R.L., Belnap, J., Lamothe, P., 2005.Multi-decadal impacts of grazing onsoil physical and biogeochemical properties in southeast Utah. Ecological Applica-tions 15, 87–95.
Okin, G.S., Gillette, D.A., 2001. Distribution of vegetation in wind-dominated land-scapes: Implications for wind erosionmodeling and landscape processes. Journal ofGeophysical Research-Atmospheres 106, 9673–9683.
Okin, G.S., Gillette, D.A., Herrick, J.E., 2006. Multi-scale controls on and consequences ofaeolian processes in landscape change in arid and semi-arid environments. Journalof Arid Environments 65, 253–275.
Painter, T.H., Barrett, A.P., Landry, C.C., Neff, J.C., Cassidy, M.P., Lawrence, C.R., McBride, K.E.,Farmer, G.L., 2007. Impact of disturbed desert soils on duration of mountain snowcover. Geophysical Research Letters 34, L12502. doi:10.1029/2007GL030284.
Peters, D.P.C., Bestelmeyer, B.T., Herrick, J.E., Fredrickson, E.L., Monger, H.C., Havstad, K.M.,2006. Disentangling complex landscapes: new insights into arid and semiarid systemdynamics. Bioscience 56, 491–501.
Pimentel, D., Harvey, C., Resosudarmo, P., Sinclair, K., Kurz, D., Mcnair, M., Crist, S.,Shpritz, L., Fitton, L., Saffouri, R., Blair, R., 1995a. Environmental and economic costsof soil erosion and conservation benefits. Science 267, 1117–1123.
Pimentel, D.,Harvey, C., Resosudarmo, P., Sinclair, K., Kurz, D.,McNair,M., Crist, S., Shpritz, L.,Fitton, L., Saffouri, R., Blair, R., 1995b. Soil-erosion estimates and costs — reply. Science269, 464–465.
Pye, K., 1987. Aeolian Dust and Dust Deposits. Academic Press, London.Raupach, M.R., Thom, A.S., Edwards, I., 1980. Awind tunnel study of turbulent flow close
to regularly arrayed rough surfaces. Boundary Layer Meteorology 18, 373–397.Raupach, M.R., Gillette, D.A., Leys, J.F., 1993. The effect of roughness elements on wind
erosion threshold. Journal of Geophysical Research-Atmospheres 98, 3023–3029.Reynolds, R.L., Belnap, J., Reheis, M., Lamothe, P., Luiszer, F., 2001. Aeolian dust in
Colorado Plateau soils: nutrient inputs and recent change in source. Proceedings ofthe National Academy of Sciences of the United States of America 98, 7123–7127.
Reynolds, R., Neff, J., Reheis, M., Lamothe, P., 2006a. Atmospheric dust in modem soil onaeolian sandstone, Colorado Plateau (USA): variation with landscape position andcontribution to potential plant nutrients. Geoderma 130, 108–123.

38 D.D. Breshears et al. / Geomorphology 105 (2009) 28–38
Reynolds, R.L., Reheis, M., Yount, J., Lamothe, P., 2006b. Composition of aeolian dust innatural traps on isolated surfaces of the central Mojave desert— insights to mixing,sources, and nutrient inputs. Journal of Arid Environments 66, 42–61.
Reynolds, R.L., Reheis, M.C., Neff, J.C., Goldstein, H., Yount, J., 2006c. Late quaternary eoliandust in surficial deposits of a Colorado Plateau grassland: controls on distribution andecologic effects. Catena 66, 251–266.
Rich, P.M., Breshears, D.D., White, A.B., 2008. Phenology of mixed woody–herbaceousecosystems following extreme events: net changes fromdifferential responses. Ecology89, 342–352.
Rosenfeld, D., Rudich, Y., Lahav, R., 2001. Desert dust suppressing precipitation: apossible desertification feedback loop. Proceedings of the National Academy ofSciences of the United States of America 98, 5975–5980.
Schlesinger, W.H., Reynolds, J.F., Cunningham, G.L., Huenneke, L.F., Jarrell, W.M.,Virginia, R.A., Whitford, W.G., 1990. Biological feedbacks in global desertification.Science 247, 1043–1048.
Shao, Y., Dong, C.H., 2006. A review on east Asian dust storm climate, modeling andmonitoring. Global and Planetary Change 52, 1–22.
Shirato, Y., Taniyama, I., Zhang, T.H., 2004. Changes in soil properties after afforestationin Horqin sandy land, North China. Soil Science and Plant Nutrition 50, 537–543.
Toy, T.J., Foster, G.R., Renard, K.G., 2002. Soil Erosion: Processes, Prediction, Measure-ment and Control. John Wiley & Sons, New York.
Trimble, S.W., Crosson, P., 2000a. Land use — US soil erosion rates — myth and reality.Science 289, 248–250.
Trimble, S.W., Crosson, P., 2000b. Measurements and models of soil loss rates— response.Science 290, 1301.
Urban, M.A., Daniels, M., 2006. Introduction: exploring the links between geomorphol-ogy and ecology. Geomorphology 77, 203–206.
van Donk, S.J., Huang, X.W., Skidmore, E.L., Anderson, A.B., Gebhart, D.L., Prehoda, V.E.,Kellogg, E.M., 2003.Wind erosion frommilitary training lands in theMojave Desert,California, USA. Journal of Arid Environments 54, 687–703.
Vermeire, L.T., Wester, D.B., Mitchell, R.B., Fuhlendorf, S.D., 2005. Fire and grazing effectsonwind erosion, soil water content, and soil temperature. Journal of EnvironmentalQuality 34, 1559–1565.
Warner, T.T., 2004. Desert Meteorology. Cambridge, New York.Whicker, J.J., Breshears, D.D., 2004. Assessing wind erosion as a contaminant transport
mechanism at Area G. Los Alamos National Laboratory report LA-UR-04-8553.Whicker, J.J., Breshears, D.D.,Wasiolek, P.T., Kirchner, T.B., Tavani, R.A., Schoep, D.A., Rodgers,
J.C., 2002. Temporal and spatial variation of episodic wind erosion in unburned andburned semiarid shrubland. Journal of Environmental Quality 31, 599–612.
Whicker, J.J., Pinder, J.E., Breshears, D.D., 2006a. Increased wind erosion from forestwildfire: Implications for contaminant-related risks. Journal of EnvironmentalQuality 35, 468–478.
Whicker, J.J., Pinder III, J.E., Breshears, D.D., Eberhardt, C.F., 2006b. From dust to dose:effects of forest disturbance on increased inhalation exposure. Science of the TotalEnvironment 368, 519–530.
Whicker, J.J., Pinder III, J.E., Breshears, D.D., 2007a. Thinning semiarid forests amplifieswind erosion comparable to wildfire: implications for restoration and soil stability.Journal of Arid Environments 72, 494–508.
Whicker, J.J., Pinder III, J.E., Ibrahim, S.A., Stone, J.M., Breshears, D.D., Baker, K.N., 2007b.Uranium partition coefficients (Kd) in forest surface soil reveal long equilibriumtimes and vary by site and soil size fraction. Health Physics 93, 36–46.
Whitford, W.G., 2002. Ecology of Desert Systems. Academic Press, San Diego, CA, USA.Wolfe, S.A., Nickling, W.G., 1993. The protective role of sparse vegetation in wind
erosion. Progress in Physical Geography 17, 50–68.Zhao, C.X., Zheng, D.W., Stigter, C.J., He, W.Q., Tuo, D.B., Zhao, P.Y., 2006. An index
guiding temporal planting policies for wind erosion reduction. Arid Land Researchand Management 20, 233–244.
Zobeck, T.M., Sterk, G., Funk, R., Rajot, J.L., Stout, J.E., Van Pelt, R.S., 2003. Measurementand data analysis methods for field-scale wind erosion studies and modelvalidation. Earth Surface Processes and Landforms 28, 1163–1188.