Embed Size (px)
Citation preview
A Computer Modeling Study on the Acoustical Characteristics of the Concert Hall
East Harbour Project, Concert and Conference Center Reykjavík, Iceland
Artec Project No. 3760
Report 7763
21 December 2007

Report 7763 Artec Consultants Inc
Project 3760 2
1 Overview In order to assess the acoustical characteristics of the Concert Hall design, a computer model has been developed. This model was constructed in AutoCAD 2006, and it served as input to the CATT-Acoustic modeling program (version 7.2). This model represents the basic room design as of May 2007 with the reverberation doors in the closed position. This computer model does not attempt to model the effect of the reverberation chambers because of the limitations of this CATT software.
Figure 1.1: Basic Computer Model in CATT-Acoustic Modeling Program
1.1 Absorption Coefficients Recommended surface materials for all room surfaces of the model have been defined by their respective sound absorption characteristics (absorption coefficients) within the acoustic modeling program. These have been defined as follows for purposes of this model:
Material 125 250 500 1000 2000 4000 Location Wood on Concrete 0.05 0.05 0.05 0.05 0.05 0.05 All walls
Concrete 0.02 0.02 0.02 0.04 0.05 0.05 Balcony fronts and undersides and ceiling
Concrete Floor 0.01 0.01 0.02 0.02 0.02 0.02 Audience floors Audience 0.52 0.68 0.85 0.97 0.93 0.85 Audience and musicians
Wood 0.19 0.14 0.09 0.06 0.05 0.1 Movable canopy Wood Floor 0.40 0.30 0.20 0.17 0.15 0.10 Stage floor
Organ 0.53 0.25 0.30 0.30 0.30 0.15 Organ Absorptive Banners 0.1 0.26 0.47 0.61 0.57 0.53 Sound absorbing banners
(on all wall surfaces)
Report 7763 Artec Consultants Inc
Project 3760 3
The model also allows sound absorptive banners (weight = 25 oz./linear yard) to be “extended” in front of all wall surfaces as they would be used in the actual hall. The room’s physical parameters are 25.2 meters (width), 50.8 meters (length – measured from back wall of 3rd tier to front of organ zone), and 22 meters (height from stage to ceiling). Some architectural modifications to the basic room design have been made since the model was constructed. These modifications are not currently presented in the model as it will not significantly alter the results from the modeling analysis.
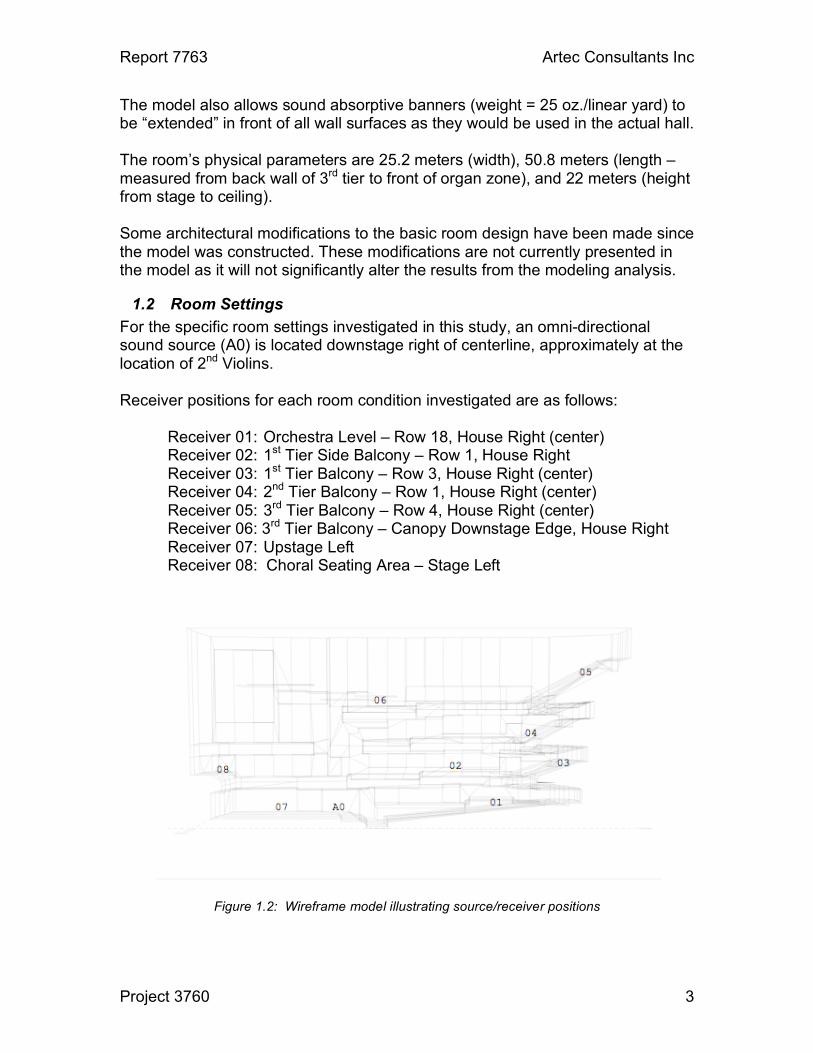
1.2 Room Settings For the specific room settings investigated in this study, an omni-directional sound source (A0) is located downstage right of centerline, approximately at the location of 2nd Violins. Receiver positions for each room condition investigated are as follows:
Receiver 01: Orchestra Level – Row 18, House Right (center) Receiver 02: 1st Tier Side Balcony – Row 1, House Right Receiver 03: 1st Tier Balcony – Row 3, House Right (center) Receiver 04: 2nd Tier Balcony – Row 1, House Right (center) Receiver 05: 3rd Tier Balcony – Row 4, House Right (center) Receiver 06: 3rd Tier Balcony – Canopy Downstage Edge, House Right Receiver 07: Upstage Left Receiver 08: Choral Seating Area – Stage Left
Figure 1.2: Wireframe model illustrating source/receiver positions

Report 7763 Artec Consultants Inc
Project 3760 4
Since the use of the vertically moving canopy and sound absorbing banners provides considerable acoustical flexibility, the following room “settings” were examined in this study (all vertical dimensions of canopies are measured from stage floor to the underside of the canopy):
• Setting 1 – Downstage canopy set to 14.0 meters; middle canopy at 14.7 meters; upstage canopy at 15.5 meters. This may be a setting appropriate for large orchestra events.
• Setting 2 – Similar to Setting 1, but with addition of sound absorbing
banners on walls of upper volume (above 14 meters).
Figure 1.3: Room Settings 1-2
• Setting 3 – Downstage canopy set to 16.0 meters; middle canopy at 16.7 meters; upstage canopy at 17.5 meters, with addition of sound absorbing banners over all wall surfaces. This would be an appropriate setting for most amplified events.
• Setting 4 – Similar setting to Setting 3 with no sound absorbing banners.
This may be an appropriate setting for organ music.
Report 7763 Artec Consultants Inc
Project 3760 5
Figure 1.4: Room Settings 3 - 4
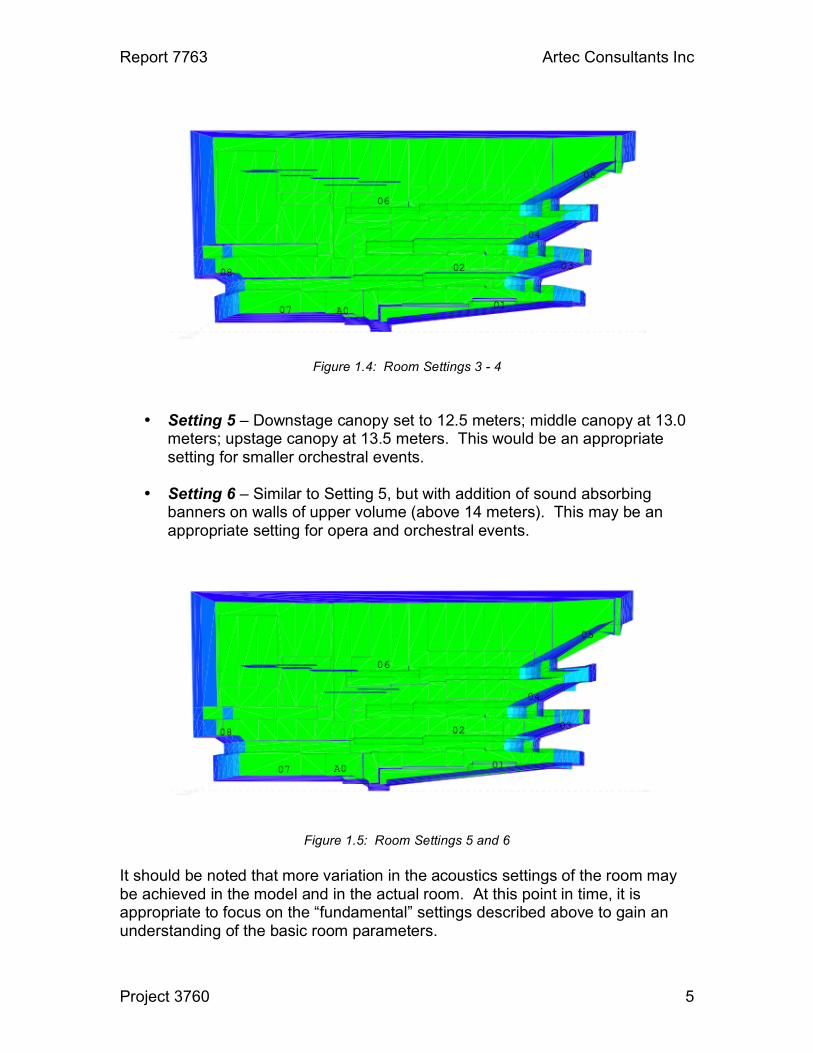
• Setting 5 – Downstage canopy set to 12.5 meters; middle canopy at 13.0 meters; upstage canopy at 13.5 meters. This would be an appropriate setting for smaller orchestral events.
• Setting 6 – Similar to Setting 5, but with addition of sound absorbing
banners on walls of upper volume (above 14 meters). This may be an appropriate setting for opera and orchestral events.
Figure 1.5: Room Settings 5 and 6
It should be noted that more variation in the acoustics settings of the room may be achieved in the model and in the actual room. At this point in time, it is appropriate to focus on the “fundamental” settings described above to gain an understanding of the basic room parameters.

Report 7763 Artec Consultants Inc
Project 3760 6
2 Definition of Acoustic Parameters For each source/receiver position, the CATT-Acoustic computer program calculates the primary path of direct sound and those reflected off the room’s boundary surfaces. Each of these sound reflections will arrive at a different time and amplitude (volume) depending on the specific path and the acoustical properties of the physical surfaces the sound rays strike on their way from source to receiver. The collection of these sound rays form the acoustical signature of what one will hear at that specific location, under the particular room condition. This acoustical signature can be graphically represented as an “echogram”, or “impulse response” – the response of the room to an impulsive sound source. The terms “impulse response” and “echogram” will be used interchangeably within this report. The impulse response is essentially a history of the direct and reflected sound volume arriving at a particular location as a function of time. From the impulse responses, specific acoustical quantities are calculated that correlate to objective impressions of how a listener may perceive certain attributes of the sound in the room under those conditions.
Figure 2.1: Typical calculated echogram (receiver position 01 - room setting 1). Direct sound is at time t = 0 ms. “Bars” following direct sound are reflected sound reflections off room boundaries.
Reverberation time T-30 at 500 Hz is calculated by black line (1.98 sec.)

Report 7763 Artec Consultants Inc
Project 3760 7
Definitions of the calculated acoustical quantities follow:
2.1 Reverberation Time (RT or T-30) The reverberation time (RT) is originally defined as the time it takes for the sound to decay from 0dB to -60 dB in level. In practice, as in the model, it is defined as the time, multiplied by a factor of two, taken for the sound to decay from -5 dB to -35 dB from its steady state value. This is referenced in the model as the parameter “T-30”. T-30 is physically derived in the model from a straight-line least-square fit to the calculated decay curve from each echogram (impulse response).
Figure 2.2: Calculated T-30 values (in black) by octave band (at receiver position 01 – main floor,
room setting 1) CATT-Acoustic also calculates reverberation time by classical Sabine and Eyring equations utilizing basic volumetric and absorption information contained in the model. However, the T-30 parameter is at this time a more accurate assessment of the reverberation time in the model as it is calculated from the echogram derived directly from the model. For ease of presentation, the T-30 parameter is presented in some portions of this study as T-30mid. This is defined as the average of the T-30 at the 500 Hz and 1000 Hz octave bands. Full octave band data at each listener location is provided in an Excel worksheet attached under separate cover.

Report 7763 Artec Consultants Inc
Project 3760 8
2.2 Clarity (C80) The parameter C80 , expressed in decibels, is the ratio of the (early) sound energy arriving at a given point (listener) within the first 80 ms of the direct sound to the (reverberant) sound energy arriving after 80 ms. This parameter correlates with clarity of the sound, and is calculated directly from the impulse response. A higher positive value of C80 correlates with greater clarity, a higher negative value correlates with a more reverberant (less clear) sound. The value C80(3) is equal to the average of individual C80 values in the 500 Hz, 1000 Hz and 2000 Hz and is presented in this study as a means to compare equivalent values at several listener locations more easily. Full octave band data at each listener location is provided in an Excel worksheet attached under separate cover.
2.3 Loudness, Strength of Sound (G10) One of the more important parameters in a concert room is the strength of sound at a given listening position. It is defined as the ratio, expressed in decibels, of the sound energy at a listener position in a hall from a non-directional sound source to the sound energy from the same source when measured in an anechoic room at a distance of 10 meters. This is described as the parameter G10 and is calculated in 6 octave bands from 125 Hz through 4000 Hz. High, positive values of G10 correlate to subjective impressions of stronger (louder) sound than lower values and negative values. It should be noted that loudness is affected by several physical features: 1) the physical distance of the listener to the stage, 2) the surfaces that help to reflect early sound energy to the listener, 3) the acoustical surface area of audience and orchestra, and volume of the hall, 4) materials that absorb sound, such as banners, seats, organs, etc. It is not uncommon to have a 2-4 dB decrease in sound level from center of hall to rear of hall. For purposes of presentation, we define the parameters G10, low as the average values of G10 in the 125 Hz and 250 Hz octave bands, and G10, mid as the average values of G10 on the 500 Hz and 1000 Hz octave bands. Full octave band data at each listener location is provided in an Excel worksheet attached under separate cover.
2.4 Lateral Energy Fraction (LEF) A measure of the strength of laterally arriving energy (i.e. the energy that arrives at a listener from the sides rather than the front) was devised by Barron and

Report 7763 Artec Consultants Inc
Project 3760 9
Marshall in 1981. This measure, LEF, is defined as the ratio of the sound energy arriving laterally to the total sound energy at a given listener position in the hall. It is expressed as a ratio (i.e. values between 0 and 1). LEF correlates well with subjective impressions of the spatial qualities of the sound source on stage or the “apparent source width”. In other words, this is the broadening of the sound source beyond its visual width as a result of lateral reflections from the room boundaries. Two values of LEF are calculated by the CATT-Acoustic program, called LEF1 and LEF2. The only difference between the two measures is that LEF1 uses a cosine function where LEF2 uses a cosine-squared function. LEF2 is presented in the model as it is described by the authors of the program to be an “easier to measure” parameter, and can thus be compared to measured data. We note that both parameters LEF1 and LEF2 are presented in the Excel worksheet as a function of frequency.
2.5 Initial Time Delay Gap (ITDG) The Initial Time Delay Gap (ITDG) is defined as the physical time between the direct sound reaching the listener and the first reflection. It is a measure that is calculated directly from the impulse response and can be roughly correlated with the impression of “intimacy” – the subjective impression of listening to music in a large space and having it sound like a small space. Smaller values of ITDG denote greater sense of intimacy.
3 Analysis
3.1 Consistency of Sound One of the fundamental questions worth investigation is how consistent the various acoustical parameters throughout the audience seating area are for a given room setting, and whether the general trends among seating areas are consistent as the room is changed (i.e. do the different room settings produce consistent changes to the room as a whole?). The parameters C80(3), G10, mid , G10, low , and T-30 are plotted in bar format against each of the eight room settings defined earlier in the study.

Report 7763 Artec Consultants Inc
Project 3760 10
Figure 3.1: C80 (3) at listening positions in the hall as a function of room setting.
We note that for settings 1-6, where the difference in settings is attributable solely to the amount of absorption in the room, that the variation from seat to seat (i.e. the trend) remains fairly consistent. When all absorptive banners are extended in the room, there is a marked increase in C80 values, which is appropriate for audio systems usage. Variation by seating location per setting is within 2-3 dB at each setting, excluding receivers 7 and 8, which tend to have higher clarity factors due to their proximity to the source.
Report 7763 Artec Consultants Inc
Project 3760 11
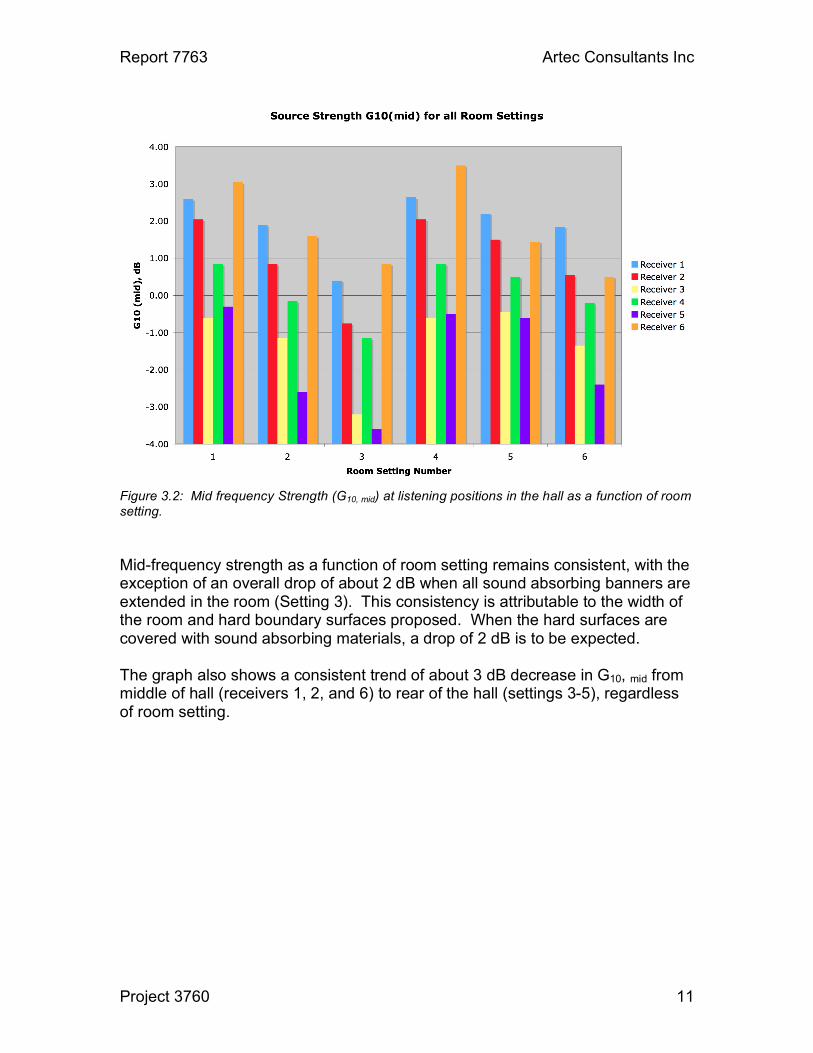
Figure 3.2: Mid frequency Strength (G10, mid) at listening positions in the hall as a function of room setting. Mid-frequency strength as a function of room setting remains consistent, with the exception of an overall drop of about 2 dB when all sound absorbing banners are extended in the room (Setting 3). This consistency is attributable to the width of the room and hard boundary surfaces proposed. When the hard surfaces are covered with sound absorbing materials, a drop of 2 dB is to be expected. The graph also shows a consistent trend of about 3 dB decrease in G10, mid from middle of hall (receivers 1, 2, and 6) to rear of the hall (settings 3-5), regardless of room setting.

Report 7763 Artec Consultants Inc
Project 3760 12
Figure 3.3: Low Frequency Strength (G10, low) at listening positions in the hall as a function of room setting.
The graph of the low-frequency strength shows similar characteristics to that of the mid-frequency strength throughout the hall. Strength is higher overall as compared to the mid-frequency strength by about 1.5 dB to 2 dB, and can be attributed to the heavy wood-on-concrete surfaces in the room for good support of these frequencies. We note that the deviation between the hard room condition (setting 1) and when all of the absorptive banners are extended (setting 2) varies by only about 1 dB – less than that of the mid-frequency strength. This is likely due to the lower absorption characteristics of the sound absorbing banners at these frequencies. Deviations in low-frequency strength as a function of seating location vary by 2.5 dB to 3 dB from middle of hall (receivers 1, 2, and 6) to rear of hall (receivers 3 - 5), a trend similar to that shown for the mid-frequency strength.

Report 7763 Artec Consultants Inc
Project 3760 13
Figure 3.4: Reverberation Time (T-30, mid) at listening positions in the hall as a function of room setting. As would be expected, considerable variation in mid-frequency reverberation time is seen as a function of room setting, primarily due to the introduction of sound absorbing materials into the room, and also due to changes to canopy height. Variation of more than one second is achievable by extending all of the banners into the room (setting 4 v. setting 3). The variation is a bit less at the upper balcony, where the listener receives more reverberant energy. A variation of about 0.5 seconds is seen in the upper balcony when the ceiling is at a low position and sound absorbing banners are introduced into the upper volume of the hall (setting 5 v. setting 6). Variation of 0.5 seconds is found when the canopy is at a high position and sound absorbing banners are introduced into the upper volume of the hall (setting 5 v. setting 6).
3.2 Lateral Energy in the Concert Hall The amount of lateral energy received by a listener in the hall is directly related to the plan geometry of the venue, its width (which affects strength and time arrival of the reflections), and the amount/degree of horizontal surfaces along the side walls that can direct sound energy to the listener in a lateral direction.

Report 7763 Artec Consultants Inc
Project 3760 14
A narrow, shoebox-style, or modified shoebox-style geometry has been shown through many studies by acousticians and scientists throughout the world to be preferable in developing strong lateral energy to listeners. Measured values of LEF in some highly regarded concert venues (Musikverein, Boston Symphony Hall, Concertgebouw) have LEF values (average of 4 octave bands, starting at the 125-Hertz band) in the range of 0.16 – 0.22. As a comparison, we have plotted calculated values of LEF2 (also 4-band averages) from the CATT-Acoustic program by audience position for room setting 1, mid-height canopy with no absorption on the walls.
Figure 3.5: Lateral Energy Fraction (LEF2 – 4-band averages) at each listener position for
reflective room conditions, with comparative measured data for other concert venues. Four-band averages of LEF2 in the audience seating areas range from .19 to .31 (position 1) for this room setting To assess the room geometry, we have also plotted LEF2 on a plan of the model to indicate the variation or consistency of lateral energy over the audience area. This plot is for the 1000-Hz. octave band over a period of 20 to 80 ms after the direct sound, as the early energy accounts for a significant portion of a listener’s spatial impression.

Report 7763 Artec Consultants Inc
Project 3760 15
Figure 3.6: Main floor audience mapping of Lateral Energy Fraction (in %) in time intervals from 20 ms to 50 ms (top); 50 ms to 80 ms (middle); and 80 ms to 200 ms (bottom).

Report 7763 Artec Consultants Inc
Project 3760 16
From these plots, it is evident that there is strong lateral energy build-up in the front of the room within the very early time period prior to 50 ms from the direct sound, consistent with narrow, shoebox-style shaping. In the period from 50 ms to 80 ms, there is a strong, consistent amount of lateral energy throughout the main floor (between 20% and 30% in the central area of the main floor). During the later portion of the sound field (past 80 ms), the degree of lateral energy reaching listeners on the main floor is quite consistent throughout the entire seating area, approaching 40-50% in many areas. These levels of lateral energy are consistent with excellent spatial qualities of the sound field, and coupled with appropriate reverberation, a very enveloping quality to the sound is expected from these results.
3.3 Effect of Canopy Height The figures below show the effect on onstage acoustics when varying the canopy height over the platform. C-80 and T-30 are used for this analysis. The graphs show that clarity can be influenced significantly by canopy height (up to 1.5 dB in mid-frequencies), but there is relatively little change onstage in reverberation time when canopy heights are adjusted.
Figure 3.7: C80 as a function of frequency for a receiver onstage at various ceiling heights over
the platform.

Report 7763 Artec Consultants Inc
Project 3760 17
Figure 3.8: C80 as a function of frequency for a receiver in orchestra seating area at various
ceiling heights over the platform.
We do see a marked increase in clarity (C80) values when the ceiling is at lower heights. This is as expected, and is accounted for as a result of ceiling reflections arriving to the listener more quickly as the ceiling gets physically closer to the seating areas.
Figure 3.8 indicates little modification to the reverberation time onstag e with the canopy in different positions. However, canopy height does affect reverberation time at other seats throughout the audience as shown previously in this document.
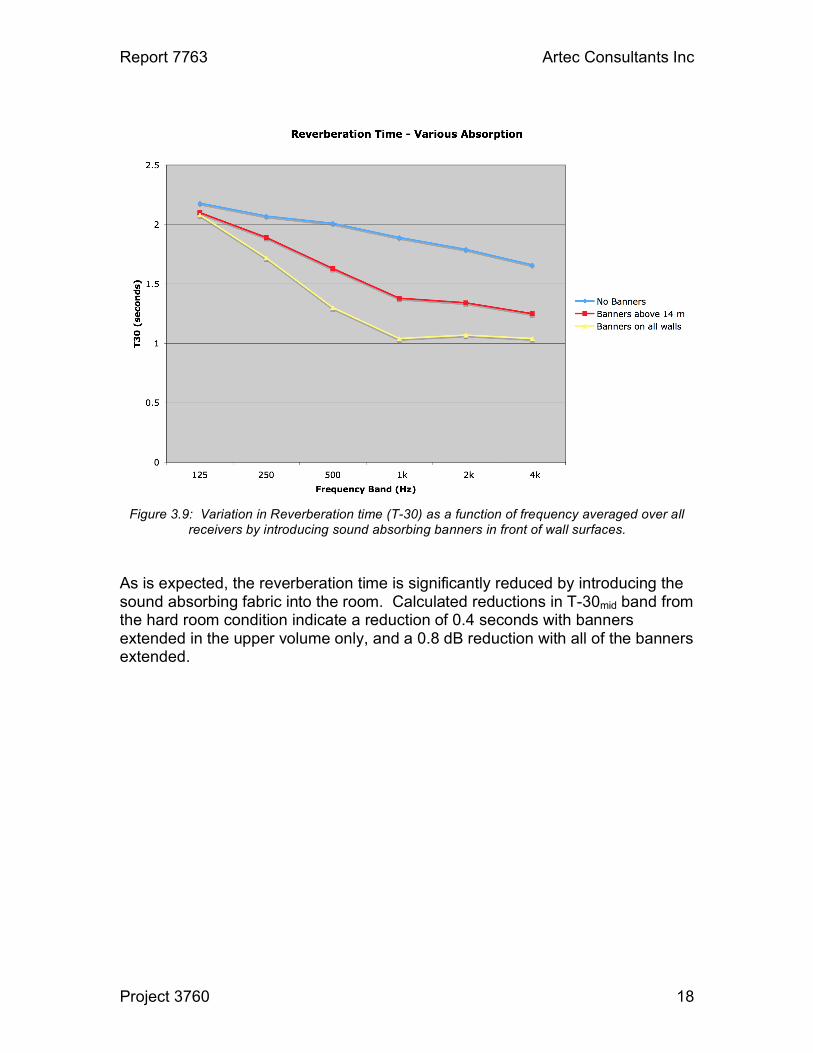
3.4 Effect of Sound Absorbing Banners In addition to the vertically moving canopy, means to control the room’s natural reverberation characteristics and clarity, are provided by means of heavy sound absorbing fabrics that can be extended in front of the hard wall surfaces in the room. To examine the effect of the sound absorbing banners on the room acoustics, the parameters T-30 and C80 were plotted as a function of frequency for a receiver at the orchestra level (receiver 1) under three conditions: all banners retracted (no absorption in room), banners extended only in the upper volume above 14 meters, and all banners extended into the room.
Report 7763 Artec Consultants Inc
Project 3760 18
Figure 3.9: Variation in Reverberation time (T-30) as a function of frequency averaged over all
receivers by introducing sound absorbing banners in front of wall surfaces. As is expected, the reverberation time is significantly reduced by introducing the sound absorbing fabric into the room. Calculated reductions in T-30mid band from the hard room condition indicate a reduction of 0.4 seconds with banners extended in the upper volume only, and a 0.8 dB reduction with all of the banners extended.

Report 7763 Artec Consultants Inc
Project 3760 19
Figure 3.10: Variation in Clarity (C80) as a function of frequency for a receiver in orchestra
seating area by introducing sound absorbing banners in front of wall surfaces. As banners are introduced into the room, clarity is significantly increased. This is also as expected from the previous graphs of reverberation time in the room and hence, increasing clarity. These attributes are desired and will be important particularly for amplified events, but also for various styles of music.

Report 7763 Artec Consultants Inc
Project 3760 20
4 Concluding Remarks In general, based on the results of this study, we offer the following conclusions: • The acoustic parameters as a function of room setting are consistent from
seat to seat. Varying the room setting affects the entire room in a consistent manner.
• The room acoustics parameters appear to be within the appropriate ranges to produce high quality acoustics in all seating areas. We therefore confirm that the hall’s acoustical design depicted in the model meets the design goals and quality expectations of the project.
• Strong and consistent percentages of lateral energy across the seating area confirms appropriate room geometry.
• The adjustable features which modify the acoustical characteristics of the room (i.e. the canopy and sound absorbing banners) are performing as intended and create measurable and appropriate changes to the room acoustics.