Embed Size (px)
Citation preview
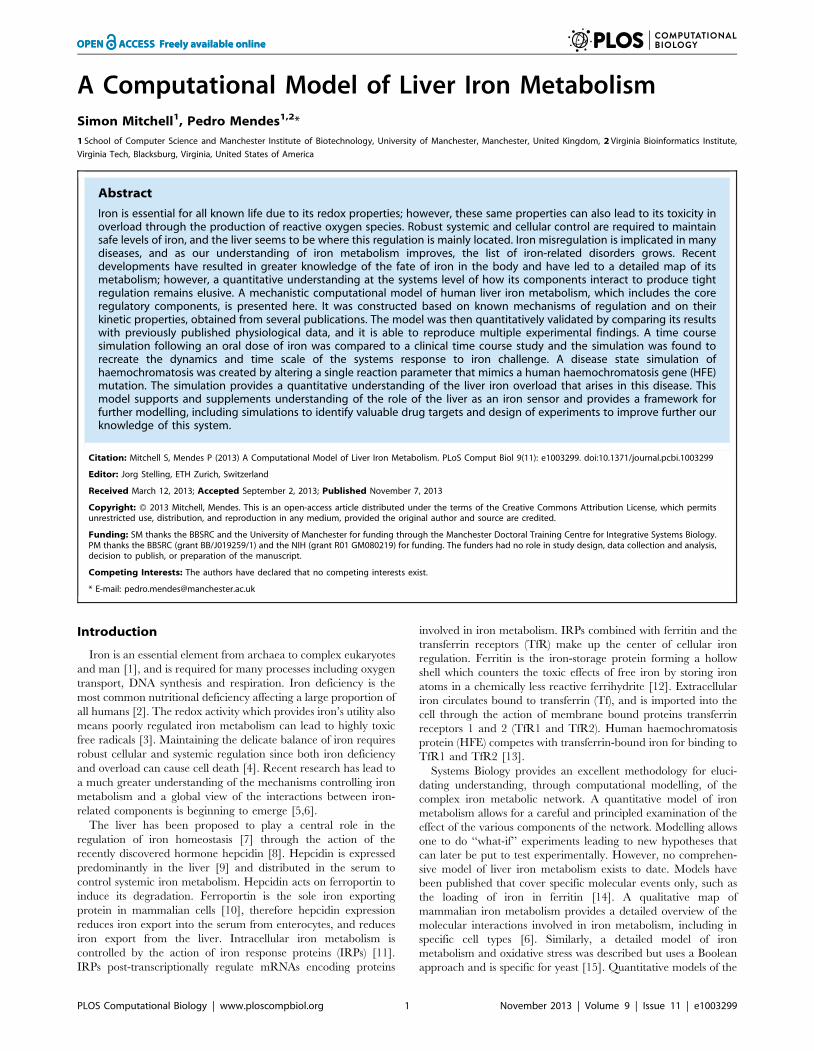
A Computational Model of Liver Iron MetabolismSimon Mitchell1, Pedro Mendes1,2*
1 School of Computer Science and Manchester Institute of Biotechnology, University of Manchester, Manchester, United Kingdom, 2 Virginia Bioinformatics Institute,
Virginia Tech, Blacksburg, Virginia, United States of America
Abstract
Iron is essential for all known life due to its redox properties; however, these same properties can also lead to its toxicity inoverload through the production of reactive oxygen species. Robust systemic and cellular control are required to maintainsafe levels of iron, and the liver seems to be where this regulation is mainly located. Iron misregulation is implicated in manydiseases, and as our understanding of iron metabolism improves, the list of iron-related disorders grows. Recentdevelopments have resulted in greater knowledge of the fate of iron in the body and have led to a detailed map of itsmetabolism; however, a quantitative understanding at the systems level of how its components interact to produce tightregulation remains elusive. A mechanistic computational model of human liver iron metabolism, which includes the coreregulatory components, is presented here. It was constructed based on known mechanisms of regulation and on theirkinetic properties, obtained from several publications. The model was then quantitatively validated by comparing its resultswith previously published physiological data, and it is able to reproduce multiple experimental findings. A time coursesimulation following an oral dose of iron was compared to a clinical time course study and the simulation was found torecreate the dynamics and time scale of the systems response to iron challenge. A disease state simulation ofhaemochromatosis was created by altering a single reaction parameter that mimics a human haemochromatosis gene (HFE)mutation. The simulation provides a quantitative understanding of the liver iron overload that arises in this disease. Thismodel supports and supplements understanding of the role of the liver as an iron sensor and provides a framework forfurther modelling, including simulations to identify valuable drug targets and design of experiments to improve further ourknowledge of this system.
Citation: Mitchell S, Mendes P (2013) A Computational Model of Liver Iron Metabolism. PLoS Comput Biol 9(11): e1003299. doi:10.1371/journal.pcbi.1003299
Editor: Jorg Stelling, ETH Zurich, Switzerland
Received March 12, 2013; Accepted September 2, 2013; Published November 7, 2013
Copyright: � 2013 Mitchell, Mendes. This is an open-access article distributed under the terms of the Creative Commons Attribution License, which permitsunrestricted use, distribution, and reproduction in any medium, provided the original author and source are credited.
Funding: SM thanks the BBSRC and the University of Manchester for funding through the Manchester Doctoral Training Centre for Integrative Systems Biology.PM thanks the BBSRC (grant BB/J019259/1) and the NIH (grant R01 GM080219) for funding. The funders had no role in study design, data collection and analysis,decision to publish, or preparation of the manuscript.
Competing Interests: The authors have declared that no competing interests exist.
* E-mail: [email protected]
Introduction
Iron is an essential element from archaea to complex eukaryotes
and man [1], and is required for many processes including oxygen
transport, DNA synthesis and respiration. Iron deficiency is the
most common nutritional deficiency affecting a large proportion of
all humans [2]. The redox activity which provides iron’s utility also
means poorly regulated iron metabolism can lead to highly toxic
free radicals [3]. Maintaining the delicate balance of iron requires
robust cellular and systemic regulation since both iron deficiency
and overload can cause cell death [4]. Recent research has lead to
a much greater understanding of the mechanisms controlling iron
metabolism and a global view of the interactions between iron-
related components is beginning to emerge [5,6].
The liver has been proposed to play a central role in the
regulation of iron homeostasis [7] through the action of the
recently discovered hormone hepcidin [8]. Hepcidin is expressed
predominantly in the liver [9] and distributed in the serum to
control systemic iron metabolism. Hepcidin acts on ferroportin to
induce its degradation. Ferroportin is the sole iron exporting
protein in mammalian cells [10], therefore hepcidin expression
reduces iron export into the serum from enterocytes, and reduces
iron export from the liver. Intracellular iron metabolism is
controlled by the action of iron response proteins (IRPs) [11].
IRPs post-transcriptionally regulate mRNAs encoding proteins
involved in iron metabolism. IRPs combined with ferritin and the
transferrin receptors (TfR) make up the center of cellular iron
regulation. Ferritin is the iron-storage protein forming a hollow
shell which counters the toxic effects of free iron by storing iron
atoms in a chemically less reactive ferrihydrite [12]. Extracellular
iron circulates bound to transferrin (Tf), and is imported into the
cell through the action of membrane bound proteins transferrin
receptors 1 and 2 (TfR1 and TfR2). Human haemochromatosis
protein (HFE) competes with transferrin-bound iron for binding to
TfR1 and TfR2 [13].
Systems Biology provides an excellent methodology for eluci-
dating understanding, through computational modelling, of the
complex iron metabolic network. A quantitative model of iron
metabolism allows for a careful and principled examination of the
effect of the various components of the network. Modelling allows
one to do ‘‘what-if’’ experiments leading to new hypotheses that
can later be put to test experimentally. However, no comprehen-
sive model of liver iron metabolism exists to date. Models have
been published that cover specific molecular events only, such as
the loading of iron in ferritin [14]. A qualitative map of
mammalian iron metabolism provides a detailed overview of the
molecular interactions involved in iron metabolism, including in
specific cell types [6]. Similarly, a detailed model of iron
metabolism and oxidative stress was described but uses a Boolean
approach and is specific for yeast [15]. Quantitative models of the
PLOS Computational Biology | www.ploscompbiol.org 1 November 2013 | Volume 9 | Issue 11 | e1003299
iron network have been recently described [16,17], yet these
include only a few components of the iron network. The model
from Chifman et al. suggests that the dynamics of this iron network
is stable [16]. Large-scale models of the metabolism of the
hepatocyte [18,19] and a generic human metabolism stoichiomet-
ric model [20] have also been published, but these contain only
four reactions relating to iron metabolism. While they include iron
transport, the receptors are not considered, and regulatory details
are absent altogether.
Existing models are therefore at two extremes of detail: very
specific and very generic — but to address questions about hepatic
iron regulation, what is desirable is a model that balances coverage
and detail. This is the aim of the present work. One of the
problems of modelling iron metabolism quantitatively and in detail
arises from the lack of parameter values for many interactions.
Recently, several of those parameters have been described in the
literature (Table 1), particularly using technologies like surface
plasmon resonance. This has enabled us to construct a detailed
mechanistic kinetic model of human hepatocyte iron metabolism.
The model has been validated by being able to reproduce data
from several disease conditions — importantly, these physiological
data were not used in constructing the model. This validation
provides a sense of confidence that the model is indeed
appropriate for understanding liver iron regulation and for
predicting the response to various environmental perturbations.
Results
Our model was constructed based on many published data on
individual molecular interactions (see Materials and Methods
section), and is available in Systems Biology Markup Language
(SBML) and COPASI formats in supplementary data, as well as
from BioModels (http://identifiers.org/biomodels.db/MODEL13
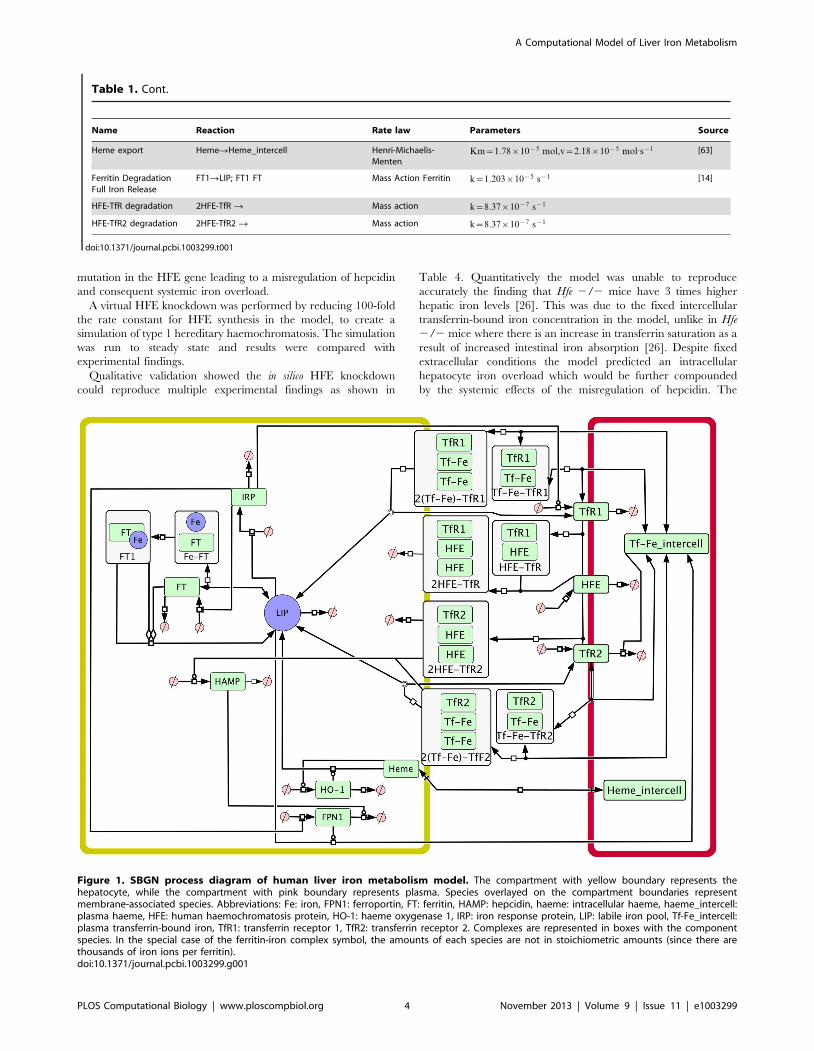
02260000) [21]. Figure 1 depicts a process diagram of the model,
using the Systems Biology Graphical Notation (SBGN) standard
[22], where all the considered interactions are shown. It is
important to highlight that while results described below are
largely in agreement with observations, the model was not forced
to replicate them. The extent of agreement between model and
physiological data provides confidence that the model is accurate
enough to carry out ‘‘what-if’’ type of experiments that can
provide quantitative explanation of iron regulation in the liver.
Steady StateInitial validation of the model was performed by assessing the
ability to recreate experimentally-observed steady-state concen-
trations of metabolites and rates of reactions. Simulations were run
to steady state using the parameters and initial conditions from
Tables 1 and 2. Table 3 compares steady-state concentrations of
metabolites and reaction rates with experimental observations.
Chua et al. [23] injected radio-labeled transferrin-bound iron
into the serum of mice and measured the total uptake of the liver
after 120 minutes. The uptake rate, when expressed as mol/s, was
close to that found at steady state by the computational model
(Table 3).
A technical aspect of note in this steady-state solution, is that it is
very stiff. This originates because one section of the model is
orders or magnitude faster than the rest: the cycle composed of
iron binding to ferritin, internalization and release. Arguably this
could be resolved by simplifying the model, but the model was left
intact because this cycling is an important aspect of iron
metabolism and allows the representation of ferritin saturation.
Even though the stiffness is high, our software is able to cope by
using an appropriate numerical method.
Response to Iron ChallengeAn oral dose of iron creates a fluctuation in serum transferrin
saturation of approximately 10% [24]. The fixed serum iron
concentration in the simulation was replaced by a transient
increase in concentration equivalent to a 10% increase in
transferrin saturation as a simulation of oral iron dosage on
hepatocytes. The simulated hepcidin response (Figure 2) is
consistent with the hepcidin response measured by Girelli et al.
[24]. The time scale and dynamics of the hepcidin response to iron
challenge has been accurately replicated in the simulation
presented here. Although the exact dynamics of the simulated
response is not validated by either experimental technique (mass
spectrometry or ELISA) the simulation appears to present an
approximation of the two experimental techniques reaching a
peak between 4 and 8 hours and returning to around basal levels
within 24 hours.
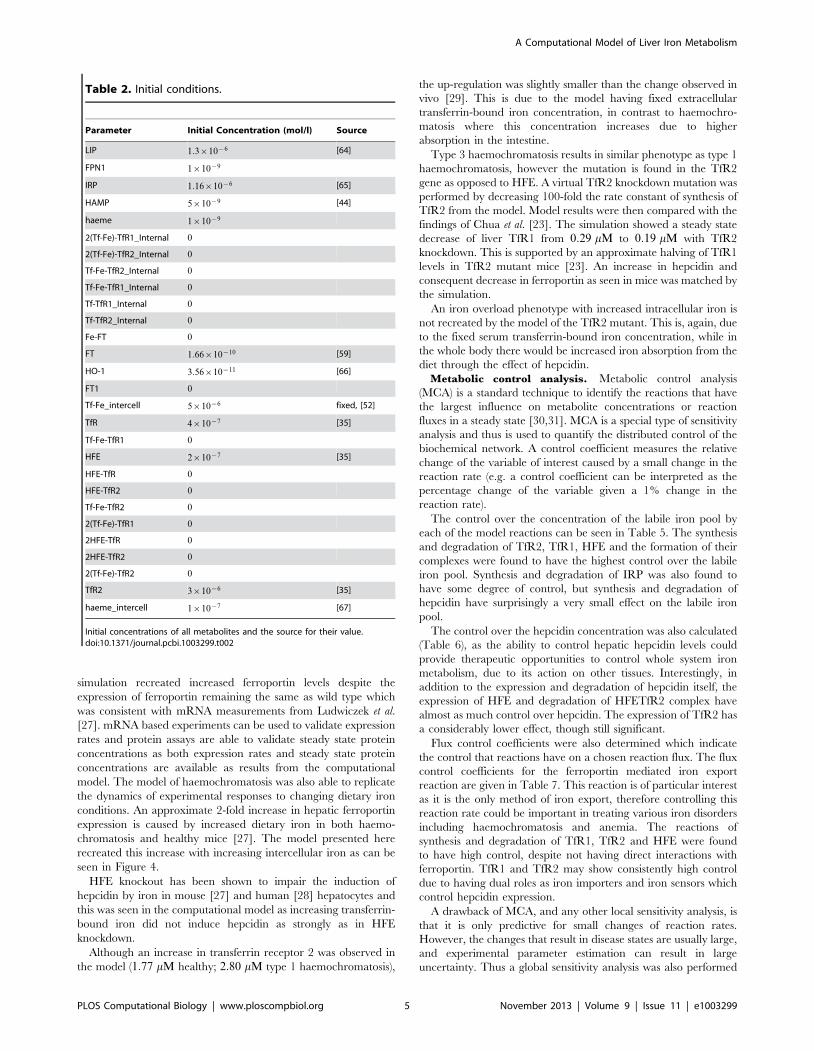
Cellular Iron RegulationThe computational model supports the proposed role of HFE
and TFR2 as sensors of systemic iron. Figure 3B shows that as the
concentration of HFE bound to TfR2 (HFE-TfR2) increases with
serum transferrin-bound iron (Tf-Fe_intercell), at the same time
the abundance of HFE bound to TfR1 (HFE-TfR1) decreases.
The increase in HFE-TfR2 complex, even though of small
magnitude, promotes increased expression of hepcidin (Figure 3A).
It is through this mechanism that liver cells sense serum iron levels
and control whole body iron metabolism through the action of
hepcidin. Although the labile iron pool increases with serum
transferrin-bound iron in this simulation, this is only because the
model does not include the action of hepcidin in reducing
duodenal export of iron. Expression and secretion of hepcidin will
have a global effect of reducing the labile iron pool.
Hereditary Haemochromatosis SimulationHereditary haemochromatosis is the most common hereditary
disorder with a prevalence higher than 1 in 500 [25]. Type 1
haemochromatosis is the most common and is caused by a
Author Summary
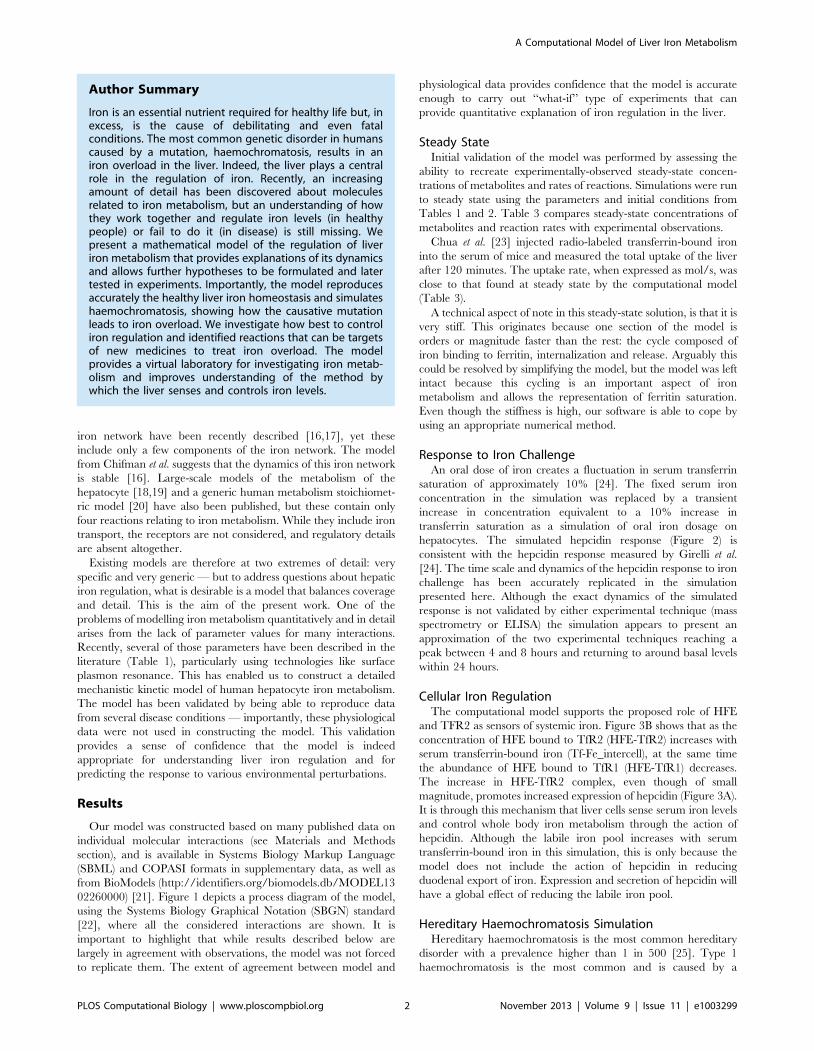
Iron is an essential nutrient required for healthy life but, inexcess, is the cause of debilitating and even fatalconditions. The most common genetic disorder in humanscaused by a mutation, haemochromatosis, results in aniron overload in the liver. Indeed, the liver plays a centralrole in the regulation of iron. Recently, an increasingamount of detail has been discovered about moleculesrelated to iron metabolism, but an understanding of howthey work together and regulate iron levels (in healthypeople) or fail to do it (in disease) is still missing. Wepresent a mathematical model of the regulation of liveriron metabolism that provides explanations of its dynamicsand allows further hypotheses to be formulated and latertested in experiments. Importantly, the model reproducesaccurately the healthy liver iron homeostasis and simulateshaemochromatosis, showing how the causative mutationleads to iron overload. We investigate how best to controliron regulation and identified reactions that can be targetsof new medicines to treat iron overload. The modelprovides a virtual laboratory for investigating iron metab-olism and improves understanding of the method bywhich the liver senses and controls iron levels.
A Computational Model of Liver Iron Metabolism
PLOS Computational Biology | www.ploscompbiol.org 2 November 2013 | Volume 9 | Issue 11 | e1003299
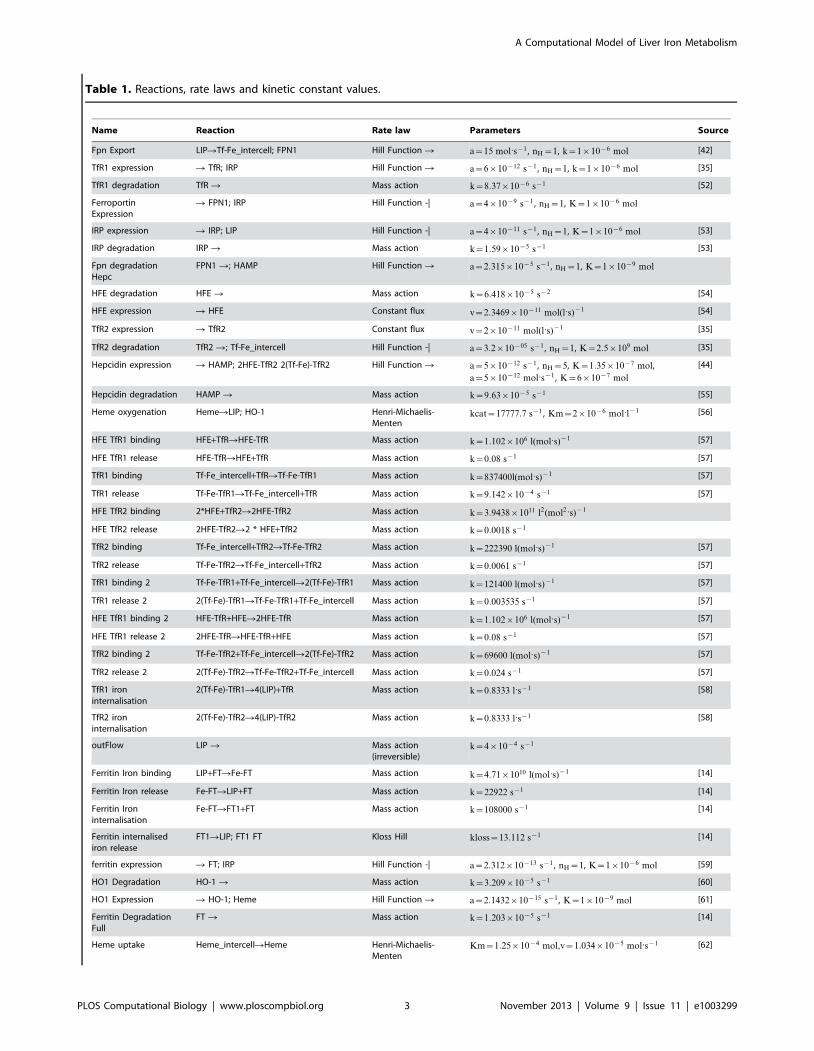
Table 1. Reactions, rate laws and kinetic constant values.
Name Reaction Rate law Parameters Source
Fpn Export LIPRTf-Fe_intercell; FPN1 Hill Function R a~15 mol:s{1 , nH~1, k~1|10{6 mol [42]
TfR1 expression R TfR; IRP Hill Function R a~6|10{12 s{1 , nH~1, k~1|10{6 mol [35]
TfR1 degradation TfR R Mass action k~8:37|10{6 s{1 [52]
FerroportinExpression
R FPN1; IRP Hill Function -| a~4|10{9 s{1 , nH~1, K~1|10{6 mol
IRP expression R IRP; LIP Hill Function -| a~4|10{11 s{1 , nH~1, K~1|10{6 mol [53]
IRP degradation IRP R Mass action k~1:59|10{5 s{1 [53]
Fpn degradationHepc
FPN1 R; HAMP Hill Function R a~2:315|10{5 s{1 , nH~1, K~1|10{9 mol
HFE degradation HFE R Mass action k~6:418|10{5 s{2 [54]
HFE expression R HFE Constant flux v~2:3469|10{11 mol(l:s){1 [54]
TfR2 expression R TfR2 Constant flux v~2|10{11 mol(l:s){1 [35]
TfR2 degradation TfR2 R; Tf-Fe_intercell Hill Function -| a~3:2|10{05 s{1 , nH~1, K~2:5|109 mol [35]
Hepcidin expression R HAMP; 2HFE-TfR2 2(Tf-Fe)-TfR2 Hill Function R a~5|10{12 s{1 , nH~5, K~1:35|10{7 mol,
a~5|10{12 mol:s{1 , K~6|10{7 mol
[44]
Hepcidin degradation HAMP R Mass action k~9:63|10{5 s{1 [55]
Heme oxygenation HemeRLIP; HO-1 Henri-Michaelis-Menten
kcat~17777:7 s{1 , Km~2|10{6 mol:l{1 [56]
HFE TfR1 binding HFE+TfRRHFE-TfR Mass action k~1:102|106 l(mol:s){1 [57]
HFE TfR1 release HFE-TfRRHFE+TfR Mass action k~0:08 s{1 [57]
TfR1 binding Tf-Fe_intercell+TfRRTf-Fe-TfR1 Mass action k~837400l(mol:s){1 [57]
TfR1 release Tf-Fe-TfR1RTf-Fe_intercell+TfR Mass action k~9:142|10{4 s{1 [57]
HFE TfR2 binding 2*HFE+TfR2R2HFE-TfR2 Mass action k~3:9438|1011 l2(mol2:s){1
HFE TfR2 release 2HFE-TfR2R2 * HFE+TfR2 Mass action k~0:0018 s{1
TfR2 binding Tf-Fe_intercell+TfR2RTf-Fe-TfR2 Mass action k~222390 l(mol:s){1 [57]
TfR2 release Tf-Fe-TfR2RTf-Fe_intercell+TfR2 Mass action k~0:0061 s{1 [57]
TfR1 binding 2 Tf-Fe-TfR1+Tf-Fe_intercellR2(Tf-Fe)-TfR1 Mass action k~121400 l(mol:s){1 [57]
TfR1 release 2 2(Tf-Fe)-TfR1RTf-Fe-TfR1+Tf-Fe_intercell Mass action k~0:003535 s{1 [57]
HFE TfR1 binding 2 HFE-TfR+HFER2HFE-TfR Mass action k~1:102|106 l(mol:s){1 [57]
HFE TfR1 release 2 2HFE-TfRRHFE-TfR+HFE Mass action k~0:08 s{1 [57]
TfR2 binding 2 Tf-Fe-TfR2+Tf-Fe_intercellR2(Tf-Fe)-TfR2 Mass action k~69600 l(mol:s){1 [57]
TfR2 release 2 2(Tf-Fe)-TfR2RTf-Fe-TfR2+Tf-Fe_intercell Mass action k~0:024 s{1 [57]
TfR1 ironinternalisation
2(Tf-Fe)-TfR1R4(LIP)+TfR Mass action k~0:8333 l:s{1 [58]
TfR2 ironinternalisation
2(Tf-Fe)-TfR2R4(LIP)-TfR2 Mass action k~0:8333 l:s{1 [58]
outFlow LIP R Mass action(irreversible)
k~4|10{4 s{1
Ferritin Iron binding LIP+FTRFe-FT Mass action k~4:71|1010 l(mol:s){1 [14]
Ferritin Iron release Fe-FTRLIP+FT Mass action k~22922 s{1 [14]
Ferritin Ironinternalisation
Fe-FTRFT1+FT Mass action k~108000 s{1 [14]
Ferritin internalisediron release
FT1RLIP; FT1 FT Kloss Hill kloss~13:112 s{1 [14]
ferritin expression R FT; IRP Hill Function -| a~2:312|10{13 s{1 , nH~1, K~1|10{6 mol [59]
HO1 Degradation HO-1 R Mass action k~3:209|10{5 s{1 [60]
HO1 Expression R HO-1; Heme Hill Function R a~2:1432|10{15 s{1 , K~1|10{9 mol [61]
Ferritin DegradationFull
FT R Mass action k~1:203|10{5 s{1 [14]
Heme uptake Heme_intercellRHeme Henri-Michaelis-Menten
Km~1:25|10{4 mol,v~1:034|10{5 mol:s{1 [62]
A Computational Model of Liver Iron Metabolism
PLOS Computational Biology | www.ploscompbiol.org 3 November 2013 | Volume 9 | Issue 11 | e1003299
mutation in the HFE gene leading to a misregulation of hepcidin
and consequent systemic iron overload.
A virtual HFE knockdown was performed by reducing 100-fold
the rate constant for HFE synthesis in the model, to create a
simulation of type 1 hereditary haemochromatosis. The simulation
was run to steady state and results were compared with
experimental findings.
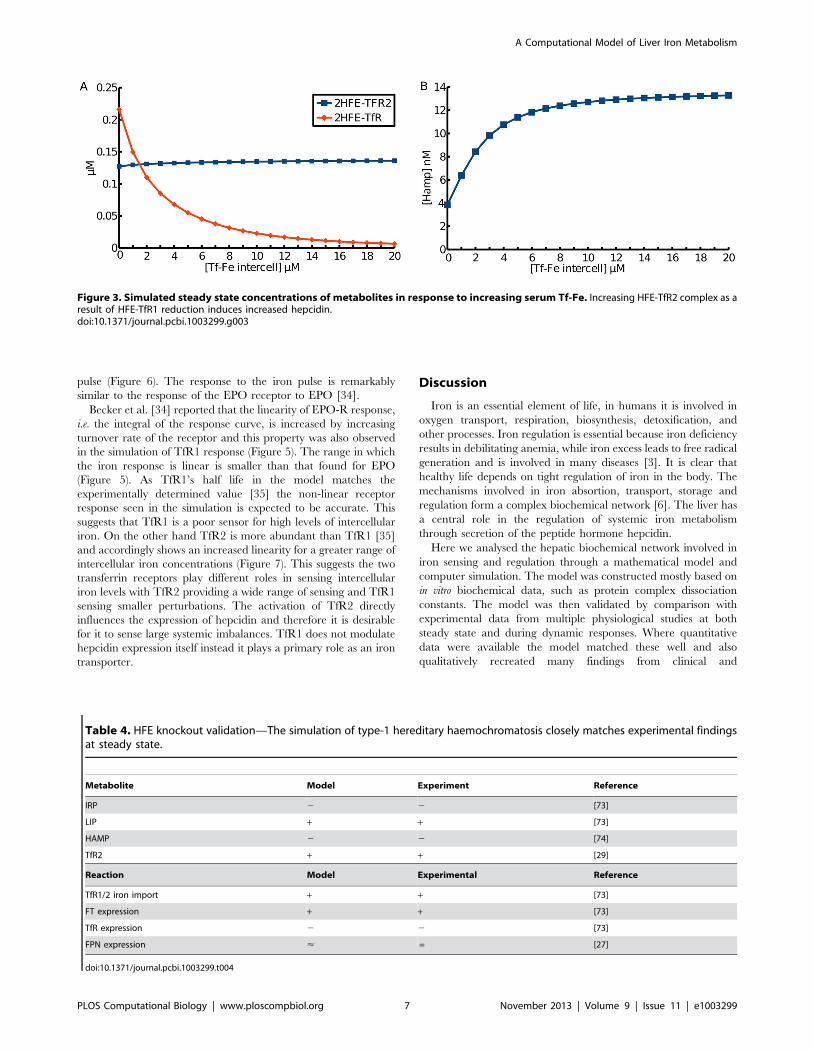
Qualitative validation showed the in silico HFE knockdown
could reproduce multiple experimental findings as shown in
Table 4. Quantitatively the model was unable to reproduce
accurately the finding that Hfe 2/2 mice have 3 times higher
hepatic iron levels [26]. This was due to the fixed intercellular
transferrin-bound iron concentration in the model, unlike in Hfe
2/2 mice where there is an increase in transferrin saturation as a
result of increased intestinal iron absorption [26]. Despite fixed
extracellular conditions the model predicted an intracellular
hepatocyte iron overload which would be further compounded
by the systemic effects of the misregulation of hepcidin. The
Table 1. Cont.
Name Reaction Rate law Parameters Source
Heme export HemeRHeme_intercell Henri-Michaelis-Menten
Km~1:78|10{5 mol,v~2:18|10{5 mol:s{1 [63]
Ferritin DegradationFull Iron Release
FT1RLIP; FT1 FT Mass Action Ferritin k~1:203|10{5 s{1 [14]
HFE-TfR degradation 2HFE-TfR R Mass action k~8:37|10{7 s{1
HFE-TfR2 degradation 2HFE-TfR2 R Mass action k~8:37|10{7 s{1
doi:10.1371/journal.pcbi.1003299.t001
Figure 1. SBGN process diagram of human liver iron metabolism model. The compartment with yellow boundary represents thehepatocyte, while the compartment with pink boundary represents plasma. Species overlayed on the compartment boundaries representmembrane-associated species. Abbreviations: Fe: iron, FPN1: ferroportin, FT: ferritin, HAMP: hepcidin, haeme: intracellular haeme, haeme_intercell:plasma haeme, HFE: human haemochromatosis protein, HO-1: haeme oxygenase 1, IRP: iron response protein, LIP: labile iron pool, Tf-Fe_intercell:plasma transferrin-bound iron, TfR1: transferrin receptor 1, TfR2: transferrin receptor 2. Complexes are represented in boxes with the componentspecies. In the special case of the ferritin-iron complex symbol, the amounts of each species are not in stoichiometric amounts (since there arethousands of iron ions per ferritin).doi:10.1371/journal.pcbi.1003299.g001
A Computational Model of Liver Iron Metabolism
PLOS Computational Biology | www.ploscompbiol.org 4 November 2013 | Volume 9 | Issue 11 | e1003299
simulation recreated increased ferroportin levels despite the
expression of ferroportin remaining the same as wild type which
was consistent with mRNA measurements from Ludwiczek et al.
[27]. mRNA based experiments can be used to validate expression
rates and protein assays are able to validate steady state protein
concentrations as both expression rates and steady state protein
concentrations are available as results from the computational
model. The model of haemochromatosis was also able to replicate
the dynamics of experimental responses to changing dietary iron
conditions. An approximate 2-fold increase in hepatic ferroportin
expression is caused by increased dietary iron in both haemo-
chromatosis and healthy mice [27]. The model presented here
recreated this increase with increasing intercellular iron as can be
seen in Figure 4.
HFE knockout has been shown to impair the induction of
hepcidin by iron in mouse [27] and human [28] hepatocytes and
this was seen in the computational model as increasing transferrin-
bound iron did not induce hepcidin as strongly as in HFE
knockdown.
Although an increase in transferrin receptor 2 was observed in
the model (1:77 mM healthy; 2:80 mM type 1 haemochromatosis),
the up-regulation was slightly smaller than the change observed in
vivo [29]. This is due to the model having fixed extracellular
transferrin-bound iron concentration, in contrast to haemochro-
matosis where this concentration increases due to higher
absorption in the intestine.
Type 3 haemochromatosis results in similar phenotype as type 1
haemochromatosis, however the mutation is found in the TfR2
gene as opposed to HFE. A virtual TfR2 knockdown mutation was
performed by decreasing 100-fold the rate constant of synthesis of
TfR2 from the model. Model results were then compared with the
findings of Chua et al. [23]. The simulation showed a steady state
decrease of liver TfR1 from 0:29 mM to 0:19 mM with TfR2
knockdown. This is supported by an approximate halving of TfR1
levels in TfR2 mutant mice [23]. An increase in hepcidin and
consequent decrease in ferroportin as seen in mice was matched by
the simulation.
An iron overload phenotype with increased intracellular iron is
not recreated by the model of the TfR2 mutant. This is, again, due
to the fixed serum transferrin-bound iron concentration, while in
the whole body there would be increased iron absorption from the
diet through the effect of hepcidin.
Metabolic control analysis. Metabolic control analysis
(MCA) is a standard technique to identify the reactions that have
the largest influence on metabolite concentrations or reaction
fluxes in a steady state [30,31]. MCA is a special type of sensitivity
analysis and thus is used to quantify the distributed control of the
biochemical network. A control coefficient measures the relative
change of the variable of interest caused by a small change in the
reaction rate (e.g. a control coefficient can be interpreted as the
percentage change of the variable given a 1% change in the
reaction rate).
The control over the concentration of the labile iron pool by
each of the model reactions can be seen in Table 5. The synthesis
and degradation of TfR2, TfR1, HFE and the formation of their
complexes were found to have the highest control over the labile
iron pool. Synthesis and degradation of IRP was also found to
have some degree of control, but synthesis and degradation of
hepcidin have surprisingly a very small effect on the labile iron
pool.
The control over the hepcidin concentration was also calculated
(Table 6), as the ability to control hepatic hepcidin levels could
provide therapeutic opportunities to control whole system iron
metabolism, due to its action on other tissues. Interestingly, in
addition to the expression and degradation of hepcidin itself, the
expression of HFE and degradation of HFETfR2 complex have
almost as much control over hepcidin. The expression of TfR2 has
a considerably lower effect, though still significant.
Flux control coefficients were also determined which indicate
the control that reactions have on a chosen reaction flux. The flux
control coefficients for the ferroportin mediated iron export
reaction are given in Table 7. This reaction is of particular interest
as it is the only method of iron export, therefore controlling this
reaction rate could be important in treating various iron disorders
including haemochromatosis and anemia. The reactions of
synthesis and degradation of TfR1, TfR2 and HFE were found
to have high control, despite not having direct interactions with
ferroportin. TfR1 and TfR2 may show consistently high control
due to having dual roles as iron importers and iron sensors which
control hepcidin expression.
A drawback of MCA, and any other local sensitivity analysis, is
that it is only predictive for small changes of reaction rates.
However, the changes that result in disease states are usually large,
and experimental parameter estimation can result in large
uncertainty. Thus a global sensitivity analysis was also performed
Table 2. Initial conditions.
Parameter Initial Concentration (mol/l) Source
LIP 1:3|10{6 [64]
FPN1 1|10{9
IRP 1:16|10{6 [65]
HAMP 5|10{9 [44]
haeme 1|10{9
2(Tf-Fe)-TfR1_Internal 0
2(Tf-Fe)-TfR2_Internal 0
Tf-Fe-TfR2_Internal 0
Tf-Fe-TfR1_Internal 0
Tf-TfR1_Internal 0
Tf-TfR2_Internal 0
Fe-FT 0
FT 1:66|10{10 [59]
HO-1 3:56|10{11 [66]
FT1 0
Tf-Fe_intercell 5|10{6 fixed, [52]
TfR 4|10{7 [35]
Tf-Fe-TfR1 0
HFE 2|10{7 [35]
HFE-TfR 0
HFE-TfR2 0
Tf-Fe-TfR2 0
2(Tf-Fe)-TfR1 0
2HFE-TfR 0
2HFE-TfR2 0
2(Tf-Fe)-TfR2 0
TfR2 3|10{6 [35]
haeme_intercell 1|10{7 [67]
Initial concentrations of all metabolites and the source for their value.doi:10.1371/journal.pcbi.1003299.t002
A Computational Model of Liver Iron Metabolism
PLOS Computational Biology | www.ploscompbiol.org 5 November 2013 | Volume 9 | Issue 11 | e1003299

following the method described in [32]. This calculates the
maximal and minimal values of the sensitivity coefficients within a
large space of parameter values. This technique is useful, for
example, if there is uncertainty about the values of the model
parameters as it reveals the possible range of control of each one
given the uncertainty. All parameters were allowed to vary
simultaneously within +10% and the maximal and minimal
control coefficients were measured (Tables 5, 6 and 7).
In terms of the control of the labile iron pool (Table 5), the
reactions with highest control in the reference steady state are still
the ones with highest control in the global case (i.e. when all
parameters have an uncertainty of +10%). However TfR1
expression, TfR1 binding, TfR1 degradation, IRP expression
and IRP degradation, which all have significant (but not the
highest) control in the reference state, could have very low control
in the global sense. On the other hand HFETfR2 degradation,
hepcidin expression, hepcidin degradation and TfR2 binding 2,
have low control in the reference steady state, but could have
significant control in the global sense. All other reactions have low
control in any situation.
In the case of the control of hepcidin concentration (Table 6) the
differences between the reference state and the global are much
smaller overall, and one could only identify a few reactions that
have moderate control in the reference, but could have a bit less in
the global sense (TfR2 expression, TfR2 binding, and TfR2 iron
internalisation).
In the case of the control of the flux of iron export (Table 7), we
find some reactions with high control in the reference that could
have low control in the global sense: TfR1 expression, TfR1
biding, TfR1 degradation, IRP expression and IRP degradation.
Hepcidin expression, hepcidin degradation, and HFETfR2
degradation have almost no control in the reference, but in the
global sense they could exert considerable control. This is very
similar to the situation of the control of the labile iron pool.
Chifman et al. [16] analysed the parameter space of their core
model of iron metabolism in breast epithelial cells and concluded
the system behavior is far more dependent on the network
structure than the exact parameters used. The analysis presented
here lends some support to that finding, since only a few reactions
could have different effect on the system if the parameters are
wrong. A further scan of initial conditions for metabolites found
that varying initial concentrations over 2 orders of magnitude had
no affect on the steady state achieved (Table 3), indicating that the
steady state found in these simulations is possibly unique.
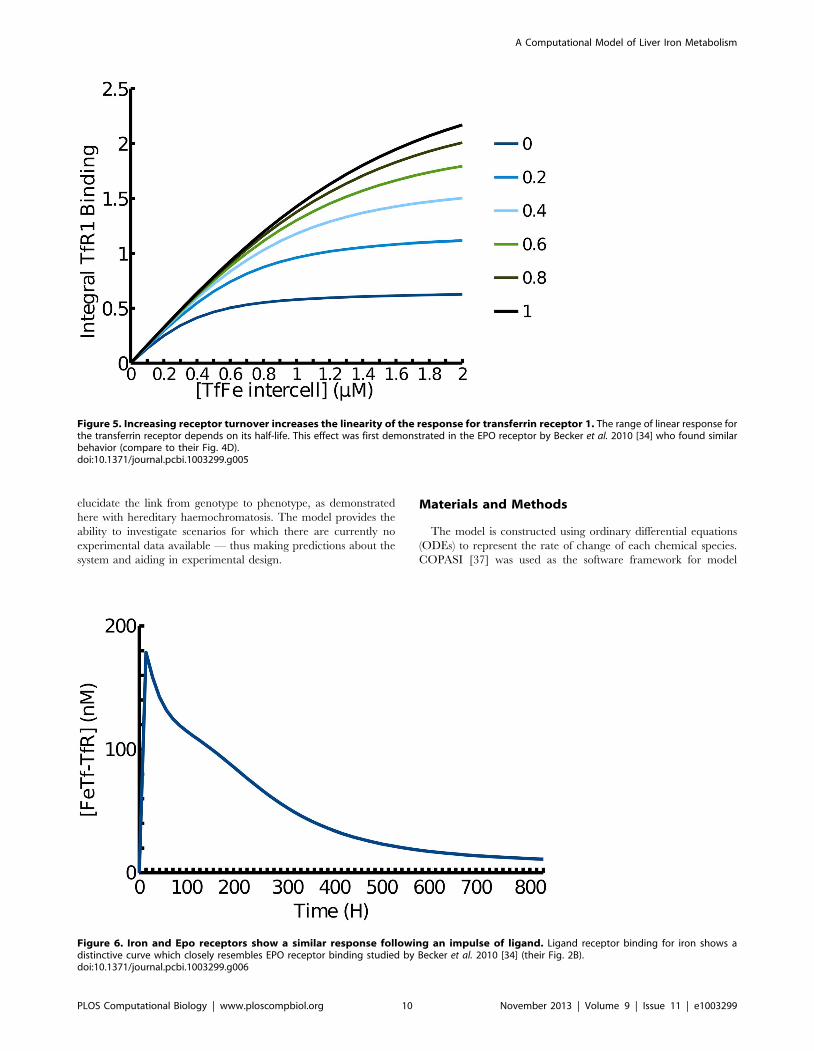
Receptor PropertiesIt is known that the iron sensing by the transferrin receptors is
responsive over a wide range of intercellular iron concentrations
[33]. The present model reproduces this well (Figure 5,
1|turnover line). Becker et al. argued that a linear response of
a receptor to its signal over a wide range could be achieved
through a combination of: high receptor abundance, increased
expression when required, recycling to the surface of internalised
receptors and high receptor turnover [34]. This was illustrated
with the behaviour of the erythropoietin (EPO) receptor [34].
Since the present model contains essentially the same type of
reactions that can lead to such a behaviour, simulations were
carried out to investigate to what extent this linearity of response is
present here. In this case it is the response of the total amount of all
forms of TfR1 and TfR2 bound to Tf-Fe against the amount of Tf-
Fe_intercell that is important. A variable was created in the model
to reflect the total receptor response (see Materials and Methods),
and this variable was followed in a time course response to an iron
Table 3. Steady state validation—Comparison between model and experimental observations.
Metabolite Model Experimental Reference
Labile Iron Pool 0:804 mM 0:2{1:5 mM [64]
Iron Response Protein 836000 cell{1 *700000 cell{1 [68]
Ferritin 4845 cell{1 3000{6000 cell{1(mRNA), 2:5{54600 cell{1(protein) [68], [69]
TfR 1:74|105 cell{1 1:6{2|105 cell{1 [70]
TfR2 4:63| TfR1½ � 4:5{6:1| TfR1½ � [35]
Iron per Ferritin 2272 average *2400 [71]
Hepcidin 5:32 nM 3:5{8:3 nM [72]
Reaction Model Experimental Reference
TBI importrate
2:67 mM:s{1 2:08 mM:s{1 [23]
IRP, Ferritin and TfR are expressed in particles per cell assuming a cellular volume of 10{12 l. Iron per Ferritin is a ratio.doi:10.1371/journal.pcbi.1003299.t003
Figure 2. Simulated time course concentrations of hepcidin inresponse to changing serum transferrin-bound iron levels. Themodel shows similar dynamics to time course samples from patientsmeasured by mass spectrometry and ELISA by Girelli et al., 2011 [24].Hereditary haemochromatosis simulations show reduced hepcidinlevels and peak response compared to WT (Wild Type).doi:10.1371/journal.pcbi.1003299.g002
A Computational Model of Liver Iron Metabolism
PLOS Computational Biology | www.ploscompbiol.org 6 November 2013 | Volume 9 | Issue 11 | e1003299
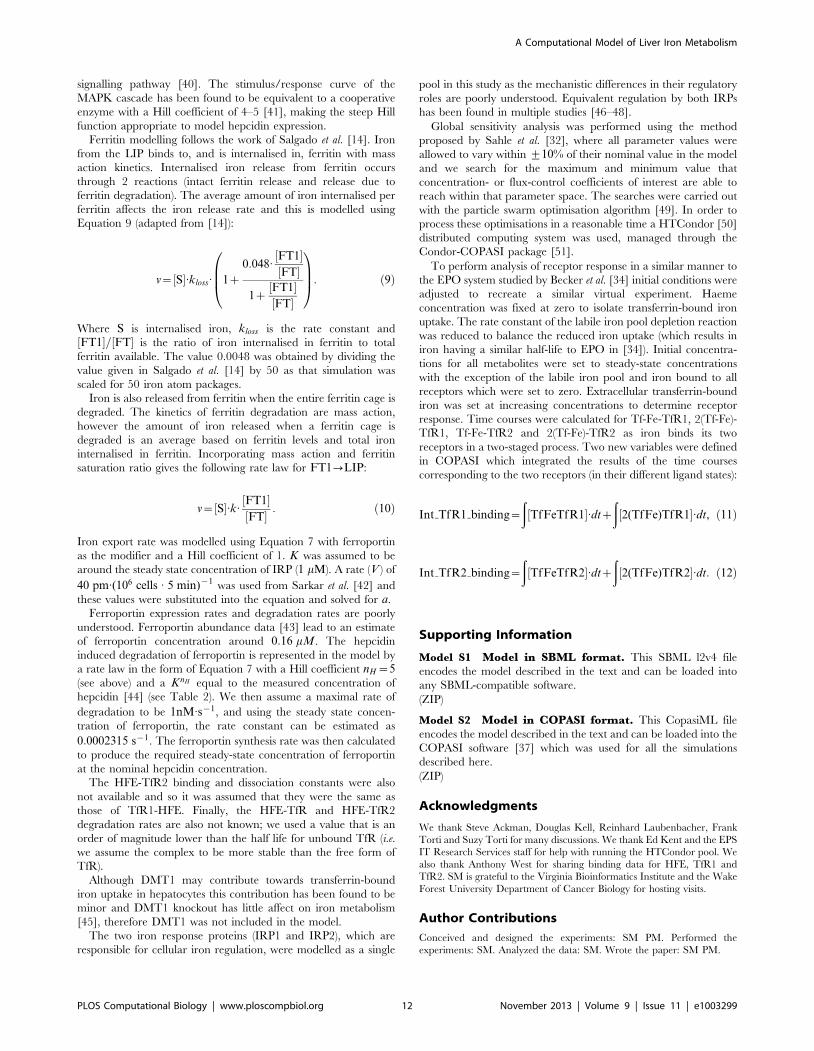
pulse (Figure 6). The response to the iron pulse is remarkably
similar to the response of the EPO receptor to EPO [34].
Becker et al. [34] reported that the linearity of EPO-R response,
i.e. the integral of the response curve, is increased by increasing
turnover rate of the receptor and this property was also observed
in the simulation of TfR1 response (Figure 5). The range in which
the iron response is linear is smaller than that found for EPO
(Figure 5). As TfR1’s half life in the model matches the
experimentally determined value [35] the non-linear receptor
response seen in the simulation is expected to be accurate. This
suggests that TfR1 is a poor sensor for high levels of intercellular
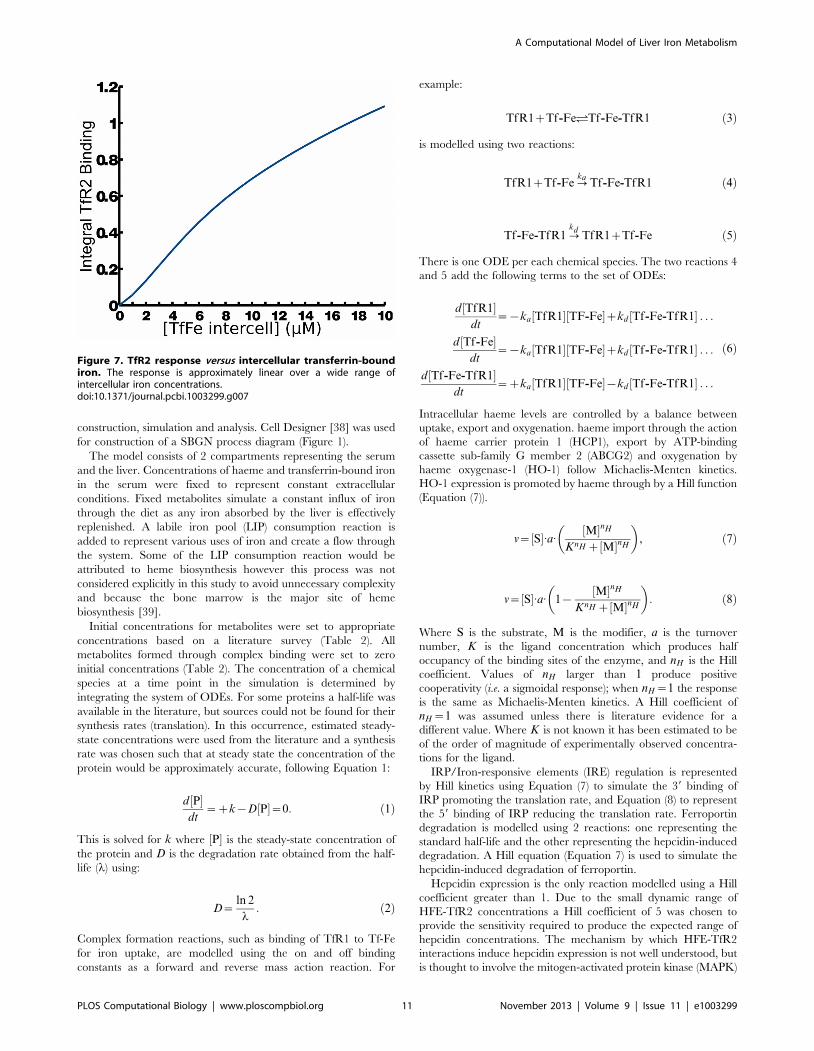
iron. On the other hand TfR2 is more abundant than TfR1 [35]
and accordingly shows an increased linearity for a greater range of
intercellular iron concentrations (Figure 7). This suggests the two
transferrin receptors play different roles in sensing intercellular
iron levels with TfR2 providing a wide range of sensing and TfR1
sensing smaller perturbations. The activation of TfR2 directly
influences the expression of hepcidin and therefore it is desirable
for it to sense large systemic imbalances. TfR1 does not modulate
hepcidin expression itself instead it plays a primary role as an iron
transporter.
Discussion
Iron is an essential element of life, in humans it is involved in
oxygen transport, respiration, biosynthesis, detoxification, and
other processes. Iron regulation is essential because iron deficiency
results in debilitating anemia, while iron excess leads to free radical
generation and is involved in many diseases [3]. It is clear that
healthy life depends on tight regulation of iron in the body. The
mechanisms involved in iron absortion, transport, storage and
regulation form a complex biochemical network [6]. The liver has
a central role in the regulation of systemic iron metabolism
through secretion of the peptide hormone hepcidin.
Here we analysed the hepatic biochemical network involved in
iron sensing and regulation through a mathematical model and
computer simulation. The model was constructed mostly based on
in vitro biochemical data, such as protein complex dissociation
constants. The model was then validated by comparison with
experimental data from multiple physiological studies at both
steady state and during dynamic responses. Where quantitative
data were available the model matched these well and also
qualitatively recreated many findings from clinical and
Figure 3. Simulated steady state concentrations of metabolites in response to increasing serum Tf-Fe. Increasing HFE-TfR2 complex as aresult of HFE-TfR1 reduction induces increased hepcidin.doi:10.1371/journal.pcbi.1003299.g003
Table 4. HFE knockout validation—The simulation of type-1 hereditary haemochromatosis closely matches experimental findingsat steady state.
Metabolite Model Experiment Reference
IRP 2 2 [73]
LIP + + [73]
HAMP 2 2 [74]
TfR2 + + [29]
Reaction Model Experimental Reference
TfR1/2 iron import + + [73]
FT expression + + [73]
TfR expression 2 2 [73]
FPN expression < = [27]
doi:10.1371/journal.pcbi.1003299.t004
A Computational Model of Liver Iron Metabolism
PLOS Computational Biology | www.ploscompbiol.org 7 November 2013 | Volume 9 | Issue 11 | e1003299

experimental investigations. The simulation accurately modelled
the highly prevalent iron disorder haemochromatosis. The disease
state was simulated through altering a single parameter of the
model and showed quantitatively how an iron overload phenotype
occurs in patients with a HFE mutation.
Due to the limited availability of quantitative clinical data on
human iron metabolism, various other data sources, particularly
from in vitro experiments and animal models, were integrated for
the parameterisation of this model. This computational modelling
effort constitutes a clinical translational approach, enabling data
from multiple sources to improve our understanding of human
iron metabolism. Several arguments could be raised to cast doubt
on this approach, such as the the failure of in vitro conditions to
mimic those in vivo or the difference between animal models and
humans. This means that this type of data integration must be
carefully monitored in terms of establishing the validity of the
resulting model. Examining the behaviour of the model by
simulating it at different values of initial conditions or other
parameters (parameter scans) is important to establish the limits of
utility of the model. Global sensitivity analysis is another approach
that determines the boundaries of parameter variation that the
model tolerates before it becomes too distant from the actual
Table 5. Metabolic control analysis—Concentration controlcoefficients for the labile iron pool.
Reaction Local Global
Minimum Maximum
TfR2 expression 0.894573 0.515971 1.41255
Fpn Export 20.825483 20.924 20.698754
TfR2 binding 0.569815 0.298433 0.901285
TfR2 degradation 20.563132 20.898362 20.293111
Fpn degradation 0.351397 0.186176 0.50289
Ferroportin Expression 20.351397 20.502317 20.176245
HFE expression 20.313525 20.623067 0.346532
TfR1 expression 0.259758 0.0652 0.496352
TfR1 binding 0.259436 0.06577 0.497636
TfR1 degradation 20.258004 20.503067 20.0657364
IRP expresion 0.209893 0.0748546 0.300039
IRP degradation 20.209893 20.347477 20.0753367
HFE-TfR2 degradation 20.0341692 20.684936 0.000229851
Hepcidin expression 0.0283652 0.0004375 0.6553120
Hepcidin degradation 20.0283652 20.791216 20.000576136
HFE degradation 0.0162284 20.0259426 0.0386967
TfR2 binding 2 0.0100938 0.298433 0.901285
TfR2 release 20.0100938 20.0194113 20.00434313
HFE TfR2 binding 20.00668253 20.0187053 0.0218869
HFE TfR2 release 0.0063856 20.0205303 0.018034
TfR2 iron internalisation 20.00335169 20.156882 0.000557494
HFE TfR1 binding 20.00143167 20.0120993 0.0000742
HFE TfR1 release 0.00143166 0.0000760 0.0121124
HFE TfR1 binding 2 20.00143166 20.0121238 20.0000739
HFE TfR1 release 2 0.00143165 0.0000738 0.0121135
HFE-TfR degradation 20.00143165 20.0121249 20.0000737
doi:10.1371/journal.pcbi.1003299.t005
Table 6. Metabolic control analysis—Concentration controlcoefficients for hepcidin.
Reaction Local Global
Minimum Maximum
Hepcidin expression 1.00002 0.512257 1.487664
Hepcidin degradation 21.00002 21.00027 20.999001
HFE-TfR2 degradation 20.956041 21.3943 20.380497
HFE expression 0.9131 0.274035 1.30051
TfR2 expression 0.243052 0.0984356 0.486305
TfR2 degradation 20.153001 20.293528 20.0638787
TfR2 binding 0.128436 0.0558287 0.273304
TfR2 iron internalisation 20.128062 20.272967 20.0557919
HFE degradation 20.047263 20.102578 20.0122656
HFE TfR2 binding 0.0245645 0.00630724 0.0573883
HFE TfR2 release 20.023473 20.0557905 20.00602681
TfR2 binding 2 0.00227514 0.000811688 0.00589495
TfR2 release 20.00227514 20.00589437 20.000812498
HFE TfR1 binding 20.00093303 20.00728765 25.22895e-05
HFE TfR1 release 0.000933028 4.84169e-05 0.00697082
HFE TfR1 binding 2 20.000933028 20.0073373 25.31758e-05
HFE TfR1 release 2 0.000933018 5.3417e-05 0.00731269
HFE-TfR degradation 20.000933018 20.00733725 25.69006e-05
TfR1 expression 20.000796332 20.00607511 24.36181e-05
TfR1 degradation 0.000790955 4.53395e-05 0.00623214
IRP expresion 20.000544238 20.00281211 24.71681e-05
IRP degradation 0.000544238 4.16666e-05 0.00351147
Fpn export 20.00045206 20.00277642 24.33404e-05
Fpn degradation 0.000192436 1.47897e-05 0.00153538
Ferroportin expression 20.000192436 20.00153463 21.41905e-05
TfR1 binding 0.000142075 3.78713e-06 0.00137383
TfR2 release 2 26.36921e-05 20.000176906 22.18216e-05
doi:10.1371/journal.pcbi.1003299.t006
Figure 4. Ferroportin expression rate in the model doubles inresponse to changing serum iron concentrations as verifiedexperimentally. HFE knock-down (HH) simulations and WT simulationof Fe-Tf against ferroportin (Fpn) expression.doi:10.1371/journal.pcbi.1003299.g004
A Computational Model of Liver Iron Metabolism
PLOS Computational Biology | www.ploscompbiol.org 8 November 2013 | Volume 9 | Issue 11 | e1003299
system behaviour. Model validation is an essential step in
modelling. Validation should be carried out by enquiring if the
model is able to match experimental observations that were not
used to calibrate it. Here the model was validated by the
simulation of haemochromatosis disease, where the model
behaviour matched the clinical data (Table 4).
The precise regulatory mechanism behind transferrin receptors
and HFE controlling hepcidin expression remains to be validated
experimentally, however the model presented here supports
current understanding that the interaction of TfR2 and HFE
form the signal transduction pathway that leads to the induction of
hepcidin expression [36].
The global metabolic control analysis results support the
identification of the transferrin receptors, particularly TfR2, and
HFE as potential therapeutic targets; a result that is robust even to
inaccuracies in parameter values. Although hepcidin would be an
intuitive point of high control of this system (and therefore a good
therapeutic target), in the present model this is not the case. It
seems that targeting the promoters of hepcidin expression may be
more desirable. However this conclusion has to be expressed with
some reservation that stems from the fact that the global sensitivity
analysis identified the hepcidin synthesis and degradation reactions
in the group of those with the largest uncertainty. By changing
parameter values by no more than 10% it would be possible to
have the hepcidin expression and degradation show higher
control. So it seems important that the expression of hepcidin be
studied in more detail. We also predict that the control of hepcidin
over the system would be higher if the model had included the
regulation of intestinal ferroportin by hepatic ferroportin.
The global sensitivity analysis, however, allows taking strong
conclusions about the reactions for which the reference steady
state is not much different from the maximal and minimal values.
It turns out that these are the reactions that have the largest and
the smallest control over the system variables. For example, the
reactions with greatest control on the labile iron pool and iron
export are those of the HFE-TfR2 system. But the reactions of the
HFE-TfR1 system have always low control. These two conclusions
are valid under a wide range of parameter values.
Construction of this model required several assumptions to be
made due to lack of measured parameter values, as described in
Materials and Methods. These assumptions may or may not have
a large impact on the model behaviour, and it is important to
identify those that have a large impact, as their measurement will
improve our knowledge the most. Of all the assumptions made,
the rates of expression and degradation of ferroportin are those
that have a significant impact on the labile iron pool in the model
(see Table 5). This means that if the values assumed for these rate
parameters were to be significantly different the model prediction
for labile iron pool behaviour would also be different. The model is
therefore also useful by suggesting experiments that will optimally
improve our knowledge about this system.
Limitations on the predictive power of the model occur due to
the scope of the system chosen. Fixed serum iron conditions, which
were used as boundary conditions in the model, do not successfully
recreate the amplifying feedbacks that occur as a result of hepcidin
expression controlling enterocyte iron export. To relieve this
limitation, a more advanced model should include dietary iron
uptake and the action of hepcidin on that process.
The model predicts a quasi-linear response to increasing pulses of
serum iron, similar to what has been predicted for the erythropoi-
etin system [34]. Our simulations display response of the transferrin
receptors to pulses of extracellular transferrin-bound iron that is
similar to the EPO-R response to EPO (Figure 5). The integral of
this response versus the iron sensed deviates very little from linearity
in the range of physiological iron (Figure 6).
Computational models are research tools whose function is to
allow for reasoning in a complex nonlinear system. The present
model can be useful in terms of predicting properties of the liver
iron system. These predictions form hypotheses that lead to new
experiments. Their outcome will undoubtedly improve our
knowledge and will also either confirm the accuracy of the model
or refute it (in which case it then needs to be corrected). The
present model and its results identified a number of predictions
about liver iron regulation that should be investigated further:
N changes in activity of the hepcidin gene in the liver have little
effect on the size of the labile iron pool,
N the rate of expression of HFE has a high control over the
steady state level of hepcidin,
N the strong effect of HFE is due to its interaction with TfR2
rather than TfR1,
N the rate of liver iron export by ferroportin has a strong
dependence on the expression of TfR1, TfR2 and HFE,
N the rate of expression of hepcidin is approximately linear with
the concentration of plasma iron within the physiological range.
The present model is the most detailed quantitative mechanistic
model of cellular iron metabolism to date, allowing for a
comprehensive description of its regulation. It can be used to
Table 7. Metabolic control analysis—Flux-control coefficientsfor the iron export out of the liver compartment.
Reaction Local Global
Minimum Maximum
TfR2 expression 0.910944 0.449405 1.38521
TfR2 binding 0.581149 0.285737 0.867434
TfR2 degradation 20.573438 20.858215 20.278218
HFE expression 20.353566 20.669513 20.187987
TfR1 expression 0.266964 0.0676606 0.510467
TfR1 binding 0.266601 0.0675083 0.51963
TfR1 degradation 20.265162 20.51689 20.0669265
IRP expresion 0.182446 0.063823 0.310888
IRP degradation 20.182446 20.313848 20.0656558
Fpn Export 0.151719 0.0626056 0.271594
Ferroportin Expression 0.0645849 0.0189112 0.149717
Fpn degradation 20.0645849 20.149993 20.0189094
HFE degradation 0.0183009 0.00812358 0.0401559
TfR2 release 20.0102946 20.018781 20.00414945
TfR2 binding 2 0.0102946 0.00414543 0.0187846
HFE TfR2 binding 20.0077113 20.0191638 0.00292511
HFE TfR2 release 0.00736866 20.00282598 0.0186586
Hepcidin expression 20.00521336 20.1785377 20.0000387334
Hepcidin degradation 0.00521336 5.77312e-05 0.224586
HFE-TfR2 degradation 20.00226218 20.0183295 0.19571
HFE TfR1 binding 20.00143917 20.0119501 27.50839e-05
HFE TfR1 release 0.00143917 7.49065e-05 0.0119095
HFE TfR1 binding 2 20.00143917 20.0114124 27.49686e-05
HFE TfR1 release 2 0.00143915 7.49046e-05 0.0116242
doi:10.1371/journal.pcbi.1003299.t007
A Computational Model of Liver Iron Metabolism
PLOS Computational Biology | www.ploscompbiol.org 9 November 2013 | Volume 9 | Issue 11 | e1003299
elucidate the link from genotype to phenotype, as demonstrated
here with hereditary haemochromatosis. The model provides the
ability to investigate scenarios for which there are currently no
experimental data available — thus making predictions about the
system and aiding in experimental design.
Materials and Methods
The model is constructed using ordinary differential equations
(ODEs) to represent the rate of change of each chemical species.
COPASI [37] was used as the software framework for model
Figure 5. Increasing receptor turnover increases the linearity of the response for transferrin receptor 1. The range of linear response forthe transferrin receptor depends on its half-life. This effect was first demonstrated in the EPO receptor by Becker et al. 2010 [34] who found similarbehavior (compare to their Fig. 4D).doi:10.1371/journal.pcbi.1003299.g005
Figure 6. Iron and Epo receptors show a similar response following an impulse of ligand. Ligand receptor binding for iron shows adistinctive curve which closely resembles EPO receptor binding studied by Becker et al. 2010 [34] (their Fig. 2B).doi:10.1371/journal.pcbi.1003299.g006
A Computational Model of Liver Iron Metabolism
PLOS Computational Biology | www.ploscompbiol.org 10 November 2013 | Volume 9 | Issue 11 | e1003299
construction, simulation and analysis. Cell Designer [38] was used
for construction of a SBGN process diagram (Figure 1).
The model consists of 2 compartments representing the serum
and the liver. Concentrations of haeme and transferrin-bound iron
in the serum were fixed to represent constant extracellular
conditions. Fixed metabolites simulate a constant influx of iron
through the diet as any iron absorbed by the liver is effectively
replenished. A labile iron pool (LIP) consumption reaction is
added to represent various uses of iron and create a flow through
the system. Some of the LIP consumption reaction would be
attributed to heme biosynthesis however this process was not
considered explicitly in this study to avoid unnecessary complexity
and because the bone marrow is the major site of heme
biosynthesis [39].
Initial concentrations for metabolites were set to appropriate
concentrations based on a literature survey (Table 2). All
metabolites formed through complex binding were set to zero
initial concentrations (Table 2). The concentration of a chemical
species at a time point in the simulation is determined by
integrating the system of ODEs. For some proteins a half-life was
available in the literature, but sources could not be found for their
synthesis rates (translation). In this occurrence, estimated steady-
state concentrations were used from the literature and a synthesis
rate was chosen such that at steady state the concentration of the
protein would be approximately accurate, following Equation 1:
d½P�dt
~zk{D½P�~0: ð1Þ
This is solved for k where ½P� is the steady-state concentration of
the protein and D is the degradation rate obtained from the half-
life (l) using:
D~ln 2
l: ð2Þ
Complex formation reactions, such as binding of TfR1 to Tf-Fe
for iron uptake, are modelled using the on and off binding
constants as a forward and reverse mass action reaction. For
example:
TfR1zTf-Fe'Tf-Fe-TfR1 ð3Þ
is modelled using two reactions:
TfR1zTf-Fe?ka
Tf-Fe-TfR1 ð4Þ
Tf-Fe-TfR1?kd
TfR1zTf-Fe ð5Þ
There is one ODE per each chemical species. The two reactions 4
and 5 add the following terms to the set of ODEs:
d TfR1½ �dt
~{ka½TfR1�½TF-Fe�zkd ½Tf-Fe-TfR1� . . .
d Tf-Fe½ �dt
~{ka½TfR1�½TF-Fe�zkd ½Tf-Fe-TfR1� . . .
d Tf-Fe-TfR1½ �dt
~zka½TfR1�½TF-Fe�{kd ½Tf-Fe-TfR1� . . .
ð6Þ
Intracellular haeme levels are controlled by a balance between
uptake, export and oxygenation. haeme import through the action
of haeme carrier protein 1 (HCP1), export by ATP-binding
cassette sub-family G member 2 (ABCG2) and oxygenation by
haeme oxygenase-1 (HO-1) follow Michaelis-Menten kinetics.
HO-1 expression is promoted by haeme through by a Hill function
(Equation (7)).
v~½S�:a: ½M�nH
KnH z½M�nH
� �, ð7Þ
v~½S�:a: 1{½M�nH
KnH z½M�nH
� �: ð8Þ
Where S is the substrate, M is the modifier, a is the turnover
number, K is the ligand concentration which produces half
occupancy of the binding sites of the enzyme, and nH is the Hill
coefficient. Values of nH larger than 1 produce positive
cooperativity (i.e. a sigmoidal response); when nH~1 the response
is the same as Michaelis-Menten kinetics. A Hill coefficient of
nH~1 was assumed unless there is literature evidence for a
different value. Where K is not known it has been estimated to be
of the order of magnitude of experimentally observed concentra-
tions for the ligand.
IRP/Iron-responsive elements (IRE) regulation is represented
by Hill kinetics using Equation (7) to simulate the 39 binding of
IRP promoting the translation rate, and Equation (8) to represent
the 59 binding of IRP reducing the translation rate. Ferroportin
degradation is modelled using 2 reactions: one representing the
standard half-life and the other representing the hepcidin-induced
degradation. A Hill equation (Equation 7) is used to simulate the
hepcidin-induced degradation of ferroportin.
Hepcidin expression is the only reaction modelled using a Hill
coefficient greater than 1. Due to the small dynamic range of
HFE-TfR2 concentrations a Hill coefficient of 5 was chosen to
provide the sensitivity required to produce the expected range of
hepcidin concentrations. The mechanism by which HFE-TfR2
interactions induce hepcidin expression is not well understood, but
is thought to involve the mitogen-activated protein kinase (MAPK)
Figure 7. TfR2 response versus intercellular transferrin-boundiron. The response is approximately linear over a wide range ofintercellular iron concentrations.doi:10.1371/journal.pcbi.1003299.g007
A Computational Model of Liver Iron Metabolism
PLOS Computational Biology | www.ploscompbiol.org 11 November 2013 | Volume 9 | Issue 11 | e1003299
signalling pathway [40]. The stimulus/response curve of the
MAPK cascade has been found to be equivalent to a cooperative
enzyme with a Hill coefficient of 4–5 [41], making the steep Hill
function appropriate to model hepcidin expression.
Ferritin modelling follows the work of Salgado et al. [14]. Iron
from the LIP binds to, and is internalised in, ferritin with mass
action kinetics. Internalised iron release from ferritin occurs
through 2 reactions (intact ferritin release and release due to
ferritin degradation). The average amount of iron internalised per
ferritin affects the iron release rate and this is modelled using
Equation 9 (adapted from [14]):
v~½S�:kloss: 1z
0:048:½FT1�½FT�
1z½FT1�½FT�
0BB@
1CCA: ð9Þ
Where S is internalised iron, kloss is the rate constant and
½FT1�=½FT� is the ratio of iron internalised in ferritin to total
ferritin available. The value 0.0048 was obtained by dividing the
value given in Salgado et al. [14] by 50 as that simulation was
scaled for 50 iron atom packages.
Iron is also released from ferritin when the entire ferritin cage is
degraded. The kinetics of ferritin degradation are mass action,
however the amount of iron released when a ferritin cage is
degraded is an average based on ferritin levels and total iron
internalised in ferritin. Incorporating mass action and ferritin
saturation ratio gives the following rate law for FT1?LIP:
v~½S�:k: ½FT1�½FT� : ð10Þ
Iron export rate was modelled using Equation 7 with ferroportin
as the modifier and a Hill coefficient of 1. K was assumed to be
around the steady state concentration of IRP (1 mM). A rate (V ) of
40 pm:(106 cells : 5 min){1 was used from Sarkar et al. [42] and
these values were substituted into the equation and solved for a.
Ferroportin expression rates and degradation rates are poorly
understood. Ferroportin abundance data [43] lead to an estimate
of ferroportin concentration around 0:16 mM. The hepcidin
induced degradation of ferroportin is represented in the model by
a rate law in the form of Equation 7 with a Hill coefficient nH~5(see above) and a KnH equal to the measured concentration of
hepcidin [44] (see Table 2). We then assume a maximal rate of
degradation to be 1nM:s{1, and using the steady state concen-
tration of ferroportin, the rate constant can be estimated as
0:0002315 s{1. The ferroportin synthesis rate was then calculated
to produce the required steady-state concentration of ferroportin
at the nominal hepcidin concentration.
The HFE-TfR2 binding and dissociation constants were also
not available and so it was assumed that they were the same as
those of TfR1-HFE. Finally, the HFE-TfR and HFE-TfR2
degradation rates are also not known; we used a value that is an
order of magnitude lower than the half life for unbound TfR (i.e.
we assume the complex to be more stable than the free form of
TfR).
Although DMT1 may contribute towards transferrin-bound
iron uptake in hepatocytes this contribution has been found to be
minor and DMT1 knockout has little affect on iron metabolism
[45], therefore DMT1 was not included in the model.
The two iron response proteins (IRP1 and IRP2), which are
responsible for cellular iron regulation, were modelled as a single
pool in this study as the mechanistic differences in their regulatory
roles are poorly understood. Equivalent regulation by both IRPs
has been found in multiple studies [46–48].
Global sensitivity analysis was performed using the method
proposed by Sahle et al. [32], where all parameter values were
allowed to vary within +10% of their nominal value in the model
and we search for the maximum and minimum value that
concentration- or flux-control coefficients of interest are able to
reach within that parameter space. The searches were carried out
with the particle swarm optimisation algorithm [49]. In order to
process these optimisations in a reasonable time a HTCondor [50]
distributed computing system was used, managed through the
Condor-COPASI package [51].
To perform analysis of receptor response in a similar manner to
the EPO system studied by Becker et al. [34] initial conditions were
adjusted to recreate a similar virtual experiment. Haeme
concentration was fixed at zero to isolate transferrin-bound iron
uptake. The rate constant of the labile iron pool depletion reaction
was reduced to balance the reduced iron uptake (which results in
iron having a similar half-life to EPO in [34]). Initial concentra-
tions for all metabolites were set to steady-state concentrations
with the exception of the labile iron pool and iron bound to all
receptors which were set to zero. Extracellular transferrin-bound
iron was set at increasing concentrations to determine receptor
response. Time courses were calculated for Tf-Fe-TfR1, 2(Tf-Fe)-
TfR1, Tf-Fe-TfR2 and 2(Tf-Fe)-TfR2 as iron binds its two
receptors in a two-staged process. Two new variables were defined
in COPASI which integrated the results of the time courses
corresponding to the two receptors (in their different ligand states):
Int TfR1 binding~
ð½TfFeTfR1�:dtz
ð½2(TfFe)TfR1�:dt, ð11Þ
Int TfR2 binding~
ð½TfFeTfR2�:dtz
ð½2(TfFe)TfR2�:dt: ð12Þ
Supporting Information
Model S1 Model in SBML format. This SBML l2v4 file
encodes the model described in the text and can be loaded into
any SBML-compatible software.
(ZIP)
Model S2 Model in COPASI format. This CopasiML file
encodes the model described in the text and can be loaded into the
COPASI software [37] which was used for all the simulations
described here.
(ZIP)
Acknowledgments
We thank Steve Ackman, Douglas Kell, Reinhard Laubenbacher, Frank
Torti and Suzy Torti for many discussions. We thank Ed Kent and the EPS
IT Research Services staff for help with running the HTCondor pool. We
also thank Anthony West for sharing binding data for HFE, TfR1 and
TfR2. SM is grateful to the Virginia Bioinformatics Institute and the Wake
Forest University Department of Cancer Biology for hosting visits.
Author Contributions
Conceived and designed the experiments: SM PM. Performed the
experiments: SM. Analyzed the data: SM. Wrote the paper: SM PM.
A Computational Model of Liver Iron Metabolism
PLOS Computational Biology | www.ploscompbiol.org 12 November 2013 | Volume 9 | Issue 11 | e1003299
References
1. Aisen P, Enns C, Wessling-Resnick M (2001) Chemistry and biology of
eukaryotic iron metabolism. Int J Biochem Cell Biol 33: 940–959.
2. Tussing-Humphreys L, Pustacioglu C, Nemeth E, Braunschweig C (2012)Rethinking iron regulation and assessment in iron deficiency, anemia of chronic
disease, and obesity: introducing hepcidin. J Acad Nutrition Dietetics 112: 391–400.
3. Kell D (2009) Iron behaving badly: inappropriate iron chelation as a major
contributor to the aetiology of vascular and other progressive inflammatory and
degenerative diseases. BMC Med Genomics 2: 2.4. Hentze MW, Muckenthaler MU, Andrews NC (2004) Balancing acts: molecular
control of mammalian iron metabolism. Cell 117: 285–297.
5. Dunn LL, Rahmanto YSS, Richardson DR (2007) Iron uptake and metabolismin the new millennium. Trends Cell Biol 17: 93–100.
6. Hower V, Mendes P, Torti FM, Laubenbacher R, Akman S, et al. (2009) A
general map of iron metabolism and tissue-specific subnetworks. Mol BioSystems
5: 422–443.7. Frazer DM, Anderson GJ (2003) The orchestration of body iron intake: how and
where do enterocytes receive their cues? Blood Cells, Molecules & Diseases 30:
288–297.
8. Park CH, Valore EV, Waring AJ, Ganz T (2001) Hepcidin, a urinaryantimicrobial peptide synthesized in the liver. J Biol Chem 276: 7806–7810.
9. Pigeon C, Ilyin G, Courselaud B, Leroyer P, Turlin B, et al. (2001) A new mouse
liver-specific gene, encoding a protein homologous to human antimicrobialpeptide hepcidin, is overexpressed during iron overload. J Biol Chem 276: 7811–
7819.
10. Van Zandt KE, Sow FB, Florence WC, Zwilling BS, Satoskar AR, et al. (2008)The iron export protein ferroportin 1 is differentially expressed in mouse
macrophage populations and is present in the mycobacterial-containingphagosome. J Leukocyte Biol 84: 689–700.
11. Hentze MW, Kuhn LC (1996) Molecular control of vertebrate iron metabolism:
mRNA-based regulatory circuits operated by iron, nitric oxide, and oxidativestress. Proc Natl Acad Sci USA 93: 8175–8182.
12. Harrison PM (1977) Ferritin: an iron-storage molecule. Sem Hematol 14: 55–70.
13. West AP, Giannetti AM, Herr AB, Bennett MJ, Nangiana JS, et al. (2001)
Mutational analysis of the transferrin receptor reveals overlapping HFE andtransferrin binding sites. J Mol Biol 313: 385–397.
14. Salgado JC, Nappa AO, Gerdtzen Z, Tapia V, Theil E, et al. (2010)
Mathematical modeling of the dynamic storage of iron in ferritin. BMC SystBiol 4: 147.
15. Achcar F, Camadro JM, Mestivier D (2011) A Boolean probabilistic model of
metabolic adaptation to oxygen in relation to iron homeostasis and oxidative
stress. BMC Syst Biol 5: 51.16. Chifman J, Kniss A, Neupane P, Williams I, Leung B, et al. (2012) The core
control system of intracellular iron homeostasis: a mathematical model. J Theoret
Biol 300: 91–99.
17. Mobilia N, Donze A, Moulis JM, Fanchon E (2012) A model of the cellular ironhomeostasis network using semi-formal methods for parameter space explora-
tion. Electronic Proceedings in Theoretical Computer Science 92: 42–57.
18. Gille C, Bolling C, Hoppe A, Bulik S, Hoffmann S, et al. (2010) HepatoNet1: acomprehensive metabolic reconstruction of the human hepatocyte for the
analysis of liver physiology. Mol Syst Biol 6: 411.
19. Krauss M, Schaller S, Borchers S, Findeisen R, Lippert J, et al. (2012)Integrating cellular metabolism into a multiscale whole-body model. PLoS
Comput Biol 8: e1002750.
20. Thiele I, Swainston N, Fleming RMT, Hoppe A, Sahoo S, et al. (2013) Acommunity-driven global reconstruction of human metabolism. Nature
Biotechnol 31: 419–425.
21. Le Novere N, Bornstein B, Broicher A, Courtot M, Donizelli M, et al. (2006)BioModels database: a free, centralized database of curated, published,
quantitative kinetic models of biochemical and cellular systems. Nucleic Acids
Res 34: D689–D691.22. Novere NL, Hucka M, Mi H, Moodie S, Schreiber F, et al. (2009) The Systems
Biology Graphical Notation. Nature Biotechnol 27: 735–741.
23. Chua AC, Delima RD, Morgan EH, Herbison CE, Tirnitz-Parker JE, et al.(2010) Iron uptake from plasma transferrin by a transferrin receptor 2 mutant
mouse model of haemochromatosis. J Hepatol 52: 425–431.
24. Girelli D, Trombini P, Busti F, Campostrini N, Sandri M, et al. (2011) A time
course of hepcidin response to iron challenge in patients with HFE and TFR2hemochromatosis. Haematologica 96: 500–506.
25. Asberg (2001) Screening for hemochromatosis: High prevalence and low
morbidity in an unselected population of 65,238 persons. ScandinavianJ Gastroenterol 36: 1108–1115.
26. Fleming RE, Holden CC, Tomatsu S, Waheed A, Brunt EM, et al. (2001)
Mouse strain differences determine severity of iron accumulation in hfe knockoutmodel of hereditary hemochromatosis. Proc Natl Acad Sci USA 98: 2707–2711.
27. Ludwiczek S, Theurl I, Bahram S, Schumann K, Weiss G (2005) Regulatory
networks for the control of body iron homeostasis and their dysregulation inHFE mediated hemochromatosis. J Cell Physiol 204: 489–499.
28. Piperno A, Girelli D, Nemeth E, Trombini P, Bozzini C, et al. (2007) Blunted
hepcidin response to oral iron challenge in HFE-related hemochromatosis.Blood 110: 4096–4100.
29. Robb A, Wessling-Resnick M (2004) Regulation of transferrin receptor 2 proteinlevels by transferrin. Blood 104: 4294–4299.
30. Kacser H, Burns JA (1973) The control of flux. Symposia of the Society for
Experimental Biology 27: 65–104.
31. Heinrich R, Rapoport TA (1974) A linear steady-state treatment of enzymatic
chains. Eur J Biochem 42: 89–95.
32. Sahle S, Mendes P, Hoops S, Kummer U (2008) A new strategy for assessingsensitivities in biochemical models. Phil Trans R Soc A 366: 3619–3631.
33. Lin L, Valore EV, Nemeth E, Goodnough JB, Gabayan V, et al. (2007) Iron
transferrin regulates hepcidin synthesis in primary hepatocyte culture throughhemojuvelin and BMP2/4. Blood 110: 2182–2189.
34. Becker V, Schilling M, Bachmann J, Baumann U, Raue A, et al. (2010)
Covering a broad dynamic range: Information processing at the erythropoietinreceptor. Science 328: 1404–1408.
35. Chloupkova M, Zhang AS, Enns CA (2010) Stoichiometries of transferrin
receptors 1 and 2 in human liver. Blood Cells, Molecules, & Diseases 44: 28–33.
36. Gao J, Chen J, Kramer M, Tsukamoto H, Zhang ASS, et al. (2009) Interactionof the hereditary hemochromatosis protein hfe with transferrin receptor 2 is
required for transferrin-induced hepcidin expression. Cell Metabolism 9: 217–227.
37. Hoops S, Sahle S, Gauges R, Lee C, Pahle J, et al. (2006) COPASI — a
COmplex Pathway SImulator. Bioinformatics 22: 3067–3074.
38. Funahashi A, Morohashi M, Kitano H, Tanimura N (2003) CellDesigner: aprocess diagram editor for gene-regulatory and biochemical networks.
BIOSILICO 1: 159–162.
39. Ajioka RS, Phillips JD, Kushner JP (2006) Biosynthesis of heme in mammals.Biochim Biophys Acta 1763: 723–736.
40. Wallace DF, Summerville L, Crampton EM, Frazer DM, Anderson GJ, et al.
(2009) Combined deletion of HFE and transferrin receptor 2 in mice leads tomarked dysregulation of hepcidin and iron overload. Hepatol 50: 1992–2000.
41. Huang CY, Ferrell JE (1996) Ultrasensitivity in the mitogen-activated protein
kinase cascade. Proc Natl Acad Sci USA 93: 10078–10083.
42. Sarkar J, Seshadri V, Tripoulas NA, Ketterer ME, Fox PL (2003) Role of
ceruloplasmin in macrophage iron efflux during hypoxia. J Biol Chem 278:
44018–44024.
43. Wang M, Weiss M, Simonovic M, Haertinger G, Schrimpf SP, et al. (2012)
PaxDb, a database of protein abundance averages across all three domains of
life. Mol Cell Proteom 11: 492–500.
44. Zaritsky J, Young B, Gales B, Wang HJ, Rastogi A, et al. (2010) Reduction of
serum hepcidin by hemodialysis in pediatric and adult patients. Clin J Am Soc
Nephrol 5: 1010–1014.
45. Wang CYY, Knutson MD (2013) Hepatocyte divalent metal-ion transporter-1 is
dispensable for hepatic iron accumulation and non-transferrin-bound iron
uptake in mice. Hepatol 58: 788–798.
46. Kim HY, Klausner RD, Rouault TA (1995) Translational repressor activity is
equivalent and is quantitatively predicted by in vitro RNA binding for two iron-
responsive element-binding proteins, IRP1 and IRP2. J Biol Chem 270: 4983–4986.
47. Ke Y, Wu J, Leibold EA, Walden WE, Theil EC (1998) Loops and bulge/loopsin iron-responsive element isoforms influence iron regulatory protein binding.
Fine-tuning of mRNA regulation? J Biol Chem 273: 23637–23640.
48. Erlitzki R, Long JC, Theil EC (2002) Multiple, conserved iron-responsiveelements in the 39- untranslated region of transferrin receptor mRNA enhance
binding of iron regulatory protein 2. J Biol Chem 277: 42579–42587.
49. Kennedy J, Eberhart R (1995) Particle swarm optimization. In: Proceedings ofthe Fourth IEEE International Conference on Neural Networks, Perth,
Australia. pp. 1942–1948.
50. Litzkow MJ, Livny M, Mutka MW (1988) Condor—a hunter of idleworkstations. In: 8th International Conference on Distributed Computing
Systems. pp. 104–111.
51. Kent E, Hoops S, Mendes P (2012) Condor-COPASI: high-throughputcomputing for biochemical networks. BMC Syst Biol 6: 91.
52. Johnson MB, Enns CA (2004) Diferric transferrin regulates transferrin receptor 2
protein stability. Blood 104: 4287–4293.
53. Pantopoulos K, Gray NK, Hentze MW (1995) Differential regulation of tworelated RNA-binding proteins, iron regulatory protein (IRP) and IRPB. RNA 1:
155–163.
54. Wang J, Chen G, Pantopoulos K (2003) The haemochromatosis protein HFEinduces an apparent iron-deficient phenotype in H1299 cells that is not
corrected by co-expression of beta 2- microglobulin. Biochem J 370: 891–899.
55. Rivera S, Nemeth E, Gabayan V, Lopez MA, Farshidi D, et al. (2005) Synthetichepcidin causes rapid dose-dependent hypoferremia and is concentrated in
ferroportin-containing organs. Blood 106: 2196–2199.
56. Kinobe RT, Dercho RA, Vlahakis JZ, Brien JF, SzarekWA, et al. (2006)Inhibition of the enzymatic activity of heme oxygenases by azole-based
antifungal drugs. J Pharmacol Exp Therap 319: 277–284.
57. West AP, Bennett MJ, Sellers VM, Andrews NC, Enns CA, et al. (2000)Comparison of the interactions of transferrin receptor and transferrin receptor 2
with transferrin and the hereditary hemochromatosis protein HFE. J Biol Chem275: 38135–38138.
A Computational Model of Liver Iron Metabolism
PLOS Computational Biology | www.ploscompbiol.org 13 November 2013 | Volume 9 | Issue 11 | e1003299

58. Byrne SL, Chasteen ND, Steere AN, Mason AB (2010) The unique kinetics of
iron release from transferrin: the role of receptor, lobe-lobe interactions, and saltat endosomal pH. J Mol Biol 396: 130–140.
59. Cozzi A (2003) Role of iron and ferritin in TNFa-induced apoptosis in HeLa
cells. FEBS Lett 537: 187–192.60. Pimstone NR, Engel P, Tenhunen R, Seitz PT, Marver HS, et al. (1971)
Inducible heme oxygenase in the kidney: a model for the homeostatic control ofhemoglobin catabolism. J Clin Investigation 50: 2042–2050.
61. Bao W, Song F, Li X, Rong S, Yang W, et al. (2010) Plasma heme oxygenase-1
concentration is elevated in individuals with type 2 diabetes mellitus. PLoS One5: e12371.
62. Shayeghi M, Latunde-Dada GO, Oakhill JS, Laftah AH, Takeuchi K, et al.(2005) Identification of an intestinal heme transporter. Cell 122: 789–801.
63. Tamura A, Watanabe M, Saito H, Nakagawa H, Kamachi T, et al. (2006)Functional validation of the genetic polymorphisms of human ATP-binding
cassette (ABC) transporter ABCG2: identification of alleles that are defective in
porphyrin transport. Mol Pharmacol 70: 287–296.64. Epsztejn S, Kakhlon O, Glickstein H, Breuer W, Cabantchik ZI (1997)
Fluorescence analysis of the labile iron pool of mammalian cells. Anal Biochem248: 31–40.
65. Haile DJ, Hentze MW, Rouault TA, Harford JB, Klausner RD (1989)
Regulation of interaction of the iron-responsive element binding protein withiron-responsive RNA elements. Mol Cell Biol 9: 5055–5061.
66. Mateo I, Infante J, Sanchez-Juan P, Garcıa-Gorostiaga I, Rodrıguez-RodrıguezE, et al. (2010) Serum heme oxygenase-1 levels are increased in Parkinson’s
disease but not in Alzheimer’s disease. Acta Neurol Scandinavica 121: 136–138.
67. Sassa S (2004) Why heme needs to be degraded to iron, biliverdin ixalpha, and
carbon monoxide? Antioxidants & Redox Signaling 6: 819–824.
68. Cairo G, Tacchini L, Pietrangelo A (1998) Lack of coordinate control of ferritin
and transferrin receptor expression during rat liver regeneration. Hepatol 28:
173–178.
69. Summers M, Worwood M, Jacobs A (1974) Ferritin in normal erythrocytes,
lymphocytes, polymorphs, and monocytes. British J Haematol 28: 19–26.
70. Salter-Cid L, Brunmark A, Li Y, Leturcq D, Peterson PA, et al. (1999)
Transferrin receptor is negatively modulated by the hemochromatosis protein
hfe: implications for cellular iron homeostasis. Proc Natl Acad Sci USA 96:
5434–5439.
71. Sibille JC, Kondo H, Aisen P (1988) Interactions between isolated hepatocytes
and Kupffer cells in iron metabolism: a possible role for ferritin as an iron carrier
protein. Hepatol 8: 296–301.
72. Swinkels DW, Girelli D, Laarakkers C, Kroot J, Campostrini N, et al. (2008)
Advances in quantitative hepcidin measurements by time-of-flight mass
spectrometry. PloS One 3: 7.
73. Riedel HD, Muckenthaler MU, Gehrke SG, Mohr I, Brennan K, et al. (1999)
HFE downregulates iron uptake from transferrin and induces iron-regulatory
protein activity in stably transfected cells. Blood 94: 3915–3921.
74. van Dijk BA, Laarakkers CM, Klaver SM, Jacobs EM, van Tits LJ, et al. (2008)
Serum hepcidin levels are innately low in HFE-related haemochromatosis but
differ between C282Y-homozygotes with elevated and normal ferritin levels.
British J Haematol 142: 979–985.
A Computational Model of Liver Iron Metabolism
PLOS Computational Biology | www.ploscompbiol.org 14 November 2013 | Volume 9 | Issue 11 | e1003299