Embed Size (px)
Citation preview
A Comprehensive Study on the Organization of Kansas School Districts
Prepared for
The Kansas State Board of Education
in response to RFP Number 00241
by
Augenblick & Myers, Inc.
Dr. John Augenblick, John Myers, and Justin Silverstein
January 10, 2001

i
EXECUTIVE SUMMARY In October 1999, Augenblick & Myers, Inc. (A&M), a Denver-based consulting firm that works with state policy makers on education finance and governance issues, was selected by the Kansas State Board of Education to conduct a study of school district organization. The study was mandated by the Kansas Legislature in Section 10, 1999 Senate Bill 171. A&M created an advisory panel for the study, consisting of Dr. Richard King of the University of Northern Colorado, Dr. Chris Pipho, formerly with the Education Commission of the States, Dr. Paul Nachtigal, former director of the Rural Challenge, and Mr. Terry Whitney, formerly with the National Conference of State Legislatures. We then undertook five key tasks. 1. We completed a review of the literature related to school district
reorganization. 2. We developed two approaches to selecting “target” districts that might
benefit from reorganization. 3. We conducted on-site visits and interviews with representatives of 64
school districts located throughout the state. 4. We developed three alternative ways to reorganize school districts. 5. We identified areas where statutory changes would be needed to
implement our recommendations. School districts are important governmental entities in this country. At the discretion of the states, most of them have been delegated the authority to levy taxes, incur bonded indebtedness, hire key employees, and set curriculum. Kansas, like the other states, determines how many school districts shall exist and where their boundaries shall be. Over time, the number of school districts has decreased dramatically from over 120,000 nationally, to fewer than 15,000, and from over 9,000 in Kansas, to 304. The importance of their boundaries has also diminished somewhat, particularly in states such as Kansas that have modified their school finance procedures so that the wealth of each district is far less critical in determining that district’s total revenue and property tax rates. This is also true in states that have promoted open enrollment (so that pupils can enroll in schools in districts other than the one in which they reside). Kansas currently has 1.00% of the nation’s pupils, 1.62% of the nation’s schools, and 2.10% of the nation’s school districts. While the states have delegated certain powers to school districts, they maintain both a constitutional responsibility to provide adequate and equitable education services and an interest in assuring that pupils achieve certain education objectives. A state’s economic and democratic future hinges on whether such objectives are met. Because

ii
the state pays for a significant portion of educational services, it also has an interest in assuring that the cost of providing these services is reasonable. These days, a state’s interest in elementary and secondary education primarily reflects its interest in pupil performance and per pupil spending. Little else justifies changing school district boundaries. The literature about school district reorganization is rather thin, consisting mostly of economic studies of school and school district optimum size, and the arguments that are made for and against changing the numbers of school districts in a state. While the literature is less than definitive about school and school district size, there has long been the view that schools, particularly high schools, need to be large enough to provide an adequate array of academic services and extra-curricular activities. More recently, there are those who advise that schools be small enough to assure a safe, nurturing environment and that school districts are not so large that they become unmanageable. While technology facilitates the provision of broader opportunities in small, isolated schools, there is little evidence that it can fully substitute for the hands-on presence of well-trained adults. And while evidence exists that some graduates of small high schools go on to become very successful, that evidence tends to focus on very few people, much the same way large schools publicize a small number of pupils who become Merit Scholars. A&M used two basic approaches to identify “target” school districts that might benefit from reorganization. The first approach focuses on districts with relatively low levels of pupil performance and relatively high levels of per pupil spending. We used a statistical technique, regression analysis, to predict both expected levels of pupil performance (based on combining 1998 composite reading, math, and writing scores for Kansas statewide achievement tests) and expected levels of per pupil spending (for instruction, administration, and plant maintenance and operation). Some people suggested that the use of the tests was inappropriate. Because our purpose was to focus only on some districts, the tests provide the only basis for evaluating the relative performance of school districts, and the information is already being used to hold districts accountable, we feel that it is appropriate to use them as the basis of identifying those school districts where state action might be required. While there are many other kinds of information that individual districts use to evaluate their own performance, none provide comparable information for all districts. We used per pupil spending as the basis for evaluating relative spending levels. Some people suggested that, since the state controls the level of spending of school districts, and no district exceeds the level specified by the state, it is logically impossible to identify high spending districts. Our feeling is that, given the variation in spending that exists, some districts may be spending more than necessary relative to the spending of other districts. The state’s formula for distributing state aid may also permit higher spending than is necessary. Using regression analysis allows us to see how pupil performance and per pupil spending are influenced by the proportion of pupils eligible for free and reduced price lunches and the wealth or enrollment level of a school district. The regression equations accounted for 73 percent of the variation in per pupil performance and 80

iii
percent of the variation in per pupil spending. Given that those levels are high but not perfect, we established confidence intervals around predicted levels of performance and spending to be sure that appropriate districts were identified as being low in performance or high in spending. Based on our analysis, we identified 28 districts that had a combination of low pupil performance and high per pupil spending. They are listed below in three categories. Districts that have low pupil performance and high per pupil spending based on
regression results: Moscow Public Schools (209), West Solomon Valley Public Schools (213), Elkhart (218), Washington Schools (222), Hanston (228), Nes Tre La Go (301), Belle Plaine (357), Chase-Raymond (401), Hillcrest Rural Schools (455), and Udall (463).
Districts with higher than expected per pupil spending and lower than average
pupil performance for two years: Fowler (225), Triplains (275), Elk Valley (283), Cedar Vale (285), Herndon (317), Eastern Heights (324), Wathena (406), and Chetopa (505).
Districts with lower than expected pupil performance in 1998, lower than average performance in 1997, and per pupil spending above the predicted level excluding the use of the confidence interval: Turner-Kansas City (202), Bonner Springs (204), Mankato (278), Pleasanton (344), Oxford (358), Caldwell (360), Marysville (364), Madison-Virgil (386), Neodesha (461), and South Haven (509).
The second approach to identify districts that might benefit from reorganization focuses on districts that are either too small or too large, given what researchers and practitioners believe, to offer an appropriate curriculum, extra-curricular opportunities, and a safe, nurturing environment. This approach assumes that a high school should serve between 100 and 900 pupils and that a district should have an enrollment of at least 260 pupils per high school but no more than 2,925 pupils per high school in order to be at those levels. Looking at the total enrollment of school districts and the number of high schools they operate, we found 50 districts that are too small and 24 districts that are too large based on these guidelines. We also identified two districts as being so large that they might need to be reorganized by breaking them into smaller, more manageable districts. These 76 districts have been grouped into four categories and listed below. Districts that are too small with only one high school: Cheylin (103), White Rock
(104), Moscow Public Schools (209), Northern Valley (212), West Solomon Valley Schools (213), Rolla (217), Ashland (220), North Central (221), Fowler (225), Hanston (228), West Smith County (238), Weskan (242), Palco (269), Triplains (275), Jewell (279), West Graham-Morland (280), Elk Valley (283), Cedar Vale (286), Grinnell Public Schools (291), Wheatland (292), Prairie Heights (295), Sylvan Grove (299), Nes Tre La Go (301), Smoky Hill (302), Bazine (304), Brewster (314), Golden Plains (316), Herndon (317), Eastern

iv
Heights (324), Logan (326), Burrton (369), Montezuma (371), Hamilton (390), Paradise (399), Chase-Raymond (401), Mullinville (424), Midway Schools (433), Hillcrest Public Schools (455), Healy Public Schools (468), Dexter (471), Haviland (474), Copeland (476), Pawnee Heights (496), Lewis (502), and Attica (511).
Districts that are too small with more than one high school: Barnes (223), Leroy-
Gridley (245), Southern Cloud (334), Rural Vista (481), and Axtell (488). Districts that are too large relative to the number of high schools they operate:
Turner-Kansas City (202), Blue Valley (229), Olathe (233), Emporia (253), Derby (260), Haysville (261), Goddard (265), Maize (266), Salina (305), Hutchinson Public Schools (308), Seaman (345), Newton (373), Manhattan (383), Great Bend (428), Auburn Washburn (437), Dodge City (443), Leavenworth (453), Garden City (457), Geary County Schools (475), Liberal (480), Hays (489), Lawrence (497), and Kansas City (500).
Districts that are too large: Wichita (259) and Shawnee Mission Public Schools (512).
Some of the most important activities we undertook in this study were the on-site visits to a large number of school districts where we interviewed many district representatives. We did this not only because it was required by contract, but also to better understand the dynamics within the districts we identified as targets and in their neighboring districts, which might also be involved in reorganization. We used several criteria to select districts for on-site visits or interviews. First, every one of the 28 districts we identified using the first approach described above was placed on the list. Second, we selected some neighboring districts of those 28 target districts. Third, we obtained additional information about 90 school districts, including the age of their buildings and enrollment projections, and selected some districts based on those factors. Finally, we selected some districts based on being too large, using the second approach to identify target districts described above. In all, we had contact with 64 districts. We learned a number of things from our on-site visits and interviews: (1) there is substantial resistance to consolidation because of historical, cultural and financial reasons; (2) there is support for state reorganization in extreme cases, where there are declining enrollments and high spending; (3) district officials justified and defended low student performance and high spending; and (4) technology, distance learning, building projects and innovative superintendents were considered essential for surviving consolidation. Once the on-site visits and interviews were completed, we began to develop reorganization scenarios, ultimately creating three alternative approaches: (1) an approach based on pupil performance and per pupil spending; (2) an approach based on enrollment levels relative to number of high schools; and (3) an approach that took

v
into consideration both of the first two approaches and resolved differences between them based on a variety of practical considerations, including distance between schools, school capacity (which we obtained through a survey carried out by the Department of Education), and the information we obtained through the on-site visits and interviews. Tables in the report show the characteristics of target school districts and their neighboring districts, as well as the mergers of districts associated with the three alternative approaches to reorganization. The figures below summarize the results of each approach for the entire state. (1) For the approach based on pupil performance and per pupil spending, we
identified 28 target districts. We examined all neighbors of those districts for possible reorganization with target districts based on their pupil performance, their per pupil spending, and their distance from the target districts. We were unable to reorganize eight of the target districts using those criteria. We found 20 neighboring districts that could be merged with the 20 remaining target districts to create 20 new districts. The result is 284 districts statewide.
(2) For the approach based on school district size, we identified 76 target
districts. We examined all neighbor districts for the 74 districts that we felt had high schools that were either too small or too large based on enrollment relative to number of high schools, excess capacity of schools, and distance between schools. We were able to reconfigure 45 of the 50 districts with high schools that are too small by merging them with 29 neighbor districts and creating 34 new districts. We were able to reconfigure six of the 24 districts with high schools that are too large by merging them with seven neighbor districts and creating five new districts. In total, 51 target districts are merged with 36 neighbor districts to create 39 new districts and a total of 256 districts in the state. Some other approach would need to be taken to address the issue in 20 of the 26 districts with large high schools and in the two large districts.
(3) For the combined approach, we were able to reconfigure 56 target districts
with 36 neighboring districts to create 43 new districts and a total of 255 districts statewide. As with the second approach, we were unable to resolve concerns in 21 districts by reorganization, which would require other approaches to be taken.
In order to facilitate reorganizing school districts in Kansas, a number of changes need to be made to the state’s statutes. A&M recommends that the legislature delegate to the State Board of Education the power to change school district boundaries more easily than is currently allowed. The State Board should consider boundary changes by using three processes to assess alternative: (1) Emergency dissolution, (2) Required boundary change planning, and (3) Review of boundary options. The emergency

vi
dissolution is required for those districts that are less than 80 students in 2000, or less than 100 students in 2001 and have declining enrollment. Those districts are required to have a public hearing and report the results to the State Board. The State Board shall take action to accept the district report or implement one of their own. The required boundary change planning is for all of the other districts identified as part of the 28 original targets on Map 1 in this report. Districts would have three years to work on improvements or recommendations, then if they are still targets would follow the emergency dissolution process. The review of boundary options would be for all of the other districts identified as targets in this report. They would follow the same process as the required boundary change planning districts without the final requirement of dissolution.

vii
TABLE OF CONTENTS I. Introduction I-1 II. School District Boundaries: An Overview An Overview of the Literature II-1 School Districts in Context II-1 Historical Evolution of School Districts II-1 District Consolidation II-3 The Case for Large School Districts II-3 The Case for Small School Districts II-4 The Small Schools Critique and the Diseconomies of Scale II-5 Sher’s Critique of Large District Size II-6 Optimal Size II-7 Monk’s Test for District Consolidation II-7 The Current Environment II-9 Bibliography II-10 III. Alternative Procedures for Identifying Districts that Might Benefit from Reorganization Introduction III-1 Identifying Target Districts Based on Pupil Performance and Per Pupil Spending III-1 Pupil Performance III-2 Per Pupil Spending III-4 Selecting “Target” Districts III-6 Identifying Districts Based on Size of School III-7 Selecting “Target” Districts III-8 IV. Interview Procedures The On-Site Visit and Interview Process IV-1 Selecting Districts for Analysis IV-1 KASB School Board Meetings IV-2 The Research Teams IV-2 On-Site Visits IV-2 School Districts Selected IV-3 Phone Interviews IV-3
viii
TABLE OF CONTENTS (Continued) IV. Interview Procedures (continued) Large School Districts IV-4 Conclusion IV-4 What We Heard: IV-4 A Summary of the Interviews IV-4 Resistance to Consolidation IV-4 A Call for State Help IV-5 Explanations for Low Student Performance IV-6 Explanations for High Spending IV-7 Responses to Consolidation IV-7 The Reorganization Process IV-9 Conclusion IV-9 V. Alternative Approaches to Reorganizing School Districts in Kansas Introduction V-1 The First Approach to School District Reorganization (Map 1) V-2 The Target Districts V-2 Identifying Appropriate Neighboring Districts V-3 The Second Approach to School District Reorganization (Map 2) V-3 The Target Districts V-3 Identifying Appropriate Neighboring Districts V-4 The Third Approach to School District Reorganization (Map 3) V-5 VI. Recommendations for Statutory Changes Current Statutes VI-1 Recommendations VI-3 Emergency Dissolution VI-4 Required Boundary Change Planning VI-4 Review of Boundary Options VI-5 Other Statutory Issues VI-5 Appendix Tables
ix
LIST OF TABLES
III-1 District-Weighted Kansas Statewide Statistics for Variables Related to Per Pupil Spending and Pupil Performance in 1998-99 III-2 Pupil-Weighted Kansas Statewide Statistics for Variables Related to Per Pupil Spending and Pupil Performance in 1998-99 III-3 District-Weighted Averages for Variables Related to Per Pupil Spending and Pupil Performance in 1998-99 by Quintile of Per Pupil Performance for School Districts in Kansas III-4 Pupil-Weighted Averages for Variables Related to Per Pupil Spending and Pupil Performance in 1998-99 by Quintile of Per Pupil Performance for School Districts in Kansas III-5 District-Weighted Averages for Variables Related to Per Pupil Spending and Pupil Performance in 1998-99 by Quintile of Per pupil Spending for Instruction, Admin- istration, and Plant M&O for School Districts in Kansas III-6 Pupil-Weighted Averages for Variables Related to Per Pupil Spending and Pupil Performance in 1998-99 by Quintile of Per pupil Spending for Instruction, Admin- istration, and Plant M&O for School Districts in Kansas III-7 Pupil-Weighted Averages for Variables Related to Per Pupil Spending and Pupil Performance in 1998-99 for Three groups of Kansas School Districts Identified as Low Performing and High Spending V-1 Data Related to the Selection of Neighboring Districts to Merge with the Target Districts Associated with Map 1 V-2 Districts Involved in Reconfiguration Where Target Districts are Those with Relatively Low Performance and Relatively High Spending (Map 1) V-3 Data Related to the Selection of Neighboring Districts to Merge with the Target Districts Associated with Map 2

x
LIST OF TABLES (Continued)
V-4(A) Districts Involved in Reconfiguration Where Target Districts are Those with Schools Considered to be Too Small Based on Enrollment Relative to Number of High Schools (Map 2) V-4(B) Districts Involved in Reconfiguration Where Target Districts are Those with Schools Considered to be Too Large Based on Enrollment Relative to Number of High Schools or Where the District Itself Is Considered to be Too Large (Map 2) V-5 Districts Involved in Reconfiguration Where Target Districts are Those Identified in Map 1 and Map 2 and Some Issues that Arose in Making Those Maps are Resolved (Map 3) V-6 Numbers of Districts that are Reconfigured in Association with Map 1, Map 2, and Map 3 Appendix 1 Enrollment Data for All Districts Appendix 2 Performance Data for All Districts Appendix 3 1998-99 Spending Data for All Districts Appendix 4 Enrollment, Capacity and Year Built for Schools Appendix 5 Self Reported Condition of Buildings for the 90 Districts that Were Asked to provide Additional Information

I-1
Chapter I
INTRODUCTION
In October 1999 Augenblick & Myers, Inc. (A&M) signed a contract with the Kansas State Board of Education to conduct an analysis of school district organization. The study was undertaken pursuant to Section 10 of 1999 Senate Bill No. 171, which mandated that a consultant be employed to gather and analyze information, conduct on-site visits in school districts, and develop a comprehensive plan for the organization of school districts so that the school system could operate efficiently and effectively. We spent the last 15 months studying school districts in Kansas in order to comply with the requirements of the State Board of Education and the Legislature. The purpose of this report is to describe our work, including the procedures we used to collect and evaluate information, the alternative approaches we developed to address some of the issues we identified, and the statutory changes that would need to be made in order to implement those approaches. School districts play an important role in American society. Although the states have the constitutional responsibility of providing public elementary and secondary education, they have delegated the authority to manage the way education services are delivered to school districts, which they can create or dissolve as they see fit. School districts have specific powers, which vary from state to state, that range from levying taxes and incurring bonded indebtedness to hiring staff and setting curriculum. Over time, however, the roles of school districts have changed somewhat as states, including Kansas, have placed constraints on the ability of school districts to generate revenue and have permitted students to enroll in schools in districts other than the ones in which they reside. Over the last 100 years, the number of school districts has decreased dramatically, from more than 120,000 to less than 15,000. This change reflects a variety of trends, including the creation of unified, K-12 districts, rather than elementary or high school districts, and the desire to have entities that provide a broad array of instructional and ancillary services in an efficient manner. As anyone knows who has even contemplated changing the way school districts are organized, the topic is a controversial one. The states have approached the organization of school districts in very different ways with some states having only a few and some making them co-terminal with counties, while others have large numbers of districts that may be independent of any other government entities. School districts are symbols of localism and they play an important role in the economies of some communities. When change occurs, it tends to cause great consternation and, as we discovered working in Kansas, people remember those changes for a long time after they have taken place. There are a variety of reasons for why a state might choose to change the way its school districts are organized. The state might decide that some schools or school districts are too small, or too large, to provide services efficiently. It might decide that

I-2
school districts should share their boundaries with other political jurisdictions, such as towns or counties, in order to strengthen the relationship between the way education services and other social services are provided. The state might decide that some of the boundary lines of school districts are so “odd” that they should be changed so that they are straight, or follow natural landmarks, or so they do not cross county lines. We have heard all of these, and other reasons, as possible justifications to reorganize school districts in Kansas. In fact, in 1998-99, Kansas enrolled 1.00 percent of the pupils in the nation but had 1.62 percent of the schools and 2.10 percent of the school districts in the United States. In our view, the ultimate responsibility of the state is to assure that education services are provided effectively. Effectiveness could mean a lot of different things. It might mean that pupils, schools, or school districts are performing at a high level. It might mean that school districts are spending at a reasonable level, that schools are not so small or so large that they incur extremely high costs, and that school facilities are being utilized appropriately. And it might mean that school districts provide an appropriate array of services so that pupils are exposed to both a broad curriculum and appropriate extra-curricular activities. If a state found that education were not being provided effectively in certain school districts, the state would be justified in examining the situation carefully and possibly reorganizing school districts to produce the desired results. In fact, we believe that there are few other justifications for school reorganization. Therefore, we viewed the purpose of our work as identifying situations in which education is not being provided effectively in Kansas — that is, pupil performance is relatively low while per pupil spending is relatively high, or schools are smaller or larger than what practitioners believe to be appropriate — and determining whether school district reorganization could reasonably be expected to change the situation under circumstances where it would be practical. We completed a variety of tasks in order to gather background information, obtain and analyze data, and organize findings and recommendations. 1. We created an advisory panel to review our progress. The panel included
Dr. Richard King, professor of education administration at the University of Northern Colorado; Dr. Chris Pipho, former Senior Fellow at the Education Commission of the States; Dr. Paul Nachtigal, former National Director of the Rural Challenge; and Mr. Terry Whitney, former Senior Policy Specialist at the National Conference of State Legislatures.
2. We undertook a thorough review of the literature about school size and
school district consolidation. 3. We conducted an analysis of pupil performance and per pupil spending in
order to identify those districts that should be targets of state scrutiny due to lower than expected performance and higher than expected spending.

I-3
4. We identified other criteria, such as district size, change in enrollment, and
age of buildings, that might serve as the basis of identifying other districts that could be the target of state scrutiny and that were used to select districts from which we needed to gather more data than were routinely available or that we wanted to contact.
5. We collected additional data, including enrollment projections and
information about the condition of school buildings, from target districts and some of their neighbors.
6. We conducted on-site visits to some school districts and held meetings
with representatives of other school districts and, in conjunction with those meetings, made presentations to every regional meeting of the Kansas School Boards Association in the Spring of 2000.
7. We worked with the Kansas Department of Education to collect data on
the capacities of school buildings. 8. We obtained mapping software that allowed us to plot schools, school
district boundaries, and county lines for Kansas. The software also made it possible for us to measure distances between any pairs of schools.
9. We conducted additional on-site visits in several school districts -- some
with large high schools, one that we considered to be a very large district, and one with a group of districts that were all target districts in the same county.
10. We met with representatives of several state level education associations
to discuss our progress. 11. We created three alternative approaches to reorganize school districts
based on different ways of selecting target districts, reviewing data for neighbor districts, and taking into consideration some of the information we gathered from visits and meetings.
This report is organized as follows: Section II is the review of the literature. In Section III, we describe the various procedures we used to select target districts. Section IV discusses the on-site visits and interviews. In Section V, we present three alternative ways of reorganizing school districts. The statutory changes required to implement the recommendations are discussed in Section VI. A series of appendices present data for every school district in the state.
II-1
Chapter II
SCHOOL DISTRICT BOUNDARIES: AN OVERVIEW
This section of the report describes how school districts in the United States have evolved into governing bodies and why they have changed over time. In doing so, the report will offer a review of the research and current trends for reorganizing school districts. An Overview of the Literature
This section offers a brief overview of the research literature on school district organization. This is not a literature review in the traditional sense. Most of the research concerning school districts is interwoven within (1) broad philosophical educational issues, (2) individual schools and what goes into them, (3) people’s likes and dislikes for various approaches, (4) discussions of ideal class and school size, and (5) the finance and governance of schools. Instead, the primary focus of this section will be the organizational structures and optimal size of school districts. In doing so, we will highlight historical developments, influential research, authors, popular writings, case studies and the structural forces that have affected school districts. School Districts in Context
A school district is one of four types of governmental entities that exists below the state government in the U.S. that provide general and specific services to people in a geographic region. It is not unusual for people to be served by overlapping government entities and jurisdictions simultaneously. In 1992, there were 3,043 counties and 35,962 municipalities, townships, or towns that provided general government services. At the same time, there were 33,131 special district governing bodies, focusing on the availability of higher education (through community colleges), recreation service, control of natural resources, fire protection and other services. 14,556 school districts oversaw education services for elementary and secondary schools (Bureau of the Census, 1993, Table 466). Historical Evolution of School Districts
School districts have evolved as the public interest in education has expanded in the last 300 years. It is often expressed as a Jeffersonian ideal, that (state) government is primarily responsible for providing education for its citizens; however, in American colonies, education was primarily the function of the family or church. 18th Century education was characterized by enormous variation:

II-2
... there were individual teachers of reading, writing, ciphering, grammar, bookkeeping, surveying, navigation, fencing, dancing, music, modern languages, embroidery, and every conceivable combination of these and other subjects; teachers taught part time and full time, by day and by evening, in their homes, in other people’s homes, in rented rooms, in churches and meetinghouses, in abandoned buildings, and in buildings erected especially for their use; (teachers) were self-employed and employed by others (acting as individuals or through self-constituted, self-perpetuating, or elected boards; and they were paid with funds obtained from employers, patrons, subscriptions, lotteries, endowments, tuition rates, and taxes (Cremin, 1970, pp. 499-500).
As early as 1642, a Massachusetts statute required towns to make “some
provisions for giving the rudiments of learning to those children who did not get them at home” (Beard, 1944, p. 64). In 1692, the Massachusetts general court required that all towns of 100 families or more have a grammar school; and a few years later, the court required a full-time instructor (Cremin, 1970, p. 524).
As the country expanded, conflicts arose between towns and families that demanded access to schools in the precincts and wards where they lived. Cremin (1970) observes:
such disputes were indicative of the extent to which the school was looked upon as integral to an orderly community, and the right to maintain one essential to community integrity. Indeed, petitions to the general court for the right to form new towns often based their appeal on the need for better services (p. 525).
Education developed differently in different regions of the country, reflecting their
particular economic, social, geographic, and fiscal characteristics. What worked in New England communities, for example, did not work on the plantations in the South. As states were established, they wrote their own constitutions specifically mentioning education, even though the U.S. Constitution did not mention education.1 Although some state constitutions were more explicit than others (about the expectations for public education), most required that their state provide “thorough,” “uniform,” efficient,” or “free” education services.
State legislatures eventually delegated their authority and constitutional responsibility to school districts, which governed, and in some cases, maintained the fiscal responsibility for public schools (e.g., eleven states refer to local school boards in their constitutions; see Education Commission of the States, June 1999). Many school districts were established coterminous with counties and municipalities, while others were created with a different set of boundaries. Some school districts were “independent,” with the authority to collect tax revenues, while others were “dependent,” or fiscally controlled by some government entity. The states eventually replaced the
1 Although the Northwest Ordinance of 1787 declared that “schools and the means of education shall forever be encouraged.” The ordinance required that a section of land in every township be devoted to the support of schools.
II-3
laws permitting states, cites, counties and towns to levy taxes for schools (with voter approval), with state and local boards of education that were required to provide free and compulsory education, at least at the elementary level (Beard, 1944, p. 219). By the middle of the 19th Century, educational governance was in the hands of locally elected boards, which established curriculum, hired employment staff, selected textbooks, located physical space, and granted diplomas to graduates.
In the 20th Century, the modern model for resolving complex and political education issues, such as who should be educated, how education should be organized, and who should pay for it (particularly in urban high schools) is the “incipient bureaucracy” model, says Michael Katz (1971). Bureaucracies emerged as a way of providing a consistent set of services by qualified experts to pupils at a low cost. As school boards decreased, ward and precincts were abolished, the reliance on “experts” increased, and the role of state departments of education grew, particularly in terms of professional certification (Education Commission of the States, Nov. 1999, pp. 9-11). In sum, school districts emerged as a way of providing educational services that were conveniently located near pupils (in elementary schools), thereby fulfilling state constitutional requirements.
District Consolidation
The number of school districts has decreased sharply in the last century. Since the beginning of the 1900's, the number of school districts, nationwide, has declined by 87 percent from 117,108 school districts to 15,367 in 1992 (Walberg, 1993). 2
As of the United States, Kansas has decreased dramatically its number of school
districts. In 1896 Kansas had 9,284 school districts (Kansas Biennial Report, 1964); by 1966-67, this number of school districts had dropped to 348. There are 304 school districts in Kansas presently. The Case for Large School Districts
The decline in the number of school districts can be explained by a major ideological shift in the U.S. after World War II, toward industrialized, economically efficient, highly productive organizations. Hence, corporations served as models for school reorganization and consolidation, with a decidedly bureaucratic bent (Education Commission of the States, Jan. 1999). The proponents of the rapid consolidation movement argued that large schools could use their resources more efficiently and achieve “economies of scale,” a theory that focuses on the increased savings through reduced redundancy and increased resource strength as schools and school districts get bigger (e.g., one large school can operate more cheaply and efficiently than two smaller ones). Economies of scale were further applied to the cost of “producing” a given level of student achievement. The logic was that savings would accrue as costs were spread over a larger pupil base. These savings could then be applied toward

II-4
developing a more comprehensive and specialized programs of instruction, with greater quality, for more students with differing interests and abilities.
Early research supported the idea that larger school districts could operate more efficiently than small districts. One of the leading proponents of larger schools and economies of scale theory was former Harvard President James Bryant Conant. In his influential 1959 book (financed by the Carnegie Corporation of New York in 1957), The American High School Today, Conant indicated that larger high schools (those over 750 students) were more efficient and could offer a more comprehensive curriculum of greater quality and lower cost than smaller schools. Larger schools could afford more specialized teachers, counselors, classes and activities. Students attending large schools could benefit from increased course offerings and participate more in extracurricular activities. Thus, Conant called for the elimination of high schools having fewer than 100 students in the graduating class (Sher, 1986, p. 29), favoring larger units for “comprehensive” schools. Conant’s conclusions reinforced a 1948 study by the National Commission on School District Reorganization, which favored large school districts because small school districts had difficulty attracting and retaining qualified teachers (Hughes and Bass, 1994, p. 9).
From the beginning of the century to the early 1960s, research supporting large schools and districts (and the economies of scale theory) dominated the education research and popular writings. This research focuses on educational “inputs” (e.g., the number of teachers, professional staff, salary levels, availability and materials). Since the 1960s, support for the economy of scale theory would lead policymakers and educators to favor the rapid consolidation movement. The Case for Small School Districts
By 1964, the rapid consolidation movement was challenged by an insurgent movement for smaller schools and smaller school districts. In Big School, Small School: High School Size and Student Behavior, published in 1964, Barker and Gump found that only a few students actively participated in activities in large schools; by contrast, students in small schools engaged in extracurricular activities in a greater proportion (see Swenson & King, 1997 p. 367). Although large schools offered more varieties of subjects, Baker and Gump found that pupils in large schools took fewer electives proportionally than students in smaller schools. Barker and Gump were not explicit as to the ideal size of a given school, but their book began challenging the conventional wisdom and popular ideology of the time, that “bigger is better.” Specifically, they challenged the economies of scale theory, and placed more emphasis on the “outputs” of school districts, such as student achievement, participation and social relationships. After conducting a nationally comprehensive study, in A Place Called School (1964), Goodlad concluded that it is not impossible to have a good large school, but it is difficult; the burden of proof on large schools is to show what curricular benefits they have that small schools do not.

II-5
Barker and Gump’s analysis spawned a growing reform movement for smaller schools, which has gained support presently in research and popular writings. The small schools literature began with large-scale qualitative studies in the 1980s and 1990s, reinforcing a number of literature syntheses and reviews establishing the effectiveness of small schools. These studies built an “impressive case for “smallness”(Raywid, 1996). In their reviews of the literature, Raywid (1997) and Cotton (1996) found smaller schools to be more personal, equitable, participatory, “community-oriented” (see Nachitgal, 1992), safer, and conducive to student learning. By contrast, Klonsky (1995) and Raywid (1995) found that large schools have lower grade averages, lower test scores, higher dropout rates, and more problems with violence.2 In his review of the literature, Klonsky (1998) found a compelling body of research showing that female, minority (especially, African American and Latino students), low socioeconomic, and special needs students benefit from smaller school units (charters, minischools, houses) than larger ones. The Small Schools Critique and The Diseconomies of Scale
Small school reformers typically cast their arguments in “big” versus “small” schools, but almost always ignore or diminish the costs of maintaining small schools and districts. Further, they fail to address the central question: when is a school or district too small to produce effective student learning. Lee and Smith (1997) warn that the ideological shift toward “smallness” is proceeding without research to support it, which might result in a number of schools (and school districts) that are too small to produce effective student learning, particularly for minority and disadvantaged students.
As for cost, most proponents of small schools acknowledge that spending increases per pupil in small school districts, at least initially. However, they argue that spending should not be based on per pupil spending, but on the number of graduating students, which they argue is higher than large school districts.
In addition, they argue that empirical evidence supporting the economies of scale theory is weak. The savings projected by the school consolidation movement has not materialized because large schools often expand their administrative staff to manage bureaucratic needs and transportation costs (particularly in rural areas), thereby offsetting savings (Chambers, 1981). When states give more funding to schools, they also increase the regulations and legislation, resulting in a bureaucratic system of education complete with inefficiencies (Walberg, 1993, p. 123). Walberg refers to this condition as “diseconomies of scale,” which occur when the per unit costs increase as a greater number of units are served. Like Walberg, Coleman and LaRocque (1984) argue that it is not clear that the economies of scale theory applies to school districts (in British Columbia) because the administrative costs are a relatively small portion of a district’s overall costs (p. 22). Moreover, the relationship between district size and the
2 Raywid (2000) and other scholars have suggested that the large “alienating” size of Columbine High School, over 1600 students, might well have been a factor in the school shooting tragedy.

II-6
resource availability is inconsistent across socioeconomic communities (Friedkin & Neocochea, 1988). Although districts in low income areas have access to more resources than smaller school districts, critics point out that in such populations there is a higher incidence of “exceptional problems” that contribute to lower achievement (Lee & Smith, 1997, p. 207).
An additional body of literature argues that bigger districts lead to bureaucracies, which negatively impact student performance. In his review of student test scores among states, Walberg (1993) found that higher achieving states have smaller districts, smaller schools, and smaller state shares of school costs (p. 115). Carnoy and MacDonnell (1990) found that large organizational structures limit local control for teachers and principles to make decisions to improve student performance. Sher’s Critique of Large District Size
In spite of the rapid consolidations throughout the 1900s, there was little evidence that school districts actually operate more efficiently presently (Management Analysis and Planning Associates, 1996, p. 21). Yet a 1986 report by the North Carolina Department of Public Instruction sparked criticism after it recommended that states consolidate, so that there was no more than one school per district per county, and all districts had at least 5,000 students (Sher, 1986, p. 8).
In response to the North Carolina recommendations, in 1986 researcher Jonathan Sher examined student achievement in large and small districts, specifically analyzing the student performance data (SAT, ACT, and graduation rates) that was available at the time nationwide. (Today the flaws in using these indicators of student performance are well known.) Students’ scores on the SAT were compared among states. The study found that on average, states that had districts smaller than 5,000 students scored higher on the tests than states with larger districts (Sher, 1986 p. 21). States that ranked in the top ten percent on SAT scores, were in the top ten percent of per pupil expenditures (ibid.).
Sher’s study also examined how students in comparative states performed on the ACT. The study found that four of the five states whose students scored the highest on the ACT had districts averaging less than 2,000 pupils, and none had an average school district size above 3,000 (Sher, 1986, p. 22). Conversely, the average district size of states whose students performed poorly on the ACT were five times greater than that of the top-ranked states (ibid.).
Sher also compared graduation rates among states. States that had the highest
graduation rates had far smaller schools and school districts than states that had the lowest graduation rates (Sher, 1986, p. 23). Sher cautioned that these results did not prove that having small, sub-county school districts produced better student learning. But Sher’s evidence directly challenged the validity of the North Carolina Department of Public Instruction’s recommendation that school districts having at least 5,000 students
II-7
were necessary to achieve the best student outcomes (Sher, 1986, p. 24).
In another study, Sher also compared student performance among large and small districts in Nebraska. This study similarly found that on average, larger districts had higher dropout rates than smaller districts (Sher, 1988, p. 22). The ACT scores were also higher in small districts than in large districts (Sher, 1988, p. 24).
A study of student performance among school districts in Colorado found similar results. Student average test scores on the Iowa Test of Basic Skills in smaller districts outperformed those in larger districts, with the difference even more pronounced the higher the grade levels (Colorado Department of Education, 1995, p. 9). Furthermore, in 1994, the Colorado graduation rate for the 25 smallest school districts was 95.1 percent, while the graduation rate for the entire state was 78.8 percent (Colorado Department of Education, 1995, p. 10). Thus, students in smaller school districts are performing better and graduating at a higher rate than those in larger school districts in Colorado. Optimal Size
Rather than defining an ideal size for schools and districts (often degenerating into debates between large versus small, or specialization versus dehumanization), recently researchers have attempted to define the optimal school district size. Optimal school size has been an enduring issue for educational policy, and meaningful and influential distinctions for policymakers (See Lee & Smith, 1997, p. 219). Optimal school district size refers to (1) how the school district size produces optimum economic efficiency (an economic criteria, or inputs) and (2) how the size of the district affects student performance and the equity of student learning (a sociological criteria, or outputs).
Researchers have attempted to define the optimal school district size, but the numbers vary widely. For example, studies have recommended districts as large as 50,000 pupils while others have targeted districts as low as 500 (Monk and Kadamus, 1995, p. 30). Some argue that districts and schools could never be too small; good school districts come in all kinds and sizes (Sher, 1988, p. 25); or, it depends on the situation and circumstances. Such ambivalence led some researchers to conclude that there is no optimal school district size. Monk’s Test for District Consolidation
In determining whether school districts should be consolidated, Monk (1992) describes the indicators of a quality of education offered by a school or a district. These factors include: learning outcome indicators (i.e., standardized tests given to students to measure their abilities) and schooling process indicators, i.e., measuring inputs such as teacher experience, training, class size, and courses offered (Monk, 1992, p. 39). These

II-8
factors can be used to examine and evaluate how well a district is doing, and whether consolidation is necessary. As for economies of scale, like Conant, Monk argues that larger districts and schools are less expensive to operate and offer more courses for student learning. For Monk, however, size alone does not determine the quality of courses offered (Monk, 1992, p. 41).
Monk and Kadamus (1995) outline conditions or indicators that a district may not be performing at the desired level. These conditions include: a district is spending more than is necessary to achieve a given result (that is, higher test scores), a district is producing the “wrong” mix of results; a district is producing results at the “wrong” level. According to Monk and Kadamus (1995), states must define a set of indicators that can identify districts with these types of productivity problems. States must also establish benchmarks so that judgments can be made about the educational outcomes that are observed (Monk and Kadamus, 1995, p. 34).
In addition to Monk’s test, the literature on optimal school size may provide additional guidelines in determining optimal school district size, although the relationships of school and district size are often confused, particularly for high schools (many districts operate as a single high school).
A widely held assumption is that elementary schools should be smaller than middle and high schools because elementary schools provide intimate relations and supportive environments for young children. (High school students desire more course offerings.) Based on a review of 103 studies, Cotton (1996) found the optimal size for an elementary school is between 300 and 400 students.
The research focusing on optimal school size for middle schools is in its infancy; but a 1992 survey of middle school principals reported that the optimal school size for middle schools is 400 to 599 students.
After analyzing the NELS database of 9,812 students, (8th through 12th graders), Lee and Smith (1997) found that schools were most effective for student learning and equitable learning (across differing socioeconomic levels and concentration of minority students) when they enroll between 600 and 900 students. Importantly, in schools smaller than 600, students learn less. This is an important finding because, the authors conclude, there are schools too small to produce effective student learning.
Similarly, Turning Points, an influential report on school reform, written in 1989 by Carnegie Foundation, as well as the National Association of Secondary School Principals recommended that high schools enroll no more than 600 students. The ideal high school of 600 students seems to be a very popular recommendation, but close scrutiny of these readings reveals little empirical report for these recommendations.

II-9
The Current Environment
Today schools are under more pressure to improve against a backdrop of funding. Improvement is expected regardless of whether funding keeps up with inflation. This places the future of school districts in question.
First, most of the school improvement literature points to the importance of schools, their expectations, and how they use their resources, as critical elements — almost nothing has emerged in research that focuses on school district level leadership or management that is associated with helping pupils perform at higher levels; states are already organizing pupil performance information by school site.
Second, much of the discussion about how to improve school funding suggests that whatever authority school districts currently have over the amount of resources available to them is likely to diminish as states take more control over gross taxing and spending decisions. There is talk in some quarters of states distributing most, if not all, state aid directly to schools, bypassing districts.
Third, while school districts may be given more control over how they spend their resources, some state policymakers are placing spending decisions in the hands of schools, principals and teachers. In this scenario, school board spending would be relegated to administration, plant maintenance and operation, or ancillary services including personnel, accounting, and food services. School districts might even be forced to compete with other districts to provide such services. Moreover, the expansion of smaller educational units (charter schools, schools-within-schools, minischools, and others), and possible school vouchers (even if only in urban districts) may further reduce school district authority.
School districts are unlikely to disappear. However, as this overview of school boards suggests, the role and function of school districts will change. They may look more like current multi-district cooperative service boards in the future, providing technical assistance, comparative information, and administrative services done more efficiently by a central agency.
II-10
Bibliography
Barker, R. and Gump, P. Big School, Small School: High School Size and Student Behavior (1964). Beard, C. and Beard, M. Basic History of the United States (1944). Bureau of the Census. Statistical Abstract of the United States, (1993). Carnoy, M. and MacDonnell, J. School District Restructuring in Santa Fe, New Mexico (1990). Carnegie Foundation. Turning Points: Preparing American Youth for the 21st Century (1989). Chambers, J.G. “An Analysis of School Size Under a Voucher System.” Educational Evaluation and Policy Analysis. (1981). Coleman, P. and LaRocque, L. “Economies of Scale Revisited: School District Operating Costs in British Columbia, 1979-82.” Journal of Education Finance (Summer 1984), pp. 22-35. Colorado Department of Education. “A Report on Colorado School District Organization.” (1995). Conant, J.B. (1959). The American High School Today. New York: McGraw-Hill. Cotton, K. “Affective and Social Benefits of Small-Scale Schooling.” ERIC Digest (December 1996). Cremin, L. American Education, The Colonial Experience, 1607-1783 (1970). Education Commission of the States [1]. “The Invisible Hand of Ideology: Perspectives from the History of School Governance” (January 1999). Education Commission of the States [2]. “State Constitutions and Public Education Governance” (June 1999). Education Commission of the States [3]. “Governing America’s Schools: Changing the Rules: Report of the National Commission on Governing America’s Schools.” (November 1999). Friedkin, N. and Neocochea, J. “School System Size and Performance: A Contingency Perspective.” Educational Evaluation and Policy Analysis (Vol. 10, 1988).

II-11
Goodlad, J. I. A Place Called School (1984). Hughes, M.F. and Bass, G. R. “Multi-phased Study of an Economy of Scale Weight Factor for Low Enrollment School Districts in the State of Kansas.” (1994). Kansas Biennial Report (1964). Katz, M. B. Class, Bureaucracy & Schools (1971). Klonsky, M. (1998). Small Schools: The Numbers Tell a Story. Third Ed. Chicago: University of Illinois at Chicago. Klonsky, M. (1995). Small Schools: The Numbers Tell a Story. University of Illinois. Lee,V.E. & Smith, J.B. “High School Size: Which Works Best and for Whom?” Educational Evaluation and Policy Analysis (Vol. 19 1997). Management Analysis and Planning Associates. “Nevada School District Organization and Control: Meeting the Challenges of Growth and Diversity.” (1996). Monk, D. H. “Modern Conceptions of Educational Quality and State Policy Regarding Small Schooling Units.” Center for School Change: Source Book on School and District Size, Cost and Quality (1992), pp. 35-49. Monk, D. H. and Kadamus, James A. “The Reform of School District Organizational Structure.” Advances in Educational Productivity (Volume 5, 1995), pp. 27-44. Nachtigal P. “Remapping the Terrain: School Size, Cost, and Quality.” Center for School Change: Source Book on School and District Size, Cost, and Quality (1992), pp. 53 -71. Raywid, M. and Oshiyama, L. “Musing in the Wake of Columbine: What Can Schools Do?” Phi Delta Kappan (Vol. 81, 6, 2000). Raywid, M. “The Current Literature on Small Schools.” ERIC Digest (1997). Raywid, M. “Taking Stock: The Movement to Create Mini-Schools, Schools-Within-Schools, and Separate Small Schools.” ERIC Clearinghouse on Urban Education. (1996). Raywid, M. “The Subschools/Small Schools Movement—Taking Stock.” Paper commissioned by the Center on Organization and Restructuring of Schools. (1995). Rogers, B. “Small is Beautiful” Center for School Change: Source Book on School and District Size, Cost, and Quality (1992), pp. 97-116.

II-12
Sher, J. P. [1] Heavy Meddle: A Critique of the North Carolina Department of Public Instructions Plan to Mandate School District Mergers Throughout the State (1986). Sher, J. P. [2] Class Dismissed: Examining Nebraska’s Rural Education Debate. (1988). Swenson, A.D. and King, R.A. School Finance: It’s Economics and Politics (1997). Walberg, H. J. “On Local Control: Is Bigger Better?” School and District Size, Cost, and Quality (1993).

III-1
Chapter III
ALTERNATIVE PROCEDURES FOR IDENTIFYING DISTRICTS THAT MIGHT BENEFIT FROM REORGANIZATION
Introduction Based on our view of the state’s role in establishing school districts, and our review of the literature about school district organization, we feel that the most appropriate rationale for state action must be based on three factors: (1) the level of pupil performance, in which the state is explicitly interested, because it is the foundation of democratic government and the state’s economic development; (2) the level of per pupil spending, in which the state has an interest because it provides state aid that accounts for a significant portion of those expenditures; and (3) the ability of school districts to provide an appropriate curriculum and ancillary activities, in which the state has an interest primarily because of the nexus with pupil performance. We developed two primary approaches to identify school districts in Kansas that should be reorganized. The first approach is based specifically on analysis of both pupil performance and per pupil spending and is designed to identify districts that are relatively low in performance and relatively high in spending. The second approach is based on the relationship between the size of schools and districts and the ability of districts to provide services when they are either too small or too large. Identifying Target Districts Based on Pupil Performance and Per Pupil Spending The first approach is designed to focus attention on a set of “target” districts in which performance is relatively low and spending is relatively high. In order to examine relative performance, we use the results of the statewide tests that have been developed in the past few years even though several people told us that their understanding was that those tests were not developed for the specific purpose of comparing one district to another. Our feeling is that, since the tests provide the only basis of evaluating the relative performance of school districts, the information is already being used to hold districts accountable (given that results are published), and because our purpose is to focus only on some districts, it is appropriate to use them as the basis for identifying those places where state action is required. While there are many other kinds of information that individual districts use to evaluate their own performance, none provide comparable information for all districts. We used per pupil spending for instruction, administration, and plant maintenance and operation (M&O) as the basis of evaluating relative spending levels even though some people suggested that since the state controlled their level of spending, and no district exceeds the level specified by the state, it is logically impossible to identify high spending districts. Our feeling is that, given the variation in spending that exists, some districts may be spending more than they need to relative to the spending of other districts and/or the

III-2
state’s formula for distributing state aid may permit higher spending than is necessary. Pupil Performance We were able to obtain average pupil performance data for 1997 and 1998 for all 304 school districts in Kansas -- data were for the composite reading index, the math power composite, and the writing composite. We combined the average scores for each district into a single score by transforming district average raw scores for each test into “standard” scores (sometimes called “z-scores”), which indicate how many standard deviations the district average raw score is from the statewide average score for a particular test. The use of standard scores allowed us to add the scores of the three tests together despite the fact that the raw scores use different scales for measurement (the assumption in adding the standard scores together is that each test is valued equally). These scores generally range from -4.0 to +4.0; a district with the statewide average score on all three tests would have a standard score of 0.0; if a district had an unusually high or low average score for all three tests, the combined standard score could be lower than -4.0 or higher than +4.0. We found some variation across all school districts in raw scores and standard scores, which are shown in Table III-1 (where they are district weighted) and Table III-2 (where they are pupil weighted). We show figures weighted in two different ways, by district or by pupils, because it can make a difference and because there are reasonable justifications for looking at the data using either approach to weighting. We tend to favor the pupil-weighted approach, meaning each pupil is weighted equally. Looking at Table III-2, where scores have been weighted by enrollment, it is clear that there was not much variation across districts in composite scores: two thirds of all pupils were enrolled in districts where reading scores varied from 59.8 to 68.6, where math scores varied from 45.1 to 56.3, and where writing scores varied from 3.22 to 3.60. To better understand the relationship between pupil performance and district characteristics, we created five groups of districts, called quintiles, based on pupil performance, which are shown in Table III-3 (where quintiles have similar numbers of districts) and Table III-4 (where quintiles have similar numbers of pupils). Looking at quintiles with similar numbers of pupils (Table III-4), there were 27 districts, enrolling 87,113 pupils, in the lowest performance quintile (where the combined standard [”z”] scores were less than -2.50) while there were 43 districts, enrolling 89,133 pupils, in the highest performing quintile (where the combined standard [”z”] scores were greater than +2.58). The average performance of each quintile is shown in row (8), rising from -3.716 in the lowest performing quintile to +3.531 in the highest performing. In general, higher performance was associated with higher total spending [see row (1)] and with higher spending for instruction [see row (2)]. There was no obvious relationship between pupil performance and either spending for administration [see row (3), where spending varied across the quintiles but not in a systematic way] or spending for plant M&O [see row (4), where spending was about the same across the quintiles].

III-3
Quintiles that had higher combined standard scores had higher raw scores for all three composites [see rows (5), (6), and (7)] and higher standard (“z”) scores for all three composites [see rows (9), (10), and (11)]. While higher performing districts tended to have lower proportions of pupils from low-income families [see row (16)], there was no clear relationship between performance and district wealth (although the highest performing districts had greater wealth than the lowest performing districts). There was also no relationship between performance and local tax effort (which was highest in both the lowest and highest performing quintiles) or school district size (where the highest and lowest performing districts were larger than those with middle levels of performance). Size of attendance center also showed no strong correlation to performance (where the lowest and highest performing districts had slightly larger attendance centers than districts performing in the middle range). There are three major approaches that could be taken to identify districts that have low performance: (1) an approach based on absolute levels of performance, in which districts that are low performing do not meet a particular standard; (2) an approach based on the change in performance over time, in which districts that are low performing are those that do not improve their level of performance at a specified rate; and (3) an approach that compares actual performance to expected performance, in which low performing districts are those whose actual performance is lower than expected performance. We used the third approach because a large proportion of the variation in performance across school districts tends to be explained by the demographic characteristics of pupils, which can be controlled by comparing actual to predicted levels of performance. In order to implement the third approach, we developed a prediction model for performance (using the combined standard [“z”] scores for the three composite indicators) based on a statistical technique, linear regression, that is designed to identify those factors that predict performance and explain the variation in performance across all districts. The regression equation: (1) explained about 73 percent of the variation in performance across all school districts; (2) suggested that the strongest predictor of performance was the proportion of pupils from low-income families; (3) indicated that density, tax effort, wealth and the proportion of pupils from low-income families were negatively related to spending (that is, districts with higher density, higher tax effort, higher wealth and higher proportions of pupils from low-income families had lower performance); and (4) resulted in the following equation to predict performance: combined standard = -9.122 - (12.895 X percentage of pupils (“z”) performance on eligible for free/reduced lunch) - (.0289 X reading, math, and density) - (42.113 X tax effort [mills]) writing tests. - (.00000269 X assessed value per pupil) + (.985 X natural log of enrollment) + (.00204 X per pupil spending for instruction).

III-4
When this equation is used to predict the actual pupil performance of districts, there is a standard error across all districts of 1.367 per pupil. Because this error exists (and differs for each district), we created a range of pupil performance for each district within which we could be 90 percent confident that the predicted performance was correct. We then compared each district’s actual performance to the low end of this range and identified districts with actual performance below the low end as having unusually low performance. We found 36 districts that had unusually low performance, relative to what would have been expected, given their circumstances, in 1998-99. Per Pupil Spending We were able to obtain per pupil spending data for 1998-99 for all school districts in Kansas, which was disaggregated for several functions. We chose to examine: (1) instruction; (2) plant maintenance and operation (M&O); (3) administration (school and district combined); and (4) transportation. We chose to exclude transportation in our analysis since, in our view, spending for that purpose alone should not serve as the primary basis of changing school district boundaries. We found some variation across all school districts in their per pupil spending for the three spending functions, as shown in Tables III-1 and III-2. Using pupil-weighted data (Table III-2), in 1998-99 school districts in Kansas spent $3,162 per pupil, on average, for instruction, with two-thirds of all pupils enrolled in districts that spent between $2,713 and $3,611 for that purpose. On average, school districts spent $568 per pupil for administration and two-thirds of all pupils were enrolled in districts spending between $343 and $793 for administration. Finally, districts spent $646 per pupil, on average, for plant M&O — two thirds of all pupils attended schools in districts that spent between $486 and $806 per pupil. When the three functions are combined, districts spent an average of $4,376 per pupil, although the range in spending was from $3,504 to $10,928. In order to identify districts that spend at unusually high levels we had two choices: (1) we could simply inspect per pupil spending and identify high spending as being above a specified amount or (2) we could develop a predictive model designed to take into consideration those factors, such as district enrollment, that might legitimately explain spending differences. Since many studies of school district spending suggest that different school districts spend at different levels because they face cost pressures beyond their control, we used the second approach since it is designed to control for those factors. The factors that might influence spending level decisions include such things as: (1) district wealth as indicated by property value per pupil; (2) district tax effort; (3) district enrollment level; (4) the proportion of pupils from low-income families; and (5) the average size of each attendance center. The figures in Tables III-1 and III-2 indicate the statewide average values for these factors as well as statistics about their distribution across all districts. Looking at Table III-2, where figures are weighted for

III-5
pupil enrollment, the figures indicate that statewide average property value per pupil was $41,988, although the range was from $612 per pupil to $537,214. Average tax effort (imputed by dividing local revenue by property wealth) was 34.5 mills and two-thirds of all pupils were enrolled in districts in which tax effort was between 28.1 and 40.9 mills. Average district enrollment was 1,477 pupils (although enrollments ranged from 76 to 44,925 pupils) while the average size of attendance centers was 387 pupils (although the range was from 38 to 816 pupils). The proportion of pupils from low-income families (measured by the percentage of pupils eligible for free lunches) was 24.2 percent on average; two thirds of all pupils attended schools in districts with between 9.1 and 39.3 percent of all pupils coming from low-income families. In order to understand the relationships between spending, pupil performance, and these factors, we organized districts into five groups, or quintiles, with different levels of spending, as shown in Table III-5 (district weighted) and Table III-6 (pupil weighted). Focusing on spending quintiles (and looking at quintiles with similar numbers of pupils, as shown in Table III-6) there were nine districts, enrolling 91,399 pupils, in the lowest spending quintile (with those districts with spending below $3,757 per pupil) while there were 198 districts, enrolling 89,712 pupils, in the highest spending quintile (with districts spending more than $4,931 per pupil). The average spending of each quintile is shown in row (1), rising from $3,695 in the lowest spending quintile to $5,572 in the highest spending quintile. In general, higher total spending was associated with higher spending for the three spending components (instruction, administration, and plant M&O) -- but that was not always true. Despite an almost $300 per pupil difference in spending for instruction between the second to lowest spending quintile and the middle spending quintile, there was almost no difference in spending for administration between the two quintiles [see row (3)] and spending for plant M&O was actually lower in the higher spending quintile [see row (4)]. While higher spending districts tend to have higher test scores than lower spending districts, the relationship is not strong because the highest test scores were in the middle spending quintile. Higher spending districts also tend to have higher property wealth [see row (12)]; but tax effort was similar across all spending groups [except for the highest spending, wealthiest quintile — see row (13)]. Higher spending districts tended to be smaller than lower spending districts [see row (14)] but the average size of attendance centers was similar across all spending quintiles other than the highest group, where they were smaller [see row (15)]. Finally, spending tended to be higher in districts that had lower proportions of pupils from low-income families [see row (16)]. In order to develop a prediction model for spending (the sum of instruction, administration, and plant M&O), we used a statistical procedure, linear regression, to determine the mathematical relationship between spending and wealth, effort, enrollment level of districts and attendance centers, and proportion of pupils from low-income families. Since some of the factors had a curvilinear (curved) relationship with spending, rather than a linear (straight line) relationship, we used a logarithmic transformation (natural log) for several factors (enrollment level, proportion of pupils
III-6
from low-income families, and average size of attendance centers). We also eliminated the district [Fort Leavenworth (207)] with the lowest wealth ($612 per pupil) since it was so different from all other districts. The regression equation: (1) explained about 80 percent of the variation in spending across the 303 school districts; (2) suggested that the strongest predictor of spending was the average size of attendance centers; (3) indicated that enrollment level, the proportion of pupils from low income families, and the average size of attendance centers were negatively related to spending (that is, smaller school districts, small attendance centers, and low proportions of pupils from low-income families increased spending); and (4) resulted in the following equation to predict spending: per pupil spending for = $10,079 - (969.02 X natural log of size instruction, plant M&O, of attendance center) - (181.44 X natural and administration. log of enrollment) - (216.44 X natural log of proportion of pupils from low income families) + (27,813.33 X tax effort [mills]) + (.00404 X assessed value per pupil). When this equation is used to predict the actual spending level of districts, there is a standard error across all districts of $325 per pupil. Because this error exists (and differs for each district), we created a range of spending for each district within which we could be 95 percent confident that the predicted spending was correct. We then compared each district’s actual spending to the high end of this range and identified districts with actual spending in excess of the high end as having unusually high spending. We found 41 districts that had unusually high spending, relative to the spending level expected given their circumstances, in 1998-99. Selecting “Target” Districts We developed a variety of approaches for using the results of the regression analyses of both pupil performance and per pupil spending to identify target school districts that might be reorganized. First, we wanted to find districts that have low performance relative to what might be expected and that spend at a high level compared to what might be expected. As discussed above, 36 districts had lower than expected pupil performance while 41 districts had higher than expected per pupil spending. Of these 77 districts, 10 districts had both higher levels of spending and lower levels of performance than would have been expected given their circumstances (using the confidence intervals associated with the regressions). These ten districts, which we refer to as Type “A” districts, are: Moscow Public Schools (209), West Solomon Valley Schools (213), Elkhart (218), Washington Schools (222), Hanston (228), Nes Tre La Go (301), Belle Plaine (357), Chase-Raymond (401), Hillcrest Rural Schools (455), and Udall (463).
III-7
In addition, there are districts that have higher than expected levels of spending and performance that has been lower than average for two years. These eight districts, which we refer to as Type “B” districts, are: Fowler (225), Triplains (275), Elk Valley (283), Cedar Vale (285), Herndon (317), Eastern Heights (324), Wathena (406), and Chetopa (505). Finally, there are districts that had lower than expected performance in 1998, lower than average performance in 1997, and spending levels above the predicted level excluding the use of the confidence interval. These 10 districts, which we refer to as Type “C” districts, are: Turner-Kansas City (202), Bonner Springs (204), Mankato (278), Pleasanton (344), Oxford (358), Caldwell (360), Marysville (364), Madison-Virgil (386), Neodesha (461), and South Haven (509). The data shown in Table III-7 compares the spending, pupil performance, and other information that has been discussed in this section for the three groups of districts separately, for the 276 districts not included in any of the three groups, and for all 304 districts. Identifying Districts Based on Size of School A second way to think about school districts that might benefit from reorganization is based on schools being “too small” or “too large.” As has been discussed in the literature review, education researchers and practitioners have studied the optimum size of schools, the minimum size of schools, and the maximum size of schools based on the ability of schools to offer what is believed to be an appropriate curriculum, opportunities for extra-curricular activities, and a nurturing, safe environment — all at reasonable cost. While the literature provides no universally accepted guidance, it suggests that a high school should serve at least 100 pupils in order to meet academic and social expectations. It also suggests that the maximum size of high schools should be no greater than 900 pupils.1 While there are people who might disagree with these figures, and there are plenty of examples of both successful high schools with enrollments below 100 pupils or more than 900 pupils and of unsuccessful high schools with enrollments between 100 and 900 pupils, many people find these levels to be reasonable guidelines.
1In 1997-98, there were 89,500 public schools in the United States, the average enrollment of which was 525 pupils (the average size of elementary schools was 478 pupils while the average size of secondary schools was 699 pupils and the average size of combined elementary- secondary schools was 374 pupils). Of those schools, about 8,800 had an enrollment of less than 100 pupils and 15,100 had an enrollment greater than 800 pupils (with about 8,600 having more than 1,000 pupils) according to the National Center for Education Statistics of the U.S. Department of Education.
III-8
Selecting “Target” Districts What we wanted to do was to examine current enrollments in Kansas and, where we saw schools that were either too small or too large based on the enrollment criteria, to see whether it might be possible to reorganize districts so that schools would meet the criteria. Since our focus is on school district organization, we decided to identify districts that might be considered too small or too large. To do this, we assumed that, for any district to support a high school of at least 100 pupils, it must have an enrollment of at least 260 pupils per high school (so the enrollment of a district with two high schools should be at least 520 pupils). We also assumed that, in order for a district not to have a high school that exceeds 900 pupils, the district’s enrollment should be no greater than 2,925 pupils per high school (so the enrollment of a district with two high schools should not be greater than 5,850 pupils). In looking at enrollment figures and numbers of high schools in Kansas, we found 50 districts with enrollments less than 260 pupils (45 of which have a single high school and five of which have more than one high school). We also found 24 districts with enrollments too large to support the number of high schools they have (18 of which have one high school, two of which have two high schools, three of which have three high schools, one of which has four high schools, one of which has five high schools, and one of which has seven high schools). We also identified two districts where total enrollment is simply so high that, regardless of numbers of high schools, they might be viewed by some people as being too large to manage effectively.2
Districts that are too small relative to the number of schools they operate: The districts are listed below by category. Too small with only one high school: Cheylin (103), White Rock (104), Moscow
Public Schools (20-9), Northern Valley (212), West Solomon Valley Schools (213), Rolla (217), Ashland (220), North Central (221), Fowler (225), Hanston (228), West Smith County (238), Weskan (242), Palco (269), Triplains (275), Jewell (279), West Graham-Morland (280), Elk Valley (283), Cedar Vale (286), Grinnell Public Schools (291), Wheatland (292), Prairie Heights (295), Sylvan Grove (299), Nes Tre La Go (301), Smoky Hill (302), Bazine (304), Brewster (314), Golden Plains (316), Herndon (317), Eastern Heights (324), Logan (326), Burrton (369), Montezuma (371), Hamilton (390), Paradise (399), Chase-Raymond (401), Mullinville (424), Midway Schools (433), Hillcrest Public Schools (455), Healy Public Schools (468), Dexter (471), Haviland (474), Copeland (476), Pawnee Heights (496), Lewis (502), and Attica (511). Too small with more than one high school: Barnes (223), Leroy-Gridley (245), Southern Cloud (334), Rural Vista (481), and Axtell (488).
2In 1997-98, there were 14,805 school districts in the United States, of which 230 districts enrolled 25,000 or more pupils (those districts represented 1.6 percent of all districts and they enrolled 31.5 percent of all pupils)

III-9
Districts that are too large: Too large relative to the number of high schools: Turner-Kansas City (202), Blue Valley (229), Olathe (233), Emporia (253), Derby (260), Haysville (261), Goddard (265), Maize (266), Salina (305), Hutchinson (308), Seaman (345), Newton (373), Manhattan (383), Great Bend (428), Auburn Washburn (437), Dodge City (443), Leavenworth (453), Garden City (457), Geary County Schools (475), Liberal (480), Hays (489), Lawrence (497), and Kansas City (500). Too large: Wichita (259) and Shawnee Mission (512).

TABLE III-1
DISTRICT-WEIGHTED KANSAS STATEWIDESTATISTICS FOR VARIABLES RELATED TO PER PUPIL
SPENDING AND PUPIL PERFORMANCE IN 1998-99
Statistics Coeff. of
Average Minimum Maximum Variation Variable
Per Pupil Spending
(1) Total Spending (Instr.,Admin., and Plant M&O) $5,367 $3,504 $10,928 .214
(2) Instruction $3,714 $2,503 $7,301 .191
(3) Administration $860 $224 $2,529 .377
(4) Plant M&O $793 $391 $2,184 .295
Test Scores - Raw
(5) Reading 65.2 52.5 76.3 .059
(6) Math 50.5 38.5 63.3 .095
(7) Writing 3.45 2.70 4.08 .063
Test Scores - Standard (“z”)
(8) Total “z” .398 - .759 6.670 1.098
(9) Reading “z” .236 - 2.697 2.784 3.787
(10) Math “z” - .037 - 2.168 2.228 22.550
(11) Writing “z” .200 - 3.697 3.495 5.660

TABLE III-1 (Continued)
Statistics Coeff. of
Average Minimum Maximum Variation Variable
Other Variables
(12) 1998 Assessed ValuePer Pupil $48,284 $612 $537,214 1.179
(13) Imputed LocalOperating Tax Effort 31.4m 21.0m 55.2m .214
(14) District Enrollment 1,477 76 44,925 2.536
(15) Attendance CenterEnrollment 230 38 816 .576
(16) Percent of PupilsEligible for Free Lunch 22.8% 1.0% 59.0% .426

TABLE III-2
PUPIL-WEIGHTED KANSAS STATEWIDE STATISTICS FOR VARIABLES RELATED TO PER PUPIL SPENDING
AND PUPIL PERFORMANCE IN 1998-99
Statistics Coeff. of
Average Minimum Maximum Variation Variable
Per Pupil Spending
(1) Total Spending (Instr.,Admin., and Plant M&O) $4,376 $3,504 $10,928 .168
(2) Instruction $3,162 $2,503 $7,301 .142
(3) Administration $568 $224 $2,529 .397
(4) Plant M&O $646 $391 $2,184 .247
Test Scores - Raw
(5) Reading 64.2 52.5 76.3 .068
(6) Math 50.7 38.5 63.3 .111
(7) Writing 3.41 2.70 4.08 .056
Test Scores - Standard (“z”)
(8) Total “z” .000 .- 7.590 6.670 n/a
(9) Reading “z” .000 - 2.697 2.784 n/a
(10) Math “z” .000 - 2.168 2.228 n/a
(11) Writing “z” .000 - 3.697 3.495 n/a

TABLE III-2 (Continued)
Statistics Coeff. of
Average Minimum Maximum Variation Variable
Other Variables
(12) 1998 Assessed ValuePer Pupil $41,988 $612 $537,214 .914
(13) Imputed LocalOperating Tax Effort 34.5m 21.0m 55.2m .185
(14) District Enrollment 1,477 76 44,925 2.536
(15) Attendance CenterEnrollment 387 38 816 .366
(16) Percent of PupilsEligible for Free Lunch 24.2% 1.0% 59.0% .626

TABLE III-3
DISTRICT-WEIGHTED AVERAGES FOR VARIABLES RELATEDTO PER PUPIL SPENDING AND PUPIL PERFORMANCE IN
1998-99 BY QUINTILE OF PER PUPIL PERFORMANCE*FOR SCHOOL DISTRICTS IN KANSAS
Quintile of Performance Less - 1.40 - .07 .99 More than to to to than
- 1.40 - .08 .98 2.22 2.22
Number of Districts 61 61 61 61 60
Number of Pupils 143,826 54,550 87,229 62,162 101,159
Variable
Per Pupil Spending
(1) Total Spending (Instr.,Admin., and Plant M&O) $5,342 $5,307 $5,265 $5,381 $5,542
(2) Instruction $3,702 $3,652 $3,646 $3,717 $3,855
(3) Administration $852 $855 $833 $863 $897
(4) Plant M&O $788 $800 $785 $800 $791
Test Scores - Raw
(5) Reading 60.5 63.9 65.5 67.3 69.0
(6) Math 45.3 48.7 50.5 52.4 55.8
(7) Writing 3.25 3.35 3.45 3.52 3.68

TABLE III-3 (Continued)
Quintile of Performance Less - 1.40 - .07 .99 More than to to to than
- 1.40 - .08 .98 2.22 2.22 Variable
Test Scores - Standard (“z”)
(8) Total “z” - 2.659 - .733 .445 1.561 3.425
(9) Reading “z” - .848 - .064 .291 .701 1.113
(10) Math “z” - .969 - .355 - .037 .289 .898
(11) Writing “z” - .842 - .315 .190 .570 1.414
Other Variables
(12) 1998 Assessed ValuePer Pupil $55,187 $42,222 $42,351 $49,229 $52,501
(13) Imputed LocalOperating Tax Effort 31.5m 30.3m 30.9m 32.5m 31.6m
(14) District Enrollment 2,358 894 1,430 1,019 1,686
(15) Attendance CenterEnrollment 236 222 235 243 213
(16) Percent of PupilsEligible for Free Lunch 29.5% 23.2% 23.3% 19.9% 18.0%
* Per pupil performance is measured by the combinedz-scores for the three tests.

TABLE III-4
PUPIL-WEIGHTED AVERAGES FOR VARIABLES RELATEDTO PER PUPIL SPENDING AND PUPIL PERFORMANCE IN
1998-99 BY QUINTILE OF PER PUPIL PERFORMANCE*FOR SCHOOL DISTRICTS IN KANSAS
Quintile of Performance Less - 2.50 - .42 .71 More than to to to than
- 2.50 - .43 .70 2.58 2.58
Number of Districts 27 78 64 92 43
Number of Pupils 87,113 91,947 88,133 92,528 89,133
Variable
Per Pupil Spending
(1) Total Spending (Instr.,Admin., and Plant M&O) $4,024 $4,355 $4,320 $4,640 $4,524
(2) Instruction $2,935 $3,098 $3,113 $3,297 $3,359
(3) Administration $475 $615 $566 $663 $515
(4) Plant M&O $615 $643 $641 $679 $650
Test Scores - Raw
(5) Reading 58.1 62.0 65.1 66.9 68.7
(6) Math 43.7 47.6 51.0 52.9 58.3
(7) Writing 3.20 3.30 3.41 3.50 3.63

TABLE III-4 (Continued)
Quintile of Performance Less - 2.50 - .42 .71 More than to to to than
- 2.50 - .43 .70 2.58 2.58 Variable
Test Scores - Standard (“z”)
(8) Total “z” - 3.716 - 1.605 .228 1.472 3.531
(9) Reading “z” - 1.398 - .508 .205 .618 1.045
(10) Math “z” - 1.250 - .548 .045 .387 1.340
(11) Writing “z” - 1.068 - .549 - .022 .467 1.146
Other Variables
(12) 1998 Assessed ValuePer Pupil $37,305 $38,239 $35,278 $42,495 $56,527
(13) Imputed LocalOperating Tax Effort 37.9m 32.3m 32.2m 33.0m 37.2m
(14) District Enrollment 3,226 1,179 1,377 1,006 2,073
(15) Attendance CenterEnrollment 416 340 357 357 469
(16) Percent of PupilsEligible for Free Lunch 43.5% 28.9% 24.4% 16.9% 8.0%
* Per pupil performance is measured by the combinedz-scores for the three tests.

TABLE III-5
DISTRICT-WEIGHTED AVERAGES FOR VARIABLES RELATEDTO PER PUPIL SPENDING AND PUPIL PERFORMANCE IN
1998-99 BY QUINTILE OF PER PUPIL SPENDING FORINSTRUCTION, ADMINISTRATION, AND PLANT M&O
FOR SCHOOL DISTRICTS IN KANSAS
Quintile of Spending Less $4,390 $5,059 $5,432 More than to to to than
$4,390 $5,058 $5,431 $5,979 $5,979
Number of Districts 61 61 61 61 60
Number of Pupils 292,961 80,260 34,812 27,673 13,220
Variable
Per Pupil Spending
(1) Total Spending (Instr.,Admin., and Plant M&O) $4,024 $4,754 $5,242 $5,698 $7,147
(2) Instruction $2,919 $3,364 $3,631 $3,881 $4,793
(3) Administration $522 $689 $848 $932 $1,316
(4) Plant M&O $584 $701 $762 $884 $1,037
Test Scores - Raw
(5) Reading 64.6 64.7 65.1 66.0 65.9
(6) Math 50.6 50.8 50.3 50.9 49.9
(7) Writing 3.42 3.43 3.46 3.45 3.48

TABLE III-5 (Continued)
Quintile of Spending Less $4,390 $5,059 $5,432 More than to to to than
$4,390 $5,058 $5,431 $5,979 $5,979 Variable
Test Scores - Standard (“z”)
(8) Total “z” .107 .236 .407 .655 .586
(9) Reading “z” .079 .111 .203 .408 .380
(10) Math “z” - .018 .016 - .071 .039 - .156
(11) Writing “z” .046 .109 .276 .208 .362
Other Variables
(12) 1998 Assessed ValuePer Pupil $30,367 $42,096 $34,266 $64,013 $71,053
(13) Imputed LocalOperating Tax Effort 32.3m 30.8m 28.7m 30.6m 34.5m
(14) District Enrollment 4,803 1,316 571 454 220
(15) Attendance CenterEnrollment 409 277 206 164 92
(16) Percent of PupilsEligible for Free Lunch 22.2% 19.5% 22.7% 22.0% 27.6%

TABLE III-6
PUPIL-WEIGHTED AVERAGES FOR VARIABLES RELATEDTO PER PUPIL SPENDING AND PUPIL PERFORMANCE IN
1998-99 BY QUINTILE OF PER PUPIL SPENDING FORINSTRUCTION, ADMINISTRATION, AND PLANT M&O
FOR SCHOOL DISTRICTS IN KANSAS
Quintile of Spending Less $3,758 $4,034 $4,264 More than to to to than
$3,757 $4,033 $4,263 $4,931 $4,931
Number of Districts 9 22 19 56 198
Number of Pupils 91,399 89,804 91,490 86,712 89,712
Variable
Per Pupil Spending
(1) Total Spending (Instr.,Admin., and Plant M&O) $3,695 $3,897 $4,177 $4,565 $5,572
(2) Instruction $2,776 $2,817 $3,120 $3,291 $3,822
(3) Administration $407 $456 $459 $608 $918
(4) Plant M&O $512 $625 $598 $666 $833
Test Scores - Raw
(5) Reading 61.4 62.2 66.4 65.6 65.5
(6) Math 48.0 47.7 54.5 52.7 50.7
(7) Writing 3.29 3.34 3.49 3.46 3.48

TABLE III-6 (Continued)
Quintile of Spending Less $4,390 $5,059 $5,432 More than to to to than
$4,390 $5,058 $5,431 $5,979 $5,979 Variable
Test Scores - Normed (“z”)
(8) Total “z” - 1.787 - 1.362 1.604 .938 .642
(9) Reading “z” - .659 - .453 .508 .322 .295
(10) Math “z” - .488 - .528 .668 .356 .001
(11) Writing “z” - .641 - .381 .428 .260 .346
Other Variables
(12) 1998 Assessed ValuePer Pupil $34,669 $30,370 $45,883 $45,270 $53,954
(13) Imputed LocalOperating Tax Effort 35.0m 35.3m 35.7m 34.8m 31.5m
(14) District Enrollment 10,155 4,082 4,815 1,548 453
(15) Attendance CenterEnrollment 449 425 473 390 197
(16) Percent of PupilsEligible for Free Lunch 37.5% 29.6% 16.2% 15.4% 22.0%

TABLE III-7
PUPIL-WEIGHTED AVERAGES FOR VARIABLES RELATED TOPER PUPIL SPENDING AND PUPIL PERFORMANCE IN 1998-99
FOR THREE GROUPS OF KANSAS SCHOOL DISTRICTSIDENTIFIED AS LOW PERFORMING AND HIGH SPENDING
Group of School Districts All All
Kansas Type Type Type Other Districts A* B** C*** Districts
Number of Districts 304 10 8 10 276
Number of Pupils 448,926 2,919 1,654 9,545 434,808
Variable
Per Pupil Spending
(1) Total Spending (Instr.,Admin., and Plant M&O) $4,376 $6,508 $6,723 $4,941 $4,340
(2) Instruction $3,162 $4,513 $4,518 $3,429 $3,142
(3) Administration $568 $1,090 $1,294 $760 $558
(4) Plant M&O $646 $905 $910 $752 $641
Test Scores - Raw
(5) Reading 64.2 61.8 64.5 58.6 64.4
(6) Math 50.7 46.7 45.4 45.3 50.9
(7) Writing 3.41 3.18 3.34 3.17 3.42

TABLE III-7 (Continued)
Group of School Districts All All
Kansas Type Type Type Other Districts A* B** C*** Districts
Variable
Test Scores - Standard (“z”)
(8) Total “z” .000 - 2.426 - 1.237 - 3.510 .098
(9) Reading “z” .000 - .545 .061 - 1.297 .032
(10) Math “z” .000 - .709 - .937 - .957 .029
(11) Writing “z” .000 - 1.173 - .361 - 1.255 .037
Other Variables
(12) 1998 Assessed ValuePer Pupil $41,988 $75,280 $37,946 $27,983 $42,087
(13) Imputed LocalOperating Tax Effort 34.5m 31.5m 31.0m 39.0m 34.4m
(14) District Enrollment 1,477 292 207 955 1,575
(15) Attendance CenterEnrollment 387 176 124 348 391
(16) Percent of PupilsEligible for Free Lunch 24.2% 24.3% 40.3% 24.9% 24.1%
* Type “A” districts had both higher levels of spending and lower levels of performance than would havebeen expected given their circumstances.
** Type “B” districts had higher than expected levels of spending and performance that has been lowerthan average for two years.
*** Type “C” districts had lower than expected performance in 1998 and lower than average performancein 1997 and have spending levels above the predicted level excluding the use of the confidenceinterval.

IV-1
Chapter IV
INTERVIEW PROCEDURES
The State of Kansas requested that we conduct interviews and collect
information from at least sixty (60) school districts, thereby gathering information from a broad cross-section of the state concerning reorganization and efficiency. We received survey information from 90 districts. Using a variety of procedures (including review of the survey information), we identified sixty-four (64) districts and conducted meetings, interviews, observations and analysis with these districts. The On-Site Visit and Interview Process
Selecting Districts for Analysis
Our review of the literature prompted us to identify districts that had low levels of student performance and high levels of per pupil spending, districts that could most benefit from reorganization and efficiency. Specifically, we selected districts that had a lower pupil performance and higher per pupil spending than would have been expected, given the district’s characteristics. The previous chapter provided detail for the selection of the “target” districts in Map 1. In sum, 28 districts had lower performance and higher levels of spending than we expected. These districts became our primary focus for the interview planning, inquiry and collecting data.
In addition to the twenty-eight “target” districts, we identified 44 other districts that had one or more of the following characteristics: (1) below average performance in 1997 and 1998 and higher than average spending; (2) convoluted or odd boundaries; (3) dramatic enrollment changes (a decline of 20% in 5 or 10 years); (4) all buildings 50 years old, and (5) fewer than 150 pupils in the entire district and declining enrollment.
Of these 72 districts (28+44), we isolated 15 districts that would most benefit from an on-site visit, in which interviews and observations would be made to supplement and explain the district’s unique circumstances, conditions and problems. Of these 15 districts, ten (10) were type “A” districts that had lower performance and higher spending than expected; four (4) were considered type “B” and “C” districts (of the 18 districts); and one (1) district that met at least five other criteria.
In addition, we sent surveys to 90 districts to supplement the information on enrollment, conditions of school facilities, course offerings, distance learning, and sharing with other districts. These 90 districts include the 72 that met the criteria described above, plus 18 neighboring districts.

IV-2
KASB School Board Meetings
We met with 43 districts in conjunction with the Kansas Association of School
Boards (KASB) meetings:
• 14 of the Type “B” or “C” districts that did not have site visits. • 11 districts that met multiple criteria.
• 17 “good neighbor” districts (i.e., a neighboring district of one of the 15
being visited, with relatively high performance and low spending). • One neighbor district of a district with a convoluted boundary.
The Research Teams
Three experienced teams of two researchers met with schools at the KASB
school board meetings and at district sites. The meetings took place April 2- May 11, 2000.
Team One included John Myers, partner of Augenblick & Myers (A&M), and Dr. Michael G. Lacy, A&M associate and professor at Regis University. Team Two included: Dr. John Augenblick, and Justin Silverstein, partner and associate of A&M, respectively. And Team Three included: Dr. Chris Pipho, former of Senior Fellow at the Education Commission of the States (ECS) and Terry Whitney, former senior policy specialist for National Conference of State Legislatures (NCSL).
While at the meeting, a brief presentation was made describing the procedures, scope and timetable of the study. Questions were solicited at each school board meeting. Before and after the meetings, we met with superintendents, school board members, and community members. We asked the district officials a variety of questions pertaining to (a) per pupil performance and spending, (b) the role the school plays in the community, (c) the future of the district, and (d) views about developing relationships with neighboring districts.
On-Site Visits
The site visits we conducted gave district administrators, teachers, school board and community members a chance to (1) affirm or explain their (low) performance and (high) spending levels; (2) reaffirm their building capacity needs; (3) forecast future enrollments, and (4) discuss obstacles for student learning in their district.
We met with the district officials for approximately two hours. The interviews were designed to provide 30 minutes with the superintendent; 20 minutes with a

IV-3
teacher; 40 minutes with a school board member and a leader or member of the community; and then, 30 minutes with a principal or superintendent again. Some school districts requested changed schedules, added interviews, or changed the interview formats.
School Districts Selected
Western Kansas
The primary focus of Team One was western Kansas. They met the district superintendents, and school board members at the school board meeting in Weskan, Cimarron, and Stafford. Specifically, Team One met with Atwood (318), Chase (401), Hanston (228), Hill City (281), Hoxie (412), Hugoton (210), Jetmore (227), Oakley (274), Prairie Heights (295), and Rolla (217) all of which were “good neighbors” of districts that had lower than predicted pupil performance and higher spending. Team One conducted two site interviews with superintendents, school board members, community members, and teachers in Moscow (209) and Elkhart (218).
Central Kansas
Team Two focused on central Kansas. They attended two school board meetings in Cuba, Wellington and Goessel. After the meetings, the research team met with Burrton (369), Conway Springs (356), Lyons (405), Oxford (358), South Haven (509), Winfield (465), Wellington (353), Mankato (278), Phillipsburg (325), Clifton-Clyde (224), Pike Valley (426), Republic County (427), Southern Cloud (334), Washington (222). Team Two had site meetings at Belle Plaine (357), Caldwell (360), Eastern Heights (324), Hillcrest (455), Lenora (213), Morland (280), and Udall (463).
Eastern Kansas
Team Three went to the school board meetings in Fort Scott, Blue Rapids, Tecumseh, and Lansing. They met with Barnes (223), Bonner Springs (204), Cedar Vale (285), Lyons (406), Madison-Virgil (386), Marysville (364), Neodesha (461), North Central (221), and Pleasanton (344), and Turner-Kansas City (202).
Phone Interviews
Some school districts did not meet with us at the school board meeting, primarily because they were undergoing changes, such as a new superintendent, administrators, or others. For these districts, we conducted five telephone interviews with the superintendents. These interviews lasted about 90 minutes. The five districts were Argonia (359), Chetopa (505), Elk Valley (283), Fowler (225), and Sterling (376).

IV-4
Large School Districts
In addition to per pupil performance and spending, we met with six (6) districts because of their “large” pupil population size (based on average high school enrollments above 900 pupils), to see if they could benefit from reorganization, and to hear their concerns. They were: Auburn Washburn (437), Kansas City (500), Olathe (233), Shawnee Mission (512), Topeka (501), and Wichita (259).
Conclusion
In sum, we interviewed 64 school districts, received survey information from 90 school districts in Kansas, and received school building capacity information from all school districts. This work provided the evidentiary material for descriptions, explanations and attitudes towards reorganization and consolidation, of substantial resistance and a call for state help found in the next section. What We Heard
A Summary Of The Interviews
The interviews with administrators, school board members, community leaders, and teachers suggest that (a) they have substantial resistance to the idea of reorganizing or consolidating school districts; (b) they support state involvement to reorganize districts in extreme cases (where there are declining enrollments and high spending); (c) they justified or defended low student performance and high expenditures; and (d) they viewed the use of technology for student learning and building projects as a way of surviving consolidation; and (e) they were ambivalent about mandates by the state.
Resistance to Consolidation
Many older and established community leaders and school board members resisted the idea of reorganizing school districts, primarily because they viewed consolidation as a threat to their community. They commonly cited the statewide consolidation in the 1960s, which created unified K-12 districts and reduced the total number of school districts in Kansas. The consolidation resulted in feelings of resentment, loss of autonomy and control, as well as disenfranchisement from the rank and file, they argued. Notably, these accounts did not reference the changing structural conditions in Kansas (e.g., economy, declining populations, desire for efficiency). Instead, the consolidation was blamed for the destruction of communities and difficult economic conditions. The school closures have had long-term effects they argued, because it is virtually impossible to attract new businesses and industries to communities that do not have a school. In some counties, the school district is the
IV-5
major employer. In addition, community leaders and school board members consider the (high) school to be the hub of community and extracurricular activities (especially sports), thereby reinforcing a sense of community.
The resistance to consolidation also stems from longstanding and intense feelings toward neighboring districts, counties, and townships. The source of these rivalries is historic, said one superintendent, based on competition over being awarded the county seat over 100 years ago. Some argued that the differences were cultural and socioeconomic, reflecting how each of the communities developed its business activities and interests (e.g., farming, mining, oil and gas producing, and bedroom communities). These interests affected the expectations for student learning and advancement for higher degrees, explained one superintendent. Those communities that were near colleges had higher expectations for student learning. Differences were also expressed in terms of ethnic and regional differences, dramatized with lurid stories of crime and drugs in neighboring towns and cities.
Some district administrators resisted reorganization on financial grounds. They complained that combining school districts would result in less revenue and per pupil spending locally, and more money being sent to Topeka. This was a recurrent concern expressed by oil and gas-rich districts in southwestern Kansas, wanting the authority to act independently.
A Call for State Help
Some districts distinguished by low and declining enrollments (some fewer than 50 students) thought that they could benefit from state reorganization and support. Many of these districts had large geographic areas. For the most part, these school administrators were concerned about economic efficiency and lowering cost, however they resisted the idea that their declining enrollments affected the quality of education, curricula and student learning. However, one story told by a superintendent unearthed a serious problem. The superintendent reported that one of their most experienced and popular high school math teachers, who taught four grade levels, moved away. Her replacement was not a good teacher. The district enticed the established teacher to return (because of her status in the community). However, during her absence, the students suffered. This stark and succinct example shows that in small districts, one good or bad teacher can affect many students, over many grade levels for one or many years.
Rather than closing or consolidating schools, struggling districts proposed that they become “special needs” or “education centers” (e.g., teaching special education, bilingual education, adult education). School board members and community leaders said that they would consider consolidation if the state would “bring neighboring districts here.” In other words, the compromises and sacrifices should be made elsewhere.

IV-6
Explanations for Low Student Performance
As suggested earlier, one of the criteria that we used to select the schools for the interviews was student performance. The district officials attempted to justify their low performance scores or to defend them by using other criteria.
Justifications for Low Performance
Some school district administrators justified their lower than predicted performance by complaining about the tests:
• The scope of the tests and indexes were unrepresentative (“scores in the past would have been much higher”).
• The tests were unreliable and unrepresentative (particularly the
writing tests).
• The scores were attributed to a statistical aberration, caused by one or two students.
• Each class is different and the test did not include the “good”
classes. School administrators accounted for their low student performance by blaming certain groups:
• A bad cohort of students who score poorly on the tests.
• The changing ethnic and socioeconomic demographics (the school serves a high number of ESL students, Hispanics, and “outsiders”).
Neighboring superintendents and school board members argued that low performing schools were a product of:
• Poor leadership by superintendents and administrators. • Inexperienced teachers (particularly in remote and rural areas of
the state).
• Low expectations for student performance, and too much emphasis on extracurricular activities.
Defending Low Student Performance
Although most did not provide hard evidence, school administrators argued that
the state assessments were not valid or credible because one student could easily bring
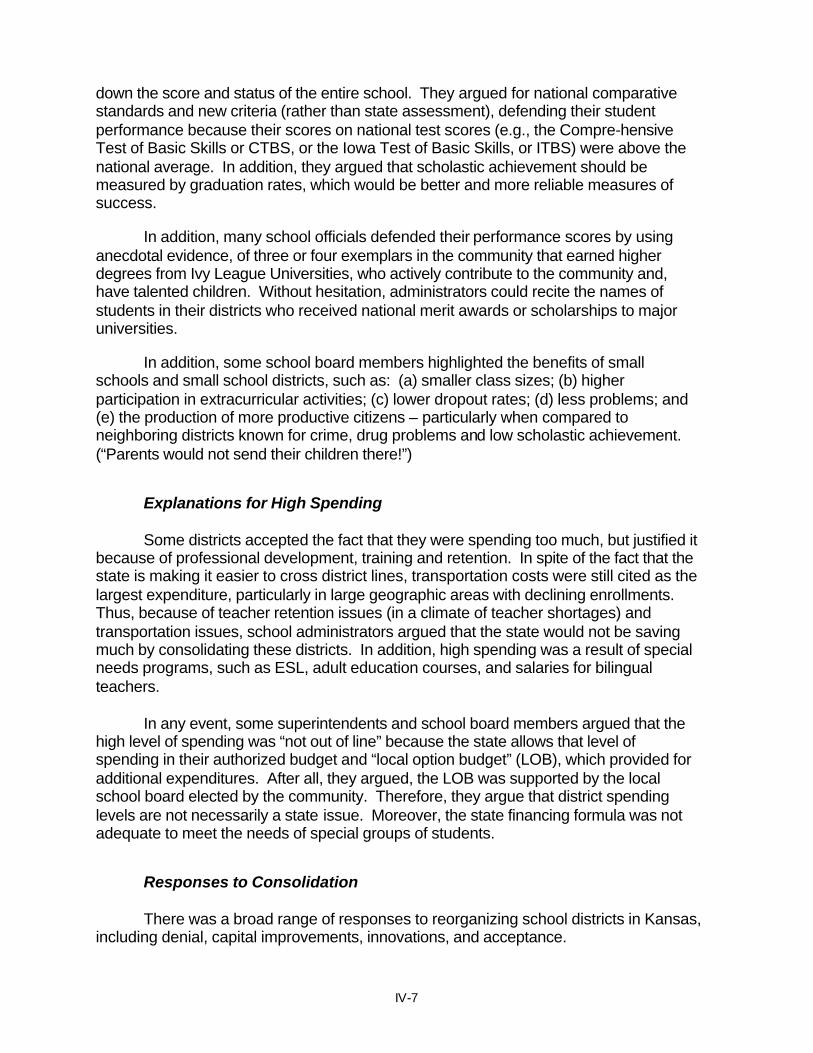
IV-7
down the score and status of the entire school. They argued for national comparative standards and new criteria (rather than state assessment), defending their student performance because their scores on national test scores (e.g., the Compre-hensive Test of Basic Skills or CTBS, or the Iowa Test of Basic Skills, or ITBS) were above the national average. In addition, they argued that scholastic achievement should be measured by graduation rates, which would be better and more reliable measures of success.
In addition, many school officials defended their performance scores by using anecdotal evidence, of three or four exemplars in the community that earned higher degrees from Ivy League Universities, who actively contribute to the community and, have talented children. Without hesitation, administrators could recite the names of students in their districts who received national merit awards or scholarships to major universities.
In addition, some school board members highlighted the benefits of small schools and small school districts, such as: (a) smaller class sizes; (b) higher participation in extracurricular activities; (c) lower dropout rates; (d) less problems; and (e) the production of more productive citizens – particularly when compared to neighboring districts known for crime, drug problems and low scholastic achievement. (“Parents would not send their children there!”)
Explanations for High Spending
Some districts accepted the fact that they were spending too much, but justified it because of professional development, training and retention. In spite of the fact that the state is making it easier to cross district lines, transportation costs were still cited as the largest expenditure, particularly in large geographic areas with declining enrollments. Thus, because of teacher retention issues (in a climate of teacher shortages) and transportation issues, school administrators argued that the state would not be saving much by consolidating these districts. In addition, high spending was a result of special needs programs, such as ESL, adult education courses, and salaries for bilingual teachers.
In any event, some superintendents and school board members argued that the high level of spending was “not out of line” because the state allows that level of spending in their authorized budget and “local option budget” (LOB), which provided for additional expenditures. After all, they argued, the LOB was supported by the local school board elected by the community. Therefore, they argue that district spending levels are not necessarily a state issue. Moreover, the state financing formula was not adequate to meet the needs of special groups of students.
Responses to Consolidation
There was a broad range of responses to reorganizing school districts in Kansas,
including denial, capital improvements, innovations, and acceptance.
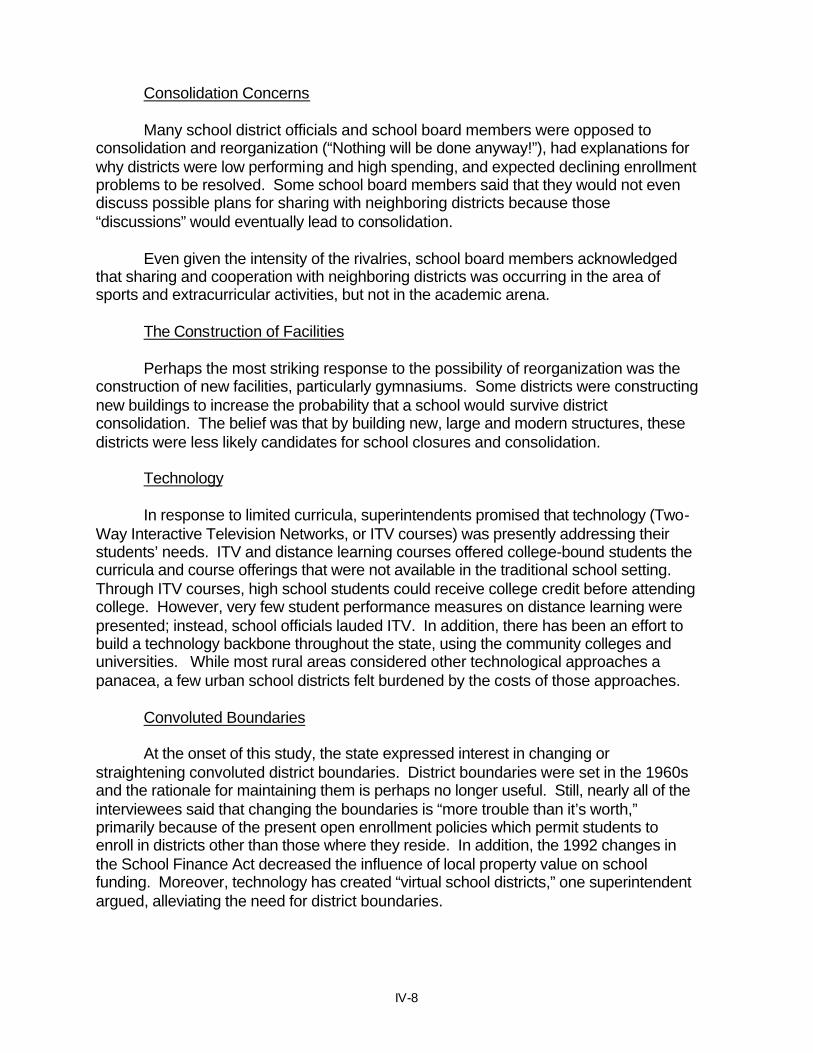
IV-8
Consolidation Concerns
Many school district officials and school board members were opposed to consolidation and reorganization (“Nothing will be done anyway!”), had explanations for why districts were low performing and high spending, and expected declining enrollment problems to be resolved. Some school board members said that they would not even discuss possible plans for sharing with neighboring districts because those “discussions” would eventually lead to consolidation.
Even given the intensity of the rivalries, school board members acknowledged that sharing and cooperation with neighboring districts was occurring in the area of sports and extracurricular activities, but not in the academic arena.
The Construction of Facilities
Perhaps the most striking response to the possibility of reorganization was the construction of new facilities, particularly gymnasiums. Some districts were constructing new buildings to increase the probability that a school would survive district consolidation. The belief was that by building new, large and modern structures, these districts were less likely candidates for school closures and consolidation.
Technology
In response to limited curricula, superintendents promised that technology (Two-
Way Interactive Television Networks, or ITV courses) was presently addressing their students’ needs. ITV and distance learning courses offered college-bound students the curricula and course offerings that were not available in the traditional school setting. Through ITV courses, high school students could receive college credit before attending college. However, very few student performance measures on distance learning were presented; instead, school officials lauded ITV. In addition, there has been an effort to build a technology backbone throughout the state, using the community colleges and universities. While most rural areas considered other technological approaches a panacea, a few urban school districts felt burdened by the costs of those approaches.
Convoluted Boundaries
At the onset of this study, the state expressed interest in changing or straightening convoluted district boundaries. District boundaries were set in the 1960s and the rationale for maintaining them is perhaps no longer useful. Still, nearly all of the interviewees said that changing the boundaries is “more trouble than it’s worth,” primarily because of the present open enrollment policies which permit students to enroll in districts other than those where they reside. In addition, the 1992 changes in the School Finance Act decreased the influence of local property value on school funding. Moreover, technology has created “virtual school districts,” one superintendent argued, alleviating the need for district boundaries.

IV-9
Superintendents as Managers
In spite of the prevalence of Special Education Cooperatives, Service Centers, Interlocals and Networks, most administrators do not routinely work with neighboring districts. Some superintendents promote the sharing of technology, nurses, teachers, and other resources. Most sharing occurred because of prior relationships among superintendents. One superintendent argued that if reorganization were left up to the superintendents, organizational problems might be resolved because superintendents are willing to work together. These superintendents viewed the lack of clear administrative roles and responsibilities as a major hindrance to taking action. Some suggested that sharing teachers, might cause scheduling and governance problems (for example, how would teachers be paid and by which district?). Some districts were sharing senior administrators although net savings were small because the superintendents in small districts had other roles and responsibilities, including principal and transportation director.
Some administrators of large school districts have resisted sharing with smaller districts, particularly in rural areas, because of budgetary, logistical and scheduling demands. Resulting high transportation costs reduce cost savings, they argued. Superintendents of larger districts expressed concern that the smaller districts viewed them as monoliths.
The Reorganization Process
The more established superintendents suggested that the state should mandate change, while providing timetables and incentives, and not require that districts hold down spending and raise taxes until they no longer can afford it (“bleeding the district”). Mandating change would minimize the period of resentment, they argued, while taking the pressure off local school boards and administrators to make difficult financial decisions.
Some administrators wanted the state to provide incentives for reorganization efforts. Funding for such programs should be provided and could be reevaluated periodically (every two or three years). Moreover, funding should be given for programs that encourage community dialogue, such as “pen pal programs.”
Conclusion
Although there is substantial resistance to reorganizing school districts in Kansas, some district officials acknowledge that something needs to be done. They suggest that a more comprehensive approach for organizing school districts will enhance efficiency and student performance.

V-1
Chapter V
ALTERNATIVE APPROACHES TO REORGANIZING SCHOOL DISTRICTS IN KANSAS
Introduction In Section III, we described two ways to identify districts that might need to be reorganized. First, we focused on school districts where pupil performance was low and where per pupil spending was high. Second, we focused on school districts where schools, or the district itself, may be too small or too large to provide a broad array of services effectively. Having identified “target” districts, we then examined the characteristics of all districts that are neighbors of those target districts to determine if reorganization with one or more of them might address the conditions in each target district. In the case of those districts selected on the basis of relatively low pupil performance and relatively high per pupil spending, we identified suitable neighbors as ones with relatively high performance and relatively low per pupil spending. In the case of those districts selected on the basis of size, we identified suitable neighbors based on proximity, size, and the availability of space to serve pupils. In pursuing these approaches, we discovered several situations in which we were either unable to find a suitable neighboring district for a target district, or the suitable neighbor we found differed depending on which approach (size or performance) was used to identify the neighbor. Therefore, we developed a third approach, which focused on the same target districts we identified using the first and second approaches, but selected neighboring districts using some criteria associated with the first two approaches, as well as information gleaned from the interviews we conducted with school districts, making the outcome both rational and reasonable. The result of pursuing these three approaches was the development of three maps that display the districts we believe should be reorganized. There are several important things to take into consideration in reviewing the maps. First, we have attempted to use data to drive the process. That is, we established criteria to guide our work and then collected and evaluated relevant information to determine whether any district met the criteria and whether other districts should be involved in reorganization. We strongly believe that this approach is the only legitimate way to do this kind of work and that other approaches would not withstand scrutiny by those who are affected by policy decisions. Second, we used data in making our decisions that some might complain were never intended to be used for that purpose. In our view, the state has gone to the trouble of developing pupil performance data using statewide tests as well as school district spending data using statewide accounting procedures, and such information is the best and only basis for making the kinds of decisions we needed to make in doing this work. Third, we took our work to completion; that is, we used the data and information we had to recommend that specific districts be reorganized. We did this primarily to illustrate that it is possible to reach such conclusions. However, as
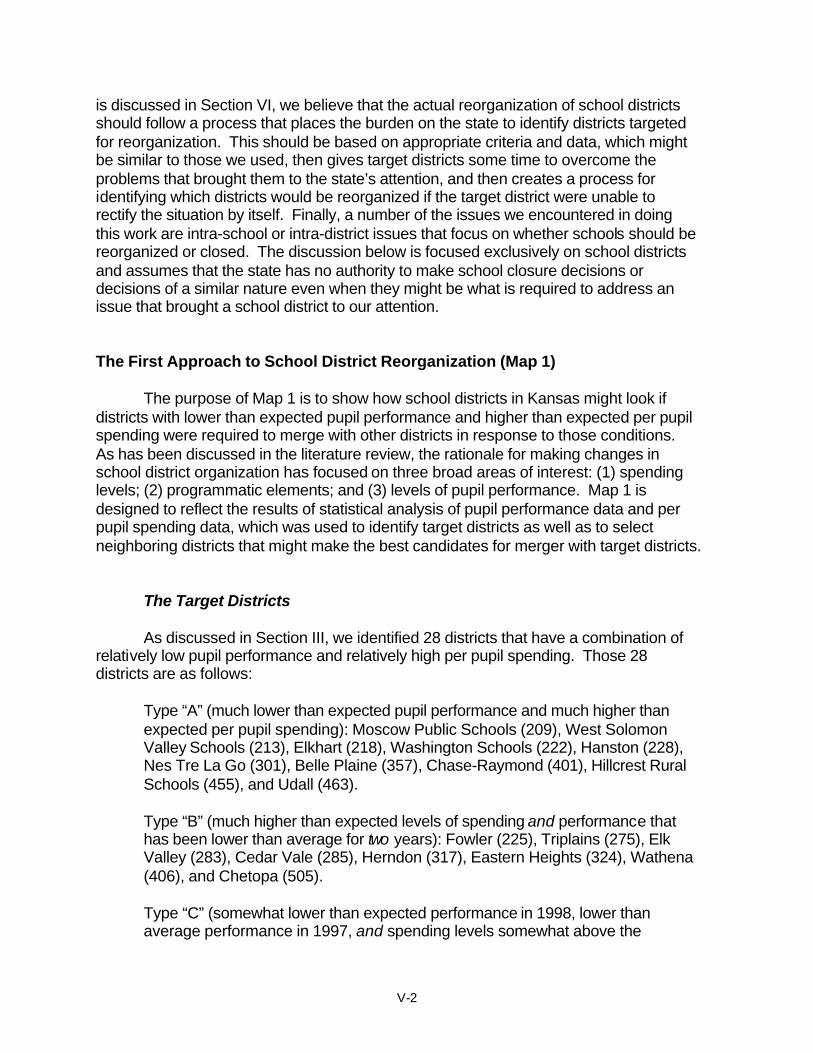
V-2
is discussed in Section VI, we believe that the actual reorganization of school districts should follow a process that places the burden on the state to identify districts targeted for reorganization. This should be based on appropriate criteria and data, which might be similar to those we used, then gives target districts some time to overcome the problems that brought them to the state’s attention, and then creates a process for identifying which districts would be reorganized if the target district were unable to rectify the situation by itself. Finally, a number of the issues we encountered in doing this work are intra-school or intra-district issues that focus on whether schools should be reorganized or closed. The discussion below is focused exclusively on school districts and assumes that the state has no authority to make school closure decisions or decisions of a similar nature even when they might be what is required to address an issue that brought a school district to our attention. The First Approach to School District Reorganization (Map 1) The purpose of Map 1 is to show how school districts in Kansas might look if districts with lower than expected pupil performance and higher than expected per pupil spending were required to merge with other districts in response to those conditions. As has been discussed in the literature review, the rationale for making changes in school district organization has focused on three broad areas of interest: (1) spending levels; (2) programmatic elements; and (3) levels of pupil performance. Map 1 is designed to reflect the results of statistical analysis of pupil performance data and per pupil spending data, which was used to identify target districts as well as to select neighboring districts that might make the best candidates for merger with target districts. The Target Districts As discussed in Section III, we identified 28 districts that have a combination of relatively low pupil performance and relatively high per pupil spending. Those 28 districts are as follows:
Type “A” (much lower than expected pupil performance and much higher than expected per pupil spending): Moscow Public Schools (209), West Solomon Valley Schools (213), Elkhart (218), Washington Schools (222), Hanston (228), Nes Tre La Go (301), Belle Plaine (357), Chase-Raymond (401), Hillcrest Rural Schools (455), and Udall (463).
Type “B” (much higher than expected levels of spending and performance that
has been lower than average for two years): Fowler (225), Triplains (275), Elk Valley (283), Cedar Vale (285), Herndon (317), Eastern Heights (324), Wathena (406), and Chetopa (505).
Type “C” (somewhat lower than expected performance in 1998, lower than
average performance in 1997, and spending levels somewhat above the

V-3
predicted level): Turner-Kansas City (202), Bonner Springs (204), Mankato (278), Pleasanton (344), Oxford (358), Caldwell (360), Marysville (364), Madison-Virgil (386), Neodesha (461), and South Haven (509).
Identifying Appropriate Neighboring Districts Having identified 28 target districts, we examined all their neighboring districts to find appropriate candidates for merger based on four factors: (1) pupil performance; (2) per pupil spending; (3) distance between schools; and (4) being in the same county. Our assumption is that the best candidates for merger are those districts with relatively high levels of pupil performance and relatively low levels of per pupil spending that are reasonably close to target districts (that is, having schools within a distance of 20 miles of each other) and within the same county (representing a similar community of interest). The figures in Table V-1 indicate those characteristics of neighbor districts for each of the 28 target districts. Table V-2 indicates the recommended mergers of districts, which result in: (1) the creation of 20 merged districts, combining 20 target districts with 22 neighbor districts; (2) of the 20 new districts, all reflect merging a target district with one other district; (3) no mergers between target districts; and (4) eight target districts that cannot be reorganized. The Second Approach to School District Reorganization (Map 2) As discussed in Section III, we also identified school districts that might benefit from reorganization on the basis of school size. In looking at enrollment figures and numbers of high schools in Kansas, we found 50 districts with enrollments less than 260 pupils. We also found 24 districts with enrollments that are too large in relationship to the number of high schools they have. We also identified two districts where total enrollment is simply so high that, regardless of numbers of high schools, they might be viewed by some people as being too large to manage effectively. The Target Districts Districts that are too small relative to the number of schools they operate. Too small with only one high school: Cheylin (103), White Rock (104), Moscow
Public Schools (20-9), Northern Valley (212), West Solomon Valley Schools (213), Rolla (217), Ashland (220), North Central (221), Fowler (225), Hanston (228), West Smith County (238), Weskan (242), Palco (269), Triplains (275), Jewell (279), West Graham-Morland (280), Elk Valley (283), Cedar Vale (286), Grinnell Public Schools (291), Wheatland (292), Prairie Heights (295), Sylvan Grove (299), Nes Tre La Go (301), Smoky Hill (302), Bazine (304), Brewster

V-4
(314), Golden Plains (316), Herndon (317), Eastern Heights (324), Logan (326), Burrton (369), Montezuma (371), Hamilton (390), Paradise (399), Chase-Raymond (401), Mullinville (424), Midway Schools (433), Hillcrest (455), Healy (468), Dexter (471), Haviland (474), Copeland (476), Pawnee Heights (496), Lewis (502), and Attica (511). Too small with more than one high school: Barnes (223), Leroy-Gridley (245), Southern Cloud (334), Rural Vista (481), and Axtell (488).
Districts that are too large. Too large relative to the number of high schools: Turner-Kansas City (202), Blue Valley (229), Olathe (233), Emporia (253), Derby (260), Haysville (261), Goddard (265), Maize (266), Salina (305), Hutchinson (308), Seaman (345), Newton (373), Manhattan (383), Great Bend (428), Auburn Washburn (437), Dodge City (443), Leavenworth (453), Garden City (457), Geary County Schools (475), Liberal (480), Hays (489), Lawrence (497), and Kansas City (500). Too large: Wichita (259) and Shawnee Mission (512).
Identifying Appropriate Neighboring Districts Once the target districts using this approach were identified, we examined neighboring districts to determine whether consolidation could address the issue that brought the district under scrutiny. In order for a merger to be feasible, we decided that existing high schools in two districts should be no more than 20 miles apart and that there would need to be sufficient capacity in one or more schools to serve all of the pupils in the newly formed district. The figures in Table V-3 indicate the characteristics of neighboring districts for all 76 target districts. We found that 45 of the 50 districts considered to be too small could be merged with one or more neighboring districts and would meet all criteria. For five districts, consolidation with a neighboring district would not solve the problem. Twenty-nine neighboring districts were merged with these 45, resulting in 34 new districts. This meant that where there had originally been 74 districts there were now 34 (of those 34 new districts, 29 are the result of the merger of two districts, four are the result of the merger of three districts, and one is the result of the merger of four districts). We also found that district reorganization would only address the needs of six districts that are too large relative to the number of high schools they operate. These six districts could be merged with seven neighboring districts to create five new districts (of these five districts, two are the result of merging two districts and three are the result of merging three districts). In 18 districts, some other approach, such as creating “schools within schools,” would need to be used to address the issue of large high schools. That approach plus others, such as dividing a district into several districts,

V-5
would need to be used to address the issues associated with the two districts that are very large. Mergers that we consider to be appropriate are shown in Table V-4(A) and Table V-4(B). Map 2 indicates a variety of approaches that might be used to address optimum size issues. The map shows a total of 39 new districts created by merging 51 target districts (ones considered to be too small or too large given the number of high schools they operate) with 36 neighboring districts that, together, are close enough and have sufficient capacity to address the concern in a reasonable way. The map shows that the 39 new districts are the result of 31 mergers of two districts, seven mergers of three districts, and one merger of four districts. In the end, the state would have 256 school districts rather than the 304 districts that exist currently. The map also shows: (1) the five districts that have enrollments that are too low to support a high school of 100 pupils for which we could not find a suitable neighbor for merger; (2) the 18 districts that have high schools considered to be too large but for which we could not find a suitable neighbor for merger (and within which some other approach would need to be taken to address the problem); and (3) the two districts that are very large. The Third Approach to School District Reorganization (Map 3) The purpose of Map 3 is to combine the information shown in Map 1 and Map 2 with other information we obtained, including that gained during the interviews with school district personnel, to create a set of districts that should be, and could be, reorganized. Map 3 reflects the research on school and school district size, the actual performance and spending levels of districts, and the practical matters that ought to be taken into consideration before making recommendations about changing school district boundaries. In order to create Map 3, we developed nine rationales (A-I) for selecting target districts and neighbor districts. The rationales are shown below. Rationale “A” Select any reorganized sets of districts that are the same on both Map 1 and Map 2. In this case, any target district would be selected on the basis of the criteria used in both Map 1 and Map 2 and any districts selected for merger with
a target district would meet the criteria used in both Map 1 and Map 2. We identify five target districts and five merger districts using this rational.
Rationale “B”
Select any target district that meets the criteria for identifying target districts on both Map 1 and Map 2 but that is reorganized differently in Map 1 than it is in Map 2; resolve the differences in Map 3. In some cases, this means that we selected a merger district for a target district for which no merger district is

V-6
selected in Map 1. In other cases, we selected a merger district from among alternative districts that we identify in Map 1 or Map 2. Using this rationale, we identify seven target districts and nine merger districts, four of which are targets in Map 2, using this rationale.
Rational “C”
Select sets of districts in which one district is a target district in Map 1 and merger districts are target districts in Map 2. Using this rationale, we identify six sets of merger districts.
Rationale “D”
Select all districts using Map 1 criteria that have not been selected already and reconfigure them using merger districts from Map 1 or Map 2 if they are reasonable based on distance and information obtained in interviews. We identify nine target districts and nine merger districts using this rationale.
Rationale “E”
Select all districts that have schools considered to be too small using Map 2 criteria that have only one high school, which have not been selected already, and reconfigure them only if they meet the following additional criteria:
(A) If they have between 150 and 260 pupils, they must also meet two out of
the following three criteria: (1) Have little or no projected enrollment growth; (2) Have actual per pupil spending that is more than 30 percent above
predicted spending per pupil; (3) Have actual average pupil performance below predicted pupil
performance. (B) If they have less than 150 pupils, they must meet one of the following
criteria: (1) Have little or no projected enrollment growth; (2) Have actual per pupil spending that is more than 20 percent above
predicted spending per pupil.
Using this rationale, we identify nine target districts and nine merger districts, one of which meets Map 2 selection criteria.

V-7
Rationale “F”
Select all districts that have schools considered to be too small using Map 2 criteria that have more than one high school, which have not been selected already, and reconfigure them only if they meet two out of three of the following additional criteria:
(1) Have little or no projected enrollment growth;
(2) Have actual per pupil spending that is more than 30 percent above
predicted spending per pupil; (3) Have actual average pupil performance below predicted pupil
performance. We identify four target districts and four merger districts using this rationale. Rationale “G”
Select all districts that have schools that are too large using Map 2 criteria where merger with other districts can alleviate the concern and merger is possible due to available capacity in existing facilities. Using this rationale, we identify three target districts and four merger districts.
Rationale “H”
Select all districts that have schools that are too large using Map 2 criteria where merger with other districts does not appear capable of resolving the concern and where intra-district or intra-school action needs to be taken. We identify 19 districts using this rationale.
Rationale “I”
Select districts considered to be too large using Map 2 criteria. These districts may need to be disaggregated into smaller districts. We identify two districts using these criteria.

TABLE V-1
DATA RELATED TO THE SELECTION OF NEIGHBORING DISTRICTS TOMERGE WITH THE TARGET DISTRICTS ASSOCIATED WITH MAP 1
Is the Pupil N’ghbor a Performance Per Pupil In Target Target z-score Spending Distance District
Target District Neighbor Districts District? Pred. Actual Pred. Actual (Miles) County?
Type “A”
209 Moscow 1.09 -1.46 $7,564 $8,647210 Hugoton Public Schools No -0.50 -1.22 $5,695 $4,866 13 Yes214 Ulysses No -0.46 -1.61 $4,851 $4,659 23 No480 Liberal No -2.16 -1.52 $3,707 $3,569 26 No483 Kismet-Plains No -0.35 -0.77 $4,785 $5,256 35 No507 Satanta No -1.68 -3.97 $5,886 $5,861 15 No
213 West Solomon Valley P.S. 1.23 -3.18 $7,055 $8,714211 Norton Community Schools No 1.25 -0.77 $4,865 $5,002 17 Yes280 West Graham-Morland No 2.78 1.43 $7,640 $10,928 19 No281 Hill City No 0.72 -0.38 $5,596 $5,717 19 No295 Prairie Heights No 0.95 -1.07 $6,835 $7,307 16 No326 Logan No 0.32 0.77 $6,033 $6,932 23 No
218 Elkhart 1.22 -3.33 $5,610 $6,534217 Rolla No -0.19 1.55 $7,402 $8,434 17 Yes452 Stanton County No -0.54 -0.78 $6,153 $5,825 44 No
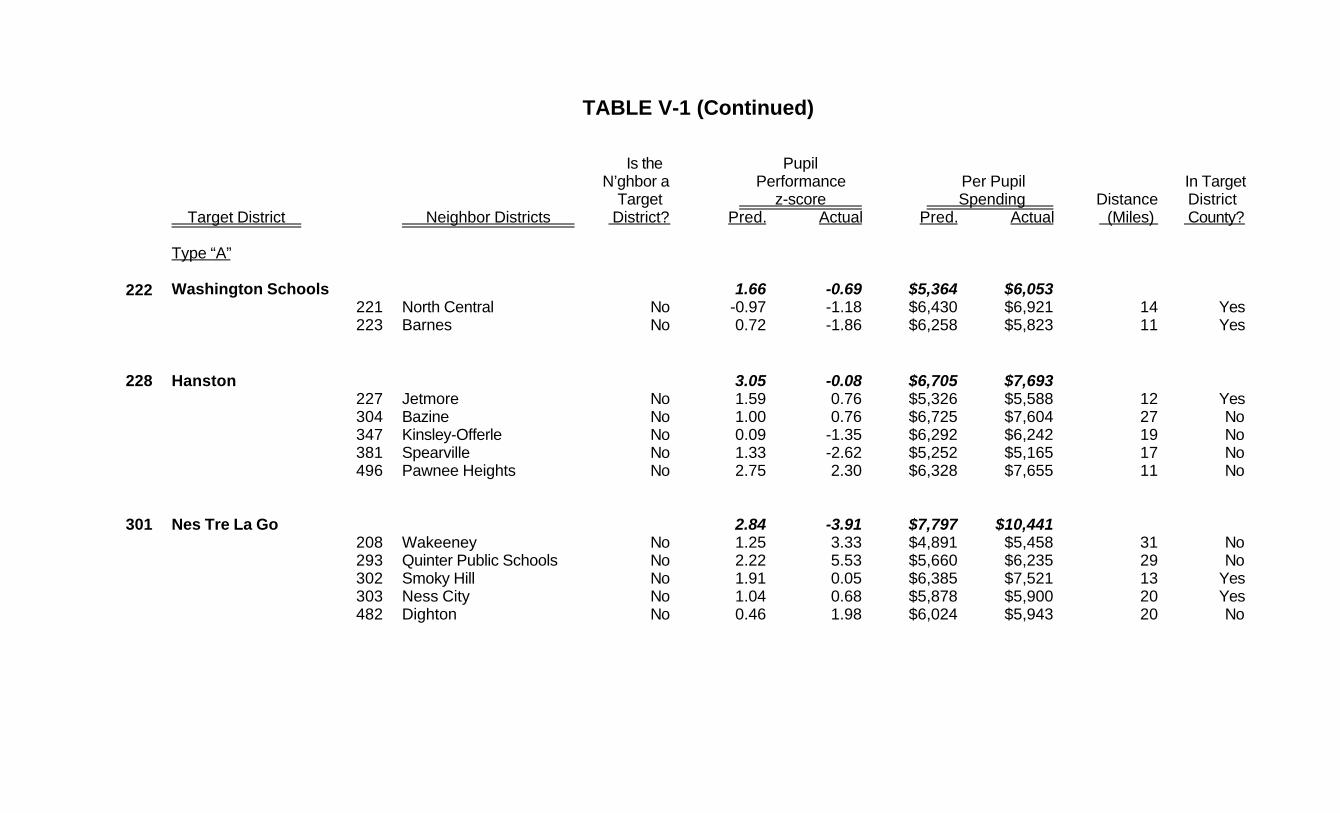
TABLE V-1 (Continued)
Is the Pupil N’ghbor a Performance Per Pupil In Target Target z-score Spending Distance District
Target District Neighbor Districts District? Pred. Actual Pred. Actual (Miles) County?
Type “A”
222 Washington Schools 1.66 -0.69 $5,364 $6,053221 North Central No -0.97 -1.18 $6,430 $6,921 14 Yes223 Barnes No 0.72 -1.86 $6,258 $5,823 11 Yes
228 Hanston 3.05 -0.08 $6,705 $7,693227 Jetmore No 1.59 0.76 $5,326 $5,588 12 Yes304 Bazine No 1.00 0.76 $6,725 $7,604 27 No347 Kinsley-Offerle No 0.09 -1.35 $6,292 $6,242 19 No381 Spearville No 1.33 -2.62 $5,252 $5,165 17 No496 Pawnee Heights No 2.75 2.30 $6,328 $7,655 11 No
301 Nes Tre La Go 2.84 -3.91 $7,797 $10,441208 Wakeeney No 1.25 3.33 $4,891 $5,458 31 No293 Quinter Public Schools No 2.22 5.53 $5,660 $6,235 29 No302 Smoky Hill No 1.91 0.05 $6,385 $7,521 13 Yes303 Ness City No 1.04 0.68 $5,878 $5,900 20 Yes482 Dighton No 0.46 1.98 $6,024 $5,943 20 No

TABLE V-1 (Continued)
Is the Pupil N’ghbor a Performance Per Pupil In Target Target z-score Spending Distance District
Target District Neighbor Districts District? Pred. Actual Pred. Actual (Miles) County?
Type “A”
357 Belle Plaine 1.53 -2.51 $4,604 $5,337263 Mulvane No 0.95 -0.95 $4,251 $3,760 7 No264 Clearwater No 2.06 2.65 $4,848 $4,411 14 No353 Wellington No -0.79 -2.35 $4,535 $3,813 11 Yes358 Oxford Yes 1.77 -2.81 $4,989 $5,622 11 Yes463 Udall Yes 0.88 -1.54 $5,175 $5,857 10 No
401 Chase-Raymond -1.22 -4.50 $6,636 $7,393310 Fairfield No -1.01 -0.83 $5,906 $5,684 34 No328 Lorraine No 0.23 4.16 $5,744 $5,457 37 No349 Stafford No -1.86 -0.50 $5,765 $6,125 31 No355 Ellinwood public Schools No 0.45 0.85 $5,146 $5,189 12 No376 Sterling No 0.07 1.25 $5,371 $5,717 13 Yes405 Lyons No -0.43 2.57 $5,312 $4,865 13 Yes
455 Hillcrest Rural Schools -0.05 -4.51 $6,126 $7,157221 North Central No -0.97 -1.18 $6,430 $6,921 15 No224 Clifton-Clyde No 0.61 2,68 $5,951 $5,920 18 No333 Concordia No -0.23 2.09 $4,505 $4,511 19 No427 Republic County No 0.61 $1.49 $5,337 $5,615 10 Yes

TABLE V-1 (Continued)
Is the Pupil N’ghbor a Performance Per Pupil In Target Target z-score Spending Distance District
Target District Neighbor Districts District? Pred. Actual Pred. Actual (Miles) County?
Type “A”
463 Udall 0.88 -1.54 $5,175 $5,857263 Mulvane No 0.95 -0.95 $4,251 $3,760 11 No357 Belle Plaine Yes 1.53 -2.51 $4,604 $5,337 10 No358 Oxford Yes 1.77 -2.81 $4,989 $5,622 9 No396 Douglass Public Schools No 1.96 0.75 $4,638 $4,930 11 No462 Central No 0.52 -0.65 $5,577 $5,846 21 Yes465 Winfield No 0.49 -0.31 $4,828 $4,162 14 Yes
Type “B”
225 Fowler 0.39 -0.51 $6,656 $8,027102 Cimarron-Ensign No 0.56 -1.39 $4,623 $4,541 30 No219 Minneola No -0.03 -1.99 $5,683 $5,687 10 No220 Ashland No 0.23 2.15 $6,327 $6,338 27 No226 Meade No 0.87 1.30 $5,494 $5,505 11 Yes371 Montezuma No -0.73 -2,48 $6,390 $6,637 20 No

TABLE V-1 (Continued)
Is the Pupil N’ghbor a Performance Per Pupil In Target Target z-score Spending Distance District
Target District Neighbor Districts District? Pred. Actual Pred. Actual (Miles) County?
Type “B”
275 Triplains 1.60 -0.05 $7,221 $8,485241 Wallace County Schools No -0.65 3.20 $5,330 $5,545 30 No274 Oakley No -0.74 0.42 $5,652 $5,979 22 Yes314 Brewster No 1.37 2.96 $6,410 $6,988 22 No315 Colby Public Schools No 0.72 0.45 $4,361 $4,302 25 No466 Scott County No 0.82 2.48 $4,753 $4,736 45 No467 Leoti No -0.14 2.11 $5,386 $5,524 40 No
283 Elk Valley -3.17 -1.56 $5,359 $6,631282 West Elk No -0.84 1.32 $5,046 $5,643 19 Yes286 Chauatauqua County Community No -0.24 -0.01 $4,658 $5,249 18 No446 Independence No -0.65 -1.57 $3,969 $4,060 23 No461 Neodesha Yes -0.16 -4.01 $4,633 $5,220 22 No484 Fredonia No -0.86 -1.78 $4,667 $5,066 18 No
285 Cedar Vale -2.11 -0.65 $5,890 $6,930282 West Elk No -0.84 1.32 $5,046 $5,643 38 No286 Chauatauqua County Community No -0.24 -0.01 $4,658 $5,249 18 Yes462 Central No 0.52 -0.65 $5,577 $5,846 20 No471 Dexter No 0.47 3.17 $5,775 $6,481 13 No

TABLE V-1 (Continued)
Is the Pupil N’ghbor a Performance Per Pupil In Target Target z-score Spending Distance District
Target District Neighbor Districts District? Pred. Actual Pred. Actual (Miles) County?
Type “B”
317 Herndon 0.25 -0.25 $6,572 $7,765294 Oberlin No 0.85 4.40 $4,918 $5,256 15 No316 Golden Plains No -0.41 3.95 $6,460 $6,764 30 No318 Atwood No 0.16 4.51 $4,934 $5,325 15 Yes
324 Eastern Heights -1.22 -0.32 $5,642 $6,583238 West Smith County No 3.08 1.47 $5,847 $6,935 9 No271 Stockton No 0.98 2.28 $4,880 $5,292 30 No325 Phillipsburg No 1.43 2.38 $5,008 $5,305 13 Yes392 Osborne County No -0.07 1.00 $5,161 $5,385 38 No
406 Wathena 0.59 -1.40 $5,080 $5,835429 Troy Public Schools No 1.06 1.19 $5,440 $5,875 7 Yes486 Elwood No -1.44 -4.48 $5,159 $5,146 4 Yes
505 Chetopa -4.00 -3.05 $5,537 $6,253493 Columbus No -1.37 0.61 $4,747 $4,447 26 No504 Oswego No -1.03 3.31 $5,520 $5,095 10 No506 Labette County No 0.74 0.80 $4,598 $4,018 22 Yes
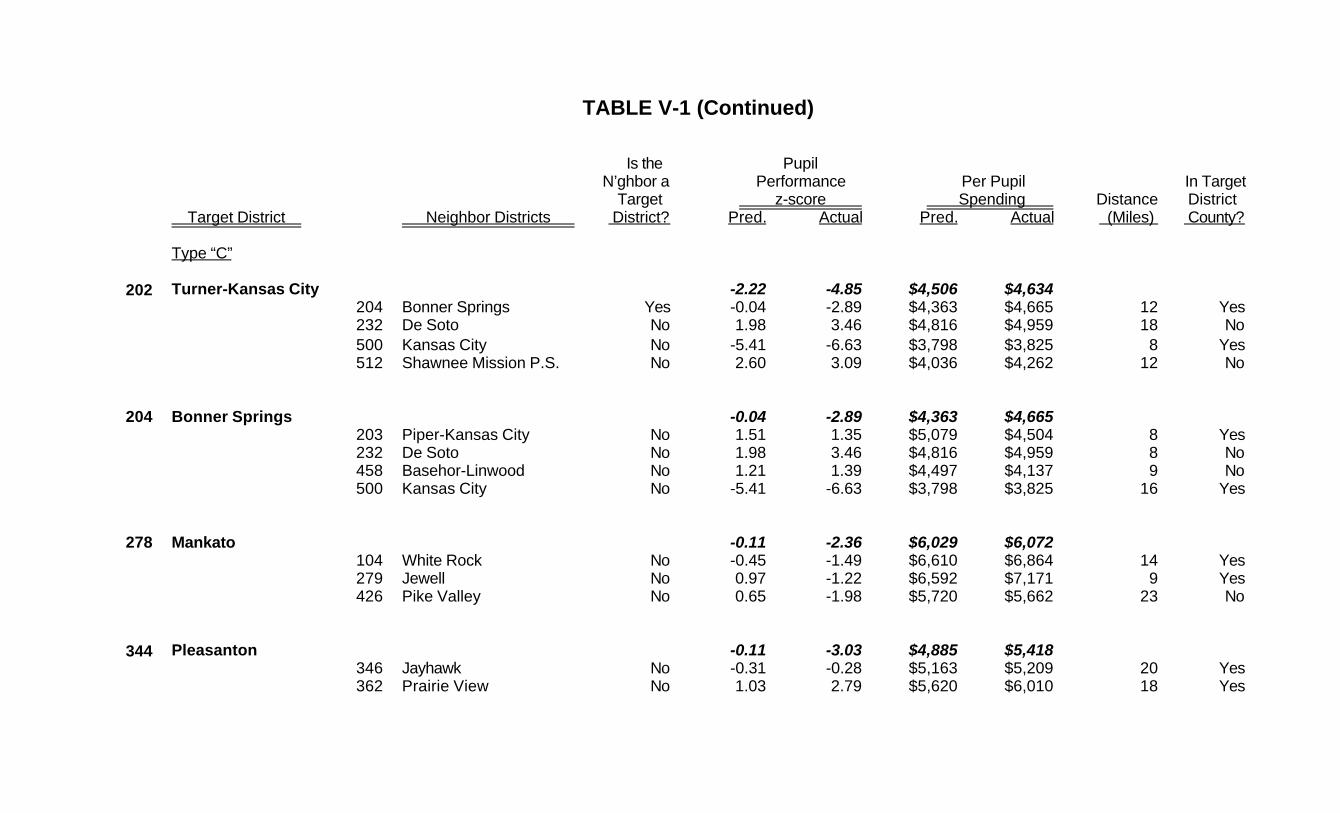
TABLE V-1 (Continued)
Is the Pupil N’ghbor a Performance Per Pupil In Target Target z-score Spending Distance District
Target District Neighbor Districts District? Pred. Actual Pred. Actual (Miles) County?
Type “C”
202 Turner-Kansas City -2.22 -4.85 $4,506 $4,634204 Bonner Springs Yes -0.04 -2.89 $4,363 $4,665 12 Yes232 De Soto No 1.98 3.46 $4,816 $4,959 18 No500 Kansas City No -5.41 -6.63 $3,798 $3,825 8 Yes512 Shawnee Mission P.S. No 2.60 3.09 $4,036 $4,262 12 No
204 Bonner Springs -0.04 -2.89 $4,363 $4,665203 Piper-Kansas City No 1.51 1.35 $5,079 $4,504 8 Yes232 De Soto No 1.98 3.46 $4,816 $4,959 8 No458 Basehor-Linwood No 1.21 1.39 $4,497 $4,137 9 No500 Kansas City No -5.41 -6.63 $3,798 $3,825 16 Yes
278 Mankato -0.11 -2.36 $6,029 $6,072104 White Rock No -0.45 -1.49 $6,610 $6,864 14 Yes279 Jewell No 0.97 -1.22 $6,592 $7,171 9 Yes426 Pike Valley No 0.65 -1.98 $5,720 $5,662 23 No
344 Pleasanton -0.11 -3.03 $4,885 $5,418346 Jayhawk No -0.31 -0.28 $5,163 $5,209 20 Yes362 Prairie View No 1.03 2.79 $5,620 $6,010 18 Yes
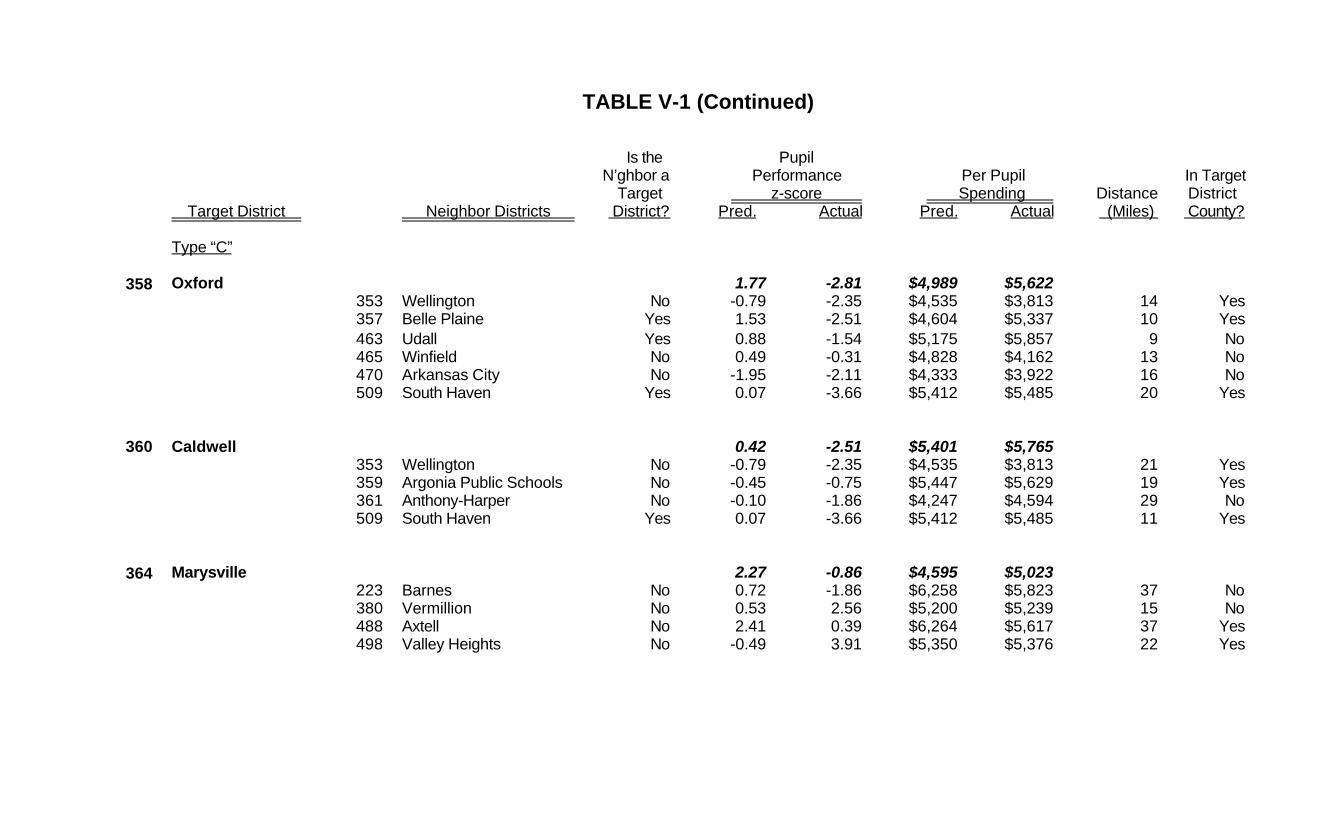
TABLE V-1 (Continued)
Is the Pupil N’ghbor a Performance Per Pupil In Target Target z-score Spending Distance District
Target District Neighbor Districts District? Pred. Actual Pred. Actual (Miles) County?
Type “C”
358 Oxford 1.77 -2.81 $4,989 $5,622353 Wellington No -0.79 -2.35 $4,535 $3,813 14 Yes357 Belle Plaine Yes 1.53 -2.51 $4,604 $5,337 10 Yes463 Udall Yes 0.88 -1.54 $5,175 $5,857 9 No465 Winfield No 0.49 -0.31 $4,828 $4,162 13 No470 Arkansas City No -1.95 -2.11 $4,333 $3,922 16 No509 South Haven Yes 0.07 -3.66 $5,412 $5,485 20 Yes
360 Caldwell 0.42 -2.51 $5,401 $5,765353 Wellington No -0.79 -2.35 $4,535 $3,813 21 Yes359 Argonia Public Schools No -0.45 -0.75 $5,447 $5,629 19 Yes361 Anthony-Harper No -0.10 -1.86 $4,247 $4,594 29 No509 South Haven Yes 0.07 -3.66 $5,412 $5,485 11 Yes
364 Marysville 2.27 -0.86 $4,595 $5,023223 Barnes No 0.72 -1.86 $6,258 $5,823 37 No380 Vermillion No 0.53 2.56 $5,200 $5,239 15 No488 Axtell No 2.41 0.39 $6,264 $5,617 37 Yes498 Valley Heights No -0.49 3.91 $5,350 $5,376 22 Yes
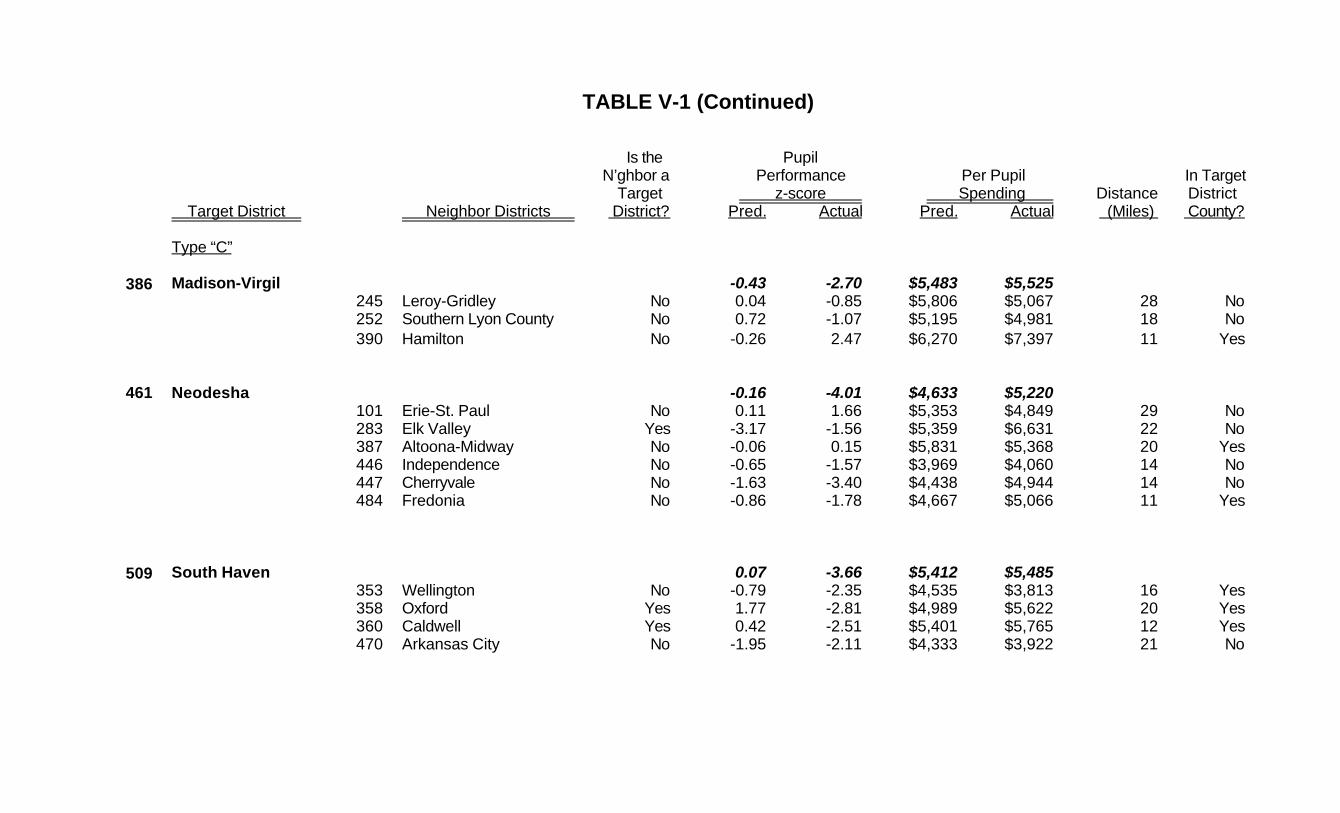
TABLE V-1 (Continued)
Is the Pupil N’ghbor a Performance Per Pupil In Target Target z-score Spending Distance District
Target District Neighbor Districts District? Pred. Actual Pred. Actual (Miles) County?
Type “C”
386 Madison-Virgil -0.43 -2.70 $5,483 $5,525245 Leroy-Gridley No 0.04 -0.85 $5,806 $5,067 28 No252 Southern Lyon County No 0.72 -1.07 $5,195 $4,981 18 No390 Hamilton No -0.26 2.47 $6,270 $7,397 11 Yes
461 Neodesha -0.16 -4.01 $4,633 $5,220101 Erie-St. Paul No 0.11 1.66 $5,353 $4,849 29 No283 Elk Valley Yes -3.17 -1.56 $5,359 $6,631 22 No387 Altoona-Midway No -0.06 0.15 $5,831 $5,368 20 Yes446 Independence No -0.65 -1.57 $3,969 $4,060 14 No447 Cherryvale No -1.63 -3.40 $4,438 $4,944 14 No484 Fredonia No -0.86 -1.78 $4,667 $5,066 11 Yes
509 South Haven 0.07 -3.66 $5,412 $5,485353 Wellington No -0.79 -2.35 $4,535 $3,813 16 Yes358 Oxford Yes 1.77 -2.81 $4,989 $5,622 20 Yes360 Caldwell Yes 0.42 -2.51 $5,401 $5,765 12 Yes470 Arkansas City No -1.95 -2.11 $4,333 $3,922 21 No

TABLE V-2
DISTRICTS INVOLVED IN RECONFIGURATION WHERETARGET DISTRICTS ARE THOSE WITH RELATIVELY LOW
PERFORMANCE AND RELATIVELY HIGH SPENDING (MAP 1)
Districts Involved in Reconfiguration Other Districts Other Districts List of 28 Map 1 that are that are not Target Districts by Type Map 1 Targets Map 1 Targets
Type “A”
209 Moscow Public Schools 210 Hugoton P.S.
213 West Solomon Valley P.S. -- --
218 Elkhart 217 Rolla
222 Washington Schools -- --
228 Hanston 227 Jetmore
301 Nes Tre La Go 482 Dighton
357 Belle Plaine 264 Clearwater
401 Chase-Raymond 405 Lyons
455 Hillcrest Rural Schools 427 Republic County
463 Udall -- --
Type “B”
225 Fowler 226 Meade
275 Triplains 274 Oakley
283 Elk Valley 282 West Elk
285 Cedar Vale 471 Dexter

TABLE V-2 (Continued)
Districts Involved in Reconfiguration Other Districts Other Districts List of 28 Map 1 that are that are not Target Districts by Type Map 1 Targets Map 1 Targets
Type “B” (Continued)
317 Herndon 318 Atwood
324 Eastern Heights 325 Phillipsburg
406 Wathena -- --
505 Chetopa 504 Oswego
Type “C”
202 Turner-Kansas City 512 Shawnee Mission
204 Bonner Springs 203 Piper-Kansas City
278 Mankato -- --
344 Pleasanton 346 Jayhawk
358 Oxford -- --
360 Caldwell -- --
364 Marysville 498 Valley Heights
386 Madison-Virgil 390 Hamilton
461 Neodesha 387 Altoona-Midway
509 South Haven -- --

TABLE V-2 (Continued)
Summary of Reconfiguration
1. There are 28 target districts based on relatively low performance and relatively high spending.
2. We looked at all neighbor districts of those 28 target districts and were able to reconfigure 20 ofthem taking into consideration performance levels, spending levels, and distance from a targetdistrict.
3. It takes 20 unduplicated reconfigurations to address the needs of the remaining 20 districts.
4. Of these reconfigurations, all 20 involve two-district mergers.
Note: Type “A” districts are those that had both pupil performance levels lower than expected in 1998 (using a 90%confidence interval) and per pupil spending higher than expected in 1998 (using a 95% confidence interval) on the basis of statewide analysis of district characteristics that predict pupil performance and per pupil spending.
Type “B” districts are those in which pupil performance was lower than the statewide average in both 1998 and1997 while per pupil spending was higher than expected (using a 95% confidence interval on the basis ofstatewide analysis of district characteristics that predict per pupil spending).
Type “C” districts are those that had lower than expected performance in 1998 on the basis of statewide analysis ofdistrict characteristics that predict pupil performance, lower than statewide average pupil performance in 1997, andper pupil spending somewhat above the level expected (without using a confidence interval) on the basis ofstatewide analysis of district characteristics that predict per pupil spending.

TABLE V-3
DATA RELATED TO THE SELECTION OF NEIGHBORING DISTRICTS TOMERGE WITH THE TARGET DISTRICTS ASSOCIATED WITH MAP 2
DistrictIs the Enroll. Excess
N’ghbor a per Capacity of Target High Close High Distance
Target District Neighbor Districts District? School Schools (Miles)
Too Small (One High School)
103 Cheylin 192297 St. Francis Com. School No 441 277 14314 Brewster Yes 161 28318 Atwood No 435 27352 Goodland Yes 1,156 30
104 White Rock 200237 Smith Center No 585 23272 Waconda No 279 40278 Mankato No 275 241 14279 Jewell Yes 186 21427 Republic County No 606 44
209 Moscow Pub. Schools 192210 Hugoton Public Schools No 957 142 14214 Ulysses No 1,770 23480 Liberal Yes 4,050 26483 Kismet-Plains No 693 35507 Satanta Yes 438 106 14
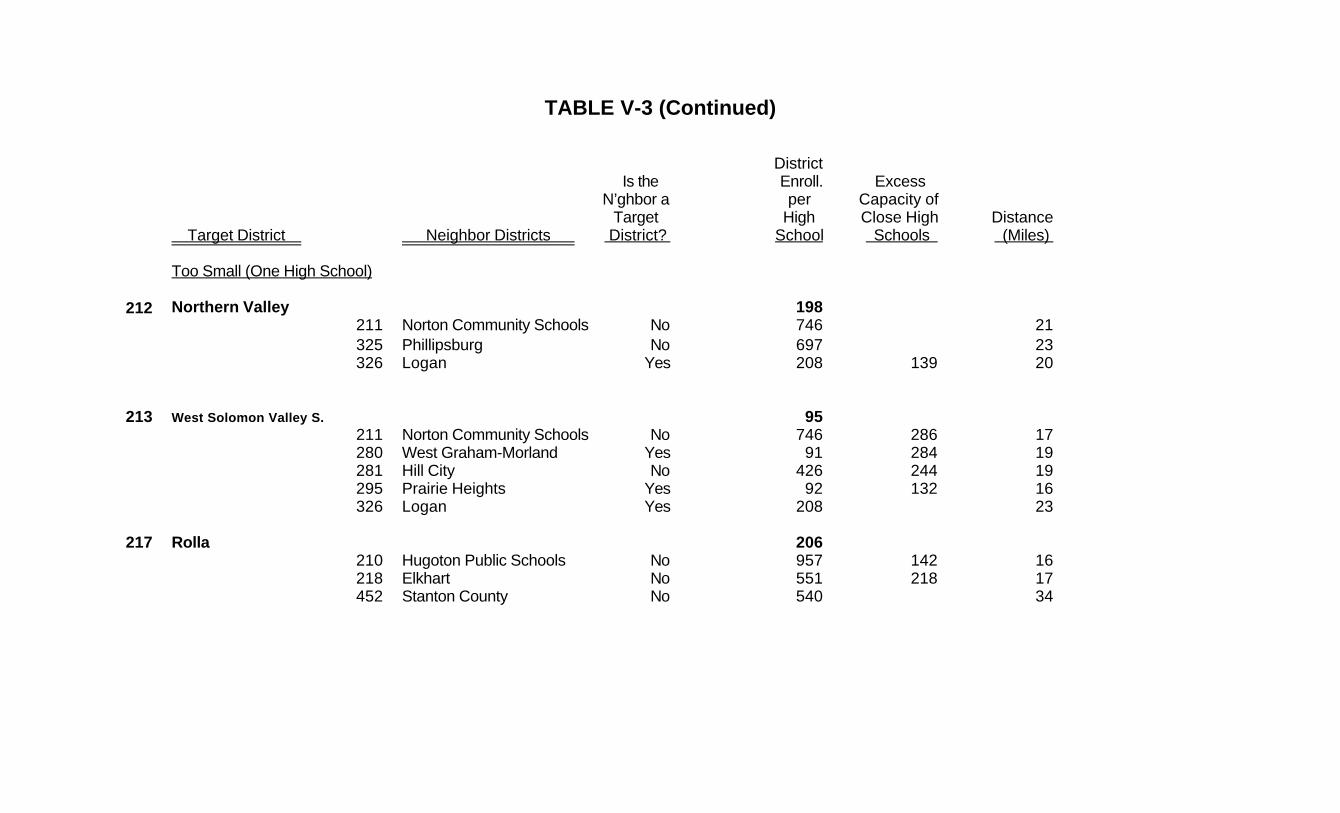
TABLE V-3 (Continued)
DistrictIs the Enroll. Excess
N’ghbor a per Capacity of Target High Close High Distance
Target District Neighbor Districts District? School Schools (Miles)
Too Small (One High School)
212 Northern Valley 198211 Norton Community Schools No 746 21325 Phillipsburg No 697 23326 Logan Yes 208 139 20
213 West Solomon Valley S. 95211 Norton Community Schools No 746 286 17280 West Graham-Morland Yes 91 284 19281 Hill City No 426 244 19295 Prairie Heights Yes 92 132 16326 Logan Yes 208 23
217 Rolla 206210 Hugoton Public Schools No 957 142 16218 Elkhart No 551 218 17452 Stanton County No 540 34

TABLE V-3 (Continued)
DistrictIs the Enroll. Excess
N’ghbor a per Capacity of Target High Close High Distance
Target District Neighbor Districts District? School Schools (Miles)
Too Small (One High School)
220 Ashland 247219 Minneola No 278 22225 Fowler Yes 170 27226 Meade No 441 28300 Comanche County No 359 26459 Bucklin No 354 26
221 North Central 161222 Washington Schools No 375 120 14223 Barnes Yes 197 23224 Clifton-Clyde No 389 22455 Hillcrest Rural Schools Yes 154 125 16
225 Fowler 170102 Cimarron-Ensign No 634 30219 Minneola No 278 170 10220 Ashland Yes 247 27226 Meade No 441 33 11371 Montezuma Yes 215 20

TABLE V-3 (Continued)
DistrictIs the Enroll. Excess
N’ghbor a per Capacity of Target High Close High Distance
Target District Neighbor Districts District? School Schools (Miles)
Too Small (One High School)
228 Hanston 139227 Jetmore No 332 251 12304 Bazine Yes 112 27347 Kinsley-Offerle No 356 504 19381 Spearville No 362 330 17496 Pawnee Heights Yes 159 104 11
238 West Smith County 196237 Smith Center No 585 215 14324 Eastern Heights Yes 195 65 9392 Osborne County No 496 29
242 Weskan 125200 Greeley County Schools No 320 29241 Wallace County Schools No 306 75 12

TABLE V-3 (Continued)
DistrictIs the Enroll. Excess
N’ghbor a per Capacity of Target High Close High Distance
Target District Neighbor Districts District? School Schools (Miles)
Too Small (One High School)
269 Palco 179208 Wakeeney No 572 29270 Plainville No 453 329 17271 Stockton No 440 21280 West Graham-Morland Yes 91 28281 Hill City No 426 244 17388 Ellis No 368 30399 Paradise Yes 154 32489 Hays Yes 3,423 41
275 Triplains 93241 Wallace County Schools No 306 30274 Oakley No 510 22314 Brewster Yes 161 22315 Colby Public Schools No 1,122 25466 Scott County No 1,121 45467 Leoti No 478 40
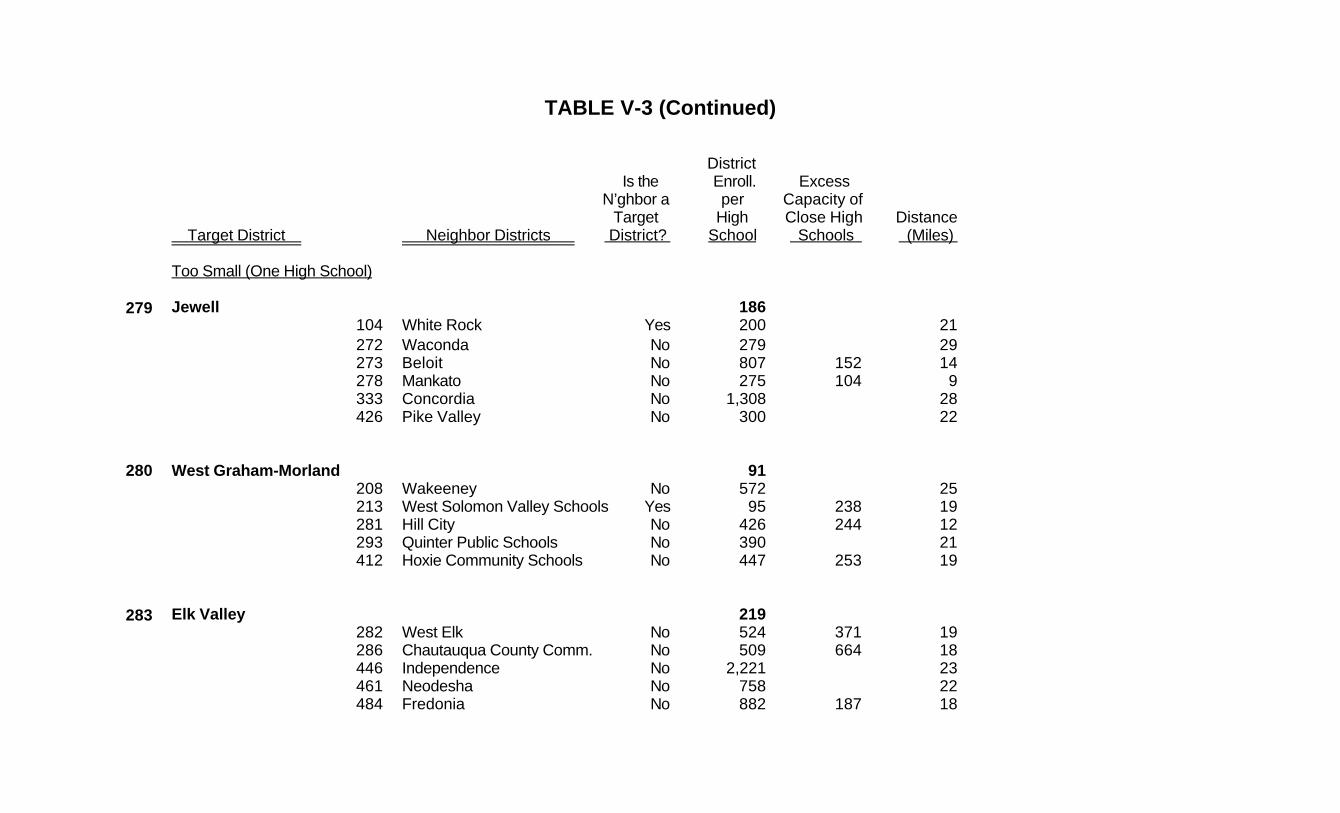
TABLE V-3 (Continued)
DistrictIs the Enroll. Excess
N’ghbor a per Capacity of Target High Close High Distance
Target District Neighbor Districts District? School Schools (Miles)
Too Small (One High School)
279 Jewell 186104 White Rock Yes 200 21272 Waconda No 279 29273 Beloit No 807 152 14278 Mankato No 275 104 9333 Concordia No 1,308 28426 Pike Valley No 300 22
280 West Graham-Morland 91208 Wakeeney No 572 25213 West Solomon Valley Schools Yes 95 238 19281 Hill City No 426 244 12293 Quinter Public Schools No 390 21412 Hoxie Community Schools No 447 253 19
283 Elk Valley 219282 West Elk No 524 371 19286 Chautauqua County Comm. No 509 664 18446 Independence No 2,221 23461 Neodesha No 758 22484 Fredonia No 882 187 18

TABLE V-3 (Continued)
DistrictIs the Enroll. Excess
N’ghbor a per Capacity of Target High Close High Distance
Target District Neighbor Districts District? School Schools (Miles)
Too Small (One High School)
285 Cedar Vale 206282 West Elk No 524 38286 Chauatuqua County Comm. No 509 664 18462 Central No 405 20471 Dexter Yes 201 69 13
291 Grinnell Public Schools 160274 Oakley No 510 182 19292 Wheatland Yes 184 191 18316 Golden Plains Yes 176 43412 Hoxie Community Schools No 447 33
292 Wheatland 184291 Grinnell Public Schools Yes 160 220 18293 Quinter Public Schools No 390 181 13412 Hoxie Community Schools No 447 21468 Healy Public Schools Yes 104 36

TABLE V-3 (Continued)
DistrictIs the Enroll. Excess
N’ghbor a per Capacity of Target High Close High Distance
Target District Neighbor Districts District? School Schools (Miles)
Too Small (One High School)
295 Prairie Heights 92211 Norton Community Schools No 746 23213 West Solomon Valley Schools Yes 95 238 16294 Oberlin No 558 202 16412 Hoxie Community Schools No 447 23
299 Sylvan Grove 205272 Waconda No 279 35273 Beloit No 807 35298 Lincoln No 412 326 13327 Ellsworth No 754 25328 Lorraine No 279 35407 Russell County No 583 26
301 Nes Tre La Go 76208 Wakeeney No 572 31293 Quinter Public Schools No 390 29302 Smoky Hill Yes 161 239 13303 Ness City No 289 281 20482 Dighton No 345 355 20

TABLE V-3 (Continued)
DistrictIs the Enroll. Excess
N’ghbor a per Capacity of Target High Close High Distance
Target District Neighbor Districts District? School Schools (Miles)
Too Small (One High School)
302 Smoky Hill 161208 Wakeeney No 572 27301 Nes Tre La Go Yes 76 64 13303 Ness City No 289 281 12304 Bazine Yes 112 128 19388 Ellis No 368 28395 Lacrosse No 357 35
304 Bazine 112228 Hanston Yes 139 27302 Smoky Hill Yes 161 239 19303 Ness City No 289 281 11395 Lacrosse No 257 22496 Pawnee Heights Yes 159 22
314 Brewster 161103 Cheylin Yes 192 28275 Triplains Yes 93 22315 Colby Public Schools No 1,122 441 18318 Atwood No 435 35352 Goodland No 1,156 811 18

TABLE V-3 (Continued)
DistrictIs the Enroll. Excess
N’ghbor a per Capacity of Target High Close High Distance
Target District Neighbor Districts District? School Schools (Miles)
Too Small (One High School)
316 Golden Plains 176274 Oakley No 510 32291 Grinnell Public Schools Yes 160 43294 Oberlin No 558 27315 Colby Public Schools No 1,122 27317 Herndon Yes 100 30412 Hoxie Community Schools No 447 249 18
317 Herndon 100294 Oberlin No 558 202 14316 Golden Plains Yes 176 30318 Atwood No 435 315 15
324 Eastern Heights 195238 West Smith County Yes 196 191 9271 Stockton No 440 31325 Phillipsburg No 697 199 13392 Osborne County No 496 38
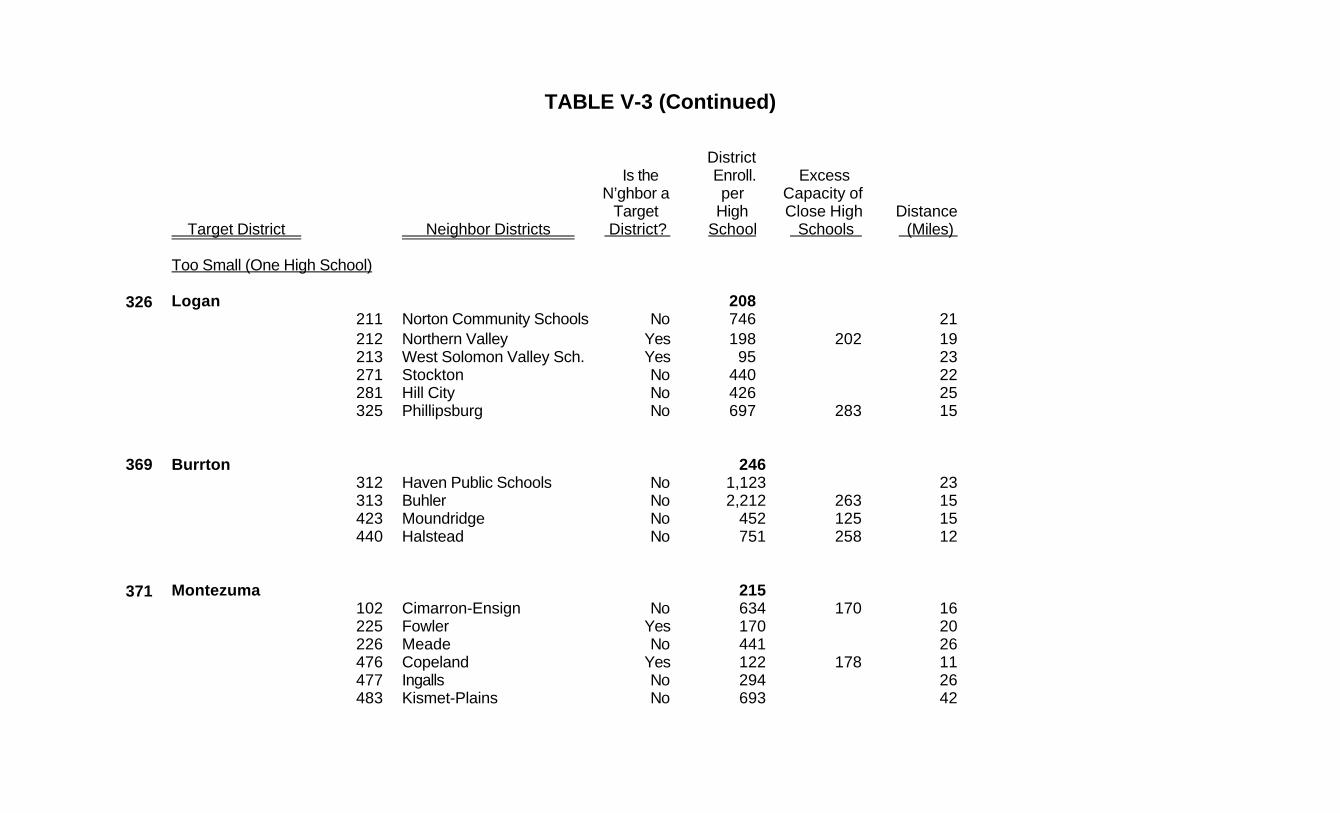
TABLE V-3 (Continued)
DistrictIs the Enroll. Excess
N’ghbor a per Capacity of Target High Close High Distance
Target District Neighbor Districts District? School Schools (Miles)
Too Small (One High School)
326 Logan 208211 Norton Community Schools No 746 21212 Northern Valley Yes 198 202 19213 West Solomon Valley Sch. Yes 95 23271 Stockton No 440 22281 Hill City No 426 25325 Phillipsburg No 697 283 15
369 Burrton 246312 Haven Public Schools No 1,123 23313 Buhler No 2,212 263 15423 Moundridge No 452 125 15440 Halstead No 751 258 12
371 Montezuma 215102 Cimarron-Ensign No 634 170 16225 Fowler Yes 170 20226 Meade No 441 26476 Copeland Yes 122 178 11477 Ingalls No 294 26483 Kismet-Plains No 693 42

TABLE V-3 (Continued)
DistrictIs the Enroll. Excess
N’ghbor a per Capacity of Target High Close High Distance
Target District Neighbor Districts District? School Schools (Miles)
Too Small (One High School)
390 Hamilton 122284 Chase County No 493 28386 Madison-Virgil No 282 330 10389 Eureka No 796 122 12492 Flinthills No 339 26
399 Paradise 154270 Plainville No 453 329 15271 Stockton No 440 22392 Osborne County No 496 24407 Russell County No 583 28432 Victoria No 302 24489 Hays No 3,423 29
401 Chase-Raymond 182310 Fairfield No 448 34328 Lorraine No 279 37349 Stafford No 338 31355 Ellinwood Public Schools No 601 107 12376 Sterling No 532 180 13405 Lyons No 934 403 13
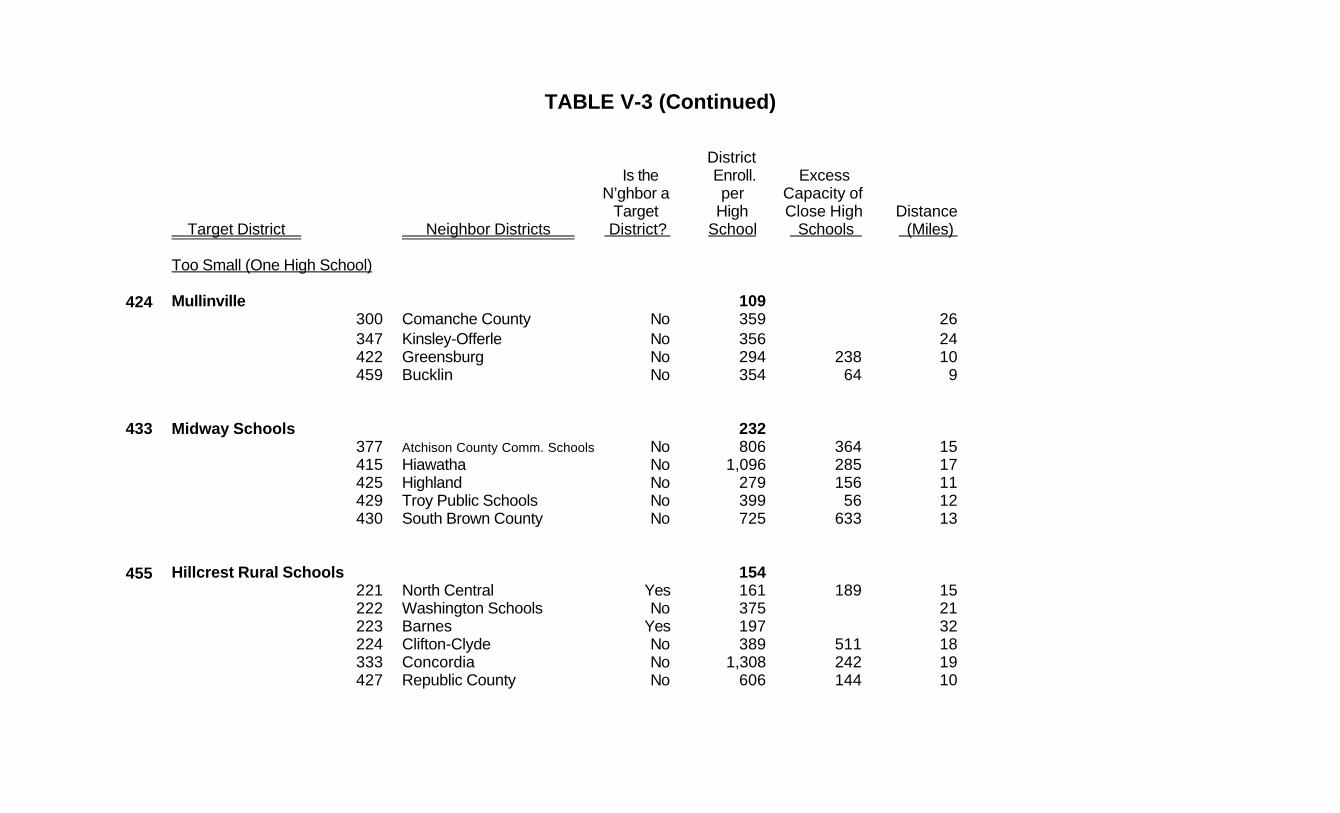
TABLE V-3 (Continued)
DistrictIs the Enroll. Excess
N’ghbor a per Capacity of Target High Close High Distance
Target District Neighbor Districts District? School Schools (Miles)
Too Small (One High School)
424 Mullinville 109300 Comanche County No 359 26347 Kinsley-Offerle No 356 24422 Greensburg No 294 238 10459 Bucklin No 354 64 9
433 Midway Schools 232377 Atchison County Comm. Schools No 806 364 15415 Hiawatha No 1,096 285 17425 Highland No 279 156 11429 Troy Public Schools No 399 56 12430 South Brown County No 725 633 13
455 Hillcrest Rural Schools 154221 North Central Yes 161 189 15222 Washington Schools No 375 21223 Barnes Yes 197 32224 Clifton-Clyde No 389 511 18333 Concordia No 1,308 242 19427 Republic County No 606 144 10

TABLE V-3 (Continued)
DistrictIs the Enroll. Excess
N’ghbor a per Capacity of Target High Close High Distance
Target District Neighbor Districts District? School Schools (Miles)
Too Small (One High School)
468 Healy Public Schools 104274 Oaley No 510 40292 Wheatland Yes 184 36293 Quinter Public Schools No 390 36466 Scott County No 1,121 21482 Dighton No 345 355 9
471 Dexter 201285 Cedar Vale Yes 206 127 13462 Central No 405 346 10465 Winfield No 2,642 955 16470 Arkansas City No 2,858 917 19
474 Haviland 179254 Barber County North No 759 37300 Comanche County No 359 30351 Macksville No 295 30422 Greensburg No 294 206 8438 Skyline Schools No 346 22502 Lewis Yes 191 27

TABLE V-3 (Continued)
DistrictIs the Enroll. Excess
N’ghbor a per Capacity of Target High Close High Distance
Target District Neighbor Districts District? School Schools (Miles)
Too Small (One High School)
476 Copeland 122371 Montezuma Yes 215 29 11374 Sublette No 494 123 12457 Garden City No 7,100 36477 Ingalls No 294 30483 Kismet-Plains No 693 34
496 Pawnee Heights 159228 Hanston Yes 139 126 11304 Bazine Yes 112 22347 Kinsley-Offerle No 356 21395 Lacrosse No 357 27403 Otis-Bison No 336 35495 Ft. Larned No 1,073 30
502 Lewis 191347 Kinsley-Offerle No 356 504 16351 Macksville No 295 292 16422 Greensburg No 294 23424 Mullinville Yes 109 26474 Haviland Yes 179 26495 Ft. Larned No 1,073 27

TABLE V-3 (Continued)
DistrictIs the Enroll. Excess
N’ghbor a per Capacity of Target High Close High Distance
Target District Neighbor Districts District? School Schools (Miles)
Too Small (One High School)
511 Attica 163254 Barber County North No 759 20255 South Barber No 325 28332 Cunningham No 334 30361 Anthony-Harper No 1,079 428 13
Too Small (More than One High School)
223 Barnes 197221 North Central Yes 161 23222 Washington Schools No 375 120 11224 Clifton-Clyde No 389 35364 Marysville No 971 37379 Clay Center No 795 55384 Blue Valley (Riley Co.) No 303 37498 Valley Heights No 514 25
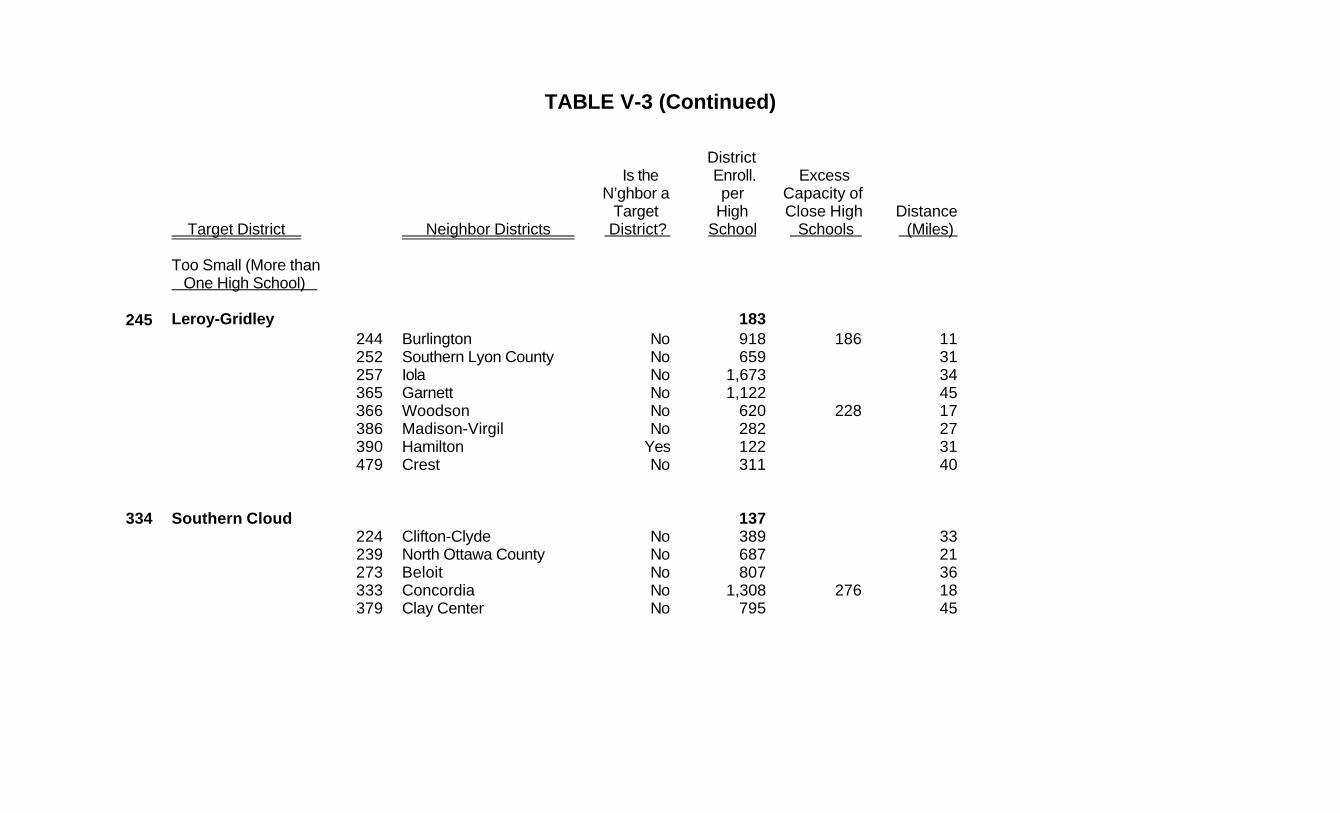
TABLE V-3 (Continued)
DistrictIs the Enroll. Excess
N’ghbor a per Capacity of Target High Close High Distance
Target District Neighbor Districts District? School Schools (Miles)
Too Small (More than One High School)
245 Leroy-Gridley 183244 Burlington No 918 186 11252 Southern Lyon County No 659 31257 Iola No 1,673 34365 Garnett No 1,122 45366 Woodson No 620 228 17386 Madison-Virgil No 282 27390 Hamilton Yes 122 31479 Crest No 311 40
334 Southern Cloud 137224 Clifton-Clyde No 389 33239 North Ottawa County No 687 21273 Beloit No 807 36333 Concordia No 1,308 276 18379 Clay Center No 795 45

TABLE V-3 (Continued)
DistrictIs the Enroll. Excess
N’ghbor a per Capacity of Target High Close High Distance
Target District Neighbor Districts District? School Schools (Miles)
Too Small (More than One High School)
481 Rural Vista 226397 Centre No 307 21410 Durham-Hillsborough-Lehigh No 736 40417 Morris County No 1,036 32473 Chapman No 1,227 33475 Geary County Schools No 6,077 34487 Herington No 571 221 15
488 Axtell 187364 Marysville No 971 36380 Vermillion No 315 30451 B & B No 270 95 13
Too Large
202 Turner-Kansas City 3,641204 Bonner Springs Yes 2,130 295 13232 De Soto No 2,515 588 18500 Kansas City Yes 4,969 7,827 8512 Shawnee Mission Yes 6,059 8,930 12

TABLE V-3 (Continued)
DistrictIs the Enroll. Excess
N’ghbor a per Capacity of Target High Close High Distance
Target District Neighbor Districts District? School Schools (Miles)
Too Large
229 Blue Valley (Johnson Co.) 5,140230 Spring Hill No 1,354 289 16233 Olathe Yes 6,209 11,817 16416 Louisburg No 1,303 22512 Shawnee Mission P.S. Yes 6,059 8,930 19
233 Olathe 6,209229 Blue Valley Yes 5,140 4,163 16230 Spring Hill No 1,354 289 13231 Gardner-Edgerton-Antioch No 2,384 265 18232 De Soto No 2,515 588 15512 Shawnee Mission P.S. Yes 6,059 8,930 17
253 Emporia 4,570251 North Lyon County No 716 134 18252 Southern Lyon County No 329 471 17284 Chase County No 493 332 20

TABLE V-3 (Continued)
DistrictIs the Enroll. Excess
N’ghbor a per Capacity of Target High Close High Distance
Target District Neighbor Districts District? School Schools (Miles)
Too Large
260 Derby 6,673259 Wichita Yes 6,418 10,352 18261 Haysville Yes 4,198 442 10263 Mulvane No 1,938 462 11394 Rose hill Public Schools No 1,755 170 9
261 Haysville (Not evaluated due to large alternative school)
265 Goddard 3,260259 Wichita Yes 6,418 21261 Haysville Yes 4,198 442 15264 Clearwater No 1,145 177 11266 Maize Yes 4,895 995 11267 Renwick No 904 1,696 10
266 Maize 4,895259 Wichita Yes 6,418 10,352 17262 Valley Center P.S. No 2,303 763 7265 Goddard Yes 3,260 1,115 10267 Renwick No 904 1,696 15440 Halstead No 751 256 17
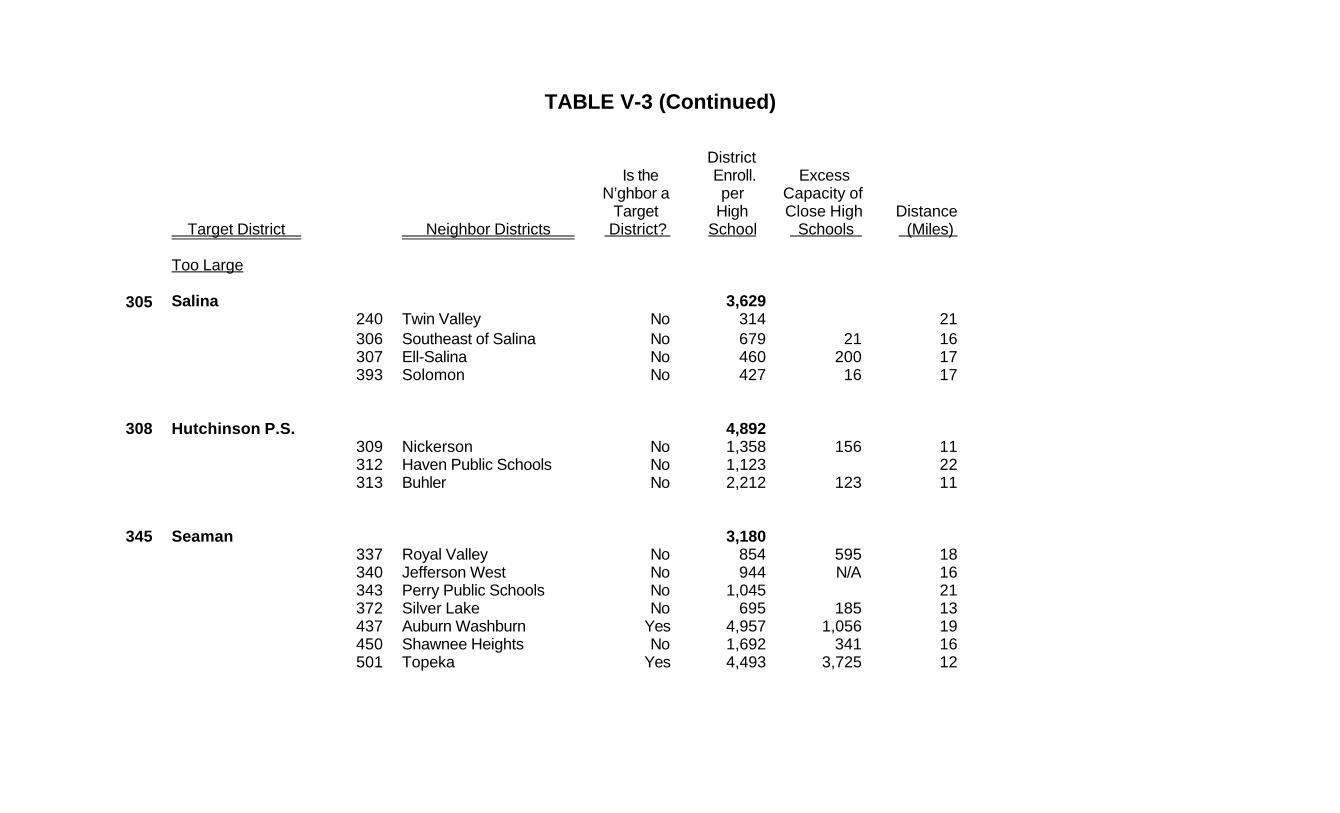
TABLE V-3 (Continued)
DistrictIs the Enroll. Excess
N’ghbor a per Capacity of Target High Close High Distance
Target District Neighbor Districts District? School Schools (Miles)
Too Large
305 Salina 3,629240 Twin Valley No 314 21306 Southeast of Salina No 679 21 16307 Ell-Salina No 460 200 17393 Solomon No 427 16 17
308 Hutchinson P.S. 4,892309 Nickerson No 1,358 156 11312 Haven Public Schools No 1,123 22313 Buhler No 2,212 123 11
345 Seaman 3,180337 Royal Valley No 854 595 18340 Jefferson West No 944 N/A 16343 Perry Public Schools No 1,045 21372 Silver Lake No 695 185 13437 Auburn Washburn Yes 4,957 1,056 19450 Shawnee Heights No 1,692 341 16501 Topeka Yes 4,493 3,725 12
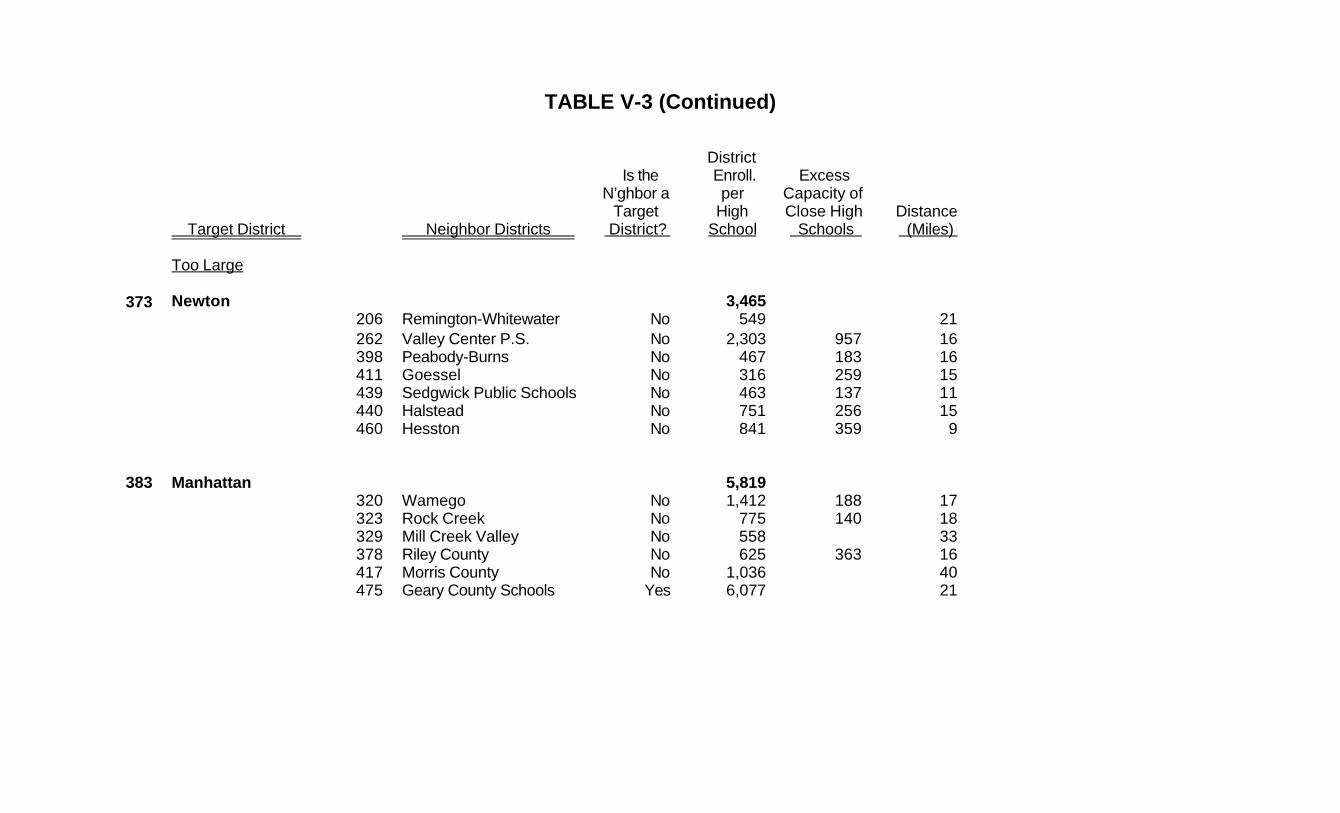
TABLE V-3 (Continued)
DistrictIs the Enroll. Excess
N’ghbor a per Capacity of Target High Close High Distance
Target District Neighbor Districts District? School Schools (Miles)
Too Large
373 Newton 3,465206 Remington-Whitewater No 549 21262 Valley Center P.S. No 2,303 957 16398 Peabody-Burns No 467 183 16411 Goessel No 316 259 15439 Sedgwick Public Schools No 463 137 11440 Halstead No 751 256 15460 Hesston No 841 359 9
383 Manhattan 5,819320 Wamego No 1,412 188 17323 Rock Creek No 775 140 18329 Mill Creek Valley No 558 33378 Riley County No 625 363 16417 Morris County No 1,036 40475 Geary County Schools Yes 6,077 21

TABLE V-3 (Continued)
DistrictIs the Enroll. Excess
N’ghbor a per Capacity of Target High Close High Distance
Target District Neighbor Districts District? School Schools (Miles)
Too Large
428 Great Bend350 St. John-Hudson No 444 26351 Macksville No 295 31354 Claflin ` No 325 175 19355 Ellinwood Public Schools No 601 99 13403 Otis-Bison No 336 21431 Hoisington No 744 146 11495 Ft. Larned No 1,073 23
437 Auburn Washburn 4,957321 Kaw Valley No 534 32330 Wabaunsee East No 636 23372 Silver Lake No 695 185 14434 Santa Fe Trail No 1,318 22450 Shawnee Heights No 1,692 341 16454 Burlingame Public Schools No 365 21501 Topeka Public Schools Yes 4,493 3,725 15

TABLE V-3 (Continued)
DistrictIs the Enroll. Excess
N’ghbor a per Capacity of Target High Close High Distance
Target District Neighbor Districts District? School Schools (Miles)
Too Large
443 Dodge City 4,917102 Cimarron-Ensign No 634 24219 Minneola No 278 24227 Jetmore No 332 25381 Spearville No 362 338 18459 Bucklin No 354 26
453 Leavenworth 4,041207 Ft. Leavenworth No -- -- 5449 Easton No 704 0 12469 Lansing No 1,913 16 6
457 Garden City 7,100102 Cimarron-Ensign No 634 32216 Deerfield No 375 285 19363 Holcomb No 870 680 14374 Sublette No 494 38466 Scott County No 1,121 46476 Copeland Yes 122 36477 Ingalls No 294 23482 Dighton No 345 51507 Satanta No 438 42

TABLE V-3 (Continued)
DistrictIs the Enroll. Excess
N’ghbor a per Capacity of Target High Close High Distance
Target District Neighbor Districts District? School Schools (Miles)
Too Large
475 Geary County Schools 6,077378 Riley County No 625 363 20379 Clay Center No 795 37383 Manhattan Yes 5,819 21417 Morris County No 1,036 42473 Chapman No 1,227 27481 Rural Vista Yes 226 35
480 Liberal 4,050209 Moscow Public Schools Yes 192 26210 Hugoton Public Schools No 956 26483 Kismet-Plains No 693 24
489 Hays 3,423269 Palco Yes 179 40270 Plainville No 453 28388 Ellis No 368 182 17395 Lacrosse No 357 26399 Paradise Yes 154 29403 Otis-Bison No 336 28432 Victoria No 302 463 11

TABLE V-3 (Continued)
DistrictIs the Enroll. Excess
N’ghbor a per Capacity of Target High Close High Distance
Target District Neighbor Districts District? School Schools (Miles)
Too Large
497 Lawrence 5,008342 McLouth No 577 21343 Perry Public Schools No 1,045 235 14348 Baldwin City No 1,241 229 17434 Santa Fe Trail No 1,318 33450 Shawnee Heights No 1,692 23464 Tonganoxie No 1,467 33 19491 Eudora No 1,100 170 12
500 Kansas City 4,969202 Turner-Kansas City Yes 3,641 259 8203 Piper-Kansas City No 1,282 643 15204 Bonner Springs Yes 2,130 295 16
501 Topeka P.S. 4,493345 Seaman Yes 3,180 2,040 12372 Silver Lake No 695 185 13437 Auburn Washburn Yes 4,957 1,056 15450 Shawnee Heights No 1,692 341 10
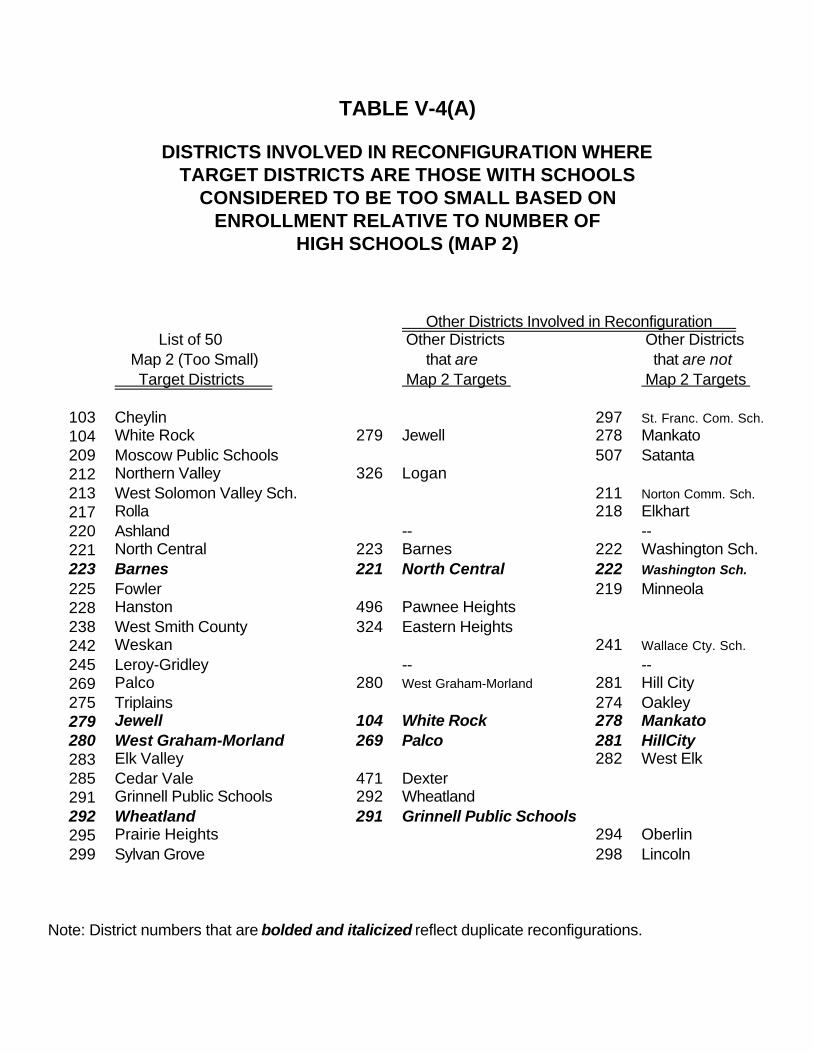
TABLE V-4(A)
DISTRICTS INVOLVED IN RECONFIGURATION WHERETARGET DISTRICTS ARE THOSE WITH SCHOOLS
CONSIDERED TO BE TOO SMALL BASED ONENROLLMENT RELATIVE TO NUMBER OF
HIGH SCHOOLS (MAP 2)
Other Districts Involved in Reconfiguration List of 50 Other Districts Other Districts
Map 2 (Too Small) that are that are not Target Districts Map 2 Targets Map 2 Targets
103 Cheylin 297 St. Franc. Com. Sch.104 White Rock 279 Jewell 278 Mankato209 Moscow Public Schools 507 Satanta212 Northern Valley 326 Logan213 West Solomon Valley Sch. 211 Norton Comm. Sch.217 Rolla 218 Elkhart220 Ashland -- --221 North Central 223 Barnes 222 Washington Sch.223 Barnes 221 North Central 222 Washington Sch.
225 Fowler 219 Minneola228 Hanston 496 Pawnee Heights238 West Smith County 324 Eastern Heights242 Weskan 241 Wallace Cty. Sch.245 Leroy-Gridley -- --269 Palco 280 West Graham-Morland 281 Hill City275 Triplains 274 Oakley279 Jewell 104 White Rock 278 Mankato280 West Graham-Morland 269 Palco 281 HillCity283 Elk Valley 282 West Elk285 Cedar Vale 471 Dexter291 Grinnell Public Schools 292 Wheatland292 Wheatland 291 Grinnell Public Schools295 Prairie Heights 294 Oberlin299 Sylvan Grove 298 Lincoln
Note: District numbers that are bolded and italicized reflect duplicate reconfigurations.

TABLE V-4(A) (Continued)
Other Districts Involved in Reconfiguration List of 50 Other Districts Other Districts
Map 2 (Too Small) that are that are not Target Districts Map 2 Targets Map 2 Targets
301 Nes Tre La Go 302 Smoky Hill 303 Ness City
304 Bazine302 Smoky Hill 301 Nes Tre La Go 303 Ness City
304 Bazine304 Bazine 301 Nes Tre La Go 303 Ness City
302 Smoky Hill314 Brewster 315 Colby Public
Schools316 Golden Plains 412 Hoxie Com. Sch.317 Herndon 318 Atwood324 Eastern Heights 238 West Smith County326 Logan 212 Northern Valley334 Southern Cloud -- --369 Burrton 440 Halstead371 Montezuma 102 Cimarron-Ensign390 Hamilton 386 Madison-Virgil399 Paradise 270 Plainville401 Chase-Raymond 405 Lyons424 Mullinville 474 Haviland 422 Greensburg433 Midway Schools 430 South Brown Cty.455 Hillcrest Rural Schools 427 Republic County468 Healy Public Schools 482 Dighton471 Dexter 285 Cedar Vale474 Haviland 424 Mullinville 422 Greensburg476 Copeland 374 Sublette481 Rural Vista -- --488 Axtell -- --496 Pawnee Heights 228 Hanston502 Lewis 347 Kinsley-Offerle511 Attica 361 Anthony-Harper
Note: District numbers that are bolded and italicized reflect duplicate reconfigurations.

TABLE V-4(A) (Continued)
Summary of Reconfiguration
1. There are 50 target districts that have schools considered to be too small.
2. We looked at all neighbor districts of those 50 districts and were able to reconfigure 45 of themtaking into consideration the capacity of schools, projected enrollment, and distance from a targetdistrict.
3. It takes 34 unduplicated reconfigurations to address the needs of those 45 districts.
4. Of these reconfigurations, 29 involve two-district mergers, four involve three-district mergers, andone involves a four-district merger.

TABLE V-4(B)
DISTRICTS INVOLVED IN RECONFIGURATION WHERETARGET DISTRICTS ARE THOSE WITH SCHOOLS
CONSIDERED TO BE TOO LARGE BASED ONENROLLMENT RELATIVE TO NUMBER OF HIGH
SCHOOLS OR WHERE THE DISTRICT ITSELFIS CONSIDERED TO BE TOO LARGE (MAP 2)
Other Districts Involved in Reconfiguration List of 24 Map 2 Other Districts Other Districts Target Districts with that are that are notSchools that are Too Large Map 2 Targets Map 2 Targets
202 Turner-Kansas City -- --229 Blue Valley -- --233 Olathe -- --253 Emporia -- --260 Derby -- --261 Haysville -- --265 Goddard 266 Maize 267 Renwick266 Maize 265 Goddard 267 Renwick305 Salina -- --308 Hutchinson Public Schools 309 Nickerson
313 Buhler345 Seaman -- --373 Newton -- --383 Manhattan -- --428 Great Bend -- --437 Auburn Washburn -- --443 Dodge City 381 Spearville453 Leavenworth -- --457 Garden City 216 Deerfield
363 Holcomb475 Geary County Schools 378 Riley County480 Liberal -- --489 Hays -- --497 Lawrence -- --500 Kansas City -- --501 Topeka Public Schools -- --
Note: District numbers that are bolded and italicized reflect duplicate reconfigurations
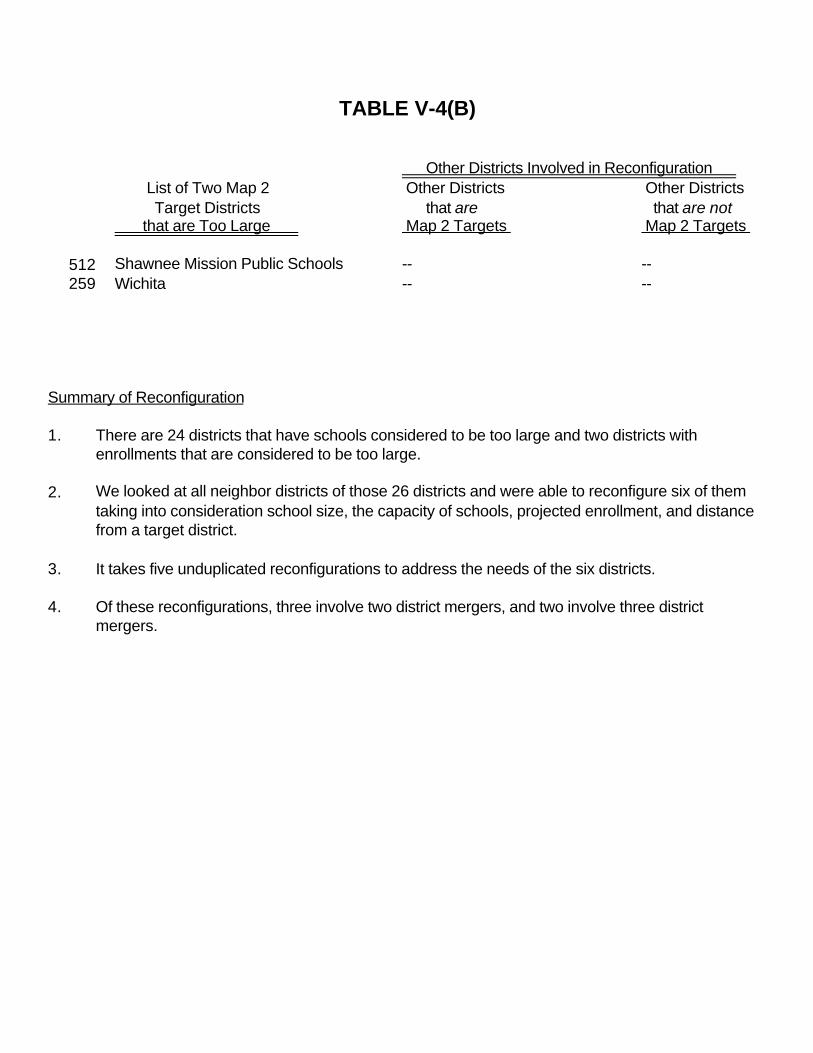
TABLE V-4(B)
Other Districts Involved in Reconfiguration List of Two Map 2 Other Districts Other Districts Target Districts that are that are not that are Too Large Map 2 Targets Map 2 Targets
512 Shawnee Mission Public Schools -- --259 Wichita -- --
Summary of Reconfiguration
1. There are 24 districts that have schools considered to be too large and two districts withenrollments that are considered to be too large.
2. We looked at all neighbor districts of those 26 districts and were able to reconfigure six of themtaking into consideration school size, the capacity of schools, projected enrollment, and distancefrom a target district.
3. It takes five unduplicated reconfigurations to address the needs of the six districts.
4. Of these reconfigurations, three involve two district mergers, and two involve three districtmergers.

TABLE V-5
DISTRICTS INVOLVED IN RECONFIGURATION WHERETARGET DISTRICTS ARE THOSE IDENTIFIED IN MAP 1
AND MAP 2 AND SOME ISSUES THAT AROSE INMAKING THOSE MAPS ARE RESOLVED (MAP 3)
Districts Involved in Reconfiguration Other Districts Other Districts List of Map 3 Target Districts that are Map 1 that are not Map 1 by Rationale for Selection or Map 2 Targets or Map 2 Targets
Rationale “A”
275 Triplains (1B, 2A) 274 Oakley
283 Elk Valley (1B, 2A) 282 West Elk
285 Cedar Vale (1B, 2A) 471 Dexter (2A)
317 Herndon (1B, 2A) 318 Atwood
401 Chase-Raymond (1A, 2A) 405 Lyons
455 Hillcrest Rural Schools (1A, 2A) 427 Republic County
.
Rationale “B”
202 Turner-Kansas City (1C, 2B) 500 Kansas City (2B)
209 Moscow Public Schools (1A, 2A) 210 Hugoton P.S.
213 West Solomon Valley P.S. (1A, 2A) 211 Norton Comm.Schools
225 Fowler (1B, 2A) 226 Meade
228 Hanston (1A, 2A) 227 Jetmore
301 Nes Tre La Go (1A, 2A) 302 Smoky Hill (2A) 303 Ness City304 Bazine (2A)
324 Eastern Heights (1B, 2A) 238 West Smith County (2A)

TABLE V-5 (Continued)
Districts Involved in Reconfiguration Other Districts Other Districts List of Map 3 Target Districts that are Map 1 that are not Map 1 by Rationale for Selection or Map 2 Targets or Map 2 Targets
Rationale “C”
218 Elkhart (1A) 217 Rolla (2A)
222 Washington Schools (1A) 221 North Central (2A)223 Barnes (2A)
278 Mankato (1C) 104 White Rock (2A)279 Jewell (2A)
358 Oxford (1C) 509 South Haven (1C) 353 Wellington
386 Madison-Virgil (1C) 390 Hamilton (2A)
Rationale “D”
204 Bonner Springs (1C) 203 Piper-Kansas City
344 Pleasanton (1C) 346 Jayhawk
357 Belle Plaine (1A) 263 Mulvane
360 Caldwell (1C) 359 Argonia P.S.
364 Marysville (1C) 498 Valley Heights
406 Wathena (1B) 486 Elwood
461 Neodesha (1C) 387 Altoona-Midway
463 Udall (1A) 465 Winfield
505 Chetopa (1B) 504 Oswego

TABLE V-5 (Continued)
Districts Involved in Reconfiguration Other Districts Other Districts List of Map 3 Target Districts that are Map 1 that are not Map 1 by Rationale for Selection or Map 2 Targets or Map 2 Targets
Rationale “E”
103 Cheylin (2A) 297 St. Francis Comm.Schools
242 Weskan (2A) 241 Wallace Co. Schools
280 West Graham-Morland (2A) 281 Hill City
295 Prairie Heights (2A) 294 Oberlin
369 Burrton (2A) 440 Halstead
424 Mullinville (2A) 422 Greensburg
468 Healy Public Schools (2A) 482 Dighton
476 Copeland (2A) 371 Montezuma (2A)
511 Attica (2A) 361 Anthony-Harper
Rationale “F”
245 Leroy-Gridley (2A) 244 Burlington
334 Southern Cloud (2A) 333 Concordia
481 Rural Vista (2A) 487 Herington
488 Axtell (2A) 451 B & B
Rationale “G”
308 Hutchinson Public Schools (2B) 309 Nickerson313 Buhler
443 Dodge City (2B) 381 Spearville
475 Geary County Schools (2B) 378 Riley County

TABLE V-5 (Continued)
Districts Involved in Reconfiguration Other Districts Other Districts List of Map 3 Target Districts that are Map 1 that are not Map 1 by Rationale for Selection or Map 2 Targets or Map 2 Targets
Rationale “H”
229 Blue Valley (2B) -- --
233 Olathe (2B) -- --
253 Emporia (2B) -- --
260 Derby (2B) -- --
261 Haysville (2B) -- --
265 Goddard (2B) -- --
266 Maize (2B) -- --
305 Salina (2B) -- --
345 Seaman (2B) -- --
373 Newton (2B) -- --
383 Manhattan (2B) -- --
428 Great Bend (2B) -- --
437 Auburn Washburn (2B) -- --
453 Leavenworth (2B) -- --
457 Garden City (2B) -- --
480 Liberal (2B) -- --
489 Hays (2B) -- --
497 Lawrence (2B) -- --
501 Topeka Public Schools (2B) -- --

TABLE V-5 (Continued)
Districts Involved in Reconfiguration Other Districts Other Districts List of Map 3 Target Districts that are Map 1 that are not Map 1 by Rationale for Selection or Map 2 Targets or Map 2 Targets
Rationale “I”
259 Wichita (2B) -- --
512 Shawnee Mission (2B) -- --
Note: Numbers in parentheses (X) indicate the specific reason for which a district is a target district inMap 3. All target districts in Map 3 are target districts in Map 1 or Map 2. In the case of Map 1,three different criteria are used to identify target districts (1A, 1B, or 1C) — see Table V-2 for alist of the districts that meet those criteria. In the case of Map 2, districts meet criteria related tobeing too small (2A) or too large (2B) — see Table V-4(A) and Table V-4(B) for lists of districtsthat meet those criteria.
Summary of Reconfiguration
1. All 28 of the Map 1 target districts are included in Map 3.
2. 36 of the 50 Map 2 target districts (too small) are included in Map 3.
3. 26 of the 26 Map 2 target districts (too large) are included in Map 3.
4. Of the 64 districts that meet Map 1 or Map 2 (too small) criteria, there are 12 districts that areduplicates; the 52 unduplicated districts (64 - 12) are all involved in multi-district reconfigurations inMap 3.
5. Of the 26 districts that meet Map 2 (too large) criteria, only five are involved in multi-districtreconfigurations and one of those is a duplicate from Map 1; therefore only four districts (5 - 1) areinvolved in unduplicated reconfigurations in Map 3.
6. Therefore, there are 56 unduplicated districts (52 + 4) that are target districts in Map 1 or Map 2that are involved in multi-district reconfigurations in Map 3.
7. In addition, 36 other districts that are not target districts in Map 1 or Map 2 are involved in multi-district reconfigurations in Map 3.
8. The 92 districts (56 + 36) reconfigured in Map 3 result in 43 new districts, of which 38 are two-district mergers, four are three-district mergers, and one is a four-district merger.

TABLE V-6
NUMBERS OF DISTRICTS THAT ARE RECONFIGUREDIN ASSOCIATION WITH MAP 1, MAP 2, AND MAP 3
(1) (2) (3) (4) (5) (6) (7) Number of Number of Number of Number of Unduplicated Total Number
Districts that Districts that Other Districts Reconfigurations of Districts Number of A&M Does Meet Criteria that Are In- Number of Based on the Number in the State
Districts that Not Recon- and Are Re- volved in Re- New Districts of Districts Merged After Recon-Meet Criteria figure configured configuration Created 2 3 4 5 figuration
MAP MAP 1 28 8 20 22 20 20 0 0 0 284
MAP 2Too Small 50 5 45 29 34 29 4 1 0 —
Too Large 26 20 6 7 5 2 3 0 0 —
Map 2 Total 76 25 51 36 39 31 7 1 0 256
MAP 3Mergers 56 0 56 36 43 38 4 1 0 —
Within DistrictChanges 21 0 21 0 21 21 0 0 0 —
Map 3 Total 77 0 77 36 64 59 4 1 0 255
Note: Figures in column (3) = column (1) - column (2); figures in columns under column (6) sum to the figures in column (5); and
figures in column (7) = 304 - column (3) - column (4) + column (5).

297
352
241242
200
314
103
467
275
317
318
315
482466
468
274292
291
316
294
412
303
301
293
295
211
213
280
302
208
304
326
281
489
395
388
452
494
217
218
214
210
209
215 216 363
507
480
374476
483
457
477
226
371
225
443102
227
381
220
219
459
496
228
347
212
271
269 270
432
403
424 422
300
474
502
495
351
399
392
254
438
350
428 355
431
407
354
324325 237238 426
382
255
332
401
349
272
104
327
328
298299
310
311
308
331
361511
309376
405
279
273
278
333
427
334
418444
313
448
312369
400
307
239
240
305
359
356
360
267
268
455
393
306
379
224
435
481
221 222
223
473
487
475
378
384
498
364
417
323
383
380
488
442
451
329
330
321320
322335
440
423
264
261
265
266259
509
357
353
411
419 410
460
439
262
373
263
260
206
358
470
465
385
463
375
402394
396
397
408
398
490
205
462
284
492
471 285
390
282
389
386
253
251
252
286
283
436
484
245
387
366
456
244
243
447446
461
445
420
454
372
434
437
421
415
430
441
340
336
337
450
501
345
338
377
339
290
287
342341
343
497
348
425
433429
491
231
232
464
469
458
289368
409
406
449
207
453
486
203
204
512
233
230
416
229
202500
365
479
413
101
258
256
257
506
505
504
367288
503
493
247
235
248
346344
362
234
246
508
499
404
250
249
MAP 1 Legend
TYPE "A" MERGED (7)TYPE "A" NOT MERGED (4)TYPE "B" MERGED (7)TYPE "B" NOT MERGED (1)TYPE "C" MERGED (6)TYPE "C" NOT MERGED (3)all others (256)
MAP 1

297
352
241242
200
314
103
467
275
317
318
315
482466
468
274292
291
316
294
412
303
301
293
295
211
213
280
302
208
304
326
281
489
395
388
452
494
217
218
214
210
209
215 216 363
507
480
374476
483
457
477
226
371
225
443102
227
381
220
219
459
496
228
347
212
271
269270
432
403
424 422
300
474
502
495
351
399
392
254
438
350
428 355
431
407
354
324325 237238 426
382
255
332
401
349
272
104
327
328
298299
310
311
308
331
361511
309376
405
279
273
278
333
427
334
418444
313
448
312369
400
307
239
240
305
359
356
360
267
268
455
393
306
379
224
435
481
221 222
223
473
487
475
378
384
498
364
417
323
383
380
488
442
451
329
330
321320
322335
440
423
264
261
265
266259
509
357
353
411
419 410
460
439
262
373
263
260
206
358
470
465
385
463
375
402394
396
397
408
398
490
205
462
284
492
471 285
390
282
389
386
253
251
252
286
283
436
484
245
387
366
456
244
243
447446
461
445
420
454
372
434
437
421
415
430
441
340
336
337
450501
345
338
377
339
290
287
342341
343
497
348
425
433429
491
231
232
464
469
458
289368
409
406
449
207
453
486
203
204
512
233
230
416
229
202500
365
479
413
101
258
256
257
506
505
504
367288
503
493
247
235
248
346344
362
234
246
508
499
404
250
249
MAP 2 Legend
TOO LARGE DISTRICT (2)LARGE H.S. NOT MERGED (18)LARGE H.S. MERGED (5)SMALL H.S. NOT MERGED (5)SMALL H.S. MERGED (34)all others (192)
MAP 2

297
352
241242
200
314
103
467
275
317
318
315
482466
468
274292
291
316
294
412
303
301
293
295
211
213
280
302
208
304
326
281
489
395
388
452
494
217
218
214
210
209
215 216 363
507
480
374476
483
457
477
226
371
225
443102
227
381
220
219
459
496
228
347
212
271
269 270
432
403
424 422
300
474
502
495
351
399
392
254
438
350
428 355
431
407
354
324325 237238 426
382
255
332
401
349
272
104
327
328
298299
310
311
308
331
361511
309376
405
279
273
278
333
427
334
418444
313
448
312369
400
307
239
240
305
359
356
360
267
268
455
393
306
379
224
435
481
221 222
223
473
487
475
378
384
498
364
417
323
383
380
488
442
451
329
330
321320
322335
440
423
264
261
265
266259
509
357
353
411
419 410
460
439
262
373
263
260
206
358
470
465
385
463
375
402394
396
397
408
398
490
205
462
284
492
471 285
390
282
389
386
253
251
252
286
283
436
484
245
387
366
456
244
243
447446
461
445
420
454
372
434
437
421
415
430
441
340
336
337
450501
345
338
377
339
290
287
342341
343
497
348
425
433429
491
231
232
464
469
458
289368
409
406
449
207
453
486
203
204
512
233
230
416
229
202500
365
479
413
101
258
256
257
506
505
504
367288
503
493
247
235
248
346344
362
234
246
508
499
404
250
249
MAP 3 Legend
RATIONALE "A" (6)RATIONALE "B" (7)RATIONALE "C" (5)RATIONALE "D" (9)RATIONALE "E" (9)RATIONALE "F" (4)RATIONALE "G" (3)RATIONALE "H" (19)RATIONALE "I" (2)all others (191)
MAP 3

VI-1
Chapter VI
RECOMMENDATIONS FOR STATUTORY CHANGES
Current Statutes
An essential component in analyzing the process of school district boundary changes is the Kansas State Statutes. Kansas Statutes found in Chapter 72, Article 71, Sections 72-7101 through 72-7110, discuss the transfer of school district territory, and Article 73, Section 72-7301 through 72-7307, address the disorganization of school districts. Most of the statutes in these two articles are over 20 years old, with almost half of the statutes being more than 30 years old. In fact, only three statutes were amended in the 1980s and one statute was amended in 1999.
The statutes address three general areas: election concerns, taxation issues, indebtedness and actual processes for transferring or disorganizing a district. For this summary, the focus is solely on the statutes that deal with transferring territory or disorganizing a district. The following points are important to the discussion of boundary changes: • On the effective date of any transfer, the school district receiving the transfer
assumes the right to all school buildings and furnishings. (7104) • On the effective date of any transfer, the school district receiving the transfer
assumes payment of the unpaid bonded indebtedness that incurred prior to the transfer, except the giving district will be solely liable for the principal and interest payments on binds which are due or may become due on or before December 1 following the effective date of the transfer. (7104)
• The giving district will have to make payments to the receiving district in order to
defray the costs of the transfer. (7105a) • Transfer of territory can only occur under the following circumstances (7108):
• Upon written agreement of any two boards and that is approved by the state board of education.
• Upon order of the state board of education after the petition by one board and
a public hearing conducted by the state board of education. • The effective date of any such transfer shall be the date of approval or the
following July 1.

VI-2
• If a public hearing is necessary, notice will be given for two consecutive weeks in a local newspaper in the district from which the territory is to be transferred. The notice must circulate at least 10 days prior and not less than three days prior to the hearing. The time and place must be clearly stated in the notice along with a summary of the transfer proposal.
• Within 90 days of receiving the petition or after the hearing, the state board of
education will issue an order approving or not approving the transfer. • If the petition is denied, there is a two-year waiting period before another
petition can be made to the state board of education.
• A school district can be disorganized under the following circumstances (7301):
• Upon petition of the board of education of a school district for disorganization and attachment of that district to another territory to the state board of education.
• The state board of education will consider disorganization if it finds that there
is only one high school in the district and it cannot meet the 30 unit minimum accreditation requirement, or if it finds that the district fails to meet the minimum requirements for the establishment of a district. The disorganization must also improve the educational system of the state and the area in which it is taking place.
• The effective date of any disorganization will be by order of the state board of
education, usually July 1.
• Voters can petition for a disorganization of a district. The petition must be filed with the county election officer and no election can occur between January 1 and July 1 of any year. (7302)
• There is a two-year waiting period between petitions. • All disorganizations are effective on July 1.
• The following procedures are required for the disorganization of one district and its attachment to one or more other districts (7304 and 7305):
• An election will be held in the school district proposed to be disorganized. • The election proposal will include the specific concerns regarding the
disorganization and attachment, including information on indebtedness.
VI-3
• If the vote passes, the county clerk certifies this to the board(s) of education of the district(s) to which the territory is to be attached and the board of the district to be disorganized, and to the state board of education.
• The board of education of the district which will have territory attached has 30
days to approve or reject the proposal. They then give the acceptance or rejection to the state board of education.
• The state board of education then has 30 days to issue an order in
accordance with the resolution for disorganization and attachment. • All disorganizations under this section will be effective on July 1 following the
election approving the disorganization. • For taxation purposes, the territory is transferred on Dec. 31 preceding the
July 1. • On July 1 the property, records, and all funds, on hand or to be collected, of
the disorganized district will be given to the receiving district.
The above points illustrate the detailed procedures required by the state regarding the transfer and consolidation of school district territory. It is important to remember that there are numerous other statutes included in Chapter 72, Articles 71 and 73 that are concerned with taxation and indebtedness issues. Within these other statutes there are more complicated and detailed requirements for transferring territory or changing school district boundaries. Recommendations
In order to meet the recommendations of this study, statutory changes will be needed. The review of some of the important relevant statutes above suggests places that will need to be amended. The laws that were used in the 1960's to unify school districts were repealed. Article 67 of Chapter 72 created a process for the entire state that involved planning boards and county superintendents of education in the drawing of school district boundaries. A&M would recommend a similar process for targeted school districts based on the identification of certain school districts that are not effective or efficient.
In the 1960's the County Superintendent helped facilitate the unification and consolidation process. The County Superintendent position no longer exists in Kansas. We recommend that the legislature delegate to the State Board of Education powers to change school district boundaries in a more direct way than currently exists in the statutes cited above. The planning for school district change would primarily be a function of the State Board of Education working with local school districts as described below.

VI-4
This study has shown the need for three levels of state involvement in the school
district boundary issue. We recommend that new statutes be adopted to create three different levels of state involvement: (1) Emergency school district dissolution, (2) Required boundary change planning, and, (3) Review of boundary options.
Emergency dissolution
The first recommendation for state involvement would be for the small number of districts that are very small and declining in size. For these districts we would recommend that the legislature set two enrollment levels such as: (1) less than 80 students on September 20, 2000 and (2) less than 100 on September 20, 2001.
All school boards that are declining in enrollment and less that 80 students on
September 20, 2000, would be required to hold a public hearing concerning the dissolution of the district by July 1, 2001. The school board shall report the recommendations for dissolution that came from the public hearing to the State Board of Education. We recommend that the legislature require the State Board of Education to take action by August 15, 2001, in prescribing the reorganization of the identified school districts in the manner proposed by the local school board or in any manner the State Board shall amend the recommendation for dissolution. (This action is needed because of a compelling need in certain districts. It will require swift action by the legislature, school boards, and the State Board of Education).
We recommend a similar process for districts with declining enrollments and less
than 100 students on September 20, 2001. Those school districts would be required to hold a public hearing on possible options for dissolution of the district by December 15, 2001. The school board report on recommendations from the public hearing would be due so the State Board of Education could take action by February 28, 2002, with the effect of the action implemented by July 1, 2002. The legislature may wish to follow this schedule annually for any districts that meet these criteria in the future.
Required Boundary Change Planning
We recommend that the legislature delegate to the State Board of Education the responsibly for oversight of a boundary change planning process for all school districts identified as target districts on map one that were not in the emergency dissolution group. The process could extend over a three-year period of time. During that period the school district could work to change from a high spending, low performing district to a district that no longer met the target levels. During this effort, the district would be required to work with neighboring districts to find a possible voluntary boundary change that could assist with the possible change. Maps 1, 2, and 3 provide some options for consideration. If the school district has improved student performance and reduced per pupil spending, a plan to continue to address those issues would not require a plan for
VI-5
dissolution. At the end of the three years, if the districts is still a target and no voluntary boundary change has been made, we recommend that the State Board require that a hearing for dissolution be held, a report be made to the State Board, and the State Board shall accept or modify the dissolution plan.
Review of Boundary Options We recommend that all districts identified as target districts on Map 2 be asked to follow the same procedure as the required boundary change planning districts, without the final requirement of emergency dissolution. The State Board of Education would encourage school districts and their neighbors to identify possible changes in school district and school size that would remove the districts from the group of target districts. The legislature should make it clear that the State Board of Education has the authority to take action in changing school district boundaries if a district or a group of districts submits a request for change.
Other Statutory Issues The 1999 Legislature provided that any school district formed by consolidation will be entitled to state financial aid equal to the amount of former districts for two years. We recommend that elimination of fiscal disincentive be granted for a longer period of time: 3-5 years. In light of the number of new districts that are likely to be created with this new approach, a further review of this issue may lead to additional changes. The current school building closing laws are not consistent for the entire state, and could be in conflict with the school board plans we are recommending. We recognize that efficiencies are gained by closing school facilities; still these decisions have been local. We recommend that the decisions for closing buildings be left to local school boards and that existing statutes be changed to make this a statewide policy. New school facilities are being built and major renovation of existing building are currently being completed in places where there may not be enough students in the future to warrant the public investment. We recommend a that the legislature direct the State Board of Education to establish procedures for a review of school district building plans that considers the possibility of future school district boundary changes.

APPENDIX I
ENROLLMENT DATA FOR ALL DISTRICTS
District # District County9-20-89
FTE9-20-93
FTE9-20-98
FTE
% Change over 10-
years
% Change over 5-years
# of High Schools
Enrollment
per HS
Projected Enrollment
2004-05
D0101 ERIE-ST PAUL NEOSHO 1,091.50 1,168.50 1,182.40 8% 1% 3 394 1,060.0D0102 CIMARRON-ENSIGN GRAY 567.5 618.8 634.4 12% 2% 1 634 610.0D0103 CHEYLIN CHEYENNE 209.5 222.5 192 -8% -12% 1 192 174.0D0104 WHITE ROCK JEWELL 177 194 199.5 13% 7% 1 200 125.0D0200 GREELEY COUNTY GREELEY 351.5 352.5 320 -9% -9% 1 320 290.0D0202 TURNER-KANSAS CITY WYANDOTTE 3,812.30 3,786.40 3,640.90 -4% -6% 1 3,641 3,300.0D0203 PIPER-KANSAS CITY WYANDOTTE 1,014.50 1,212.60 1,282.00 26% 3% 1 1,282 1,417.0D0204 BONNER SPRINGS WYANDOTTE 2,047.50 2,013.00 2,129.50 4% 7% 1 2,130 2,325.0D0205 LEON BUTLER 718.5 823.6 775.7 8% -4% 1 776 800.0D0206 REMINGTON-WHITEWATER BUTLER 487.5 550 548.5 13% -1% 1 549 570.0D0207 FT LEAVENWORTH LEAVENWORTH 1,774.00 1,845.50 1,686.00 -5% -9% 1,790.0D0208 WAKEENEY TREGO 630.5 677.1 571.5 -9% -11% 1 572 409.0D0209 MOSCOW PUBLIC SCHOOLS STEVENS 159 180.5 192.2 21% -4% 1 192 194.0D0210 HUGOTON PUBLIC SCHOOLS STEVENS 890 976.5 956.5 7% -5% 1 957 1,000.0D0211 NORTON COMMUNITY SCHOOLS NORTON 712.9 752 746.2 5% -5% 1 746 690.0D0212 NORTHERN VALLEY NORTON 180.5 205 197.5 9% -4% 1 198 159.0D0213 WEST SOLOMON VALLEY SCHOOLS NORTON 113 96.5 94.5 -16% -5% 1 95 93.0D0214 ULYSSES GRANT 1,575.70 1,699.10 1,769.60 12% 5% 1 1,770 1,707.5D0215 LAKIN KEARNY 649.3 734.3 730.5 13% 0% 1 731 760.0D0216 DEERFIELD KEARNY 250.5 337.7 374.7 50% 2% 1 375 348.0D0217 ROLLA MORTON 215 196.5 206.3 -4% 4% 1 206 220.0D0218 ELKHART MORTON 563.5 529.5 550.5 -2% 2% 1 551 500.0D0219 MINNEOLA CLARK 200 258.5 277.5 39% 4% 1 278 269.0D0220 ASHLAND CLARK 246.1 256.5 246.5 0% -8% 1 247 245.0D0221 NORTH CENTRAL WASHINGTON 180.5 164.5 160.5 -11% 0% 1 161 112.0D0222 WASHINGTON SCHOOLS WASHINGTON 418.5 396.2 375 -10% -10% 1 375 324.0D0223 BARNES WASHINGTON 396 371.3 393.9 -1% 11% 2 197 290.4D0224 REPUBLICAN VALLEY WASHINGTON 388 392 388.6 0% 3% 1 389 304.0D0225 FOWLER MEADE 143.9 153.5 169.6 18% 4% 1 170 142.0D0226 MEADE MEADE 403.5 427.5 441 9% 7% 1 441 465.0D0227 JETMORE HODGEMAN 235.5 294.5 331.5 41% 10% 1 332 332.0D0228 HANSTON HODGEMAN 150.5 151 138.5 -8% -1% 1 139 99.0

District # District County9-20-89
FTE9-20-93
FTE9-20-98
FTE
% Change over 10-
years
% Change over 5-years
# of High Schools
Enrollment
per HS
Projected Enrollment
2004-05
D0229 SOUTHEAST JOHNSON CO JOHNSON 8,193.90 11,569.60 15,418.50 88% 26% 3 5,140 19,160.0D0230 SPRING HILL JOHNSON 1,234.40 1,245.80 1,353.50 10% 7% 1 1,354 1,725.0D0231 GARDNER-EDGERTON-ANTIOCH JOHNSON 1,625.30 1,803.60 2,384.30 47% 25% 1 2,384 3,590.0D0232 DESOTO JOHNSON 1,697.50 1,829.50 2,515.00 48% 29% 1 2,515 4,587.0D0233 OLATHE JOHNSON 13,300.20 15,831.70 18,626.80 40% 14% 3 6,209 22,139.6D0234 FT SCOTT BOURBON 2,053.60 2,105.00 2,114.60 3% 0% 1 2,115 2,115.0D0235 UNIONTOWN BOURBON 500.5 458.5 498.8 0% 9% 1 499 500.0D0237 SMITH CENTER SMITH 637.9 631.5 585.3 -8% -8% 1 585 447.0D0238 WEST SMITH COUNTY SMITH 213 191.5 195.5 -8% -3% 1 196 190.0D0239 NORTH OTTAWA COUNTY OTTAWA 652 728 687.1 5% -6% 1 687 610.0D0240 TWIN VALLEY OTTAWA 470.5 468.5 627.1 33% 12% 2 314 1,100.0D0241 WALLACE COUNTY SCHOOLS WALLACE 286.1 298.5 306 7% 5% 1 306 225.0D0242 WESKAN WALLACE 101 119.5 125 24% -1% 1 125 128.0D0243 LEBO-WAVERLY COFFEY 491 578.5 581.5 18% -2% 2 291 597.0D0244 BURLINGTON COFFEY 847.2 975 918 8% -5% 1 918 715.5D0245 LEROY-GRIDLEY COFFEY 322.5 351 365 13% -1% 2 183 303.0D0246 NORTHEAST CRAWFORD 587 605.7 577 -2% -9% 1 577 532.0D0247 CHEROKEE CRAWFORD 774.4 835.5 842.8 9% 2% 1 843 820.0D0248 GIRARD CRAWFORD 1,075.00 1,125.50 1,130.50 5% 1% 1 1,131 1,115.0D0249 FRONTENAC PUBLIC SCHOOLS CRAWFORD 471 522 657.3 40% 13% 1 657 690.0D0250 PITTSBURG CRAWFORD 2,732.80 2,959.00 2,579.80 -6% -9% 1 2,580 2,310.0D0251 NORTH LYON COUNTY LYON 695.1 733 715.5 3% -2% 1 716 563.0D0252 SOUTHERN LYON COUNTY LYON 525 599 658.5 25% 1% 2 329 625.0D0253 EMPORIA LYON 4,550.00 4,622.00 4,570.20 0% 1% 1 4,570 4,684.0D0254 BARBER COUNTY NORTH BARBER 787 758.8 758.9 -4% 2% 1 759 625.0D0255 SOUTH BARBER BARBER 311.5 357 325 4% -12% 1 325 269.0D0256 MARMATON VALLEY ALLEN 319 375 415 30% 11% 1 415 326.0D0257 IOLA ALLEN 1,775.10 1,833.50 1,672.70 -6% -8% 1 1,673 1,451.0D0258 HUMBOLDT ALLEN 646.5 619 535.9 -17% -14% 1 536 510.0D0259 WICHITA SEDGWICK 43,941.80 44,792.00 44,924.60 2% 3% 7 6,418 45,305.4D0260 DERBY SEDGWICK 5,693.70 6,198.10 6,673.00 17% 5% 1 6,673 7,400.0D0261 HAYSVILLE SEDGWICK 3,281.90 3,582.90 4,197.50 28% 16% 1 4,198 4,562.0D0262 VALLEY CENTER PUBLIC SCHOOLS SEDGWICK 2,004.60 2,146.90 2,303.00 15% 5% 1 2,303 2,390.0D0263 MULVANE SEDGWICK 1,802.90 1,918.20 1,937.50 7% 3% 1 1,938 2,061.8D0264 CLEARWATER SEDGWICK 974 1,038.00 1,144.70 18% 9% 1 1,145 1,280.0D0265 GODDARD SEDGWICK 1,921.90 2,349.00 3,259.80 70% 32% 1 3,260 4,631.0D0266 MAIZE SEDGWICK 2,197.30 3,542.40 4,895.30 123% 29% 1 4,895 5,636.0
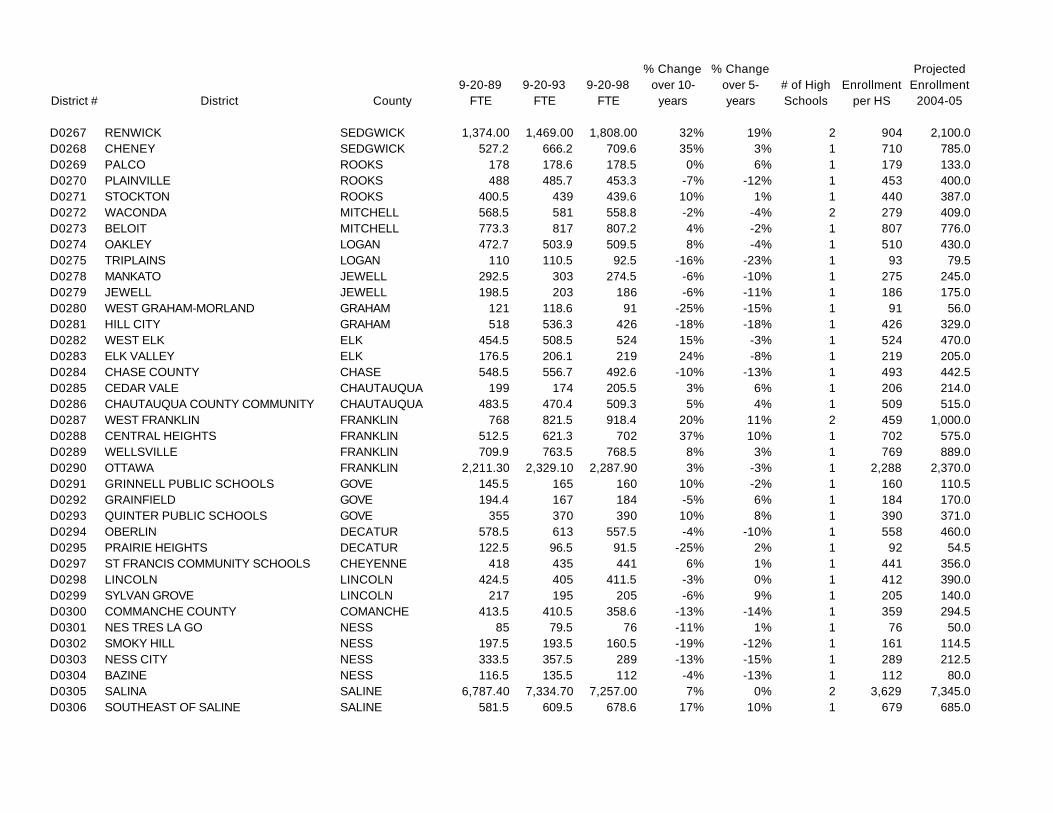
District # District County9-20-89
FTE9-20-93
FTE9-20-98
FTE
% Change over 10-
years
% Change over 5-years
# of High Schools
Enrollment
per HS
Projected Enrollment
2004-05
D0267 RENWICK SEDGWICK 1,374.00 1,469.00 1,808.00 32% 19% 2 904 2,100.0D0268 CHENEY SEDGWICK 527.2 666.2 709.6 35% 3% 1 710 785.0D0269 PALCO ROOKS 178 178.6 178.5 0% 6% 1 179 133.0D0270 PLAINVILLE ROOKS 488 485.7 453.3 -7% -12% 1 453 400.0D0271 STOCKTON ROOKS 400.5 439 439.6 10% 1% 1 440 387.0D0272 WACONDA MITCHELL 568.5 581 558.8 -2% -4% 2 279 409.0D0273 BELOIT MITCHELL 773.3 817 807.2 4% -2% 1 807 776.0D0274 OAKLEY LOGAN 472.7 503.9 509.5 8% -4% 1 510 430.0D0275 TRIPLAINS LOGAN 110 110.5 92.5 -16% -23% 1 93 79.5D0278 MANKATO JEWELL 292.5 303 274.5 -6% -10% 1 275 245.0D0279 JEWELL JEWELL 198.5 203 186 -6% -11% 1 186 175.0D0280 WEST GRAHAM-MORLAND GRAHAM 121 118.6 91 -25% -15% 1 91 56.0D0281 HILL CITY GRAHAM 518 536.3 426 -18% -18% 1 426 329.0D0282 WEST ELK ELK 454.5 508.5 524 15% -3% 1 524 470.0D0283 ELK VALLEY ELK 176.5 206.1 219 24% -8% 1 219 205.0D0284 CHASE COUNTY CHASE 548.5 556.7 492.6 -10% -13% 1 493 442.5D0285 CEDAR VALE CHAUTAUQUA 199 174 205.5 3% 6% 1 206 214.0D0286 CHAUTAUQUA COUNTY COMMUNITY CHAUTAUQUA 483.5 470.4 509.3 5% 4% 1 509 515.0D0287 WEST FRANKLIN FRANKLIN 768 821.5 918.4 20% 11% 2 459 1,000.0D0288 CENTRAL HEIGHTS FRANKLIN 512.5 621.3 702 37% 10% 1 702 575.0D0289 WELLSVILLE FRANKLIN 709.9 763.5 768.5 8% 3% 1 769 889.0D0290 OTTAWA FRANKLIN 2,211.30 2,329.10 2,287.90 3% -3% 1 2,288 2,370.0D0291 GRINNELL PUBLIC SCHOOLS GOVE 145.5 165 160 10% -2% 1 160 110.5D0292 GRAINFIELD GOVE 194.4 167 184 -5% 6% 1 184 170.0D0293 QUINTER PUBLIC SCHOOLS GOVE 355 370 390 10% 8% 1 390 371.0D0294 OBERLIN DECATUR 578.5 613 557.5 -4% -10% 1 558 460.0D0295 PRAIRIE HEIGHTS DECATUR 122.5 96.5 91.5 -25% 2% 1 92 54.5D0297 ST FRANCIS COMMUNITY SCHOOLS CHEYENNE 418 435 441 6% 1% 1 441 356.0D0298 LINCOLN LINCOLN 424.5 405 411.5 -3% 0% 1 412 390.0D0299 SYLVAN GROVE LINCOLN 217 195 205 -6% 9% 1 205 140.0D0300 COMMANCHE COUNTY COMANCHE 413.5 410.5 358.6 -13% -14% 1 359 294.5D0301 NES TRES LA GO NESS 85 79.5 76 -11% 1% 1 76 50.0D0302 SMOKY HILL NESS 197.5 193.5 160.5 -19% -12% 1 161 114.5D0303 NESS CITY NESS 333.5 357.5 289 -13% -15% 1 289 212.5D0304 BAZINE NESS 116.5 135.5 112 -4% -13% 1 112 80.0D0305 SALINA SALINE 6,787.40 7,334.70 7,257.00 7% 0% 2 3,629 7,345.0D0306 SOUTHEAST OF SALINE SALINE 581.5 609.5 678.6 17% 10% 1 679 685.0

District # District County9-20-89
FTE9-20-93
FTE9-20-98
FTE
% Change over 10-
years
% Change over 5-years
# of High Schools
Enrollment
per HS
Projected Enrollment
2004-05
D0307 ELL-SALINE SALINE 359 403.1 460.4 28% 9% 1 460 540.0D0308 HUTCHINSON PUBLIC SCHOOLS RENO 4,932.60 5,156.00 4,892.10 -1% -3% 1 4,892 4,700.0D0309 NICKERSON RENO 1,418.50 1,421.80 1,358.00 -4% -6% 1 1,358 1,215.5D0310 FAIRFIELD RENO 482.5 477.5 448.3 -7% -5% 1 448 425.0D0311 PRETTY PRAIRIE RENO 257.5 306.5 326.8 27% 2% 1 327 295.0D0312 HAVEN PUBLIC SCHOOLS RENO 1,164.70 1,165.50 1,122.90 -4% -5% 1 1,123 925.0D0313 BUHLER RENO 2,117.50 2,199.00 2,212.20 4% 1% 1 2,212 2,407.0D0314 BREWSTER THOMAS 141.5 146.5 160.5 13% 8% 1 161 145.0D0315 COLBY PUBLIC SCHOOLS THOMAS 1,241.50 1,300.50 1,122.20 -10% -15% 1 1,122 970.0D0316 GOLDEN PLAINS THOMAS 143 151.5 176 23% 7% 1 176 155.0D0317 HERNDON RAWLINS 72 86.5 100 39% -12% 1 100 62.0D0318 ATWOOD RAWLINS 482.5 478 434.5 -10% -7% 1 435 303.0D0320 WAMEGO POTTAWATOMIE 1,262.00 1,386.90 1,412.40 12% 0% 1 1,412 1,410.0D0321 KAW VALLEY POTTAWATOMIE 979 1,029.00 1,068.50 9% 1% 2 534 1,021.0D0322 ONAGA-HAVENSVILLE-WHEATON POTTAWATOMIE 428.5 461.5 422.3 -1% -6% 1 422 318.5D0323 WESTMORELAND POTTAWATOMIE 591.5 698.8 775.4 31% 3% 1 775 890.0D0324 EASTERN HEIGHTS PHILLIPS 159 172 194.5 22% 12% 1 195 175.0D0325 PHILLIPSBURG PHILLIPS 700.6 729.2 696.8 -1% -5% 1 697 602.0D0326 LOGAN PHILLIPS 226.5 221 208.1 -8% -6% 1 208 200.0D0327 ELLSWORTH ELLSWORTH 740.7 869 753.5 2% -14% 1 754 604.5D0328 LORRAINE ELLSWORTH 496.6 559.1 557.5 12% 1% 2 279 560.0D0329 ALMA WABAUNSEE 531.9 585.3 557.6 5% -4% 1 558 530.0D0330 WABAUNSEE EAST WABAUNSEE 580.9 616 635.5 9% -2% 1 636 550.0D0331 KINGMAN KINGMAN 1,056.20 1,227.40 1,217.80 15% 0% 2 609 1,245.0D0332 CUNNINGHAM KINGMAN 315 316.5 333.5 6% 4% 1 334 293.0D0333 CONCORDIA CLOUD 1,341.50 1,330.50 1,308.10 -2% -3% 1 1,308 1,200.0D0334 SOUTHERN CLOUD CLOUD 258 263 272.5 6% 2% 2 136 196.0D0335 NORTH JACKSON JACKSON 415 411.5 431.8 4% 4% 1 432 420.0D0336 HOLTON JACKSON 934.5 1,001.00 1,086.10 16% 8% 1 1,086 1,062.0D0337 MAYETTA JACKSON 766.5 822.5 854.1 11% 3% 1 854 874.0D0338 VALLEY FALLS JEFFERSON 483 483 462 -4% -7% 1 462 448.0D0339 JEFFERSON COUNTY NORTH JEFFERSON 446 453.7 481.1 8% 0% 1 481 460.0D0340 JEFFERSON WEST JEFFERSON 695.5 846.1 944.3 36% 6% 1 944 D0341 OSKALOOSA PUBLIC SCHOOLS JEFFERSON 546.5 706.5 724 32% -1% 1 724 740.0D0342 MCLOUTH JEFFERSON 518.5 564.5 577.1 11% 5% 1 577 527.0D0343 PERRY PUBLIC SCHOOLS JEFFERSON 872 995.6 1,045.10 20% -1% 1 1,045 975.0D0344 PLEASANTON LINN 424.7 420.5 425 0% 1% 1 425 400.0

District # District County9-20-89
FTE9-20-93
FTE9-20-98
FTE
% Change over 10-
years
% Change over 5-years
# of High Schools
Enrollment
per HS
Projected Enrollment
2004-05
D0345 SEAMAN SHAWNEE 3,247.70 3,379.50 3,179.70 -2% -6% 1 3,180 3,200.0D0346 JAYHAWK LINN 548.5 563.5 600 9% 7% 1 600 550.5D0347 KINSLEY-OFFERLE EDWARDS 401.7 421.5 355.5 -12% -21% 1 356 280.0D0348 BALDWIN CITY DOUGLAS 962.4 1,126.70 1,241.40 29% 5% 1 1,241 1,295.0D0349 STAFFORD STAFFORD 272.5 316.5 337.8 24% 3% 1 338 304.0D0350 ST JOHN-HUDSON STAFFORD 426 472.5 443.5 4% -6% 1 444 340.0D0351 MACKSVILLE STAFFORD 284.5 278.5 295 4% 3% 1 295 272.0D0352 GOODLAND SHERMAN 1,206.00 1,195.10 1,155.50 -4% -4% 1 1,156 1,098.0D0353 WELLINGTON SUMNER 1,910.50 2,028.40 1,970.60 3% -2% 1 1,971 1,713.0D0354 CLAFLIN BARTON 240 329 324.7 35% -5% 1 325 285.0D0355 ELLINWOOD PUBLIC SCHOOLS BARTON 559.1 576.8 601.2 8% 4% 1 601 541.0D0356 CONWAY SPRINGS SUMNER 448.1 485.2 551.8 23% 15% 1 552 570.0D0357 BELLE PLAINE SUMNER 709 773.5 836.5 18% 4% 1 837 830.0D0358 OXFORD SUMNER 424 465.5 456.5 8% 6% 1 457 450.0D0359 ARGONIA PUBLIC SCHOOLS SUMNER 224 243 270 21% 5% 1 270 268.0D0360 CALDWELL SUMNER 329 337.5 344 5% -1% 1 344 274.5D0361 ANTHONY-HARPER HARPER 1,049.00 1,052.80 1,078.90 3% 4% 1 1,079 1,000.0D0362 PRAIRIE VIEW LINN 821.3 887.4 911.4 11% 3% 1 911 990.0D0363 HOLCOMB FINNEY 659.5 727.5 870 32% 16% 1 870 1,052.0D0364 MARYSVILLE MARSHALL 976 1,025.50 970.8 -1% -6% 1 971 860.0D0365 GARNETT ANDERSON 959.1 1,082.50 1,121.70 17% 4% 1 1,122 1,122.0D0366 WOODSON WOODSON 574 631.5 619.6 8% -3% 1 620 475.0D0367 OSAWATOMIE MIAMI 1,112.90 1,137.50 1,253.00 13% 7% 1 1,253 1,228.0D0368 PAOLA MIAMI 1,576.50 1,776.60 2,055.00 30% 10% 1 2,055 2,050.0D0369 BURRTON HARVEY 294.9 291.5 245.5 -17% -20% 1 246 245.0D0371 MONTEZUMA GRAY 212 181.5 215 1% 18% 1 215 224.0D0372 SILVER LAKE SHAWNEE 605.5 660.1 695.2 15% 6% 1 695 755.0D0373 NEWTON HARVEY 3,200.40 3,467.30 3,465.30 8% 1% 1 3,465 3,284.5D0374 SUBLETTE HASKELL 504.5 517 494 -2% 0% 1 494 487.9D0375 CIRCLE BUTLER 1,259.00 1,384.50 1,406.00 12% 2% 1 1,406 1,620.0D0376 STERLING RICE 533 549 531.5 0% -5% 1 532 500.0D0377 ATCHISON CO COMM SCHOOLS ATCHISON 783 819.5 805.5 3% -4% 1 806 750.0D0378 RILEY COUNTY RILEY 550.4 645.5 625.1 14% -6% 1 625 474.0D0379 CLAY CENTER CLAY 1,530.60 1,699.80 1,589.10 4% -7% 2 795 1,510.0D0380 VERMILLION MARSHALL 592.9 645.5 629.1 6% -4% 2 315 506.0D0381 SPEARVILLE-WINDTHORST FORD 246 305.9 362 47% 14% 1 362 323.0D0382 PRATT PRATT 1,344.20 1,350.00 1,374.00 2% -2% 1 1,374 1,081.0

District # District County9-20-89
FTE9-20-93
FTE9-20-98
FTE
% Change over 10-
years
% Change over 5-years
# of High Schools
Enrollment
per HS
Projected Enrollment
2004-05
D0383 MANHATTAN RILEY 6,010.10 6,456.60 5,819.40 -3% -9% 1 5,819 5,499.0D0384 BLUE VALLEY RILEY 273 293.5 302.5 11% -2% 1 303 274.0D0385 ANDOVER BUTLER 1,620.00 1,989.50 2,791.40 72% 31% 1 2,791 3,485.0D0386 MADISON-VIRGIL GREENWOOD 288.1 296.4 282 -2% -9% 1 282 264.0D0387 ALTOONA-MIDWAY WILSON 387.9 375 359.5 -7% -5% 1 360 293.5D0388 ELLIS ELLIS 365.5 375.2 368 1% -5% 1 368 340.0D0389 EUREKA GREENWOOD 751.2 849.3 795.5 6% -6% 1 796 785.0D0390 HAMILTON GREENWOOD 126.5 125.5 122 -4% -6% 1 122 122.0D0392 OSBORNE COUNTY OSBORNE 455 483.5 496 9% -4% 1 496 475.0D0393 SOLOMON DICKINSON 325 374.5 427.2 31% 5% 1 427 453.0D0394 ROSE HILL PUBLIC SCHOOLS BUTLER 1,333.00 1,589.20 1,755.00 32% 7% 1 1,755 1,980.0D0395 LACROSSE RUSH 342.4 357 357.4 4% -2% 1 357 320.0D0396 DOUGLASS PUBLIC SCHOOLS BUTLER 725.6 782.1 904.4 25% 7% 1 904 D0397 CENTRE MARION 306.1 288 306.9 0% 2% 1 307 257.0D0398 PEABODY-BURNS MARION 403.5 442.8 466.5 16% 5% 1 467 426.5D0399 PARADISE RUSSELL 172.4 109.8 154 -11% 28% 1 154 121.0D0400 LINDSBORG MCPHERSON 845 933 990.3 17% 0% 1 990 955.0D0401 CHASE RICE 180.5 194.5 182 1% -10% 1 182 187.0D0402 AUGUSTA BUTLER 1,904.40 2,193.10 2,226.70 17% 6% 1 2,227 2,425.5D0403 OTIS-BISON RUSH 344 357 335.5 -2% -6% 1 336 200.0D0404 RIVERTON CHEROKEE 701.8 743.5 828.3 18% 9% 1 828 805.0D0405 LYONS RICE 785.5 880.8 934.1 19% 8% 1 934 880.0D0406 WATHENA DONIPHAN 489 485 402 -18% -12% 1 402 380.0D0407 RUSSELL COUNTY RUSSELL 1,211.50 1,204.60 1,165.50 -4% -5% 2 583 1,049.0D0408 MARION MARION 572 645 725.7 27% 6% 1 726 730.0D0409 ATCHISON PUBLIC SCHOOLS ATCHISON 1,709.40 1,682.90 1,616.00 -5% -1% 1 1,616 1,640.0D0410 DURHAM-HILLSBORO-LEHIGH MARION 589 641.6 735.8 25% 8% 1 736 640.0D0411 GOESSEL MARION 245.5 283.5 316.4 29% -2% 1 316 288.5D0412 HOXIE COMMUNITY SCHOOLS SHERIDAN 527 492.5 447 -15% -7% 1 447 350.0D0413 CHANUTE PUBLIC SCHOOLS NEOSHO 1,856.80 1,995.30 1,954.90 5% -1% 1 1,955 1,751.0D0415 HIAWATHA BROWN 1,215.50 1,228.20 1,095.80 -10% -9% 1 1,096 925.4D0416 LOUISBURG MIAMI 1,071.00 1,140.00 1,303.00 22% 10% 1 1,303 1,540.0D0417 MORRIS COUNTY MORRIS 1,023.00 1,078.00 1,036.10 1% -6% 1 1,036 910.0D0418 MCPHERSON MCPHERSON 2,370.20 2,652.30 2,710.50 14% 2% 1 2,711 2,425.0D0419 CANTON-GALVA MCPHERSON 402.7 476.5 425.9 6% -10% 1 426 410.0D0420 OSAGE CITY OSAGE 600.6 626.5 745 24% 16% 1 745 780.0D0421 LYNDON OSAGE 400.5 463.5 507 27% 1% 1 507 411.0
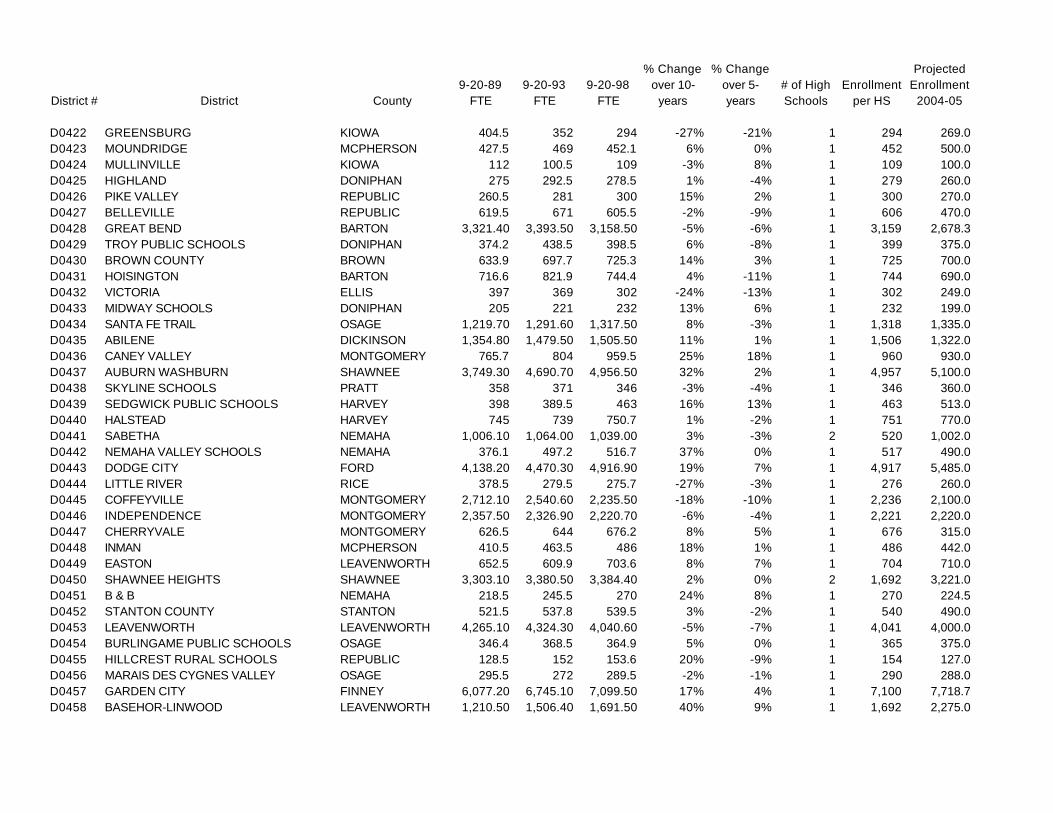
District # District County9-20-89
FTE9-20-93
FTE9-20-98
FTE
% Change over 10-
years
% Change over 5-years
# of High Schools
Enrollment
per HS
Projected Enrollment
2004-05
D0422 GREENSBURG KIOWA 404.5 352 294 -27% -21% 1 294 269.0D0423 MOUNDRIDGE MCPHERSON 427.5 469 452.1 6% 0% 1 452 500.0D0424 MULLINVILLE KIOWA 112 100.5 109 -3% 8% 1 109 100.0D0425 HIGHLAND DONIPHAN 275 292.5 278.5 1% -4% 1 279 260.0D0426 PIKE VALLEY REPUBLIC 260.5 281 300 15% 2% 1 300 270.0D0427 BELLEVILLE REPUBLIC 619.5 671 605.5 -2% -9% 1 606 470.0D0428 GREAT BEND BARTON 3,321.40 3,393.50 3,158.50 -5% -6% 1 3,159 2,678.3D0429 TROY PUBLIC SCHOOLS DONIPHAN 374.2 438.5 398.5 6% -8% 1 399 375.0D0430 BROWN COUNTY BROWN 633.9 697.7 725.3 14% 3% 1 725 700.0D0431 HOISINGTON BARTON 716.6 821.9 744.4 4% -11% 1 744 690.0D0432 VICTORIA ELLIS 397 369 302 -24% -13% 1 302 249.0D0433 MIDWAY SCHOOLS DONIPHAN 205 221 232 13% 6% 1 232 199.0D0434 SANTA FE TRAIL OSAGE 1,219.70 1,291.60 1,317.50 8% -3% 1 1,318 1,335.0D0435 ABILENE DICKINSON 1,354.80 1,479.50 1,505.50 11% 1% 1 1,506 1,322.0D0436 CANEY VALLEY MONTGOMERY 765.7 804 959.5 25% 18% 1 960 930.0D0437 AUBURN WASHBURN SHAWNEE 3,749.30 4,690.70 4,956.50 32% 2% 1 4,957 5,100.0D0438 SKYLINE SCHOOLS PRATT 358 371 346 -3% -4% 1 346 360.0D0439 SEDGWICK PUBLIC SCHOOLS HARVEY 398 389.5 463 16% 13% 1 463 513.0D0440 HALSTEAD HARVEY 745 739 750.7 1% -2% 1 751 770.0D0441 SABETHA NEMAHA 1,006.10 1,064.00 1,039.00 3% -3% 2 520 1,002.0D0442 NEMAHA VALLEY SCHOOLS NEMAHA 376.1 497.2 516.7 37% 0% 1 517 490.0D0443 DODGE CITY FORD 4,138.20 4,470.30 4,916.90 19% 7% 1 4,917 5,485.0D0444 LITTLE RIVER RICE 378.5 279.5 275.7 -27% -3% 1 276 260.0D0445 COFFEYVILLE MONTGOMERY 2,712.10 2,540.60 2,235.50 -18% -10% 1 2,236 2,100.0D0446 INDEPENDENCE MONTGOMERY 2,357.50 2,326.90 2,220.70 -6% -4% 1 2,221 2,220.0D0447 CHERRYVALE MONTGOMERY 626.5 644 676.2 8% 5% 1 676 315.0D0448 INMAN MCPHERSON 410.5 463.5 486 18% 1% 1 486 442.0D0449 EASTON LEAVENWORTH 652.5 609.9 703.6 8% 7% 1 704 710.0D0450 SHAWNEE HEIGHTS SHAWNEE 3,303.10 3,380.50 3,384.40 2% 0% 2 1,692 3,221.0D0451 B & B NEMAHA 218.5 245.5 270 24% 8% 1 270 224.5D0452 STANTON COUNTY STANTON 521.5 537.8 539.5 3% -2% 1 540 490.0D0453 LEAVENWORTH LEAVENWORTH 4,265.10 4,324.30 4,040.60 -5% -7% 1 4,041 4,000.0D0454 BURLINGAME PUBLIC SCHOOLS OSAGE 346.4 368.5 364.9 5% 0% 1 365 375.0D0455 HILLCREST RURAL SCHOOLS REPUBLIC 128.5 152 153.6 20% -9% 1 154 127.0D0456 MARAIS DES CYGNES VALLEY OSAGE 295.5 272 289.5 -2% -1% 1 290 288.0D0457 GARDEN CITY FINNEY 6,077.20 6,745.10 7,099.50 17% 4% 1 7,100 7,718.7D0458 BASEHOR-LINWOOD LEAVENWORTH 1,210.50 1,506.40 1,691.50 40% 9% 1 1,692 2,275.0

District # District County9-20-89
FTE9-20-93
FTE9-20-98
FTE
% Change over 10-
years
% Change over 5-years
# of High Schools
Enrollment
per HS
Projected Enrollment
2004-05
D0459 BUCKLIN FORD 296 384 354 20% -10% 1 354 250.0D0460 HESSTON HARVEY 720 790.5 840.5 17% 3% 1 841 780.0D0461 NEODESHA WILSON 726 759.8 758 4% -6% 1 758 869.0D0462 CENTRAL COWLEY 388 366.2 405.2 4% 11% 1 405 417.0D0463 UDALL COWLEY 357.2 430.4 320 -10% -22% 1 320 335.0D0464 TONGANOXIE LEAVENWORTH 1,312.80 1,517.50 1,466.70 12% -4% 1 1,467 1,460.0D0465 WINFIELD COWLEY 2,360.10 2,566.20 2,642.20 12% 1% 1 2,642 2,197.8D0466 SCOTT COUNTY SCOTT 1,059.20 1,072.60 1,121.20 6% 1% 1 1,121 967.5D0467 LEOTI WICHITA 581 607.5 477.5 -18% -19% 1 478 446.0D0468 HEALY PUBLIC SCHOOLS LANE 110.5 117 103.5 -6% 2% 1 104 100.0D0469 LANSING LEAVENWORTH 1,594.50 1,916.10 1,913.00 20% -1% 1 1,913 1,859.0D0470 ARKANSAS CITY COWLEY 3,095.10 3,043.10 2,857.50 -8% -8% 1 2,858 2,940.4D0471 DEXTER COWLEY 155.5 181.8 200.5 29% 7% 1 201 215.0D0473 CHAPMAN DICKINSON 1,211.00 1,312.50 1,227.00 1% -8% 1 1,227 1,070.0D0474 HAVILAND PUBLIC SCHOOLS KIOWA 159 187.9 179.3 13% -4% 1 179 175.0D0475 JUNCTION CITY GEARY 6,731.80 6,759.50 6,076.80 -10% -10% 1 6,077 6,450.0D0476 COPELAND GRAY 124 112 121.5 -2% 8% 1 122 120.0D0477 INGALLS GRAY 225.5 276 293.5 30% 10% 1 294 266.0D0479 CREST ANDERSON 279.5 314 311 11% 1% 1 311 276.0D0480 LIBERAL SEWARD 3,400.60 3,803.80 4,050.20 19% 2% 1 4,050 4,260.0D0481 RURAL VISTA DICKINSON 362.5 395 452.5 25% 12% 2 226 410.0D0482 DIGHTON LANE 387.7 405.3 345.4 -11% -14% 1 345 NAD0483 KISMET-PLAINS SEWARD 567.5 613.5 693.1 22% 10% 1 693 735.0D0484 FREDONIA WILSON 881 927 882.1 0% -4% 1 882 792.0D0486 ELWOOD DONIPHAN 254 193.5 312.5 23% 50% 1 313 365.0D0487 HERINGTON DICKINSON 577.5 561 571.3 -1% -3% 1 571 555.0D0488 AXTELL MARSHALL 328.5 365.5 374 14% 1% 2 187 283.0D0489 HAYS ELLIS 3,375.90 3,454.60 3,422.70 1% 0% 1 3,423 3,008.0D0490 EL DORADO BUTLER 2,040.70 2,305.90 2,178.50 7% -4% 1 2,179 2,120.0D0491 EUDORA DOUGLAS 810.4 883.5 1,100.10 36% 18% 1 1,100 1,358.0D0492 FLINTHILLS BUTLER 230 255.5 339 47% 23% 1 339 347.0D0493 COLUMBUS CHEROKEE 1,265.50 1,370.50 1,375.70 9% 0% 1 1,376 1,300.0D0494 SYRACUSE HAMILTON 400.5 398.5 509 27% 21% 1 509 526.0D0495 FT LARNED PAWNEE 1,106.60 1,175.70 1,073.30 -3% -11% 1 1,073 937.0D0496 PAWNEE HEIGHTS PAWNEE 152.5 168.5 159 4% -9% 1 159 160.0D0497 LAWRENCE DOUGLAS 8,034.30 8,919.10 10,016.00 25% 9% 2 5,008 10,750.0D0498 VALLEY HEIGHTS MARSHALL 425 464.8 513.5 21% 9% 1 514 420.0

District # District County9-20-89
FTE9-20-93
FTE9-20-98
FTE
% Change over 10-
years
% Change over 5-years
# of High Schools
Enrollment
per HS
Projected Enrollment
2004-05
D0499 GALENA CHEROKEE 730.1 752.6 794.7 9% 6% 1 795 782.0D0500 KANSAS CITY WYANDOTTE 21,520.60 21,001.50 19,876.50 -8% -4% 4 4,969 20,200.0D0501 TOPEKA PUBLIC SCHOOLS SHAWNEE 14,095.20 13,955.10 13,478.40 -4% -1% 3 4,493 13,129.6D0502 LEWIS EDWARDS 176.5 191 191 8% 7% 1 191 183.0D0503 PARSONS LABETTE 1,915.60 1,936.00 1,708.90 -11% -9% 1 1,709 1,485.0D0504 OSWEGO LABETTE 459 467.5 497.5 8% 0% 1 498 500.0D0505 CHETOPA LABETTE 313.2 285 270.5 -14% 1% 1 271 261.0D0506 LABETTE COUNTY LABETTE 1,625.10 1,663.60 1,780.80 10% 2% 1 1,781 1,700.0D0507 SATANTA HASKELL 356.1 371.5 438 23% 21% 1 438 440.0D0508 BAXTER SPRINGS CHEROKEE 884.8 908.3 884.1 0% -4% 1 884 860.0D0509 SOUTH HAVEN SUMNER 233 237.5 264.5 14% 10% 1 265 280.0D0511 ATTICA HARPER 217.5 182 163 -25% -23% 1 163 145.0D0512 SHAWNEE MISSION PUBLIC SCHOO JOHNSON 28,885.30 30,537.10 30,293.70 5% -1% 5 6,059 27,984.0

APPENDIX II
PERFORMANCE DATA FOR ALL DISTRICTS
District # District CountyReading
Index 98-99Math Power
98-99
Writing Composite
98-99
Actual Z-Score 98-
99
Predicted Z-Score 98-99
Reading Index 97-98
Math Power 97-
98
Writing Composite
97-98 Actual Z-
Score 97-98
D0101 ERIE-ST PAUL NEOSHO 66.4 55.2 3.48 1.66 0.11 67.5 54.2 3.25 0.77D0102 CIMARRON-ENSIGN GRAY 66.3 48.7 3.12 -1.39 0.56 62.2 45.5 3.13 -2.79D0103 CHEYLIN CHEYENNE 64.0 53.8 3.76 2.32 0.70 67.2 53.8 3.78 3.79D0104 WHITE ROCK JEWELL 62.6 44.1 3.42 -1.49 -0.45 64.4 50.0 3.37 -0.02D0200 GREELEY COUNTY GREELEY 64.3 56.6 3.56 1.85 1.08 63.5 57.2 3.68 2.92D0202 TURNER-KANSAS CITY WYANDOTTE 57.1 46.1 2.95 -4.85 -2.22 56.1 40.8 3.11 -5.22D0203 PIPER-KANSAS CITY WYANDOTTE 65.4 55.0 3.47 1.35 1.51 64.7 53.0 3.46 1.13D0204 BONNER SPRINGS WYANDOTTE 57.9 44.1 3.36 -2.89 -0.04 59.3 45.5 3.39 -1.93D0205 LEON BUTLER 64.9 52.8 3.92 3.19 1.36 65.9 51.6 3.89 3.74D0206 REMINGTON-WHITEWATER BUTLER 70.7 52.1 3.53 2.37 2.46 65.8 47.6 3.29 -0.60D0207 FT LEAVENWORTH LEAVENWORTH 69.6 62.8 4.04 6.67 66.6 54.9 3.71 3.43D0208 WAKEENEY TREGO 70.0 51.4 3.77 3.33 1.25 64.3 49.3 3.46 0.37D0209 MOSCOW PUBLIC SCHOOLS STEVENS 60.7 44.7 3.49 -1.46 1.09 62.4 46.7 3.34 -1.27D0210 HUGOTON PUBLIC SCHOOLS STEVENS 62.8 43.9 3.47 -1.22 -0.50 60.8 45.0 3.27 -2.38D0211 NORTON COMMUNITY SCHOOLS NORTON 67.6 49.6 3.15 -0.77 1.25 67.8 49.7 3.56 1.87D0212 NORTHERN VALLEY NORTON 69.3 62.5 3.75 5.03 0.03 69.8 55.0 3.44 2.60D0213 WEST SOLOMON VALLEY SCHOOLS NORTON 53.6 45.7 3.44 -3.18 1.23 64.1 45.7 3.65 0.80D0214 ULYSSES GRANT 60.9 42.7 3.52 -1.61 -0.46 62.4 41.7 3.31 -2.36D0215 LAKIN KEARNY 59.6 43.4 3.37 -2.57 -0.67 62.9 42.5 3.53 -0.78D0216 DEERFIELD KEARNY 55.7 39.8 2.70 -7.59 -2.62 56.6 37.9 3.77 -1.69D0217 ROLLA MORTON 65.5 46.9 3.78 1.55 -0.19 71.0 51.7 4.32 7.54D0218 ELKHART MORTON 58.1 43.7 3.28 -3.33 1.22 61.4 44.5 3.36 -1.79D0219 MINNEOLA CLARK 64.0 57.1 2.82 -1.99 -0.03 63.8 51.6 3.24 -0.65D0220 ASHLAND CLARK 66.0 52.6 3.68 2.15 0.23 68.8 57.4 3.53 3.33D0221 NORTH CENTRAL WASHINGTON 67.6 53.2 2.95 -1.18 -0.97 67.7 47.3 2.95 -2.23D0222 WASHINGTON SCHOOLS WASHINGTON 65.2 56.4 3.04 -0.69 1.66 66.7 58.6 3.21 1.13D0223 BARNES WASHINGTON 60.8 46.7 3.34 -1.86 0.72 64.8 43.3 2.90 -3.95D0224 REPUBLICAN VALLEY WASHINGTON 74.4 53.2 3.39 2.68 0.61 71.5 54.1 3.11 0.87D0225 FOWLER MEADE 63.1 51.9 3.32 -0.51 0.39 63.7 53.1 3.18 -0.76D0226 MEADE MEADE 68.1 53.6 3.39 1.30 0.87 65.7 52.5 3.32 0.45D0227 JETMORE HODGEMAN 66.0 47.7 3.58 0.76 1.59 65.8 46.0 3.49 0.31D0228 HANSTON HODGEMAN 63.9 49.2 3.46 -0.08 3.05 64.5 48.2 3.69 1.59D0229 SOUTHEAST JOHNSON CO JOHNSON 68.5 58.2 3.67 3.67 3.93 69.0 56.5 3.56 3.39D0230 SPRING HILL JOHNSON 68.9 49.4 3.67 2.20 1.38 66.7 50.8 3.61 2.11D0231 GARDNER-EDGERTON-ANTIOCH JOHNSON 64.8 51.5 3.65 1.53 0.69 64.2 49.9 3.41 0.15D0232 DESOTO JOHNSON 66.3 57.8 3.74 3.46 1.98 69.7 55.3 3.87 5.20D0233 OLATHE JOHNSON 69.2 59.9 3.61 3.82 3.45 70.0 61.4 3.46 3.92

District # District CountyReading
Index 98-99Math Power
98-99
Writing Composite
98-99
Actual Z-Score 98-
99
Predicted Z-Score 98-99
Reading Index 97-98
Math Power 97-
98
Writing Composite
97-98 Actual Z-
Score 97-98
D0234 FT SCOTT BOURBON 65.6 49.8 3.42 0.21 -1.16 62.9 47.8 3.31 -1.13D0235 UNIONTOWN BOURBON 67.9 49.2 3.40 0.53 -0.45 69.6 49.8 3.41 1.43D0237 SMITH CENTER SMITH 68.9 55.6 4.03 5.18 0.87 69.4 55.3 3.53 3.09D0238 WEST SMITH COUNTY SMITH 67.7 53.6 3.44 1.47 3.08 60.7 48.5 3.45 -0.70D0239 NORTH OTTAWA COUNTY OTTAWA 67.6 47.2 3.59 1.10 0.07 68.0 48.7 3.38 0.66D0240 TWIN VALLEY OTTAWA 67.6 46.7 3.29 -0.56 1.28 63.4 50.3 3.16 -1.46D0241 WALLACE COUNTY SCHOOLS WALLACE 69.2 52.3 3.75 3.20 -0.65 70.5 52.3 3.79 4.36D0242 WESKAN WALLACE 62.5 41.8 3.91 0.63 1.33 71.6 48.3 3.48 2.05D0243 LEBO-WAVERLY COFFEY 63.2 48.5 3.19 -1.77 0.11 66.7 49.5 3.27 -0.16D0244 BURLINGTON COFFEY 68.5 51.9 3.65 2.45 1.07 69.6 51.4 3.25 0.76D0245 LEROY-GRIDLEY COFFEY 64.3 47.0 3.37 -0.85 0.04 63.6 44.3 3.46 -0.71D0246 NORTHEAST CRAWFORD 60.8 52.1 3.37 -0.75 -1.02 59.6 49.2 2.90 -4.12D0247 CHEROKEE CRAWFORD 61.3 45.7 3.30 -2.13 -1.15 60.1 43.6 3.38 -2.15D0248 GIRARD CRAWFORD 66.4 54.5 3.56 1.96 1.68 60.5 49.4 3.49 -0.34D0249 FRONTENAC PUBLIC SCHOOLS CRAWFORD 61.8 53.0 3.25 -0.98 -0.33 64.1 50.5 3.43 0.36D0250 PITTSBURG CRAWFORD 65.2 52.4 3.54 1.20 -1.53 62.6 45.4 3.22 -2.18D0251 NORTH LYON COUNTY LYON 62.3 49.2 3.61 0.33 1.11 63.7 48.9 3.49 0.33D0252 SOUTHERN LYON COUNTY LYON 62.5 45.7 3.45 -1.07 0.72 61.5 42.7 3.71 0.00D0253 EMPORIA LYON 63.7 47.3 3.58 0.16 -1.54 64.3 50.3 3.66 1.74D0254 BARBER COUNTY NORTH BARBER 67.4 49.0 3.65 1.68 -0.48 66.9 47.5 3.66 1.86D0255 SOUTH BARBER BARBER 66.9 55.4 3.06 -0.37 0.28 63.2 53.6 2.89 -2.52D0256 MARMATON VALLEY ALLEN 64.2 49.4 3.83 1.95 -0.03 64.8 47.9 3.55 0.77D0257 IOLA ALLEN 65.1 50.8 3.69 1.68 -0.81 65.5 48.0 3.58 1.14D0258 HUMBOLDT ALLEN 62.0 52.8 3.64 1.06 1.43 60.8 52.3 3.50 0.32D0259 WICHITA SEDGWICK 59.9 46.0 3.27 -2.56 -2.78 60.5 46.3 3.34 -1.80D0260 DERBY SEDGWICK 65.3 53.7 3.31 0.26 0.70 65.4 50.8 3.34 0.19D0261 HAYSVILLE SEDGWICK 62.8 45.8 3.34 -1.56 -0.64 65.0 46.3 3.41 -0.31D0262 VALLEY CENTER PUBLIC SCHOOLS SEDGWICK 66.5 48.8 3.46 0.45 1.73 66.8 48.3 3.38 0.31D0263 MULVANE SEDGWICK 64.6 51.6 3.18 -0.95 0.95 63.9 47.3 3.60 0.75D0264 CLEARWATER SEDGWICK 66.5 62.1 3.43 2.65 2.06 64.9 50.5 3.51 1.03D0265 GODDARD SEDGWICK 67.4 51.5 3.47 1.19 0.97 65.8 51.3 3.17 -0.64D0266 MAIZE SEDGWICK 67.9 52.9 3.45 1.45 0.72 67.6 52.6 3.34 1.04D0267 RENWICK SEDGWICK 70.6 56.4 3.52 3.05 1.95 68.5 57.6 3.48 3.00D0268 CHENEY SEDGWICK 60.5 49.2 3.38 -1.28 1.50 64.3 48.5 3.71 1.72D0269 PALCO ROOKS 69.3 54.7 3.94 4.64 -0.15 67.1 53.3 3.79 3.73D0270 PLAINVILLE ROOKS 60.2 42.8 3.54 -1.65 -0.98 63.4 42.9 3.68 0.31D0271 STOCKTON ROOKS 66.6 54.3 3.62 2.28 0.98 62.0 45.1 3.59 -0.17D0272 WACONDA MITCHELL 69.5 56.6 3.31 1.74 1.17 66.8 53.5 3.23 0.35D0273 BELOIT MITCHELL 62.2 46.8 3.58 -0.27 0.80 63.1 45.3 3.53 -0.23D0274 OAKLEY LOGAN 66.9 49.6 3.41 0.42 -0.74 61.0 52.8 3.23 -1.16D0275 TRIPLAINS LOGAN 69.1 42.6 3.46 -0.05 1.60 61.2 46.0 3.50 -0.73D0278 MANKATO JEWELL 60.7 43.7 3.35 -2.36 -0.11 64.3 42.6 2.84 -4.55
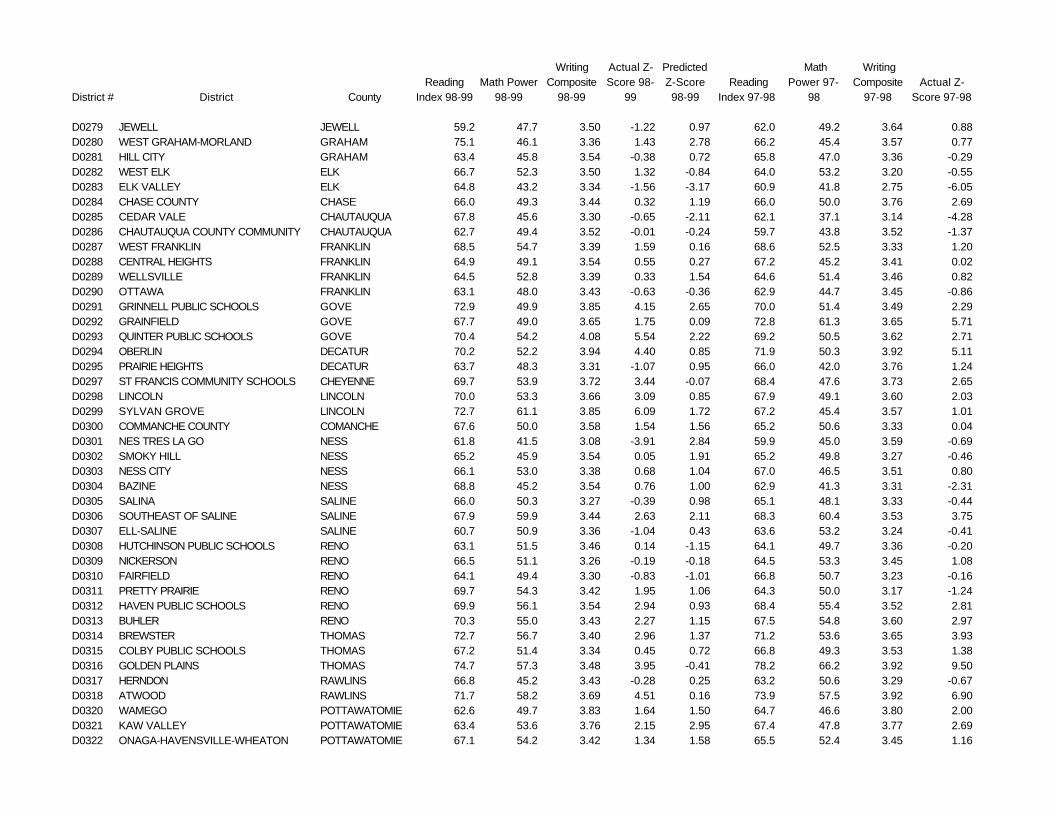
District # District CountyReading
Index 98-99Math Power
98-99
Writing Composite
98-99
Actual Z-Score 98-
99
Predicted Z-Score 98-99
Reading Index 97-98
Math Power 97-
98
Writing Composite
97-98 Actual Z-
Score 97-98
D0279 JEWELL JEWELL 59.2 47.7 3.50 -1.22 0.97 62.0 49.2 3.64 0.88D0280 WEST GRAHAM-MORLAND GRAHAM 75.1 46.1 3.36 1.43 2.78 66.2 45.4 3.57 0.77D0281 HILL CITY GRAHAM 63.4 45.8 3.54 -0.38 0.72 65.8 47.0 3.36 -0.29D0282 WEST ELK ELK 66.7 52.3 3.50 1.32 -0.84 64.0 53.2 3.20 -0.55D0283 ELK VALLEY ELK 64.8 43.2 3.34 -1.56 -3.17 60.9 41.8 2.75 -6.05D0284 CHASE COUNTY CHASE 66.0 49.3 3.44 0.32 1.19 66.0 50.0 3.76 2.69D0285 CEDAR VALE CHAUTAUQUA 67.8 45.6 3.30 -0.65 -2.11 62.1 37.1 3.14 -4.28D0286 CHAUTAUQUA COUNTY COMMUNITY CHAUTAUQUA 62.7 49.4 3.52 -0.01 -0.24 59.7 43.8 3.52 -1.37D0287 WEST FRANKLIN FRANKLIN 68.5 54.7 3.39 1.59 0.16 68.6 52.5 3.33 1.20D0288 CENTRAL HEIGHTS FRANKLIN 64.9 49.1 3.54 0.55 0.27 67.2 45.2 3.41 0.02D0289 WELLSVILLE FRANKLIN 64.5 52.8 3.39 0.33 1.54 64.6 51.4 3.46 0.82D0290 OTTAWA FRANKLIN 63.1 48.0 3.43 -0.63 -0.36 62.9 44.7 3.45 -0.86D0291 GRINNELL PUBLIC SCHOOLS GOVE 72.9 49.9 3.85 4.15 2.65 70.0 51.4 3.49 2.29D0292 GRAINFIELD GOVE 67.7 49.0 3.65 1.75 0.09 72.8 61.3 3.65 5.71D0293 QUINTER PUBLIC SCHOOLS GOVE 70.4 54.2 4.08 5.54 2.22 69.2 50.5 3.62 2.71D0294 OBERLIN DECATUR 70.2 52.2 3.94 4.40 0.85 71.9 50.3 3.92 5.11D0295 PRAIRIE HEIGHTS DECATUR 63.7 48.3 3.31 -1.07 0.95 66.0 42.0 3.76 1.24D0297 ST FRANCIS COMMUNITY SCHOOLS CHEYENNE 69.7 53.9 3.72 3.44 -0.07 68.4 47.6 3.73 2.65D0298 LINCOLN LINCOLN 70.0 53.3 3.66 3.09 0.85 67.9 49.1 3.60 2.03D0299 SYLVAN GROVE LINCOLN 72.7 61.1 3.85 6.09 1.72 67.2 45.4 3.57 1.01D0300 COMMANCHE COUNTY COMANCHE 67.6 50.0 3.58 1.54 1.56 65.2 50.6 3.33 0.04D0301 NES TRES LA GO NESS 61.8 41.5 3.08 -3.91 2.84 59.9 45.0 3.59 -0.69D0302 SMOKY HILL NESS 65.2 45.9 3.54 0.05 1.91 65.2 49.8 3.27 -0.46D0303 NESS CITY NESS 66.1 53.0 3.38 0.68 1.04 67.0 46.5 3.51 0.80D0304 BAZINE NESS 68.8 45.2 3.54 0.76 1.00 62.9 41.3 3.31 -2.31D0305 SALINA SALINE 66.0 50.3 3.27 -0.39 0.98 65.1 48.1 3.33 -0.44D0306 SOUTHEAST OF SALINE SALINE 67.9 59.9 3.44 2.63 2.11 68.3 60.4 3.53 3.75D0307 ELL-SALINE SALINE 60.7 50.9 3.36 -1.04 0.43 63.6 53.2 3.24 -0.41D0308 HUTCHINSON PUBLIC SCHOOLS RENO 63.1 51.5 3.46 0.14 -1.15 64.1 49.7 3.36 -0.20D0309 NICKERSON RENO 66.5 51.1 3.26 -0.19 -0.18 64.5 53.3 3.45 1.08D0310 FAIRFIELD RENO 64.1 49.4 3.30 -0.83 -1.01 66.8 50.7 3.23 -0.16D0311 PRETTY PRAIRIE RENO 69.7 54.3 3.42 1.95 1.06 64.3 50.0 3.17 -1.24D0312 HAVEN PUBLIC SCHOOLS RENO 69.9 56.1 3.54 2.94 0.93 68.4 55.4 3.52 2.81D0313 BUHLER RENO 70.3 55.0 3.43 2.27 1.15 67.5 54.8 3.60 2.97D0314 BREWSTER THOMAS 72.7 56.7 3.40 2.96 1.37 71.2 53.6 3.65 3.93D0315 COLBY PUBLIC SCHOOLS THOMAS 67.2 51.4 3.34 0.45 0.72 66.8 49.3 3.53 1.38D0316 GOLDEN PLAINS THOMAS 74.7 57.3 3.48 3.95 -0.41 78.2 66.2 3.92 9.50D0317 HERNDON RAWLINS 66.8 45.2 3.43 -0.28 0.25 63.2 50.6 3.29 -0.67D0318 ATWOOD RAWLINS 71.7 58.2 3.69 4.51 0.16 73.9 57.5 3.92 6.90D0320 WAMEGO POTTAWATOMIE 62.6 49.7 3.83 1.64 1.50 64.7 46.6 3.80 2.00D0321 KAW VALLEY POTTAWATOMIE 63.4 53.6 3.76 2.15 2.95 67.4 47.8 3.77 2.69D0322 ONAGA-HAVENSVILLE-WHEATON POTTAWATOMIE 67.1 54.2 3.42 1.34 1.58 65.5 52.4 3.45 1.16

District # District CountyReading
Index 98-99Math Power
98-99
Writing Composite
98-99
Actual Z-Score 98-
99
Predicted Z-Score 98-99
Reading Index 97-98
Math Power 97-
98
Writing Composite
97-98 Actual Z-
Score 97-98
D0323 WESTMORELAND POTTAWATOMIE 66.8 58.4 3.10 0.34 1.27 65.2 53.8 3.38 0.92D0324 EASTERN HEIGHTS PHILLIPS 64.2 48.6 3.42 -0.32 -1.22 57.4 49.2 3.08 -3.57D0325 PHILLIPSBURG PHILLIPS 71.9 57.7 3.29 2.38 1.43 70.2 57.7 3.72 4.85D0326 LOGAN PHILLIPS 66.9 45.1 3.63 0.77 0.32 68.2 54.7 3.55 2.82D0327 ELLSWORTH ELLSWORTH 71.4 52.3 3.69 3.40 0.95 67.7 50.8 3.66 2.65D0328 LORRAINE ELLSWORTH 68.2 53.7 3.93 4.16 0.23 70.4 57.4 3.80 5.32D0329 ALMA WABAUNSEE 68.2 55.9 3.47 2.15 0.90 67.1 53.4 3.83 3.99D0330 WABAUNSEE EAST WABAUNSEE 66.7 53.9 3.53 1.76 0.28 63.6 47.9 3.35 -0.71D0331 KINGMAN KINGMAN 64.3 53.9 3.43 0.69 0.97 66.4 50.1 3.35 0.36D0332 CUNNINGHAM KINGMAN 70.0 56.3 3.39 2.22 -0.56 68.5 53.3 3.57 2.75D0333 CONCORDIA CLOUD 68.5 57.8 3.38 2.09 -0.23 67.2 53.9 3.46 1.89D0334 SOUTHERN CLOUD CLOUD 60.1 40.1 3.01 -4.91 0.07 61.4 42.3 3.21 -3.09D0335 NORTH JACKSON JACKSON 61.0 47.1 3.40 -1.43 2.09 61.1 46.8 3.90 1.78D0336 HOLTON JACKSON 63.3 52.2 3.60 1.04 2.03 65.7 47.9 3.53 0.87D0337 MAYETTA JACKSON 64.3 53.4 3.13 -0.96 -0.51 63.3 47.0 2.96 -3.28D0338 VALLEY FALLS JEFFERSON 62.8 44.7 3.48 -1.03 0.69 69.8 50.3 3.51 2.16D0339 JEFFERSON COUNTY NORTH JEFFERSON 65.6 54.6 3.85 3.30 1.11 66.4 57.3 3.39 1.90D0340 JEFFERSON WEST JEFFERSON 61.2 48.1 3.31 -1.68 1.56 63.5 51.7 3.52 0.97D0341 OSKALOOSA PUBLIC SCHOOLS JEFFERSON 63.4 51.4 3.26 -0.85 0.55 68.5 49.6 3.28 0.35D0342 MCLOUTH JEFFERSON 60.9 50.0 3.49 -0.47 1.57 60.9 45.3 3.47 -1.11D0343 PERRY PUBLIC SCHOOLS JEFFERSON 66.4 50.8 3.39 0.42 0.96 70.0 52.9 3.38 1.90D0344 PLEASANTON LINN 56.1 52.4 3.13 -3.03 -0.11 59.7 45.9 3.00 -4.10D0345 SEAMAN SHAWNEE 64.1 49.1 3.26 -1.09 1.28 63.9 49.5 3.21 -1.19D0346 JAYHAWK LINN 65.5 46.0 3.46 -0.28 -0.31 68.7 47.4 3.50 1.31D0347 KINSLEY-OFFERLE EDWARDS 59.8 46.5 3.49 -1.35 0.09 63.5 50.3 3.67 1.61D0348 BALDWIN CITY DOUGLAS 65.2 45.9 3.28 -1.30 1.45 60.5 45.4 3.14 -3.16D0349 STAFFORD STAFFORD 61.5 50.8 3.43 -0.50 -1.86 62.6 52.2 3.05 -1.96D0350 ST JOHN-HUDSON STAFFORD 69.7 47.0 3.31 0.08 -0.61 67.9 50.0 3.42 1.12D0351 MACKSVILLE STAFFORD 62.5 50.3 3.39 -0.57 -1.46 64.8 46.4 3.38 -0.52D0352 GOODLAND SHERMAN 62.2 47.2 3.27 -1.82 -0.63 62.8 45.5 3.14 -2.59D0353 WELLINGTON SUMNER 59.5 48.6 3.24 -2.35 -0.79 60.2 41.8 3.26 -3.17D0354 CLAFLIN BARTON 68.6 53.2 3.29 0.83 1.89 67.1 55.3 3.05 -0.32D0355 ELLINWOOD PUBLIC SCHOOLS BARTON 64.5 51.3 3.54 0.85 0.45 70.5 53.4 3.30 1.64D0356 CONWAY SPRINGS SUMNER 67.2 47.0 3.44 0.19 1.17 62.7 43.5 3.32 -1.90D0357 BELLE PLAINE SUMNER 65.4 45.6 3.05 -2.51 1.53 60.0 44.8 3.35 -2.13D0358 OXFORD SUMNER 63.0 42.3 3.21 -2.81 1.77 61.2 47.4 3.24 -2.03D0359 ARGONIA PUBLIC SCHOOLS SUMNER 66.5 44.1 3.39 -0.75 -0.45 67.6 50.8 3.43 1.25D0360 CALDWELL SUMNER 62.6 45.7 3.17 -2.51 0.42 61.6 43.1 2.88 -4.87D0361 ANTHONY-HARPER HARPER 64.2 46.4 3.20 -1.86 -0.10 64.3 48.2 3.13 -1.80D0362 PRAIRIE VIEW LINN 65.4 55.8 3.72 2.79 1.03 61.4 47.2 3.43 -0.88D0363 HOLCOMB FINNEY 61.0 52.6 3.60 0.59 0.30 62.8 45.5 3.39 -1.10D0364 MARYSVILLE MARSHALL 63.1 47.3 3.41 -0.86 2.27 65.6 46.5 3.33 -0.61

District # District CountyReading
Index 98-99Math Power
98-99
Writing Composite
98-99
Actual Z-Score 98-
99
Predicted Z-Score 98-99
Reading Index 97-98
Math Power 97-
98
Writing Composite
97-98 Actual Z-
Score 97-98
D0365 GARNETT ANDERSON 65.3 57.2 3.22 0.41 0.14 64.1 54.4 3.23 -0.13D0366 WOODSON WOODSON 68.2 48.9 3.72 2.21 -1.23 64.2 49.9 3.93 3.26D0367 OSAWATOMIE MIAMI 58.8 48.0 3.63 -0.58 -2.11 61.6 49.7 3.48 -0.08D0368 PAOLA MIAMI 64.7 47.1 3.78 1.40 0.45 66.7 48.5 3.65 1.93D0369 BURRTON HARVEY 69.3 48.5 3.20 -0.31 1.22 68.1 50.6 3.22 0.08D0371 MONTEZUMA GRAY 61.2 42.1 3.36 -2.48 -0.73 63.8 45.5 3.57 0.22D0372 SILVER LAKE SHAWNEE 71.3 54.7 3.44 2.50 1.93 68.0 57.4 3.24 1.41D0373 NEWTON HARVEY 61.7 50.1 3.54 -0.01 -0.37 61.7 45.1 3.33 -1.79D0374 SUBLETTE HASKELL 67.4 49.0 3.39 0.33 -1.22 64.1 48.5 3.49 0.35D0375 CIRCLE BUTLER 67.5 55.2 3.31 1.03 1.42 65.8 51.4 3.31 0.21D0376 STERLING RICE 69.2 46.9 3.56 1.25 0.07 64.2 50.6 3.44 0.46D0377 ATCHISON CO COMM SCHOOLS ATCHISON 63.4 53.5 3.86 2.65 0.70 63.7 50.4 3.68 1.74D0378 RILEY COUNTY RILEY 68.8 60.1 3.10 1.11 1.45 65.7 49.2 3.16 -1.11D0379 CLAY CENTER CLAY 66.0 56.9 3.58 2.39 0.10 69.3 57.0 3.48 3.08D0380 VERMILLION MARSHALL 70.5 56.1 3.44 2.56 0.53 70.0 57.0 3.31 2.23D0381 SPEARVILLE-WINDTHORST FORD 65.6 44.7 3.05 -2.62 1.33 68.4 52.2 3.07 -0.46D0382 PRATT PRATT 65.1 51.2 3.45 0.50 0.30 67.1 49.3 3.47 1.10D0383 MANHATTAN RILEY 66.1 51.7 3.43 0.71 0.93 65.6 49.4 3.44 0.58D0384 BLUE VALLEY RILEY 68.3 50.9 3.87 3.37 0.55 69.1 51.0 3.60 2.66D0385 ANDOVER BUTLER 69.1 53.3 3.30 1.01 1.65 68.4 53.2 3.34 1.34D0386 MADISON-VIRGIL GREENWOOD 60.2 45.1 3.26 -2.70 -0.43 68.0 46.0 3.32 -0.18D0387 ALTOONA-MIDWAY WILSON 67.4 49.2 3.35 0.15 -0.06 68.8 55.5 3.31 1.67D0388 ELLIS ELLIS 68.9 52.4 3.52 1.95 0.84 69.3 54.8 3.61 3.46D0389 EUREKA GREENWOOD 61.8 50.9 3.65 0.73 -0.27 67.9 47.1 3.52 1.19D0390 HAMILTON GREENWOOD 71.1 50.1 3.60 2.47 -0.26 70.9 49.8 3.44 1.91D0392 OSBORNE COUNTY OSBORNE 68.7 51.1 3.39 1.00 -0.07 65.7 47.5 3.23 -1.00D0393 SOLOMON DICKINSON 66.8 43.4 3.38 -0.86 -0.15 65.7 44.3 3.16 -2.00D0394 ROSE HILL PUBLIC SCHOOLS BUTLER 62.9 51.8 3.24 -1.00 1.07 64.5 51.5 3.32 -0.02D0395 LACROSSE RUSH 68.1 51.3 3.47 1.31 -0.55 62.2 45.0 3.39 -1.33D0396 DOUGLASS PUBLIC SCHOOLS BUTLER 68.3 55.8 3.20 0.75 1.96 58.1 45.7 3.15 -3.62D0397 CENTRE MARION 63.9 55.3 3.39 0.64 -0.24 60.7 49.5 3.46 -0.46D0398 PEABODY-BURNS MARION 62.0 48.9 3.35 -1.14 0.26 64.3 46.4 3.16 -1.95D0399 PARADISE RUSSELL 67.1 50.8 3.58 1.57 -0.29 71.7 48.5 3.65 3.12D0400 LINDSBORG MCPHERSON 65.4 49.9 3.30 -0.44 1.88 64.7 49.9 3.40 0.21D0401 CHASE RICE 59.6 41.0 3.08 -4.50 -1.22 59.9 44.8 3.23 -2.87D0402 AUGUSTA BUTLER 63.2 47.0 3.30 -1.46 0.75 65.0 48.1 3.30 -0.64D0403 OTIS-BISON RUSH 68.5 52.6 3.49 1.74 -2.16 67.9 51.2 3.18 -0.10D0404 RIVERTON CHEROKEE 61.5 48.4 3.36 -1.29 -1.23 64.5 45.7 3.13 -2.21D0405 LYONS RICE 65.1 58.2 3.61 2.57 -0.43 65.0 57.9 3.53 2.51D0406 WATHENA DONIPHAN 65.7 45.3 3.26 -1.40 0.59 66.6 45.2 3.12 -1.86D0407 RUSSELL COUNTY RUSSELL 66.7 49.6 3.40 0.32 -0.34 65.3 51.9 3.31 0.18D0408 MARION MARION 66.9 52.2 3.20 -0.21 0.83 66.7 48.2 3.30 -0.21

District # District CountyReading
Index 98-99Math Power
98-99
Writing Composite
98-99
Actual Z-Score 98-
99
Predicted Z-Score 98-99
Reading Index 97-98
Math Power 97-
98
Writing Composite
97-98 Actual Z-
Score 97-98
D0409 ATCHISON PUBLIC SCHOOLS ATCHISON 63.0 45.3 3.22 -2.23 -2.04 54.9 42.0 3.17 -4.93D0410 DURHAM-HILLSBORO-LEHIGH MARION 69.2 61.3 3.79 5.01 1.94 70.7 55.8 3.70 4.51D0411 GOESSEL MARION 71.1 63.3 3.81 5.90 3.49 68.1 58.3 3.63 3.92D0412 HOXIE COMMUNITY SCHOOLS SHERIDAN 69.9 53.1 3.73 3.40 1.12 71.5 54.5 3.65 4.17D0413 CHANUTE PUBLIC SCHOOLS NEOSHO 63.7 46.9 3.31 -1.31 -0.85 66.5 44.8 3.52 0.44D0415 HIAWATHA BROWN 68.1 48.9 3.24 -0.31 0.58 65.6 46.5 3.21 -1.32D0416 LOUISBURG MIAMI 63.7 47.7 3.64 0.55 1.51 61.4 45.0 3.36 -1.70D0417 MORRIS COUNTY MORRIS 67.2 49.0 3.33 -0.03 -0.16 66.3 46.3 3.14 -1.61D0418 MCPHERSON MCPHERSON 66.7 58.3 3.38 1.76 1.65 65.6 52.5 3.36 0.66D0419 CANTON-GALVA MCPHERSON 63.1 51.3 3.91 2.45 1.50 62.7 50.6 3.87 2.67D0420 OSAGE CITY OSAGE 60.4 50.7 3.44 -0.72 0.73 61.9 49.9 3.27 -1.23D0421 LYNDON OSAGE 63.9 50.0 3.53 0.43 1.10 66.9 46.5 3.35 -0.18D0422 GREENSBURG KIOWA 67.1 57.3 3.58 2.72 0.24 69.3 49.3 3.54 2.04D0423 MOUNDRIDGE MCPHERSON 70.5 58.0 3.31 2.22 3.51 73.6 63.6 3.24 3.87D0424 MULLINVILLE KIOWA 62.4 55.8 3.42 0.54 0.28 68.6 51.1 3.94 4.59D0425 HIGHLAND DONIPHAN 66.0 51.3 3.37 0.31 -0.11 71.4 54.1 3.47 2.99D0426 PIKE VALLEY REPUBLIC 62.6 51.9 3.06 -1.98 0.65 68.8 54.8 3.19 0.83D0427 BELLEVILLE REPUBLIC 70.0 55.7 3.27 1.49 0.61 73.3 50.0 2.97 -0.28D0428 GREAT BEND BARTON 65.2 48.8 3.62 0.98 -1.42 65.8 47.6 3.51 0.72D0429 TROY PUBLIC SCHOOLS DONIPHAN 67.1 47.2 3.63 1.19 1.06 66.6 45.1 3.60 0.99D0430 BROWN COUNTY BROWN 63.8 44.8 3.42 -1.09 -1.03 58.8 44.6 3.29 -2.81D0431 HOISINGTON BARTON 64.4 50.9 3.63 1.22 -0.35 61.9 44.3 3.33 -1.89D0432 VICTORIA ELLIS 69.3 51.6 3.77 3.21 1.84 67.9 55.9 3.64 3.50D0433 MIDWAY SCHOOLS DONIPHAN 66.2 52.4 3.26 -0.02 -0.99 67.7 49.8 3.51 1.57D0434 SANTA FE TRAIL OSAGE 65.5 54.8 3.32 0.55 0.62 66.1 51.4 3.50 1.42D0435 ABILENE DICKINSON 62.7 48.6 3.52 -0.15 0.39 63.5 49.0 3.18 -1.55D0436 CANEY VALLEY MONTGOMERY 64.1 45.2 3.56 -0.22 0.14 64.4 48.8 3.48 0.42D0437 AUBURN WASHBURN SHAWNEE 67.6 56.7 3.29 1.22 1.50 67.3 52.3 3.34 0.91D0438 SKYLINE SCHOOLS PRATT 62.8 47.2 3.89 1.55 0.17 66.6 50.4 3.47 1.18D0439 SEDGWICK PUBLIC SCHOOLS HARVEY 64.9 53.7 3.44 0.84 0.68 64.1 56.4 3.28 0.53D0440 HALSTEAD HARVEY 63.4 48.7 3.27 -1.27 0.19 68.0 46.0 3.12 -1.38D0441 SABETHA NEMAHA 66.7 54.8 3.45 1.51 1.57 69.1 52.1 3.63 3.04D0442 NEMAHA VALLEY SCHOOLS NEMAHA 64.4 55.6 3.45 1.12 0.76 63.6 58.1 3.48 1.92D0443 DODGE CITY FORD 60.8 45.5 3.26 -2.49 -1.71 62.1 45.9 3.38 -1.25D0444 LITTLE RIVER RICE 72.4 55.9 3.70 4.32 1.30 71.4 56.9 3.77 5.29D0445 COFFEYVILLE MONTGOMERY 61.5 44.3 3.33 -2.18 -1.61 61.8 43.0 3.08 -3.64D0446 INDEPENDENCE MONTGOMERY 63.0 49.3 3.21 -1.57 -0.65 62.4 47.3 3.26 -1.64D0447 CHERRYVALE MONTGOMERY 62.9 41.2 3.14 -3.40 -1.63 62.4 42.6 3.59 -0.52D0448 INMAN MCPHERSON 66.1 59.6 3.46 2.27 1.80 62.9 51.9 3.25 -0.75D0449 EASTON LEAVENWORTH 65.7 53.2 3.53 1.41 1.06 63.6 46.6 3.55 0.25D0450 SHAWNEE HEIGHTS SHAWNEE 67.7 52.8 3.31 0.65 1.67 65.5 50.0 3.39 0.36D0451 B & B NEMAHA 76.3 58.8 3.75 5.99 -0.69 74.6 53.6 3.52 3.97

District # District CountyReading
Index 98-99Math Power
98-99
Writing Composite
98-99
Actual Z-Score 98-
99
Predicted Z-Score 98-99
Reading Index 97-98
Math Power 97-
98
Writing Composite
97-98 Actual Z-
Score 97-98
D0452 STANTON COUNTY STANTON 60.8 48.4 3.49 -0.78 -0.54 72.8 50.9 3.58 3.40D0453 LEAVENWORTH LEAVENWORTH 61.2 46.8 3.38 -1.54 -0.73 60.5 46.1 3.25 -2.37D0454 BURLINGAME PUBLIC SCHOOLS OSAGE 67.1 50.7 3.26 -0.12 -1.82 60.7 42.6 2.96 -4.69D0455 HILLCREST RURAL SCHOOLS REPUBLIC 56.4 46.6 3.03 -4.51 -0.05 64.3 50.9 3.41 0.36D0456 MARAIS DES CYGNES VALLEY OSAGE 65.6 43.3 3.63 0.15 -1.42 59.5 42.6 3.43 -2.17D0457 GARDEN CITY FINNEY 61.1 42.2 3.28 -2.90 -1.44 60.4 44.4 3.22 -2.89D0458 BASEHOR-LINWOOD LEAVENWORTH 65.3 53.3 3.54 1.39 1.21 62.0 47.3 3.43 -0.72D0459 BUCKLIN FORD 65.9 47.8 3.64 1.07 -0.45 62.6 46.7 3.55 0.03D0460 HESSTON HARVEY 68.7 56.7 3.67 3.45 -0.22 66.1 54.1 3.50 1.91D0461 NEODESHA WILSON 57.8 42.6 3.20 -4.01 -0.16 57.7 43.3 3.44 -2.42D0462 CENTRAL COWLEY 62.1 48.3 3.46 -0.65 0.52 63.1 45.5 3.24 -1.92D0463 UDALL COWLEY 61.2 48.6 3.32 -1.54 0.88 59.7 54.0 3.61 1.02D0464 TONGANOXIE LEAVENWORTH 68.8 56.8 3.69 3.60 1.54 68.8 57.1 3.64 3.93D0465 WINFIELD COWLEY 62.8 45.8 3.58 -0.31 0.49 62.6 45.9 3.49 -0.48D0466 SCOTT COUNTY SCOTT 67.9 54.9 3.58 2.48 0.82 64.5 51.1 3.60 1.58D0467 LEOTI WICHITA 69.1 50.4 3.61 2.11 -0.14 68.2 50.4 3.55 2.04D0468 HEALY PUBLIC SCHOOLS LANE 69.1 50.5 3.51 1.61 2.12 68.1 53.3 3.26 0.81D0469 LANSING LEAVENWORTH 69.6 48.7 3.63 2.03 1.40 66.9 46.2 3.31 -0.47D0470 ARKANSAS CITY COWLEY 61.4 44.2 3.35 -2.11 -1.95 62.0 42.9 3.31 -2.24D0471 DEXTER COWLEY 69.4 54.2 3.67 3.17 0.47 67.4 54.7 3.49 2.27D0473 CHAPMAN DICKINSON 68.1 56.1 3.26 1.07 0.26 70.1 53.0 3.38 1.95D0474 HAVILAND PUBLIC SCHOOLS KIOWA 70.4 49.7 3.31 0.72 0.27 60.7 48.5 3.38 -1.11D0475 JUNCTION CITY GEARY 64.2 54.0 3.41 0.58 -1.74 63.7 51.7 3.27 -0.48D0476 COPELAND GRAY 63.1 55.4 3.33 0.16 1.04 65.7 53.6 3.44 1.36D0477 INGALLS GRAY 62.1 48.1 3.28 -1.63 0.36 65.0 46.3 3.31 -0.91D0479 CREST ANDERSON 65.0 54.4 3.41 0.84 -1.29 64.6 44.9 3.35 -1.02D0480 LIBERAL SEWARD 55.7 54.4 3.37 -1.52 -2.16 58.5 48.0 3.21 -2.75D0481 RURAL VISTA DICKINSON 62.6 47.2 3.18 -2.19 0.45 64.3 46.7 3.32 -0.94D0482 DIGHTON LANE 75.8 57.4 3.05 1.98 0.46 72.3 53.7 3.44 2.96D0483 KISMET-PLAINS SEWARD 64.5 46.3 3.40 -0.77 -0.35 66.8 44.3 3.22 -1.38D0484 FREDONIA WILSON 62.8 43.1 3.39 -1.78 -0.86 65.4 43.9 3.47 -0.29D0486 ELWOOD DONIPHAN 56.5 44.0 3.12 -4.48 -1.44 60.2 39.9 3.16 -4.11D0487 HERINGTON DICKINSON 65.8 48.7 3.39 -0.10 0.37 67.3 52.6 3.52 2.04D0488 AXTELL MARSHALL 65.9 46.9 3.54 0.39 2.41 68.0 49.7 3.05 -1.13D0489 HAYS ELLIS 65.0 51.4 3.52 0.88 1.82 65.5 53.8 3.46 1.47D0490 EL DORADO BUTLER 64.2 48.6 3.26 -1.16 -0.99 63.5 50.2 3.32 -0.50D0491 EUDORA DOUGLAS 67.8 51.6 3.58 1.87 -0.22 64.5 49.8 3.62 1.46D0492 FLINTHILLS BUTLER 61.6 48.2 3.34 -1.41 1.24 64.9 43.1 3.21 -2.11D0493 COLUMBUS CHEROKEE 64.1 54.6 3.40 0.61 -1.37 61.3 47.1 3.27 -1.88D0494 SYRACUSE HAMILTON 59.9 43.9 3.22 -3.19 -1.17 58.4 46.1 3.24 -2.94D0495 FT LARNED PAWNEE 60.4 43.7 3.21 -3.16 -0.48 63.2 45.6 3.31 -1.46D0496 PAWNEE HEIGHTS PAWNEE 67.4 56.0 3.53 2.30 2.75 69.0 56.4 3.33 2.00

District # District CountyReading
Index 98-99Math Power
98-99
Writing Composite
98-99
Actual Z-Score 98-
99
Predicted Z-Score 98-99
Reading Index 97-98
Math Power 97-
98
Writing Composite
97-98 Actual Z-
Score 97-98
D0497 LAWRENCE DOUGLAS 66.5 53.0 3.35 0.62 1.18 66.7 51.7 3.43 1.20D0498 VALLEY HEIGHTS MARSHALL 65.0 58.2 3.87 3.91 -0.49 67.2 49.2 3.57 1.70D0499 GALENA CHEROKEE 64.8 43.6 3.65 0.13 -3.18 65.5 44.3 3.47 -0.19D0500 KANSAS CITY WYANDOTTE 52.5 38.5 3.07 -6.63 -5.41 53.3 38.2 3.26 -5.47D0501 TOPEKA PUBLIC SCHOOLS SHAWNEE 61.0 47.0 3.20 -2.49 -3.06 60.3 45.4 3.14 -3.21D0502 LEWIS EDWARDS 72.9 53.7 3.35 2.22 0.08 67.3 44.6 3.34 -0.49D0503 PARSONS LABETTE 63.8 51.5 3.40 -0.01 -1.98 62.2 45.3 3.32 -1.70D0504 OSWEGO LABETTE 64.0 51.7 4.02 3.31 -1.03 69.3 51.8 3.84 4.29D0505 CHETOPA LABETTE 58.5 42.1 3.37 -3.05 -4.00 67.3 45.3 3.29 -0.66D0506 LABETTE COUNTY LABETTE 67.1 50.6 3.44 0.80 0.74 65.1 50.5 3.48 0.90D0507 SATANTA HASKELL 54.0 41.9 3.40 -3.97 -1.68 62.2 47.2 3.19 -2.13D0508 BAXTER SPRINGS CHEROKEE 57.9 46.0 3.43 -2.18 -1.89 58.5 46.2 3.34 -2.30D0509 SOUTH HAVEN SUMNER 57.3 40.5 3.36 -3.66 0.07 63.3 48.9 3.32 -0.78D0511 ATTICA HARPER 62.5 50.5 3.53 0.19 1.79 58.3 49.3 3.75 0.67D0512 SHAWNEE MISSION PUBLIC SCHOO JOHNSON 68.7 58.8 3.53 3.09 2.60 68.7 58.4 3.57 3.73
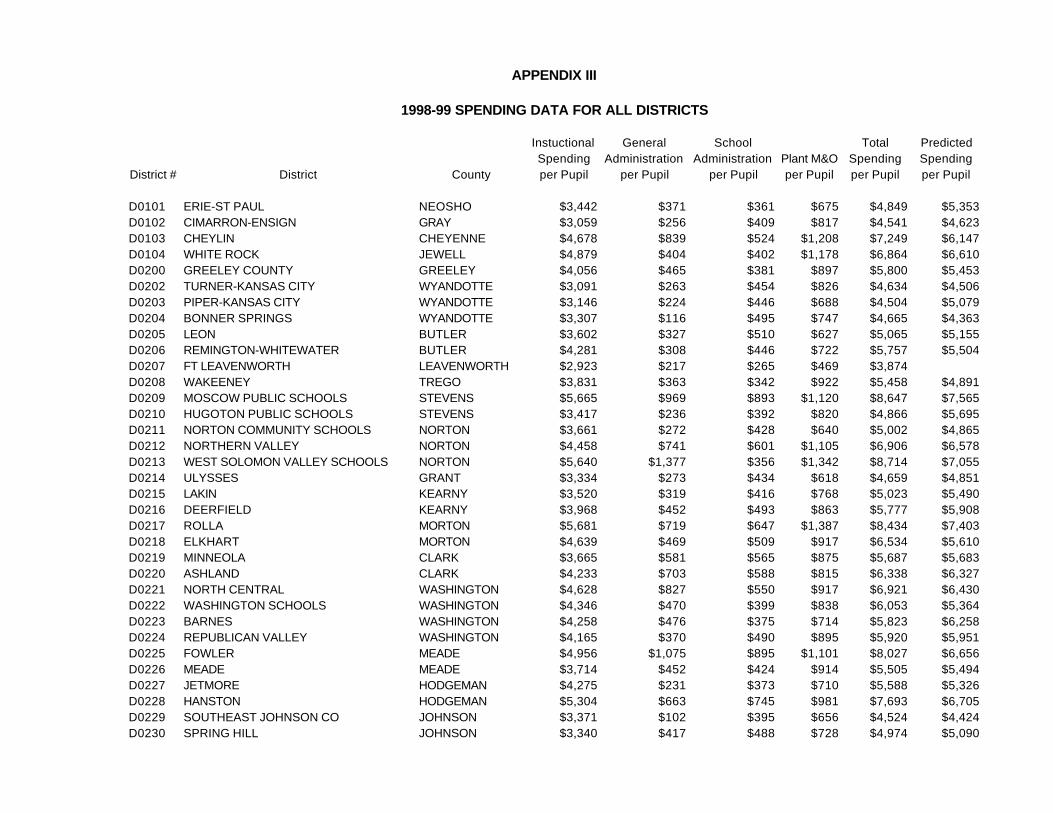
APPENDIX III
1998-99 SPENDING DATA FOR ALL DISTRICTS
District # District County
Instuctional Spending per Pupil
General Administration
per Pupil
School Administration
per PupilPlant M&O per Pupil
Total Spending per Pupil
Predicted Spending per Pupil
D0101 ERIE-ST PAUL NEOSHO $3,442 $371 $361 $675 $4,849 $5,353D0102 CIMARRON-ENSIGN GRAY $3,059 $256 $409 $817 $4,541 $4,623D0103 CHEYLIN CHEYENNE $4,678 $839 $524 $1,208 $7,249 $6,147D0104 WHITE ROCK JEWELL $4,879 $404 $402 $1,178 $6,864 $6,610D0200 GREELEY COUNTY GREELEY $4,056 $465 $381 $897 $5,800 $5,453D0202 TURNER-KANSAS CITY WYANDOTTE $3,091 $263 $454 $826 $4,634 $4,506D0203 PIPER-KANSAS CITY WYANDOTTE $3,146 $224 $446 $688 $4,504 $5,079D0204 BONNER SPRINGS WYANDOTTE $3,307 $116 $495 $747 $4,665 $4,363D0205 LEON BUTLER $3,602 $327 $510 $627 $5,065 $5,155D0206 REMINGTON-WHITEWATER BUTLER $4,281 $308 $446 $722 $5,757 $5,504D0207 FT LEAVENWORTH LEAVENWORTH $2,923 $217 $265 $469 $3,874D0208 WAKEENEY TREGO $3,831 $363 $342 $922 $5,458 $4,891D0209 MOSCOW PUBLIC SCHOOLS STEVENS $5,665 $969 $893 $1,120 $8,647 $7,565D0210 HUGOTON PUBLIC SCHOOLS STEVENS $3,417 $236 $392 $820 $4,866 $5,695D0211 NORTON COMMUNITY SCHOOLS NORTON $3,661 $272 $428 $640 $5,002 $4,865D0212 NORTHERN VALLEY NORTON $4,458 $741 $601 $1,105 $6,906 $6,578D0213 WEST SOLOMON VALLEY SCHOOLS NORTON $5,640 $1,377 $356 $1,342 $8,714 $7,055D0214 ULYSSES GRANT $3,334 $273 $434 $618 $4,659 $4,851D0215 LAKIN KEARNY $3,520 $319 $416 $768 $5,023 $5,490D0216 DEERFIELD KEARNY $3,968 $452 $493 $863 $5,777 $5,908D0217 ROLLA MORTON $5,681 $719 $647 $1,387 $8,434 $7,403D0218 ELKHART MORTON $4,639 $469 $509 $917 $6,534 $5,610D0219 MINNEOLA CLARK $3,665 $581 $565 $875 $5,687 $5,683D0220 ASHLAND CLARK $4,233 $703 $588 $815 $6,338 $6,327D0221 NORTH CENTRAL WASHINGTON $4,628 $827 $550 $917 $6,921 $6,430D0222 WASHINGTON SCHOOLS WASHINGTON $4,346 $470 $399 $838 $6,053 $5,364D0223 BARNES WASHINGTON $4,258 $476 $375 $714 $5,823 $6,258D0224 REPUBLICAN VALLEY WASHINGTON $4,165 $370 $490 $895 $5,920 $5,951D0225 FOWLER MEADE $4,956 $1,075 $895 $1,101 $8,027 $6,656D0226 MEADE MEADE $3,714 $452 $424 $914 $5,505 $5,494D0227 JETMORE HODGEMAN $4,275 $231 $373 $710 $5,588 $5,326D0228 HANSTON HODGEMAN $5,304 $663 $745 $981 $7,693 $6,705D0229 SOUTHEAST JOHNSON CO JOHNSON $3,371 $102 $395 $656 $4,524 $4,424D0230 SPRING HILL JOHNSON $3,340 $417 $488 $728 $4,974 $5,090

District # District County
Instuctional Spending per Pupil
General Administration
per Pupil
School Administration
per PupilPlant M&O per Pupil
Total Spending per Pupil
Predicted Spending per Pupil
D0231 GARDNER-EDGERTON-ANTIOCH JOHNSON $3,038 $361 $325 $654 $4,378 $4,521D0232 DESOTO JOHNSON $3,287 $570 $434 $668 $4,959 $4,816D0233 OLATHE JOHNSON $3,233 $47 $283 $559 $4,123 $4,103D0234 FT SCOTT BOURBON $2,837 $172 $269 $497 $3,775 $3,565D0235 UNIONTOWN BOURBON $3,724 $463 $472 $772 $5,431 $4,616D0237 SMITH CENTER SMITH $4,004 $354 $438 $1,059 $5,854 $4,592D0238 WEST SMITH COUNTY SMITH $5,141 $759 $407 $628 $6,935 $5,847D0239 NORTH OTTAWA COUNTY OTTAWA $3,396 $288 $444 $933 $5,061 $4,811D0240 TWIN VALLEY OTTAWA $3,620 $309 $573 $708 $5,210 $5,269D0241 WALLACE COUNTY SCHOOLS WALLACE $3,750 $373 $589 $833 $5,545 $5,330D0242 WESKAN WALLACE $4,841 $1,152 $38 $1,447 $7,478 $7,199D0243 LEBO-WAVERLY COFFEY $3,419 $293 $561 $856 $5,129 $5,553D0244 BURLINGTON COFFEY $4,106 $280 $463 $905 $5,755 $6,547D0245 LEROY-GRIDLEY COFFEY $3,726 $365 $448 $528 $5,067 $5,806D0246 NORTHEAST CRAWFORD $3,608 $462 $399 $619 $5,088 $4,511D0247 CHEROKEE CRAWFORD $3,399 $280 $457 $720 $4,856 $4,922D0248 GIRARD CRAWFORD $4,049 $199 $25 $528 $4,801 $4,796D0249 FRONTENAC PUBLIC SCHOOLS CRAWFORD $3,120 $286 $372 $728 $4,506 $4,461D0250 PITTSBURG CRAWFORD $3,001 $285 $253 $533 $4,072 $3,743D0251 NORTH LYON COUNTY LYON $3,609 $306 $515 $661 $5,091 $4,920D0252 SOUTHERN LYON COUNTY LYON $3,585 $260 $411 $724 $4,981 $5,195D0253 EMPORIA LYON $2,754 $189 $312 $649 $3,904 $3,924D0254 BARBER COUNTY NORTH BARBER $3,251 $292 $362 $830 $4,734 $4,715D0255 SOUTH BARBER BARBER $3,737 $427 $520 $1,025 $5,709 $5,801D0256 MARMATON VALLEY ALLEN $3,845 $312 $438 $741 $5,336 $5,076D0257 IOLA ALLEN $3,114 $151 $395 $913 $4,572 $4,593D0258 HUMBOLDT ALLEN $3,773 $494 $526 $615 $5,407 $5,144D0259 WICHITA SEDGWICK $2,868 $28 $369 $492 $3,757 $3,598D0260 DERBY SEDGWICK $2,797 $95 $260 $561 $3,713 $3,692D0261 HAYSVILLE SEDGWICK $2,776 $107 $307 $695 $3,886 $4,039D0262 VALLEY CENTER PUBLIC SCHOOLS SEDGWICK $3,131 $201 $343 $416 $4,091 $4,121D0263 MULVANE SEDGWICK $2,661 $218 $370 $511 $3,760 $4,251D0264 CLEARWATER SEDGWICK $3,304 $159 $410 $539 $4,411 $4,848D0265 GODDARD SEDGWICK $2,767 $232 $300 $609 $3,908 $3,962D0266 MAIZE SEDGWICK $3,329 $252 $288 $521 $4,389 $4,072D0267 RENWICK SEDGWICK $3,123 $195 $420 $565 $4,302 $5,113D0268 CHENEY SEDGWICK $3,399 $467 $477 $657 $5,000 $5,113D0269 PALCO ROOKS $5,178 $943 $825 $1,100 $8,046 $6,929

District # District County
Instuctional Spending per Pupil
General Administration
per Pupil
School Administration
per PupilPlant M&O per Pupil
Total Spending per Pupil
Predicted Spending per Pupil
D0270 PLAINVILLE ROOKS $3,357 $709 $442 $835 $5,343 $5,441D0271 STOCKTON ROOKS $3,862 $339 $438 $652 $5,292 $4,880D0272 WACONDA MITCHELL $3,975 $375 $542 $827 $5,719 $5,917D0273 BELOIT MITCHELL $3,688 $331 $439 $611 $5,069 $4,624D0274 OAKLEY LOGAN $3,635 $988 $488 $869 $5,979 $5,652D0275 TRIPLAINS LOGAN $5,843 $1,192 $266 $1,184 $8,485 $7,221D0278 MANKATO JEWELL $3,902 $593 $586 $991 $6,072 $6,029D0279 JEWELL JEWELL $4,710 $454 $718 $1,289 $7,171 $6,593D0280 WEST GRAHAM-MORLAND GRAHAM $6,628 $1,724 $805 $1,770 $10,928 $7,640D0281 HILL CITY GRAHAM $4,002 $417 $428 $869 $5,717 $5,596D0282 WEST ELK ELK $3,912 $402 $531 $797 $5,643 $5,046D0283 ELK VALLEY ELK $4,494 $662 $708 $767 $6,631 $5,359D0284 CHASE COUNTY CHASE $3,860 $388 $444 $702 $5,394 $5,292D0285 CEDAR VALE CHAUTAUQUA $4,320 $1,301 $277 $1,033 $6,930 $5,890D0286 CHAUTAUQUA COUNTY COMMUNITY CHAUTAUQUA $3,806 $400 $405 $638 $5,249 $4,658D0287 WEST FRANKLIN FRANKLIN $3,593 $304 $483 $914 $5,294 $5,177D0288 CENTRAL HEIGHTS FRANKLIN $3,282 $265 $360 $734 $4,641 $4,289D0289 WELLSVILLE FRANKLIN $3,467 $287 $359 $642 $4,754 $4,582D0290 OTTAWA FRANKLIN $2,824 $234 $348 $484 $3,890 $4,159D0291 GRINNELL PUBLIC SCHOOLS GOVE $4,724 $681 $467 $1,213 $7,085 $6,557D0292 GRAINFIELD GOVE $4,848 $713 $495 $886 $6,942 $6,168D0293 QUINTER PUBLIC SCHOOLS GOVE $4,531 $429 $479 $796 $6,235 $5,660D0294 OBERLIN DECATUR $3,893 $343 $377 $642 $5,256 $4,918D0295 PRAIRIE HEIGHTS DECATUR $5,138 $1,052 $327 $791 $7,307 $6,835D0297 ST FRANCIS COMMUNITY SCHOOLS CHEYENNE $3,696 $301 $378 $627 $5,002 $4,804D0298 LINCOLN LINCOLN $3,957 $432 $467 $683 $5,540 $4,981D0299 SYLVAN GROVE LINCOLN $4,455 $483 $480 $1,072 $6,490 $5,747D0300 COMMANCHE COUNTY COMANCHE $4,711 $669 $672 $998 $7,050 $6,532D0301 NES TRES LA GO NESS $7,301 $698 $257 $2,184 $10,441 $7,797D0302 SMOKY HILL NESS $5,241 $509 $571 $1,201 $7,521 $6,385D0303 NESS CITY NESS $3,720 $626 $454 $1,100 $5,900 $5,878D0304 BAZINE NESS $5,040 $1,129 $267 $1,168 $7,604 $6,725D0305 SALINA SALINE $3,062 $41 $271 $498 $3,872 $3,852D0306 SOUTHEAST OF SALINE SALINE $3,705 $317 $306 $810 $5,139 $4,667D0307 ELL-SALINE SALINE $3,278 $459 $391 $865 $4,994 $5,196D0308 HUTCHINSON PUBLIC SCHOOLS RENO $2,842 $58 $362 $811 $4,073 $4,209D0309 NICKERSON RENO $3,161 $300 $332 $573 $4,367 $4,746D0310 FAIRFIELD RENO $3,704 $485 $594 $901 $5,684 $5,906

District # District County
Instuctional Spending per Pupil
General Administration
per Pupil
School Administration
per PupilPlant M&O per Pupil
Total Spending per Pupil
Predicted Spending per Pupil
D0311 PRETTY PRAIRIE RENO $3,962 $320 $502 $856 $5,640 $5,965D0312 HAVEN PUBLIC SCHOOLS RENO $3,491 $147 $518 $784 $4,940 $5,513D0313 BUHLER RENO $2,944 $290 $374 $619 $4,227 $4,521D0314 BREWSTER THOMAS $4,526 $715 $558 $1,189 $6,988 $6,410D0315 COLBY PUBLIC SCHOOLS THOMAS $3,115 $229 $294 $665 $4,302 $4,361D0316 GOLDEN PLAINS THOMAS $4,435 $922 $564 $843 $6,764 $6,460D0317 HERNDON RAWLINS $5,574 $581 $717 $893 $7,765 $6,572D0318 ATWOOD RAWLINS $3,879 $361 $447 $638 $5,325 $4,934D0320 WAMEGO POTTAWATOMIE $3,082 $231 $334 $561 $4,208 $4,254D0321 KAW VALLEY POTTAWATOMIE $4,368 $276 $427 $821 $5,893 $5,933D0322 ONAGA-HAVENSVILLE-WHEATON POTTAWATOMIE $3,985 $478 $653 $662 $5,778 $5,615D0323 WESTMORELAND POTTAWATOMIE $3,661 $341 $484 $709 $5,195 $4,619D0324 EASTERN HEIGHTS PHILLIPS $4,453 $673 $543 $915 $6,583 $5,642D0325 PHILLIPSBURG PHILLIPS $3,801 $294 $502 $708 $5,305 $5,008D0326 LOGAN PHILLIPS $4,761 $493 $583 $1,095 $6,932 $6,033D0327 ELLSWORTH ELLSWORTH $3,713 $393 $468 $995 $5,569 $4,961D0328 LORRAINE ELLSWORTH $3,721 $388 $665 $683 $5,457 $5,744D0329 ALMA WABAUNSEE $3,648 $334 $579 $980 $5,541 $5,824D0330 WABAUNSEE EAST WABAUNSEE $3,322 $319 $545 $884 $5,071 $5,106D0331 KINGMAN KINGMAN $3,364 $313 $344 $626 $4,647 $4,551D0332 CUNNINGHAM KINGMAN $3,817 $513 $623 $538 $5,491 $5,866D0333 CONCORDIA CLOUD $3,212 $203 $335 $760 $4,511 $4,505D0334 SOUTHERN CLOUD CLOUD $4,351 $397 $507 $986 $6,241 $6,305D0335 NORTH JACKSON JACKSON $4,053 $308 $289 $687 $5,336 $4,941D0336 HOLTON JACKSON $3,711 $133 $321 $535 $4,700 $4,567D0337 MAYETTA JACKSON $3,371 $422 $550 $1,148 $5,491 $4,884D0338 VALLEY FALLS JEFFERSON $3,334 $552 $397 $1,036 $5,319 $4,929D0339 JEFFERSON COUNTY NORTH JEFFERSON $3,535 $409 $454 $763 $5,161 $4,865D0340 JEFFERSON WEST JEFFERSON $3,311 $413 $473 $559 $4,755 $4,876D0341 OSKALOOSA PUBLIC SCHOOLS JEFFERSON $3,586 $318 $525 $1,538 $5,966 $4,991D0342 MCLOUTH JEFFERSON $3,497 $404 $543 $639 $5,084 $5,010D0343 PERRY PUBLIC SCHOOLS JEFFERSON $3,295 $339 $546 $530 $4,710 $5,131D0344 PLEASANTON LINN $3,749 $465 $458 $746 $5,418 $4,885D0345 SEAMAN SHAWNEE $2,756 $150 $416 $613 $3,934 $4,654D0346 JAYHAWK LINN $3,786 $274 $448 $701 $5,209 $5,163D0347 KINSLEY-OFFERLE EDWARDS $4,357 $474 $494 $917 $6,242 $6,292D0348 BALDWIN CITY DOUGLAS $3,329 $159 $491 $863 $4,843 $4,985D0349 STAFFORD STAFFORD $4,325 $443 $560 $798 $6,125 $5,765

District # District County
Instuctional Spending per Pupil
General Administration
per Pupil
School Administration
per PupilPlant M&O per Pupil
Total Spending per Pupil
Predicted Spending per Pupil
D0350 ST JOHN-HUDSON STAFFORD $3,594 $302 $402 $901 $5,198 $5,479D0351 MACKSVILLE STAFFORD $3,603 $559 $576 $677 $5,415 $5,442D0352 GOODLAND SHERMAN $3,276 $221 $443 $736 $4,676 $4,993D0353 WELLINGTON SUMNER $2,868 $101 $374 $470 $3,813 $4,535D0354 CLAFLIN BARTON $4,133 $473 $472 $889 $5,967 $5,742D0355 ELLINWOOD PUBLIC SCHOOLS BARTON $3,629 $357 $520 $682 $5,189 $5,146D0356 CONWAY SPRINGS SUMNER $3,623 $356 $620 $794 $5,392 $5,313D0357 BELLE PLAINE SUMNER $3,900 $310 $449 $678 $5,337 $4,604D0358 OXFORD SUMNER $4,063 $387 $475 $697 $5,622 $4,989D0359 ARGONIA PUBLIC SCHOOLS SUMNER $3,570 $518 $597 $944 $5,629 $5,447D0360 CALDWELL SUMNER $3,932 $627 $577 $630 $5,765 $5,401D0361 ANTHONY-HARPER HARPER $3,313 $275 $318 $688 $4,594 $4,247D0362 PRAIRIE VIEW LINN $3,903 $491 $721 $895 $6,010 $5,620D0363 HOLCOMB FINNEY $3,824 $376 $340 $983 $5,523 $5,041D0364 MARYSVILLE MARSHALL $3,818 $217 $414 $574 $5,023 $4,595D0365 GARNETT ANDERSON $3,120 $178 $448 $593 $4,339 $4,920D0366 WOODSON WOODSON $3,278 $185 $428 $1,317 $5,208 $4,463D0367 OSAWATOMIE MIAMI $2,662 $296 $419 $832 $4,209 $4,326D0368 PAOLA MIAMI $2,682 $235 $326 $758 $4,001 $4,277D0369 BURRTON HARVEY $4,754 $704 $559 $1,163 $7,181 $6,380D0371 MONTEZUMA GRAY $4,472 $613 $715 $837 $6,637 $6,390D0372 SILVER LAKE SHAWNEE $3,608 $444 $376 $851 $5,278 $4,754D0373 NEWTON HARVEY $2,760 $182 $392 $697 $4,031 $4,059D0374 SUBLETTE HASKELL $3,743 $577 $477 $625 $5,422 $5,613D0375 CIRCLE BUTLER $3,260 $172 $383 $548 $4,362 $4,569D0376 STERLING RICE $3,910 $361 $609 $837 $5,717 $5,371D0377 ATCHISON CO COMM SCHOOLS ATCHISON $3,508 $247 $368 $783 $4,906 $5,145D0378 RILEY COUNTY RILEY $3,691 $382 $528 $711 $5,311 $4,823D0379 CLAY CENTER CLAY $2,846 $215 $356 $548 $3,964 $4,872D0380 VERMILLION MARSHALL $3,531 $387 $346 $976 $5,239 $5,200D0381 SPEARVILLE-WINDTHORST FORD $3,546 $435 $436 $748 $5,165 $5,252D0382 PRATT PRATT $3,123 $200 $368 $762 $4,452 $4,344D0383 MANHATTAN RILEY $2,893 $75 $291 $599 $3,857 $3,954D0384 BLUE VALLEY RILEY $3,734 $381 $626 $609 $5,350 $5,866D0385 ANDOVER BUTLER $2,924 $227 $327 $554 $4,033 $4,108D0386 MADISON-VIRGIL GREENWOOD $3,807 $628 $326 $764 $5,525 $5,483D0387 ALTOONA-MIDWAY WILSON $3,806 $488 $439 $636 $5,368 $5,831D0388 ELLIS ELLIS $4,227 $432 $523 $679 $5,862 $5,422

District # District County
Instuctional Spending per Pupil
General Administration
per Pupil
School Administration
per PupilPlant M&O per Pupil
Total Spending per Pupil
Predicted Spending per Pupil
D0389 EUREKA GREENWOOD $3,643 $312 $395 $718 $5,068 $4,808D0390 HAMILTON GREENWOOD $5,325 $694 $601 $776 $7,397 $6,270D0392 OSBORNE COUNTY OSBORNE $3,534 $400 $558 $893 $5,385 $5,161D0393 SOLOMON DICKINSON $3,199 $482 $387 $830 $4,898 $4,861D0394 ROSE HILL PUBLIC SCHOOLS BUTLER $2,594 $168 $276 $769 $3,807 $4,384D0395 LACROSSE RUSH $3,782 $414 $651 $713 $5,561 $5,845D0396 DOUGLASS PUBLIC SCHOOLS BUTLER $3,552 $207 $423 $747 $4,930 $4,638D0397 CENTRE MARION $4,095 $324 $451 $760 $5,629 $5,418D0398 PEABODY-BURNS MARION $3,556 $401 $510 $869 $5,336 $5,311D0399 PARADISE RUSSELL $4,427 $534 $798 $966 $6,725 $6,375D0400 LINDSBORG MCPHERSON $3,345 $246 $373 $543 $4,507 $4,693D0401 CHASE RICE $4,463 $836 $885 $1,210 $7,393 $6,636D0402 AUGUSTA BUTLER $2,620 $156 $336 $391 $3,504 $4,034D0403 OTIS-BISON RUSH $3,434 $532 $585 $933 $5,484 $5,824D0404 RIVERTON CHEROKEE $3,609 $206 $393 $803 $5,011 $4,596D0405 LYONS RICE $3,440 $292 $430 $703 $4,865 $5,312D0406 WATHENA DONIPHAN $4,056 $289 $484 $1,005 $5,835 $5,080D0407 RUSSELL COUNTY RUSSELL $3,272 $271 $278 $595 $4,416 $5,224D0408 MARION MARION $3,457 $284 $342 $585 $4,668 $4,621D0409 ATCHISON PUBLIC SCHOOLS ATCHISON $2,909 $245 $401 $659 $4,214 $3,802D0410 DURHAM-HILLSBORO-LEHIGH MARION $3,972 $279 $547 $1,000 $5,798 $5,151D0411 GOESSEL MARION $4,416 $436 $533 $774 $6,160 $5,690D0412 HOXIE COMMUNITY SCHOOLS SHERIDAN $3,702 $530 $412 $671 $5,314 $5,152D0413 CHANUTE PUBLIC SCHOOLS NEOSHO $3,171 $184 $387 $477 $4,219 $4,411D0415 HIAWATHA BROWN $3,385 $299 $395 $575 $4,653 $4,203D0416 LOUISBURG MIAMI $3,126 $269 $416 $722 $4,534 $4,653D0417 MORRIS COUNTY MORRIS $3,218 $267 $406 $498 $4,389 $4,774D0418 MCPHERSON MCPHERSON $3,110 $216 $344 $712 $4,382 $4,688D0419 CANTON-GALVA MCPHERSON $3,694 $486 $694 $715 $5,589 $5,784D0420 OSAGE CITY OSAGE $3,395 $286 $269 $540 $4,490 $4,187D0421 LYNDON OSAGE $3,500 $476 $335 $747 $5,059 $4,692D0422 GREENSBURG KIOWA $3,938 $575 $657 $1,052 $6,222 $5,830D0423 MOUNDRIDGE MCPHERSON $4,559 $414 $458 $809 $6,241 $6,055D0424 MULLINVILLE KIOWA $5,014 $1,630 $759 $1,362 $8,765 $7,318D0425 HIGHLAND DONIPHAN $3,730 $469 $668 $1,143 $6,011 $5,584D0426 PIKE VALLEY REPUBLIC $4,078 $479 $548 $558 $5,662 $5,720D0427 BELLEVILLE REPUBLIC $3,959 $269 $557 $830 $5,615 $5,337D0428 GREAT BEND BARTON $2,750 $265 $355 $522 $3,891 $4,049

District # District County
Instuctional Spending per Pupil
General Administration
per Pupil
School Administration
per PupilPlant M&O per Pupil
Total Spending per Pupil
Predicted Spending per Pupil
D0429 TROY PUBLIC SCHOOLS DONIPHAN $3,964 $501 $472 $938 $5,875 $5,440D0430 BROWN COUNTY BROWN $3,481 $348 $410 $911 $5,149 $4,843D0431 HOISINGTON BARTON $3,533 $240 $565 $749 $5,087 $5,040D0432 VICTORIA ELLIS $3,995 $454 $540 $786 $5,774 $5,607D0433 MIDWAY SCHOOLS DONIPHAN $3,729 $401 $503 $787 $5,419 $5,520D0434 SANTA FE TRAIL OSAGE $3,520 $326 $426 $629 $4,902 $4,694D0435 ABILENE DICKINSON $3,057 $140 $383 $502 $4,083 $4,600D0436 CANEY VALLEY MONTGOMERY $3,162 $228 $305 $618 $4,313 $3,910D0437 AUBURN WASHBURN SHAWNEE $2,756 $142 $314 $466 $3,677 $3,843D0438 SKYLINE SCHOOLS PRATT $3,950 $489 $460 $568 $5,467 $5,238D0439 SEDGWICK PUBLIC SCHOOLS HARVEY $3,221 $397 $368 $929 $4,915 $5,123D0440 HALSTEAD HARVEY $3,332 $330 $662 $762 $5,086 $4,917D0441 SABETHA NEMAHA $3,573 $365 $428 $632 $4,997 $5,056D0442 NEMAHA VALLEY SCHOOLS NEMAHA $3,531 $435 $369 $946 $5,282 $4,896D0443 DODGE CITY FORD $2,889 $271 $373 $575 $4,107 $3,725D0444 LITTLE RIVER RICE $4,082 $573 $649 $705 $6,009 $6,288D0445 COFFEYVILLE MONTGOMERY $3,164 $199 $319 $414 $4,096 $4,223D0446 INDEPENDENCE MONTGOMERY $3,063 $213 $283 $501 $4,060 $3,969D0447 CHERRYVALE MONTGOMERY $3,375 $443 $413 $714 $4,944 $4,438D0448 INMAN MCPHERSON $3,812 $425 $298 $708 $5,242 $5,076D0449 EASTON LEAVENWORTH $3,407 $300 $710 $567 $4,983 $5,259D0450 SHAWNEE HEIGHTS SHAWNEE $3,011 $197 $356 $579 $4,142 $4,274D0451 B & B NEMAHA $3,791 $341 $430 $1,298 $5,860 $5,553D0452 STANTON COUNTY STANTON $3,932 $346 $451 $1,096 $5,825 $6,153D0453 LEAVENWORTH LEAVENWORTH $3,070 $164 $390 $581 $4,206 $4,021D0454 BURLINGAME PUBLIC SCHOOLS OSAGE $3,372 $463 $495 $867 $5,197 $5,400D0455 HILLCREST RURAL SCHOOLS REPUBLIC $4,920 $835 $585 $817 $7,157 $6,126D0456 MARAIS DES CYGNES VALLEY OSAGE $3,989 $539 $515 $1,035 $6,078 $5,903D0457 GARDEN CITY FINNEY $2,639 $79 $345 $579 $3,642 $3,761D0458 BASEHOR-LINWOOD LEAVENWORTH $2,684 $430 $328 $694 $4,137 $4,497D0459 BUCKLIN FORD $3,484 $498 $348 $626 $4,957 $5,080D0460 HESSTON HARVEY $2,880 $320 $430 $766 $4,396 $4,919D0461 NEODESHA WILSON $3,735 $361 $557 $565 $5,220 $4,633D0462 CENTRAL COWLEY $3,939 $415 $630 $861 $5,846 $5,577D0463 UDALL COWLEY $3,898 $698 $431 $829 $5,857 $5,175D0464 TONGANOXIE LEAVENWORTH $3,227 $210 $345 $528 $4,310 $4,185D0465 WINFIELD COWLEY $3,094 $183 $359 $527 $4,162 $4,828D0466 SCOTT COUNTY SCOTT $3,555 $250 $371 $560 $4,736 $4,753

District # District County
Instuctional Spending per Pupil
General Administration
per Pupil
School Administration
per PupilPlant M&O per Pupil
Total Spending per Pupil
Predicted Spending per Pupil
D0467 LEOTI WICHITA $3,554 $348 $589 $1,032 $5,524 $5,386D0468 HEALY PUBLIC SCHOOLS LANE $5,971 $1,238 $269 $1,199 $8,678 $7,231D0469 LANSING LEAVENWORTH $2,649 $225 $305 $507 $3,687 $4,307D0470 ARKANSAS CITY COWLEY $2,781 $126 $375 $640 $3,922 $4,333D0471 DEXTER COWLEY $4,324 $1,354 $8 $795 $6,481 $5,775D0473 CHAPMAN DICKINSON $3,043 $226 $448 $799 $4,516 $5,084D0474 HAVILAND PUBLIC SCHOOLS KIOWA $4,410 $938 $550 $1,123 $7,020 $6,527D0475 JUNCTION CITY GEARY $2,503 $88 $371 $657 $3,619 $3,976D0476 COPELAND GRAY $5,205 $1,121 $284 $1,363 $7,973 $7,024D0477 INGALLS GRAY $3,616 $336 $424 $698 $5,074 $5,399D0479 CREST ANDERSON $3,894 $400 $485 $873 $5,651 $5,604D0480 LIBERAL SEWARD $2,650 $126 $282 $511 $3,569 $3,707D0481 RURAL VISTA DICKINSON $3,573 $325 $347 $684 $4,928 $5,459D0482 DIGHTON LANE $3,973 $514 $555 $901 $5,943 $6,024D0483 KISMET-PLAINS SEWARD $3,807 $213 $462 $775 $5,256 $4,753D0484 FREDONIA WILSON $3,489 $286 $645 $647 $5,066 $4,667D0486 ELWOOD DONIPHAN $3,835 $374 $265 $671 $5,146 $5,159D0487 HERINGTON DICKINSON $3,698 $313 $467 $1,336 $5,814 $5,294D0488 AXTELL MARSHALL $4,019 $368 $548 $682 $5,617 $6,264D0489 HAYS ELLIS $3,502 $233 $429 $544 $4,708 $4,730D0490 EL DORADO BUTLER $2,712 $93 $372 $798 $3,975 $4,478D0491 EUDORA DOUGLAS $2,810 $274 $387 $1,121 $4,592 $4,850D0492 FLINTHILLS BUTLER $3,724 $393 $505 $967 $5,589 $5,811D0493 COLUMBUS CHEROKEE $3,154 $220 $449 $623 $4,447 $4,747D0494 SYRACUSE HAMILTON $3,531 $469 $338 $1,263 $5,601 $5,127D0495 FT LARNED PAWNEE $3,232 $356 $428 $1,283 $5,299 $5,595D0496 PAWNEE HEIGHTS PAWNEE $5,164 $881 $631 $979 $7,655 $6,328D0497 LAWRENCE DOUGLAS $3,012 $73 $354 $563 $4,002 $4,269D0498 VALLEY HEIGHTS MARSHALL $3,693 $326 $440 $916 $5,376 $5,350D0499 GALENA CHEROKEE $3,485 $340 $633 $971 $5,430 $5,535D0500 KANSAS CITY WYANDOTTE $2,692 $48 $352 $732 $3,825 $3,798D0501 TOPEKA PUBLIC SCHOOLS SHAWNEE $2,744 $49 $334 $494 $3,621 $3,978D0502 LEWIS EDWARDS $4,380 $644 $517 $740 $6,280 $5,908D0503 PARSONS LABETTE $2,935 $271 $362 $671 $4,239 $4,495D0504 OSWEGO LABETTE $3,403 $476 $712 $504 $5,095 $5,520D0505 CHETOPA LABETTE $4,304 $886 $483 $580 $6,253 $5,537D0506 LABETTE COUNTY LABETTE $2,900 $161 $293 $664 $4,018 $4,598D0507 SATANTA HASKELL $3,875 $548 $425 $1,012 $5,861 $5,886

District # District County
Instuctional Spending per Pupil
General Administration
per Pupil
School Administration
per PupilPlant M&O per Pupil
Total Spending per Pupil
Predicted Spending per Pupil
D0508 BAXTER SPRINGS CHEROKEE $3,164 $318 $433 $811 $4,726 $4,599D0509 SOUTH HAVEN SUMNER $3,595 $635 $289 $965 $5,485 $5,412D0511 ATTICA HARPER $4,874 $737 $614 $846 $7,071 $6,058D0512 SHAWNEE MISSION PUBLIC SCHOO JOHNSON $3,242 $56 $330 $634 $4,262 $4,036

APPENDIX IV
ENROLLMENT, CAPACITY AND YEAR BUILT FOR SCHOOLS
Distict Number District Name
Building Number School Name Enrollment Capacity
Year Built
D0101 Erie-St Paul 102 Erie Elem 349 300 1938D0101 Erie-St Paul 104 Erie High 207 220 1953D0101 Erie-St Paul 108 Galesburg Elem 105 141 1954D0101 Erie-St Paul 116 St Paul Elem 115 140 1954D0101 Erie-St Paul 118 St Paul High 159 120 1922D0101 Erie-St Paul 120 Thayer Elem 111 150 1947D0101 Erie-St Paul 122 Thayer High 131 130 1947D0102 Cimarron-Ensign 124 Cimarron Elem 323 450 1967D0102 Cimarron-Ensign 125 Cimarron High 307 350 1995D0103 Cheylin 2780 Cheylin West Jr/Sr High 86 140 1921D0103 Cheylin 3374 Cheylin West Elem 102 140 1921D0104 White Rock 2306 White Rock Middle 43 80 1956D0104 White Rock 2320 White Rock Elem 60 100 1968D0104 White Rock 2322 White Rock High 65 120 1956D0200 Greeley County Schools 132 Greeley County Elem School 172 250 1956D0200 Greeley County Schools 134 Greeley County High School 144 250 1931D0202 Turner-Kansas City 150 Highland Middle School 573 625 1964D0202 Turner-Kansas City 152 Junction Elem 138 150 1929D0202 Turner-Kansas City 154 Junction Primary 256 260 1955D0202 Turner-Kansas City 156 Morris Elem 131 125 1952D0202 Turner-Kansas City 158 Muncie Elem 353 410 1951D0202 Turner-Kansas City 160 Oak Grove Elem 323 650 1950D0202 Turner-Kansas City 162 Pierson Jr High 544 600 1964D0202 Turner-Kansas City 164 Turner East Elem 352 300 1916D0202 Turner-Kansas City 168 Turner High 680 700 1953D0202 Turner-Kansas City 170 Career Opportunity Center 68 80 1931D0203 Piper-Kansas City 180 Piper Elem School East 277 450 1994D0203 Piper-Kansas City 188 Piper Elem School West 252 390 1920D0203 Piper-Kansas City 189 Piper Middle 312 510 1990D0203 Piper-Kansas City 190 Piper High 466 575 1965D0204 Bonner Springs 210 Bonner Springs Elementary 487 525 1956D0204 Bonner Springs 214 Bonner Springs High 729 775 1965D0204 Bonner Springs 216 Edwardsville Elem 481 525 1958

Distict Number District Name
Building Number School Name Enrollment Capacity
Year Built
D0204 Bonner Springs 221 Robert E Clark Middle 538 600 1983D0205 Bluestem 238 Leon Elem 203 200D0205 Bluestem 240 Bluestem High 256 300 1972D0205 Bluestem 246 Haverhill Elem 154 200 1957D0205 Bluestem 250 Bluestem Middle School 187 250 1978D0206 Remington-Whitewater 260 Frederic Remington High 160 300 1963D0206 Remington-Whitewater 272 Potwin Elem 203 300 1950D0206 Remington-Whitewater 274 Whitewater Elem 190 250 1923D0207 Ft Leavenworth 286 Bradley Elem 406 550 1965D0207 Ft Leavenworth 288 Eisenhower Elem 536 550 1952D0207 Ft Leavenworth 290 MacArthur Elem 567 550 1956D0207 Ft Leavenworth 294 Patton Jr High 367 500 1958D0208 Wakeeney 306 WaKeeney Elem 321 500 1950D0208 Wakeeney 308 Trego Community High 215 400 1951D0209 Moscow Public Schools 342 Moscow Elem 98 130 1936D0209 Moscow Public Schools 344 Moscow High 108 200 1959D0210 Hugoton Public Schools 356 Hugoton Elem 548 650 1947D0210 Hugoton Public Schools 357 Hugoton Middle 175 200 1961D0210 Hugoton Public Schools 358 Hugoton High 310 325 1931D0211 Norton Community Schools 374 Eisenhower Elem 363 500 1957D0211 Norton Community Schools 378 Norton Jr High 116 150 1937D0211 Norton Community Schools 380 Norton High 260 375 1976D0212 Northern Valley 404 Almena Elem 66 100 1924D0212 Northern Valley 406 Northern Valley High 74 200 1923D0212 Northern Valley 408 Long Island Elem 61 100 1917D0213 West Solomon Valley Sch 424 Lenora Elem 71 160 1955D0213 West Solomon Valley Sch 426 Lenora High 31 180 1924D0214 Ulysses 443 Kepley Middle School 433 500 1951D0214 Ulysses 444 Sullivan Elem 325 410 1954D0214 Ulysses 446 Ulysses High 503 585 1969D0214 Ulysses 450 Hickok Elem 408 475 1962D0214 Ulysses 452 Red Rock Elem 111 200 1947D0215 Lakin 466 Lakin Elem 428 300 1950D0215 Lakin 467 Lakin Middle 138 350 1986D0215 Lakin 468 Lakin High 209 300 1931D0216 Deerfield 482 Deerfield Elem 171 240 1957D0216 Deerfield 483 Deerfield Middle School 79 150 1992D0216 Deerfield 484 Deerfield High 132 270 1950

Distict Number District Name
Building Number School Name Enrollment Capacity
Year Built
D0217 Rolla 496 Rolla Elem. (K-8) 164 210 1946D0217 Rolla 498 Rolla High (9-12 69 150 1925D0218 Elkhart 514 Elkhart Middle School 188 250 1957D0218 Elkhart 516 Elkhart Elem 204 300 1958D0218 Elkhart 520 Elkhart High 190 250 1962D0219 Minneola 536 Minneola Elem 182 252 1956D0219 Minneola 538 Minneola High 100 200 1930D0220 Ashland 552 Ashland Elem 144 165 1937D0220 Ashland 553 Ashland Middle 38 150 1962D0220 Ashland 554 Ashland High 96 150 1962D0221 North Central 576 North Central Elem 99 150 1925D0221 North Central 582 North Central High 51 200 1926D0222 Washington Schools 594 Washington Elem 196 150 1931D0222 Washington Schools 596 Washington High 184 350 1965D0223 Barnes 620 Hanover Elem 178 s 1930D0223 Barnes 622 Hanover High 92 140 1930D0223 Barnes 628 Linn Elem 156 145 1950D0223 Barnes 630 Linn High 77 150 1950D0224 Clifton-Clyde 658 Clifton Elem K-5 80 150 1980D0224 Clifton-Clyde 660 Clifton-Clyde Elem 6-8 90 250 1949D0224 Clifton-Clyde 666 Clyde Elem K-5 81 200 1917D0224 Clifton-Clyde 668 Clifton-Clyde Sr High 129 300 1958D0225 Fowler 684 Fowler Elem 81 200 1965D0225 Fowler 686 Fowler High 111 275 1950D0226 Meade 700 Meade Elem 337 350 1926D0226 Meade 702 Meade High 140 160 1971D0227 Jetmore 722 Jetmore Elem 237 300 1960D0227 Jetmore 724 Jetmore High 112 300 1951D0228 Hanston 748 Hanston Elem 52 140 1954D0228 Hanston 750 Hanston High 88 125 1984D0229 Blue Valley 756 Lakewood Elementary 399 587 1999D0229 Blue Valley 767 Oxford Middle 595 725 1988D0229 Blue Valley 768 Stanley Elem 564 587 1988D0229 Blue Valley 769 Blue Valley North High 1610 1600 1986D0229 Blue Valley 770 Blue Valley High 1576 1470 1971D0229 Blue Valley 771 Morse Elem 440 490 1980D0229 Blue Valley 772 Valley Park Elem 303 587 1985D0229 Blue Valley 773 Leawood Elem 398 529 1978
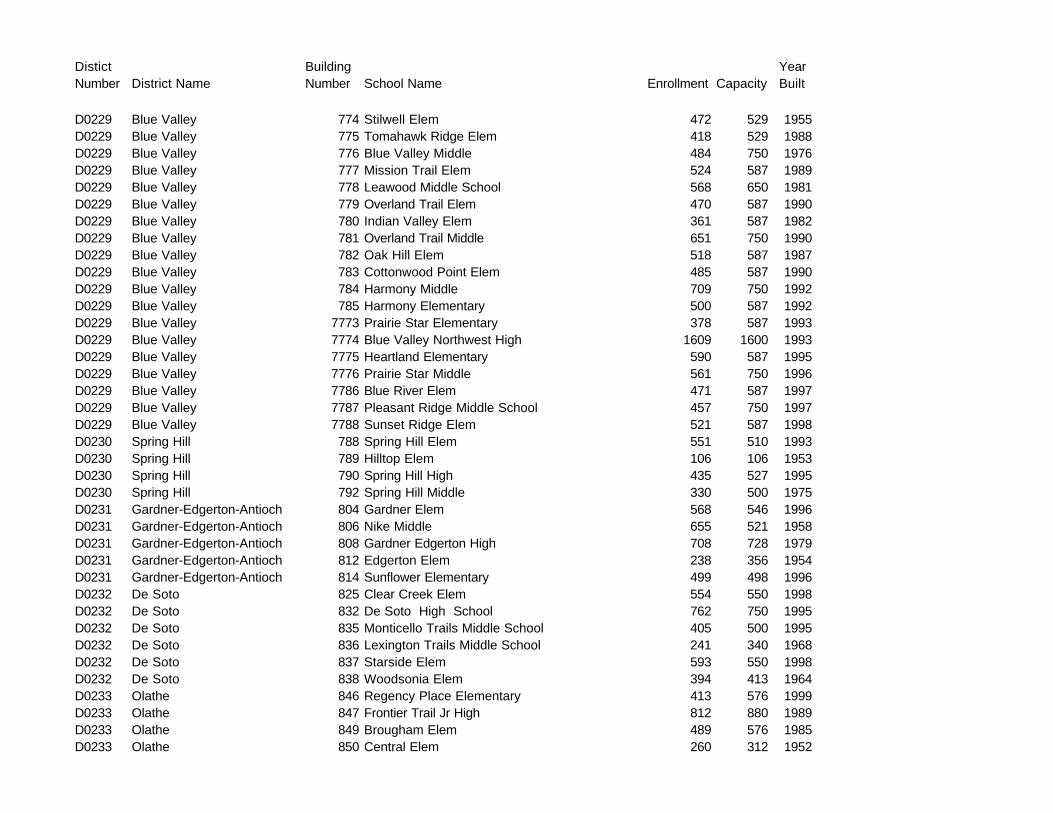
Distict Number District Name
Building Number School Name Enrollment Capacity
Year Built
D0229 Blue Valley 774 Stilwell Elem 472 529 1955D0229 Blue Valley 775 Tomahawk Ridge Elem 418 529 1988D0229 Blue Valley 776 Blue Valley Middle 484 750 1976D0229 Blue Valley 777 Mission Trail Elem 524 587 1989D0229 Blue Valley 778 Leawood Middle School 568 650 1981D0229 Blue Valley 779 Overland Trail Elem 470 587 1990D0229 Blue Valley 780 Indian Valley Elem 361 587 1982D0229 Blue Valley 781 Overland Trail Middle 651 750 1990D0229 Blue Valley 782 Oak Hill Elem 518 587 1987D0229 Blue Valley 783 Cottonwood Point Elem 485 587 1990D0229 Blue Valley 784 Harmony Middle 709 750 1992D0229 Blue Valley 785 Harmony Elementary 500 587 1992D0229 Blue Valley 7773 Prairie Star Elementary 378 587 1993D0229 Blue Valley 7774 Blue Valley Northwest High 1609 1600 1993D0229 Blue Valley 7775 Heartland Elementary 590 587 1995D0229 Blue Valley 7776 Prairie Star Middle 561 750 1996D0229 Blue Valley 7786 Blue River Elem 471 587 1997D0229 Blue Valley 7787 Pleasant Ridge Middle School 457 750 1997D0229 Blue Valley 7788 Sunset Ridge Elem 521 587 1998D0230 Spring Hill 788 Spring Hill Elem 551 510 1993D0230 Spring Hill 789 Hilltop Elem 106 106 1953D0230 Spring Hill 790 Spring Hill High 435 527 1995D0230 Spring Hill 792 Spring Hill Middle 330 500 1975D0231 Gardner-Edgerton-Antioch 804 Gardner Elem 568 546 1996D0231 Gardner-Edgerton-Antioch 806 Nike Middle 655 521 1958D0231 Gardner-Edgerton-Antioch 808 Gardner Edgerton High 708 728 1979D0231 Gardner-Edgerton-Antioch 812 Edgerton Elem 238 356 1954D0231 Gardner-Edgerton-Antioch 814 Sunflower Elementary 499 498 1996D0232 De Soto 825 Clear Creek Elem 554 550 1998D0232 De Soto 832 De Soto High School 762 750 1995D0232 De Soto 835 Monticello Trails Middle School 405 500 1995D0232 De Soto 836 Lexington Trails Middle School 241 340 1968D0232 De Soto 837 Starside Elem 593 550 1998D0232 De Soto 838 Woodsonia Elem 394 413 1964D0233 Olathe 846 Regency Place Elementary 413 576 1999D0233 Olathe 847 Frontier Trail Jr High 812 880 1989D0233 Olathe 849 Brougham Elem 489 576 1985D0233 Olathe 850 Central Elem 260 312 1952

Distict Number District Name
Building Number School Name Enrollment Capacity
Year Built
D0233 Olathe 851 Indian Creek Elem 431 576 1985D0233 Olathe 852 Fairview Elem 426 464 1964D0233 Olathe 853 Briarwood Elem 483 576 1988D0233 Olathe 854 Ridgeview Elem 248 480 1956D0233 Olathe 855 Walnut Grove Elem 453 624 1985D0233 Olathe 856 Prairie Center Elem 429 576 1980D0233 Olathe 857 Pioneer Trail Jr High 590 800 1986D0233 Olathe 858 Washington Elem 434 636 1975D0233 Olathe 859 Countryside Elementary 529 576 1988D0233 Olathe 860 Westview Elem 269 336 1954D0233 Olathe 861 Santa Fe Trail Jr High 777 960 1968D0233 Olathe 862 Oregon Trail Jr High 732 780 1976D0233 Olathe 863 Indian Trail Jr High 734 900 1981D0233 Olathe 864 Olathe North Sr High 1418 1520 1958D0233 Olathe 865 Olathe South Sr High 1442 1560 1981D0233 Olathe 867 Heartland Learning Center 144 125 1976D0233 Olathe 868 Meadow Lane Elem 384 480 1951D0233 Olathe 870 Rolling Ridge Elem 473 528 1972D0233 Olathe 871 Northview Elem 335 456 1967D0233 Olathe 872 Havencroft Elem 392 480 1972D0233 Olathe 874 Scarborough Elem 592 576 1977D0233 Olathe 875 Heritage Elementary 434 480 1988D0233 Olathe 876 Black Bob Elem 504 576 1978D0233 Olathe 877 Tomahawk Elem 399 552 1980D0233 Olathe 885 Olathe East Sr High 1384 1540 1992D0233 Olathe 2781 Green Springs Elem 432 552 1991D0233 Olathe 2782 Mahaffie Elem 501 576 1991D0233 Olathe 2783 Pleasant Ridge Elem 474 576 1991D0233 Olathe 2784 Heatherstone Elem 530 576 1995D0233 Olathe 2785 Bentwood Elem 564 576 1996D0233 Olathe 2786 California Trail Jr High 921 850 1996D0233 Olathe 2787 Cedar Creek Elem 341 576 1997D0234 Fort Scott 898 Eugene Ware Elem 418 500 1934D0234 Fort Scott 900 Winfield Scott Elem 502 540 1956D0234 Fort Scott 902 Fort Scott Middle School 170 600 1918D0234 Fort Scott 904 Fort Scott Sr High 707 700 1979D0235 Uniontown 964 Uniontown High School 175 290 1958D0235 Uniontown 966 West Bourbon Elementary 356 320 1975
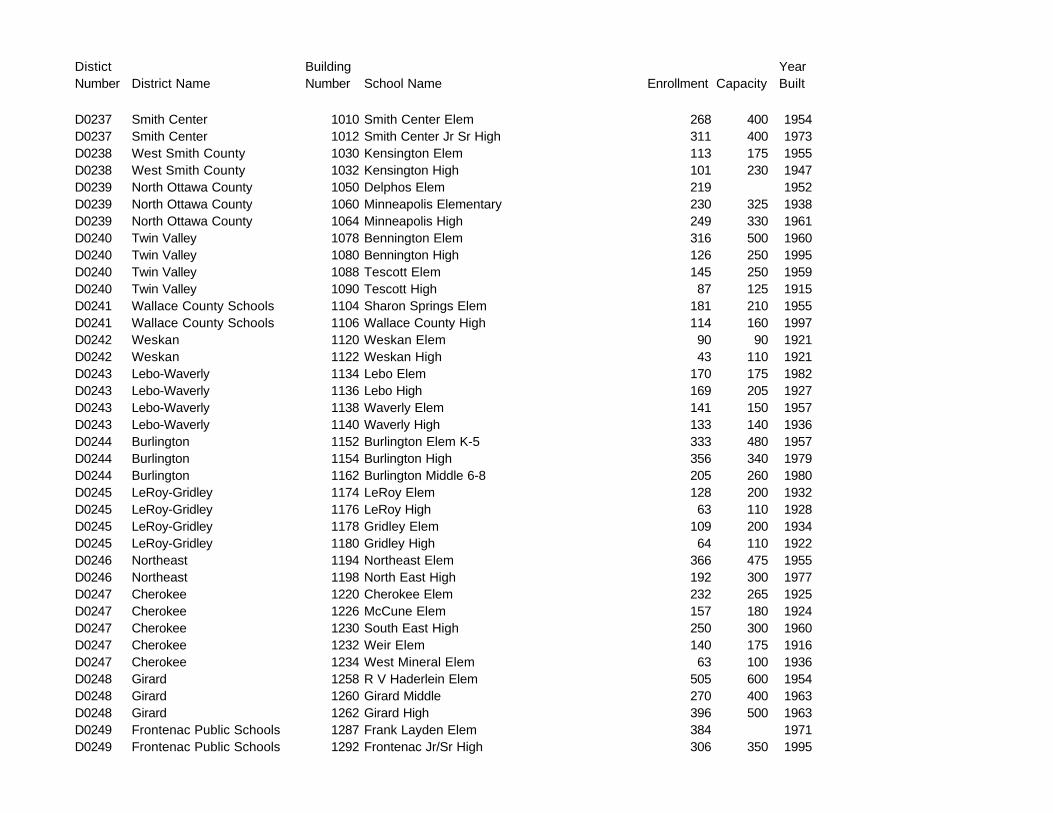
Distict Number District Name
Building Number School Name Enrollment Capacity
Year Built
D0237 Smith Center 1010 Smith Center Elem 268 400 1954D0237 Smith Center 1012 Smith Center Jr Sr High 311 400 1973D0238 West Smith County 1030 Kensington Elem 113 175 1955D0238 West Smith County 1032 Kensington High 101 230 1947D0239 North Ottawa County 1050 Delphos Elem 219 1952D0239 North Ottawa County 1060 Minneapolis Elementary 230 325 1938D0239 North Ottawa County 1064 Minneapolis High 249 330 1961D0240 Twin Valley 1078 Bennington Elem 316 500 1960D0240 Twin Valley 1080 Bennington High 126 250 1995D0240 Twin Valley 1088 Tescott Elem 145 250 1959D0240 Twin Valley 1090 Tescott High 87 125 1915D0241 Wallace County Schools 1104 Sharon Springs Elem 181 210 1955D0241 Wallace County Schools 1106 Wallace County High 114 160 1997D0242 Weskan 1120 Weskan Elem 90 90 1921D0242 Weskan 1122 Weskan High 43 110 1921D0243 Lebo-Waverly 1134 Lebo Elem 170 175 1982D0243 Lebo-Waverly 1136 Lebo High 169 205 1927D0243 Lebo-Waverly 1138 Waverly Elem 141 150 1957D0243 Lebo-Waverly 1140 Waverly High 133 140 1936D0244 Burlington 1152 Burlington Elem K-5 333 480 1957D0244 Burlington 1154 Burlington High 356 340 1979D0244 Burlington 1162 Burlington Middle 6-8 205 260 1980D0245 LeRoy-Gridley 1174 LeRoy Elem 128 200 1932D0245 LeRoy-Gridley 1176 LeRoy High 63 110 1928D0245 LeRoy-Gridley 1178 Gridley Elem 109 200 1934D0245 LeRoy-Gridley 1180 Gridley High 64 110 1922D0246 Northeast 1194 Northeast Elem 366 475 1955D0246 Northeast 1198 North East High 192 300 1977D0247 Cherokee 1220 Cherokee Elem 232 265 1925D0247 Cherokee 1226 McCune Elem 157 180 1924D0247 Cherokee 1230 South East High 250 300 1960D0247 Cherokee 1232 Weir Elem 140 175 1916D0247 Cherokee 1234 West Mineral Elem 63 100 1936D0248 Girard 1258 R V Haderlein Elem 505 600 1954D0248 Girard 1260 Girard Middle 270 400 1963D0248 Girard 1262 Girard High 396 500 1963D0249 Frontenac Public Schools 1287 Frank Layden Elem 384 1971D0249 Frontenac Public Schools 1292 Frontenac Jr/Sr High 306 350 1995

Distict Number District Name
Building Number School Name Enrollment Capacity
Year Built
D0250 Pittsburg 1302 Geo E Nettels Elem 385 340 1954D0250 Pittsburg 1304 Lakeside Elem 552 575 1926D0250 Pittsburg 1310 Westside Elem 301 265 1951D0250 Pittsburg 1314 Pittsburg Middle School 570 800 1921D0250 Pittsburg 1316 Pittsburg High 853 900 1978D0251 North Lyon County 1346 Admire Elem 150 200 1925D0251 North Lyon County 1350 Americus Elem 231 250 1940D0251 North Lyon County 1358 Northern Heights 249 275 1955D0251 North Lyon County 1360 Reading Elem 94 125 1995D0252 Southern Lyon County 1382 Hartford High 114 130 1915D0252 Southern Lyon County 1388 Neosho Rapids K Thru 8 248 320 1936D0252 Southern Lyon County 1392 Olpe Elem K-8 184 220 1968D0252 Southern Lyon County 1394 Olpe High 131 130 1952D0253 Emporia 1410 Mary Herbert Elem 256 288 1929D0253 Emporia 1412 Maynard Elem 223 245 1951D0253 Emporia 1414 Village Elem 386 365 1963D0253 Emporia 1415 Lowther South Intermediate School 5th 318 350 1924D0253 Emporia 1416 Walnut Elem 254 305 1950D0253 Emporia 1418 W A White Elem 312 305 1949D0253 Emporia 1420 Emporia Alternative School 31 80 1942D0253 Emporia 1422 Emporia Middle School 762 750 1993D0253 Emporia 1423 Lowther North Intermediate School 6th 358 350 1923D0253 Emporia 1424 Emporia High 1589 1350 1974D0253 Emporia 1428 Logan Ave Elem 277 288 1973D0253 Emporia 1450 Butcher Children's School 122 131 1961D0254 Barber County North 1470 Medicine Lodge Middle School 212 250 1919D0254 Barber County North 1472 Medicine Lodge Primary Elem 277 300 1950D0254 Barber County North 1474 Medicine Lodge High 248 305 1960D0255 South Barber 1508 South Barber Middle 86 150 1951D0255 South Barber 1516 South Barber Elem 124 220 1935D0255 South Barber 1518 South Barber High 131 200 1973D0256 Marmaton Valley 1536 Marmaton Valley Elem 205 350 1937D0256 Marmaton Valley 1538 Marmaton Valley High 226 360 1951D0257 Iola 1556 Jefferson Elem 267 306 1939D0257 Iola 1558 Lincoln Elem 275 312 1939D0257 Iola 1560 McKinley Elem 139 160 1950D0257 Iola 1562 Iola Middle School 390 275 1924D0257 Iola 1564 Iola Sr High 515 500 1916

Distict Number District Name
Building Number School Name Enrollment Capacity
Year Built
D0257 Iola 1566 LaHarpe Elem 70 125 1977D0257 Iola 1578 Crossroads Alternative School 22 966 1970D0258 Humboldt 1590 Humboldt Elem School 200 500 1962D0258 Humboldt 1592 Humboldt High School 178 500 1922D0258 Humboldt 1600 Humboldt Middle School 130 700 1996D0259 Wichita 1614 Adams Elem 290 450 1948D0259 Wichita 1616 Alcott/Burger King Academy 81 123 1926D0259 Wichita 1618 Allen Elem 292 300 1952D0259 Wichita 1622 Benton Elem 370 450 1957D0259 Wichita 1623 Beech Elem 554 600 1984D0259 Wichita 1624 Black Traditional Magnet Elem 332 332 1954D0259 Wichita 1626 Booth Early Childhood 234 300 1954D0259 Wichita 1632 Bryant Core Knowledge Magent 367 480 1956D0259 Wichita 1634 Buckner Performing Arts Magnet Elem 314 600 1955D0259 Wichita 1636 Caldwell Elem 438 450 1950D0259 Wichita 1640 Cessna Elem 365 300 1960D0259 Wichita 1644 Chisholm Trail Elem 529 600 1954D0259 Wichita 1646 Clark Elem 285 300 1956D0259 Wichita 1648 Cleaveland Traditional Magnet Elementary 316 300 1956D0259 Wichita 1650 Cloud Elem 753 600 1954D0259 Wichita 1652 College Hill Elem 462 475 1977D0259 Wichita 1653 Colvin Elem 743 850 1978D0259 Wichita 1654 Dodge/Edison Partnership 626 625 1938D0259 Wichita 1658 Earhart Environ Magnet Elem 322 330 1946D0259 Wichita 1659 Emerson Open Magnet Elem 238 300 1953D0259 Wichita 1660 Enterprise Elem 413 450 1919D0259 Wichita 1674 Franklin Elem 340 350 1941D0259 Wichita 1676 Funston Elem 408 450 1926D0259 Wichita 1677 Gammon Elem 615 600 1984D0259 Wichita 1678 Gardiner Elem 472 500 1927D0259 Wichita 1682 Greiffenstein Special Ed Center 60 100 1950D0259 Wichita 1684 Griffith Elem 338 333 1958D0259 Wichita 1686 Price/Harris Communications Magnet 231 200 1956D0259 Wichita 1688 Harry Street Elem 277 300 1889D0259 Wichita 1690 Hyde Intl Studies/Commun Elem Magnet 314 333 1930D0259 Wichita 1692 Ingalls Edison Academy 666 700 1926D0259 Wichita 1694 Horace Mann/Irving Foreign Lang Mag 405 419 1941D0259 Wichita 1696 Isely Edison Academy 274 450 1949

Distict Number District Name
Building Number School Name Enrollment Capacity
Year Built
D0259 Wichita 1698 Jefferson Elem 373 450 1942D0259 Wichita 1702 Kellogg Science/Tech Magnet Elem 292 300 1941D0259 Wichita 1704 Kelly Liberal Arts Academy 539 600 1957D0259 Wichita 1706 Kensler Elem 557 600 1958D0259 Wichita 1708 Bostic Traditional Magnet Elem 343 450 1956D0259 Wichita 1710 Lewis Open Magnet Elem 211 200 1954D0259 Wichita 1712 Lawrence Elem 468 450 1952D0259 Wichita 1715 Levy Sp Ed Center 118 115 1981D0259 Wichita 1716 Lincoln Elem 251 300 1938D0259 Wichita 1718 Linwood Elementary 258 300 1910D0259 Wichita 1720 Little Early Childhood Ed Ctr 205 250 1954D0259 Wichita 1724 L'Ouverture Computer Technology Magnet 370 450 1951D0259 Wichita 1736 McCollom Elem 402 450 1959D0259 Wichita 1740 McLean Science/Tech Magnet Elem 304 300 1955D0259 Wichita 1742 Metro Meridian Alt High 180 200 1924D0259 Wichita 1744 Minneha Elem 649 700 1948D0259 Wichita 1746 Mueller Elem 573 600 1952D0259 Wichita 1754 O K Elem 301 300 1924D0259 Wichita 1756 Horace Mann/Park Foreign Lang Magnet Ele 194 450 1921D0259 Wichita 1758 Payne Elem 343 450 1954D0259 Wichita 1760 Peterson Elem 508 520 1932D0259 Wichita 1764 Price/Harris Communications Magnet 226 200 1956D0259 Wichita 1766 Riverside Cultural Arts / History Magnet 262 300 1910D0259 Wichita 1772 Seltzer Elem 341 700 1951D0259 Wichita 1778 Pleasant Valley Elem 322 450 1948D0259 Wichita 1780 Sowers Special Education Center 116 100 1952D0259 Wichita 1782 Stanley Elem 368 450 1930D0259 Wichita 1790 Washington Accelerated Learning Elem 410 470 1919D0259 Wichita 1792 Wells Alternative Middle School 101 85 1956D0259 Wichita 1796 White Elem 267 300 1957D0259 Wichita 1798 Anderson Elem 554 600 1953D0259 Wichita 1800 Woodland Health / Wellness Magnet Elem 291 300 1889D0259 Wichita 1802 Woodman Elem 650 600 1962D0259 Wichita 1804 Allison Traditional Magnet Middle 499 500 1919D0259 Wichita 1805 Arkansas Gateway Middle School 21 90 1942D0259 Wichita 1806 Brooks Magnet Middle School 688 750 1956D0259 Wichita 1808 Curtis Middle School 833 800 1953D0259 Wichita 1810 Coleman Middle School 1019 800 1965

Distict Number District Name
Building Number School Name Enrollment Capacity
Year Built
D0259 Wichita 1812 Hadley Middle School 692 750 1957D0259 Wichita 1814 Hamilton Middle School 553 600 1919D0259 Wichita 1816 Jardine/Edison Partnership Middle 822 900 1957D0259 Wichita 1818 Horace Mann Foreign Lang Elem Magnet 468 600 1917D0259 Wichita 1820 Marshall Middle School 554 600 1939D0259 Wichita 1823 Northeast Magnet High & Downtown Law Cam 570 530 1951D0259 Wichita 1824 Mayberry Magnet Middle School 631 750 1954D0259 Wichita 1826 Mead Middle School 495 600 1951D0259 Wichita 1828 Pleasant Valley Middle School 600 750 1955D0259 Wichita 1830 Robinson Middle School 709 750 1932D0259 Wichita 1833 Wilbur Middle School 916 1000 1966D0259 Wichita 1834 Truesdell Middle School 1036 1051 1955D0259 Wichita 1836 East High 2181 2200 1922D0259 Wichita 1837 Metro Blvd Alt High 180 180 1924D0259 Wichita 1838 North High 1691 1750 1929D0259 Wichita 1840 South High 1597 1750 1959D0259 Wichita 1842 Southeast High 1808 1800 1957D0259 Wichita 1844 West High 1469 1600 1953D0259 Wichita 1846 Heights High 1477 1800 1961D0259 Wichita 1847 Northwest High 1563 1800 1978D0259 Wichita 1852 Metro Midtown Alt High 165 180 1913D0259 Wichita 1947 Arkansas Avenue Gateway High School 11 1947D0259 Wichita 1948 Chisholm Life Skills Center 107 130 1949D0260 Derby 1926 Derby Middle Sch 1098 1118 1951D0260 Derby 1927 El Paso Elem 375 364 1966D0260 Derby 1928 Oaklawn Elem 226 294 1954D0260 Derby 1929 Derby Sixth Grade Center 524 546 1951D0260 Derby 1930 Paul B Cooper Elem 255 272 1954D0260 Derby 1932 Pleasantview Elem 310 362 1954D0260 Derby 1934 Swaney Elem 389 408 1956D0260 Derby 1936 Wineteer Elem 533 518 1959D0260 Derby 1938 Carlton Math Science Magnet 238 229 1960D0260 Derby 1941 Derby Hills Elem 440 432 1985D0260 Derby 1942 Derby High School 2079 1850 1994D0260 Derby 1944 Tanglewood Elem 350 408 1982D0261 Haysville 1956 Campus High Haysville 1091 1400 1960D0261 Haysville 1957 Haysville Alternative High 335 170 1997D0261 Haysville 1958 Haysville Middle School 1008 1200 1960
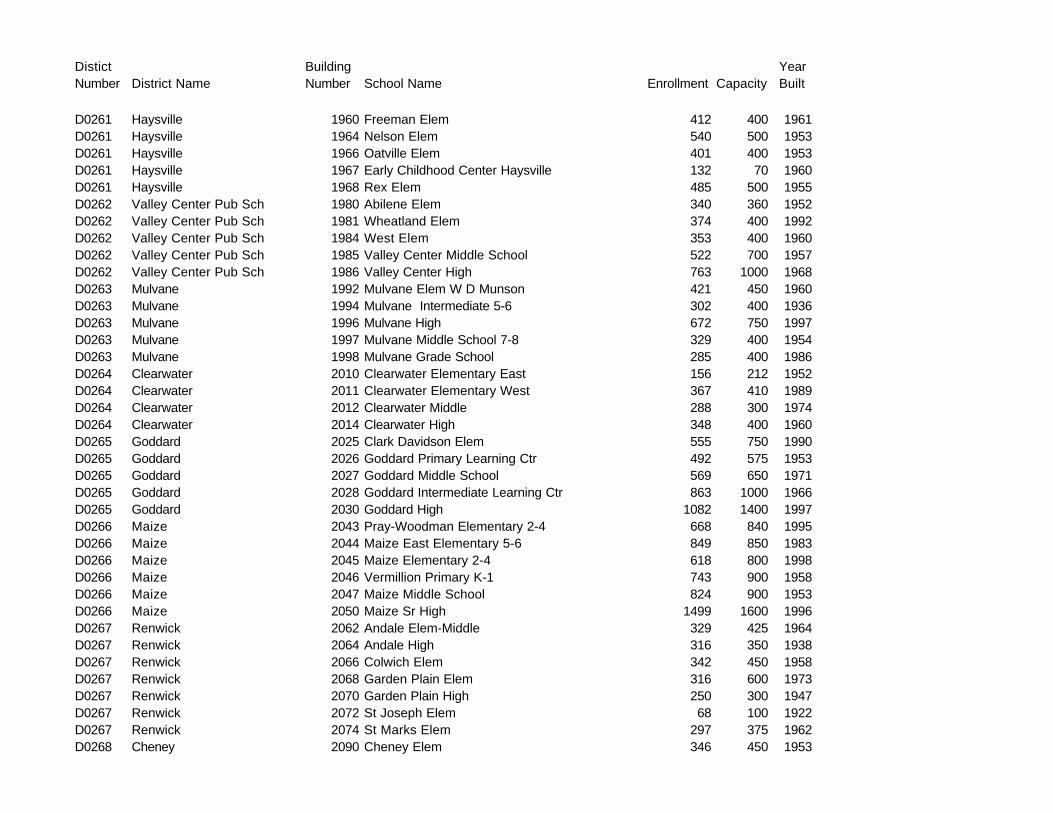
Distict Number District Name
Building Number School Name Enrollment Capacity
Year Built
D0261 Haysville 1960 Freeman Elem 412 400 1961D0261 Haysville 1964 Nelson Elem 540 500 1953D0261 Haysville 1966 Oatville Elem 401 400 1953D0261 Haysville 1967 Early Childhood Center Haysville 132 70 1960D0261 Haysville 1968 Rex Elem 485 500 1955D0262 Valley Center Pub Sch 1980 Abilene Elem 340 360 1952D0262 Valley Center Pub Sch 1981 Wheatland Elem 374 400 1992D0262 Valley Center Pub Sch 1984 West Elem 353 400 1960D0262 Valley Center Pub Sch 1985 Valley Center Middle School 522 700 1957D0262 Valley Center Pub Sch 1986 Valley Center High 763 1000 1968D0263 Mulvane 1992 Mulvane Elem W D Munson 421 450 1960D0263 Mulvane 1994 Mulvane Intermediate 5-6 302 400 1936D0263 Mulvane 1996 Mulvane High 672 750 1997D0263 Mulvane 1997 Mulvane Middle School 7-8 329 400 1954D0263 Mulvane 1998 Mulvane Grade School 285 400 1986D0264 Clearwater 2010 Clearwater Elementary East 156 212 1952D0264 Clearwater 2011 Clearwater Elementary West 367 410 1989D0264 Clearwater 2012 Clearwater Middle 288 300 1974D0264 Clearwater 2014 Clearwater High 348 400 1960D0265 Goddard 2025 Clark Davidson Elem 555 750 1990D0265 Goddard 2026 Goddard Primary Learning Ctr 492 575 1953D0265 Goddard 2027 Goddard Middle School 569 650 1971D0265 Goddard 2028 Goddard Intermediate Learning Ctr 863 1000 1966D0265 Goddard 2030 Goddard High 1082 1400 1997D0266 Maize 2043 Pray-Woodman Elementary 2-4 668 840 1995D0266 Maize 2044 Maize East Elementary 5-6 849 850 1983D0266 Maize 2045 Maize Elementary 2-4 618 800 1998D0266 Maize 2046 Vermillion Primary K-1 743 900 1958D0266 Maize 2047 Maize Middle School 824 900 1953D0266 Maize 2050 Maize Sr High 1499 1600 1996D0267 Renwick 2062 Andale Elem-Middle 329 425 1964D0267 Renwick 2064 Andale High 316 350 1938D0267 Renwick 2066 Colwich Elem 342 450 1958D0267 Renwick 2068 Garden Plain Elem 316 600 1973D0267 Renwick 2070 Garden Plain High 250 300 1947D0267 Renwick 2072 St Joseph Elem 68 100 1922D0267 Renwick 2074 St Marks Elem 297 375 1962D0268 Cheney 2090 Cheney Elem 346 450 1953

Distict Number District Name
Building Number School Name Enrollment Capacity
Year Built
D0268 Cheney 2091 Cheney Middle School 6-8 200 300 1970D0268 Cheney 2092 Cheney High 221 225 1996D0269 Palco 2110 Damar Jr High 38 150 1937D0269 Palco 2114 Palco Elem 68 180 1922D0269 Palco 2116 Palco High 64 250 1954D0270 Plainville 2136 Plainville Elem 307 450 1938D0270 Plainville 2138 Plainville High 164 350 1951D0271 Stockton 2156 Stockton Elem 304 450 1995D0271 Stockton 2158 Stockton High 145 200 1954D0272 Waconda 2170 Cawker City Elem 56 155 1961D0272 Waconda 2172 Waconda East High 77 147 1950D0272 Waconda 2174 Downs Elem 157 198 1962D0272 Waconda 2176 Downs High 93 161 1929D0272 Waconda 2178 Glen Elder Elem 90 125 1938D0272 Waconda 2186 Tipton Elem 79 141 1976D0273 Beloit 2214 Beloit Elem 410 456 1954D0273 Beloit 2218 Beloit Jr-Sr High 414 520 1976D0274 Oakley 2258 Monument Elem 73 136 1928D0274 Oakley 2262 Oakley Elem 79 166 1961D0274 Oakley 2266 Oakley Sr High 189 229 1954D0274 Oakley 2268 Oakley Middle School 142 161 1923D0275 Triplains 2286 Winona Elem 52 175 1926D0275 Triplains 2288 Winona High 40 175 1926D0278 Mankato 2346 Mankato Elem 135 325 1956D0278 Mankato 2348 Mankato Jr High 48 150 1969D0278 Mankato 2350 Mankato High 101 150 1969D0279 Jewell 2370 Randall Elem 83 130 1924D0279 Jewell 2372 Jewell Senior High 66 125 1922D0279 Jewell 2374 Jewell Jr High 37 125 1924D0280 West Graham-Morland 2390 Morland Elem 40 150 1951D0280 West Graham-Morland 2392 Morland High 47 225 1957D0281 Hill City 2412 Hill City Elem 174 250 1946D0281 Hill City 2414 Longfellow Middle 91 120 1922D0281 Hill City 2416 Hill City High 150 300 1959D0282 West Elk 2442 Howard West Elk Jr-Sr High 234 550 1978D0282 West Elk 2444 Moline Elem 141 165 1952D0282 West Elk 2448 Severy Elem 134 165 1956D0283 Elk Valley 2470 Elk Valley Elementary 104 120 1958
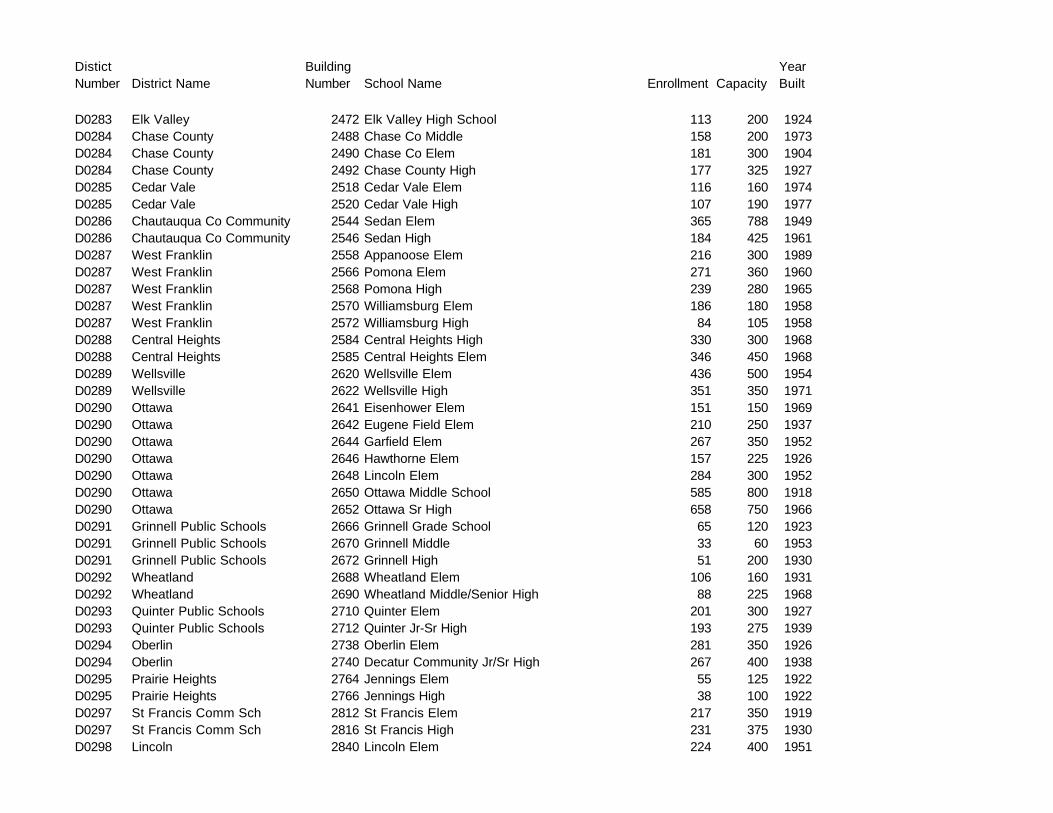
Distict Number District Name
Building Number School Name Enrollment Capacity
Year Built
D0283 Elk Valley 2472 Elk Valley High School 113 200 1924D0284 Chase County 2488 Chase Co Middle 158 200 1973D0284 Chase County 2490 Chase Co Elem 181 300 1904D0284 Chase County 2492 Chase County High 177 325 1927D0285 Cedar Vale 2518 Cedar Vale Elem 116 160 1974D0285 Cedar Vale 2520 Cedar Vale High 107 190 1977D0286 Chautauqua Co Community 2544 Sedan Elem 365 788 1949D0286 Chautauqua Co Community 2546 Sedan High 184 425 1961D0287 West Franklin 2558 Appanoose Elem 216 300 1989D0287 West Franklin 2566 Pomona Elem 271 360 1960D0287 West Franklin 2568 Pomona High 239 280 1965D0287 West Franklin 2570 Williamsburg Elem 186 180 1958D0287 West Franklin 2572 Williamsburg High 84 105 1958D0288 Central Heights 2584 Central Heights High 330 300 1968D0288 Central Heights 2585 Central Heights Elem 346 450 1968D0289 Wellsville 2620 Wellsville Elem 436 500 1954D0289 Wellsville 2622 Wellsville High 351 350 1971D0290 Ottawa 2641 Eisenhower Elem 151 150 1969D0290 Ottawa 2642 Eugene Field Elem 210 250 1937D0290 Ottawa 2644 Garfield Elem 267 350 1952D0290 Ottawa 2646 Hawthorne Elem 157 225 1926D0290 Ottawa 2648 Lincoln Elem 284 300 1952D0290 Ottawa 2650 Ottawa Middle School 585 800 1918D0290 Ottawa 2652 Ottawa Sr High 658 750 1966D0291 Grinnell Public Schools 2666 Grinnell Grade School 65 120 1923D0291 Grinnell Public Schools 2670 Grinnell Middle 33 60 1953D0291 Grinnell Public Schools 2672 Grinnell High 51 200 1930D0292 Wheatland 2688 Wheatland Elem 106 160 1931D0292 Wheatland 2690 Wheatland Middle/Senior High 88 225 1968D0293 Quinter Public Schools 2710 Quinter Elem 201 300 1927D0293 Quinter Public Schools 2712 Quinter Jr-Sr High 193 275 1939D0294 Oberlin 2738 Oberlin Elem 281 350 1926D0294 Oberlin 2740 Decatur Community Jr/Sr High 267 400 1938D0295 Prairie Heights 2764 Jennings Elem 55 125 1922D0295 Prairie Heights 2766 Jennings High 38 100 1922D0297 St Francis Comm Sch 2812 St Francis Elem 217 350 1919D0297 St Francis Comm Sch 2816 St Francis High 231 375 1930D0298 Lincoln 2840 Lincoln Elem 224 400 1951
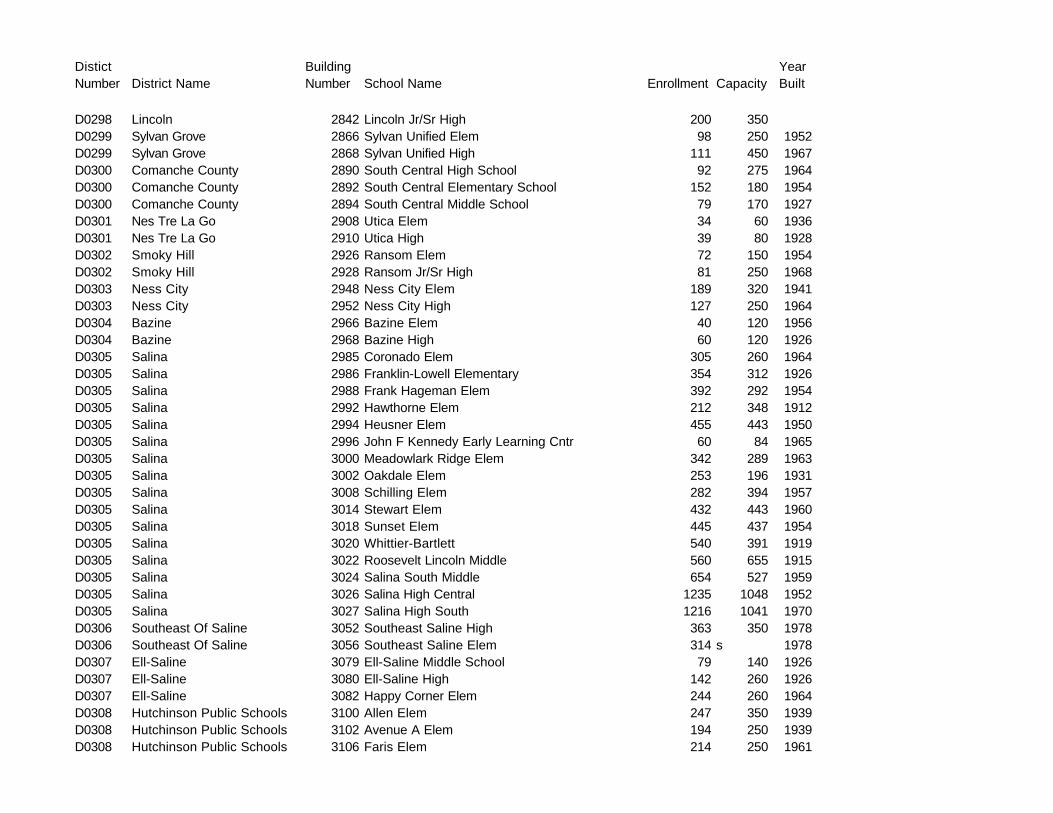
Distict Number District Name
Building Number School Name Enrollment Capacity
Year Built
D0298 Lincoln 2842 Lincoln Jr/Sr High 200 350D0299 Sylvan Grove 2866 Sylvan Unified Elem 98 250 1952D0299 Sylvan Grove 2868 Sylvan Unified High 111 450 1967D0300 Comanche County 2890 South Central High School 92 275 1964D0300 Comanche County 2892 South Central Elementary School 152 180 1954D0300 Comanche County 2894 South Central Middle School 79 170 1927D0301 Nes Tre La Go 2908 Utica Elem 34 60 1936D0301 Nes Tre La Go 2910 Utica High 39 80 1928D0302 Smoky Hill 2926 Ransom Elem 72 150 1954D0302 Smoky Hill 2928 Ransom Jr/Sr High 81 250 1968D0303 Ness City 2948 Ness City Elem 189 320 1941D0303 Ness City 2952 Ness City High 127 250 1964D0304 Bazine 2966 Bazine Elem 40 120 1956D0304 Bazine 2968 Bazine High 60 120 1926D0305 Salina 2985 Coronado Elem 305 260 1964D0305 Salina 2986 Franklin-Lowell Elementary 354 312 1926D0305 Salina 2988 Frank Hageman Elem 392 292 1954D0305 Salina 2992 Hawthorne Elem 212 348 1912D0305 Salina 2994 Heusner Elem 455 443 1950D0305 Salina 2996 John F Kennedy Early Learning Cntr 60 84 1965D0305 Salina 3000 Meadowlark Ridge Elem 342 289 1963D0305 Salina 3002 Oakdale Elem 253 196 1931D0305 Salina 3008 Schilling Elem 282 394 1957D0305 Salina 3014 Stewart Elem 432 443 1960D0305 Salina 3018 Sunset Elem 445 437 1954D0305 Salina 3020 Whittier-Bartlett 540 391 1919D0305 Salina 3022 Roosevelt Lincoln Middle 560 655 1915D0305 Salina 3024 Salina South Middle 654 527 1959D0305 Salina 3026 Salina High Central 1235 1048 1952D0305 Salina 3027 Salina High South 1216 1041 1970D0306 Southeast Of Saline 3052 Southeast Saline High 363 350 1978D0306 Southeast Of Saline 3056 Southeast Saline Elem 314 s 1978D0307 Ell-Saline 3079 Ell-Saline Middle School 79 140 1926D0307 Ell-Saline 3080 Ell-Saline High 142 260 1926D0307 Ell-Saline 3082 Happy Corner Elem 244 260 1964D0308 Hutchinson Public Schools 3100 Allen Elem 247 350 1939D0308 Hutchinson Public Schools 3102 Avenue A Elem 194 250 1939D0308 Hutchinson Public Schools 3106 Faris Elem 214 250 1961

Distict Number District Name
Building Number School Name Enrollment Capacity
Year Built
D0308 Hutchinson Public Schools 3108 Graber Elem 300 400 1953D0308 Hutchinson Public Schools 3114 Lincoln Elem 227 300 1972D0308 Hutchinson Public Schools 3116 McCandless Elem 485 450 1950D0308 Hutchinson Public Schools 3118 Morgan Elem 372 400 1950D0308 Hutchinson Public Schools 3122 Roosevelt Elem 247 300 1920D0308 Hutchinson Public Schools 3124 Wiley Elem 217 250 1953D0308 Hutchinson Public Schools 3126 Winans Elem 122 300 1920D0308 Hutchinson Public Schools 3130 Liberty Middle 451 500 1983D0308 Hutchinson Public Schools 3132 Sherman Middle 337 500 1983D0308 Hutchinson Public Schools 3134 Hutchinson High 1397 1500 1960D0309 Nickerson 3162 Mitchell Elem 65 125 1960D0309 Nickerson 3164 Nickerson Elem 318 400 1955D0309 Nickerson 3166 Nickerson High 444 600 1956D0309 Nickerson 3168 North Reno Elem 185 350 1955D0309 Nickerson 3170 South Hutchinson Elem 341 400 1956D0310 Fairfield 3186 Fairfield East Elem 93 120 1956D0310 Fairfield 3188 Fairfield High 138 160 1963D0310 Fairfield 3194 Fairfield West Elem 102 120 1926D0310 Fairfield 3195 Fairfield Middle 96 120 1993D0311 Pretty Prairie 3218 Pretty Prairie Elem 104 200 1956D0311 Pretty Prairie 3220 Pretty Prairie High 117 160 1921D0311 Pretty Prairie 3222 Pretty Prairie Middle 97 160 1977D0312 Haven Public Schools 3231 Elreka Elem 54 140 1958D0312 Haven Public Schools 3232 Haven Elem 261 200 1951D0312 Haven Public Schools 3233 Haven Middle School 110 160 1990D0312 Haven Public Schools 3234 Haven High 354 375 1970D0312 Haven Public Schools 3238 Yoder Elem 91 105 1955D0312 Haven Public Schools 3240 Partridge Elem 70 125 1955D0312 Haven Public Schools 3244 Mt Hope Elem 151 240 1997D0313 Buhler 3252 Buhler Elem 308 300 1956D0313 Buhler 3254 Buhler High 777 900 1931D0313 Buhler 3258 Obee Elem 181 180 1939D0313 Buhler 3260 Prosperity Elem 191 200 1954D0313 Buhler 3262 Prairie Hills Middle 365 400 1980D0313 Buhler 3264 Union Valley Elem 495 600 1953D0314 Brewster 3276 Brewster Elem 79 150 1923D0314 Brewster 3278 Brewster High 83 150 1923D0315 Colby Public Schools 3290 Colby Elem 445 650 1949

Distict Number District Name
Building Number School Name Enrollment Capacity
Year Built
D0315 Colby Public Schools 3292 Colby Middle School 278 375 1962D0315 Colby Public Schools 3294 Colby Senior High 411 550 1996D0316 Golden Plains 3314 Golden Plains Middle 11 150 1924D0316 Golden Plains 3316 Golden Plains High 57 200 1924D0316 Golden Plains 3318 Golden Plains Elem 88 175 1965D0317 Herndon 3328 Herndon Elem 49 100 1950D0317 Herndon 3330 Herndon High 58 100 1950D0318 Atwood 3348 Atwood Elem 256 400 1965D0318 Atwood 3350 Atwood High 149 320 1925D0320 Wamego 3388 Wamego Middle School 342 400 1992D0320 Wamego 3396 Central Elem 293 360 1963D0320 Wamego 3398 Wamego High 470 360 1939D0320 Wamego 3399 West Elem 314 480 1980D0321 Kaw Valley 3416 Delia Elem 65 68 1955D0321 Kaw Valley 3420 Emmett Elem 82 101 1974D0321 Kaw Valley 3426 Rossville Elem 323 457 1944D0321 Kaw Valley 3428 Rossville High 181 304 1980D0321 Kaw Valley 3430 St Marys Elem 236 416 1975D0321 Kaw Valley 3432 St Marys High 213 364 1980D0322 Onaga-Havensville-Wheaton 3452 Havensville Elem 53 80 1937D0322 Onaga-Havensville-Wheaton 3456 Onaga Elem 198 400 1959D0322 Onaga-Havensville-Wheaton 3458 Onaga Junior/Senior High 150 250 1951D0323 Rock Creek 3488 St George Elem 269 250 1960D0323 Rock Creek 3492 Westmoreland Elem 169 250 1927D0323 Rock Creek 3495 Rock Creek Jr/Sr High School 379 415 1991D0324 Eastern Heights 3504 Eastern Heights Elem 108 120 1919D0324 Eastern Heights 3508 Eastern Heights High 87 140 1948D0325 Phillipsburg 3538 Phillipsburg Elem 243 380 1953D0325 Phillipsburg 3540 Phillipsburg Middle 235 300 1939D0325 Phillipsburg 3542 Phillipsburg High 223 300 1961D0326 Logan 3562 Logan Elem 108 160 1954D0326 Logan 3564 Logan High 113 200 1969D0327 Ellsworth 3594 Ellsworth Elem 236 550 1952D0327 Ellsworth 3598 Ellsworth High 260 725 1955D0327 Ellsworth 3600 Kanopolis Middle 224 475 1922D0328 Lorraine 3634 Wilson Elem 111 1248 1998D0328 Lorraine 3636 Wilson Jr/Sr High 135 1998D0328 Lorraine 3638 Quivira Heights Elem/Jr Hi 208 1998

Distict Number District Name
Building Number School Name Enrollment Capacity
Year Built
D0328 Lorraine 3640 Quivira Heights High 118 647 1998D0329 Mill Creek Valley 3650 Alma Grade School 140 200 1956D0329 Mill Creek Valley 3652 Wabaunsee Sr High 195 250 1937D0329 Mill Creek Valley 3664 Paxico Grade School 82 175 1954D0329 Mill Creek Valley 3665 Mill Creek Valley Junior High 88 120 1929D0329 Mill Creek Valley 3667 Maple Hill Elem 54 150 1952D0330 Wabaunsee East 3680 Dover Elem 146 217 1950D0330 Wabaunsee East 3684 Eskridge Elem 131 264 1921D0330 Wabaunsee East 3686 Mission Valley High 212 240 1970D0330 Wabaunsee East 3688 Harveyville Elem 109 242 1940D0331 Kingman - Norwich 3714 Kingman Elem 681 650 1980D0331 Kingman - Norwich 3716 Kingman High 306 500 1963D0331 Kingman - Norwich 3722 Norwich Elem 207 300 1955D0331 Kingman - Norwich 3724 Norwich High 106 200 1983D0332 Cunningham 3748 Cunningham Elem 156 220 1948D0332 Cunningham 3750 Cunningham High 94 160 1917D0332 Cunningham 3760 Zenda Elem 69 160 1988D0333 Concordia 3780 Concordia Elementary 353 600 1996D0333 Concordia 3786 Lincoln Elem 105 100 1957D0333 Concordia 3793 Concordia Middle 190 275 1962D0333 Concordia 3794 Concordia Jr-Sr High 626 575 1929D0334 Southern Cloud 3832 Glasco Elem 79 160 1950D0334 Southern Cloud 3834 Glasco High 45 120 1921D0334 Southern Cloud 3836 Miltonvale Elem 54 140 1958D0334 Southern Cloud 3838 Miltonvale High 81 120 1963D0335 North Jackson 3861 Jackson Heights High 140 291 1969D0335 North Jackson 3870 Jackson Heights Elem 291 425 1975D0336 Holton 3886 Central Elem 235 250 1955D0336 Holton 3887 Colorado Elem 229 250 1955D0336 Holton 3890 Holton Middle 250 280 1975D0336 Holton 3892 Holton High 357 400 1994D0337 Royal Valley 3916 Royal Valley Elementary 324 425 1964D0337 Royal Valley 3918 Royal Valley High 268 512 1971D0337 Royal Valley 3921 Royal Valley Middle School 306 512 1979D0338 Valley Falls 3936 Valley Falls Elem 299 310 1958D0338 Valley Falls 3938 Valley Falls High 171 390 1925D0339 Jefferson County North 3948 Jefferson Co North High 171 280 1980D0339 Jefferson County North 3950 Jefferson County North Elem/Middle 332 475 1997

Distict Number District Name
Building Number School Name Enrollment Capacity
Year Built
D0340 Jefferson West 3968 Jefferson West Elem 250 1939D0340 Jefferson West 3969 Jefferson West Intermediate 142 1966D0340 Jefferson West 3970 Jefferson West High 306 1996D0340 Jefferson West 3972 Jefferson West Middle 260 1968D0341 Oskaloosa Public Schools 3988 Oskaloosa Elem 334 400 1972D0341 Oskaloosa Public Schools 3989 Oskaloosa Middle School 177 235 1990D0341 Oskaloosa Public Schools 3990 Oskaloosa High 246 300 1961D0342 McLouth 4006 McLouth Elem 259 400 1957D0342 McLouth 4007 McLouth Middle 150 300 1981D0342 McLouth 4008 McLouth High 168 200 1981D0343 Perry Public Schools 4020 Grantville Elem 74 80 1956D0343 Perry Public Schools 4022 Lecompton Elem 183 230 1960D0343 Perry Public Schools 4028 Perry Elem 188 230 1948D0343 Perry Public Schools 4029 Perry Middle 168 240 1971D0343 Perry Public Schools 4030 Perry Lecompton High 335 400 1971D0343 Perry Public Schools 4032 Williamstown Elem 95 100 1954D0344 Pleasanton 4038 Pleasanton Elem 229 200 1962D0344 Pleasanton 4040 Pleasanton High 194 200 1966D0345 Seaman 4056 East Indianola Elem 243 400 1950D0345 Seaman 4058 Elmont Elem 154 340 1959D0345 Seaman 4060 Indian Creek Elem 167 280 1954D0345 Seaman 4064 Lyman Elem 147 260 1956D0345 Seaman 4066 North Fairview Elem 189 380 1958D0345 Seaman 4068 Pleasant Hill Elem 285 340 1955D0345 Seaman 4070 Rochester Elem 268 340 1952D0345 Seaman 4072 West Indianola Elem 253 380 1970D0345 Seaman 4073 Logan Jr High 329 640 1954D0345 Seaman 4074 Northern Hills Jr High 457 620 1963D0345 Seaman 4076 Seaman High 744 1240 1970D0346 Jayhawk 4088 Blue Mound Elem 57 110 1942D0346 Jayhawk 4092 Mound City Elem 190 260 1922D0346 Jayhawk 4094 Jayhawk-Linn High 301 400 1972D0346 Jayhawk 4096 Prescott Elem 59 90 1925D0347 Kinsley-Offerle 4112 Lincoln Elem 54 124 1928D0347 Kinsley-Offerle 4114 Southside Elem 56 176 1930D0347 Kinsley-Offerle 4118 Kinsley Sr High 135 300 1942D0347 Kinsley-Offerle 4120 Offerle Middle 101 250 1956D0348 Baldwin City 4140 Baldwin Elem 399 450 1923

Distict Number District Name
Building Number School Name Enrollment Capacity
Year Built
D0348 Baldwin City 4141 Baldwin Junior High School 323 300 1969D0348 Baldwin City 4142 Baldwin High 408 500 1994D0348 Baldwin City 4144 Marion Springs 91 100 1963D0348 Baldwin City 4146 Vinland Elem 112 120 1993D0349 Stafford 4158 Stafford Elementary 163 220 1955D0349 Stafford 4164 Stafford Middle School/High School 176 280 1999D0350 St John-Hudson 4176 Hudson Elem 65 100 1953D0350 St John-Hudson 4180 St John Elem 162 190 1939D0350 St John-Hudson 4182 St John High 199 250 1939D0351 Macksville 4196 Macksville Elem 194 300 1961D0351 Macksville 4200 Macksville High 94 280 1925D0352 Goodland 4222 Central Elementary School 186 288 1950D0352 Goodland 4224 Grant Junior High 197 374 1927D0352 Goodland 4228 Goodland High 366 825 1937D0352 Goodland 4231 North Elem Goodland 278 260 1969D0352 Goodland 4239 West Elem Goodland 169 260 1969D0353 Wellington 4260 Eisenhower Elem 246 454 1970D0353 Wellington 4265 Kennedy Elem 228 341 1970D0353 Wellington 4266 Lincoln Elem 243 308 1954D0353 Wellington 4272 Roosevelt Elem 149 218 1954D0353 Wellington 4274 Washington Elem 137 180 1918D0353 Wellington 4276 Wellington Jr High 471 789 1928D0353 Wellington 4278 Wellington High 473 650 1959D0354 Claflin 4294 Claflin Elem 172 250 1912D0354 Claflin 4296 Claflin Junior/Senior High 169 250 1964D0355 Ellinwood Public Schools 4318 Ellinwood Elem 284 300 1952D0355 Ellinwood Public Schools 4320 Ellinwood Middle School 86 120 1926D0355 Ellinwood Public Schools 4322 Ellinwood High 223 280 1926D0356 Conway Springs 4340 Conway Springs Kyle Trueblood 181 250 1959D0356 Conway Springs 4341 Conway Springs Middle School 151 250 1987D0356 Conway Springs 4342 Conway Springs High School 227 400 1997D0357 Belle Plaine 4362 Belle Plaine Elem 420 450 1950D0357 Belle Plaine 4363 Belle Plaine Middle 204 250 1985D0357 Belle Plaine 4364 Belle Plaine High 245 250 1924D0358 Oxford 4388 Oxford Elem 228 300 1929D0358 Oxford 4390 Oxford Jr/Sr High 224 300 1968D0359 Argonia Public Schools 4404 Argonia Elem 137 180 1957D0359 Argonia Public Schools 4406 Argonia High 123 180 1964

Distict Number District Name
Building Number School Name Enrollment Capacity
Year Built
D0360 Caldwell 4420 Caldwell Elem 178 250 1926D0360 Caldwell 4422 Caldwell High 166 600 1916D0361 Anthony-Harper 4438 Anthony Elem 359 450 1928D0361 Anthony-Harper 4442 Chaparral High Anthony 367 600 1970D0361 Anthony-Harper 4458 Harper Elem 346 450 1938D0362 Prairie View 4490 Fontana Elem 85 100 1955D0362 Prairie View 4496 Lacygne Elem 261 225 1988D0362 Prairie View 4502 Parker Elem 153 175 1987D0362 Prairie View 4504 Prairie View Jr Hi (7-8) 159 1970D0362 Prairie View 4505 Prairie View High 314 450 1970D0363 Holcomb 4516 Holcomb Elem K-5 488 500 1954D0363 Holcomb 4517 Holcomb Elementary (6-8) 227 450 1954D0363 Holcomb 4518 Holcomb High 238 600 1983D0364 Marysville 4530 Beattie Elem 46 180 1959D0364 Marysville 4545 Marysville Elem 351 475 1989D0364 Marysville 4548 Marysville Jr/Sr High 575 600 1939D0365 Garnett 4586 Irving Primary 131 144 1938D0365 Garnett 4590 Garnett Elem 322 325 1921D0365 Garnett 4592 Greeley Elem 60 72 1949D0365 Garnett 4600 Mont Ida Elem 26 36 1929D0365 Garnett 4610 Westphalia 127 180 1941D0365 Garnett 4612 Anderson County Jr/Sr High School 496 560 1992D0366 Woodson 4639 Yates Center Elem 363 500 1969D0366 Woodson 4646 Yates Center High 229 320 1924D0367 Osawatomie 4662 Trojan Elem 494 600 1998D0367 Osawatomie 4664 Swenson Early Childhood Education Center 139 200 1956D0367 Osawatomie 4665 Osawatomie Middle School 289 350 1983D0367 Osawatomie 4666 Osawatomie High 380 490 1969D0368 Paola 4690 Sunflower Elem 370 450 1985D0368 Paola 4692 Hillsdale Elem 151 250 1982D0368 Paola 4694 Paola Middle 637 700 1970D0368 Paola 4696 Paola North Elem 232 450 1935D0368 Paola 4700 Paola High 725 750 1992D0369 Burrton 4734 Burrton Elem 182 250 1923D0369 Burrton 4736 Burrton High 86 175 1923D0371 Montezuma 4762 Montezuma Elem 103 120 1929D0371 Montezuma 4764 South Gray High 118 130 1925D0372 Silver Lake 4776 Silver Lake Elem 388 480 1961

Distict Number District Name
Building Number School Name Enrollment Capacity
Year Built
D0372 Silver Lake 4778 Silver Lake Jr-Sr High 357 400 1953D0373 Newton 4796 Northridge Elem 263 300 1955D0373 Newton 4799 Slate Creek Elementary 439 450 1997D0373 Newton 4800 South Breeze Elem 307 350 1957D0373 Newton 4802 Sunset Elem 468 450 1954D0373 Newton 4805 Chisholm Middle 407 450 1958D0373 Newton 4807 Santa Fe Middle 399 450 1914D0373 Newton 4810 Newton Sr High 1159 1100 1973D0373 Newton 4816 Walton Elem 99 150 1963D0374 Sublette 4834 Sublette Elem 255 275 1953D0374 Sublette 4836 Sublette High 169 250 1961D0374 Sublette 4838 Sublette Middle 78 100 1989D0375 Circle 4850 Benton Elem 356 350 1954D0375 Circle 4852 Circle High 470 450 1962D0375 Circle 4854 Oil Hill Elem 152 200 1957D0375 Circle 4856 Towanda Elem 498 400 1954D0376 Sterling 4864 Sterling Grade School 290 200 1927D0376 Sterling 4865 Sterling Junior High 90 325 1995D0376 Sterling 4866 Sterling High 165 200 1955D0377 Atchison Co Comm Schools 4888 Cummings Elem 49 120 1961D0377 Atchison Co Comm Schools 4890 Effingham Elem 137 140 1938D0377 Atchison Co Comm Schools 4894 Atchison Co Community High 294 420 1976D0377 Atchison Co Comm Schools 4906 Lancaster Elem 78 100 1936D0377 Atchison Co Comm Schools 4916 Atchison Co Community Middle 258 400 1929D0378 Riley County 4950 Riley County Grade Sch 398 588 1982D0378 Riley County 4952 Riley County High School 223 400 1959D0379 Clay Center 4970 Garfield Elem 150 200 1941D0379 Clay Center 4972 Lincoln Elem 282 300 1939D0379 Clay Center 4974 Clay Center Community Middle 302 400 1993D0379 Clay Center 4976 Clay Center High 436 500 1963D0379 Clay Center 4982 Green Elem 43 100 1930D0379 Clay Center 4994 Longford Elem 21 100 1929D0379 Clay Center 4998 Morganville Elem 72 100 1926D0379 Clay Center 5014 Wakefield Elem 184 120 1957D0379 Clay Center 5016 Wakefield High 96 105 1948D0380 Vermillion 5032 Centralia Elem 156 185 1953D0380 Vermillion 5034 Centralia High 157 220 1953D0380 Vermillion 5036 Frankfort Elem 171 250 1998

Distict Number District Name
Building Number School Name Enrollment Capacity
Year Built
D0380 Vermillion 5038 Frankfort High 158 245 1958D0381 Spearville 5058 Spearville Elem 171 350 1925D0381 Spearville 5060 Spearville Jr/Sr High 199 350 1937D0382 Pratt 5084 Mattie O Haskins Elem 224 240 1950D0382 Pratt 5088 Southwest Elem 263 270 1962D0382 Pratt 5090 Liberty Middle School 321 380 1983D0382 Pratt 5092 Pratt Sr High 454 520 1938D0383 Manhattan 5112 Amanda Arnold Elem 363 480 1985D0383 Manhattan 5113 Frank V Bergman Elem 432 456 1995D0383 Manhattan 5118 Bluemont Elem 303 336 1910D0383 Manhattan 5122 Eugene Field Elem 142 144 1917D0383 Manhattan 5124 Lee Elem 276 336 1951D0383 Manhattan 5126 Marlatt Elem 443 456 1960D0383 Manhattan 5128 Northview Elem 377 480 1957D0383 Manhattan 5130 Theo Roosevelt Elem 241 336 1922D0383 Manhattan 5132 Woodrow Wilson Elem 276 336 1922D0383 Manhattan 5135 Susan B Anthony Middle School 479 600 1996D0383 Manhattan 5136 Manhattan High School West/East Campus 1936 2300 1956D0383 Manhattan 5137 Dwight D Eisenhower Middle School 495 600 1996D0383 Manhattan 5138 Ogden Elem 191 216 1918D0384 Blue Valley 5160 Olsburg Elem 106 115 1959D0384 Blue Valley 5164 Randolph Middle 99 115 1961D0384 Blue Valley 5166 Blue Valley High 84 110 1961D0385 Andover 5177 Andover Intermediate 461 422 1997D0385 Andover 5179 Andover Middle School 711 750 1996D0385 Andover 5180 Andover High 954 850 1980D0385 Andover 5181 Martin Primary North Campus K-3 389 370 1989D0385 Andover 5182 Martin Primary South Campus K-3 447 400 1959D0386 Madison-Virgil 5198 Madison Elem 132 250 1962D0386 Madison-Virgil 5202 Madison High 138 350 1982D0387 Altoona-Midway 5214 Altoona Elem 60 120 1954D0387 Altoona-Midway 5216 Altoona-Midway Middle 79 130 1958D0387 Altoona-Midway 5220 Midway Elem 78 150 1957D0387 Altoona-Midway 5222 Altoona-Midway High School 127 120 1957D0388 Ellis 5236 Washington Elem 219 300 1960D0388 Ellis 5238 Ellis High 145 250 1977D0389 Eureka 5260 Mulberry Elem 336 400 1917D0389 Eureka 5265 Eureka Kindergarten 61 80 1952

Distict Number District Name
Building Number School Name Enrollment Capacity
Year Built
D0389 Eureka 5266 Eureka Jr High 128 260 1984D0389 Eureka 5268 Eureka Sr High 273 260 1984D0390 Hamilton 5296 Hamilton Elem 84 120 1951D0390 Hamilton 5298 Hamilton High 41 80 1981D0392 Osborne County 5322 Alton Osborne Jr Hi 90 220 1914D0392 Osborne County 5332 Osborne Elem 244 420 1954D0392 Osborne County 5334 Osborne High 160 340 1929D0393 Solomon 5354 Solomon Elem 223 225 1965D0393 Solomon 5356 Solomon High 208 218 1996D0394 Rose Hill Public Schools 5370 Rose Hill Primary 408 400 1949D0394 Rose Hill Public Schools 5371 Rose Hill Middle 475 425 1978D0394 Rose Hill Public Schools 5372 Rose Hill High 551 600 1995D0394 Rose Hill Public Schools 5374 Rose Hill Intermediate 442 500 1940D0395 LaCrosse 5389 LaCrosse Elementary 146 174 1927D0395 LaCrosse 5390 LaCrosse High 116 239 1955D0395 LaCrosse 5396 McCracken Middle Sch 88 146 1928D0396 Douglass Public Schools 5411 Leonard C Seal Elem 462 1953D0396 Douglass Public Schools 5413 Marvin Sisk Middle School 169 1994D0396 Douglass Public Schools 5414 Douglass High 296 1972D0397 Centre 5434 Centre Elem 151 125 1928D0397 Centre 5436 Centre Jr/Sr High 150 250 1958D0398 Peabody-Burns 5456 Burns Elem 36 100 1921D0398 Peabody-Burns 5460 Peabody Elem 214 250 1973D0398 Peabody-Burns 5462 Peabody-Burns Jr/Sr High School 235 300 1997D0399 Paradise 5486 Natoma Elem 83 154 1950D0399 Paradise 5488 Natoma High (7-12) 72 160 1951D0400 Smoky Valley 5504 Soderstrom Elem 282 325 1962D0400 Smoky Valley 5505 Lindsborg Middle School 259 325 1954D0400 Smoky Valley 5506 Smoky Valley High 369 450 1998D0400 Smoky Valley 5508 Marquette Elem 149 180 1986D0401 Chase-Raymond 5534 Chase Elem 80 130 1936D0401 Chase-Raymond 5536 Chase High 72 150 1923D0401 Chase-Raymond 5538 Raymond Jr High 46 100 1924D0402 Augusta 5554 Garfield Elem 237 350 1955D0402 Augusta 5555 Ewalt Elementary 331 450 1994D0402 Augusta 5556 Lincoln Elem 206 350 1955D0402 Augusta 5558 Robinson Elem 226 350 1961D0402 Augusta 5560 Augusta Middle School 578 750 1995

Distict Number District Name
Building Number School Name Enrollment Capacity
Year Built
D0402 Augusta 5562 Augusta Sr High 690 1000 1970D0403 Otis-Bison 5588 Otis-Bison Middle 74 200 1920D0403 Otis-Bison 5598 Otis-Bison Elementary 105 200 1916D0403 Otis-Bison 5600 Otis-Bison High 128 200 1932D0404 Riverton 5620 Riverton Elem 388 450 1951D0404 Riverton 5621 Riverton Middle 198 200 1981D0404 Riverton 5622 Riverton High 240 350 1982D0405 Lyons 5636 Lyons Central Elementary 194 200 1956D0405 Lyons 5638 Lyons Park Elementary 117 200 1973D0405 Lyons 5640 Lyons Middle School 210 300 1930D0405 Lyons 5642 Lyons High 391 500 1968D0405 Lyons 5646 Lyons South Elementary 85 200 1952D0406 Wathena 5674 Wathena Elem 286 400 1964D0406 Wathena 5676 Wathena High 121 220 1930D0407 Russell County 5708 Lucas-Luray High 57 150 1959D0407 Russell County 5710 Luray-Lucas Elem 105 200 1960D0407 Russell County 5718 Bickerdyke Elem 244 400 1952D0407 Russell County 5720 Simpson Elem 195 300 1952D0407 Russell County 5722 Ruppenthal Middle 221 400 1938D0407 Russell County 5724 Russell High 308 500 1962D0408 Marion-Florence 5746 Marion Middle 120 180 1998D0408 Marion-Florence 5748 Marion High 230 250 1921D0408 Marion-Florence 5750 Marion Elem 389 450 1960D0409 Atchison Public Schools 5761 Atchison Elementary School 793 1050 1997D0409 Atchison Public Schools 5770 Atchison High School 556 500 1976D0409 Atchison Public Schools 5776 Atchison Middle School 397 600 1908D0410 Durham-Hillsboro-Lehigh 5812 Hillsboro Elem 325 450 1961D0410 Durham-Hillsboro-Lehigh 5814 Hillsboro High 240 300 1937D0410 Durham-Hillsboro-Lehigh 5820 Hillsboro Middle School 163 300 1995D0411 Goessel 5834 Goessel Elem 170 350 1959D0411 Goessel 5836 Goessel High 151 225 1935D0412 Hoxie Community Schools 5852 Hoxie Elem 291 400 1920D0412 Hoxie Community Schools 5854 Hoxie High 160 300 1920D0413 Chanute Public Schools 5870 Alcott Elem 155 125 1938D0413 Chanute Public Schools 5872 Hutton Elem 302 400 1951D0413 Chanute Public Schools 5874 Lincoln Elem 99 125 1966D0413 Chanute Public Schools 5876 Murray Elem 281 400 1950D0413 Chanute Public Schools 5880 Royster Middle School 491 600 1968

Distict Number District Name
Building Number School Name Enrollment Capacity
Year Built
D0413 Chanute Public Schools 5882 Chanute High 651 750 1914D0415 Hiawatha 5936 Hiawatha Elem 360 500 1956D0415 Hiawatha 5940 Hiawatha Sr High 362 450 1972D0415 Hiawatha 5949 Robinson Middle School 343 400 1921D0416 Louisburg 5968 Circle Grove Elem 133 135 1959D0416 Louisburg 5970 Louisburg Elem 432 400 1977D0416 Louisburg 5972 Louisburg High 420 400 1992D0416 Louisburg 5978 Louisburg Middle 348 275 1977D0417 Morris County 5987 Prairie Heights Middle School 94 160 1986D0417 Morris County 5990 Council Grove Elem 428 550 1949D0417 Morris County 5994 Council Grove High 366 425 1917D0417 Morris County 5998 Prairie Heights Elem 77 160 1954D0417 Morris County 6005 Wilsey Elem 68 150 1929D0418 McPherson 6028 Eisenhower Elementary 269 315 1996D0418 McPherson 6030 Lincoln Elem 244 430 1980D0418 McPherson 6032 Roosevelt Elem 344 430 1980D0418 McPherson 6034 Washington Elem 255 290 1936D0418 McPherson 6038 McPherson Middle School 637 800 1938D0418 McPherson 6040 McPherson High 951 1100 1963D0419 Canton-Galva 6064 Canton Elem 117 240 1959D0419 Canton-Galva 6066 Canton High 129 407 1964D0419 Canton-Galva 6068 Galva Elem 112 250 1957D0419 Canton-Galva 6070 Galva Middle 52 210 1972D0420 Osage City 6088 Osage City Elem 585 600 1957D0420 Osage City 6090 Osage City High 209 325 1935D0421 Lyndon 6102 Lyndon Elem 318 350 1920D0421 Lyndon 6104 Lyndon High 176 200 1930D0422 Greensburg 6118 Delmer Day Elem/Middle School 174 250 1955D0422 Greensburg 6122 Greensburg High 88 250 1922D0423 Moundridge 6140 Moundridge Elem 168 200 1956D0423 Moundridge 6142 Moundridge High 167 200 1965D0423 Moundridge 6146 Moundridge Middle 130 180 1976D0424 Mullinville 6156 Mullinville Elem 64 120 1950D0424 Mullinville 6158 Mullinville Junior High 11 100 1925D0425 Highland 6170 Highland Elem 146 252 1895D0425 Highland 6172 Highland High 130 280 1977D0426 Pike Valley 6192 Pike Valley Elem 124 225 1966D0426 Pike Valley 6194 Pike Valley Jr High 74 225 1939

Distict Number District Name
Building Number School Name Enrollment Capacity
Year Built
D0426 Pike Valley 6206 Pike Valley High 96 180 1963D0427 Republic County 6220 Belleville East Elem 188 250 1951D0427 Republic County 6222 Belleville Middle 192 250 1931D0427 Republic County 6224 Belleville High 213 250 1962D0428 Great Bend 6256 Eisenhower Elem 143 325 1954D0428 Great Bend 6268 Jefferson Elem 296 325 1958D0428 Great Bend 6270 Lincoln Elem 261 325 1958D0428 Great Bend 6272 Morrison Elem 64 1937D0428 Great Bend 6274 Park Elem 281 325 1953D0428 Great Bend 6276 Riley Elem 369 325 1956D0428 Great Bend 6278 Washington Elem 142 300 1919D0428 Great Bend 6280 Great Bend Middle School 550 525 1958D0428 Great Bend 6284 Great Bend High School 1080 1100 1950D0429 Troy Public Schools 6324 Troy Elem 202 200 1926D0429 Troy Public Schools 6326 Troy High and Middle School 212 270 1927D0430 South Brown County 6344 Everest Middle 214 330 1951D0430 South Brown County 6348 Horton Elem 301 450 1973D0430 South Brown County 6350 Horton High 232 600 1917D0431 Hoisington 6374 Lincoln Elem 114 120 1926D0431 Hoisington 6376 Roosevelt Elem 202 220 1954D0431 Hoisington 6378 Hoisington Middle 168 250 1956D0431 Hoisington 6380 Hoisington High 254 400 1938D0432 Victoria 6400 Victoria Elem 187 440 1961D0432 Victoria 6402 Victoria High 104 325 1950D0433 Midway Schools 6422 Midway Elem 125 200 1978D0433 Midway Schools 6426 Midway Jr/Sr High 113 201 1958D0434 Santa Fe Trail 6440 Carbondale Elem 435 500 1983D0434 Santa Fe Trail 6444 Overbrook Elem 0 375 1996D0434 Santa Fe Trail 6446 Santa Fe Trail High 459 500 1970D0434 Santa Fe Trail 6448 Scranton Elem 164 200 1996D0435 Abilene 6464 Garfield Elem 213 350 1941D0435 Abilene 6466 Kennedy Elem 206 350 1963D0435 Abilene 6470 McKinley Elem 222 350 1951D0435 Abilene 6475 Abilene Middle School 376 450 1975D0435 Abilene 6476 Abilene High School 483 600 1955D0436 Caney Valley 6490 Lincoln Memorial Elem 505 500 1954D0436 Caney Valley 6492 Caney Valley High 457 436 1973D0437 Auburn Washburn 6512 Auburn Elementary 442 524 1951

Distict Number District Name
Building Number School Name Enrollment Capacity
Year Built
D0437 Auburn Washburn 6517 Indian Hills Elementary 515 588 1988D0437 Auburn Washburn 6518 Pauline Central Primary 384 480 1960D0437 Auburn Washburn 6522 Pauline South Intermediate 294 326 1958D0437 Auburn Washburn 6527 Washburn Rural Middle School 819 1000 1990D0437 Auburn Washburn 6528 Wanamaker Elem 499 517 1940D0437 Auburn Washburn 6530 Jay Shideler Elementary 545 708 1952D0437 Auburn Washburn 6532 Washburn Rural High 1511 1800 1964D0437 Auburn Washburn 6533 Washburn Rural Alternative High School 67 70 1964D0438 Skyline Schools 6559 Skyline Elem 230 230 1967D0438 Skyline Schools 6560 Skyline High 130 140 1967D0439 Sedgwick Public Schools 6572 R L Wright Elem 333 415 1957D0439 Sedgwick Public Schools 6574 Sedgwick High 143 185 1969D0440 Halstead 6586 Bentley Primary School 202 227 1942D0440 Halstead 6592 Halstead Middle School 284 422 1956D0440 Halstead 6594 Halstead High 263 358 1970D0441 Sabetha 6618 Sabetha Elem 361 400 1959D0441 Sabetha 6619 Sabetha Middle School 199 350 1991D0441 Sabetha 6620 Sabetha High 306 350 1969D0441 Sabetha 6622 Wetmore Elem 145 160 1929D0441 Sabetha 6624 Wetmore High 61 100 1929D0442 Nemaha Valley Schools 6652 Seneca Elem 339 350 1938D0442 Nemaha Valley Schools 6654 Nemaha Valley High 222 300 1970D0443 Dodge City 6674 Central Elem 363 300 1927D0443 Dodge City 6678 Miller Elem 334 400 1950D0443 Dodge City 6680 Northwest Elem 542 450 1958D0443 Dodge City 6682 Sunnyside Elem 461 450 1950D0443 Dodge City 6684 Dodge City Middle School 786 800 1957D0443 Dodge City 6686 Dodge City High School 1436 1250 1928D0443 Dodge City 6687 Beeson Elementary 421 450 1995D0443 Dodge City 6688 Linn Elementary 524 450 1994D0443 Dodge City 6689 Soule 6th Grade Center 413 400 1995D0443 Dodge City 6702 Wilroads Gardens Elem 144 150 1954D0444 Little River 6726 Little River Junior High 57 90 1937D0444 Little River 6728 Little River High 94 150 1937D0444 Little River 6734 Windom Elem 125 150 1954D0445 Coffeyville 6758 Edgewood Elem 258 360 1954D0445 Coffeyville 6760 Garfield Elem 425 390 1953D0445 Coffeyville 6762 Longfellow Elem 132 240 1953
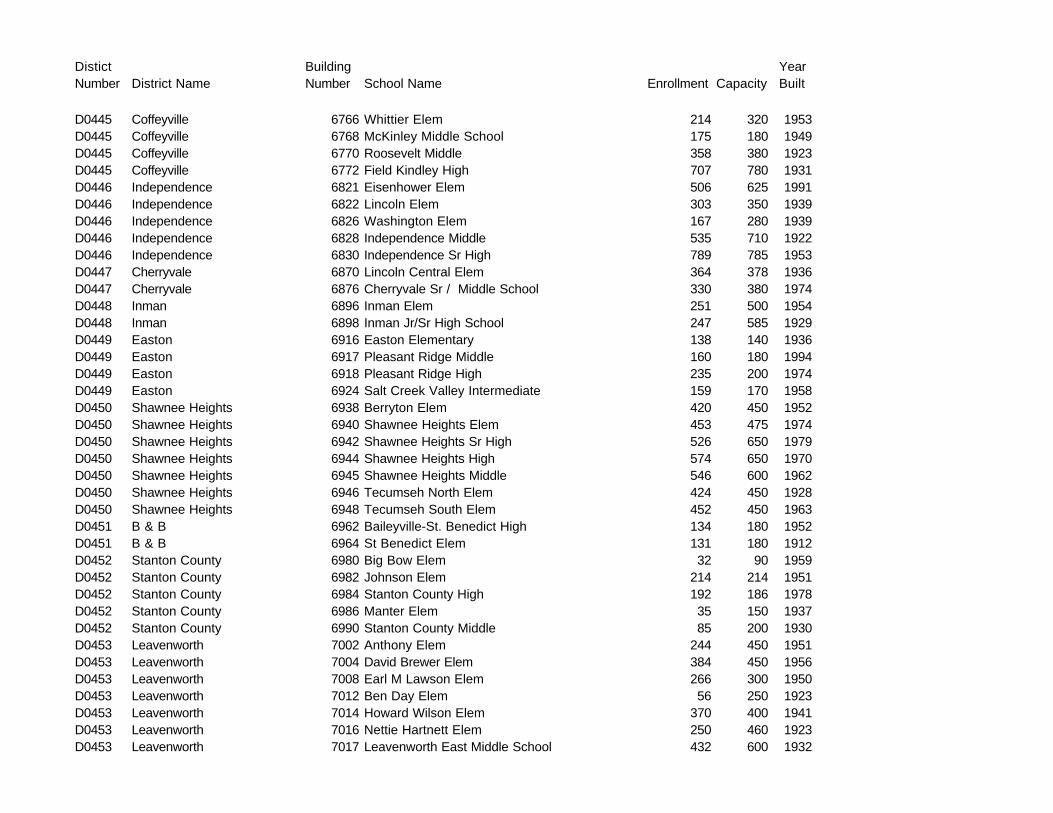
Distict Number District Name
Building Number School Name Enrollment Capacity
Year Built
D0445 Coffeyville 6766 Whittier Elem 214 320 1953D0445 Coffeyville 6768 McKinley Middle School 175 180 1949D0445 Coffeyville 6770 Roosevelt Middle 358 380 1923D0445 Coffeyville 6772 Field Kindley High 707 780 1931D0446 Independence 6821 Eisenhower Elem 506 625 1991D0446 Independence 6822 Lincoln Elem 303 350 1939D0446 Independence 6826 Washington Elem 167 280 1939D0446 Independence 6828 Independence Middle 535 710 1922D0446 Independence 6830 Independence Sr High 789 785 1953D0447 Cherryvale 6870 Lincoln Central Elem 364 378 1936D0447 Cherryvale 6876 Cherryvale Sr / Middle School 330 380 1974D0448 Inman 6896 Inman Elem 251 500 1954D0448 Inman 6898 Inman Jr/Sr High School 247 585 1929D0449 Easton 6916 Easton Elementary 138 140 1936D0449 Easton 6917 Pleasant Ridge Middle 160 180 1994D0449 Easton 6918 Pleasant Ridge High 235 200 1974D0449 Easton 6924 Salt Creek Valley Intermediate 159 170 1958D0450 Shawnee Heights 6938 Berryton Elem 420 450 1952D0450 Shawnee Heights 6940 Shawnee Heights Elem 453 475 1974D0450 Shawnee Heights 6942 Shawnee Heights Sr High 526 650 1979D0450 Shawnee Heights 6944 Shawnee Heights High 574 650 1970D0450 Shawnee Heights 6945 Shawnee Heights Middle 546 600 1962D0450 Shawnee Heights 6946 Tecumseh North Elem 424 450 1928D0450 Shawnee Heights 6948 Tecumseh South Elem 452 450 1963D0451 B & B 6962 Baileyville-St. Benedict High 134 180 1952D0451 B & B 6964 St Benedict Elem 131 180 1912D0452 Stanton County 6980 Big Bow Elem 32 90 1959D0452 Stanton County 6982 Johnson Elem 214 214 1951D0452 Stanton County 6984 Stanton County High 192 186 1978D0452 Stanton County 6986 Manter Elem 35 150 1937D0452 Stanton County 6990 Stanton County Middle 85 200 1930D0453 Leavenworth 7002 Anthony Elem 244 450 1951D0453 Leavenworth 7004 David Brewer Elem 384 450 1956D0453 Leavenworth 7008 Earl M Lawson Elem 266 300 1950D0453 Leavenworth 7012 Ben Day Elem 56 250 1923D0453 Leavenworth 7014 Howard Wilson Elem 370 400 1941D0453 Leavenworth 7016 Nettie Hartnett Elem 250 460 1923D0453 Leavenworth 7017 Leavenworth East Middle School 432 600 1932

Distict Number District Name
Building Number School Name Enrollment Capacity
Year Built
D0453 Leavenworth 7018 Leavenworth West Middle School 439 500 1969D0453 Leavenworth 7020 Leavenworth Sr High 1419 1500 1959D0453 Leavenworth 7022 Muncie Elem 246 300 1961D0454 Burlingame Public School 7056 Lincoln Middle School 107 230 1926D0454 Burlingame Public School 7057 Schuyler Elem 145 240 1902D0454 Burlingame Public School 7058 Burlingame High 117 220 1959D0455 Hillcrest Rural Schools 7074 Hillcrest Elem 106 142 1962D0455 Hillcrest Rural Schools 7076 Hillcrest High 51 140 1962D0456 Marais Des Cygnes Valley 7094 Marais Des Cygnes Valley Elem 100 100 1924D0456 Marais Des Cygnes Valley 7096 Marais Des Cygnes Valley High 106 100 1924D0456 Marais Des Cygnes Valley 7104 Marais Des Cygnes Valley Middle 94 120 1960D0457 Garden City 7115 Edith Scheuerman Elem 324 300 1985D0457 Garden City 7118 Alta Brown Elem 322 300 1949D0457 Garden City 7119 Florence Wilson Elem 369 300 1981D0457 Garden City 7120 Garfield Elem 344 300 1976D0457 Garden City 7124 Buffalo Jones Elem 408 350 1958D0457 Garden City 7126 Georgia Matthews Elem 312 300 1958D0457 Garden City 7128 Abe Hubert Middle School 554 600 1963D0457 Garden City 7130 Garden City Sr High 1887 1500 1953D0457 Garden City 7131 Gertrude Walker Elem 307 300 1974D0457 Garden City 7132 Jennie Barker Elem 111 125 1955D0457 Garden City 7133 Jennie Wilson Elem 358 300 1966D0457 Garden City 7138 Kenneth Henderson Middle 594 600 1976D0457 Garden City 7140 Pierceville-Plymell Elem 99 125 1952D0457 Garden City 7142 Theoni Elem 15 40 1954D0457 Garden City 7143 Victor Ornelas Elem 592 500 1989D0457 Garden City 7147 Bernadine Sitts Intermediate Ctr 634 700 1996D0457 Garden City 7148 Charles O Stones Intermediate Ctr 550 700 1996D0458 Basehor-Linwood 7160 Basehor Elem School 622 450 1938D0458 Basehor-Linwood 7164 Basehor-Linwood High School 577 1000 1963D0458 Basehor-Linwood 7170 Linwood Elem 202 285 1962D0458 Basehor-Linwood 7172 Basehor-Linwood Middle School 297 400 1920D0459 Bucklin 7184 Bucklin Elem 147 200 1952D0459 Bucklin 7186 Bucklin High 189 200 1962D0460 Hesston 7206 Hesston Elem 326 400 1954D0460 Hesston 7208 Hesston Middle 255 400 1964D0460 Hesston 7210 Hesston High 262 400 1970D0461 Neodesha 7226 Heller Elem 293 305 1968

Distict Number District Name
Building Number School Name Enrollment Capacity
Year Built
D0461 Neodesha 7228 North Lawn Elem 174 180 1981D0461 Neodesha 7232 Neodesha High 394 415 1987D0462 Central 7246 Central Elem 237 425 1999D0462 Central 7254 Central Jr-Sr High 207 326 1972D0463 Udall 7270 Udall Elem 193 350 1957D0463 Udall 7272 Udall High & Junior High 132 450 1956D0464 Tonganoxie 7296 Tonganoxie Elem 697 700 1955D0464 Tonganoxie 7297 Tonganoxie Jr High 395 400 1988D0464 Tonganoxie 7298 Tonganoxie High 372 400 1963D0465 Winfield 7310 Country View Elem 153 180 1961D0465 Winfield 7312 Pleasant Valley Elem 70 100 1949D0465 Winfield 7314 South Vernon Elem 51 60 1955D0465 Winfield 7324 Irving Elem 264 380 1963D0465 Winfield 7326 Lowell Elem 239 360 1957D0465 Winfield 7329 Webster Elem 117 120 1938D0465 Winfield 7330 Whittier Elem 320 320 1954D0465 Winfield 7331 Winfield Middle School 663 790 1953D0465 Winfield 7332 Winfield High 877 1287 1974D0466 Scott County 7356 Scott City Lower Elem 314 400 1987D0466 Scott County 7358 Scott City Middle 269 325 1960D0466 Scott County 7360 Scott City High 350 350 1930D0466 Scott County 7362 Shallow Water Elem School 147 200 1963D0467 Leoti 7382 R B Stewart Elem 221 350 1924D0467 Leoti 7383 Wichita Co Jr High 112 225 1926D0467 Leoti 7384 Wichita Co High 160 300 1970D0468 Healy Public Schools 7402 Healy Elem 43 60 1938D0468 Healy Public Schools 7404 Healy High 63 130 1986D0469 Lansing 7420 Lansing Middle 6-8 522 515 1997D0469 Lansing 7422 Lansing Intermediate 4-5th 296 286 1927D0469 Lansing 7426 Lansing High 9-12 669 661 1988D0469 Lansing 7428 Lansing Elem K-3 463 467 1977D0470 Arkansas City 7440 Adams Elem 270 375 1954D0470 Arkansas City 7442 Frances Willard Elem 190 300 1954D0470 Arkansas City 7443 Jefferson Elem 260 325 1957D0470 Arkansas City 7448 Roosevelt Elem 270 250 1923D0470 Arkansas City 7454 Arkansas City Middle Sch 680 900 1967D0470 Arkansas City 7456 Arkansas City High 911 1200 1982D0470 Arkansas City 7458 C 4 Elem 116 150 1963

Distict Number District Name
Building Number School Name Enrollment Capacity
Year Built
D0470 Arkansas City 7466 I X L Elem 228 275 1957D0471 Dexter 7492 Dexter Elem 110 125 1971D0471 Dexter 7494 Dexter High 103 145 1980D0473 Chapman 7534 Blue Ridge Elem 62 145 1960D0473 Chapman 7540 Chapman Elem 267 350 1935D0473 Chapman 7541 Chapman Middle School 218 350 1963D0473 Chapman 7542 Chapman High 427 600 1961D0473 Chapman 7546 Enterprise Elem 145 150 1953D0473 Chapman 7552 Rural Center Elem 69 110 1951D0473 Chapman 7554 Talmage Elem 46 50 1930D0474 Haviland 7574 Haviland Elem 107 240 1952D0474 Haviland 7576 Haviland High 76 160 1922D0475 Geary County Schools 7592 Grandview Elem 97 127 1956D0475 Geary County Schools 7596 Custer Hill Elem 306 367 1963D0475 Geary County Schools 7598 Eisenhower Elem 277 410 1979D0475 Geary County Schools 7600 Fort Riley Elem 295 277 1952D0475 Geary County Schools 7602 Franklin Elem 211 242 1929D0475 Geary County Schools 7604 Jefferson Elem 282 306 1960D0475 Geary County Schools 7606 Lincoln Elem 214 268 1953D0475 Geary County Schools 7608 Morris Hill Elem 227 365 1957D0475 Geary County Schools 7610 Sheridan Elem 249 310 1959D0475 Geary County Schools 7612 Washington Elem 234 436 1929D0475 Geary County Schools 7614 Westwood Elem 315 375 1957D0475 Geary County Schools 7616 Fort Riley Middle School 593 713 1963D0475 Geary County Schools 7618 Junction City Middle School 817 824 1929D0475 Geary County Schools 7620 Junction City Sr High 1382 1588 1957D0475 Geary County Schools 7624 Milford Elem 87 129 1964D0475 Geary County Schools 7628 K.S. Hauge Alt Ed Ctr 22 70 1981D0475 Geary County Schools 7630 Ware Elem 789 1008 1983D0475 Geary County Schools 7631 Max O Heim Early Childhood Ed Ctr 49 177 1991D0476 Copeland 7648 Copeland Elem 50 200 1956D0476 Copeland 7651 South Gray Jr High 77 100 1920D0477 Ingalls 7664 Ingalls Elem 204 200 1952D0477 Ingalls 7666 Ingalls High 98 120 1972D0479 Crest 7692 Crest West Elem 63 78 1959D0479 Crest 7694 Crest High 108 224 1959D0479 Crest 7696 Crest East Elem 125 259 1936D0480 Liberal 7714 Garfield Elem 333 300 1957

Distict Number District Name
Building Number School Name Enrollment Capacity
Year Built
D0480 Liberal 7716 Lincoln Elem 244 300 1958D0480 Liberal 7718 MacArthur Elem 277 330 1964D0480 Liberal 7720 McDermott Elem 300 350 1929D0480 Liberal 7722 McKinley Elem 280 380 1934D0480 Liberal 7724 Southlawn Elem 511 425 1955D0480 Liberal 7726 Washington Elem 258 410 1953D0480 Liberal 7728 Liberal South Middle 474 610 1965D0480 Liberal 7730 Liberal West Middle 483 660 1961D0480 Liberal 7732 Liberal Sr High 1118 1400 1983D0481 Rural Vista 7750 Hope Elem 144 320 1921D0481 Rural Vista 7752 Hope High 69 1921D0481 Rural Vista 7758 White City Elem 142 320 1923D0481 Rural Vista 7760 White City High 70 1958D0482 Dighton 7778 Dighton Elem 123 250 1928D0482 Dighton 7780 Lincoln Primary 103 200 1960D0482 Dighton 7782 Dighton High 124 250 1936D0483 Kismet-Plains 7798 Kismet Elem 214 230 1952D0483 Kismet-Plains 7800 Plains Elem 212 235 1960D0483 Kismet-Plains 7804 Southwestern Heights Jr/Sr High 347 375 1965D0484 Fredonia 7832 Lincoln Elementary 396 455 1907D0484 Fredonia 7836 Fredonia Middle 221 275 1956D0484 Fredonia 7838 Fredonia Sr High 316 390 1990D0486 Elwood 7874 Elwood Elem 214 275 1977D0486 Elwood 7876 Elwood High 87 235 1952D0487 Herington 7888 Herington Elem 242 400 1954D0487 Herington 7890 Herington Middle Sch 143 200 1996D0487 Herington 7892 Herington High 197 300 1965D0488 Axtell 7912 Axtell High 123 150 1942D0488 Axtell 7914 Bern Elem 70 140 1971D0488 Axtell 7916 Bern High 88 125 1951D0488 Axtell 7920 Summerfield Elem 70 150 1955D0489 Hays 7942 Kennedy Middle 388 436 1949D0489 Hays 7946 Lincoln Elem 211 227 1925D0489 Hays 7948 Washington Elem 132 170 1926D0489 Hays 7950 Woodrow Wilson Elem 317 321 1959D0489 Hays 7952 Felten Middle 530 512 1964D0489 Hays 7954 Hays High 1141 1048 1981D0489 Hays 7956 Kathryn O'Loughlin McCarthy Elem 322 340 1960
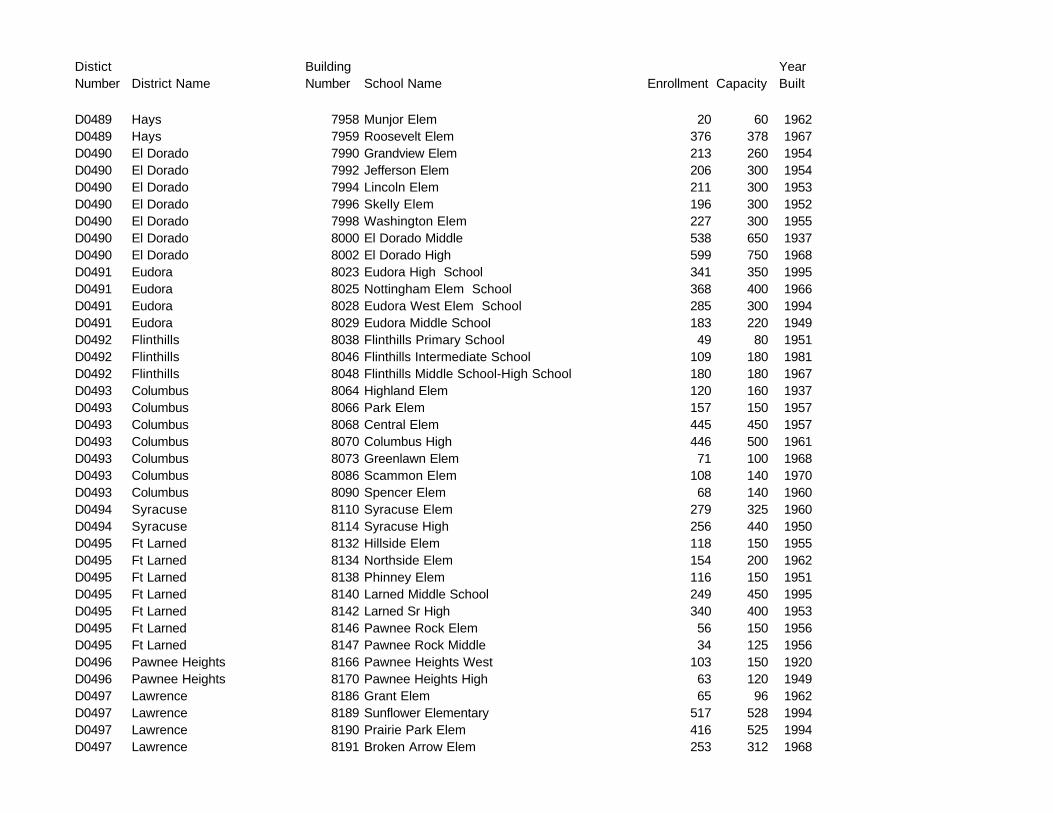
Distict Number District Name
Building Number School Name Enrollment Capacity
Year Built
D0489 Hays 7958 Munjor Elem 20 60 1962D0489 Hays 7959 Roosevelt Elem 376 378 1967D0490 El Dorado 7990 Grandview Elem 213 260 1954D0490 El Dorado 7992 Jefferson Elem 206 300 1954D0490 El Dorado 7994 Lincoln Elem 211 300 1953D0490 El Dorado 7996 Skelly Elem 196 300 1952D0490 El Dorado 7998 Washington Elem 227 300 1955D0490 El Dorado 8000 El Dorado Middle 538 650 1937D0490 El Dorado 8002 El Dorado High 599 750 1968D0491 Eudora 8023 Eudora High School 341 350 1995D0491 Eudora 8025 Nottingham Elem School 368 400 1966D0491 Eudora 8028 Eudora West Elem School 285 300 1994D0491 Eudora 8029 Eudora Middle School 183 220 1949D0492 Flinthills 8038 Flinthills Primary School 49 80 1951D0492 Flinthills 8046 Flinthills Intermediate School 109 180 1981D0492 Flinthills 8048 Flinthills Middle School-High School 180 180 1967D0493 Columbus 8064 Highland Elem 120 160 1937D0493 Columbus 8066 Park Elem 157 150 1957D0493 Columbus 8068 Central Elem 445 450 1957D0493 Columbus 8070 Columbus High 446 500 1961D0493 Columbus 8073 Greenlawn Elem 71 100 1968D0493 Columbus 8086 Scammon Elem 108 140 1970D0493 Columbus 8090 Spencer Elem 68 140 1960D0494 Syracuse 8110 Syracuse Elem 279 325 1960D0494 Syracuse 8114 Syracuse High 256 440 1950D0495 Ft Larned 8132 Hillside Elem 118 150 1955D0495 Ft Larned 8134 Northside Elem 154 200 1962D0495 Ft Larned 8138 Phinney Elem 116 150 1951D0495 Ft Larned 8140 Larned Middle School 249 450 1995D0495 Ft Larned 8142 Larned Sr High 340 400 1953D0495 Ft Larned 8146 Pawnee Rock Elem 56 150 1956D0495 Ft Larned 8147 Pawnee Rock Middle 34 125 1956D0496 Pawnee Heights 8166 Pawnee Heights West 103 150 1920D0496 Pawnee Heights 8170 Pawnee Heights High 63 120 1949D0497 Lawrence 8186 Grant Elem 65 96 1962D0497 Lawrence 8189 Sunflower Elementary 517 528 1994D0497 Lawrence 8190 Prairie Park Elem 416 525 1994D0497 Lawrence 8191 Broken Arrow Elem 253 312 1968

Distict Number District Name
Building Number School Name Enrollment Capacity
Year Built
D0497 Lawrence 8192 Centennial Elem 230 328 1955D0497 Lawrence 8194 Cordley Elem 221 391 1915D0497 Lawrence 8195 Deerfield Elem 506 552 1968D0497 Lawrence 8196 East Heights Elem 214 220 1954D0497 Lawrence 8198 Hillcrest Elem 362 384 1953D0497 Lawrence 8200 Kennedy Elem 361 483 1960D0497 Lawrence 8202 Quail Run Elementary 626 552 1987D0497 Lawrence 8204 New York Elem 134 242 1937D0497 Lawrence 8206 Pinckney Elem 264 336 1931D0497 Lawrence 8208 Schwegler Elem 502 552 1957D0497 Lawrence 8210 Sunset Hill Elem 345 288 1955D0497 Lawrence 8212 Woodlawn Elem 170 350 1924D0497 Lawrence 8214 Lawrence Central Jr Hi 529 567 1923D0497 Lawrence 8215 Lawrence South Jr Hi 673 587 1968D0497 Lawrence 8216 Lawrence West Jr Hi 610 520 1961D0497 Lawrence 8217 Southwest Jr High 630 567 1995D0497 Lawrence 8218 Lawrence High 1262 1400 1954D0497 Lawrence 8220 Riverside Elem 137 120 1955D0497 Lawrence 8222 Wakarusa Valley Elem 272 264 1960D0497 Lawrence 8224 Lawrence Free State High 1172 1400 1997D0498 Valley Heights 8238 Valley Heights Elem 126 180 1972D0498 Valley Heights 8246 Valley Heights Elem 104 180 1958D0498 Valley Heights 8252 Valley Heights Jr/Sr High 257 350 1972D0499 Galena 8264 Liberty Elem 180 175 1941D0499 Galena 8268 Spring Grove Primary Center 185 200 1939D0499 Galena 8270 Galena Middle School 198 175 1941D0499 Galena 8272 Cornerstone High 25 40 1993D0499 Galena 8274 Galena High 219 225 1964D0500 Kansas City 8279 Banneker Elem 488 578 1972D0500 Kansas City 8282 Silver City Elem 175 278 1970D0500 Kansas City 8284 Chelsea Elem 199 626 1923D0500 Kansas City 8285 Douglass Elem 249 411 1963D0500 Kansas City 8287 Thomas A Edison Elem 206 256 1954D0500 Kansas City 8288 Emerson Elem 274 292 1960D0500 Kansas City 8290 John Fiske Elem 471 351 1984D0500 Kansas City 8292 Grant Elem 309 358 1956D0500 Kansas City 8293 Hawthorne Elem 353 658 1909D0500 Kansas City 8297 Fairfax Learning Center 42 135 1972

Distict Number District Name
Building Number School Name Enrollment Capacity
Year Built
D0500 Kansas City 8298 Mark Twain Elem 175 228 1923D0500 Kansas City 8302 Parker Elem 150 258 1915D0500 Kansas City 8303 Noble Prentis Elem 292 376 1954D0500 Kansas City 8305 Quindaro Elem 418 611 1972D0500 Kansas City 8307 Roosevelt Elem 175 251 1923D0500 Kansas City 8308 Frank Rushton Elem 463 424 1956D0500 Kansas City 8309 New Stanley Elem 355 367 1913D0500 Kansas City 8311 Eugene Ware Elem 310 273 1949D0500 Kansas City 8312 Wm A White Elem 268 287 1959D0500 Kansas City 8313 Whittier Elem 709 725 1991D0500 Kansas City 8315 Frances Willard Elem 342 272 1955D0500 Kansas City 8316 Central Middle 712 988 1915D0500 Kansas City 8317 Northwest Middle 553 983 1923D0500 Kansas City 8319 West Middle 429 752 1955D0500 Kansas City 8320 Argentine Middle 555 1142 1930D0500 Kansas City 8321 Rosedale Middle 500 1090 1926D0500 Kansas City 8322 Sumner Academy of Arts & Science 946 999 1939D0500 Kansas City 8323 Wyandotte High 1187 2041 1935D0500 Kansas City 8324 Arrowhead Middle 487 609 1961D0500 Kansas City 8326 Bethel Elem 264 239 1956D0500 Kansas City 8327 J C Harmon High 1190 1697 1973D0500 Kansas City 8328 Coronado Middle 431 645 1961D0500 Kansas City 8329 F L Schlagle High 1067 1386 1973D0500 Kansas City 8330 Claude A Huyck Elem 292 256 1965D0500 Kansas City 8331 D D Eisenhower Middle 722 1031 1973D0500 Kansas City 8332 Hazel Grove Elem 464 469 1933D0500 Kansas City 8340 John F Kennedy Elem 482 514 1965D0500 Kansas City 8342 Lindbergh Elem 219 286 1950D0500 Kansas City 8346 Stony Point South 405 488 1972D0500 Kansas City 8348 Stony Point North 375 404 1958D0500 Kansas City 8350 Washington High 1185 1531 1931D0500 Kansas City 8352 Welborn Elem 527 589 1914D0500 Kansas City 8354 White Church Elem 297 294 1924D0500 Kansas City 8358 M E Pearson Elem 695 700 1977D0501 Topeka Public Schools 8442 Avondale East Elem 239 330 1954D0501 Topeka Public Schools 8444 Shaner Elem 180 285 1957D0501 Topeka Public Schools 8446 Avondale West Elem 166 255 1954D0501 Topeka Public Schools 8452 Chase Middle School 497 600 1979
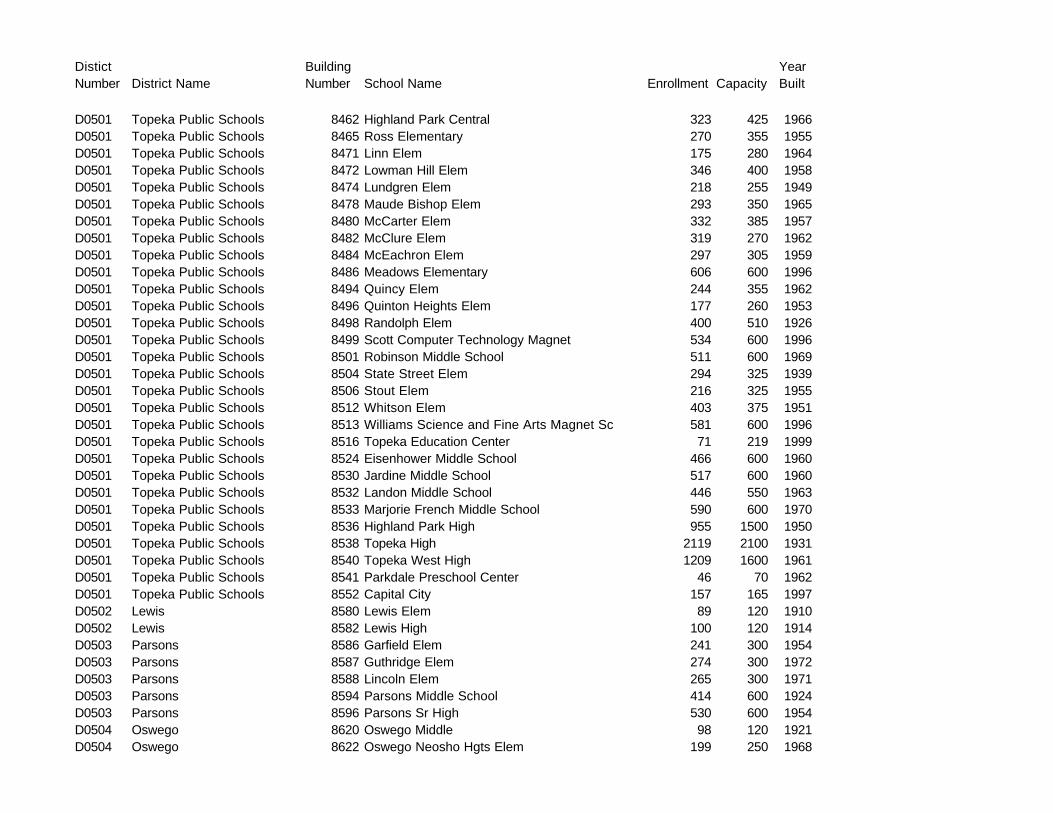
Distict Number District Name
Building Number School Name Enrollment Capacity
Year Built
D0501 Topeka Public Schools 8462 Highland Park Central 323 425 1966D0501 Topeka Public Schools 8465 Ross Elementary 270 355 1955D0501 Topeka Public Schools 8471 Linn Elem 175 280 1964D0501 Topeka Public Schools 8472 Lowman Hill Elem 346 400 1958D0501 Topeka Public Schools 8474 Lundgren Elem 218 255 1949D0501 Topeka Public Schools 8478 Maude Bishop Elem 293 350 1965D0501 Topeka Public Schools 8480 McCarter Elem 332 385 1957D0501 Topeka Public Schools 8482 McClure Elem 319 270 1962D0501 Topeka Public Schools 8484 McEachron Elem 297 305 1959D0501 Topeka Public Schools 8486 Meadows Elementary 606 600 1996D0501 Topeka Public Schools 8494 Quincy Elem 244 355 1962D0501 Topeka Public Schools 8496 Quinton Heights Elem 177 260 1953D0501 Topeka Public Schools 8498 Randolph Elem 400 510 1926D0501 Topeka Public Schools 8499 Scott Computer Technology Magnet 534 600 1996D0501 Topeka Public Schools 8501 Robinson Middle School 511 600 1969D0501 Topeka Public Schools 8504 State Street Elem 294 325 1939D0501 Topeka Public Schools 8506 Stout Elem 216 325 1955D0501 Topeka Public Schools 8512 Whitson Elem 403 375 1951D0501 Topeka Public Schools 8513 Williams Science and Fine Arts Magnet Sc 581 600 1996D0501 Topeka Public Schools 8516 Topeka Education Center 71 219 1999D0501 Topeka Public Schools 8524 Eisenhower Middle School 466 600 1960D0501 Topeka Public Schools 8530 Jardine Middle School 517 600 1960D0501 Topeka Public Schools 8532 Landon Middle School 446 550 1963D0501 Topeka Public Schools 8533 Marjorie French Middle School 590 600 1970D0501 Topeka Public Schools 8536 Highland Park High 955 1500 1950D0501 Topeka Public Schools 8538 Topeka High 2119 2100 1931D0501 Topeka Public Schools 8540 Topeka West High 1209 1600 1961D0501 Topeka Public Schools 8541 Parkdale Preschool Center 46 70 1962D0501 Topeka Public Schools 8552 Capital City 157 165 1997D0502 Lewis 8580 Lewis Elem 89 120 1910D0502 Lewis 8582 Lewis High 100 120 1914D0503 Parsons 8586 Garfield Elem 241 300 1954D0503 Parsons 8587 Guthridge Elem 274 300 1972D0503 Parsons 8588 Lincoln Elem 265 300 1971D0503 Parsons 8594 Parsons Middle School 414 600 1924D0503 Parsons 8596 Parsons Sr High 530 600 1954D0504 Oswego 8620 Oswego Middle 98 120 1921D0504 Oswego 8622 Oswego Neosho Hgts Elem 199 250 1968

Distict Number District Name
Building Number School Name Enrollment Capacity
Year Built
D0504 Oswego 8623 Service Valley Elem 101 110 1956D0504 Oswego 8624 Oswego High 47 200 1994D0505 Chetopa 8636 Chetopa Elem 156 200 1976D0505 Chetopa 8638 Chetopa High 120 220 1976D0506 Labette County 8652 Altamont Elem 240 225 1933D0506 Labette County 8654 Labette County High School 634 700 1940D0506 Labette County 8658 Bartlett Elem 129 190 1951D0506 Labette County 8666 Edna Elem 210 225 1970D0506 Labette County 8680 Meadowview Elem 387 430 1959D0506 Labette County 8684 Mound Valley Elem 205 200 1921D0507 Satanta 8694 Satanta Elem 242 300 1961D0507 Satanta 8696 Satanta Jr-Sr High 202 250 1979D0508 Baxter Springs 8702 Central Elem 192 300 1950D0508 Baxter Springs 8704 Lincoln Elem 209 300 1957D0508 Baxter Springs 8708 Baxter Springs Middle 216 400 1918D0508 Baxter Springs 8710 Baxter Springs High 264 400 1975D0509 South Haven 8742 South Haven Elem 197 225 1955D0509 South Haven 8744 South Haven High 78 100 1955D0511 Attica 8762 Puls Elem 95 180 1955D0511 Attica 8764 Attica High 51 250 1982D0512 Shawnee Mission Pub Sch 8774 East Antioch Elem 352 365 1958D0512 Shawnee Mission Pub Sch 8775 West Antioch Elem 212 275 1970D0512 Shawnee Mission Pub Sch 8776 Apache Elem 329 400 1958D0512 Shawnee Mission Pub Sch 8778 Arrowhead Elem 178 250 1956D0512 Shawnee Mission Pub Sch 8782 Belinder Elem 417 450 1952D0512 Shawnee Mission Pub Sch 8784 Bluejacket-Flint 583 750 1996D0512 Shawnee Mission Pub Sch 8786 Briarwood Elem 528 575 1959D0512 Shawnee Mission Pub Sch 8787 Broken Arrow Elem 645 675 1990D0512 Shawnee Mission Pub Sch 8788 Brookridge Elem 499 600 1967D0512 Shawnee Mission Pub Sch 8790 Brookwood Elem 417 450 1960D0512 Shawnee Mission Pub Sch 8791 Christa McAuliffe Elem 611 550 1987D0512 Shawnee Mission Pub Sch 8792 Cherokee Elem 292 390 1955D0512 Shawnee Mission Pub Sch 8793 Comanche Elem 415 550 1969D0512 Shawnee Mission Pub Sch 8794 Corinth Elem 343 550 1936D0512 Shawnee Mission Pub Sch 8796 Crestview Elem 318 425 1954D0512 Shawnee Mission Pub Sch 8798 Dorothy Moody Elem 312 475 1966D0512 Shawnee Mission Pub Sch 8804 Hickory Grove AEP 158 250 1916D0512 Shawnee Mission Pub Sch 8806 Highlands Elem 324 275 1951

Distict Number District Name
Building Number School Name Enrollment Capacity
Year Built
D0512 Shawnee Mission Pub Sch 8808 John Diemer Elem 261 325 1964D0512 Shawnee Mission Pub Sch 8810 Katherine Carpenter Elem 255 330 1962D0512 Shawnee Mission Pub Sch 8812 Shawanoe Elem 398 550 1960D0512 Shawnee Mission Pub Sch 8814 Bonjour Elem 327 575 1954D0512 Shawnee Mission Pub Sch 8816 Ray Marsh Elem 364 375 1969D0512 Shawnee Mission Pub Sch 8817 Merriam Elem 193 265 1969D0512 Shawnee Mission Pub Sch 8819 Mill Creek Elem 500 600 1978D0512 Shawnee Mission Pub Sch 8820 Nall Hills Elem 273 275 1961D0512 Shawnee Mission Pub Sch 8822 Nieman Elem 361 440 1954D0512 Shawnee Mission Pub Sch 8823 Oak Park Elem 275 500 1974D0512 Shawnee Mission Pub Sch 8826 Overland Park Elem 319 550 1998D0512 Shawnee Mission Pub Sch 8828 Pawnee Elem 351 365 1965D0512 Shawnee Mission Pub Sch 8832 Prairie Elem 490 550 1936D0512 Shawnee Mission Pub Sch 8834 Rhein Benninghoven Elem 605 625 1966D0512 Shawnee Mission Pub Sch 8836 Rising Star Elem 505 800 1991D0512 Shawnee Mission Pub Sch 8838 Roesland Elem 357 400 1926D0512 Shawnee Mission Pub Sch 8840 Roeland Park Elem 190 200 1951D0512 Shawnee Mission Pub Sch 8842 Rosehill Elem 600 725 1966D0512 Shawnee Mission Pub Sch 8844 Rushton Elem 339 425 1954D0512 Shawnee Mission Pub Sch 8846 Santa Fe Trail Elem 313 455 1953D0512 Shawnee Mission Pub Sch 8854 Somerset Elem 301 375 1953D0512 Shawnee Mission Pub Sch 8856 South Park Elem 263 375 1947D0512 Shawnee Mission Pub Sch 8857 Sunflower Elem 616 780 1995D0512 Shawnee Mission Pub Sch 8858 Tomahawk Elem 382 425 1954D0512 Shawnee Mission Pub Sch 8860 Trailwood Elem 258 375 1962D0512 Shawnee Mission Pub Sch 8864 Westwood View Elem 303 380 1968D0512 Shawnee Mission Pub Sch 8868 Westridge Middle 986 1175 1962D0512 Shawnee Mission Pub Sch 8870 Hocker Grove Middle 597 800 1955D0512 Shawnee Mission Pub Sch 8874 Indian Hills Middle 623 900 1955D0512 Shawnee Mission Pub Sch 8876 Mission Valley Middle 713 885 1958D0512 Shawnee Mission Pub Sch 8878 Antioch Middle 527 770 1955D0512 Shawnee Mission Pub Sch 8880 Indian Woods Middle 880 965 1961D0512 Shawnee Mission Pub Sch 8884 Trailridge Middle 696 900 1967D0512 Shawnee Mission Pub Sch 8886 Shawnee Mission East High 2023 2190 1958D0512 Shawnee Mission Pub Sch 8888 Shawnee Mission North High 1923 2175 1921D0512 Shawnee Mission Pub Sch 8890 Shawnee Mission Northwest High 2132 2325 1969D0512 Shawnee Mission Pub Sch 8892 Shawnee Mission South High 1841 2425 1966D0512 Shawnee Mission Pub Sch 8894 Shawnee Mission West High 1923 2325 1962
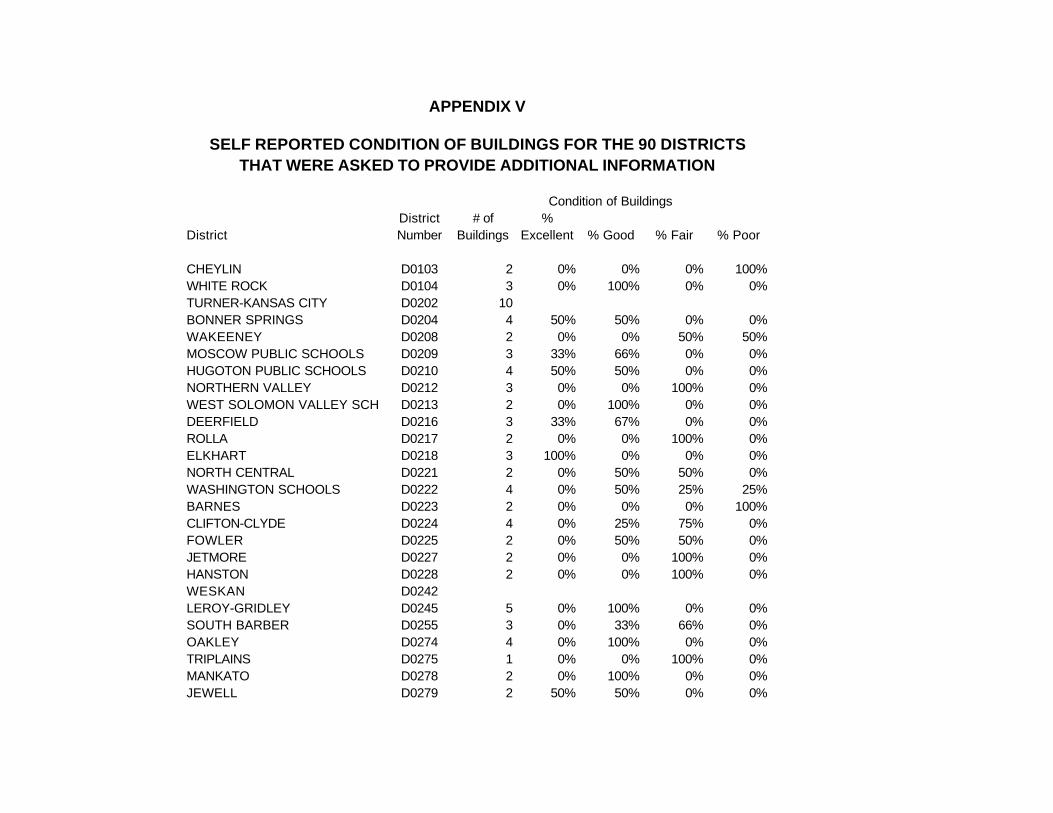
APPENDIX V
SELF REPORTED CONDITION OF BUILDINGS FOR THE 90 DISTRICTS THAT WERE ASKED TO PROVIDE ADDITIONAL INFORMATION
Condition of Buildings
DistrictDistrict Number
# of Buildings
% Excellent % Good % Fair % Poor
CHEYLIN D0103 2 0% 0% 0% 100%WHITE ROCK D0104 3 0% 100% 0% 0%TURNER-KANSAS CITY D0202 10BONNER SPRINGS D0204 4 50% 50% 0% 0%WAKEENEY D0208 2 0% 0% 50% 50%MOSCOW PUBLIC SCHOOLS D0209 3 33% 66% 0% 0%HUGOTON PUBLIC SCHOOLS D0210 4 50% 50% 0% 0%NORTHERN VALLEY D0212 3 0% 0% 100% 0%WEST SOLOMON VALLEY SCH D0213 2 0% 100% 0% 0%DEERFIELD D0216 3 33% 67% 0% 0%ROLLA D0217 2 0% 0% 100% 0%ELKHART D0218 3 100% 0% 0% 0%NORTH CENTRAL D0221 2 0% 50% 50% 0%WASHINGTON SCHOOLS D0222 4 0% 50% 25% 25%BARNES D0223 2 0% 0% 0% 100%CLIFTON-CLYDE D0224 4 0% 25% 75% 0%FOWLER D0225 2 0% 50% 50% 0%JETMORE D0227 2 0% 0% 100% 0%HANSTON D0228 2 0% 0% 100% 0%WESKAN D0242LEROY-GRIDLEY D0245 5 0% 100% 0% 0%SOUTH BARBER D0255 3 0% 33% 66% 0%OAKLEY D0274 4 0% 100% 0% 0%TRIPLAINS D0275 1 0% 0% 100% 0%MANKATO D0278 2 0% 100% 0% 0%JEWELL D0279 2 50% 50% 0% 0%
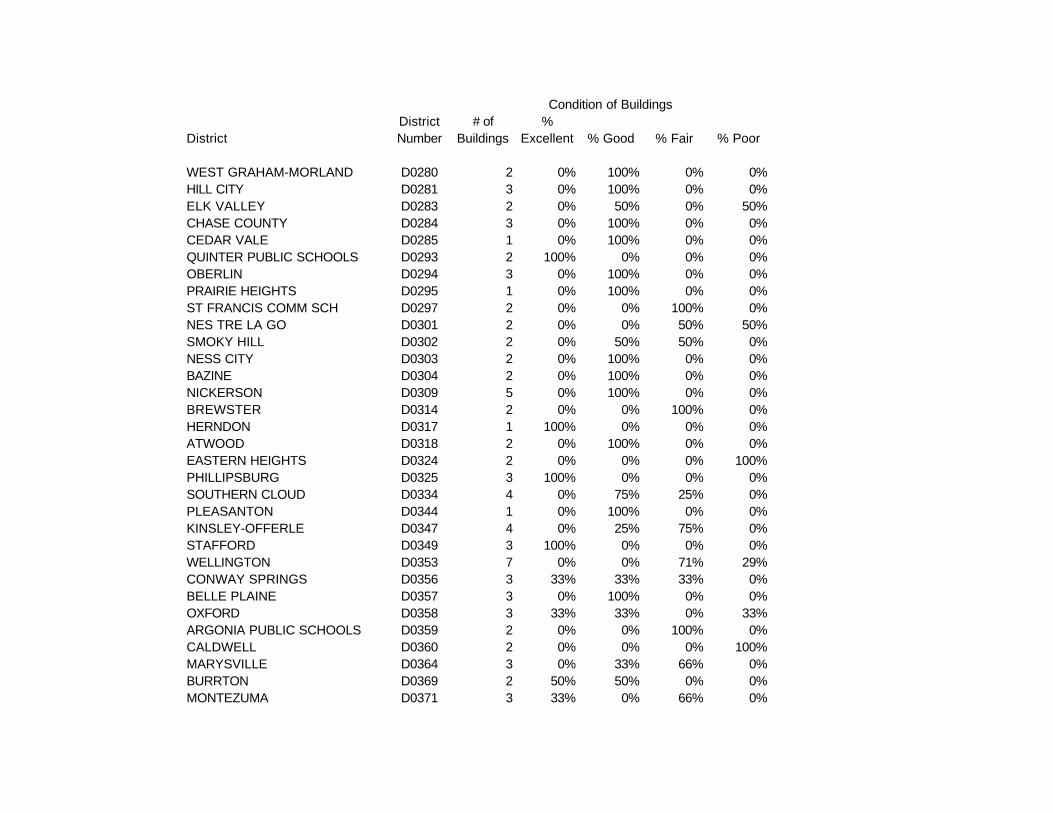
Condition of Buildings
DistrictDistrict Number
# of Buildings
% Excellent % Good % Fair % Poor
WEST GRAHAM-MORLAND D0280 2 0% 100% 0% 0%HILL CITY D0281 3 0% 100% 0% 0%ELK VALLEY D0283 2 0% 50% 0% 50%CHASE COUNTY D0284 3 0% 100% 0% 0%CEDAR VALE D0285 1 0% 100% 0% 0%QUINTER PUBLIC SCHOOLS D0293 2 100% 0% 0% 0%OBERLIN D0294 3 0% 100% 0% 0%PRAIRIE HEIGHTS D0295 1 0% 100% 0% 0%ST FRANCIS COMM SCH D0297 2 0% 0% 100% 0%NES TRE LA GO D0301 2 0% 0% 50% 50%SMOKY HILL D0302 2 0% 50% 50% 0%NESS CITY D0303 2 0% 100% 0% 0%BAZINE D0304 2 0% 100% 0% 0%NICKERSON D0309 5 0% 100% 0% 0%BREWSTER D0314 2 0% 0% 100% 0%HERNDON D0317 1 100% 0% 0% 0%ATWOOD D0318 2 0% 100% 0% 0%EASTERN HEIGHTS D0324 2 0% 0% 0% 100%PHILLIPSBURG D0325 3 100% 0% 0% 0%SOUTHERN CLOUD D0334 4 0% 75% 25% 0%PLEASANTON D0344 1 0% 100% 0% 0%KINSLEY-OFFERLE D0347 4 0% 25% 75% 0%STAFFORD D0349 3 100% 0% 0% 0%WELLINGTON D0353 7 0% 0% 71% 29%CONWAY SPRINGS D0356 3 33% 33% 33% 0%BELLE PLAINE D0357 3 0% 100% 0% 0%OXFORD D0358 3 33% 33% 0% 33%ARGONIA PUBLIC SCHOOLS D0359 2 0% 0% 100% 0%CALDWELL D0360 2 0% 0% 0% 100%MARYSVILLE D0364 3 0% 33% 66% 0%BURRTON D0369 2 50% 50% 0% 0%MONTEZUMA D0371 3 33% 0% 66% 0%
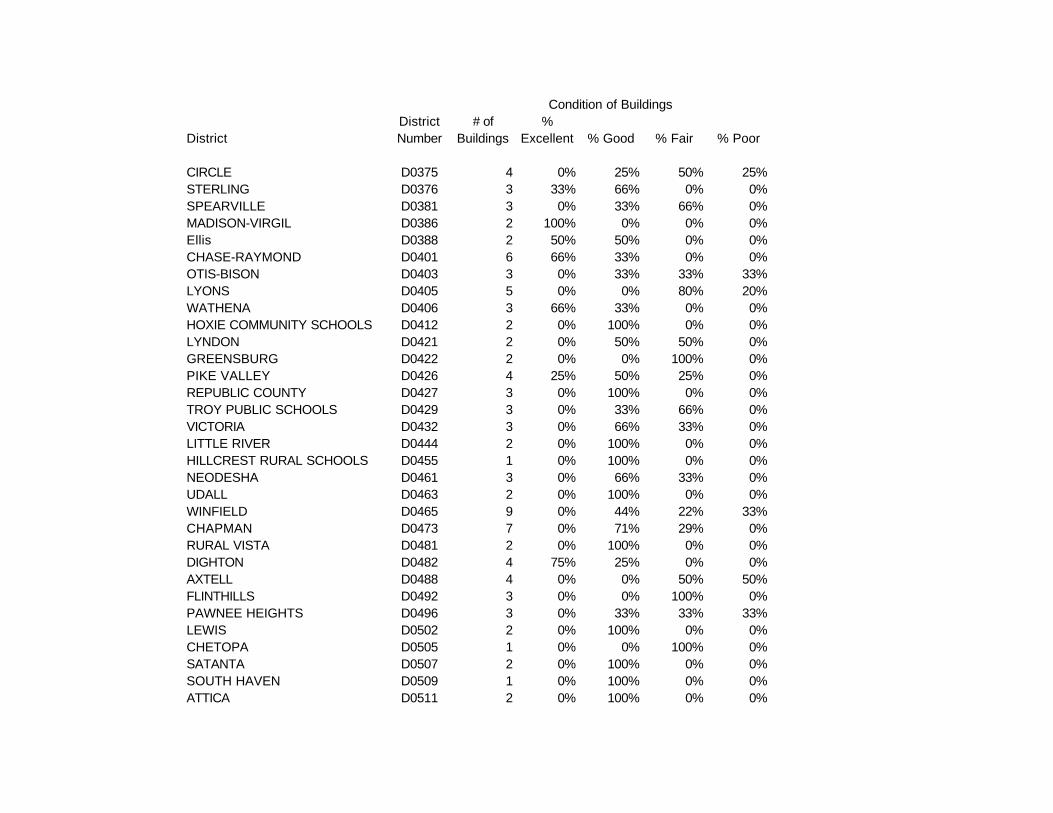
Condition of Buildings
DistrictDistrict Number
# of Buildings
% Excellent % Good % Fair % Poor
CIRCLE D0375 4 0% 25% 50% 25%STERLING D0376 3 33% 66% 0% 0%SPEARVILLE D0381 3 0% 33% 66% 0%MADISON-VIRGIL D0386 2 100% 0% 0% 0%Ellis D0388 2 50% 50% 0% 0%CHASE-RAYMOND D0401 6 66% 33% 0% 0%OTIS-BISON D0403 3 0% 33% 33% 33%LYONS D0405 5 0% 0% 80% 20%WATHENA D0406 3 66% 33% 0% 0%HOXIE COMMUNITY SCHOOLS D0412 2 0% 100% 0% 0%LYNDON D0421 2 0% 50% 50% 0%GREENSBURG D0422 2 0% 0% 100% 0%PIKE VALLEY D0426 4 25% 50% 25% 0%REPUBLIC COUNTY D0427 3 0% 100% 0% 0%TROY PUBLIC SCHOOLS D0429 3 0% 33% 66% 0%VICTORIA D0432 3 0% 66% 33% 0%LITTLE RIVER D0444 2 0% 100% 0% 0%HILLCREST RURAL SCHOOLS D0455 1 0% 100% 0% 0%NEODESHA D0461 3 0% 66% 33% 0%UDALL D0463 2 0% 100% 0% 0%WINFIELD D0465 9 0% 44% 22% 33%CHAPMAN D0473 7 0% 71% 29% 0%RURAL VISTA D0481 2 0% 100% 0% 0%DIGHTON D0482 4 75% 25% 0% 0%AXTELL D0488 4 0% 0% 50% 50%FLINTHILLS D0492 3 0% 0% 100% 0%PAWNEE HEIGHTS D0496 3 0% 33% 33% 33%LEWIS D0502 2 0% 100% 0% 0%CHETOPA D0505 1 0% 0% 100% 0%SATANTA D0507 2 0% 100% 0% 0%SOUTH HAVEN D0509 1 0% 100% 0% 0%ATTICA D0511 2 0% 100% 0% 0%