Embed Size (px)
Citation preview
PLEASE SCROLL DOWN FOR ARTICLE
This article was downloaded by: [Indian Institute of Technology, Delhi]On: 16 February 2011Access details: Access Details: [subscription number 931793936]Publisher Taylor & FrancisInforma Ltd Registered in England and Wales Registered Number: 1072954 Registered office: Mortimer House, 37-41 Mortimer Street, London W1T 3JH, UK
International Journal of CrashworthinessPublication details, including instructions for authors and subscription information:http://www.informaworld.com/smpp/title~content=t778188386
A comprehensive failure model for crashworthiness simulation ofaluminium extrusionsH. Hooputra; H. Gese; H. Dell; H. Werner
Online publication date: 08 July 2010
To cite this Article Hooputra, H. , Gese, H. , Dell, H. and Werner, H.(2004) 'A comprehensive failure model forcrashworthiness simulation of aluminium extrusions', International Journal of Crashworthiness, 9: 5, 449 — 464To link to this Article: DOI: 10.1533/ijcr.2004.0289URL: http://dx.doi.org/10.1533/ijcr.2004.0289
Full terms and conditions of use: http://www.informaworld.com/terms-and-conditions-of-access.pdf
This article may be used for research, teaching and private study purposes. Any substantial orsystematic reproduction, re-distribution, re-selling, loan or sub-licensing, systematic supply ordistribution in any form to anyone is expressly forbidden.
The publisher does not give any warranty express or implied or make any representation that the contentswill be complete or accurate or up to date. The accuracy of any instructions, formulae and drug dosesshould be independently verified with primary sources. The publisher shall not be liable for any loss,actions, claims, proceedings, demand or costs or damages whatsoever or howsoever caused arising directlyor indirectly in connection with or arising out of the use of this material.

© Woodhead Publishing Ltd 0289 449 IJCrash 2004 Vol. 9 No. 5 pp. 449–463
Corresponding Author:H Hooputra,BMW GroupForschungs- und Innovationszentrum, Knorrstrasse 147,D-80788 Munich, GermanyTel: +49 (0) 89 382 494 17 Fax: +49 (0) 89 382 428 20Email: [email protected]
NOTATION
a, a1 Constants in analytical approximation ofstress-strain curve
c Directionally dependent material parameterin ductile fracture curve
ch Heat treatment effectivity parameterd Inhomogeneity parameterd0, d1 Material parameters in ductile fracture curvef Material parameter in shear fracture curvek0, k1, k2 Material parameters in ductile fracture curveh0, h̃0 Initial sheet thickness outside of localised neck
and in the localised neckh, ̃h Actual sheet thickness outside of localised
neck and in the localised neckks Material parameter in shear fracture curvem Strain rate sensitivity parametern Strain hardening exponent
r0, r45, r90 Lankford coefficients describing plasticorthotropy
t Timex Axis in coordinate system of textured sheet
(x = rolling direction)y Axis in coordinate system of textured sheet
(y = normal to rolling direction)x′ Axis in local coordinate system of necked
sheet (x′ = normal to neck)y′ Axis in local coordinate system of necked
sheet (y′ = parallel to neck)α Ratio of minor principal strain (rate) to major
principal strain (rate)γ Orientation angle of initial neck relative to
rolling directionδ Small number for initial sheet imperfection
in Marciniak modelε0 Constant in analytical approximation of stress-
strain curveε1, ε2 Principal in plane components of plastic
strain, ε1 > ε2εeq Equivalent plastic strain
ε̇ eq Equivalent plastic strain rate
( )eq refε̇ Reference equivalent plastic strain rate(typically 1 s–1)
A comprehensive failure model forcrashworthiness simulation of aluminiumextrusions
H Hooputra1, H Gese2, H Dell2 and H Werner1
1BMW Group, Forschungs- und Innovationszentrum, Knorrstrasse 147, D-80788 Munich, Germany2MATFEM Partnerschaft Dr. Gese & Oberhofer, Nederlingerstrasse 1, D-80638 Munich, Germany
Abstract: A correct representation of the plastic deformation and failure of individual componentparts is essential to obtaining accurate crashworthiness simulation results. The aim of this paper is topresent a comprehensive approach for predicting failure in a component based on macroscopicstrains and stresses. This approach requires the use of a number of different failure mechanismrepresentations, such as necking (due to local instabilities), as well as ductile and shear fracture. Allfailure criteria have been developed in a way to include the influence of non-linear strain paths. Theeffectiveness of this approach in predicting failure is then discussed by comparing numerical resultswith test data by three point bending and axial compression tests of double chamber extrusioncomponents. All studies presented in this paper were carried out on extrusions made from aluminiumalloy EN AW-7108 T6.
Key words: Crashworthiness simulation, metal failure, failure prediction, plastic instability, ductilefracture, shear fracture.
doi:10.1533/ijcr.2004.0289
Downloaded By: [Indian Institute of Technology, Delhi] At: 10:42 16 February 2011

H Hooputra, H Gese, H Dell and H Werner
IJCrash 2004 Vol. 9 No. 5 450 doi:10.1533/ijcr.2004.0289 © Woodhead Publishing Ltd
ε eq* Equivalent plastic strain at onset of instability
εγeq Equivalent plastic strain at onset of instability
for one orientation angle γ of the initial neckrelative to rolling direction
ε eq** Equivalent plastic strain at onset of fracture
ε εS S+ –, Equivalent plastic strain in equibiaxial
tension/compression at shear fracture
ε εT T+ –, Equivalent plastic strain in equibiaxial
tension/compression at ductile fractureη Stress triaxialityη+, η– Stress triaxiality in equibiaxial tension/
compression at ductile fractureθ Shear stress parameterθ+, θ– Shear stress parameter for equibiaxial
tension/compression. θ+ = 2 – 4kS, θ– = 2 +4kS
ν Angle between extrusion direction and majorprincipal strain rate
σ1, σ2, σ3 Principal components of stress tensorσeq Equiv. stressσm σm = (σ1 + σ2 + σ3)/3σx, σy Stress components in extrusion direction and
transverse directionτxy In plane shear stress componentφ Ratio of maximum shear stress to equivalent
stress
INTRODUCTION
Most of today’s crashworthiness simulation codes offeran incomplete selection of failure models. Often thisselection is limited to simple fracture models based onthe maximum strain criterion (i.e. the true fracture strainis constant for all stress states). The problem with thesemodels is that they do not take the dependence of thefracture strain on the complete state of stress in acomponent into account. The result being, that thesesimplified approaches have resulted in inaccurate fracturepredictions [1]. On a more advanced level, there existsome theoretical models based on mesoscopic effects. Oneexample is the Gurson model, which accounts for theevolution of material porosity using a special yield criterion.
However, this kind of model is limited to representingductile fracture and as such ignores the fracture mechanismbased on shear [1, 2]. In FEM analysis, failure predictionusing the Gurson model is highly dependent on meshrefinement as this model causes strain softening prior tofracture. Considering these shortcomings prevalent intoday’s numerical codes, there emerges a strong need forthe development of a comprehensive approach for failureprediction coupled with a numerically robust implementa-tion. This approach must be flexible enough to make useof the available discretisation used in today’s automotivecrash simulations (i.e. the use of shell elements with typicaledge length between 5 and 15 mm). As localised neckingof thin sheets or profiles (necking in the direction of sheetthickness) cannot be modelled with this discretisation, acriterion for instability must be introduced in addition tothe fracture models.
Sheets and thin-walled extrusions made from aluminiumalloys generally fail due to one or a combination of thefollowing mechanisms (Figure 1):
• ductile fracture (based on initiation, growth andcoalescence of voids),
• shear fracture (based on shear band localisation).• instability with localised necking (followed by ductile
or shear fracture inside the neck area),
Instability is necessary as a third failure criterion if thestructure is discretised with shell elements. A more in-depth explanation will be given in the section “NumericalModel for Instability”.
The failure strains of the different mechanisms dependprimarily on strain rate, temperature, anisotropy, state ofstress and strain path.
This paper describes the derivation of three failurecriteria for Instability, Ductile, and Shear fracture (IDSfailure criteria). The failure criteria are based onmacroscopic stresses and strains. The criteria include theeffect of anisotropy, state of stress and strain path. Oneset of parameters is valid for one temperature and onestrain rate regime (quasi-static or dynamic).
The IDS failure criteria have been integrated into thesoftware code CrachFEM1. CrachFEM is an add-onmodule to FEM codes which use an explicit-dynamic timeintegration scheme. CrachFEM transiently predicts failure
Figure 1 Visualisation of ductile fracture, shear fracture and sheet instability (localised necking).
Localised neck
Ductile fracture Shear fracture Sheet instability
1 CrachFEM is a trademark of MATFEM (GER)
Downloaded By: [Indian Institute of Technology, Delhi] At: 10:42 16 February 2011

A comprehensive failure model for crashworthiness simulation of aluminium extrusions
© Woodhead Publishing Ltd doi:10.1533/ijcr.2004.0289 451 IJCrash 2004 Vol. 9 No. 5
of elements during deformation. Critical elements can beeliminated from the finite element model.
Three point bending and compression tests have beenused to validate the IDS failure criteria. The simulationswere conducted using a coupling of the crash simulationcode PAM-CRASH2 with CrachFEM.
The instability, ductile, and shear fracture curves weredetermined for aluminium alloy EN AW-7108 T6 subjectedto various stress states. This material was selected in orderto illustrate the occurrence of the various failure modes.The coefficients for the IDS failure criteria were derivedfor room temperature and two strain rates (quasi-staticand 250 1/s).
A correct representation of the material plasticity is aprerequisite of a correct failure prediction because thefailure criteria are based on local stresses and strains.Therefore, the plasticity of the aluminium extrusion ENAW-7108 T6 was examined in detail first (strain hardening,yield locus).
CHARACTERIZATION OF MATERIAL PLASTICITY
Short tensile specimens have been cut out of the outerwalls of a double chamber extrusion, at 0°, 45° and 90° tothe extrusion direction. The plastic anisotropy r (necessaryfor the IDS failure criteria calculation) and the strainhardening parameters were derived experimentally usingthese samples. Test results are summarised in Table 1.The results show that the plastic orthotropy is verypronounced, r-values change from 0.327 in extrusiondirection to 1.378 in diagonal direction.
Static and dynamic, tensile and compression tests ofprismatic specimens cut in the extrusion direction havebeen performed to quantify the strain rate sensitivity ofthe material and adiabatic flow stress curves. These arerequired as input for commercial FEM crash codes withan explicit-dynamic time integration scheme. A fullycoupled thermo-mechanical solution procedure is notsupported by these codes. The method used to obtainadiabatic flow stress curves from these experiments isdescribed in [1]. The adiabatic flow stress curves foraluminium alloy EN AW-7108 T6 are shown in Figure 2.There is no significant strain rate sensitivity for strainrates between quasi-static and 1 s–1. At higher strain rates,
the material displays a positive strain rate sensitivity forstrains below about 20%, while above this value, thematerial shows a negative strain rate sensitivity due to theadiabatic heating of the material.
Tube-shaped specimens extruded from the same batchunder similar process parameters were used to determinethe initial yield locus of EN AW-7108 T6. Testing wasperformed on a multifunctional testing machine withhydraulic gear for the following load cases
1. Axial tension2. Axial compression3. Torsion4. Axial tension (compression) with internal pressure5. Torsion with internal pressure6. Torsion with axial tension (compression) and internal
pressure.
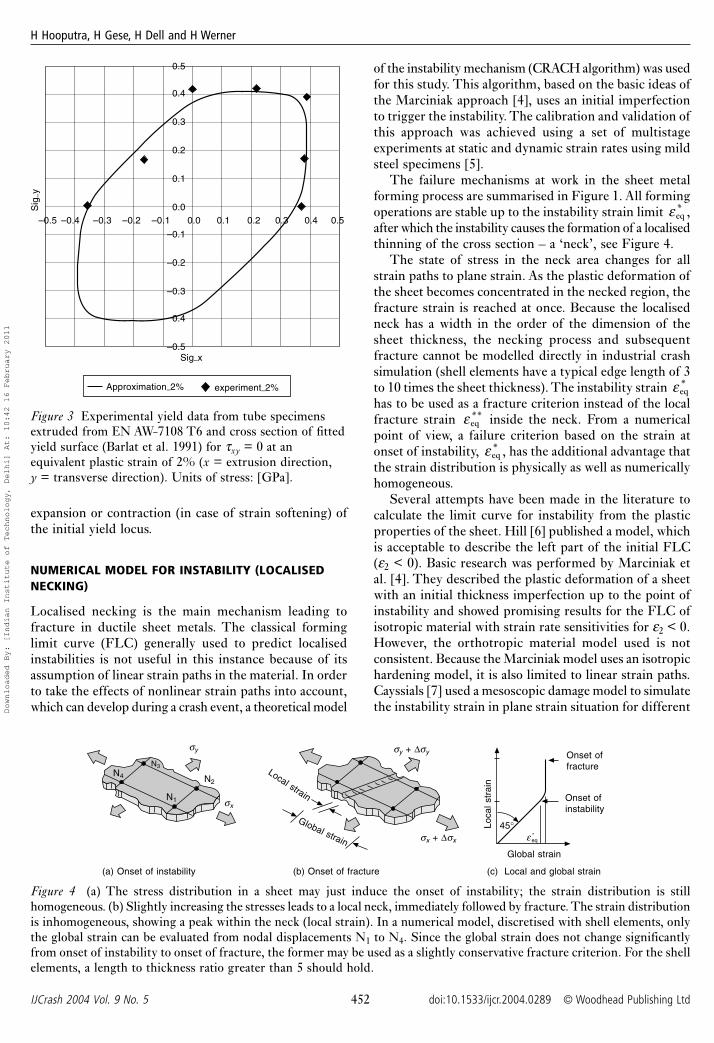
Additionally, ring specimens for uniaxial compressiontests were cut from tubes. The yield locus was measuredfor an equivalent plastic strain of 2%, see Figure 3. Thesymmetric yield locus of Barlat et al. [3] in connectionwith an associated flow rule has been used to describeplastic deformation. It gives a good approximation in thetension-tension regime. However, it can be seen fromFigure 3 that the case of pure shear (σx = –σy) is not wellrepresented. The experimental results display a slightlyconcave shape in this area. Strain hardening and strainrate effects have been taken into consideration by an affine
Table 1 Quasi-static material parameters of extrusion EN AW-7108 T6
Orientation Anisotropy Flow stress: σeq = a(ε0 + εeq)n
parameter ra [MPa] ε0[−−−−−] n[−−−−−]
L (0°) 0.327 596.1 0.020 0.1427D (45°) 1.378 511.5 0.012 0.1148LT (90°) 0.965 642.5 0.042 0.1726
600
500
400
300
200
100
00.00 0.20 0.40 0.60 0.80 1.00
True strain [–]
Tru
e st
ress
[M
Pa]
0.002 1/s25 1/s100 1/s
Figure 2 Adiabatic flow stress vs. strain for differentstrain rates for EN AW-7108 T6 specimens cut inextrusion direction.
2 PAM-CRASH is a trademark of ESI Group (F)
Downloaded By: [Indian Institute of Technology, Delhi] At: 10:42 16 February 2011
H Hooputra, H Gese, H Dell and H Werner
IJCrash 2004 Vol. 9 No. 5 452 doi:10.1533/ijcr.2004.0289 © Woodhead Publishing Ltd
expansion or contraction (in case of strain softening) ofthe initial yield locus.
NUMERICAL MODEL FOR INSTABILITY (LOCALISEDNECKING)
Localised necking is the main mechanism leading tofracture in ductile sheet metals. The classical forminglimit curve (FLC) generally used to predict localisedinstabilities is not useful in this instance because of itsassumption of linear strain paths in the material. In orderto take the effects of nonlinear strain paths into account,which can develop during a crash event, a theoretical model
of the instability mechanism (CRACH algorithm) was usedfor this study. This algorithm, based on the basic ideas ofthe Marciniak approach [4], uses an initial imperfectionto trigger the instability. The calibration and validation ofthis approach was achieved using a set of multistageexperiments at static and dynamic strain rates using mildsteel specimens [5].
The failure mechanisms at work in the sheet metalforming process are summarised in Figure 1. All formingoperations are stable up to the instability strain limit ε eq
* ,after which the instability causes the formation of a localisedthinning of the cross section – a ‘neck’, see Figure 4.
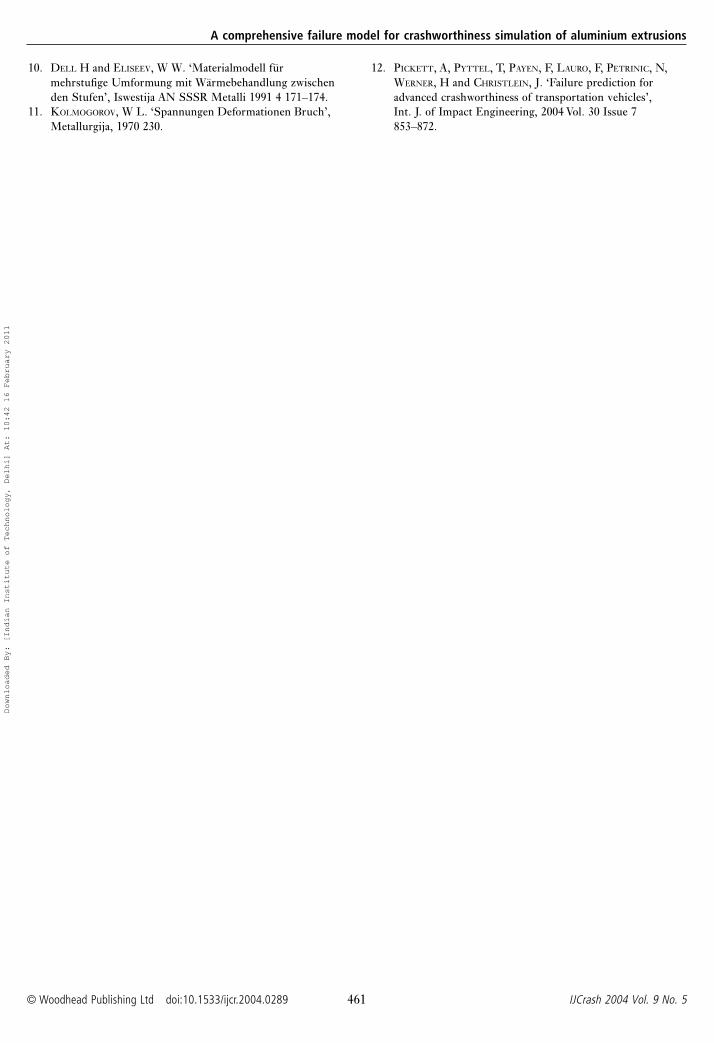
The state of stress in the neck area changes for allstrain paths to plane strain. As the plastic deformation ofthe sheet becomes concentrated in the necked region, thefracture strain is reached at once. Because the localisedneck has a width in the order of the dimension of thesheet thickness, the necking process and subsequentfracture cannot be modelled directly in industrial crashsimulation (shell elements have a typical edge length of 3to 10 times the sheet thickness). The instability strain ε eq
*
has to be used as a fracture criterion instead of the localfracture strain ε eq
** inside the neck. From a numericalpoint of view, a failure criterion based on the strain atonset of instability, ε eq
* , has the additional advantage thatthe strain distribution is physically as well as numericallyhomogeneous.
Several attempts have been made in the literature tocalculate the limit curve for instability from the plasticproperties of the sheet. Hill [6] published a model, whichis acceptable to describe the left part of the initial FLC(ε2 < 0). Basic research was performed by Marciniak etal. [4]. They described the plastic deformation of a sheetwith an initial thickness imperfection up to the point ofinstability and showed promising results for the FLC ofisotropic material with strain rate sensitivities for ε2 < 0.However, the orthotropic material model used is notconsistent. Because the Marciniak model uses an isotropichardening model, it is also limited to linear strain paths.Cayssials [7] used a mesoscopic damage model to simulatethe instability strain in plane strain situation for different
Figure 3 Experimental yield data from tube specimensextruded from EN AW-7108 T6 and cross section of fittedyield surface (Barlat et al. 1991) for τxy = 0 at anequivalent plastic strain of 2% (x = extrusion direction,y = transverse direction). Units of stress: [GPa].
Sig
–y
0.5
0.4
0.3
0.2
0.1
0.0
–0.1
–0.2
–0.3
0.4
–0.5
–0.5 –0.4 –0.3 –0.2 –0.1 0.0 0.1 0.2 0.3 0.4 0.5
Sig–x
Approximation–2% experiment–2%
Figure 4 (a) The stress distribution in a sheet may just induce the onset of instability; the strain distribution is stillhomogeneous. (b) Slightly increasing the stresses leads to a local neck, immediately followed by fracture. The strain distributionis inhomogeneous, showing a peak within the neck (local strain). In a numerical model, discretised with shell elements, onlythe global strain can be evaluated from nodal displacements N1 to N4. Since the global strain does not change significantlyfrom onset of instability to onset of fracture, the former may be used as a slightly conservative fracture criterion. For the shellelements, a length to thickness ratio greater than 5 should hold.
(a) Onset of instability (b) Onset of fracture (c) Local and global strain
σy
σx
σy + ∆σy
σx + ∆σx
45°
Onset offracture
Onset ofinstability
Global strain
Loca
l str
ain
Global strain
Local strain
N2
N1
N3
N4
ε eq*
Downloaded By: [Indian Institute of Technology, Delhi] At: 10:42 16 February 2011

A comprehensive failure model for crashworthiness simulation of aluminium extrusions
© Woodhead Publishing Ltd doi:10.1533/ijcr.2004.0289 453 IJCrash 2004 Vol. 9 No. 5
steel grades. However, the model does not cover the wholeFLC and is limited to isotropic materials. Hora et al. [8]have applied a modified force criterion to non-linear strainpaths. The model does not include kinematic hardeningand will therefore be limited in the quantitative predictionof necking in non-linear cases. This review shows that aneed for a complete description of sheet instability for allstrain paths still exists.
The newly developed algorithm CRACH has been usedin this study which includes a refined description ofmaterial behaviour on a macroscopic level, in conjunctionwith the effects of the material microstructure. Themechanical problem is given in Figure 5. The basic conceptis derived from the Marciniak model [4]. In this modelthe localised neck is triggered by an initial imperfectionof the sheet. The sheet has an initial thickness of h0. Thethickness inside the infinitely small imperfection is givenin equation (1).
h̃ h0 0 = (1 – δ) [1]
δ is a very small number. Here and in the following chapters,all values inside the localised neck are indicated with atilde (~). As the neck is infinitely small, the increase instrain parallel to the neck (defined as local y′-direction inFigure 5) is identical inside and outside the neck accordingto equation (2).
d dy y˜ ′ ′ε ε = [2]
This model is practicable for linear strain paths in theregion of ε2 < 0 (ε1 and ε2 are the principal strains in theplane of the sheet with ε2 ≤ ε1), where the neck width isvery small. In the region ε2 > 0 the neck can have asignificant width. Therefore, the CRACH algorithm usesan approximation of the neck cross section according toequation (3).
h̃ h d
xl0 0 = 1 – cosπ ′
[3]
x′ indicates the local direction normal to the necking lineaccording to Figure 5. The initial thickness h0 has noinfluence on the numerical problem and is fixed to 1. Theratio x′/l changes from 0 (neck center) to 1/2 (region ofthe sheet with homogeneous deformation). d is theinhomogeneity parameter and its initial value is calibratedfrom the limit strain out of one experiment with theindividual sheet. The parameter d increases withdeformation in the CRACH algorithm in order to accountfor the roughening of the sheet during plastic deformation.
The strain outside the neck can be increasedincrementally according to the strain history of a finiteelement. The strain inside the neck is calculated by CRACHusing equation (3) and a strain rate dependent plasticitymodel with isotropic-kinematic hardening.
The equivalent flow stress of the material is defined by
σ ε ε
εεeq 1 0 eq
eq
eq ref = ( + )
( )a n
˙
˙
[4]
with strain hardening exponent n and strain rate sensitivityparameter m, where n and m can differ between thequasistatic and dynamic loading regimes. The plasticorthotropy is defined by the Lankford coefficients r0, r45,and r90. An anisotropic yield locus according to Hill-1948is combined with a model for anisotropic strain hardeningaccording to Backhaus [9] to account for the Bauschingereffect in the CRACH algorithm.
The global strain around the neck is increasedincrementally as long as the force equilibrium is fulfilledaccording to equations (5a) and (5b).
˜˜σ σ′ ′x xh h = [5a]
˜ ˜σ σ′ ′ ′ ′x y x yh h = [5b]
The first increment without equilibrium indicates theinstability with the start of the localised necking. Thismechanical problem has to be solved for differentorientation angles γ according to Figure 5 of the initialneck relative to the rolling direction of the sheet. Thelimit strain ε eq
* for one deformation path is derived throughoptimisation according to equation (6).
ε ε γγeq*
eq = min { ( )} [6]
For some angles γ, the equivalent limit strain εγeq can be
high or even infinite. Therefore, an upper limit of εγeq =
1.2 has been defined. In summary, the CRACH algorithmsolves the plastic flow problem inside and outside theinitial neck area. Instability occurs if there is no commonsolution for the flow problem inside and outside of theneck.Additional features of the CRACH algorithm are:
• introduction of a heat treatment effectivity parameterch(0 < ch < 1) to represent interstage annealing; ch > 0
Figure 5 Schematic representation of the imperfectiontriggering a localised neck in the CRACH algorithm.
y
σyσxy
x ′
xσx
γ
l
y ′
h h̃X
d h h h = ( – )/˜
Downloaded By: [Indian Institute of Technology, Delhi] At: 10:42 16 February 2011

H Hooputra, H Gese, H Dell and H Werner
IJCrash 2004 Vol. 9 No. 5 454 doi:10.1533/ijcr.2004.0289 © Woodhead Publishing Ltd
reduces the effect of strain hardening and resets allmicro stresses to zero according to [10];
• inclusion of the possibility to introduce new flow curvesbetween stages due to heat treatment (i.e. solution heattreatment and age hardening) or significant changes instrain rate (i.e. for history deep drawing and crash).
PHENOMENOLOGICAL MODEL FOR DUCTILE ANDSHEAR FRACTURE
Two main mechanisms can cause the fracture of a ductilemetal:
• void nucleation, void growth and void coalescence;• shear fracture due to shear band localisation.
Most of the phenomenological fracture models are basedon a fracture diagram which gives the equivalent plasticstrain at fracture ε eq
** as a function of the stress state (i.e.stress triaxiality η according to equation (8)). The function
ε eq** (η) can be used directly as a fracture criterion in the
case of a linear strain path. For the more general case ofa nonlinear strain path, an integral fracture criterion isnecessary. Kolmogorov [11] has presented an integralcriterion according to equation (7).
0
eq
eq**
eq**
( ) = 1
ε εε η∫ d
[7]
Integral criteria can account for nonlinear strain paths.However, in more severe cases of load path changes (i.e.compression-tension reversal) even the integral criteriaare no longer valid. CrachFEM offers a tensorial criterionas an option for these cases. The tensorial fracture criterionis not discussed here.
The fracture criterion is calculated separately for therisk of ductile fracture and shear fracture in CrachFEM.It is assumed that there is no interaction between bothfracture mechanisms.
Ductile fracture
For ductile fracture, it is assumed that the equivalentfracture strain ε eq
** is a function of the stress triaxiality η,defined in equation (8) by components in principal stressspace.
η σσ
σ σ σ
α α α σ σ σ σ σ σ =
3 =
+ +
+ + – – – eq
1 2 3
12
22
32
1 2 2 3 3 1
m
[8]Typically, the dependence of the equivalent fracturestrain on the stress triaxiality is expressed in the form ofequation (9).
ε eq** = d0 exp(–cη) [9]
Equation (9) assumes a monotonic decrease of the fracturestrain with increasing stress triaxiality. However,experimental results from aluminium extrusions used inthis study show that the equivalent plastic strain at fracture
for equibiaxial stress (η ≅ 2) can be higher than theequivalent plastic strain at fracture in plane strain loading(η ≅ 3 ). Equation (10) represents a more generalformulation and includes a non-monotonic decrease ofthe fracture strain with increasing stress triaxiality.
ε eq** = d0 exp (–cη) + d1 exp (cη) [10]
where d1 is an additional material parameter. Of course,equation (10) includes the special case of equation (9) fora monotonic decrease in fracture strain vs. stress triaxiality.However, equations (9) and (10) remain limited todescribing isotropic materials.
A more general formulation of equation (10), whichincludes the orthotropy of fracture, must also include theboundary conditions of the equivalent fracture strain εT
+
for the equibiaxial tension condition which must not beorientation dependent. Theoretically, the fracture strainat equibiaxial compression εT
– must not be orientationdependent as well. However, its value is usually very high.
If η+ is the stress triaxiality for equibiaxial tension andη– indicates the stress triaxiality in equibiaxial compression(a material with isotropic plasticity yields η+ = 2 and η–
= –2), the following boundary conditions may be defined.
ε εT+
eq** = for η = η+ [11a]
ε εT–
eq** = for η = η– [11b]
The parameters d0 and d1 of equation (10) can besubstituted using the boundary conditions from equations(11a) and (11b). The result is given in equation (12) below.
ε
ε η η ε η ηη ηeq
**+ – – +
– +=
sinh[ ( – )] + sinh [ ( – )]
sinh [ ( – )]T Tc c
c[12]
An orientation dependent parameter c has been introducedin equation (12) for the orthotropic case. Therefore equation(12) has two constant parameters, ε εT T
+ –, and oneorientation dependent parameter c. The dependence ofthe parameter c on the angle ν between the extrusiondirection and the direction of the first principal strainrate ̇ε1 is expressed in equation (13).
c = k0 + k1 cos (2ν) + k2 cos (4ν) [13]
Equations (13) and (14) fulfil the necessary symmetryboundary conditions. Equations (12) and (13) are used toapproximate the ductile fracture curve in this study.
The parameter εT+ can be directly obtained from an
equibiaxial tension test (i.e. Erichsen test). The parameters
εT– and c for one direction (extrusion direction) can be
derived from two additional experiments with differentstress triaxiality. In this project, three point bending (planestrain tension) and notched tensile specimens (uniaxialtension at notch root) have been used. For two differentorientations (45° and 90°) the value of c is derived fromthree point bending tests. If c is known for three orientations(i.e. c0, c45 and c90), the coefficients k0, k1 and k2 of equation(13) can be calculated using equations (14a−c).
Downloaded By: [Indian Institute of Technology, Delhi] At: 10:42 16 February 2011

A comprehensive failure model for crashworthiness simulation of aluminium extrusions
© Woodhead Publishing Ltd doi:10.1533/ijcr.2004.0289 455 IJCrash 2004 Vol. 9 No. 5
k0 = (c0 + 2c45 + c90)/4 [14a]k1 = (c0 – c90)/2 [14b]k2 = (c0 – 2c45 + c90)/4 [14c]
Shear fracture
For shear fracture, it is assumed that the equivalent strainat fracture ε eq
** is a function of the variable θ given inequation (15).
θ η
φ =
1 – ks [15]
where ks is a material parameter and φ is the ratio of themaximum shear stress and the equivalent stress (von Mises)according to equation (16).
φ τσ
= max
eq[16]
Analogous to equation (12), the equivalent plastic strainfor shear fracture with respect to θ is given in equation(17).
ε
ε θ θ ε θ θθ θeq
**+ – – +
+ –=
sinh[ ( – )] + sinh [ ( – )]
sinh [ ( – )]S Sf f
f[17]
where θ+ and θ– are the values of the parameter θ forequibiaxial tension und compression. Equation (17) hastwo constant parameters ε εS S
+ –, and one orientationdependent parameter f. No significant orthotropy of theshear fracture curve has been found up to now for differentsheets and extrusions. Therefore, it is assumed that f is aconstant, independent of the orientation to extrusiondirection.
DERIVATION OF FRACTURE PARAMETERS
Instability
The limit strain ε1* of the initial FLC in uniaxial tension
specimens is derived from the specimen thickness andwidth measured at a distance of twice the sheet thicknessfrom the fracture line (outside the localised neck), assumingvolume constancy during the plastic deformation. Themean value of three quasi-static experiments in extrusiondirection resulted in a strain limit of 125.0 . The algorithmCRACH (input: r-values r0 = 0.327, r45 = 1.378, r90 =0.965 and strain hardening coefficients astatic = 596 MPa,ε0,static = 0.02, nstatic = 0.143 in extrusion direction; quasi-static strain rate sensitivity of mstatic = 0) was used toderive the inhomogeneity parameter d for this limit strain(d = 0.0028). The quasi-static FLC predicted by CRACHis shown in Figure 6.
An approximation of the flow stress curves from tensiletests at 250 s–1 was used to derive the parameters of theSwift equation for CRACH in the dynamic regime (adynamic= 572.9 MPa, ε0,dynamic = 0.032, ndynamic = 0.122)3. A
correlation of the flow stress curves at a strain rate of1 s–1 and 100 s–1 yields the strain rate sensitivity of mdynamic= 0.006 for the dynamic regime.
The CRACH algorithm (input: r-values and dynamicstrain hardening parameters as cited above) was used toderive the inhomogeneity parameter d for the limit strainsof the dynamic tensile tests in the different orientations.A mean value of d = 0.0025 for the three orientations wasused to calculate the dynamic FLC (see Figure 6). It maybe observed from the results that the static and meandynamic inhomogeneity parameters are very similar, andthat the dynamic FLC is somewhat lower than the quasi-static one.
Ductile fracture limit
Different specimen geometries are used to define differentdeformation states (i.e. plane strain, equibiaxial strain etc.).For the derivation of the fracture parameters, the stressstate parameters η (defined in equation (8)) and φ for theshear fracture curve (defined in equation (16)) must beknown, and thus a material model must be introduced forthis purpose. For this analysis, an isotropic von Misesyield locus was used. This yield locus does not exactly fitthe materials plasticity results, but it does make the fracturemodel more robust and more general. This does not causean incompatibility during the calculation because thematerial plasticity in the FEM module and the fracturemodels are uncoupled.
Erichsen test (equibiaxial stress with η = 2), three pointbending of sheet coupons (width/thickness > 4 with planestrain tension and η = 3 ; tests under 0°, 45° and 90° toextrusion direction) and waisted tensile specimens withfracture at the notch root (uniaxial tension with η = 1)have been used to obtain the ductile fracture limit. Thelocal fracture strains have been derived from a grid on thesurface of the specimens (Erichsen test and three point
Figure 6 Initial forming limit curves (FLC) predictedwith CRACH for the quasistatic and dynamic cases(approx. 250 s–1) for specimens cut in the extrusiondirection.
0.35
0.3
0.25
0.2
0.15
0.1
0.05
0–0.1 0 0.1 0.2 0.3
esp–2
eps –
1
Quasistatic
Dynamic
3 This approximation is only used for the prediction of instability with algorithm CRACH. The Swift parameters must not be used for theextrapolation up to higher strains since this function type cannot account for softening effects due to adiabatic heating.
Downloaded By: [Indian Institute of Technology, Delhi] At: 10:42 16 February 2011

H Hooputra, H Gese, H Dell and H Werner
IJCrash 2004 Vol. 9 No. 5 456 doi:10.1533/ijcr.2004.0289 © Woodhead Publishing Ltd
bending) or from the sheet thickness in the fracture plane(waisted tensile specimens). The Erichsen tests resultedin both ductile and shear fractures for different specimensat the pole location. Therefore, these data have been usedto determine both the ductile and shear fracture limits.
In comparing the equivalent fracture strain betweenthe quasistatic and dynamic experiments, it has beenobserved that for the three point bending and notchedtensile tests (wide specimens) the quasistatic equivalentstrain is lower than in the dynamic case. In all otherexperiments, the equivalent fracture strains are higher inthe dynamic case. Whereas, in quasistatic tests the fracturestrain shows a pronounced minimum in the LT direction(normal to extrusion direction), the fracture strains inthe dynamic case seem to be more isotropic.
The limit diagram for ductile fracture was approximatedusing equations (12) and (13). Material parameters shownin Table 2 were derived from experiments. Theapproximation of the ductile fracture curves for threeorientations to extrusion direction versus stress triaxialityη is given for the quasi-static case in Figure 7 togetherwith the experimental input.
Table 2 Material parameters in equation (12) for theductile fracture limit in the quasistatic and dynamiccase (EN AW-7108 T6)
Quasi-static Dynamic
εT+ = 0.26 εT
+ = 0.44
εT– = 193.0 εT
– = 1494.0k0 = 1.759 k0 = 2.8768k1 = –0.125 k1 = 0.0465k2 = 0.048 k2 = –0.1233
quasistatic case and in Figure 10 for the dynamic case.The derivation of α from the stress triaxiality η is givenin Appendix A.
Shear fracture limit
Tensile specimen with a groove (rectangular cross section,groove depth = half sheet thickness) under 45° to loadingdirection (θ = 1.469), specially shaped tensile specimenswith a groove parallel to the loading direction (pure shearwith θ = 1.732) and Erichsen tests (biaxial tension with θ= 1.6), have been used to determine the shear fracturelimit. Results from Erichsen tests were added to this curvein case the specimens had failed in shear fracture. Thedynamic fracture limits are slightly lower than thequasistatic ones.
The quasistatic and dynamic shear fracture limit curveswere approximated using equation (17). The parameterkS in equation (15) was set to 0.1 based on a number oftests with different aluminium alloys. The shear fracturewas assumed to be isotropic. Material parameters accordingto Table 3 were derived from the experimental results.The shear fracture limit curve for the quasi-static case isshown in Figure 8 together with the experimental data.
Table 3 Material parameters in equation (17) for the shearfracture limit in quasistatic and dynamic case (EN AW-7108 T6)
Quasi-static Dynamic
εS+ = 0.26 εS
+ = 0.35
εS– = 4.16 εS
– = 1.2f = 4.04 f = 2.05
The shear fracture limit curves are plotted in Figure 9 forthe quasistatic case and in Figure 10 for the dynamic casetogether with the instability limit and the ductile fracturelimit. For the characterization of the loading path for allthree types of limit curves, α ε ε = /2 1˙ ˙ (α = ε2/ε1 forlinear strain paths) is used as a common measure. Thederivation of α from the stress triaxiality η and theparameter θ is given in Appendix A.
Ductile–limit–0
Ductile–limit–45
Ductile–limit–90
Experiment–0
Experiment–45
Experiment–90
2
1.5
1
0.5
00 0.5 1 1.5 2
Stress triaxiality eta
Equ
ival
ent
plas
tic s
trai
n
Figure 7 Ductile fracture limit curves ε ηeq** ( ) together
with experimental data for quasi-static case in orientationof 0°, 45° and 90° to extrusion direction.
For the characterization of the loading path for all threetypes of limit curves, α ε ε = /2 1˙ ˙ (α = ε2/ε1 for linearstrain paths) is used as a common measure. For purposesof comparing these results with the other fracture limits,the ductile fracture curves are shown in Figure 9 for the
1
0.8
0.6
0.4
0.2
01.3 1.4 1.5 1.6 1.7 1.8 1.9 2 2.1 2.2 2.3 2.4
Shear limit–0Experiment–0
Teta
Equ
ival
ent
plas
tic s
trai
n
Figure 8 Quasi-static shear fracture limit curve ε eq** (θ) and
experimental data from specimens cut in the extrusiondirection.
Downloaded By: [Indian Institute of Technology, Delhi] At: 10:42 16 February 2011

A comprehensive failure model for crashworthiness simulation of aluminium extrusions
© Woodhead Publishing Ltd doi:10.1533/ijcr.2004.0289 457 IJCrash 2004 Vol. 9 No. 5
IDS “failure map” for EN AW-7108 T6
For the characterization of the loading path for all threetypes of limit curves, α ε ε = /2 1˙ ˙ (α = ε2/ε1 for linearstrain paths) is used as a common measure. For the purposeof comparison, all failure limits are combined into a “failuremap” in Figure 9 for the quasistatic case and in Figure 10for the dynamic case. The limit curves are plotted for thespecial case of linear strain paths and membranedeformation. A linear strain path is defined by α = constant.
In practice, the strain paths are often nonlinear. In thiscase, the limit curves used in the numerical solution processare updated during the deformation based on the theoreticalmodels described above (algorithm CRACH for instability;nonlinear damage accumulation with a tensorial damagemodel for ductile and shear fracture). In the case ofcombined loading (membrane and bending), the limitcurves for instability and shear fracture are checked againstthe membrane strains (both effects cover the whole sheetthickness), whereas the upper and lower surface strainsare used to predict ductile fracture (ductile cracks initiatedat the surface).
VALIDATION
Quasi-static three point bending, as well as quasi-static
and dynamic compression tests in axial direction of thedouble chamber extrusions have been used to validate theIDS failure criteria. The three point bending testconfiguration consists of two support pins (radius 25 mm)and a central punch (radius 50 mm). The distance betweenthe pins is 350 mm. Double plastic foils, lubricated onboth sides, are placed between the extrusions and thepins, as well as the punch, to minimise friction. Thedynamic compression tests are conducted using impactvelocities of 10 m/s and an impacting mass of 500 kg.
A coupling of the crash simulation code PAM-CRASHand CrachFEM has been used for performing the analyses.Finite elements whose strains exceed any one of the failurecriteria are eliminated from the FE mesh.
The coupling between the codes is organised in thefollowing manner:
1. The strain and stress tensors of each shell elementare transferred from the FEM code to the CrachFEMmodule every 10th time step,
2. CrachFEM then calculates factors of safety forInstability, Ductile, and Shear fracture (IDS failurecriteria)
CrachFEM tracks the influence of strain path, stress state,strain rate, and orthotropy on the failure strain. During
1.5
1
0.5
0–2 –1 0 1
Instability
Ductile fracture 0
Ductile fracture 45
Ductile fracture 90
Shear fractureE
quiv
alen
t pl
astic
str
ain
alpha = phi–2/phi–1
Figure 9 Quasistatic failure diagram for extrusion EN AW-7108 T6. Plotted limit curves are valid for linear strain pathsand membrane loading.
Ductile fracture 0
Ductile fracture 45
Ductile fracture 90
Shear fracture
Instability
1.5
1
0.5
0–2 –1.5 –1 –0.5 0 0.5 1
Alpha = Phi–2/phi–1
Equ
ival
ent
plas
tic s
trai
n
Figure 10 Dynamic failure diagram for extrusion EN AW-7108 T6: Plotted limit curves are valid for linear strain pathsand membrane loading.
Downloaded By: [Indian Institute of Technology, Delhi] At: 10:42 16 February 2011

H Hooputra, H Gese, H Dell and H Werner
IJCrash 2004 Vol. 9 No. 5 458 doi:10.1533/ijcr.2004.0289 © Woodhead Publishing Ltd
deformation, there is a competition between the 3mechanisms of failure (factor of safety is calculated for allof the 3 failure modes). The criterion which is found tobecome critical first (safety factor below 1) initiates theelement elimination. The result being that CrachFEMcan predict the time and mode of failure for each element.
The yield locus of Barlat-1991 (see Figure 3) and astrain hardening according to Figure 2 has been used todescribe the plastic behaviour of the extrusions. Althougha strain softening has been found at high strain rates, thisbehaviour may be problematic in the numerical application.A strain softening or a negative strain rate sensitivity cancause local element instabilities. Therefore, the strainhardening curves above 25 s–1 according to Figure 2 havebeen forced to have a positive strain hardening similar tothe curve for 25 s–1.
The double chamber extrusion is modelled using shellelements. The extrusion has a uniform thickness of2.5 mm. In order to obtain an accurate prediction in thesimulation, a fine mesh (about 5 mm edge length) hasbeen used to produce the results shown in Figures 11 to14. This is approximately the minimum edge length oftoday’s whole car crashworthiness simulation models forcritical structural parts.
Three point bending
The punch and the pins for three point bending test aswell as the impactor for the compression test are modelledas rigid bodies. A penalty contact with a friction coefficientof 0.05 is defined for the contact between the punch andthe component (steel-aluminium with lubricated polymerfoil in between). The aluminium-aluminium self contactfriction coefficient was found to be 0.15.
The force-displacement curves obtained from the threepoint bending test are shown in Figure 11.
The numerical solution predicted without the use offailure models shows considerable discrepancies from thetest results. Introducing the IDS failure criteria into thenumerical solution, not only improved the correlation,but also approximates more accurately the total energyabsorption of the component. The initiation of fracturein the simulation, using IDS failure criteria, correlates
well with that found in the test (Figures 12(a) and (b).Fracture was found to initiate mainly in the T-section ofthe middle wall and in the external area of the bucklingzone.
Axial compression test
The impactor for the compression test is modelled as arigid body too. A penalty contact with a friction coefficientof 0.20 is defined for the contact between the droppedmass (steel) and the extrusion. The aluminium-aluminiumself contact friction coefficient is again 0.15.
The simulation without any failure model does notmatch the results from the quasi-static and dynamiccompression tests (Figure 13 – center). Figure 13 – leftshows a regular folding pattern in the quasi-static anddynamic simulation. The simulations using the IDS failurecriteria accurately predict the real fracture pattern in theextrusion for both loading velocities (Figure 13 – right).In the quasi-static case there is still folding with significantfracture. Figure 14 shows fringe plots of the failure riskparameter for the three failure modes. It is evident thatinstability is not responsible for fracture. Ductile fracturestarts in the folds bent inward since they have a smallerradius of curvature compared to the folds bent outward.
Figure 11 Three point bending test of double chamberextrusions. Force-displacement curves from tests andsimulations with and without IDS failure criteria.
60000
50000
40000
30000
20000
10000
0
Pun
ch f
orce
[N
]
0 20 40 60 80 100 120 140 160Punch displacement [mm]
ExperimentsFEM–no–fracture
FEM–with IDS criteria
Figure 12 Three point bending test - Fracture pattern from tests and simulation.
(a) Quasistatic three point bending test (b) Simulation of three point bending with IDSfailure criteria. (5 mm edge length ofshell elements)
Downloaded By: [Indian Institute of Technology, Delhi] At: 10:42 16 February 2011

A comprehensive failure model for crashworthiness simulation of aluminium extrusions
© Woodhead Publishing Ltd doi:10.1533/ijcr.2004.0289 459 IJCrash 2004 Vol. 9 No. 5
Quasi-static simulationwithout any failure criteria
Quasi-static compression test Quasi-static simulationwith IDS failure criteria
Dynamic simulationwithout any failure criteria
Dynamic compression test Dynamic simulation with IDSfailure criteria
Shear fracture is initiated at the T-joint in the plane ofsymmetry of the profile. In the dynamic case, see Figure13 bottom, nearly no folding occurs. The wall segmentsare separated completely in the corners and at the T-jointbetween the middle wall and the outer walls, which is ingood agreement with the experiment.
The predominating fracture mode occurring in thequasi-static and dynamic compression tests is shear andductile fracture. It seems likely that aluminium alloysgenerally tend to be highly sensitive for shear loading inthe dynamic case (Figure 13 – dynamic compression test).
CONCLUSIONS
A correct representation of the plastic deformation and
failure of individual component parts is essential toobtaining accurate crashworthiness simulation results. Acomprehensive approach for predicting failure in structuralcomponents based on macroscopic strains and stressesusing the CrachFEM code has been presented. Thisapproach fits to the state-of-the-art in discretisation ofautomotive crash simulation models (shell elements withedge lengths of 5 to 15 mm). An edge length of 5 mm isrecommended in areas of high strain gradients. Due tothe absence of adaptive meshing procedures, these criticalareas have to be identified in advance. CrachFEM includesall relevant failure mechanisms, such as Instability (localisednecking), Ductile and Shear fracture (IDS failure criteria).All failure criteria are implemented in a way to includethe influence of non-linear strain paths.
Figure 13 Static and dynamic compression tests of double chamber extrusions (center) compared to simulations with andwithout IDS failure criteria (left and right, respectively). Shell elements with 5 mm edge length were used.D
ownloaded By: [Indian Institute of Technology, Delhi] At: 10:42 16 February 2011

H Hooputra, H Gese, H Dell and H Werner
IJCrash 2004 Vol. 9 No. 5 460 doi:10.1533/ijcr.2004.0289 © Woodhead Publishing Ltd
All studies presented in this paper were carried out onextrusions made from aluminium alloy EN AW-7108 T6.The plasticity of these extrusions has been examinedexperimentally. A Barlat yield criterion has been used tomodel the plastic orthotropy. The IDS failure curves ofEN AW-7108 T6 are strongly dependent on the stressstate and strain rate of the material. The ductile fracturelimit curves and the instability curves show a strongorthotropic behaviour, whereas the shear fracture limitcurves show no significant dependence on the extrusionorientation direction. To obtain an accurate failureprediction, this anisotropic behaviour has to be taken intoaccount in the simulation.
The comparison of numerical results to test data forthe three point bending and axial compression tests ofdouble chamber extrusions demonstrates a comprehensiveapproach to accurately predict component failure, bothin terms of the mode and the location of cracks. Due tothe loading conditions in all of the examples, instabilitydid not show up as a dominating failure mode. However,in loading situations where membrane tensile strainsprevail, instability will be of great importance. An examplefor such a case is shown in the publication from Pickett etal. [12].
The presented failure approach, however, can onlypredict the crack initiation. The element elimination usedin the simulation, after the onset of fracture, representsonly a preliminary approach for simulating crackpropagation. A suitable criterion for crack propagation incombination with a numerical implementation which ismesh independent to the greatest possible extent remainsa challenge for future development work.
ACKNOWLEDGEMENT
The authors would like to thank Dr. V. Yelisseyev and hisco-workers at company TEST in Voronezh (RUS) for the
excellent experimental work on the measurement of theyield locus and Dr. Andrew Heath for programming theinterface in PAM-CRASH to CrachFEM.
REFERENCES
1. EL-MAGD, E, GESE, H, THAM, R, HOOPUTRA, H andWERNER, H. ‘Fracture Criteria for AutomobileCrashworthiness Simulation of wrought Aluminium AlloyComponents’, Mat.-wiss u Werkstofftech, 2001 32 712–724.
2. SCHMITT, W, SUN, D Z, BLAUEL, J G and CHRISTLEIN, J.‘Improved Description of the Material Behaviour ofAluminium Automobile Components by the GursonModel’, Proceeding of the 31st International Symposium onAutomotive Technology and Automation, Düsseldorf, 1998.
3. BARLAT, F, LEGE, D J and BREM, J C. ‘A six-componentyield function for anisotropic materials’, Int J Plasticity,1991 7 693.
4. MARCINIAK, Z, KUCZYNSKI, K and POKORA, T. ‘Influence ofthe plastic properties of a material on the forming limitdiagram for sheet metal in tension’, Int. J. of MechanicalSciences, 1973 15 789–805.
5. DELL, H, GESE, H, KEßLER, L, WERNER, H and HOOPUTRA,H ‘Continuous Failure Prediction Model for NonlinearLoad Paths in Successive Stamping and Crash Processes’,New Sheet Steel Products and Sheet Metal Stamping (SP-1614), SAE 2001 World Congress, Michigan, SAE-Paper2001-01-1131, 2001.
6. HILL, R. ‘On discontinuous plastic states with specialreference to localised necking in thin sheets’, J Mech PhysSolids, 1952 1 19–30.
7. CAYSSIALS, F. ‘A new method for predicting FLC’, IDDRGConference, Geneva, 1998 443–454.
8. Hora, P, Tong, L, Reissner, J. ‘A Failure Criterion for Predictionof Strain Path Dependent Failures for Quadratic and Non-Quadratic Yield Loci’, Proceedings of Numisheet, 1996.
9. BACKHAUS, G. ‘Plastic deformation in form of straintrajectories of constant curvature – Theory and comparisonwith experimental results’, Acta Mechanica, 1979 34 193–204.
Figure 14 Quasi-static compression of EN AW-7108 T6 double chamber extrusions. Left: arrows point to ductile fracturesites of inward bent folds in the experiment. The fringe plots display the failure risk parameter for the three modes.Failure is to be expected if the failure risk parameter is greater or equal to 1. The failure modes and their respective cracklocation are in good agreement with the experiment. NOTE: element elimination is suppressed in the simulation; alldisplacements are scaled by a factor of 0.25 to “unfold” the profile.
Failure riskparameter
0.20.40.60.81
Quasi-static compression Instability Ductile fracture Shear fracture
′
Downloaded By: [Indian Institute of Technology, Delhi] At: 10:42 16 February 2011
A comprehensive failure model for crashworthiness simulation of aluminium extrusions
© Woodhead Publishing Ltd doi:10.1533/ijcr.2004.0289 461 IJCrash 2004 Vol. 9 No. 5
10. DELL H and ELISEEV‚ W W. ‘Materialmodell fürmehrstufige Umformung mit Wärmebehandlung zwischenden Stufen’, Iswestija AN SSSR Metalli 1991 4 171–174.
11. KOLMOGOROV, W L. ‘Spannungen Deformationen Bruch’,Metallurgija, 1970 230.
12. PICKETT, A, PYTTEL, T, PAYEN, F, LAURO, F, PETRINIC, N,WERNER, H and CHRISTLEIN, J. ‘Failure prediction foradvanced crashworthiness of transportation vehicles’,Int. J. of Impact Engineering, 2004 Vol. 30 Issue 7853–872.
Downloaded By: [Indian Institute of Technology, Delhi] At: 10:42 16 February 2011
H Hooputra, H Gese, H Dell and H Werner
IJCrash 2004 Vol. 9 No. 5 462 doi:10.1533/ijcr.2004.0289 © Woodhead Publishing Ltd
APPENDIX A
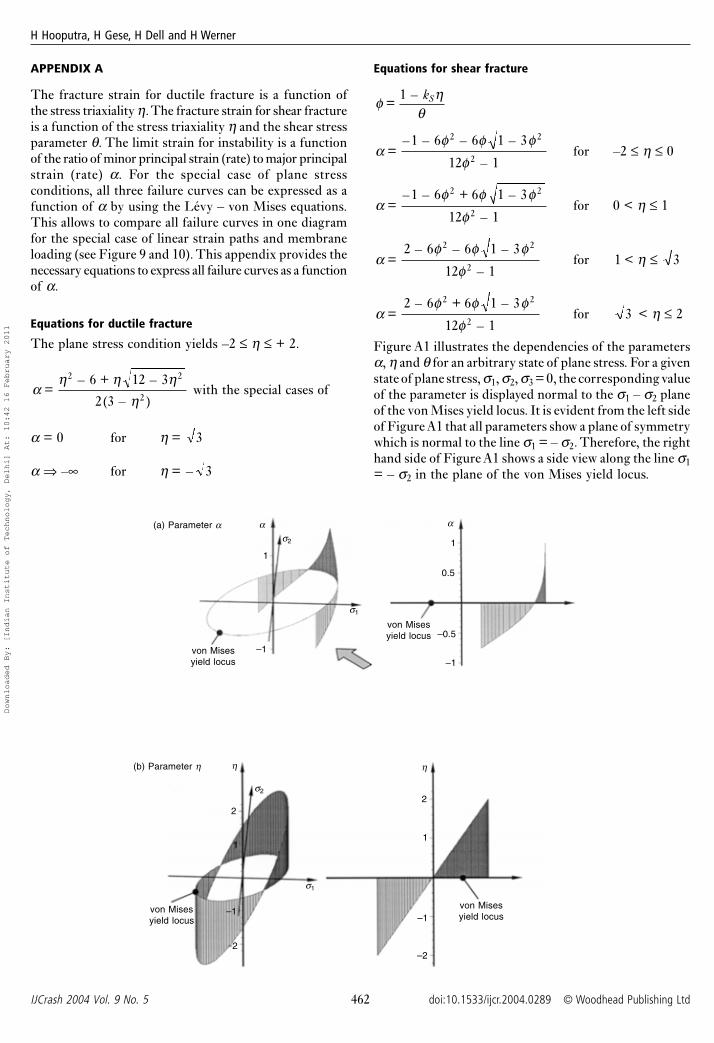
The fracture strain for ductile fracture is a function ofthe stress triaxiality η. The fracture strain for shear fractureis a function of the stress triaxiality η and the shear stressparameter θ. The limit strain for instability is a functionof the ratio of minor principal strain (rate) to major principalstrain (rate) α. For the special case of plane stressconditions, all three failure curves can be expressed as afunction of α by using the Lévy – von Mises equations.This allows to compare all failure curves in one diagramfor the special case of linear strain paths and membraneloading (see Figure 9 and 10). This appendix provides thenecessary equations to express all failure curves as a functionof α.
Equations for ductile fracture
The plane stress condition yields –2 ≤ η ≤ + 2.
αη η η
η =
– 6 + 12 – 3
2(3 – )
2 2
2 with the special cases of
α = 0 for η = 3
α ⇒ –∞ for η = – 3
Equations for shear fracture
φ η
θ =
1 – kS
α
φ φ φφ
= – 1 – 6 – 6 1 – 3
12 – 1
2 2
2for –2 ≤ η ≤ 0
α
φ φ φφ
= – 1 – 6 + 6 1 – 3
12 – 1
2 2
2for 0 < η ≤ 1
α
φ φ φφ
= 2 – 6 – 6 1 – 3
12 – 1
2 2
2for 1 < 3η ≤
α
φ φ φφ
= 2 – 6 + 6 1 – 3
12 – 1
2 2
2for 3 < η ≤ 2
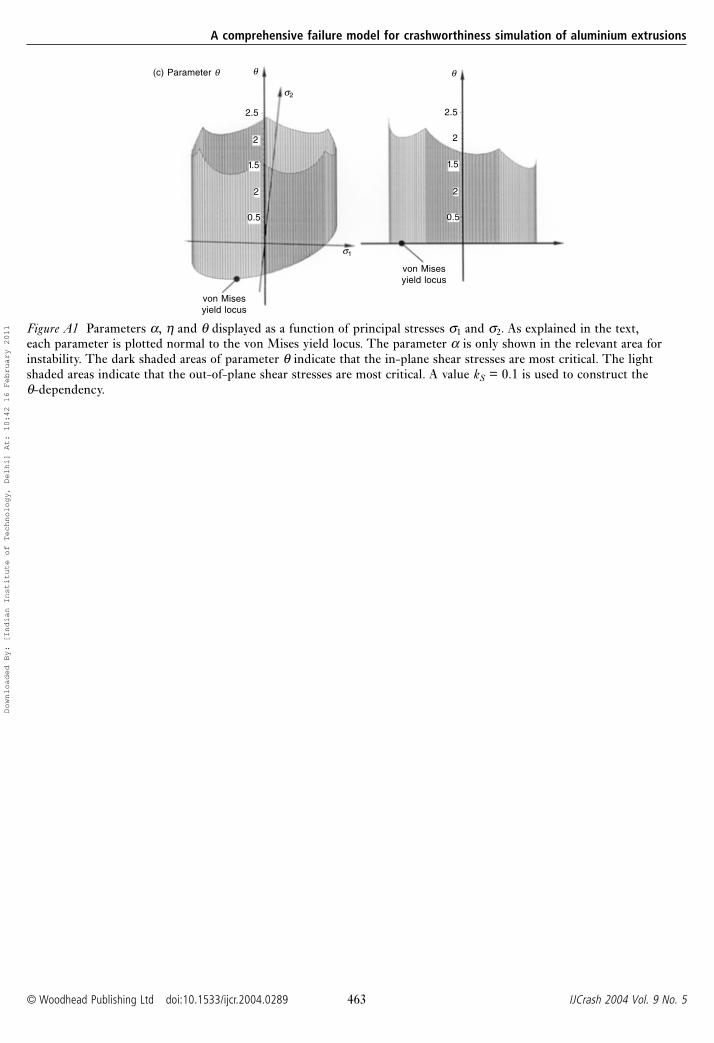
Figure A1 illustrates the dependencies of the parametersα, η and θ for an arbitrary state of plane stress. For a givenstate of plane stress, σ1, σ2, σ3 = 0, the corresponding valueof the parameter is displayed normal to the σ1 – σ2 planeof the von Mises yield locus. It is evident from the left sideof Figure A1 that all parameters show a plane of symmetrywhich is normal to the line σ1 = – σ2. Therefore, the righthand side of Figure A1 shows a side view along the line σ1= – σ2 in the plane of the von Mises yield locus.
1
0.5
–0.5
–1
1
–1
σ2
σ1
α α
von Misesyield locus
von Misesyield locus
(a) Parameter α
η
2
1
–1
–2
von Misesyield locus
σ1
σ2
η
2
1
–1
2
von Misesyield locus
(b) Parameter η
Downloaded By: [Indian Institute of Technology, Delhi] At: 10:42 16 February 2011
A comprehensive failure model for crashworthiness simulation of aluminium extrusions
© Woodhead Publishing Ltd doi:10.1533/ijcr.2004.0289 463 IJCrash 2004 Vol. 9 No. 5
Figure A1 Parameters α, η and θ displayed as a function of principal stresses σ1 and σ2. As explained in the text,each parameter is plotted normal to the von Mises yield locus. The parameter α is only shown in the relevant area forinstability. The dark shaded areas of parameter θ indicate that the in-plane shear stresses are most critical. The lightshaded areas indicate that the out-of-plane shear stresses are most critical. A value kS = 0.1 is used to construct theθ-dependency.
θ
von Misesyield locus
σ1
von Misesyield locus
θ(c) Parameter θ
σ2
2.5
2
1.5
2
0.5
2.5
2
1.5
2
0.5
Downloaded By: [Indian Institute of Technology, Delhi] At: 10:42 16 February 2011