Embed Size (px)
Citation preview

A Comprehensive Evaluation of High Friction Overlay Systems
on Bridge Decks in Cold Climate Regions
A Thesis
SUBMITTED TO THE FACULTY OF
UNIVERSITY OF MINNESOTA
BY
Robert D Kostick
IN PARTIAL FULFILLMENT OF THE REQUIREMENTS
FOR THE DEGREE OF
MASTER OF SCIENCE
Advisor Dr Eshan V Dave
May 2015
copy Robert Kostick 2015
i
Acknowledgements
Dr Eshan Dave
o For making my continued academic pursuits possible and providing the
opportunity to head this project Also thanks for the confidence and
support to submit my research for publication
Jay Dailey ndash Research Engineer
o For assisting with every aspect of my research going the extra mile and
the countless times you reviewed my writing Thank you especially for the
helpful advice whenever I got in a pickle
Ben Helmer - Graduate Researcher
o Always offering to help and providing it whenever necessary
Chelsea Hoplin ndashGraduate Researcher
o For taking the time to proof read my thesis and providing valuable edits
Jared Munch - Undergraduate Researcher
o Helping with field research when an extra hand was needed
Minnesota Department of Transportation
o Providing the funding traffic control personnel for field testing and data
to make this project happen
Without the contributions made by all of the aforementioned individuals I could not have
completed this project I also want to thank my family and friends for their support and
interest in the progression of my research
ii
Abstract
In recent history the Minnesota Department of Transportation has looked to improve the
safety of bridges One improvement method is placing high friction overlays (HFO) on
bridge decks The primary goal of this research was to complete a comprehensive study
of different proprietary HFO systems placed on bridges throughout the state of
Minnesota Four different proprietary HFO systems placed on fourteen different bridges
were studied
Research was split into three separate tasks The first task was laboratory testing on
different aggregate sources used in HFO systems Second a two year field study was
conducted including observation and testing of different HFO systems placed on bridges
throughout the state of Minnesota Testing was conducted to obtain the mean texture
depth bond strength permeability and friction values of the HFO systems The third task
was the comprehensive analysis of ten years of crash data encompassing before and after
HFO systems were installed on the bridge decks Crash characteristics analyzed included
the accident time weather conditions bridge surface conditions Average Daily Traffic
and severity of accidents
Field testing and observations revealed that the extensive use of snowplows during winter
months extensively abrade the high friction systems This abrasion causes a reduction in
the surfaces friction values and reduces the life of such a system The analysis of crash
data suggests that although there is a reducing trend in overall accidents a reduction in
accidents cannot be completely attributed to the use of high friction overlays
Furthermore the presence of ice packed snow on HFO systems nullifies their high
friction values The reduction in crashes directly correlated to the installation of HFO
systems is minimal It is recommended that use of HFO systems in Minnesota be
reevaluated
iii
Table of Contents
Table of Contentshelliphelliphelliphelliphelliphelliphelliphelliphelliphelliphelliphelliphelliphelliphelliphelliphelliphelliphelliphelliphelliphelliphelliphelliphelliphelliphellip iii
List of Tableshelliphelliphelliphelliphelliphelliphelliphelliphelliphelliphelliphelliphelliphelliphelliphelliphelliphelliphelliphelliphelliphelliphelliphelliphelliphelliphelliphelliphellipviii
List of Figureshelliphelliphelliphelliphelliphelliphelliphelliphelliphelliphelliphelliphelliphelliphelliphelliphelliphelliphelliphelliphelliphelliphelliphelliphelliphelliphelliphelliphellipx
Chapter 1 Introduction of the Project 1
Introduction to High Friction Overlay Systems 1
Need for this Study 2
Objective of this Study 2
Organization of Thesis 3
Background Information 4
High Friction Overlay Systems 4
Construction of an Epoxy High Friction Overlay System 5
Bridges with an HFO system installed 8
Bridge Site Descriptions 10
Chapter 2 Literature Review 14
Minnesota Climate 14
Aggregates 16
Macrotexture and Microtexture of Aggregates 17
HFO Systems in Minnesota 18
HFO Systems in Other Sates 19
Field Observations 19
Crash Analysis 21
Skid Numbers 22
Building Off of Previous Research 24
iv
Chapter 3 Comprehensive Aggregate Testing 26
Testing Procedures and Methodology 31
Description of Standard Tests 32
Density Specific Gravity amp Absorption (Coarse Aggregate) 32
Resistance to Degradation 32
Uncompacted Void Content 33
FlatElongated Particles 34
Percent of Fractured Particles 35
Soundness of Aggregates 35
Sieve Analysis 35
Results 36
Density Specific Gravity amp Absorption 36
Resistance to Degradation 38
Uncompacted Void Content 38
FlatElongated Particles 39
Percent of Fractured Particles 42
Soundness of Aggregates 43
Sieve Analysis 44
Aggregate Laboratory Testing Summary 46
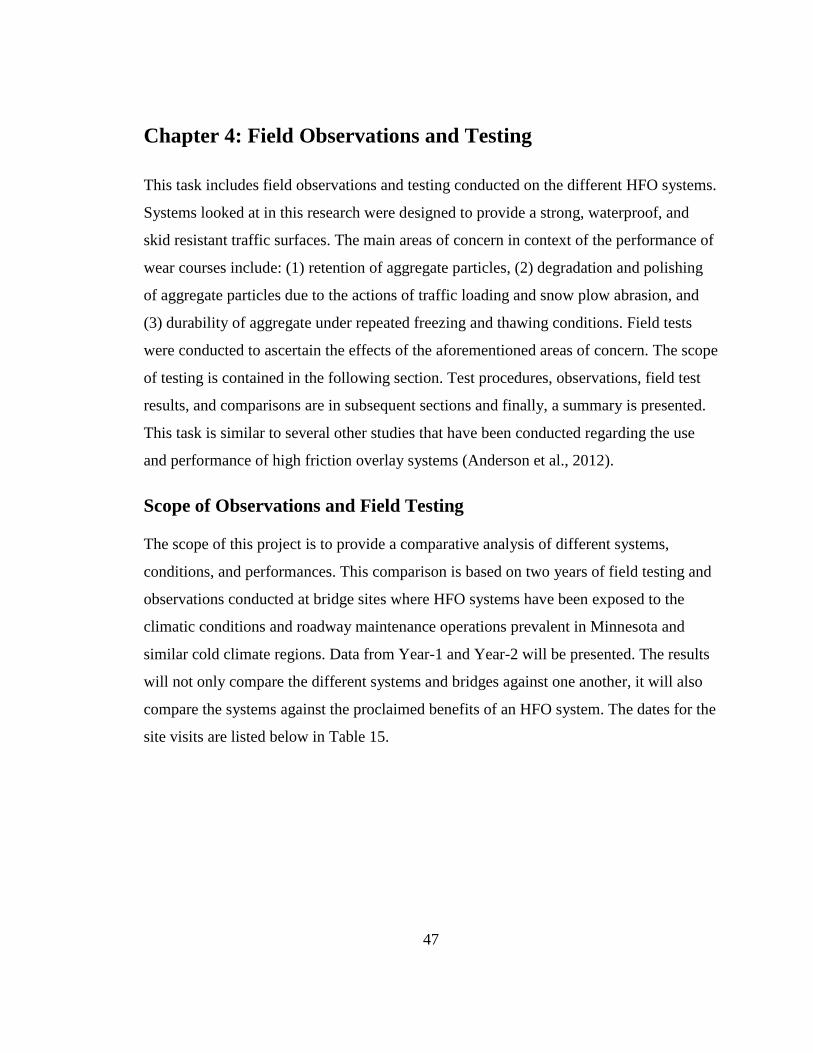
Chapter 4 Field Observations and Testing 47
Scope of Observations and Field Testing 47
Observations 48
Distresses 48
Delamination of High Friction Overlay Systems 67
v
Differences in Thickness of High Friction Overlay Systems 73
Testing Procedure and Methodology 73
Pavement Macrotexture Depth 75
Torque Bond Strength 75
Pavement Permeability 77
Skid Resistance of Paved Surfaces 79
Chloride Ion Penetration 81
Results 83
Pavement Macrotexture Depth Results 83
Bond Strength Results 92
Permeability Results 99
Surface Friction Results 102
Chloride Ion Penetration Results 116
Field Observations and Testing Summary 123
Chapter 5 Crash Data Analysis 125
Causes of Crashes in Minnesota 125
Data Collection 128
Analytical Comparison 129
Cause of Crashes 130
Severity of Crashes 131
Time of Crashes 132
Surface Conditions 132
Crashes Before and After HFO System Installation 134
Severity Before and After 135
vi
Surface Conditions Before and After 135
Normalized to Traffic Levels Before and After 137
Comparison of Year-1 and Year-2 Crashes 137
Comparison of Different HFO Systems 140
Comparing the Four Different Proprietary HFO Systems 141
Comparison of Poly-Carb Systems Using Different Aggregates 144
Comparison of Side by Side Bridges with and without HFO System Overlays 145
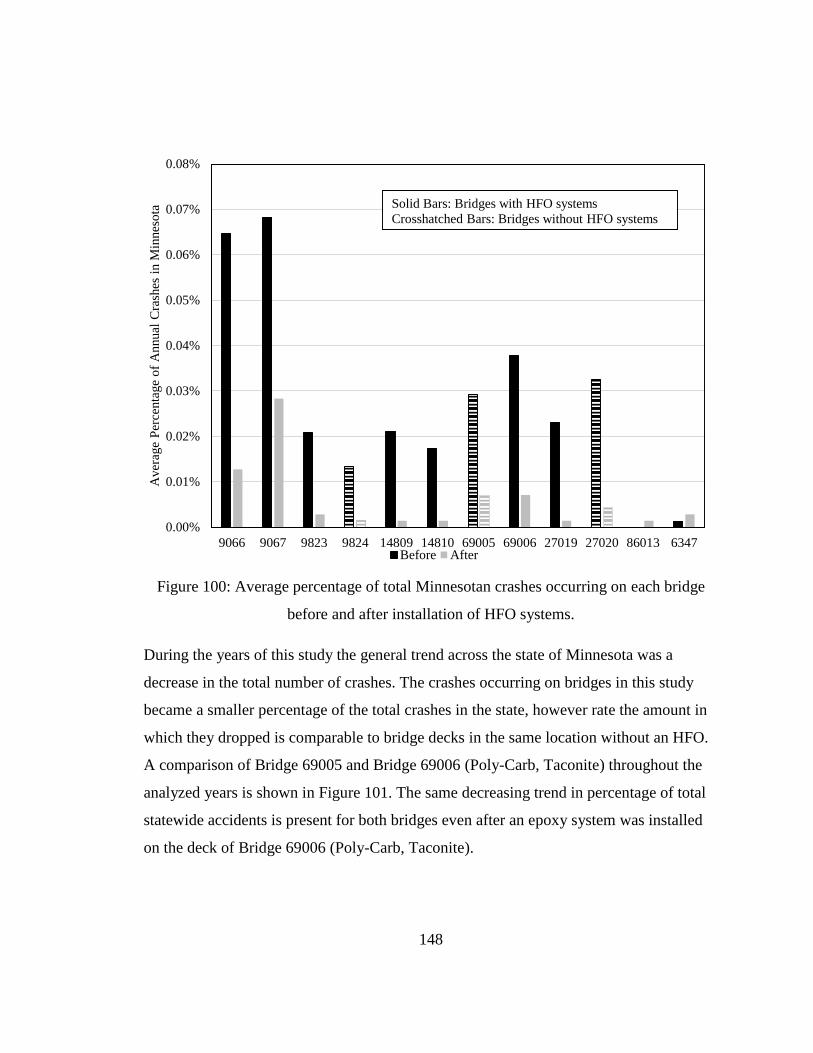
Comparison of Crashes Normalized to Total Crashes in Minnesota 147
Comparison of Crashes with the Sitersquos Surface Friction Values 149
Benefit-Cost Ratio Analysis 152
Crash Analysis Summary 154
Chapter 6 Summary Conclusions and Recommendations 157
Summary 157
Conclusions 158
Recommendations 161
References 164
Appendix 169
Chapter 3 Appendix 169
Density Specific Gravity amp Absorption (Fine Aggregate) Data 169
Resistance to Degradation Los Angeles Machine Data 171
Uncompacted Voids Data 171
FlatElongated Particles 172
Soundness of Aggregate Freeze Thaw Data 174
Sieve Analysis 175
vii
Chapter 4 Appendix 178
Mean Texture Depth 178
Coefficient of Permeability 178
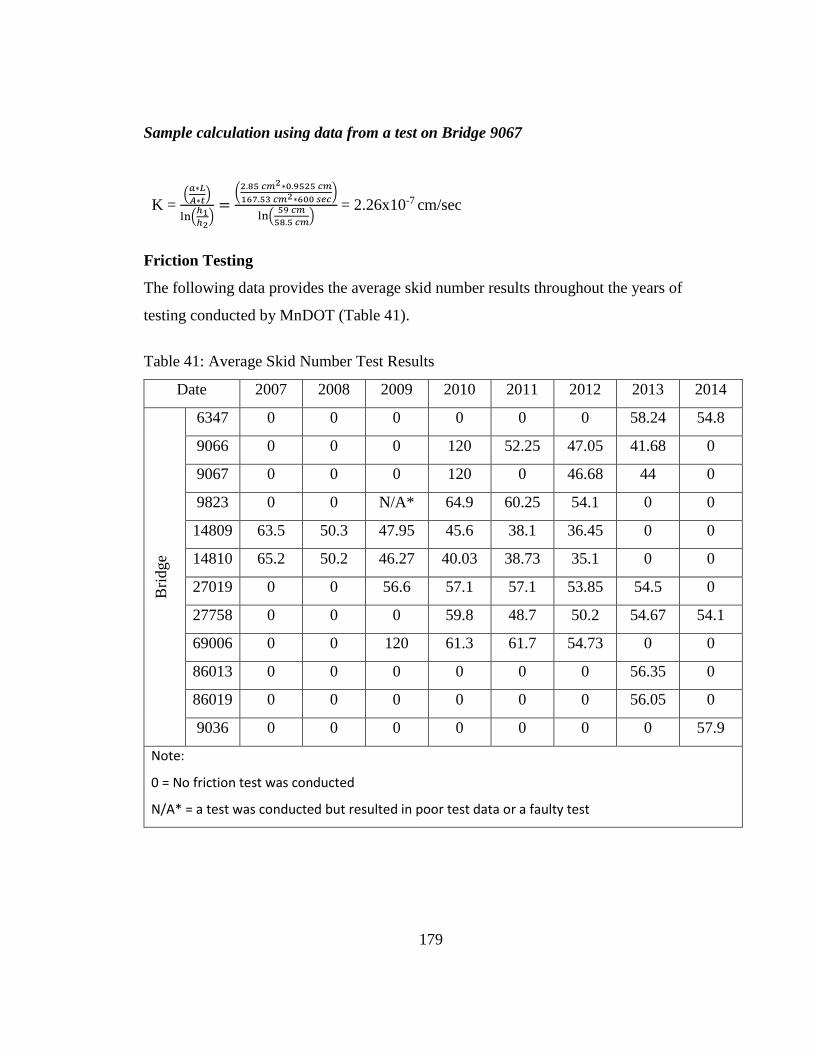
Friction Testing 179
Chloride Ion Penetration 180
Chapter 5 Appendix 183
Data for Contributing Factors in Crashes 183
Sample Calculation Number of Accidents per Million Vehicles Crossing 184
Benefit-Cost Ratio Calculation 185
viii
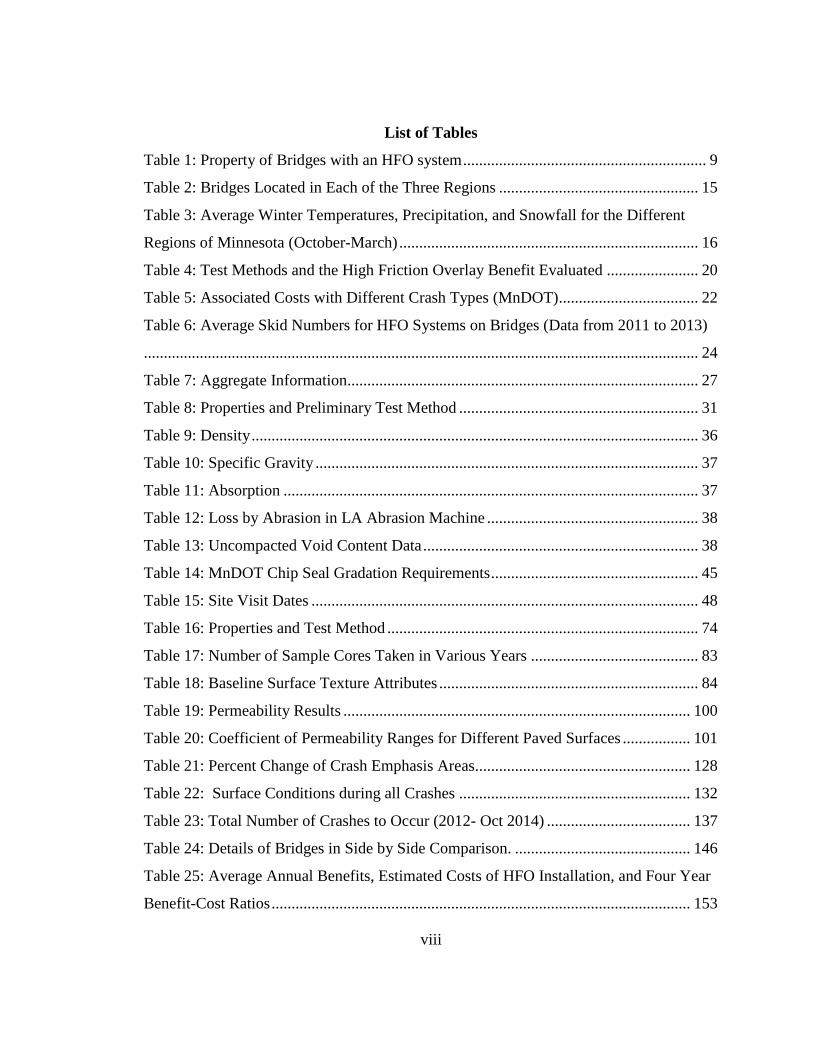
List of Tables
Table 1 Property of Bridges with an HFO system 9
Table 2 Bridges Located in Each of the Three Regions 15
Table 3 Average Winter Temperatures Precipitation and Snowfall for the Different
Regions of Minnesota (October-March) 16
Table 4 Test Methods and the High Friction Overlay Benefit Evaluated 20
Table 5 Associated Costs with Different Crash Types (MnDOT) 22
Table 6 Average Skid Numbers for HFO Systems on Bridges (Data from 2011 to 2013)
24
Table 7 Aggregate Information 27
Table 8 Properties and Preliminary Test Method 31
Table 9 Density 36
Table 10 Specific Gravity 37
Table 11 Absorption 37
Table 12 Loss by Abrasion in LA Abrasion Machine 38
Table 13 Uncompacted Void Content Data 38
Table 14 MnDOT Chip Seal Gradation Requirements 45
Table 15 Site Visit Dates 48
Table 16 Properties and Test Method 74
Table 17 Number of Sample Cores Taken in Various Years 83
Table 18 Baseline Surface Texture Attributes 84
Table 19 Permeability Results 100
Table 20 Coefficient of Permeability Ranges for Different Paved Surfaces 101
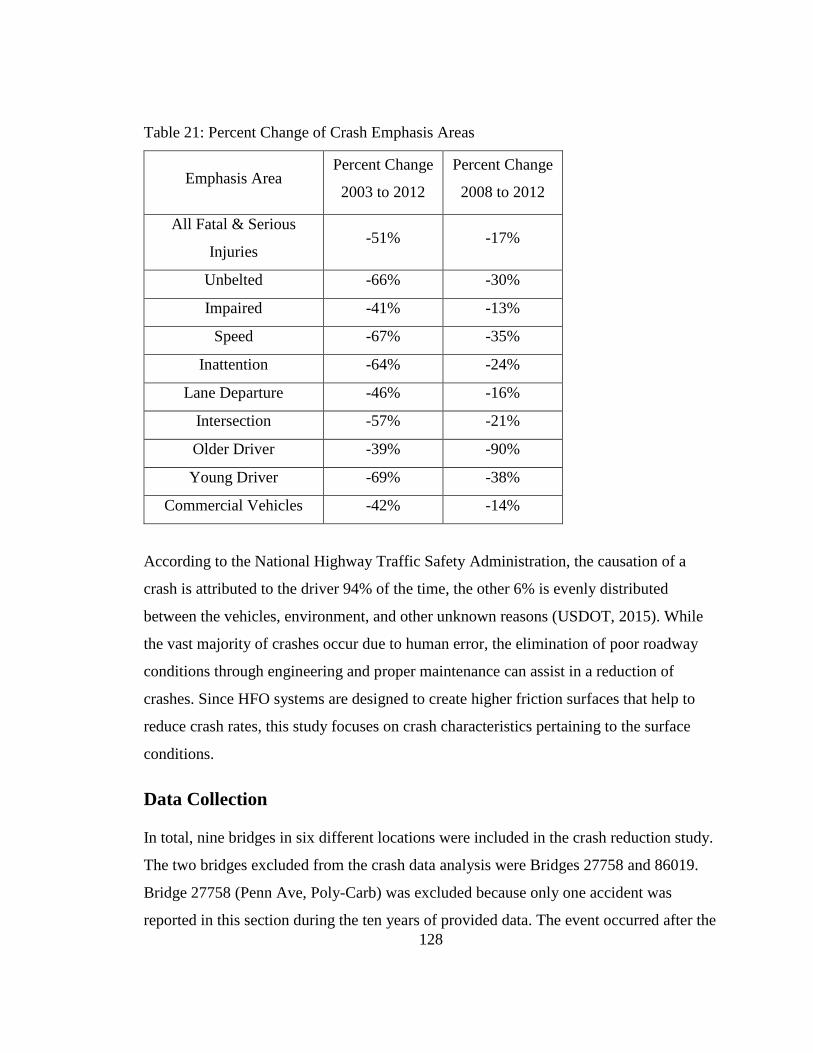
Table 21 Percent Change of Crash Emphasis Areas 128
Table 22 Surface Conditions during all Crashes 132
Table 23 Total Number of Crashes to Occur (2012- Oct 2014) 137
Table 24 Details of Bridges in Side by Side Comparison 146
Table 25 Average Annual Benefits Estimated Costs of HFO Installation and Four Year
Benefit-Cost Ratios 153
ix
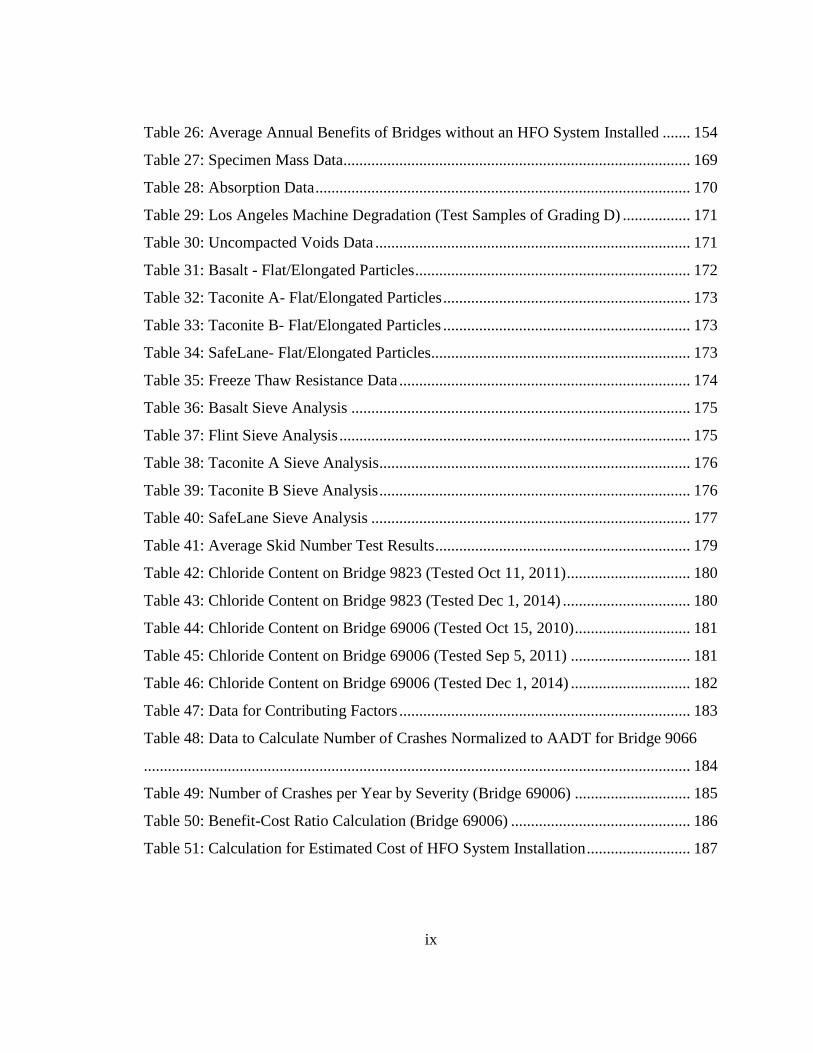
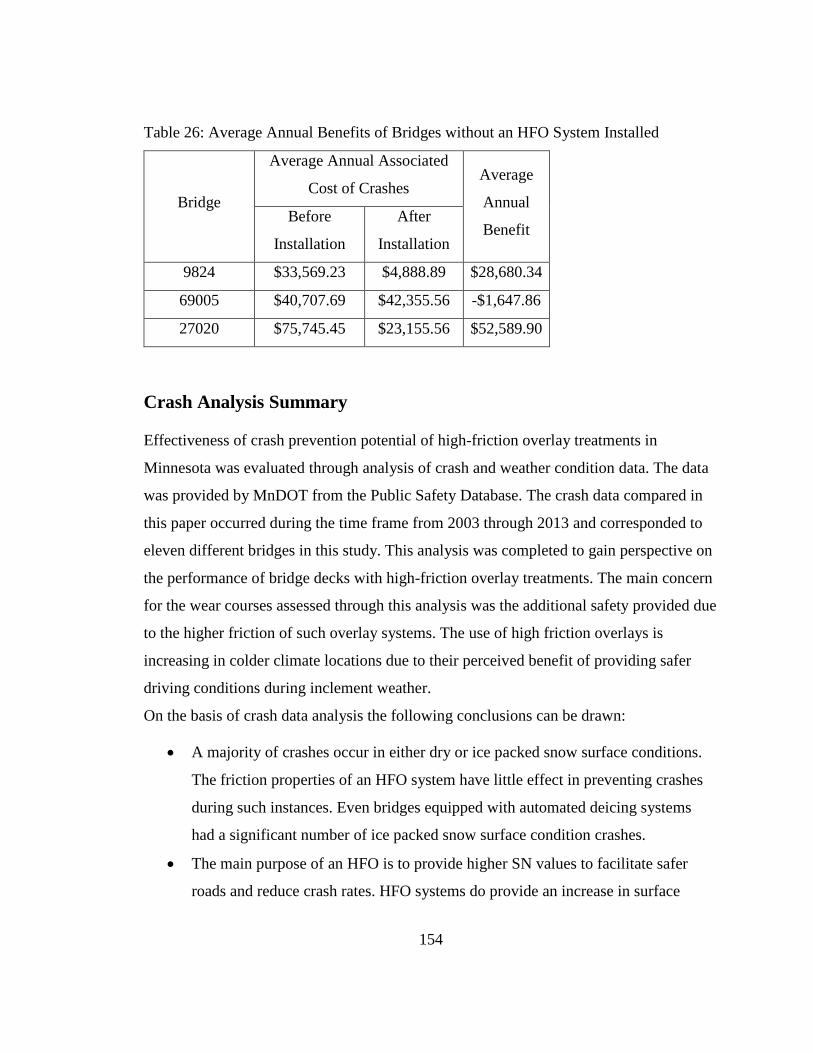
Table 26 Average Annual Benefits of Bridges without an HFO System Installed 154
Table 27 Specimen Mass Data 169
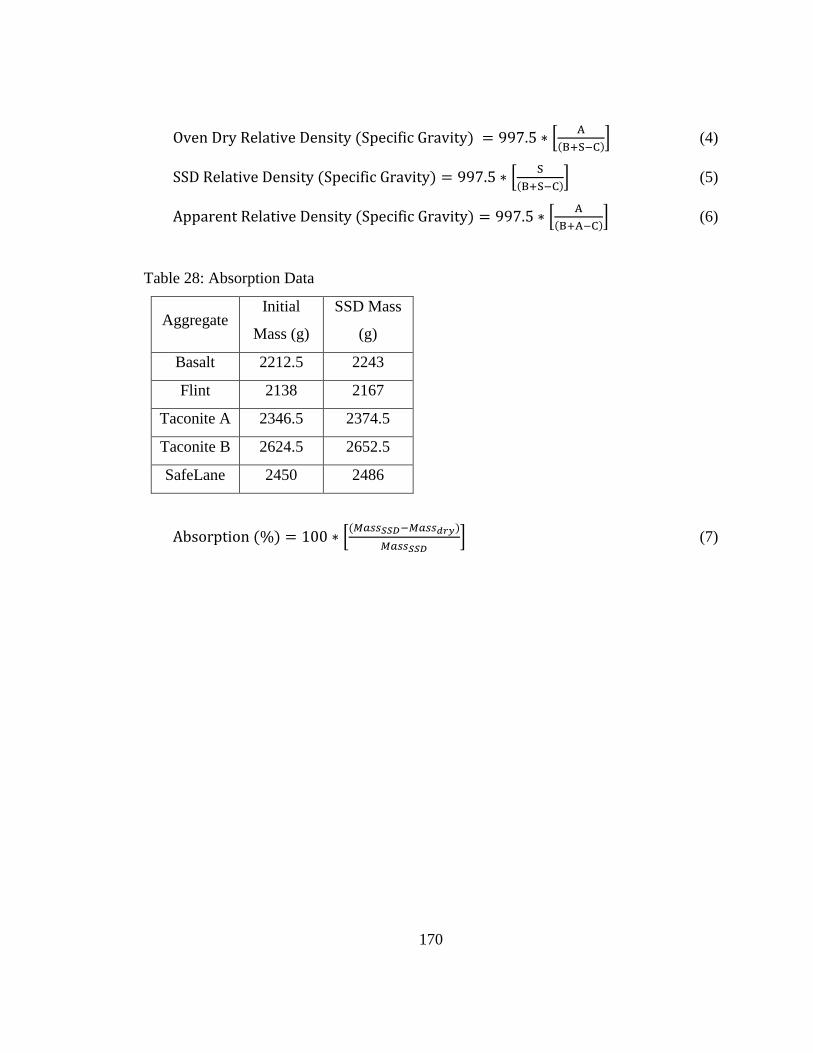
Table 28 Absorption Data 170
Table 29 Los Angeles Machine Degradation (Test Samples of Grading D) 171
Table 30 Uncompacted Voids Data 171
Table 31 Basalt - FlatElongated Particles 172
Table 32 Taconite A- FlatElongated Particles 173
Table 33 Taconite B- FlatElongated Particles 173
Table 34 SafeLane- FlatElongated Particles 173
Table 35 Freeze Thaw Resistance Data 174
Table 36 Basalt Sieve Analysis 175
Table 37 Flint Sieve Analysis 175
Table 38 Taconite A Sieve Analysis 176
Table 39 Taconite B Sieve Analysis 176
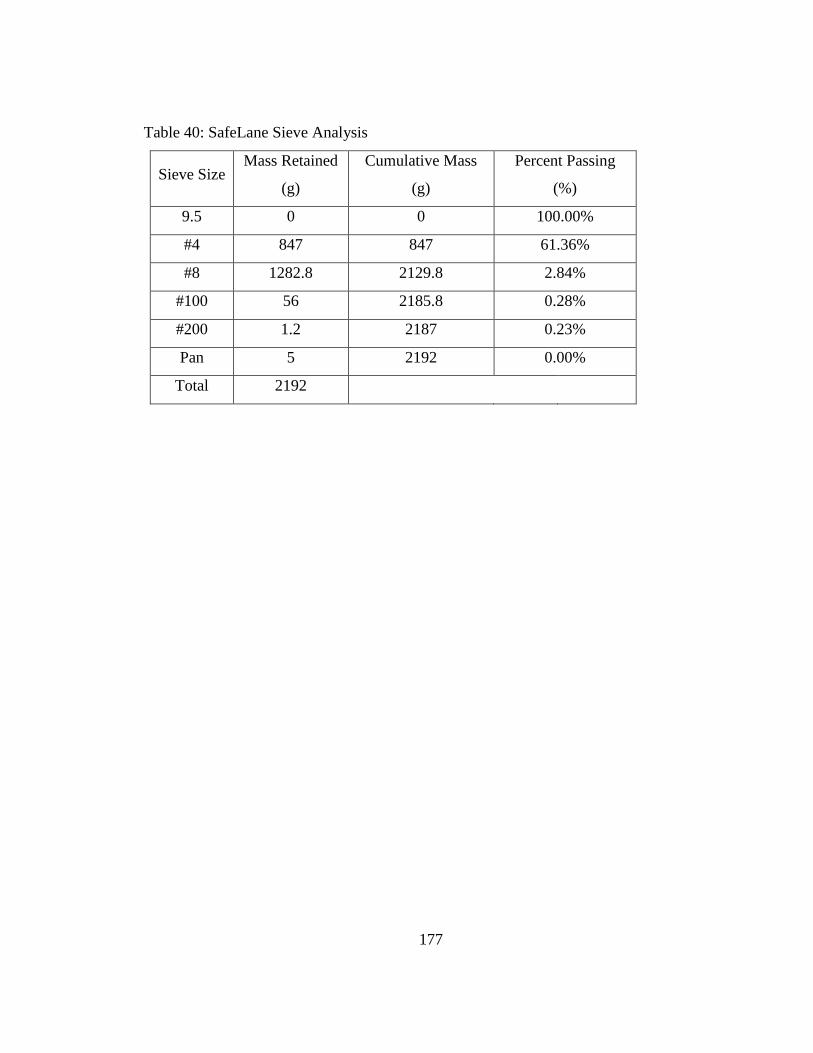
Table 40 SafeLane Sieve Analysis 177
Table 41 Average Skid Number Test Results 179
Table 42 Chloride Content on Bridge 9823 (Tested Oct 11 2011) 180
Table 43 Chloride Content on Bridge 9823 (Tested Dec 1 2014) 180
Table 44 Chloride Content on Bridge 69006 (Tested Oct 15 2010) 181
Table 45 Chloride Content on Bridge 69006 (Tested Sep 5 2011) 181
Table 46 Chloride Content on Bridge 69006 (Tested Dec 1 2014) 182
Table 47 Data for Contributing Factors 183
Table 48 Data to Calculate Number of Crashes Normalized to AADT for Bridge 9066
184
Table 49 Number of Crashes per Year by Severity (Bridge 69006) 185
Table 50 Benefit-Cost Ratio Calculation (Bridge 69006) 186
Table 51 Calculation for Estimated Cost of HFO System Installation 187
x
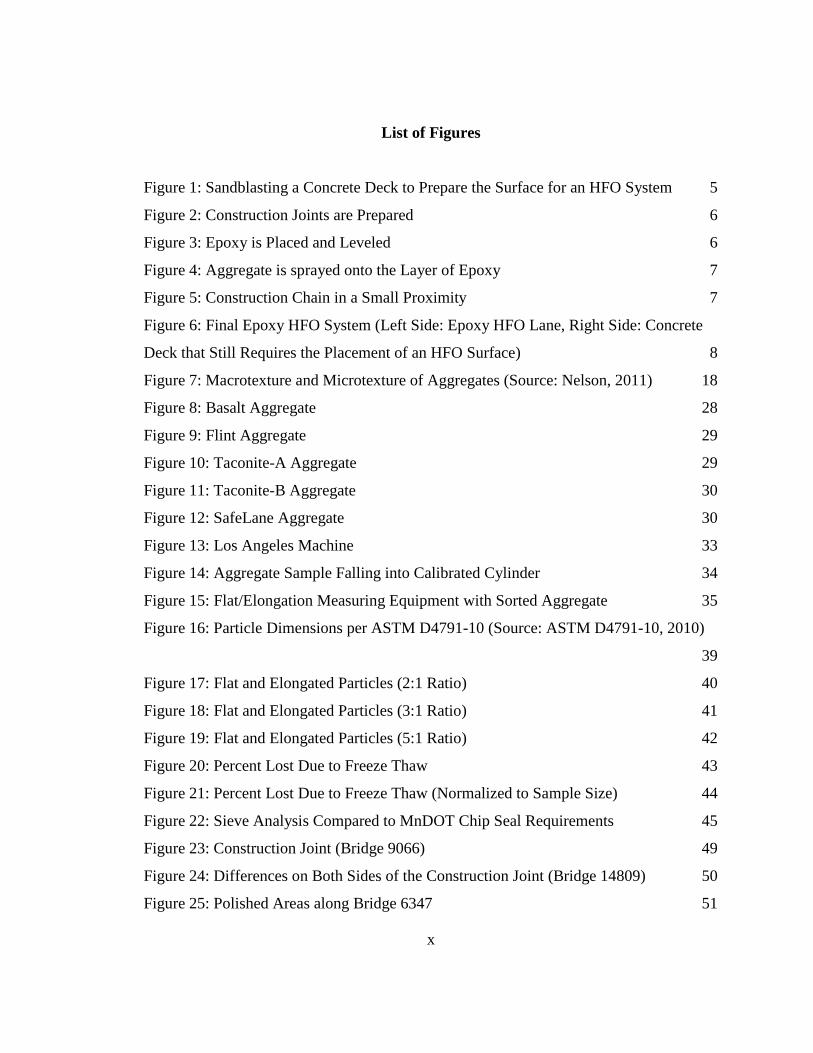
List of Figures
Figure 1 Sandblasting a Concrete Deck to Prepare the Surface for an HFO System 5
Figure 2 Construction Joints are Prepared 6
Figure 3 Epoxy is Placed and Leveled 6
Figure 4 Aggregate is sprayed onto the Layer of Epoxy 7
Figure 5 Construction Chain in a Small Proximity 7
Figure 6 Final Epoxy HFO System (Left Side Epoxy HFO Lane Right Side Concrete
Deck that Still Requires the Placement of an HFO Surface) 8
Figure 7 Macrotexture and Microtexture of Aggregates (Source Nelson 2011) 18
Figure 8 Basalt Aggregate 28
Figure 9 Flint Aggregate 29
Figure 10 Taconite-A Aggregate 29
Figure 11 Taconite-B Aggregate 30
Figure 12 SafeLane Aggregate 30
Figure 13 Los Angeles Machine 33
Figure 14 Aggregate Sample Falling into Calibrated Cylinder 34
Figure 15 FlatElongation Measuring Equipment with Sorted Aggregate 35
Figure 16 Particle Dimensions per ASTM D4791-10 (Source ASTM D4791-10 2010)
39
Figure 17 Flat and Elongated Particles (21 Ratio) 40
Figure 18 Flat and Elongated Particles (31 Ratio) 41
Figure 19 Flat and Elongated Particles (51 Ratio) 42
Figure 20 Percent Lost Due to Freeze Thaw 43
Figure 21 Percent Lost Due to Freeze Thaw (Normalized to Sample Size) 44
Figure 22 Sieve Analysis Compared to MnDOT Chip Seal Requirements 45
Figure 23 Construction Joint (Bridge 9066) 49
Figure 24 Differences on Both Sides of the Construction Joint (Bridge 14809) 50
Figure 25 Polished Areas along Bridge 6347 51
xi
Figure 26 Proper Epoxy Levels (Left Side) Next to Area with Excessive Epoxy (Right
Side) 51
Figure 27 Transverse Snowplow Abrasion (Br 4190) 52
Figure 28 Existing Macrotexture on Bridge 27758 53
Figure 29 Polished Area on Bridge 27758 along with Transverse Cracks 53
Figure 30 Excessive Snow Plow Abrasion (Br 27758) 54
Figure 31 Thin Epoxy System (Br 27758) 55
Figure 32 Uneven Snowplow Abrasion due to Uneven Roadway Elevation (Br 86019) 56
Figure 33 Missing Overlay System near Expansion Joints on Transpo System (Br 27758)
56
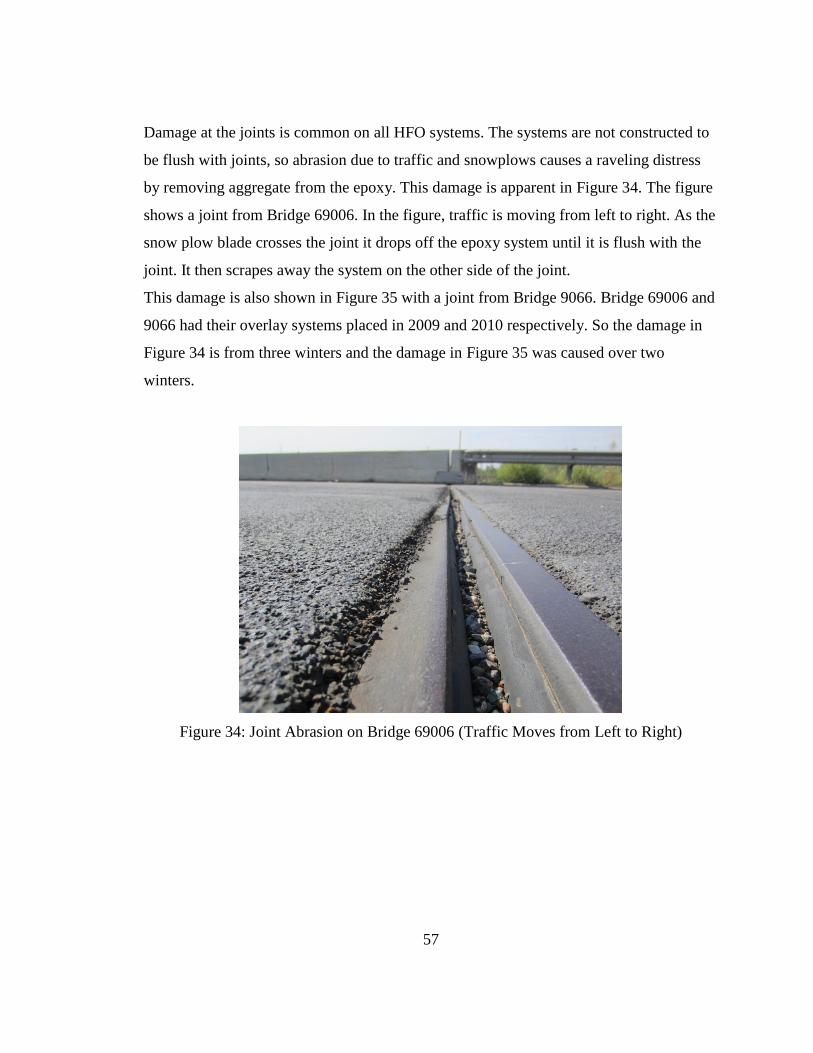
Figure 34 Joint Abrasion on Bridge 69006 (Traffic Moves from Left to Right) 57
Figure 35 Joint Damage on Bridge 9066 (Traffic Moves from Left to Right) 58
Figure 36 Damage near Approach Panels on Poly-Carb System (Bridge 69006) 59
Figure 37 System Removal near Joint on NovaChip System (Bridge 86019) 59
Figure 38 Texture Comparison of Br 4190 (Left Proper Aggregate Macrotexture Right
Aggregate Raveling) 60
Figure 39 Comparison of Loss of Aggregate between Novachip (Left) SafeLane
(Middle) and Poly-Carb (Right) Systems 62
Figure 40 Wheel Path Polishing (Br 9066) 63
Figure 41 Close View of Polished Area (Br 9066) 63
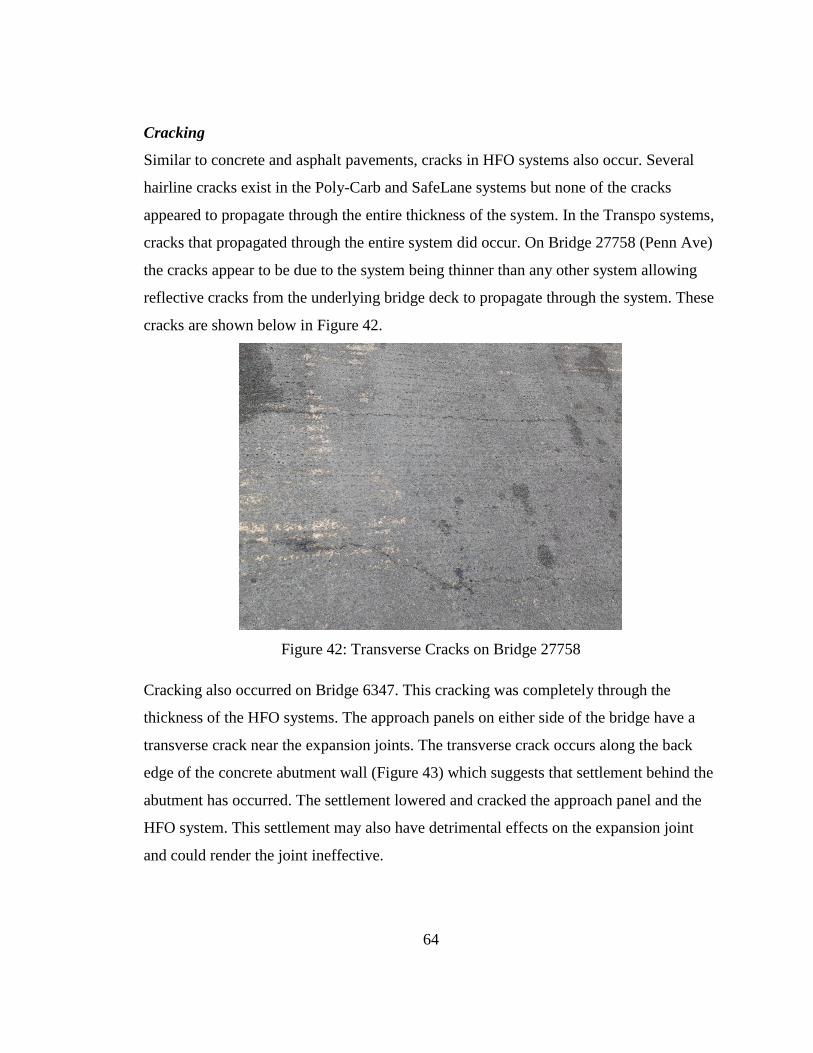
Figure 42 Transverse Cracks on Bridge 27758 64
Figure 43 Transverse Crack near Expansion Joint of Bridge 6347 65
Figure 44 Longitudinal Crack in Novachip System (Br 27019) 66
Figure 45 Reflective Cracking in Novachip System (Br 27019) 66
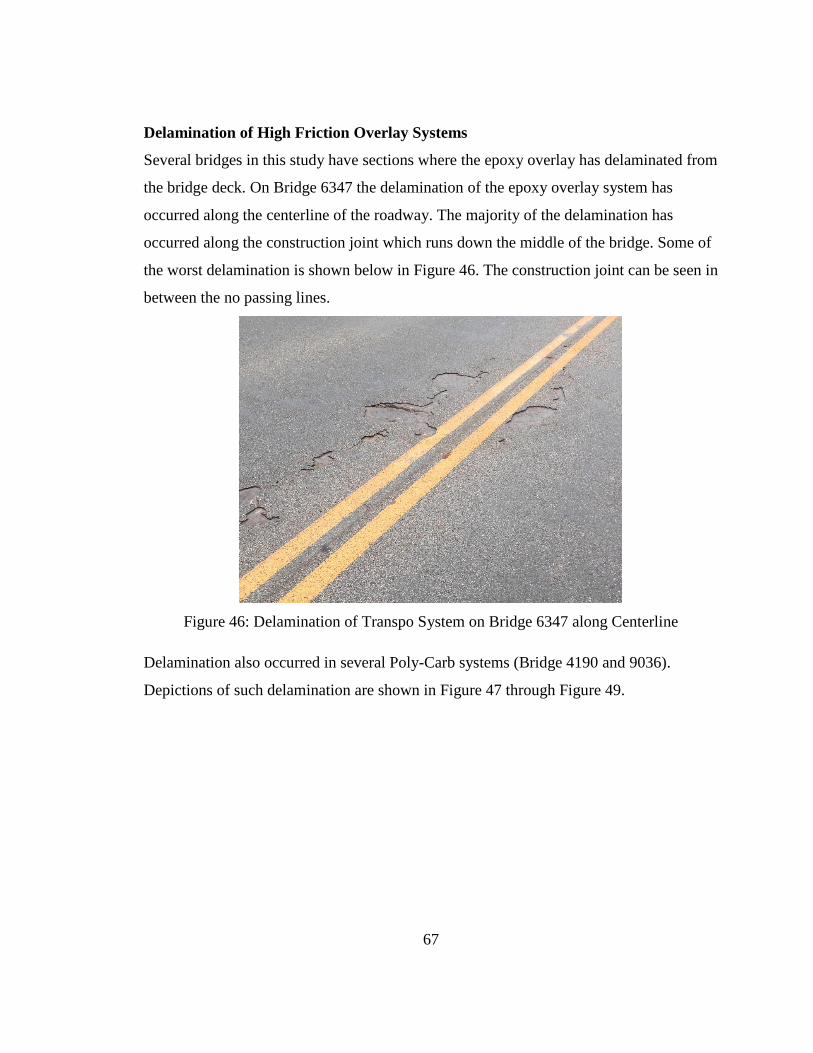
Figure 46 Delamination of Transpo System on Bridge 6347 along Centerline 67
Figure 47 Delamination of HFO on Robert Street Bridge (Br 9036) 68
Figure 48 Minimal Bond Strength Existed in the Distressed Areas (Br 9036) 69
Figure 49 Delaminated Area during Maintenance (Br 4190) 69
Figure 50 Expansion Joint on Bridge 9066 70
xii
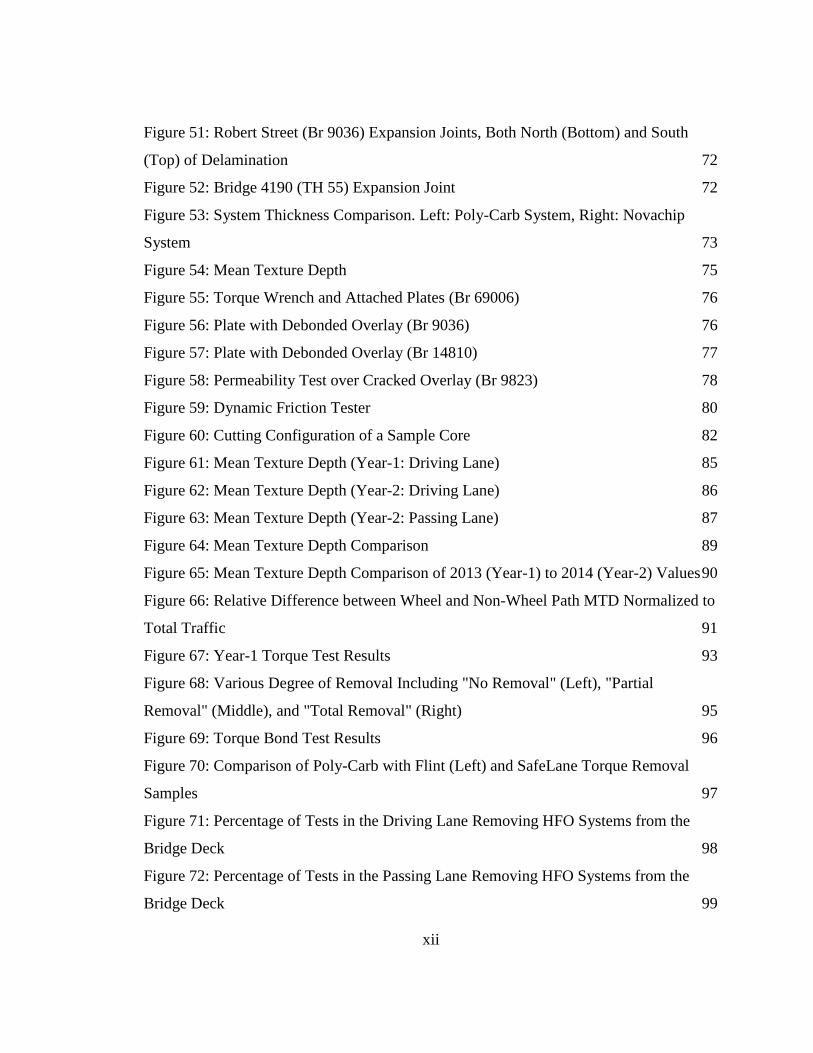
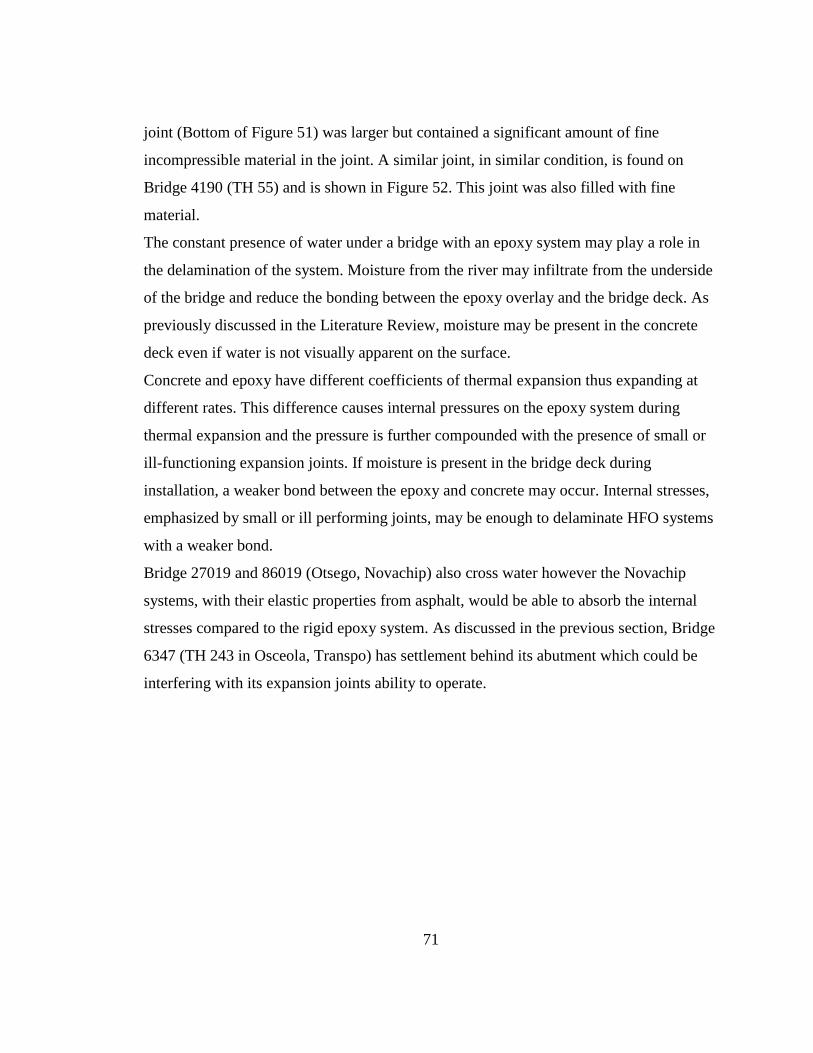
Figure 51 Robert Street (Br 9036) Expansion Joints Both North (Bottom) and South
(Top) of Delamination 72
Figure 52 Bridge 4190 (TH 55) Expansion Joint 72
Figure 53 System Thickness Comparison Left Poly-Carb System Right Novachip
System 73
Figure 54 Mean Texture Depth 75
Figure 55 Torque Wrench and Attached Plates (Br 69006) 76
Figure 56 Plate with Debonded Overlay (Br 9036) 76
Figure 57 Plate with Debonded Overlay (Br 14810) 77
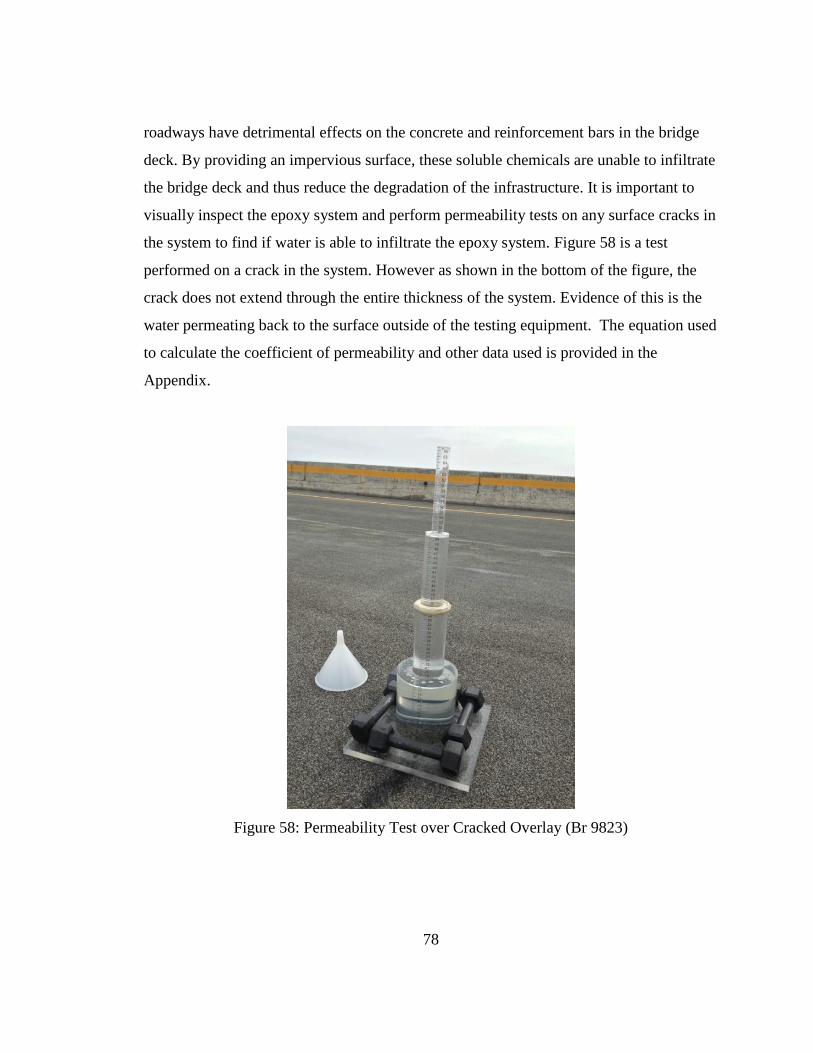
Figure 58 Permeability Test over Cracked Overlay (Br 9823) 78
Figure 59 Dynamic Friction Tester 80
Figure 60 Cutting Configuration of a Sample Core 82
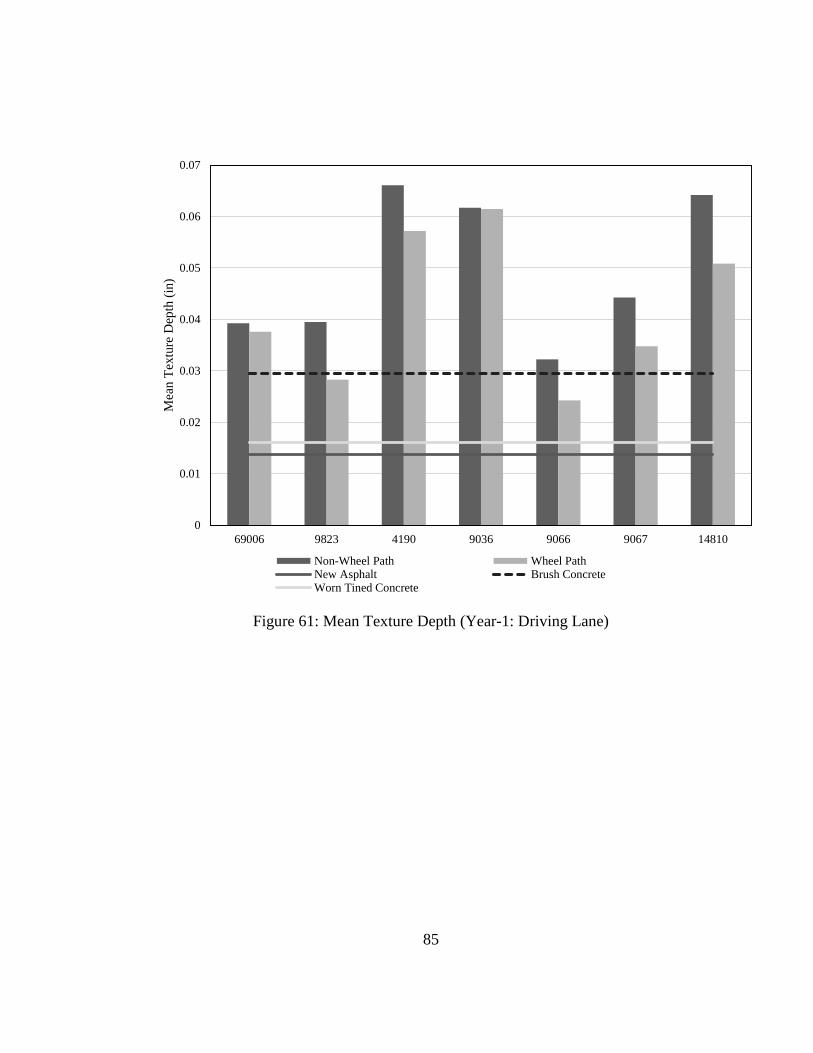
Figure 61 Mean Texture Depth (Year-1 Driving Lane) 85
Figure 62 Mean Texture Depth (Year-2 Driving Lane) 86
Figure 63 Mean Texture Depth (Year-2 Passing Lane) 87
Figure 64 Mean Texture Depth Comparison 89
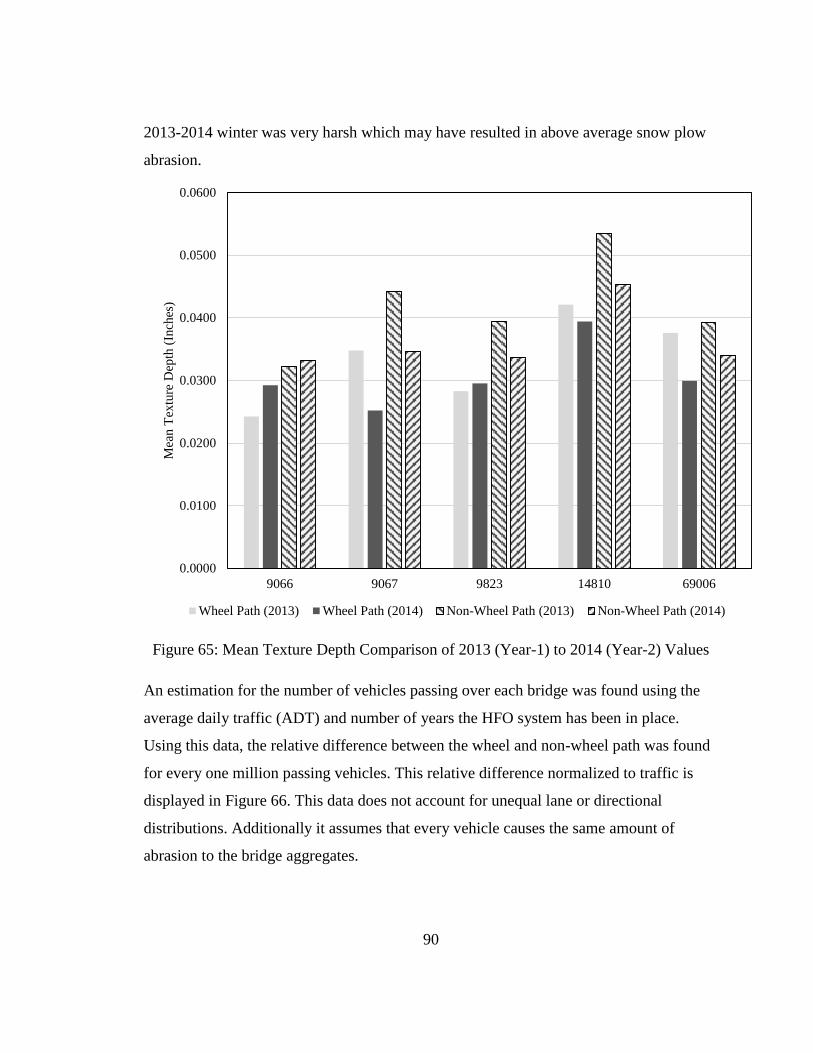
Figure 65 Mean Texture Depth Comparison of 2013 (Year-1) to 2014 (Year-2) Values 90
Figure 66 Relative Difference between Wheel and Non-Wheel Path MTD Normalized to
Total Traffic 91
Figure 67 Year-1 Torque Test Results 93
Figure 68 Various Degree of Removal Including No Removal (Left) Partial
Removal (Middle) and Total Removal (Right) 95
Figure 69 Torque Bond Test Results 96
Figure 70 Comparison of Poly-Carb with Flint (Left) and SafeLane Torque Removal
Samples 97
Figure 71 Percentage of Tests in the Driving Lane Removing HFO Systems from the
Bridge Deck 98
Figure 72 Percentage of Tests in the Passing Lane Removing HFO Systems from the
Bridge Deck 99
xiii
Figure 73 Area of Bridge 9824 Tested for Permeability 101
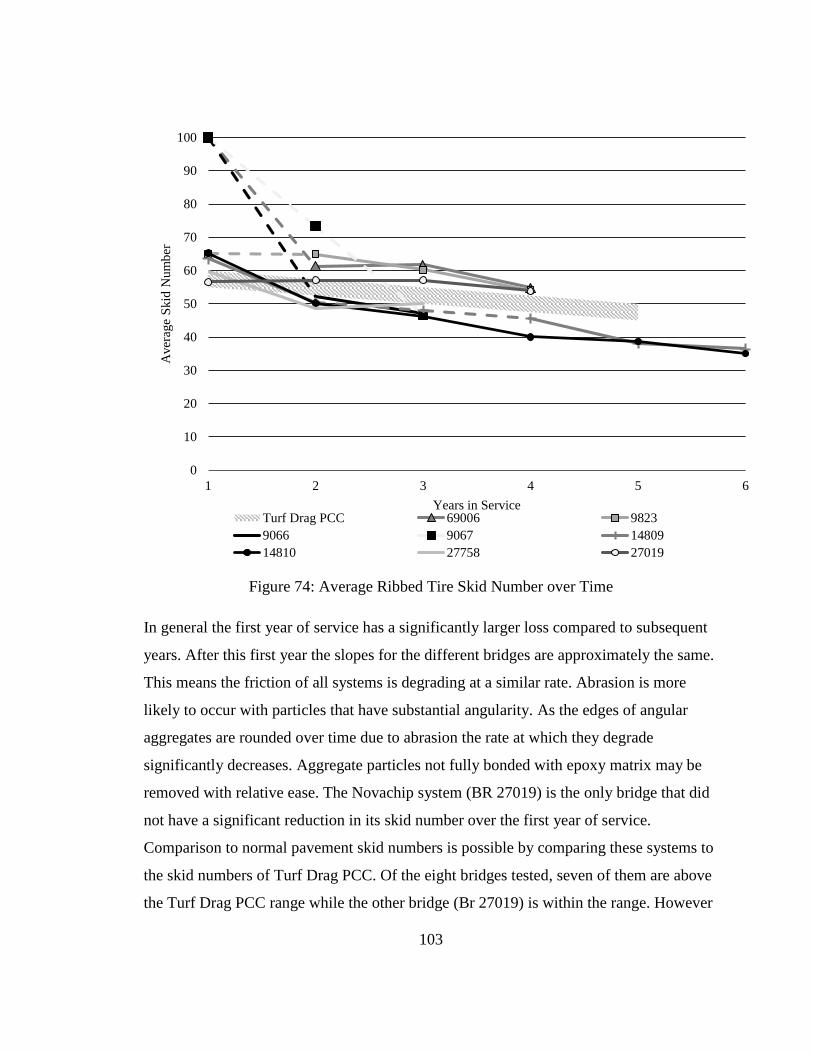
Figure 74 Average Ribbed Tire Skid Number over Time 103
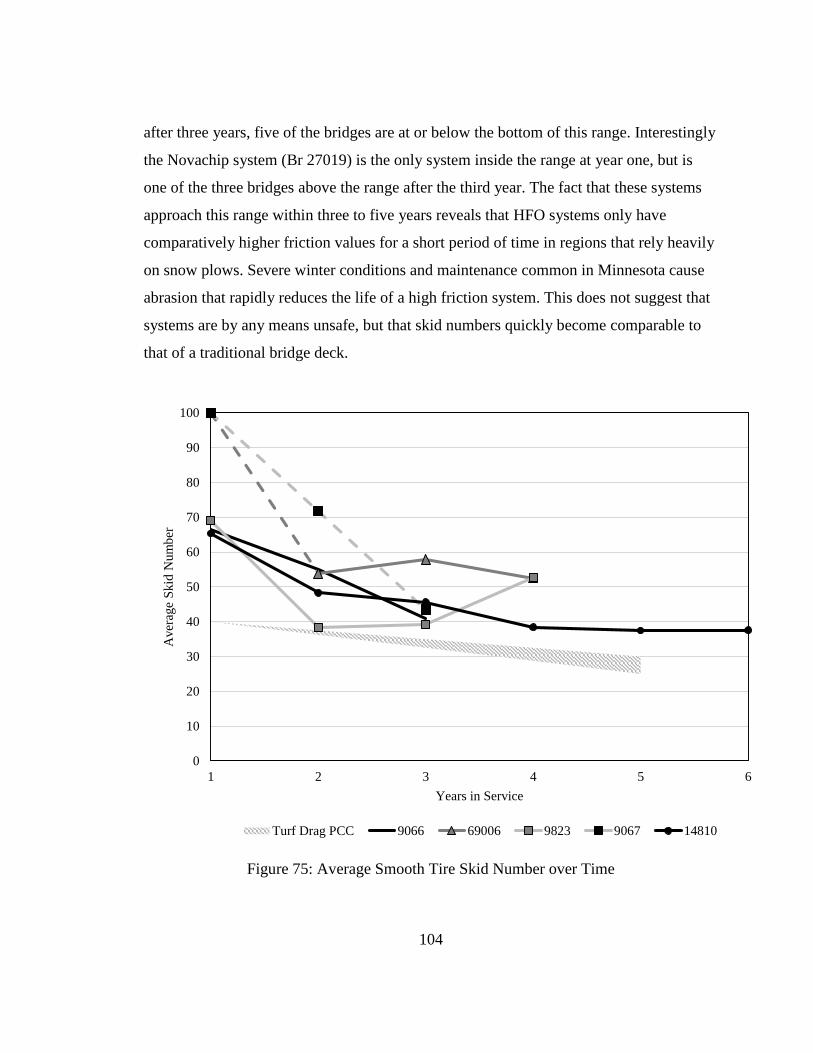
Figure 75 Average Smooth Tire Skid Number over Time 104
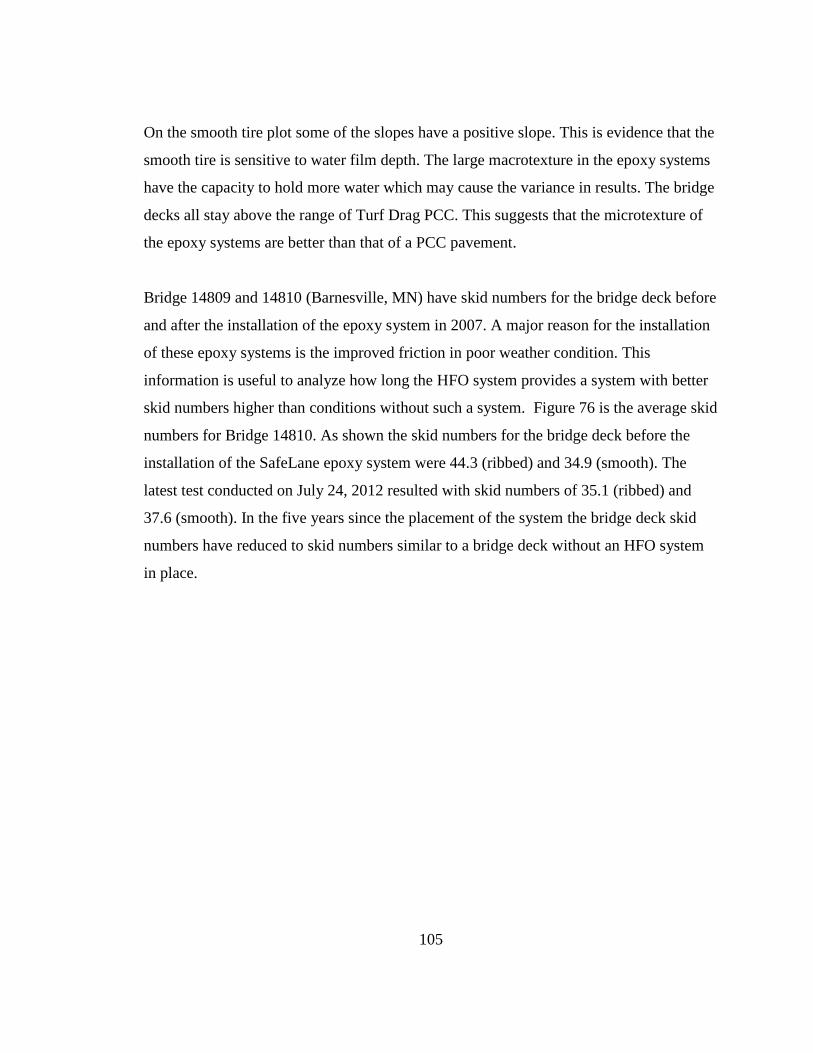
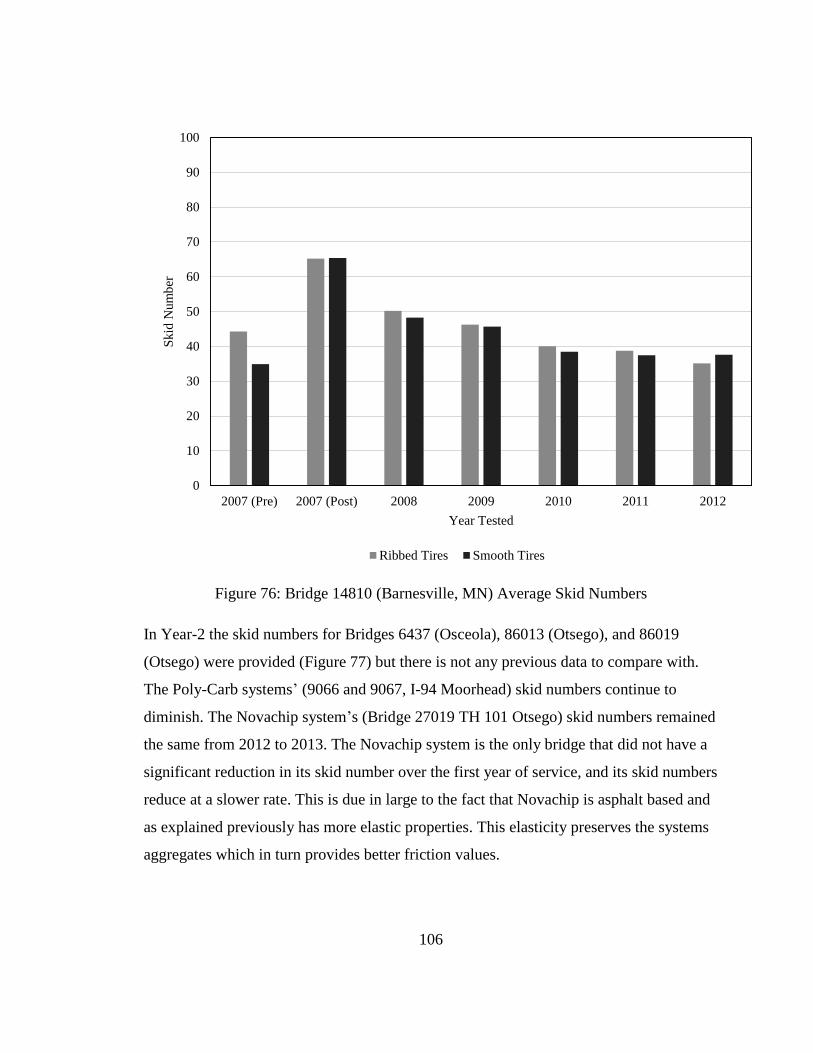
Figure 76 Bridge 14810 (Barnesville MN) Average Skid Numbers 106
Figure 77 Skid Number Comparison (2012 vs 2013) 107
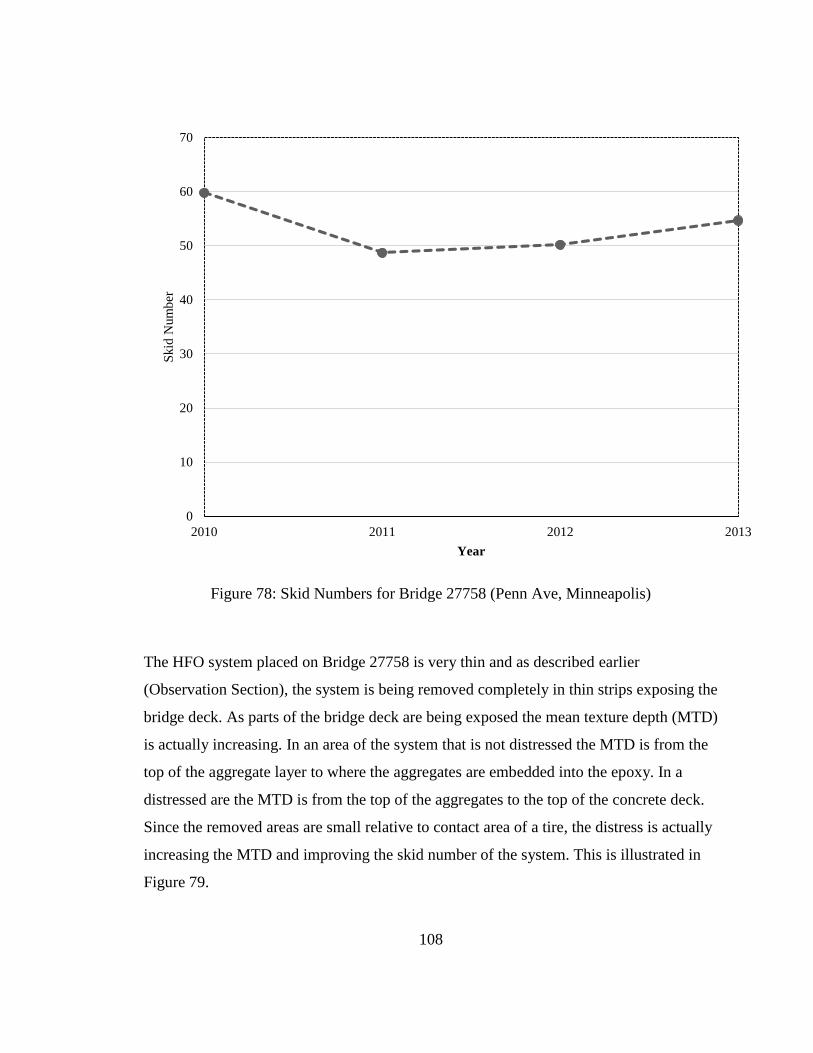
Figure 78 Skid Numbers for Bridge 27758 (Penn Ave Minneapolis) 108
Figure 79 Distresses Helping to Increase the MTD and Skid Numbers on Bridge 27758
109
Figure 80 Coefficient of Friction throughout Duration of DFT Testing 110
Figure 81 Average Coefficient of Friction at 60 kmh for Wheel and Non-Wheel Paths
Results from Dynamic Friction Tester Results 111
Figure 82 Comparison of Coefficient of Friction Found using the Skid Trailer and DFT
112
Figure 83 Coefficient of Friction versus the Number of Years in Service 114
Figure 84 Trends between the Mean Texture Depth and Coefficient of Friction for the
Different HFO Systems 115
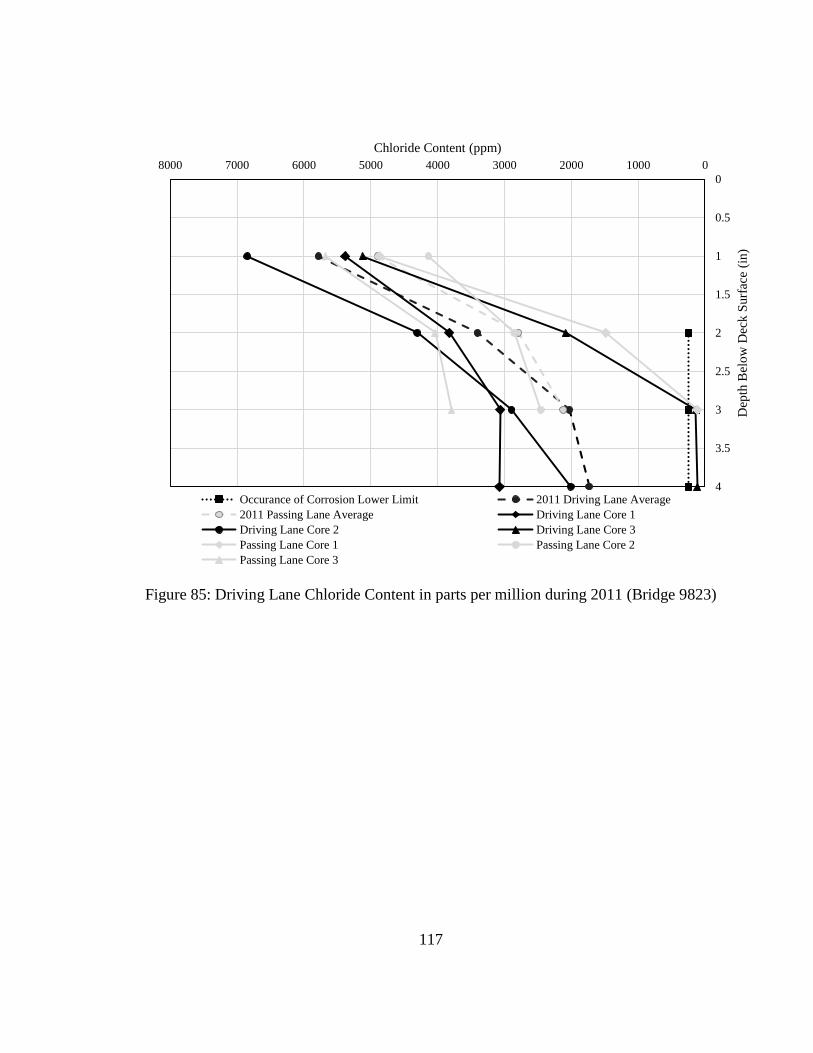
Figure 85 Driving Lane Chloride Content in parts per million during 2011 (Bridge 9823)
117
Figure 86 Driving Lane Average Chloride Content in parts per million (Bridge 9823) 118
Figure 87 Passing Lane Average Chloride Content in parts per million (Bridge 9823) 119
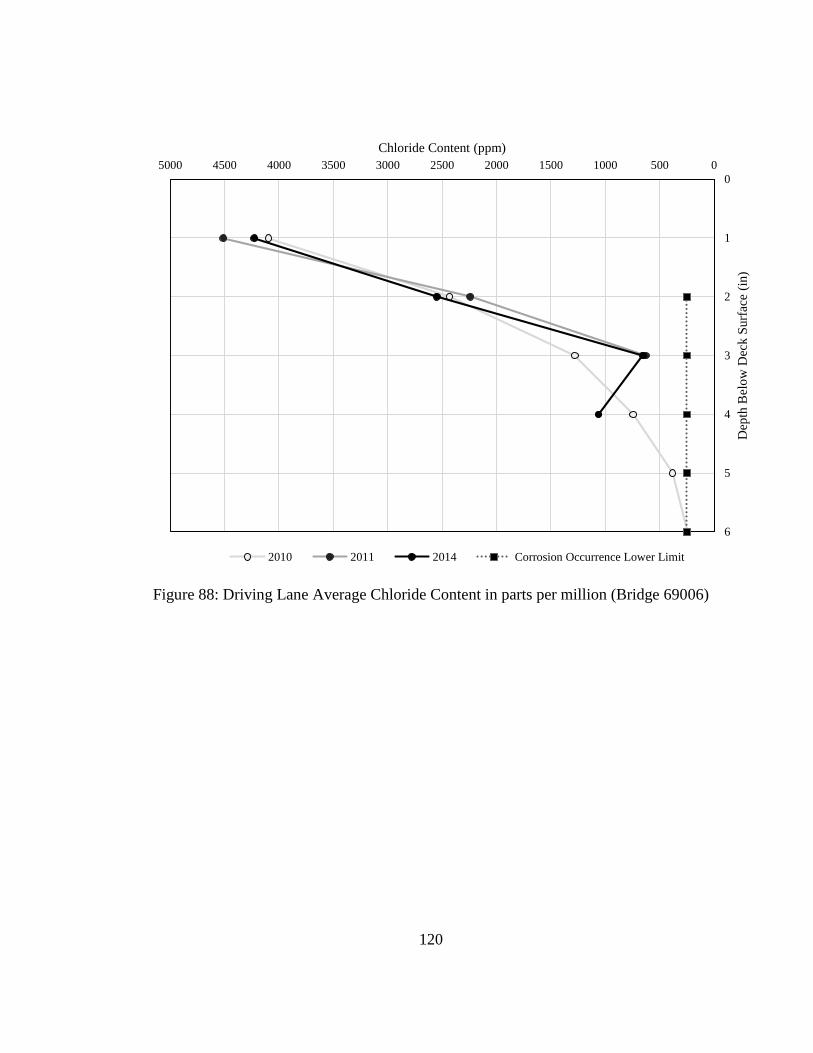
Figure 88 Driving Lane Average Chloride Content in parts per million (Bridge 69006)
120
Figure 89 Passing Lane Average Chloride Content in parts per million (Bridge 69006)
121
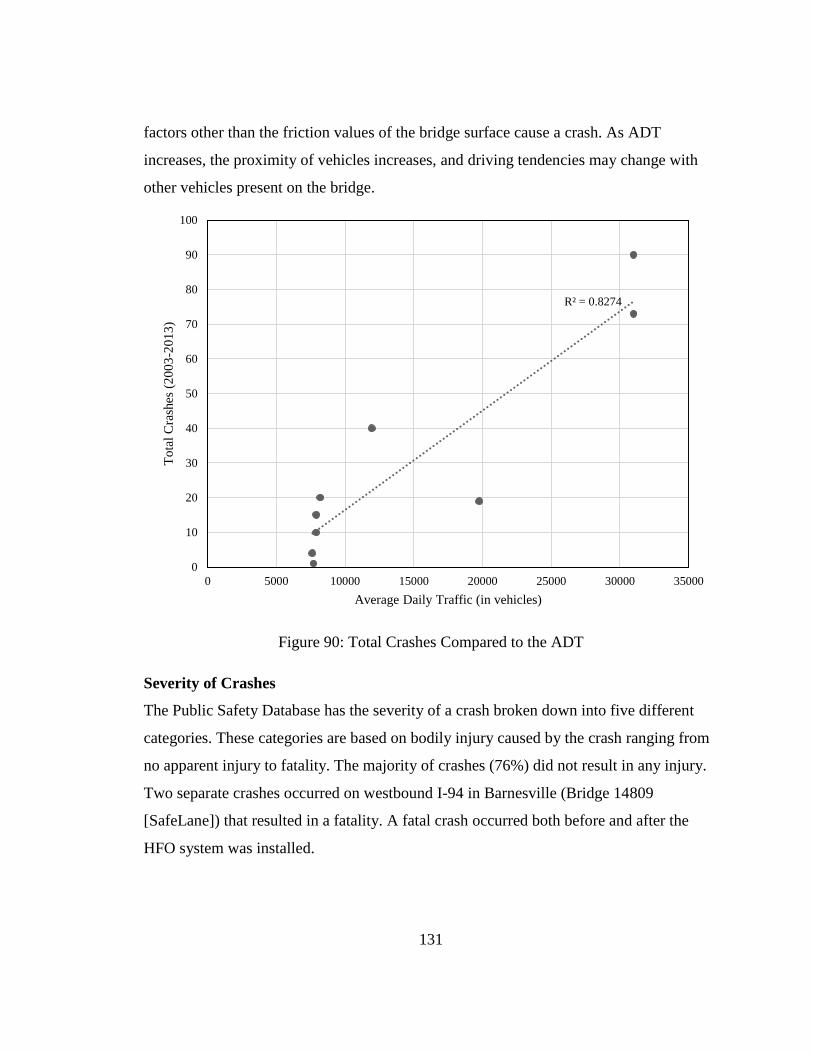
Figure 90 Total Crashes Compared to the ADT 131
Figure 91 Accumulation of Packed Ice and Snow due to Traffic Loads 133
Figure 92 Severity of crashes before and after installation of an HFO system 135
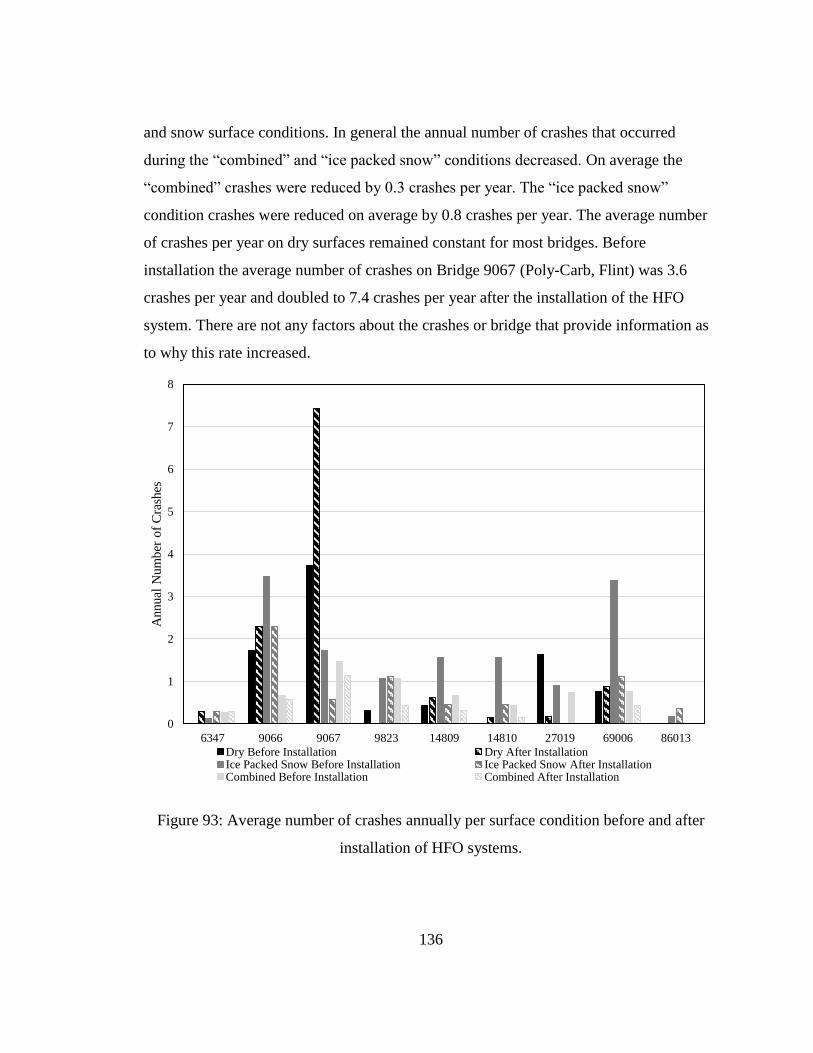
Figure 93 Average number of crashes annually per surface condition before and after
installation of HFO systems 136
xiv
Figure 94 Number of Crashes on Each Bridge during Summer (April-September) and
Winter (October-March) Months 139
Figure 95 Surface Conditions Present during Crashes in from 2012 to 2014 140
Figure 96 Comparing the average number of crashes annually per surface conditions
before and after installation of different HFO systems 142
Figure 97 Number of crashes per million vehicles crossing bridge before and after
installation of different HFO systems 143
Figure 98 Comparing the average number of crashes annually per surface condition
before and after installation of Poly-Carb systems with different aggregates 145
Figure 99 Side by side comparison of average number of crashes annually before and
after the installation of HFO systems 147
Figure 100 Average percentage of total Minnesotan crashes occurring on each bridge
before and after installation of HFO systems 148
Figure 101 Side by side comparison of the percentage of total accidents in Minnesota
across time 149
Figure 102 Skid Numbers versus the number of crashes per million vehicles 150
Figure 103 Coefficient of Friction and SN100 versus the number of crashes per million
vehicles 151
1
Chapter 1 Introduction of the Project
Introduction to High Friction Overlay Systems
Improving the safety of roadways has been an objective since the arrival of automobiles
at the turn of the 20th century and the advent of paving roadways Beginning in the 1990rsquos
the Minnesota Departments of Public Safety and Transportation began looking at ways to
reduce serious injuries and fatal crashes on Minnesota roadways In 2003 a program
called Towards Zero Deaths (TZD) was initiated It is an interdisciplinary safety program
through the Departments of Public Safety Transportation and Health With this program
the state strives for zero deaths on roadways through education engineering
enforcement and emergency medical and trauma services Over the past decade the TZD
program has been a spearhead in traffic safety (MnDOT 2014)With the harsh winter
conditions that exist in the state of Minnesota there is a great need to provide safe driving
conditions throughout the entire year Over the last ten years the Minnesota Department
of Transportation (MnDOT) has employed high friction overlays (HFO) as a possible
anti-icing and anti-skid solution
A high friction overlay is a thin overlay (less than one inch [25 cm]) which consists of
fine aggregate embedded into an epoxy or asphalt overlay creating a pavement wear
course Epoxy overlays are generally constructed in two lifts in order to ensure that the
aggregate does not settle to the bottom of the binder (Cargill 2014) Asphalt overlays are
constructed in a single lift (Midland 2014) Although more expensive compared to a
traditional overlay (asphalt or concrete) an HFO has several benefits (1) lighter dead
load (2) fast cure time (3) shallow depths eliminating the need to raise approach panels
(4) a waterproof wear surface and (5) high skid resistance (Harper 2007) Several
different HFO systems have been placed on bridge decks across the state of Minnesota in
order to observe and assess how high friction overlay systems work in cold climates and
if they provide benefits for Minnesotarsquos roadways
2
Need for this Study
With the continual strive for safer roads MnDOT has invested resources into the use of
HFO systems In 2010 a report was published by MnDOT summarizing research
conducted on SafeLane high friction overlays placed within the state This past research
studied three bridge locations for three years after the installation of SafeLane HFO
systems A more in depth summary of this study is found later in the literature review
(Chapter 2) however one of the major conclusions in the report was the recommendation
for further research of HFO systems (Evans 2010) Funding for the current research was
allocated based on this recommendation Several additional HFO systems were placed in
Minnesota between 2008 and 2011 This current research improves upon the past
research by encompassing these additional bridges and conducting research several years
after their installation These conditions allow for a study encompassing more bridges
more testing and longer time intervals since the installation of the HFO systems
Objective of this Study
The purpose of this project is to provide a comparative analysis of the different HFO
systems with two objectives The first is to investigate the HFO systems and provide a
comparative analysis of the different systems that evaluates the safety aspects they
provide The second objective is to serve as a model for future research involving HFO
systems and their benefits in the reduction of crashes
In order to ascertain the benefits of placing an HFO system on a bridge deck extensive
research of each system and the multiple variables at each location is required A
comparative analysis can be provided through the observation testing and data analysis
of different conditions and performances for each HFO system
This study will look to answer several questions regarding HFO systems including
(1) How do HFO systems perform in cold weather climates that exist in Minnesota
(2) Do HFO systems provide benefits that reduce crash rates on bridges
3
(3) Is there a correlation between surface friction values of an HFO system and their
crash rates
(4) Do the benefits that HFO systems provide to Minnesota bridge decks justify their
use in the state
Organization of Thesis
This thesis begins by providing background information of the high friction overlay
systems that are covered in this study as well as the locations across the state where the
different systems were installed An extensive literature review was performed to gain
insight on previous research conducted on HFO systems in Minnesota as well as in other
states (Chapter 2) Following the literature review research was broken into three
different tasks Chapter 3 is a compilation of laboratory tests performed on different
aggregate sources used in HFO systems Chapter 4 is a two year field investigation which
encompassed site visits to the different bridges with HFO systems Field tests and
extensive observations were conducted Chapters 3 and 4 are broken down into two main
parts First is the scope of testing and observations completed second the results of
testing and observations are presented Chapter 5 is a comparative analysis of crash data
for the bridges with HFO systems This analysis covers over a decade of crash data
provided by MnDOT The thesis culminates with a summary that ties together the results
of the three tasks in order to make appropriate conclusions and recommendations for the
entire study (Chapter 6) Following Chapter 6 are the References and Appendices These
sections provide sources data and calculations used to complete the research
4
Background Information
The following is a short overview of the four different proprietary HFO systems studied
as well as a look at the different locations in Minnesota where the HFO systems were
installed
High Friction Overlay Systems
Four types of proprietary high friction overlays are included in this study
Poly-Carb HFO systems (product of POLY-CARB Inc a subsidiary of The
Dow Chemical Company) are epoxy based overlay systems that use Mark 174
epoxy with a nominal maximum aggregate size (NMAS) of 0187 inch (476
mm) Poly-Carb HFO systems are placed in a similar method as a chip seal
SafeLane HFO systems (product of Cargill Inc) are an epoxy overlay system
with a nominal maximum aggregate size (NMAS) of 0375 inch (95 mm)
SafeLane HFO systems are placed in a similar method as a chip seal
Transpo HFO systems (product of Transpo Industries Inc) are an epoxy overlay
system using T-48 epoxy with a nominal maximum aggregate size (NMAS) of
0187 inch (476 mm) Transpo HFO systems are placed in a similar method as a
chip seal
Novachip HFO system (patented system of RoadScience LLC) are a thin-bonded
open graded asphalt overlay with a 0375 inch (95 mm) nominal maximum
aggregate size (NMAS) Novachip HFO systems are placed in a similar method as
a thin asphalt overlay Novachip systems act more like thin asphalt overlays than
like the epoxy based systems above
In this study three different types of aggregates were used in Poly-Carb systems overlays
including basalt flint and taconite A description of the aggregates is found in the
Aggregate section of Chapter 2
5
Several different variables exist between the proprietary HFO systems including (1)
epoxy or asphalt overlay system type (2) type and source of aggregate (3) type of epoxy
(4) date of construction and (5) contractor performing installation
Construction of an Epoxy High Friction Overlay System
A short summary of construction processes observed during a site visit to Bridge 5718 in
Sandstone MN is provided for better insight on how an HFO system is placed on a
bridge deck
The system placed was a Poly-Carb system with basalt aggregate Construction was
performed by PCiRoads a highway construction company based out of St Michael MN
and was observed on September 4 2013
First the bridge deck is prepared by sandblasting the surface (Figure 1) This is done to
provide a rough surface that will provide more surface area for the epoxy to adhere to
Figure 1 Sandblasting a Concrete Deck to Prepare the Surface for an HFO System
6
The deck is cleaned after the sandblasting operation and the construction joints are
prepared in order to create a level surface where adjacent lanes meet (Figure 2)
Figure 2 Construction Joints are Prepared
Epoxy is sprayed onto the roadway from a tanker truck and leveled using squeegee
brooms (Figure 3)
Figure 3 Epoxy is Placed and Leveled
7
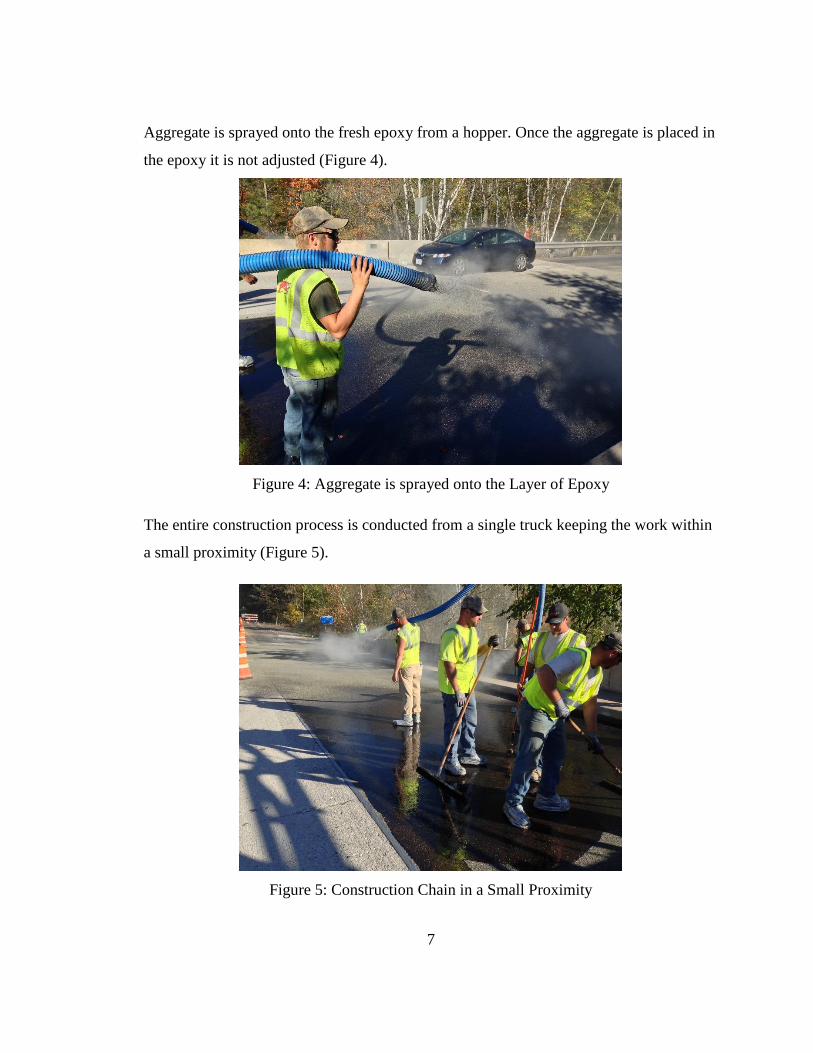
Aggregate is sprayed onto the fresh epoxy from a hopper Once the aggregate is placed in
the epoxy it is not adjusted (Figure 4)
Figure 4 Aggregate is sprayed onto the Layer of Epoxy
The entire construction process is conducted from a single truck keeping the work within
a small proximity (Figure 5)
Figure 5 Construction Chain in a Small Proximity
8
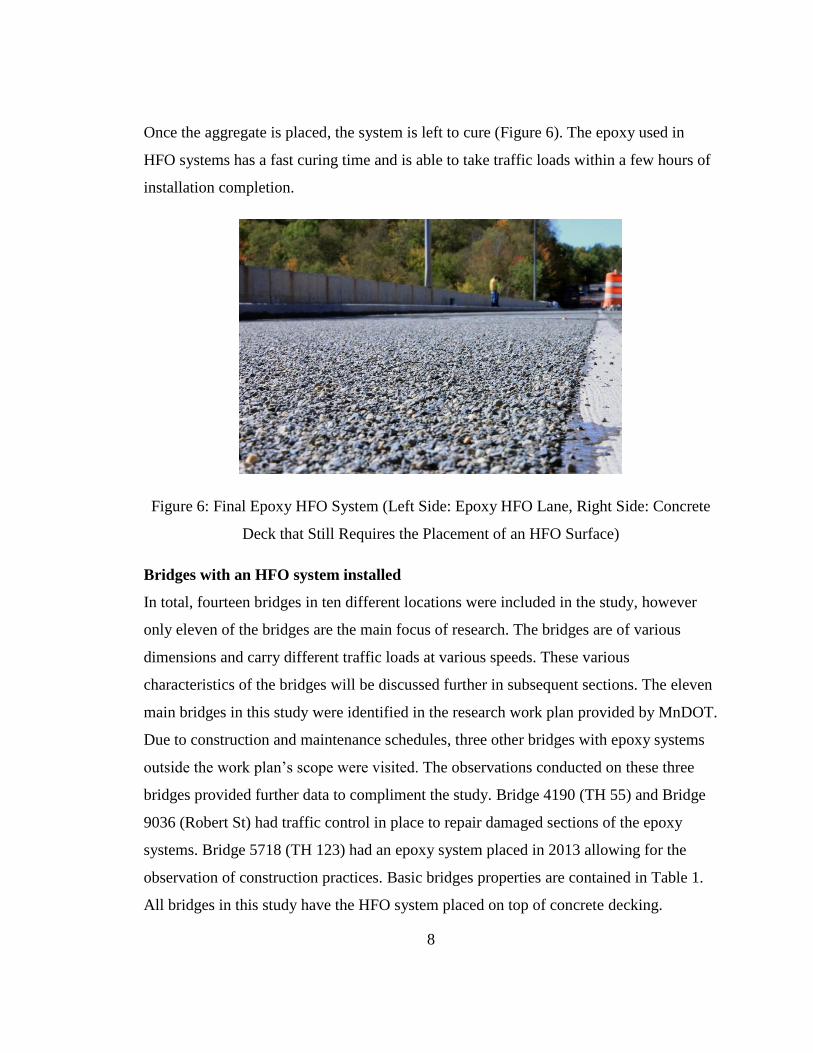
Once the aggregate is placed the system is left to cure (Figure 6) The epoxy used in
HFO systems has a fast curing time and is able to take traffic loads within a few hours of
installation completion
Figure 6 Final Epoxy HFO System (Left Side Epoxy HFO Lane Right Side Concrete
Deck that Still Requires the Placement of an HFO Surface)
Bridges with an HFO system installed
In total fourteen bridges in ten different locations were included in the study however
only eleven of the bridges are the main focus of research The bridges are of various
dimensions and carry different traffic loads at various speeds These various
characteristics of the bridges will be discussed further in subsequent sections The eleven
main bridges in this study were identified in the research work plan provided by MnDOT
Due to construction and maintenance schedules three other bridges with epoxy systems
outside the work planrsquos scope were visited The observations conducted on these three
bridges provided further data to compliment the study Bridge 4190 (TH 55) and Bridge
9036 (Robert St) had traffic control in place to repair damaged sections of the epoxy
systems Bridge 5718 (TH 123) had an epoxy system placed in 2013 allowing for the
observation of construction practices Basic bridges properties are contained in Table 1
All bridges in this study have the HFO system placed on top of concrete decking
9
Table 1 Property of Bridges with an HFO system
Bridge
Number Location
Road-
way
System
Type
Year
HFO
Installed
Year
Bridge
Built
ADT SR
6347 Osceola TH
243 Transpo 2010 1953 7600
656
(Adeq)
9066 Moorhead I-94
WB
Poly-
Carb 2010 1958 31000
916
(FO)
9067 Moorhead I-94
EB
Poly-
Carb 2010 1958 31000
936
(Adeq)
9823 Atkinson I-35
SB
Poly-
Carb 2009 1965 8200
943
(Adeq)
14809 Barnesville I-94
WB SafeLane 2007 1968 7900
925
(Adeq)
14810 Barnesville I-94
WB SafeLane 2007 1968 7900
974
(Adeq)
27019 Otsego TH
101 Novachip 2008 1993 19750
985
(Adeq)
27758 Minneapolis Penn
Ave Transpo 2008 1986 10300
922
(Adeq)
69006 Virginia US 53
NB
Poly-
Carb 2009 1969 11950
962
(Adeq)
86013 Otsego CSAH
36 Novachip 2008 2006 7700
994
(Adeq)
86019 Otsego CSAH
36 Novachip 2008 2006 5000
996
(Adeq)
10
Additional Bridges
4190 St Paul TH 55 Poly-
Carb 2011 1926 42500
848
(Adeq)
5718 Sandstone TH
123
Poly-
Carb 2013 1948 2050
623
(Adeq)
9036 St Paul Robert
St
Poly-
Carb 2011 1926 19000
740
(FO)
ADT = Average Daily Traffic
SR = Sufficiency Rating
Adeq = Adequate Structure
FO = Functionally Obsolete
Note All information in this table was taken from the List of Minnesota Bridges as
reported by the Minnesota Department of Transportation dated June 23 2009
Bridge Site Descriptions
Different variables exist between the bridge locations Some of these differences include
(1) the average daily traffic (ADT) (2) traffic speeds (3) roadway alignment (4) bridge
structure and (5) winter maintenance practices The different lengths and widths of each
bridge are listed in the Appendix and used for some later calculations The following
subsections provide a short description of each bridge Multiple lanes were considered for
bridges numbered between 9066 and 14810
Bridge 4190
Bridge 4190 is located in St Paul MN and is one of the three additional bridges in the
study The bridge is a four lane roadway with two outside shoulders and two four-foot
interior shoulders with a concrete median The bridge allows Trunk Highway (TH) 55 to
cross over the Minnesota River The eastbound lane was studied during the site visit
11
Bridge 5718
Bridge 5718 is located in Sandstone MN and is one of the three additional bridges in the
study It is a two lane bridge with one shoulder and a concrete sidewalk The bridge
allows Trunk Highway 123 to cross over the Kettle River
Bridge 6347
Bridge 6347 is located at the Minnesota border crossing the St Croix River to Osceola
WI It is a two lane bridge with two four-foot shoulders The bridge connects Minnesota
and Wisconsin via Trunk Highway 243 An HFO system exists across the entire bridge
surface The eastbound lane was studied during the site visit however due to inclement
weather minimal testing was conducted
Bridge 9036
Bridge 9036 is a four lane bridge that allows Robert Street to cross over the Mississippi
River It is one of the three additional bridges in the study The bridge is located in
downtown St Paul MN The northbound lane was studied during the site visit
Bridge 9066
Bridge 9066 is located in Moorhead MN It is a three lane bridge with two shoulders that
allows westbound Interstate 94 to cross over the Red River
Bridge 9067
Bridge 9067 is located in Moorhead MN It is a three lane bridge with two shoulders that
allows westbound Interstate 94 to cross over the Red River
Bridge 9823
Bridge 9823 is located on southbound Interstate 35 near Atkinson MN The bridge
crosses over a county road (Old Highway 61) and has two lanes and a shoulder The
bridge has a curve in its alignment as well as a negative grade
12
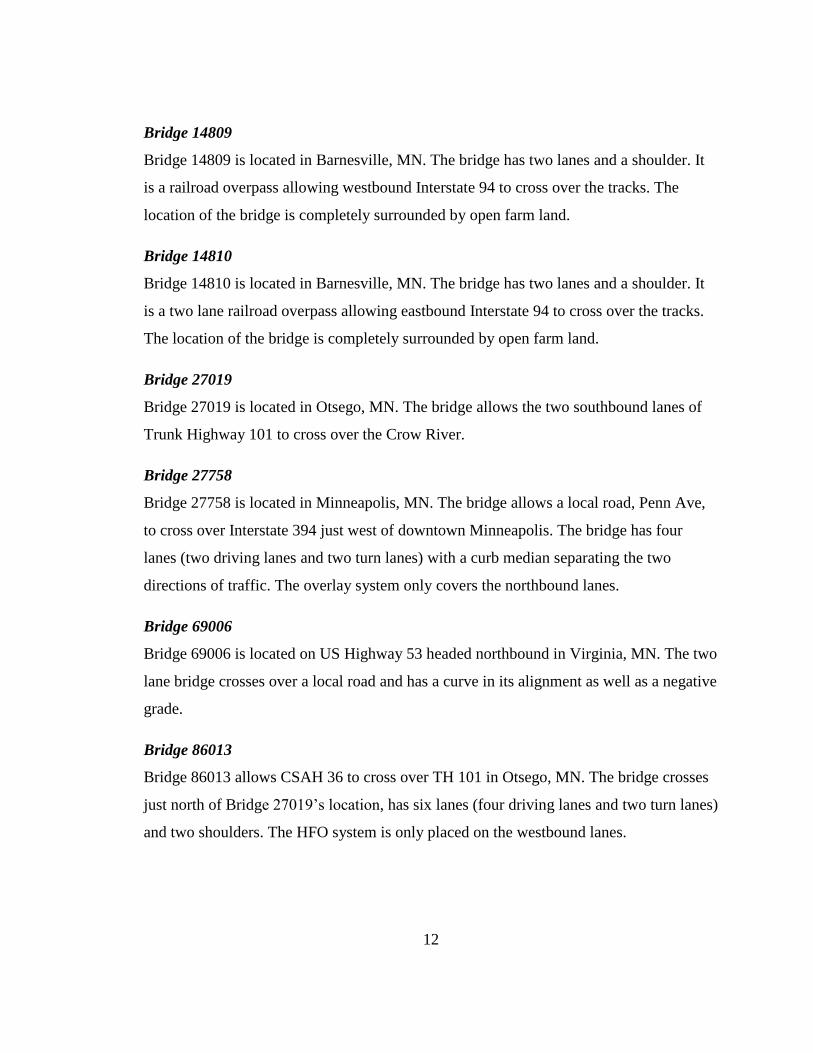
Bridge 14809
Bridge 14809 is located in Barnesville MN The bridge has two lanes and a shoulder It
is a railroad overpass allowing westbound Interstate 94 to cross over the tracks The
location of the bridge is completely surrounded by open farm land
Bridge 14810
Bridge 14810 is located in Barnesville MN The bridge has two lanes and a shoulder It
is a two lane railroad overpass allowing eastbound Interstate 94 to cross over the tracks
The location of the bridge is completely surrounded by open farm land
Bridge 27019
Bridge 27019 is located in Otsego MN The bridge allows the two southbound lanes of
Trunk Highway 101 to cross over the Crow River
Bridge 27758
Bridge 27758 is located in Minneapolis MN The bridge allows a local road Penn Ave
to cross over Interstate 394 just west of downtown Minneapolis The bridge has four
lanes (two driving lanes and two turn lanes) with a curb median separating the two
directions of traffic The overlay system only covers the northbound lanes
Bridge 69006
Bridge 69006 is located on US Highway 53 headed northbound in Virginia MN The two
lane bridge crosses over a local road and has a curve in its alignment as well as a negative
grade
Bridge 86013
Bridge 86013 allows CSAH 36 to cross over TH 101 in Otsego MN The bridge crosses
just north of Bridge 27019rsquos location has six lanes (four driving lanes and two turn lanes)
and two shoulders The HFO system is only placed on the westbound lanes
13
Bridge 86019
Bridge 86019 allows CSAH 36 to connect with TH 101 in Otsego MN The bridge
crosses over the Crow River and merges with TH 101 just south of Bridge 27019rsquos
location The bridge has one lane and two four-foot shoulders
14
Chapter 2 Literature Review
Literature from the different proprietary companies market the HFO systems to provide
three features that improve the infrastructure they are placed on (1) increased friction (2)
infrastructure protection and (3) crash reduction These three features are all provided by
HFO systems to keep drivers safer (Cargill 2014) Previous research has been conducted
in order to evaluate if HFO systems provide the benefits they claim and such evaluation
is also the main objective of this research This study however varies from previous
research in two ways the climate the research is conducted in and the scale of the project
The first difference is the climate Harsh winter climates exist in Minnesota and often
these climates last four to six months out of the year Not only do the winter elements
take a toll on infrastructure but so do the winter maintenance practices A large portion
of previous research has taken place in more mild climates that does not encounter such
extreme conditions and heavy use of snow plows The second variation from previous
research is that this research has a larger scope Previous studies have had a similar time
frame number of bridges investigated number of proprietary products investigated
number of tests conducted or scale of analytical comparison for crash data but each
previous study has only focused on a few of these variables
This study is comprehensive and provides a complete look at different HFO systems and
the variables that affect the life of the system The research was conducted in an
environment that truly tests the HFO systemrsquos winter performance
Minnesota Climate
Minnesota part of the Upper Midwest Region is located in the northern part of the
continental United States The state has a continental climate which is a climate with
large annual variations in temperature With a record minimum temperature of -60
degrees Fahrenheit [-51 Celsius] in 1996 and record maximum temperature of 114
degrees Fahrenheit [46 Celsius] in 1936 (MnDNR 2014a) roadways in Minnesota are
exposed to a variety of conditions The mean annual temperature ranges from 36 degrees
15
Fahrenheit [2 Celsius] in the northern part of the state to 49 degrees Fahrenheit [9
Celsius] in the south Average annual precipitation in the state ranges from 19 inches [48
cm] in the north to 39 inches [99 cm] in the south Seasonal snowfall averages from 70
inches [178 cm] in the northeast to 40 inches [102 cm] in the south Heavy snowfalls of
over four inches [10 cm] are common place between the months of November and April
(MnDNR 2014a)
Snowfall and cold temperatures during these months can create safety concerns on
roadways and especially bridges as surfaces become wet andor frozen It is because of
these conditions that authorities are constantly researching ways to improve the winter
time safety of roadways and the reason high friction overlays are being looked at by the
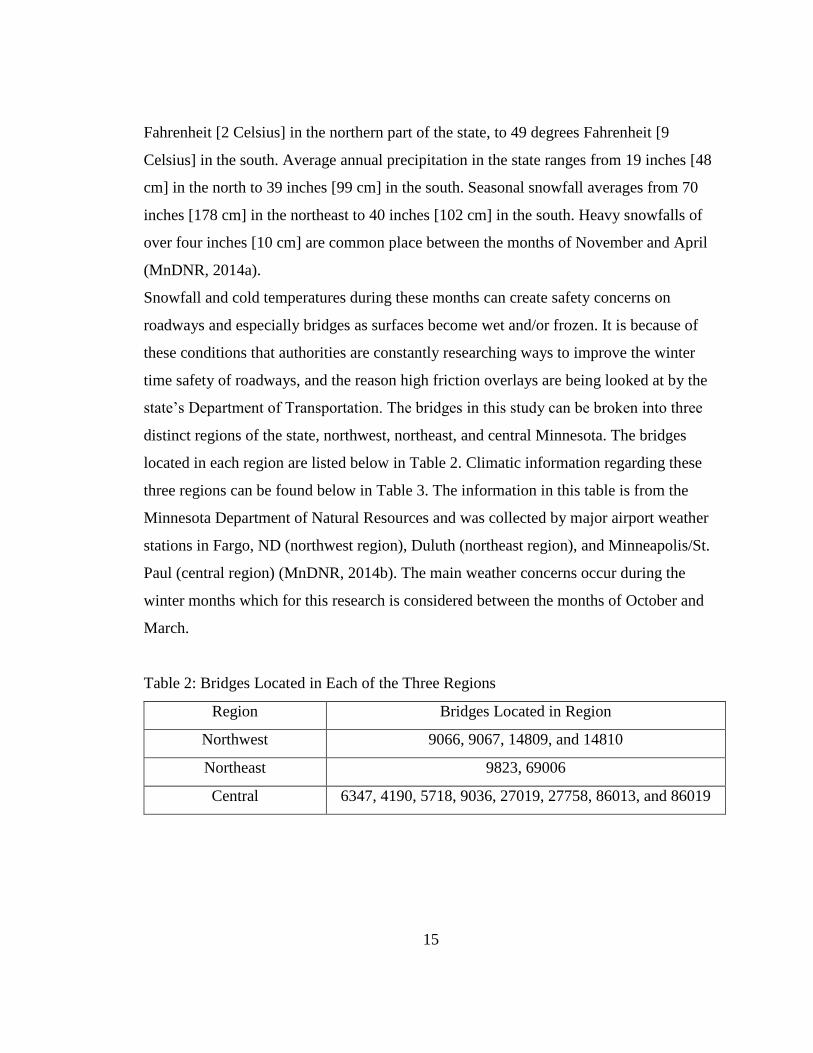
statersquos Department of Transportation The bridges in this study can be broken into three
distinct regions of the state northwest northeast and central Minnesota The bridges
located in each region are listed below in Table 2 Climatic information regarding these
three regions can be found below in Table 3 The information in this table is from the
Minnesota Department of Natural Resources and was collected by major airport weather
stations in Fargo ND (northwest region) Duluth (northeast region) and MinneapolisSt
Paul (central region) (MnDNR 2014b) The main weather concerns occur during the
winter months which for this research is considered between the months of October and
March
Table 2 Bridges Located in Each of the Three Regions
Region Bridges Located in Region
Northwest 9066 9067 14809 and 14810
Northeast 9823 69006
Central 6347 4190 5718 9036 27019 27758 86013 and 86019
16
Table 3 Average Winter Temperatures Precipitation and Snowfall for the Different
Regions of Minnesota (October-March)
Region Northwest Northeast Central
Weather Station Location Fargo Duluth Minneapolis
St Paul
Mean Daily Max (degF) [degC] 310 [-05] 303 [-09] 354 [19]
Mean Daily Min (degF) [degC] 128 [-107] 134 [-103] 191 [-72]
Normal Precipitation
(inches) [cm] 10 [25] 15 [38] 15 [38]
Normal Snowfall per Month
(inches) [cm] 74 [188] 127 [323] 87 [221]
This cold region provides an excellent location to test and observe if HFO systems
provide their design benefits during winter conditions
Aggregates
In this study three different types of aggregates were used in Poly-Carb overlays The
three different aggregates are basalt flint and taconite The basalt aggregate is a crushed
(igneous) river rock from Washington The flint aggregate was quarried in Oklahoma
and the taconite aggregate is a byproduct of mining operations in northern Minnesota A
more geological description of taconite is that ldquotaconite is an iron-bearing sedimentary
rock composed of alternating chert and slate units of varying thicknessrdquo (Zanko
Fosnacht amp Hopstock 2009) SafeLane uses a proprietary aggregate that consists of
Limestone (Cargill 2014)
Since the friction values of the HFO systems come from the macrotexture and
microtexture of the aggregate its strength and integrity are important The soundness and
durability of aggregates are especially important when used in cold climate regions
(Mamlouk 2011) Cold climate regions require aggregates to have a high resistance of
degradation due to abrasion and freeze thaw damage This resistance to degradation is
17
especially important in HFO systems as opposed to traditional concrete pavements
because the aggregates are directly exposed to loads abrasion and weather The abrasion
resistance of aggregates can be tested through several tests including the use of a Los
Angeles abrasion machine (ASTM C131 2014) and in a freeze-thaw chamber in
accordance to AASHTO T103-08
The shape of aggregate particles can help improve the resistance to abrasion and friction
values of aggregates Aggregate particles with multiple faces have sharper corners
compared to particles with smooth features HFO systems need aggregates with these
rough features to increase the overall surface friction as well as improving the bonding
with an epoxy or asphalt binder (Mamlouk 2011) Flat and elongated aggregates have a
dimension that is significantly smaller compared to the other dimensions of the particle It
is desirable to have aggregates with even dimensions because thin aggregates are more
likely to break along a plane parallel to its smallest dimension Aggregates of cubical
shape will create an even friction surface once placed into an epoxy or asphalt matrix
The shape of aggregates in HFO systems are tested through ASTM D5821-13 (percent of
fractured faces) and ASTM D4791 (flat and elongated particles)
Macrotexture and Microtexture of Aggregates
The macro- and microtexture of aggregates are an important aspect of HFO systems
These two types of texture contribute to the higher friction found in such systems
Macrotexture is the texture supplied by the shape of an aggregate Aggregates with sharp
edges and crushed faces have a higher macrotexture compared to rounded aggregates
Microtexture is the texture found on the surface of an aggregate High microtexture
indicates that an aggregate has a rough or unpolished surface An illustration of these two
types of textures relative to a roadway is shown in Figure 7
18
Figure 7 Macrotexture and Microtexture of Aggregates (Source Nelson 2011)
Both types of texture are important for the high friction in HFO systems Distresses that
reduce these textures over time are discussed later in Chapter 4
HFO Systems in Minnesota
MnDOT has previously performed a study evaluating HFO systems for crash reduction
on bridges The three year study was conducted from 2006 to 2009 and looked at three
different locations where SafeLane HFO systems were installed The locations were
Alexandria Barnesville (the SafeLane bridges in this study) and Bemidji The
researchers also observed the installation of a SafeLane HFO system in Hibbing The
research looked at several aspects of the system including (1) bonding to the deck (2)
chloride intrusion prevention (3) chloride retention on surface (4) traction
measurements and (5) accident reduction
The study came to several conclusions including that when properly placed a strong
adherent bond between the HFO system and the bridge deck is developed This bond
provides excellent protection against the intrusion of chloride and it is inferred that this
protection will help decrease the corrosion of reinforcing steel in the underlying bridge
19
deck over its service life The overlays provided an improved traction and retained
deicing chemicals on the surface to help prevent the buildup of ice The research
concluded that the HFO systems reduce accident rates both directly (improved traction)
and indirectly (deicing chemical retention)
The study also concluded that ldquosignificant rapid wearrdquo occurs primarily due to snow
plow shearing forces (abrasion) as well as from traffic loads in the wheel path One of the
bridges in the study (Hibbing MN) had a skid number (SN) of 80 when installed in 2006
By 2009 the SN of the HFO system had dropped to 35 (Evans 2010) A description of
skid numbers is later in this chapter Due to heavy abrasion the service life of an HFO
system in Minnesota is estimated at 35 to 5 years
Finally the report concluded that the study was too short and a more comprehensive study
that encompasses other proprietary HFO systems should be conducted (Evans 2010)
HFO Systems in Other Sates
Previous research of HFO systems has been conducted in other states including Missouri
(Harper 2007) Colorado (Young Durham amp Bindel 2012) Vermont (Tremblay 2013)
Washington (Anderson et al 2012) and Wisconsin (Izeppi 2010) When discussing
HFO systems with a Transpo representative during a site visit he mentioned that HFO
systems were becoming especially popular in Kansas and Missouri Previous research can
be broken down into two different tasks field observation and crash analysis
Field Observations
Previous research of HFO systems has been conducted to evaluate the performance of
such systems in the field The two main questions research has looked to answer are (1)
how do HFO systems perform in the field (2) What is the service life of an HFO
system The most extensive research is in the field performance of HFO systems Several
studies test the mean texture depth bond strength chloride penetration and skid
resistance (Young Durham amp Bindel 2012) Each of these test methods help to evaluate
different aspects of HFO systems in order to answer the previous questions about HFO
systems Below in Table 4 the different test methods used by previous research are listed
20
Each test is used to help evaluate one or more of the three benefits that HFO systems
provide It should be noted that the permeability test was added to this table because of its
use in this study A further description of how tests are conducted is provided later in
Chapter 4
Table 4 Test Methods and the High Friction Overlay Benefit Evaluated
Test Method HFO System Benefit
Mean Texture Depth Higher Friction
Bond Strength Infrastructure Protection
Permeability Test Infrastructure Protection
Chloride Ion Penetration Infrastructure Protection
Skid Resistance Higher Friction and Crash Reduction
A declination in the mean texture depth and skid resistance over time are both common
results found in previous research The skid resistance is often monitored to observe how
long systems keep skid numbers over 50 (Tremblay 2013) Skid numbers and their use in
research is expanded upon in its own section later in this literature review
Along with the performance of the aforementioned tests another important aspect to
observe during site visits include distresses that occur in HFO systems
Distresses observed in previous studies that can lead to the failure of an overlay system
include aggregate raveling delamination or polishing of the aggregate (Izeppi 2010)
Aggregate raveling and polishing reduce the friction values of HFO systems while
delamination eliminates the infrastructure protection benefit (Harper 2007) Research
conducted in Missouri looked into the cause of an HFO system delamination which is
the separation of the HFO system from the bridge deck surface The research noted that
data sheets of the Sikadur 22 Lo-Mod (Epoxy System) states that a concrete bridge deck
should be free of moisture before installation however some contractors consider ldquofree of
moisturerdquo to be no standing water on the bridge deck The research recommends the use
of ASTM D 4263 ldquoStandard Test Method for Indicating Moisture in Concrete by the
21
Plastic Sheet Methodrdquo in order to ascertain whether there is any moisture in the bridge
deck (Harper 2007)
The testing and observations are conducted in order to evaluate the performance of HFO
systems and to assess their life span (Izeppi 2010) This life span can be shortened even
before traffic is placed on an HFO system due incorrect application and distribution of
epoxy and aggregates during construction Often it is difficult to apply the correct
amounts of material and inexperienced personnel may be unable to apply HFO systems to
bridge decks uniformly (Anderson 2012) The multitude of variables that can lead to a
shorter life span in HFO systems highlights the need for comprehensive field
observations and evaluation
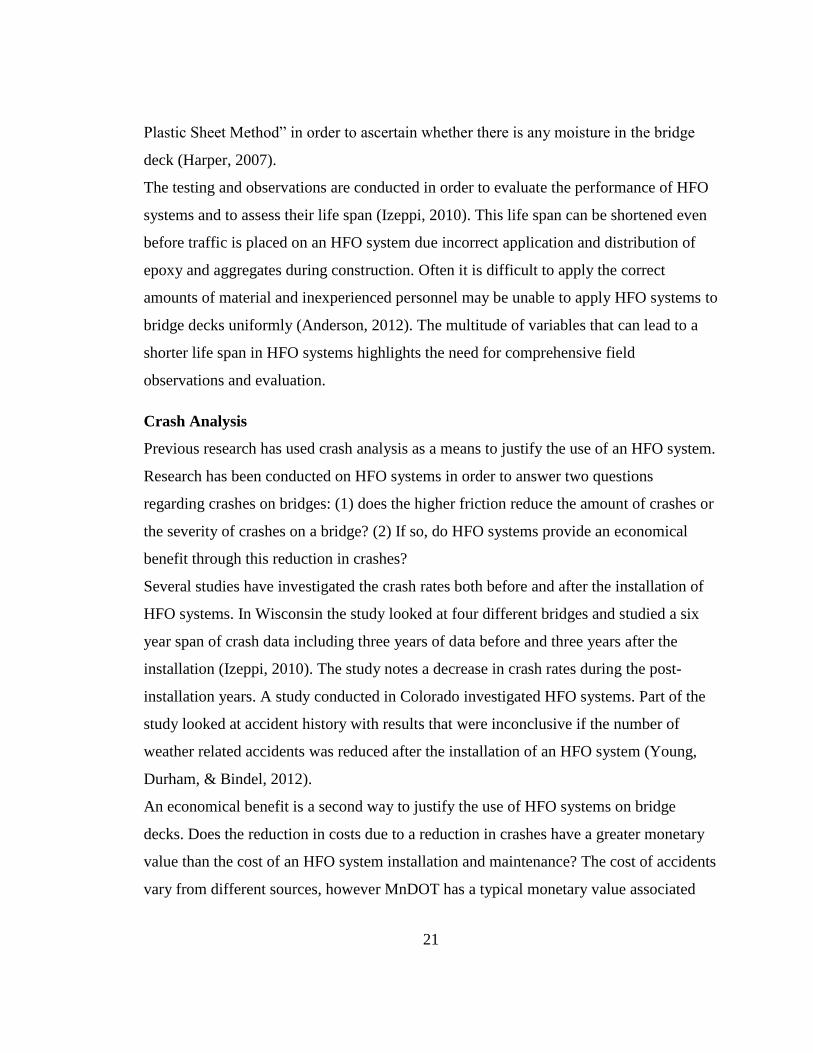
Crash Analysis
Previous research has used crash analysis as a means to justify the use of an HFO system
Research has been conducted on HFO systems in order to answer two questions
regarding crashes on bridges (1) does the higher friction reduce the amount of crashes or
the severity of crashes on a bridge (2) If so do HFO systems provide an economical
benefit through this reduction in crashes
Several studies have investigated the crash rates both before and after the installation of
HFO systems In Wisconsin the study looked at four different bridges and studied a six
year span of crash data including three years of data before and three years after the
installation (Izeppi 2010) The study notes a decrease in crash rates during the post-
installation years A study conducted in Colorado investigated HFO systems Part of the
study looked at accident history with results that were inconclusive if the number of
weather related accidents was reduced after the installation of an HFO system (Young
Durham amp Bindel 2012)
An economical benefit is a second way to justify the use of HFO systems on bridge
decks Does the reduction in costs due to a reduction in crashes have a greater monetary
value than the cost of an HFO system installation and maintenance The cost of accidents
vary from different sources however MnDOT has a typical monetary value associated
22
with each crash severity class (Izeppi 2010) These values are shown below in Table 5
Using such values a benefit-cost analysis can be conducted
Table 5 Associated Costs with Different Crash Types (MnDOT)
No Apparent Injury $4400
Possible Injury $30000
Non-Incapacitating Injury $61000
Incapacitating Injury $280000
Killed $3600000
The previously mentioned Wisconsin study performed a benefit-cost (BC) analysis on
several bridges using the monetary values in Table 5 The ratio compares the reduced
cost of crashes against the cost of installing an HFO system A value over 10 means that
the benefits outweighed the costs of installation The BC ratios in the Wisconsin study
ranged from 046 to 845 with an overall BC ratio of 186 (Izeppi 2010)
Skid Numbers
This subsection on skid number measurements provides an overview of the current
practice used to measure the surface friction properties of roadway surfaces This section
used the measured skid numbers for HFO systems in this research to compliment the
literature review of skid numbers The results are used later in the paper to make
comparisons with crash reduction efficiencies of various HFO types
Skid numbers are used to compare the friction values of different roadway surfaces and
current research uses skid numbers as indicators for roadway safety A skid number (SN)
is a calculated number that allows the comparison of frictional values for different
roadways (Watson 2011) Equipment used to determine these values and their test
procedures are further discussed in Chapter 4 An SN value is the ratio of the horizontal
force to the vertical load while an object moves over a surface multiplied by 100 Water
is sprayed onto the roadway in front of the test tire in order to simulate the ldquoworst caserdquo
23
scenario of a wet road MnDOT collects skid numbers for roadways using a
KJ Law (Dynatest) Skid Trailer Ribbed tires which have a tread design and smooth
tires were used for this testing Ribbed tires are more sensitive to the microtexture of a
surface while smooth tires are more sensitive to the macrotexture (Watson 2011) A
certain skid number however does not necessary correlate to a safe or unsafe road
condition (FHWA 2010)
Although no relationship currently exists recommended threshold values were
determined based on research sponsored by the Texas Department of Transportation
(Long 2014) Of these recommendations two important thresholds exist The first is a
range of SN where roadways are ldquopotential action segmentsrdquo These segments may
require testing or inspection to determine if treatment is required to improve the
roadwayrsquos safety The second threshold is where an increased SN values has little effect
on reducing crash rates (Long 2014) According to the Texas research for the type of
highway segments found in the following research conducted an SN value between 10
and 50 are in the ldquopotential action segmentrdquo threshold SN values over 50 have little
effect in reducing crash rates by increasing the SN Furthermore some research cited by
this Texas study has concluded that relationships between skid resistance values and
crash rates are not significant especially on freeways or higher speed roadways (Long
2014)
The SN values for nine bridges in this study are shown below in Table 6 Testing was
conducted from 2011 to 2013 (Three to Five years after the HFO installation) The SN
values shown in Table 6 show that several HFO systems are still above 50 several years
after installation while others have fallen below 50 into the ldquopotential action segmentrdquo
threshold
24
Table 6 Average Skid Numbers for HFO Systems on Bridges (Data from 2011 to 2013)
Bridge 6347 9066 9067 9823 14809 14810 27019 69006 86013
SN 583 417 440 541 365 351 545 588 564
Year of
HFO
Installation
2010 2010 2010 2009 2007 2007 2008 2009 2008
As roadways age their SN values deteriorate Abrasion from traffic and snowplows
facilitate the deterioration of SN values The heavy use of snowplows in Minnesota due
to the statersquos harsh winter climate creates higher abrasion rates compared to mild-climate
regions For a comparison the SN values of a Portland cement concrete (PCC) pavement
(traditional bridge deck overlay in Minnesota) are as follows Immediately after
construction SN values range from 55-60 (ribbed tires) or 45-50 (smooth tires) Five
years after construction the skid numbers drop to 45-50 for ribbed tires and to 25-30 for
smooth tires (Nelson 2011)
Since a minimum skid resistance value does not exist for crash reduction it is possible to
improve skid resistance of a bridge deck without actually improving the safety of the
bridge Using crash data provided by MnDOT from the public safety database this
research will analysis and evaluate the effectiveness of HFO systems in reducing crashes
on bridges
Building Off of Previous Research
Previous research in other states have conducted field tests very similar to the tests in this
study including (1) mean texture depth (2) bond strength (3) skid resistance and (4)
chloride penetration While previous research has been conducted on the performance of
HFO systems and several assessments of crashes on HFO systems exist a robust crash
analysis has not been conducted Minimal research has taken a significant look at how
effective systems are in reducing crashes This research will look at a decade of crash
data in order to ascertain the effectiveness of HFO systems in terms of crash reduction
25
In the study conducted by MnDOT (Evans 2010) the recommendation to create a more
comprehensive study was the motivation for this current research This study looks at
four different types of HFO systems instead of one The field testing will compare the
wheel to non-wheel path areas and finally an analysis of ten years of crash data will be
conducted The hope is that this study will be able to either confirm or disprove the
conclusions of the previous research as well as conclude if the use of HFO systems in
Minnesota is beneficial
26
Chapter 3 Comprehensive Aggregate Testing
The role of aggregates in these systems is critical to ensure that necessary friction is
maintained over the service life of the wear courses The main areas of concern in context
of the performance of wear courses include (1) retention of aggregate particles (2)
degradation and polishing of aggregate particles under the actions of traffic and snow
plows and (3) durability of aggregates under repeated freezing and thawing conditions A
number of laboratory tests can be conducted to get insight on the aforementioned areas of
concern with respect to aggregates
A comparison of several different aggregate sources that were implemented in variations
of these systems follows including the five aggregate types used in Poly-Carb Transpo
and SafeLane systems that were investigated Table 7 provides details of the five
aggregate samples that were chosen to undergo the testing These products were chosen
on the basis of systems actively in service as well as availability of sample material
27
Table 7 Aggregate Information
Aggregate Bridge Roadway Location Source
Basalt
4190 Hwy 55
(EB) St Paul
Washington Rock
Quarries (Pierce WA) 9036 Robert St St Paul
9823 I-35 (SB) Atkinson
Flint
6347 TH 243 Otsego
Flint Rock Products
(Picher OK) 9066 I-94 (WB) Moorhead
9067 I-94 (EB) Moorhead
Taconite
A 69006
TH 53
(NB) Virginia
United Taconite
(Eveleth MN)
Taconite
B NA NA NA
ArcelorMittal Minorca
Mines (Virginia MN)
SafeLane
14809 I-94 (WB) Barnesville
NA
14810 I-94 (EB) Barnesville
A couple additional notes about the processing of the aggregate include
Basalt consists of river rock that was crushed to specifications for an HFO system
Flint Both Poly-Carb and Transpo products use flint from Oklahoma
Taconite-A was prepped at the Ulland Brothersrsquo Kinmount location in Orr MN
SafeLane is a proprietary aggregate by Cargill and at this time Cargill will not
disclose the source location
The aggregate source used for the Novachip systems in this study is unknown
Trap Rock was used for Bridge 27758 (Penn Ave Transpo) however the
aggregate was not provided for this portion of the study
28
Pictures of all five aggregates with a reference scale are found below in Figure 8 through
Figure 12
Figure 8 Basalt Aggregate
29
Figure 9 Flint Aggregate
Figure 10 Taconite-A Aggregate
30
Figure 11 Taconite-B Aggregate
Figure 12 SafeLane Aggregate
31
Testing Procedures and Methodology
Testing was completed on aggregate samples in order to acquire material properties The
desired properties tests and their corresponding ASTM or AASHTO specification
designations are in Table 8 Testing was conducted at the University of Minnesota Duluth
civil engineering laboratory
Table 8 Properties and Preliminary Test Method
Property Test Method
Density Specific
Gravity and
Absorption
ASTM C127-12 ndash Standard Test Method for Density Relative
Density (Specific Gravity) and Absorption of Coarse Aggregate
ASTM C128-12 ndash Standard Test Method for Density Relative
Density (Specific Gravity) and Absorption of Fine Aggregate
Resistance to
Degradation
ASTM C 131-14 ndash Standard Test Method for Resistance to
Degradation of Small-Size Coarse Aggregate by Abrasion and
Impact in the Los Angeles Machine
Uncompacted Void
Content
ASTM C 1252-06 ndash Standard Test Methods for Uncompacted
Void Content of Fine Aggregate (as Influenced by Particle
Shape Surface Texture and Grading
FlatElongated
Particles
ASTM D4791-10 ndash Standard Test Methods for Flat Particles
Elongated Particles or Flat and Elongated Particles in Coarse
Aggregate
Percent of
Fractured Particles
ASTM D5821-13 ndash Standard Test Method for Determining the
Percentage of Fractured Particles in Coarse Aggregate
Soundness of
Aggregates
AASHTO T 103-08 ndash Standard Method of Test for Soundness of
Aggregates by Freezing and Thawing
Sieve Analysis ASTM C136-06 ndash Standard Test Method for Sieve Analysis of
Fine and Coarse Aggregates
32
Description of Standard Tests
The following sections provide a brief overview for each of the tests completed during
this task
Density Specific Gravity amp Absorption (Coarse Aggregate)
The ASTM C127-04 and ASTM C128-07 find the saturated-surface dry and dried mass
values of an aggregate in order to calculate density specific gravity and absorption of
coarse aggregate using gravimetric relationships High specific gravity usually correlates
with high toughness and strength High absorption is an indicator of potentially low
durability which can lead to a shorter life span on an aggregate in an HFO system
Resistance to Degradation
ASTM C131-06 uses a Los Angeles abrasion machine to measure the degradation of
mineral aggregates due to abrasion impact and grinding in a rotating steel drum The
Los Angeles Machine is pictured in Figure 13 This provides an indication of aggregate
toughness and potential for breakdown under abrasive actions such as traffic and snow
plows
Testing in this study had one deviation from the ASTM standards The standard requires
the aggregate retained on the 12 sieve to be washed after rotating in the steel drum For
this testing aggregate retained on or above the 10 sieve was used because a 12 sieve
was unavailable at the time of testing
33
Figure 13 Los Angeles Machine
Uncompacted Void Content
The uncompacted void content can be measured using a funnel and calibrated cylinder
(Figure 14) The uncompacted void content is the difference between the volume of the
standard cylinder and the absolute volume of the fine aggregate collected in the cylinder
Uncompacted voids provide an indication of the angularity of aggregates and hence
provide an approximation of the friction that will be offered through macrotexture The
higher the uncompacted void content the larger the spacing is between aggregates which
allows for a well-drained system
34
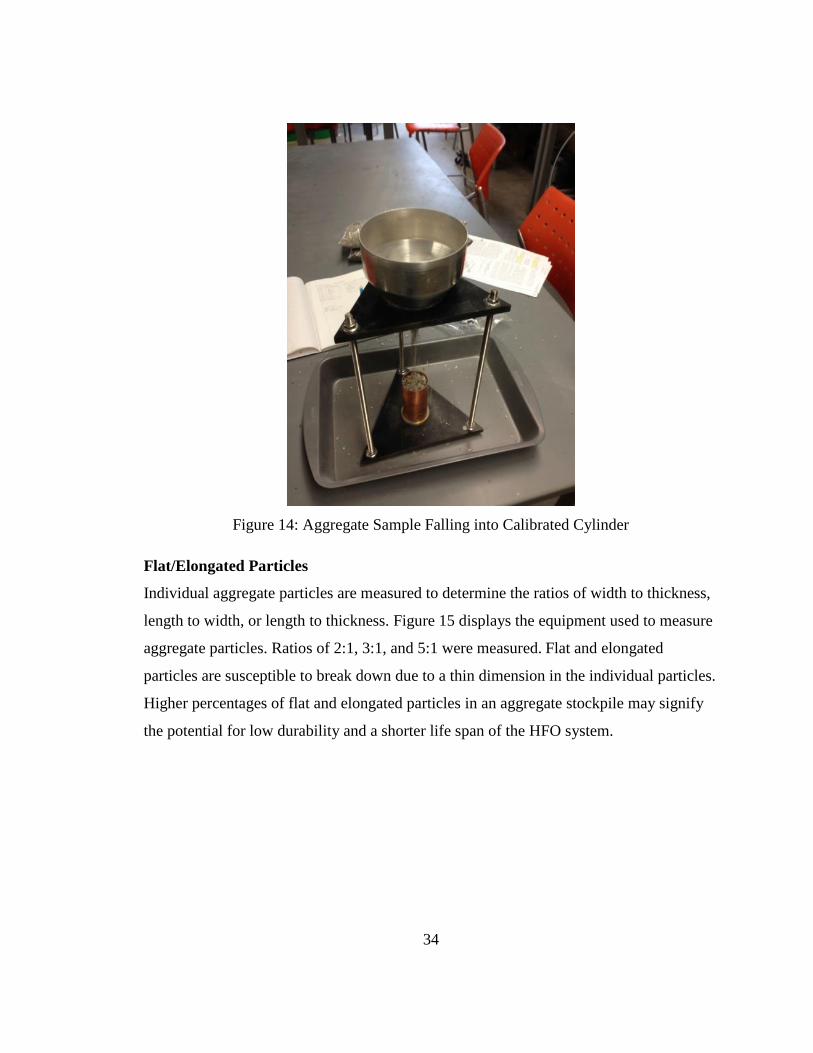
Figure 14 Aggregate Sample Falling into Calibrated Cylinder
FlatElongated Particles
Individual aggregate particles are measured to determine the ratios of width to thickness
length to width or length to thickness Figure 15 displays the equipment used to measure
aggregate particles Ratios of 21 31 and 51 were measured Flat and elongated
particles are susceptible to break down due to a thin dimension in the individual particles
Higher percentages of flat and elongated particles in an aggregate stockpile may signify
the potential for low durability and a shorter life span of the HFO system
35
Figure 15 FlatElongation Measuring Equipment with Sorted Aggregate
Percent of Fractured Particles
ASTM D5821-01 has individual particles of aggregate surveyed to find the percentage of
fractured particles in an aggregate Fractured particles are important to provide high
friction surfaces as well as provide surface area for epoxy to properly bond
Soundness of Aggregates
The resistance to disintegration of aggregates by freezing and thawing is found by the
AASHTO T 103-08 specification This testing subjects a sample of aggregate particles to
freeze thaw cycles in a controlled chamber Weather in MN is conducive to repeated
freezing and thawing thus it is important to know if an aggregate has sufficient durability
for such conditions More resistant aggregates are desirable for longer lasting systems
and maintaining a high friction surface
Sieve Analysis
A sieve analysis was run on all five aggregate samples to determine the relative
proportions of different grain sizes A sieve analysis is done to evaluate an aggregatersquos
gradation to ensure (1) a limited amount of fines to allow proper bonding between epoxy
layers and the aggregate particles (2) an open graded nature to provide good
36
macrotexture drainage and friction and (3) to compare to MnDOT chip seal
requirements since epoxy systems are constructed in a similar fashion
Results
Results found from the aforementioned standard test methods are provided below with
additional equations data and calculations in the Appendix
Density Specific Gravity amp Absorption
Density (Table 9) Specific Gravity (Table 10) and Absorption (Table 11) were found
using gravimetric measurements in accordance to ASTM standards
Table 9 Density
Aggregate Oven Dry
Density (kgm3)
SSD Density
(kgm3)
Apparent
Density (kgm3)
Basalt 2455 2561 2746
Flint 2223 2407 2725
Taconite A 2695 2841 3159
Taconite B 2642 2776 3051
SafeLane 2482 2618 2873
37
Table 10 Specific Gravity
Aggregate
Oven Dry
Relative Density
(Specific
Gravity)
SSD Relative
Density
(Specific
Gravity)
Apparent
Relative Density
Basalt 246 257 275
Flint 223 241 273
Taconite A 270 285 317
Taconite B 265 278 306
SafeLane 249 262 288
Table 11 Absorption
Aggregate Absorption ()
Basalt 136
Flint 134
Taconite A 118
Taconite B 106
SafeLane 145
Taconite-A and Taconite-B respectively are the two densest aggregate samples tested
SafeLane and Basalt are of similar density Flint was the lightest of the five aggregates
SafeLane had the highest abortion percentage compared to the other samples the two
Taconite samples had the lowest absorption percentage
38
Resistance to Degradation
Resistance to degradation is determined by measuring the percent of mass lost due to
abrasion and impact Table 12 provides the results for the five different samples
Table 12 Loss by Abrasion in LA Abrasion Machine
Aggregate Loss by Abrasion and
Impact
Basalt 31
Flint 30
Taconite A 32
Taconite B 40
SafeLane 46
All of the samples displayed similar results and performed well in the abrasion test In
comparison according to the Pavement Interactive website a typical loss for hard
igneous rocks is around 10 (Pavia Systems Inc 2012) Both Taconite samples and
SafeLane had higher relative loss due to abrasion These were also the aggregates with
the highest specific gravity There may be a correlation with the higher mass particles
which create a higher impact with one another when tumbling in the LA abrasion drum
Uncompacted Void Content
The uncompacted voids for the five aggregate samples is provided in Table 13 The
calculation process can be found in the Appendix
Table 13 Uncompacted Void Content Data
Aggregate Basalt Flint Taconite A Taconite B SafeLane
Uncompacted
Voids () 3860 3640 3940 3740 4230
39
The sample with the largest uncompacted void content was SafeLane The Poly-Carb
aggregate samples all had similar uncompacted void percentages The four Poly-Carb
samples had a 3 variation while the SafeLane aggregate was 3 higher than the Poly
Carb sample with the largest uncompacted void content Since SafeLane aggregates are
larger in size compared to the Poly-Carb aggregates logically more space will exist in
between particles
FlatElongated Particles
This test was performed on particles that were retained on the 4 sieve Particles were
characterized by being flat elongated flat and elongated or no characteristics The
ratios tested were 21 31 and 51 The percentages of different shaped particles for each
sample are plotted in Figure 17 through Figure 19 A flat particle is a particle that has a
width to thickness ratio larger than the specified ratio An elongated particle is a particle
that has a length to thickness ratio larger than the specified ratio Flat and elongated
particles have both ratios larger than the specified ration A visual of the particle
dimensions is shown below in Figure 16
Figure 16 Particle Dimensions per ASTM D4791-10 (Source ASTM D4791-10 2010)
For the 21 ratio a particle that is twice as wide as it is thick is considered flat A particle
that is twice as long as it is thick is elongated A particle matching both requirements is a
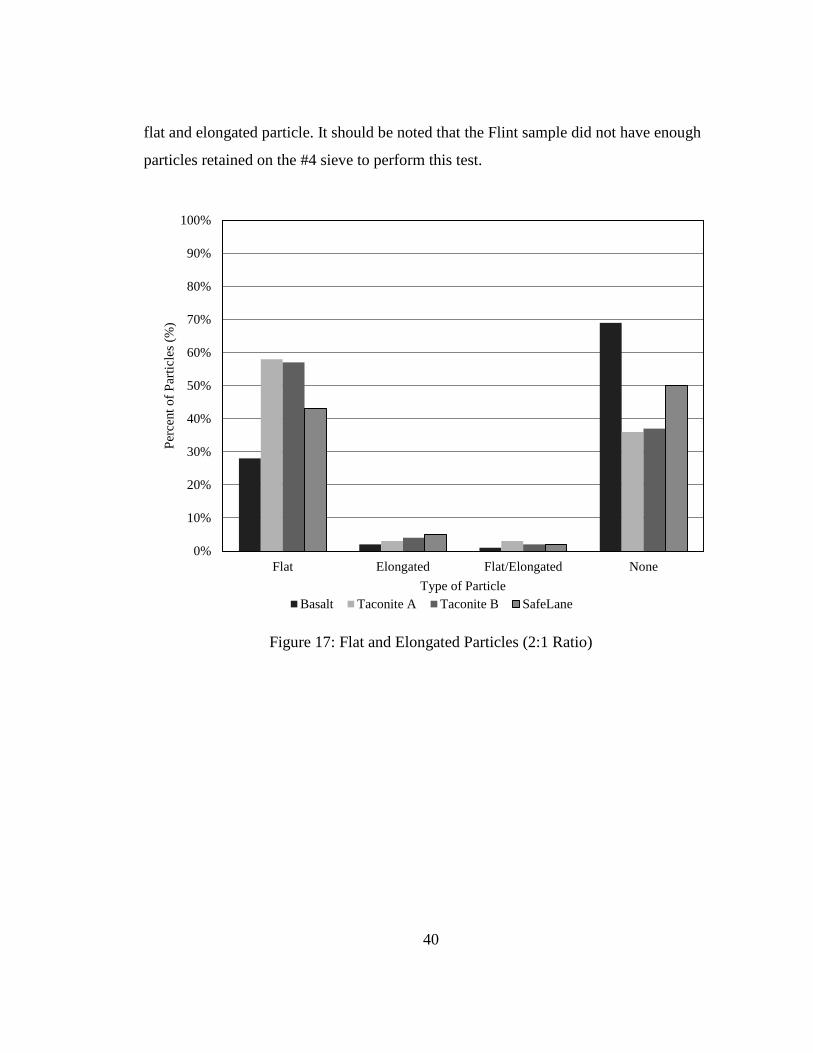
40
flat and elongated particle It should be noted that the Flint sample did not have enough
particles retained on the 4 sieve to perform this test
Figure 17 Flat and Elongated Particles (21 Ratio)
0
10
20
30
40
50
60
70
80
90
100
Flat Elongated FlatElongated None
Per
cent
of
Par
ticl
es (
)
Type of Particle
Basalt Taconite A Taconite B SafeLane
41
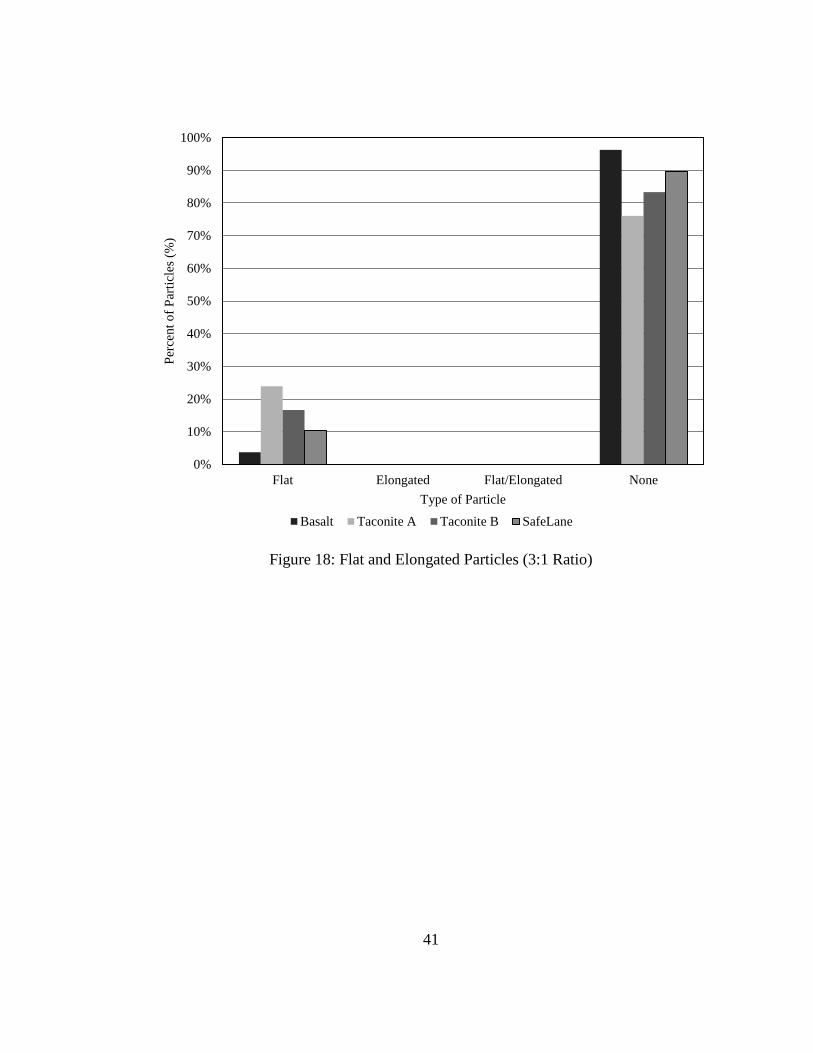
Figure 18 Flat and Elongated Particles (31 Ratio)
0
10
20
30
40
50
60
70
80
90
100
Flat Elongated FlatElongated None
Per
cent
of
Par
ticl
es (
)
Type of Particle
Basalt Taconite A Taconite B SafeLane
42
Figure 19 Flat and Elongated Particles (51 Ratio)
All four of the samples tested have a significant portion of flat particles in the 21 ratio
However this falls off quickly as the ratio is increased Taconite ldquoArdquo contains the most
flat particles across all three ratios with Taconite ldquoBrdquo following closely behind Basalt
has the lowest percentage of flat and elongated particles which may contribute to its low
mass loss due to abrasion It should be noted that although the Flint aggregate had
particle sizes too small to run this test on Based on visual inspection the aggregate
sample contains more flat and elongated particles compared to the other samples
Percent of Fractured Particles
After examination of the five crushed aggregate sources it was determined that 100 of
the particles in all five sources have at least 2 fractured faces This is a reasonable
0
10
20
30
40
50
60
70
80
90
100
Flat Elongated FlatElongated None
Per
cent
of
Par
ticl
es (
)
Type of Particle
Basalt Taconite A Taconite B SafeLane
43
characteristic because most of the aggregate samples are mechanically crushed in order to
obtain the desired aggregate sizes
Soundness of Aggregates
The sieve sizes used during this testing were based off of the Sieve Analysis Sieve sizes
with minor amounts of particles retained after freeze-thaw conditioning were excluded
from testing This is shown in Figure 20 with the text ldquoNo Datardquo For each aggregate
sample the different sieve sizes were combined to create a total mass The total mass lost
after being subjected to freeze-thaw conditions was normalized with the total sample size
for each aggregate allowing for a comparison between the different aggregates (Figure
21)
Figure 20 Percent Lost Due to Freeze Thaw
00
05
10
15
20
25
30
35
Sieve 4 Sieve 8 Sieve 16
Per
cent
Lo
st (
)
Sieve Size
Basalt Flint Taconite A Taconite B SafeLane
No
Dat
a
No
Dat
a
No
Dat
a
No
Dat
a
No
Dat
a
No
Dat
a
44
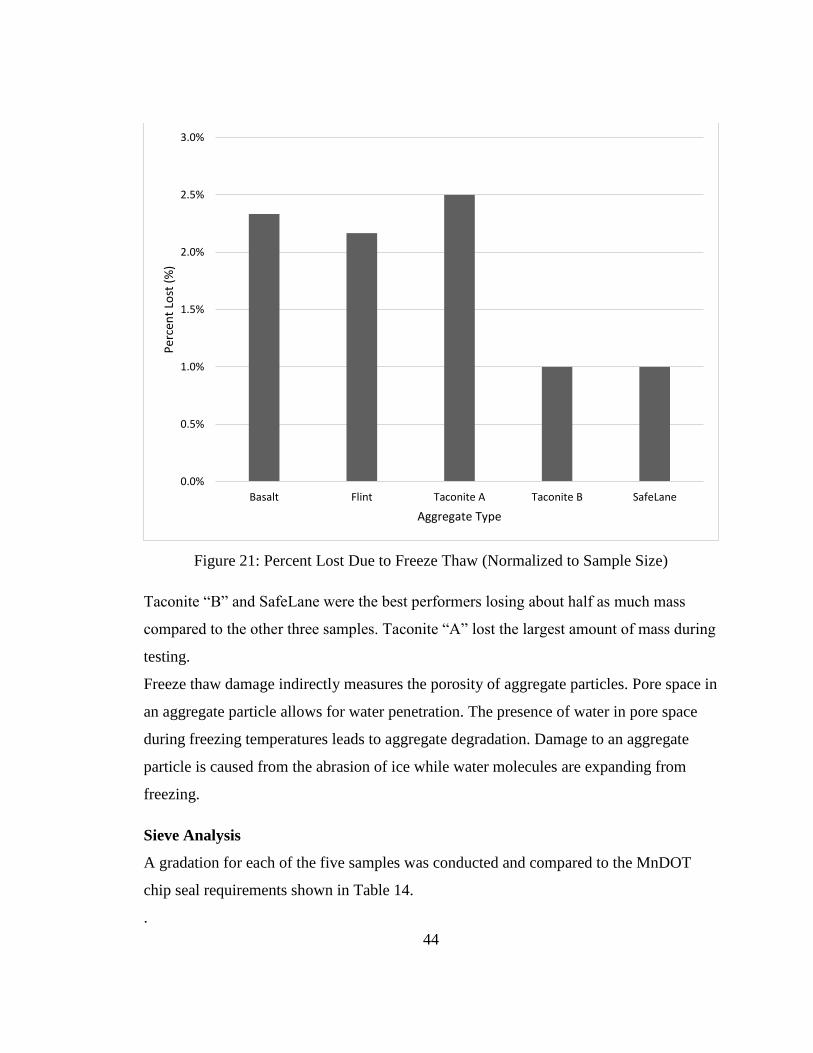
Figure 21 Percent Lost Due to Freeze Thaw (Normalized to Sample Size)
Taconite ldquoBrdquo and SafeLane were the best performers losing about half as much mass
compared to the other three samples Taconite ldquoArdquo lost the largest amount of mass during
testing
Freeze thaw damage indirectly measures the porosity of aggregate particles Pore space in
an aggregate particle allows for water penetration The presence of water in pore space
during freezing temperatures leads to aggregate degradation Damage to an aggregate
particle is caused from the abrasion of ice while water molecules are expanding from
freezing
Sieve Analysis
A gradation for each of the five samples was conducted and compared to the MnDOT
chip seal requirements shown in Table 14
00
05
10
15
20
25
30
Basalt Flint Taconite A Taconite B SafeLane
Per
cen
t Lo
st (
)
Aggregate Type
45
Table 14 MnDOT Chip Seal Gradation Requirements
In Figure 22 it is shown that the Poly-Carb systems all have similar gradations The main
difference in the systems the amount retained on the 8 and 16 sieves SafeLanersquos
gradation is significantly different than the Poly-Carb systemrsquos gradation It is also the
only aggregate sample to follow the MnDOT chip seal requirements
Figure 22 Sieve Analysis Compared to MnDOT Chip Seal Requirements
0
10
20
30
40
50
60
70
80
90
100
0375 4 8 16 50 100 200 Pan
Per
cen
t P
ass
ing
(
)
Sieve SizeBasalt FlintSafeLane Taconite ATaconite B MnDOT Upper LimitMnDOT Lower Limit
Sieve Size Passing by Weight
No 4 100
No 8 30 ndash 75
No 16 0 ndash 5
No 30 0 ndash 1
46
The most important aspect of the sieve analysis is that all aggregate samples have a
majority of their particles falling bewteen the 95 mm and 16 sieve This is created to
allow for an open gradation that provides a high macrotexture when placed in the HFO
binder
Aggregate Laboratory Testing Summary
A number of laboratory tests were conducted to gain perspective on aggregate samples
used in conjunction with epoxy and asphalt binders for high friction overlay systems on
bridge decks The main concerns regarding aggregates assessed through this testing are
the strength to endure abrasion and to provide both a solid macro- and microtexture
during the service life of HFO systems
All five aggregate samples performed satisfactorily through the battery of tests conducted
in this task While all five aggregates showed good physical and mechanical properties on
a relative basis the best abrasion performance was observed in basalt flint and taconite
ldquoArdquo The aggregates with the best freeze thaw performance were taconite ldquoBrdquo and
SafeLane Overall all aggregate is expected to perform well in HFO systems
47
Chapter 4 Field Observations and Testing
This task includes field observations and testing conducted on the different HFO systems
Systems looked at in this research were designed to provide a strong waterproof and
skid resistant traffic surfaces The main areas of concern in context of the performance of
wear courses include (1) retention of aggregate particles (2) degradation and polishing
of aggregate particles due to the actions of traffic loading and snow plow abrasion and
(3) durability of aggregate under repeated freezing and thawing conditions Field tests
were conducted to ascertain the effects of the aforementioned areas of concern The scope
of testing is contained in the following section Test procedures observations field test
results and comparisons are in subsequent sections and finally a summary is presented
This task is similar to several other studies that have been conducted regarding the use
and performance of high friction overlay systems (Anderson et al 2012)
Scope of Observations and Field Testing
The scope of this project is to provide a comparative analysis of different systems
conditions and performances This comparison is based on two years of field testing and
observations conducted at bridge sites where HFO systems have been exposed to the
climatic conditions and roadway maintenance operations prevalent in Minnesota and
similar cold climate regions Data from Year-1 and Year-2 will be presented The results
will not only compare the different systems and bridges against one another it will also
compare the systems against the proclaimed benefits of an HFO system The dates for the
site visits are listed below in Table 15
48
Table 15 Site Visit Dates
Bridge
Number
Date Visited
Year-1 Year-2
6347 NA 10314
9066 91613 6214
9067 91613 6214
9823 82913 8614
14809 NA 6414
14810 91713 6414
27019 91312 82014
27758 NA 10214
69006 82813 61814
86013 91312 82014
86019 91312 82014
4190 9413 NA
5718 10113 52814
9036 9413 NA
Observations
The observation of an HFO system in service is equally as important as the standard tests
completed The observations compliment test results and also help to explain why
specific test results or trends have occurred The following section provides a discussion
of such observations including distresses that have occurred and differences between
HFO systems
Distresses
Distresses in the HFO systems are one of the most common parameters observed during
site visits The inspection of different distresses is important since distresses may cause
49
issues that reduce the life of HFO The following subsections describe each type of
distress observed with examples from different bridges
Construction Joints and Uneven Aggregate Distribution
Uneven distribution of aggregates was apparent in several of the systems visited This is
caused by the manual process of adding aggregate to the epoxy matrix It is difficult to
evenly spread aggregate with shovels Applying too much aggregate in an area leads to
insufficient epoxy coating on the aggregates and without proper bonding these
aggregates are more prone to popping out of the matrix An insufficient amount of
aggregates in the matrix creates areas prone to polishing The construction joint in Figure
23 is the line running down the center of the figure that looks similar to a crack This
joint was caused by either a pause in construction or the application of too much
aggregate in one spot Construction joints are mostly a cosmetic distress unless an
insufficient amount of aggregates are placed which can affect the skid properties
Figure 23 Construction Joint (Bridge 9066)
This uneven application can lead to higher amounts of distresses during the life span of
an HFO system Bridge 14809 provided a good example of how the quality of
construction during installation can play a role in the performance of epoxy overlay
systems Such a difference is depicted below in Figure 24 The view of the picture is
50
looking against the direction of traffic A construction joint exists in the middle of the
picture The system on the left side of the picture is a bit lighter in color On the right side
there appears to be a higher rate of raveling This is shown best when looking at the
bottom right side of the picture
Figure 24 Differences on Both Sides of the Construction Joint (Bridge 14809)
Excessive Placement of Epoxy
Another type of distress caused by construction is polished areas due to the excessive
placement of epoxy This distress occurred on Bridge 6347 where a significant amount of
polished areas existed Looking along the wheel path in Figure 25 the darker areas are
where polished areas exist The magnified section of this figure provides an example of
the difference in texture between a polished (left side) and normal (right side) area As
vehicle traffic and snow plows cause abrasion to the roadway the aggregates are broken
along the plane of the epoxy leaving the polished area
51
Figure 25 Polished Areas along Bridge 6347
This abrasion along the epoxy plane is exemplified in Figure 26 where the right half of
the picture includes an area where the epoxy level is near the top of the aggregate layer
Any aggregate exposed in this heavy epoxy area is now flush with the top of the epoxy
due to abrasion
Figure 26 Proper Epoxy Levels (Left Side) Next to Area with Excessive Epoxy (Right
Side)
52
Snowplow abrasion
A common distress in snowy regions such as Minnesota is damage caused from the
service of snowplows Driving a snowplow blade across a roadway can cause severe
abrasion and involves a series of impact events Damage most often occurs at the crown
of a roadway or in between rutted wheel paths This snowplow abrasion is shown in
Figure 27 The damage is most prevalent along the centerline as well the right wheel path
in the driving lane On this bridge the abrasion removes some of the aggregate which
gives the roadway the appearance of a lighter color Snow plow abrasion is detrimental to
HFO systems because even with the use of aggregates that are proficient against
deterioration due to abrasion the bond between epoxy and aggregates are not strong
enough to resist the shear force a plow blade imposes Also if aggregate is being removed
from the surface the potential safety benefit quickly diminishes
Figure 27 Transverse Snowplow Abrasion (Br 4190)
The macrotexture of Bridge 27758 still exists along parts of the bridge but heavy
abrasion has taken its toll on the overlay system As shown below (Figure 28) areas of
the bridge have minimal aggregate pop-out but finer material has been removed between
53
the ldquolargerrdquo aggregate exposing the bridge deck Some locations have the opposite
distress where severe aggregate pop-out exists and leaving polished areas as well as areas
with minimal aggregate particles (Figure 29) Other areas of this bridge have parts of the
overlay system that are completely missing
Figure 28 Existing Macrotexture on Bridge 27758
Figure 29 Polished Area on Bridge 27758 along with Transverse Cracks
54
One distress on Bridge 27758 that has not occurred with any other system is the complete
removal of epoxy and aggregates from the bridge deck surface due to abrasion The
removal from snow plow abrasion has occurred near joints or at the edges of other
systems but not in the middle of the system as seen on Bridge 27758 Depicted below in
Figure 30 the localized abrasion has removed strips of the system The pattern of
removal suggests that the epoxy was removed due to the high impact of a bouncing snow
plow blade This system is thinner than any other system in the study with a thinner cross
section less removal of material is required to reach the deck surface
Figure 30 Excessive Snow Plow Abrasion (Br 27758)
The thin cross section of this system is shown in Figure 31 In this picture there is not a
distinguishable elevation difference between the bridge deck and the epoxy overlay
55
Figure 31 Thin Epoxy System (Br 27758)
In the Novachip systems the worst snowplow abrasion came from an uneven roadway
elevation The right side of the Novachip system on Bridge 86019 (Figure 32) has a
significant amount of abrasion compared to the left side During the site visit settlement
was visible on the left side of the bridge suggested by uneven approach panels and
mismatched Jersey barrier heights This settlement has lowered the left side of the bridge
causing uneven seating of snowplow blades on the right side This seating increases the
rate of abrasion compared to the left side of the system
56
Figure 32 Uneven Snowplow Abrasion due to Uneven Roadway Elevation (Br 86019)
The area most damaged on this system is along the expansion joints A common distress
among the different epoxy systems snowplows seem to cause catastrophic deterioration
near joints As shown in Figure 33 traffic is flowing from left to right The right side of
the figure is the concrete departure panel of the bridge More area is missing on the
departure side of the expansion joint
Figure 33 Missing Overlay System near Expansion Joints on Transpo System (Br 27758)
57
Damage at the joints is common on all HFO systems The systems are not constructed to
be flush with joints so abrasion due to traffic and snowplows causes a raveling distress
by removing aggregate from the epoxy This damage is apparent in Figure 34 The figure
shows a joint from Bridge 69006 In the figure traffic is moving from left to right As the
snow plow blade crosses the joint it drops off the epoxy system until it is flush with the
joint It then scrapes away the system on the other side of the joint
This damage is also shown in Figure 35 with a joint from Bridge 9066 Bridge 69006 and
9066 had their overlay systems placed in 2009 and 2010 respectively So the damage in
Figure 34 is from three winters and the damage in Figure 35 was caused over two
winters
Figure 34 Joint Abrasion on Bridge 69006 (Traffic Moves from Left to Right)
58
Figure 35 Joint Damage on Bridge 9066 (Traffic Moves from Left to Right)
Damage is also produced as snow plows cross from approach panels to the bridge deck
The mismatch between the approach panel and the bridge deck causes part of the epoxy
system to be scrapped off the bridge deck (Figure 36) Transverse abrasion from snow
plows in high elevation areas is also apparent in Figure 36
59
Figure 36 Damage near Approach Panels on Poly-Carb System (Bridge 69006)
As shown in Figure 37 the HFO system removal due to snow plows occurs across all
HFO types The removal in Figure 37 is especially bad due to the uneven elevation
between the roadway and the approach panel The asphalt roadway on the left side of the
figure has settled exposing the concrete approach panel and overlying HFO system
Figure 37 System Removal near Joint on NovaChip System (Bridge 86019)
60
Due to the thin nature of the epoxy systems aggregates that are placed on the top layer
may not receive adequate epoxy cover to stay embedded in the system Abrasion from
snow plows and traffic will remove aggregate from the epoxy matrix This distress was
common across all epoxy bridges
Aggregate Raveling
Removal of aggregates from the HFO system is due to inadequate binding to the system
Abrasion forces are most commonly responsible for aggregate removal in the epoxy
based systems Poly-Carb SafeLane and Transpo Aggregate raveling was more
apparent in the wheel path and was more common in polished areas These systems had
large amounts of aggregate raveling at every bridge location Figure 38 contrasts a
surface with the proper aggregate coating against a surface with significant amount of
polishing and raveling
Figure 38 Texture Comparison of Br 4190 (Left Proper Aggregate Macrotexture Right
Aggregate Raveling)
61
In Figure 39 there is a comparison of a typical section along the driving lane for three
different systems On the left is Novachip (Br 86013) which has minimal aggregate
raveling compared to its epoxy counterparts In the middle is a typical SafeLane surface
(Br 14810) and a typical Poly-Carb surface (Br 9067) on the right The reason Novachip
systems have minimal loss of their aggregates is due to the fact that the system is a thin-
bonded open-graded asphalt overlay The asphalt binder has viscoelastic properties
whereas the epoxy based systems are much stiffer elastic-plastic response The
viscoelastic properties may allow the asphalt system to absorb the shock exerted by snow
plow action
Two different scenarios occur when a shearing force such as a snow plow pushes across
the top of the overlay surface The first occurs with asphalt system When forces are
applied an aggregate is allowed to compress into the asphalt binder at a microscopic
level The asphalt then has an elastic recovery after the force is removed placing the
aggregate back into its original location This elasticity of asphalt allows the system to
absorb some of the energy caused by abrasion In the second scenario with elasto-plastic
epoxy the system cannot compress and cannot absorb the energy as the stiffness of
epoxy is very high This results in the applied forces breaking the bonds formed between
the epoxy and aggregates and removing aggregates from the system
Novachip systems are constructed similar to asphalt overlays thus the system is
compacted with a roller during construction This compaction helps to push the
aggregates further into the asphalt matrix and achieve a higher bond Additionally
asphalt remains pliable while it ages therefore aggregate in the Novachip systems are
able to compress into the asphalt under a load even after the initial placement The
continued embedment of aggregate into the asphalt membrane is noticeable in the
Novachip systems (Figure 39 left) These two features prevent the excessive raveling
found in epoxy systems In an epoxy system once hardened the aggregates do not have
the capability to compress further into the epoxy matrix which may lead to protruding
aggregate These protruding aggregates are more susceptible to abrasion polishing and
raveling
62
Figure 39 Comparison of Loss of Aggregate between Novachip (Left) SafeLane
(Middle) and Poly-Carb (Right) Systems
63
Aggregate Polishing
Aggregate polishing was a common distress found in the wheel paths An extreme case of
polishing was found on Bridge 9066 In Figure 40 and Figure 41 the reflection of sunlight
on polished areas makes it much easier to spot locations with poor friction
Figure 40 Wheel Path Polishing (Br 9066)
Figure 41 Close View of Polished Area (Br 9066)
64
Cracking
Similar to concrete and asphalt pavements cracks in HFO systems also occur Several
hairline cracks exist in the Poly-Carb and SafeLane systems but none of the cracks
appeared to propagate through the entire thickness of the system In the Transpo systems
cracks that propagated through the entire system did occur On Bridge 27758 (Penn Ave)
the cracks appear to be due to the system being thinner than any other system allowing
reflective cracks from the underlying bridge deck to propagate through the system These
cracks are shown below in Figure 42
Figure 42 Transverse Cracks on Bridge 27758
Cracking also occurred on Bridge 6347 This cracking was completely through the
thickness of the HFO systems The approach panels on either side of the bridge have a
transverse crack near the expansion joints The transverse crack occurs along the back
edge of the concrete abutment wall (Figure 43) which suggests that settlement behind the
abutment has occurred The settlement lowered and cracked the approach panel and the
HFO system This settlement may also have detrimental effects on the expansion joint
and could render the joint ineffective
65
Figure 43 Transverse Crack near Expansion Joint of Bridge 6347
Transverse cracking (Figure 44) and reflective cracking along expansion joints (Figure
45) both existed in the Novachip systems The Novachip systems are asphalt overlays and
thus distress differently than the other epoxy systems Novachip systems distress similar
to conventional asphalt pavements The cracks reflected through the Novachip systems
from existing cracks or settlement in the approach panels and bridge decks The
placement of Novachip systems on well-performing bridge decks would eradicate a
majority of the crack distresses observed in this study
66
Figure 44 Longitudinal Crack in Novachip System (Br 27019)
Figure 45 Reflective Cracking in Novachip System (Br 27019)
Several different types of cracking existed Cracking that propagates through the entire
HFO system is detrimental because it provides an area where water and chloride ions are
able to penetrate into the concrete deck
67
Delamination of High Friction Overlay Systems
Several bridges in this study have sections where the epoxy overlay has delaminated from
the bridge deck On Bridge 6347 the delamination of the epoxy overlay system has
occurred along the centerline of the roadway The majority of the delamination has
occurred along the construction joint which runs down the middle of the bridge Some of
the worst delamination is shown below in Figure 46 The construction joint can be seen in
between the no passing lines
Figure 46 Delamination of Transpo System on Bridge 6347 along Centerline
Delamination also occurred in several Poly-Carb systems (Bridge 4190 and 9036)
Depictions of such delamination are shown in Figure 47 through Figure 49
68
Figure 47 Delamination of HFO on Robert Street Bridge (Br 9036)
69
Figure 48 Minimal Bond Strength Existed in the Distressed Areas (Br 9036)
Figure 49 Delaminated Area during Maintenance (Br 4190)
70
During the first year of investigation Bridge 4190 (TH 55 in St Paul Poly-Carb) and
Bridge 9036 (Robert St in St Paul Poly-Carb) were visited in addition to the bridges in
this study Both bridges had delamination of their HFO systems After visiting these two
bridges they were repaired however delamination occurred again on these epoxy systems
during the second year of this study (2014) The two bridges were not visited during the
second year of this study (2014)
There appears to be two similarities between the bridges where this delamination occurs
crossing water and lower functioning expansion joints The epoxy systems crossing water
in this study are found on Bridges 6347 (TH 243 in Otsego Transpo) 9066 and 9067 (I-
94 in Moorhead Poly-Carb) Delamination has occurred on Bridge 6347 but not on either
9066 or 9067 One main difference between Bridges 9066 9067 and the other bridges
with delamination is the expansion joints On Bridge 9066 and 9067 the expansion joints
are significantly larger compared to the other bridges The expansion joint of Bridge
9066 is shown below in Figure 50
Figure 50 Expansion Joint on Bridge 9066
The expansion joints of bridges with delamination are smaller in comparison and in
some cases do not appear to be in the best condition The Robert Street Bridge expansion
joints (Figure 51) did not appear to be functioning well The smaller joint shown on the
top of Figure 51 was south of the delamination and appeared to be sealed The northern
71
joint (Bottom of Figure 51) was larger but contained a significant amount of fine
incompressible material in the joint A similar joint in similar condition is found on
Bridge 4190 (TH 55) and is shown in Figure 52 This joint was also filled with fine
material
The constant presence of water under a bridge with an epoxy system may play a role in
the delamination of the system Moisture from the river may infiltrate from the underside
of the bridge and reduce the bonding between the epoxy overlay and the bridge deck As
previously discussed in the Literature Review moisture may be present in the concrete
deck even if water is not visually apparent on the surface
Concrete and epoxy have different coefficients of thermal expansion thus expanding at
different rates This difference causes internal pressures on the epoxy system during
thermal expansion and the pressure is further compounded with the presence of small or
ill-functioning expansion joints If moisture is present in the bridge deck during
installation a weaker bond between the epoxy and concrete may occur Internal stresses
emphasized by small or ill performing joints may be enough to delaminate HFO systems
with a weaker bond
Bridge 27019 and 86019 (Otsego Novachip) also cross water however the Novachip
systems with their elastic properties from asphalt would be able to absorb the internal
stresses compared to the rigid epoxy system As discussed in the previous section Bridge
6347 (TH 243 in Osceola Transpo) has settlement behind its abutment which could be
interfering with its expansion joints ability to operate
72
Figure 51 Robert Street (Br 9036) Expansion Joints Both North (Bottom) and South
(Top) of Delamination
Figure 52 Bridge 4190 (TH 55) Expansion Joint
When cracks or delamination occur in HFO systems their ability to protect the underlying
deck from chloride infiltration is compromised This infiltration can lead to reinforcement
steel corrosion
73
Differences in Thickness of High Friction Overlay Systems
In this study the different HFO systems have different thicknesses The thickest system
is Novachip (34 inch [19mm]) followed by SafeLane (38 inch [95mm]) and then Poly-
Carb (14 inch [65mm]) A visual of the difference in thickness is provided below
(Figure 53) The figure shows steel plate samples that removed a section of an HFO
system during the torque bond testing A Poly-Carb system sample (Left) is side by side
with a Novachip system sample (Right) Since epoxy has a higher tensile strength
compared to asphalt epoxy systems can have smaller cross-sections and still achieve
adequate binding to the bridge deck as well as the aggregates in the HFO system The
slight difference in thickness between SafeLane and Poly-Carb systems is due to the
selected aggregate size SafeLane is slightly thicker because it uses larger aggregates in
its system compared to Poly-Carb
Figure 53 System Thickness Comparison Left Poly-Carb System Right Novachip
System
The main advantage for thinner epoxy systems is a reduction in dead load on bridges
Assuming the HFO systems have a relatively similar density epoxy systems place half
the weight on a bridge deck compared to asphalt based systems
Testing Procedure and Methodology
Testing was completed on overlay systems in order to acquire friction permeability and
bond strength properties The tests and their corresponding ASTM designations or
74
procedures are described in Table 16 Several testing locations along the length of the
bridges were used to collect data and reduce bias At each test location the bridge decks
were tested in both wheel path and non-wheel path areas In general the wheel path was
located by measuring 25 feet [76 cm] into the lane from the fog line The non-wheel
pathrsquos location was considered to be 6 feet [18 m] from the fog line In some instances
wearing of the deck due to wheel loads were used to identify the wheel path
Table 16 Properties and Test Method
Property Test Method
Pavement Macrotexture Depth
ASTM E 965-96 Standard Test Method for
Measuring Pavement Macrotexture Depth Using a
Volumetric Technique
Torque Bond Strength
There is currently not an ASTM standard for this
test However results are to be used for comparison
of systems within this project only
Pavement Permeability
Testing was performed based on the operating
manual for the NCAT Asphalt Field Permeameter
Kit AP-1B which was used for testing
Skid Resistance of Paved
Surface
ASTM E 274 Standard Test Method for Skid
Resistance of Paved Surfaces Using a Full-Scale
Tire
ASTM E1911-09 Standard Test Method for
Measuring Paved Surface Frictional Properties
Using the Dynamic Friction Tester
Chloride Ion Penetration
AASHTO T277 Standard Method of Test for Rapid
Determination of the Chloride Permeability of
Concrete
75
Pavement Macrotexture Depth
The ASTM 965-96 test method finds the mean texture depth of a pavement through a
volumetric procedure A known volume of evenly graded silica sand is spread evenly
over an area of pavement with the known sand volume and surface area of the space it
fills one can solve for the mean texture depth (MTD) This MTD is used to compare the
texture of HFO systems A larger MTD means more texture and inherently higher
friction An example of this process is shown below in Figure 54 The equation used to
calculate the mean texture depth and other data used is provided in the Appendix
Figure 54 Mean Texture Depth
Torque Bond Strength
In this test a steel plate is bonded to the overlay system using a fast setting epoxy Once
this epoxy is set (approximately two hours) the plate is removed using a torque wrench
This wrench has a readout that provides the torque required to remove the plate This test
measures how well a system is bonding with the concrete bridge deck Removal of the
epoxy system when torque is applied advocates for a poor bond between the system and
bridge deck Figure 55 shows the torque wrench attached to a plate just before testing
Figure 56 and Figure 57 show plates with debonded overlay material at Bridges 9036 and
14810 respectively
76
Figure 55 Torque Wrench and Attached Plates (Br 69006)
Figure 56 Plate with Debonded Overlay (Br 9036)
77
Figure 57 Plate with Debonded Overlay (Br 14810)
During the first year of bridge deck wear course evaluation the torque bond strength
testing was conducted using a two inch [5 cm] extension piece to connect the end of the
wrench with the steel plate During the second year of testing this extension was removed
and the wrench was directly connected to the steel plate This brought the wrench closer
to the steel plate Since this distance was reduced the force applied to the wrench was
more effectively transferred into the torque placed on the steel plate With the extension
piece in place it is believed that some force applied to the wrench was exerted in a
bending mode rather than pure rotational torque when transferring force from the wrench
to the steel plate likely resulting in a reduction of torque required during testing For this
reason the torque values from Year-1 should not be directly compared to the values found
in Year-2
Pavement Permeability
This test is performed to provide the coefficient of permeability of a pavement This is
accomplished by timing the rate at which the water level decreases in the testing
equipment shown below in Figure 58 The purpose of the epoxy system is to provide a
waterproof system to add protection to the bridge deck Some deicing chemicals used on
78
roadways have detrimental effects on the concrete and reinforcement bars in the bridge
deck By providing an impervious surface these soluble chemicals are unable to infiltrate
the bridge deck and thus reduce the degradation of the infrastructure It is important to
visually inspect the epoxy system and perform permeability tests on any surface cracks in
the system to find if water is able to infiltrate the epoxy system Figure 58 is a test
performed on a crack in the system However as shown in the bottom of the figure the
crack does not extend through the entire thickness of the system Evidence of this is the
water permeating back to the surface outside of the testing equipment The equation used
to calculate the coefficient of permeability and other data used is provided in the
Appendix
Figure 58 Permeability Test over Cracked Overlay (Br 9823)
79
Skid Resistance of Paved Surfaces
Two different tests were completed to find the skid resistance of the HFO systems The
first test found resistance values using a skid trailer This test was conducted by MnDOT
and was completed during both Year-1 and Year-2
The second test measured resistance values using the Dynamic Friction Tester Testing
was only completed during Year-2 of the study and was conducted by MnDOTrsquos Office
of Materials and Road Research Below are descriptions of the two different testing
procedures
Measuring Surface Frictional Properties with a Skid Trailer
An apparatus with a test wheel and recording instrumentation is driven over a roadway at
a determined speed While at this speed the test wheel has its brakes locked The force
required to slide the locked test tire over the roadway is used to determine the skid
number Water is sprayed onto the roadway in front of the test tire in order to simulate the
ldquoworst caserdquo scenario of a wet road Minnesota Department of Transportation (MnDOT)
collects skid numbers for roadways using a KJ Law (Dynatest) Skid Trailer Two types of
tires are used during testing ribbed tires which have a tread design and smooth tires
The ribbed tire is more sensitive to microtexture while the smooth tire is more sensitive
to macrotexture (M Watson 2011) Smooth tires also display more variation to water
film depth (FHWA 2010) Although this test is conducted to find the surface friction a
certain skid number does not necessary correlate to a safe or unsafe road condition
(FHWA 2010) A major drawback of the skid trailer is its use on a tangent curve When
driving on a tangent curve the weight of the skid trailer is not perpendicular to the road
surface due to the super elevation of the roadway thus skewing the coefficient of friction
results It may also be unsafe to test some tangent curves because traffic simply cannot
drive at the test speed required on some curves
80
Measuring Surface Frictional Properties with the Dynamic Friction Tester
This test is performed using an apparatus that houses a rotating disk with three rubber
sliders attached on the bottom of the disk The test procedure is standardized through
ASTM E1911-09 specification The disk is mounted in a plane parallel to the driving
surface The disk is rotated and brought up to its maximum tangential velocity of 90 kmh
(55 mph) Once the disk is up to its maximum tangential velocity water is pumped in
front of the rubber sliders as the disk is lowered to make contact with the surface The
torque is monitored as the friction between the roadway and rubber sliders reduce the
diskrsquos rotational velocity The friction at various tangential velocities is recorded for later
analysis The testing apparatus is depicted below in Figure 59 The piece of equipment
placed on the roadway surface placed to the right of the bucket in Figure 59 houses the
rotational disk Each test location ran five repetitions of the Dynamic Friction Tester
(DFT) test Tests were run at one to three different locations for both the wheel and non-
wheel path regions of each bridge The number of test-runs was based on time constraints
due to traffic control
Figure 59 Dynamic Friction Tester
There are some benefits for the use of the DFT as compared to a skid trailer The first is
reliability and ability to quantify repeatability The DFT is set up and used in a singular
location This allows for multiple tests to be run in the same location for higher precision
81
It also eliminates error that may interfere with test results This error can be caused by the
bouncing or lateral movement of the skid trailer which must be in motion for its testing
procedure The fact that testing is done in a static location for DFT testing provides the
opportunity to test more accurately in wheel and non-wheel paths Draw backs for the
localization of this test include that the friction values of a surface are based on a very
small percentage of the surface however for this study the higher accuracy allowing us to
compare multiple bridges and systems outweighs the disadvantage
Chloride Ion Penetration
This test is conducted to test the content of chloride ions present in bridge decks with an
HFO system The purpose of this test is to determine if HFO systems protect bridge decks
from chloride ion penetration which facilitates corrosion of reinforcing steel inside the
concrete deck Samples are cored out of the bridge deck and vary from four to six inches
in depth Each sample is cut at corresponding depths crushed and tested for the chloride
ion content according to the AASHTO T-277 test method These cuts are made to
determine the chloride levels present at different depths throughout the bridge deck An
illustration of where a core sample is cut is shown below (Figure 60)
82
Figure 60 Cutting Configuration of a Sample Core
The typical range at which corrosion may begin is 059 to 070 kgm3 or 250 to 330 parts
per million (Costa 2010) The chloride content threshold of 06 kgm3 was identified by a
Federal Highway of Administration (FHWA) corrosion study as the lower value where
corrosion can occur (Clemena 1998) The important depth to look at is the depth closest
to reinforcing steel (Young Durham amp Bindel 2012) For concrete bridge decks this
depth is two inches the minimum cover required for reinforcing steel (AASHTO 2012)
The purpose of this testing is to see whether HFO systems are protecting the bridge decks
from chloride ion penetration
For this testing sample cores were removed from the field by MnDOT The preparation
and testing of samples was conducted by the MnDOT Office of Materials and Road
Research A limited amount of samples were removed for this testing Core samples were
collected from Bridge 9823 (Atkinson MN Poly-Carb system) and Bridge 69006
(Virginia MN Poly-Carb system) Tabulated below in Table 17 are the year and
83
corresponding number of sample cores taken from the bridge decks Samples are cored
out of the bridge deck and vary from four to sixes inches in depth
Table 17 Number of Sample Cores Taken in Various Years
Bridge Year
Number of Sample Cores
Driving
Lane
Passing
Lane
9823 2011 3 3
2014 1 1
69006
2010 3 3
2011 3 3
2014 1 1
The 2010 and 2011 cores were cut at every inch along the deckrsquos depth The 2014 cores
were cut at every half inch for the first two inches and every inch after The results from
this testing are discussed in the following section
Results
The field results and their analysis for the different bridges and their HFO systems are
below Additional equations data and calculations are presented in the Appendix
Pavement Macrotexture Depth Results
The following section discusses the results found from the pavement macrotexture depth
testing This test is useful for comparing different physical characteristics of the bridges
and how they affect the mean texture depth (MTD) Three lines are placed on Figure 61
and Figure 62 as a baseline comparison against normal bridge surfaces Table 18
summarizes the attributes of these baseline surfaces
84
Table 18 Baseline Surface Texture Attributes
Surface Type MTD (in) Remarks
New Asphalt 00161 Taken within 6 months of construction
New Brushed Concrete 00295 Taken within 6 months of construction
Worn Tined Concrete 00138 Low speed bridge deck surface after 14 years
of service with an ADT of less than 200
The mean texture depths are found below for both the driving lane (Year-1 Figure 61
Year-2 Figure 62) and passing lane (Year-2 Figure 63) There are two general trends for
the mean texture depth These trends are divided by the different types of HFO systems
The first trend is for the epoxy based systems Poly-Carb (Bridges 9066 9067 9823 and
69006) Transpo (Bridges 6347 and 27758) and SafeLane (Bridges 14809 and 14810)
In this trend the mean texture depth varies with the smallest depth in the wheel path the
largest depth in the shoulder The non-wheel path has a depth somewhere in between
The logic behind this trend is that snow plow abrasion causes more severe abrasion on
driving lanes lowering its depth compared to the shoulder The wheels from traffic further
abrade the wheel path lowering its depth compared to the non-wheel path This trend
exists in both the driving and passing lanes
The second trend is for the Novachip system (Bridge 27019 and 86013) On these
systems the shoulder depth is smaller compared to driving lanes The reason for this is the
maintenance operations performed on these bridges Snow is plowed onto the shoulders
and then removed over the edge using a snow thrower The blades on the snow thrower
cause additional heavy abrasion on the shoulder
On Bridges 9036 (Poly-Carb) 27758 (Transpo) and 86013 (Novachip) the wheel and
non-wheel path depths are very comparable A small variance between the wheel and
non-wheel path is reasonable since this is a lower traffic volume lower speed bridge On
Bridge 27019 the wheel path has a larger depth compared to the non-wheel path A
possible explanation for this is the existence of a construction joint along the non-wheel
path section tested
85
Figure 61 Mean Texture Depth (Year-1 Driving Lane)
0
001
002
003
004
005
006
007
69006 9823 4190 9036 9066 9067 14810
Mea
n T
extu
re D
epth
(in
)
Non-Wheel Path Wheel PathNew Asphalt Brush ConcreteWorn Tined Concrete
86
Figure 62 Mean Texture Depth (Year-2 Driving Lane)
00000
00100
00200
00300
00400
00500
00600
00700
00800
6347 9066 9067 9823 14809 14810 27019 27758 69006 86013
Mea
n T
extu
re D
epth
(in
ches
)
Wheel Path (Driving Ln) Non-Wheel Path (Driving Ln)Shoulder New AsphaltBrushed Concrete Worn Tined Concrete
87
Figure 63 Mean Texture Depth (Year-2 Passing Lane)
The bridges with a Poly-Carb system (Br 9066 9067 9823 and 69006) or Transpo
system (Br 6347 and 27758) installed all have mean texture depth values near or below
that of brushed concrete When comparing the driving lane to the shoulders it shows that
these systems have lost a significant amount of texture and depth due to snowplow and
traffic abrasion
The Poly-Carb systems use smaller aggregates compared to Novachip and SafeLane
systems therefore Poly-Carb systems are more susceptible to a reduction in depth
bringing the mean texture depth closer to traditionally paved roadway surfaces However
the SafeLane bridges (14809 and 14810) also had a significant reduction in depth when
comparing their driving lanes and shoulders With the assumption that little abrasion has
occurred on shoulder lanes for Poly-Carb and SafeLane an estimate can be made for the
00000
00100
00200
00300
00400
00500
00600
00700
00800
9066 9067 9823 14809 14810
Mea
n T
extu
re D
epth
(In
ches
)
Wheel Path (Passing Ln) Non-Wheel Path (Passing Ln) Shoulder
88
original MTD when the system was first installed and had no abrasion or distresses
Based on the shoulder depth SafeLane systems have a starting MTD between 006 and
007 while Poly-Carb systems start with an MTD between 0045 and 005 With these
assumed starting numbers the Poly-Carb and SafeLane systems have had a 30 to 35
reduction in MTD values Using the dates of installation SafeLane has a reduction of
about 5 per year Poly-Carb has a reduction of 6-8 a year It should be noted that
reduction in MTD values are greatly influenced by winter weather and the use of
snowplows From 2013 to 2014 (Figure 65) the percent of MTD reduction for bridges in
this study which endured harsh winter conditions varied from 4-20 Transpo systems
were excluded from this comparison because testing of the shoulders on bridges with a
Transpo system was not conducted
The difference between the MTD in the driving lane passing lane and shoulder for some
Poly-Carb and SafeLane systems is illustrated below in Figure 64 In general the passing
lane has a larger depth and it is reasonable to attribute this trend to higher traffic loads
(especially truck loads) traveling in the driving lane
89
Figure 64 Mean Texture Depth Comparison
Five bridges were tested in both the first and second year of this study including the Poly-
Carb bridges 9066 9067 9823 and 69006 as well as the SafeLane Bridge 14810 The
comparison between the two years is shown in Figure 65 As expected another year of
abrasion has caused a reduction in depth For Bridge 9066 (Moorhead I-94 Westbound)
the depth in the wheel path actually increased As explained in the year one field
observations this bridge has several significantly polished areas and measurements of
these areas were taken Thus the 2013 values for this bridge targeted polished areas
whereas the 2014 values are more representative of the mean texture depth Bridge 9067
(Moorhead I-94 Eastbound) saw the most significant drop in depth from 2013 to 2014
Bridge 14810 (Barnesville I-94 Eastbound) had significant abrasion to its non-wheel
path reducing its average depth and bringing it much closer to the wheel path values The
00000
00100
00200
00300
00400
00500
00600
00700
00800
9066 9067 9823 14809 14810
Mea
n T
extu
re D
epth
(In
ches
)
Wheel Path (Driving Ln) Wheel Path (Passing Ln) Non-Wheel Path (Driving Ln)
Non-Wheel Path (Passing Ln) Shoulder
90
2013-2014 winter was very harsh which may have resulted in above average snow plow
abrasion
Figure 65 Mean Texture Depth Comparison of 2013 (Year-1) to 2014 (Year-2) Values
An estimation for the number of vehicles passing over each bridge was found using the
average daily traffic (ADT) and number of years the HFO system has been in place
Using this data the relative difference between the wheel and non-wheel path was found
for every one million passing vehicles This relative difference normalized to traffic is
displayed in Figure 66 This data does not account for unequal lane or directional
distributions Additionally it assumes that every vehicle causes the same amount of
abrasion to the bridge aggregates
00000
00100
00200
00300
00400
00500
00600
9066 9067 9823 14810 69006
Mea
n T
extu
re D
epth
(In
ches
)
Wheel Path (2013) Wheel Path (2014) Non-Wheel Path (2013) Non-Wheel Path (2014)
91
Figure 66 Relative Difference between Wheel and Non-Wheel Path MTD Normalized to
Total Traffic
By comparing the relative difference between wheel and non-wheel MTD normalized to
total traffic several conclusions are made
Taconite performs best against wheel path abrasion
Bridge 9823 (Atkinson MN) and Bridge 14810 (Barnesville MN) had
significantly higher wheel abrasion compared to the other bridges
Channelized driving patterns on roadways with higher speeds such as Bridge 9823
(Atkinson MN) and Bridge 14810 (Barnesville MN) are more apparent with the
higher relative difference
0
00005
0001
00015
0002
00025
0003
00035
0004
4190 9036 9066 9067 9823 14810 69006
Rel
ativ
e D
iffe
rence
bet
wee
n W
hee
l a
nd
No
n-W
hee
l P
ath
(inch
mil
lio
n v
ehic
les)
92
An aggregate type does not wear evenly in every location Considering basalt as
an example it clearly shows that different traffic loads speeds and conditions all
affect the abrasion rate
Overall several conclusions can be drawn based on the test results
The wheel path abrasion is significantly higher on bridges where channelized
driving is common (high speeds or high ADT) This is apparent on the higher
speed Interstate bridges (Br 9823 Br 9066 Br 9067 Br 14809 and Br 14810) and
the higher ADT bridge (Br 4190)
Taconite (Br 69006) appears to have the best performance of the aggregates for
abrasion due to wheels
The small difference between non-wheel and wheel path depths for Br 9036
(Robert St in St Paul Poly-Carb) and Br 86013 (CSAH 36 in Otsego Novachip)
is due to the slower speed limit which limits the abrasion damage Also since this
bridge is a local road lane changes may be more frequent causing a more even
abrasion across the entire lane
The smaller depth of Br 9066 compared to Br 9067 suggests that higher traffic
levels travel in the westbound driving lane This supports the claim that Bridge
9066 is functionally obsolete Higher traffic in this lane is most likely due to the
traffic exiting to the area Universities
Bridge 9066 (WB I-94 in Moorhead Poly-Carb) and Bridge 9823 (SB I-35 in
Atkinson Poly-Carb) had the smallest reductions in mean texture depth from the
year 2013 to 2014
Bond Strength Results
The bond strength of the different HFO systems was tested during both years of the
study As previously mentioned in the Chapter 4 Testing Procedure and Methodology
section a slight variation in testing methods occurred between the years and for that
reason torque values from Year-1 should not be compared to the values found in Year-2
93
Year-1 Results
The torque bond test was conducted on four bridges Some bridges visited during Year-1
were not tested due to time restrictions with traffic control The results for the testing
conducted are presented in Figure 67
Figure 67 Year-1 Torque Test Results
Three of the four bridges tested recorded a torque strength of around 500 Nm Although
the strength on Bridge 9036 (Robert St) was lower only one of the tests removed the
epoxy system from the bridge deck All other tests performed on Robert Street broke the
epoxy securing the steel plate to the system Weather conditions on the day of testing are
most likely the cause for this lower epoxy strength The conditions were sunny with
temperatures above 90degF [32degC] With even higher roadway surface temperatures the
epoxy used to secure the steel plate was reaching its upper operating temperature limit
Two tests removed the epoxy system from the bridge deck
0
50
100
150
200
250
300
350
400
450
500
4190 9036 9066 9067 9823 14810 69006
Req
uir
ed T
orq
ue
(Nm
)
Non-Wheel Path Wheel Path
No
Dat
a
No
Dat
a
No
Dat
a
No
Dat
a
No
Dat
a
No
Dat
a
94
Bridge 9036 (Robert St) Non-wheel path test removed the system with a torque
of 210 Nm This test was the test performed closest to the damaged section of the
system This indicates that the debonding of the system may slowly be spreading
away from the already damaged area
Bridge 14810 (Barnesville MN) Non-wheel path test removed the system with a
torque of 500 Nm [370 ftmiddotlb] The system was removed after the strength gauge
on the torque wrench was maxed out
Year-2 Results
A more robust analysis of the bond strength was completed during the second year of the
study The torque bond test was conducted on eight bridges during the year two study
Bond strength results varied greatly compared to results from the first year of study but
the variation is most likely from the small change in the testing procedure In the second
year the required torque for removal of the steel plates was much lower and the removal
of the HFO system was more common In the first year excluding Bridge 9036 because it
is considered an additional bridge one of the eighteen tests conducted on three different
bridges removed the HFO system from the bridge deck In Year-2 30 of the 53 tests
conducted on eight bridges removed the HFO system from the bridge deck A varying
degree of removal occurred This various degree of removal is illustrated below in Figure
68 and is quantified by ldquono removalrdquo (left) ldquopartial removalrdquo (middle) and ldquototal
removalrdquo (right)
95
Figure 68 Various Degree of Removal Including No Removal (Left) Partial
Removal (Middle) and Total Removal (Right)
The results for the testing conducted are displayed in Figure 69 in the unit of Newton-
meters From the data below it is hard to find a conclusive general trend for the strength
of systems
Torque for bridges with the same systems have similar torque values
Novachip systems varied from 100 Nm to 150 Nm [74 to 111 ftmiddotlb]
SafeLane systems varied from 150 Nm to 200 Nm [111 to 148 ftmiddotlb]
Poly-Carb systems varied from 175 Nm to 450 Nm [129 to 332 ftmiddotlb]
Transpo systems varied from 120 Nm to 420 Nm [89 to 310 ftmiddotlb]
Poly-Carb and SafeLane are epoxy overlay systems while Novachip is a thin-bonded
open graded asphalt overlay With epoxy having better tensile strength properties
compared to asphalt Novachip has the smallest required torque when internal tensile
stresses are placed on the HFO systems as a result of the torque placed on the system
96
Figure 69 Torque Bond Test Results
Values from the non-wheel and wheel path are similar for each individual bridge with a
variance of 50 Nm [37 ftmiddotlb] When comparing the difference between passing lane and
driving lane values that variance increases to 75 Nm [55 ftmiddotlb] Bridges 9066 and 9067
(I-94 in Moorhead Poly-Carb) have a Poly-Carb system with Flint aggregate These
bridges had an average variance of 100 Nm [74 ftmiddotlb] between non-wheel and wheel
path The flint aggregate particles are the smallest used in the HFO systems in this study
and tend to be more flat compared to aggregates in other systems During installation of
systems with flint it is possible to have many of the flat particles placed with similar
orientation This orientation and small particle size reduces the amount of aggregate
interlock and can cause a weak plane in the system This is illustrated below in Figure 70
The figure shows two samples that were removed using the torque bond test On the left
0
50
100
150
200
250
300
350
400
450
9066 9067 9823 14809 14810 9066 9067 9823 27019 27758 69006 86013
Req
uir
ed T
orq
ue
(Nm
)
Wheel path Non-Wheel Path
Passing Lanes Driving Lanes
97
is the partial removal of a Poly-Carb system with Flint aggregates (Br 9067) while the
sample on the right is a partial removal of a SafeLane system (Br 14810) The partial
removal of flint happened in a horizontal plane where the SafeLane partial removal depth
varies across the sample
Figure 70 Comparison of Poly-Carb with Flint (Left) and SafeLane Torque Removal
Samples
98
In the driving lane both of the bridges with a Novachip system had 100 of the tests
with at least a partial removal of the HFO system The only other removals in the driving
lane occurred in the wheel path of Bridge 9066 (WB I-94 in Moorhead Poly-Carb) and
Bridge 69006 (TH 53 in Virginia Poly-Carb) (Figure 71)
Figure 71 Percentage of Tests in the Driving Lane Removing HFO Systems from the
Bridge Deck
The removal rate of the HFO systems in passing lanes during torque testing is provided in
Figure 72 Of the five passing lanes tested four had 100 of the tests remove at least a
portion of the HFO system The other bridge (Br 9823 TH 53 in Virginia Poly-Carb) did
not have any system removal in the passing lane There are not any apparent conditions
that point to why removals are more common in the passing lane compared to the driving
lane One possibility is the variation of construction As previously discussed visual
0
10
20
30
40
50
60
70
80
90
100
6347 9066 9067 9823 27019 27758 69006 86013
Per
centa
ge
of
Tes
ts C
ond
uct
ed i
n t
he
Pas
sing L
ane
for
Eac
h
Bri
dge
()
No Removal () Wheel Path Total Removal ()
Wheel Path Partial Removal () Non-Wheel Path Total Removal ()
Non-Wheel Path Partial Removal ()
99
inspection can often reveal different distress and abrasion patterns on different sides of
construction joints This variability may cause the variability in torque testing both
laterally and transversely along the bridge
Figure 72 Percentage of Tests in the Passing Lane Removing HFO Systems from the
Bridge Deck
Permeability Results
The permeability factor found during all testing was very small and for practical purposes
may be considered zero The macrotexture that exists from the aggregate used in these
overlay systems creates void space between some aggregate particles Water slowly
infiltrates these void pockets throughout the duration of the test This infiltration is the
reason behind permeability coefficients (K values) that are very small but not zero For
the SafeLane (Br 14809 and Br 14810) and the Novachip (Br 27019 and Br 86013)
0
10
20
30
40
50
60
70
80
90
100
9066 9067 9823 14809 14810
Per
centa
ge
of
Tes
ts C
ond
uct
ed i
n t
he
Pas
sing L
ane
for
Eac
h
Bri
dge
()
No Removal () Wheel Path Total Removal ()Wheel Path Partial Removal () Non-Wheel Path Total Removal ()Non-Wheel Path Partial Removal ()
100
systems the aggregates were too large to allow for permeability testing The large
aggregate on the surface of these systems prevented a strong and complete seal when
attaching the testing equipment to the roadway Weather prevented testing from occurring
for both Transpo bridges Results are presented in Table 19
Table 19 Permeability Results
Bridge
Coefficient of Permeability (K)
Year-1 Year-2
Wheel Path
(cmsec)
Non-Wheel
Path (cmsec)
Wheel Path
(cmsec)
Non-Wheel
Path (cmsec)
6347 NA NA NA NA
9036 226x10-7 1855x10-7 NA NA
9066 0 2102x10-7 219x10-7 232x10-7
9067 1779x10-7 NA 0 228x10-7
9823 9046x10-7 2016x10-7 0 234x10-7
14809 NA NA NA NA
14810 3811x10-6 NA NA NA
27019 NA NA NA NA
27758 NA NA NA NA
69006 0 1007x10-6 439x10-7 0
86013 9814x10-5 5520x10-6 NA NA
86019 NA NA NA NA
This test was also conducted on a traditional concrete bridge deck to provide a
benchmark for comparison to bridges without an HFO system In Year-2 this test was
also conducted on Bridge 9824 which is the counterpart for Bridge 9823 in Atkinson
MN Bridge 9824 does not have an HFO system it has a tined concrete bridge deck The
test was conducted on the bridge deck in two locations The first did not have any
distresses and resulted with a K value of 0 cms The second test was over an unsealed
101
crack in the bridge deck (Figure 73) with a resulting K value of 153x10-6 cms Some
Department of Transportation agencies have permeability criteria for asphalt pavements
with an acceptable range between 0 and 125x10-5 cms (Williams 2009) Table 20
displays the ranges discussed to provide a visual of the differences between the values
Table 20 Coefficient of Permeability Ranges for Different Paved Surfaces
Different Paved Surfaces Coefficient of Permeability (cms)
Acceptable Range for Asphalt pavement 0 to 125x10-5
Concrete with Crack (Br 9824) 0 to 153x10-6
HFO systems 0 to 439x10-7
Figure 73 Area of Bridge 9824 Tested for Permeability
HFO systems provide a much more impervious surface which is one of their design
benefits This impervious barrier helps to protect bridge decks from harmful deterioration
and corrosion from chloride penetration
The aggregates used for the Novachip systems were too large to allow a proper seal for
permeability testing A test was conducted on the shoulder where high abrasion had
reduced the macro texture During this test it appeared that a proper seal was achieved
102
and some water was permeating into the system After a short duration of time (one or
two minutes) water would percolate back to the surface from outside the diameter of the
testing apparatus This suggests that water may be infiltrating into the system and moving
laterally however it is impossible to say at what rate and how far into the system water is
able to infiltrate
Surface Friction Results
This section discusses the testing conducted on the surface of HFO systems Results of
testing provide skid numbers or the coefficient of friction for a given surface A
discussion of skid numbers is found above in Chapter 2
Surface Friction Using a Skid Trailer
A skid trailer provides surface friction values in the form of skid numbers which were
provided by MnDOT The bridge deck skid numbers are plotted against time in Figure
74 (ribbed tire) and Figure 75 (smooth tire) Figure 76 is the average skid numbers for
Bridge 14810 and is provided as an example in this section Some bridge decks were
reported to have too much friction to properly test This is represented in the plots with
year one skid numbers that are larger than 100 The ranges found for PCC pavements are
also in Figure 74 and Figure 75 They are labeled Turf Drag PCC and appear as an area
with cross-hatching It should be noted that the dashed portions of the lines in the
following figures indicate an approximation based on the available data
The SN values in Figure 74 and Figure 75 show that several HFO systems are still above
a SN of 50 several years after installation while others have fallen below 50 and into the
ldquopotential action segmentrdquo threshold
103
Figure 74 Average Ribbed Tire Skid Number over Time
In general the first year of service has a significantly larger loss compared to subsequent
years After this first year the slopes for the different bridges are approximately the same
This means the friction of all systems is degrading at a similar rate Abrasion is more
likely to occur with particles that have substantial angularity As the edges of angular
aggregates are rounded over time due to abrasion the rate at which they degrade
significantly decreases Aggregate particles not fully bonded with epoxy matrix may be
removed with relative ease The Novachip system (BR 27019) is the only bridge that did
not have a significant reduction in its skid number over the first year of service
Comparison to normal pavement skid numbers is possible by comparing these systems to
the skid numbers of Turf Drag PCC Of the eight bridges tested seven of them are above
the Turf Drag PCC range while the other bridge (Br 27019) is within the range However
0
10
20
30
40
50
60
70
80
90
100
1 2 3 4 5 6
Aver
age
Skid
Num
ber
Years in ServiceTurf Drag PCC 69006 9823
9066 9067 14809
14810 27758 27019
104
after three years five of the bridges are at or below the bottom of this range Interestingly
the Novachip system (Br 27019) is the only system inside the range at year one but is
one of the three bridges above the range after the third year The fact that these systems
approach this range within three to five years reveals that HFO systems only have
comparatively higher friction values for a short period of time in regions that rely heavily
on snow plows Severe winter conditions and maintenance common in Minnesota cause
abrasion that rapidly reduces the life of a high friction system This does not suggest that
systems are by any means unsafe but that skid numbers quickly become comparable to
that of a traditional bridge deck
Figure 75 Average Smooth Tire Skid Number over Time
0
10
20
30
40
50
60
70
80
90
100
1 2 3 4 5 6
Aver
age
Skid
Num
ber
Years in Service
Turf Drag PCC 9066 69006 9823 9067 14810
105
On the smooth tire plot some of the slopes have a positive slope This is evidence that the
smooth tire is sensitive to water film depth The large macrotexture in the epoxy systems
have the capacity to hold more water which may cause the variance in results The bridge
decks all stay above the range of Turf Drag PCC This suggests that the microtexture of
the epoxy systems are better than that of a PCC pavement
Bridge 14809 and 14810 (Barnesville MN) have skid numbers for the bridge deck before
and after the installation of the epoxy system in 2007 A major reason for the installation
of these epoxy systems is the improved friction in poor weather condition This
information is useful to analyze how long the HFO system provides a system with better
skid numbers higher than conditions without such a system Figure 76 is the average skid
numbers for Bridge 14810 As shown the skid numbers for the bridge deck before the
installation of the SafeLane epoxy system were 443 (ribbed) and 349 (smooth) The
latest test conducted on July 24 2012 resulted with skid numbers of 351 (ribbed) and
376 (smooth) In the five years since the placement of the system the bridge deck skid
numbers have reduced to skid numbers similar to a bridge deck without an HFO system
in place
106
Figure 76 Bridge 14810 (Barnesville MN) Average Skid Numbers
In Year-2 the skid numbers for Bridges 6437 (Osceola) 86013 (Otsego) and 86019
(Otsego) were provided (Figure 77) but there is not any previous data to compare with
The Poly-Carb systemsrsquo (9066 and 9067 I-94 Moorhead) skid numbers continue to
diminish The Novachip systemrsquos (Bridge 27019 TH 101 Otsego) skid numbers remained
the same from 2012 to 2013 The Novachip system is the only bridge that did not have a
significant reduction in its skid number over the first year of service and its skid numbers
reduce at a slower rate This is due in large to the fact that Novachip is asphalt based and
as explained previously has more elastic properties This elasticity preserves the systems
aggregates which in turn provides better friction values
0
10
20
30
40
50
60
70
80
90
100
2007 (Pre) 2007 (Post) 2008 2009 2010 2011 2012
Skid
Num
ber
Year Tested
Ribbed Tires Smooth Tires
107
Figure 77 Skid Number Comparison (2012 vs 2013)
Since 2011 the skid numbers for Bridge 27758 (Penn Ave in Minneapolis Transpo) have
increased from 487 to 547 (Figure 78) Originally the rise from 487 in 2011 to 504 in
2012 was written off as either an error in testing or testing a different section of the
bridge with better friction values However it is now evident with the continual increase
that it cannot be attributed to an error in the testing procedure
0
10
20
30
40
50
60
70
6437 9066 9067 27019 27758 86013 86019
Sk
id N
um
ber
2012 2013
108
Figure 78 Skid Numbers for Bridge 27758 (Penn Ave Minneapolis)
The HFO system placed on Bridge 27758 is very thin and as described earlier
(Observation Section) the system is being removed completely in thin strips exposing the
bridge deck As parts of the bridge deck are being exposed the mean texture depth (MTD)
is actually increasing In an area of the system that is not distressed the MTD is from the
top of the aggregate layer to where the aggregates are embedded into the epoxy In a
distressed are the MTD is from the top of the aggregates to the top of the concrete deck
Since the removed areas are small relative to contact area of a tire the distress is actually
increasing the MTD and improving the skid number of the system This is illustrated in
Figure 79
0
10
20
30
40
50
60
70
2010 2011 2012 2013
Skid
Num
ber
Year
109
Figure 79 Distresses Helping to Increase the MTD and Skid Numbers on Bridge 27758
Surface Friction Using a Dynamic Friction Tester
The surface friction values are provided by the Dynamic Friction Tester (DFT) as the
coefficient of friction Each test conducted generated a report with values for the
coefficient of friction at 0 20 40 60 and 80 kmh (0 124 249 373 497 mph) as well
as a chart graphing the coefficient of friction throughout the duration of the test (Figure
80)
110
Figure 80 Coefficient of Friction throughout Duration of DFT Testing
Below are the average values for the coefficient of friction at 60 kmh for the wheel and
non-wheel path of each bridge (Figure 81) For Bridge 14809 (WB I-94 Barnesville
SafeLane) data for the passing lane was lost in the field The passing lane for Bridge
9823 (SB I-35 in Atkinson Poly-Carb) was not tested In general the wheel path has
lower friction values compared to the non-wheel path On average there is a 17
difference between the wheel and non-wheel path Also the driving lane has lower
friction values compared to the passing lane with an average difference of 10 The
trends match up with the mean texture depth (MTD) trends discussed earlier Higher
abrasion (in the wheel path compared to the non-wheel path and the driving lane
compared to the passing lane) reduces the MTD a reduction in the texture results in a
reduction of friction This correlation will be studied more and expanded upon in the
upcoming final report
There is very little difference between the driving and passing lane values for Bridge
9066 (WB I-94 in Moorhead Poly-Carb) which matches the visual observation that this
bridge was heavily worn with a lot of aggregate polishing present Both the driving lane
111
wheel and non-wheel path values are lower than any values in the passing lane on Bridge
9823 (SB I-35 in Atkinson Poly-Carb) This bridge has a negative grade and curves
horizontally to the right When a snowplow drives over this particular geometry the
snowplowrsquos blade places a lot of pressure on the right side of the bridge
Figure 81 Average Coefficient of Friction at 60 kmh for Wheel and Non-Wheel Paths
Results from Dynamic Friction Tester Results
Comparison of Dynamic Friction Tester and Skid Trailer Values
Since the skid numbers found using the skid trailer are the coefficient of friction
multiplied by 100 dividing the SN values by 100 allows for the comparison between the
DFT and skid trailer values Below in Figure 82 the coefficient of friction from both the
skid trailer and DFT are plotted It should be noted that the skid trailer testing is
0000
0100
0200
0300
0400
0500
0600
0700
0800
6347 9066 9067 9823 14809 14810 27019 27758 69006 86013
Co
effi
cien
t o
f F
rict
ion
Driving Lane Wheel Path Driving Lane Non-Wheel Path
Passing Lane Wheel Path Passing Lane Non-Wheel Path
112
conducted at 30 mph (482 kmh) and the DFT plots values at 249 mph (40 kmh) and
373 mph (60 kmh)
Figure 82 Comparison of Coefficient of Friction Found using the Skid Trailer and DFT
For most of the bridges the coefficient of friction found using the skid trailer and the DFT
are similar The values vary the most in Bridges 6347 14809 14810 and 27019 Bridges
14809 (SafeLane) 14810 (SafeLane) and 27019 (Novachip) have HFO systems that use
larger aggregates This larger macrotexture may prevent the skid trailer from properly
testing the surface The larger aggregates sit higher out of the epoxy or asphalt they are
embedded in When a wheel drives across the surface it is only in contact with the tops of
the aggregate This reduced area requires less horizontal force and thus produces lower
coefficients of friction Bridge 6347 (Transpo) as previously discussed had excess epoxy
placed during construction and thus has smooth spots A DFT test was run specifically on
a smooth location resulting in a coefficient of 058 (40 kmh) and 059 (60kmh) which
0
01
02
03
04
05
06
07
08
6347 9066 9067 9823 14809 14810 27019 27758 69006 86013
Co
effi
cien
t o
f F
rict
ion
SN100 (2014) SN100 (2013) SN100 (2012) Cf (60kmh) Cf (40 kmh)
SN100 are results of skid trailer testsCf are results of DFT tests
113
are significantly lower than the average DFT values for these speeds Thus when a skid
trailer is run over a longitudinal section of the roadway to obtain the coefficient of
friction it combines these smooth areas and normal areas resulting in a reduced
coefficient of friction
Overall the DFT and skid trailer tests provide similar surface friction values It is
recommended that DFT testing becomes a more prevalent test method because of the
benefits it provides compared to the skid trailer It allows for multiple tests run in the
same location providing higher precision It also eliminates error that may interfere with
test results such as bouncing lateral movement improper water spray film thickness or
incorrect speeds of the skid trailer which must be in motion for its testing procedure The
fact that testing is done in a static location for DFT testing provides the opportunity to
test more accurately in wheel and non-wheel paths It also provides the opportunity to test
specific distressed areas to compare with non-distressed areas
Comparison of the Coefficient of Friction to the Age of an HFO System
The coefficient of friction results from DFT testing were compared against the number of
years each system has been in service (Figure 83) This comparison will provide
information about the retention of surface friction over time Similar comparisons were
made above mapping the skid numbers of systems over time however with only one year
of DFT data this is not possible
114
Figure 83 Coefficient of Friction versus the Number of Years in Service
As shown by this data the different epoxy systems reach the coefficient of friction of 05
(equivalent of a 50 SN value) between the third and seventh year of service The
Novachip system however averaged 065 after six years in service Novachip systems are
able to maintain a higher coefficient of friction for a longer time period compared to
epoxy systems This is due to the fact that aggregate raveling is not a common distress
with Novachip systems and they are able to retain their aggregates
Comparison of the Coefficient of Friction to the Mean Texture Depth
The coefficient of friction results from DFT testing were compared with the mean texture
depth (MTD) results from the sand patch testing The comparison shows that as MTD
increases so does the coefficient of friction (Figure 84)
0000
0100
0200
0300
0400
0500
0600
0700
0800
0 1 2 3 4 5 6 7 8
Co
effi
cien
t o
f F
rict
ion
Number of Years in Service
Transpo Poly-Carb SafeLane Novachip
115
Figure 84 Trends between the Mean Texture Depth and Coefficient of Friction for the
Different HFO Systems
The rate at which the coefficient of friction increases can be broken into two different
groups The first group is Poly-Carb and Transpo systems which both use 0187 inch [5
mm] aggregates The second group includes SafeLane and Novachip which use 0375
inch [95 mm] aggregates The smaller aggregate grouprsquos coefficient of friction increases
more rapidly compared to the second group This suggests that smaller aggregates have a
higher ability to create a frictional surface compared to larger aggregates If aggregates
become too large the majority of frictional properties will come from the aggregatersquos
microtexture whereas tightly grouped aggregates of a smaller size provide frictional
properties based off of their macrotexture Based on this it is recommended that HFO
systems use aggregates under 0375 inches [95 mm] in their system in order to utilize the
macrotexture of aggregates for frictional properties
y = 33953x + 03739y = 19427x - 00631
y = 21396x - 00973y = 11365x + 00323
0
01
02
03
04
05
06
07
08
0 001 002 003 004 005 006 007
Co
effi
cien
t o
f Fr
icti
on
Mean Texture Depth (in)
SafeLane Poly-Carb Transpo Novachip
Linear (SafeLane) Linear (Poly-Carb) Linear (Transpo) Linear (Novachip)
116
Chloride Ion Penetration Results
The following section provides results of the chloride ion content testing conducted by
MnDOT as well as an analysis of the data Tables containing the chloride content data are
provided in the Appendix The average chloride content for Bridge 9823 and Bridge
69006 are below in Figure 86 through Figure 89 The figures are separated into driving
and passing lanes for each bridge It is important to note that the chloride content lower
limit at which corrosion can occur (discussed above) is also shown on the following
plots Data points to the left of this lower limit are in the range of possible corrosion The
lines between data points are dashed because there is not a linear correlation between two
different depths For instance the average chloride content at a depth of three inches
below the surface shown on the graph is the average content found in cross section of the
cores cut between two and three inches below the surface
Below in Figure 85 the data from Bridge 9823 in 2011 is displayed All six cores taken as
samples are displayed with a solid line while the averages for each lane are shown in
dashed lines The purpose of this figure is to illustrate the deviation between different
samples Depending on the sample location chloride content can vary upwards of 3000
ppm highlighting one of the downsides of this testing Although the test method is
reliable the sample size is small and localized relative to the surface of the bridge deck
117
Figure 85 Driving Lane Chloride Content in parts per million during 2011 (Bridge 9823)
0
05
1
15
2
25
3
35
4
010002000300040005000600070008000
Dep
th B
elo
w D
eck S
urf
ace
(in)
Chloride Content (ppm)
Occurance of Corrosion Lower Limit 2011 Driving Lane Average
2011 Passing Lane Average Driving Lane Core 1
Driving Lane Core 2 Driving Lane Core 3
Passing Lane Core 1 Passing Lane Core 2
Passing Lane Core 3
118
Figure 86 Driving Lane Average Chloride Content in parts per million (Bridge 9823)
0
1
2
3
4
5
6
01000200030004000500060007000
Dep
th B
elo
w D
eck S
urf
ace
(in)
Chloride Content (ppm)
2011 2014 Corrosion Occurrence Lower Limit
119
Figure 87 Passing Lane Average Chloride Content in parts per million (Bridge 9823)
0
1
2
3
4
5
6
0100020003000400050006000
Dep
th B
elo
w D
eck S
urf
ace
(in)
Chloride Content (ppm)
2011 2014 Corrosion Occurrence Lower Limit
120
Figure 88 Driving Lane Average Chloride Content in parts per million (Bridge 69006)
0
1
2
3
4
5
6
0500100015002000250030003500400045005000
Dep
th B
elo
w D
eck S
urf
ace
(in)
Chloride Content (ppm)
2010 2011 2014 Corrosion Occurrence Lower Limit
121
Figure 89 Passing Lane Average Chloride Content in parts per million (Bridge 69006)
In large the chloride content at similar depths remains relatively constant or decreases
throughout the various years of testing This trend is true for the driving lanes of both
bridges as well as the passing lane of Bridge 9823 For example the chloride content for
the driving lane of Bridge 69006 at a depth of two inches remains around 2500 ppm
while at three inches it drops from around 1200 ppm in 2010 to near 650 ppm in 2014 It
should be noted that all testing was conducted after the HFO systems were installed
however the bridge decks were constructed years before the installation of an HFO
system Therefore it is reasonable to assume that the chloride content found in these
samples penetrated the bridge deck before the installation of an HFO system
0
1
2
3
4
5
6
0100020003000400050006000
Dep
th B
elo
w D
eck S
urf
ace
(in)
Chloride Content (ppm)
2010 2011 2014 Corrosion Occurrence Lower Limit
122
This trend does not occur in the passing lane of Bridge 69006 (Figure 89) In this lane
the chloride content at a depth of two inches increased from 1700 ppm in 2010 to 4100
ppm in 2014 and this increasing trend occurs along all depths on this lane The reason for
this is that the sample taken in 2014 must have been cored at or near a distress in the
HFO system where the systemrsquos impermeability properties have been compromised
Distresses that compromise the systemrsquos properties include delamination cracking or
removal of the system due to snow plow abrasion When compromising distresses occur
they provide an environment that allows for the infiltration of chloride ions into the
bridge deck
The trends described above prove that when properly placed and when compromising
distresses have not occurred HFO systems have the ability to protect infrastructure from
chloride ion penetration However distresses of the system such as delamination
abrasion or cracking mitigate this protection in a localized area near the distress It is
also important to note that these systems do not help to reduce the amount of chloride
ions that had penetrated into the concrete bridge deck prior to the installation of an HFO
system
Based on the field observations conducted of the fourteen bridges in this study
Two bridges had delaminated HFO systems (Br 4190 and 9036 both Poly-Carb)
Three bridges had cracks in the HFO systems (Br 27019 86013 and 86019 - all
Novachip)
One bridge had delamination an cracking (Br 6347 Transpo)
One bridge had cracking and complete removal of system sections due to
abrasion (Br 27758 Transpo)
Thus fifty percent of the bridges in this study have compromised systems where water
and chloride ions are able to penetrate into the bridge deck The harsh winter conditions
and maintenance practices performed in Minnesota facilitate the distress of HFO systems
in such a way that the systemrsquos ability to protect bridge decks from chloride ion
penetration can be compromised near such distresses
123
Field Observations and Testing Summary
In this task a number of field tests and observations have been conducted to gain
perspective on the performance of bridge decks with epoxy system overlays This task
not only evaluated how the systems have been performing but also provided information
regarding changes in year-to-year performance by comparing results from Year-1 to
Year-2 The main concern for the wear courses assessed through testing include (1)
retention of aggregate particles (2) degradation and polishing of aggregate particles due
to the actions of traffic loading and snow plow abrasion (3) frictional characteristics of
the wear courses (4) deck sealing capabilities and (5) durability of aggregate under
repeated freezing and thawing conditions
The HFO systems visited are performing at varying states of satisfaction The three
distresses (1) aggregate raveling (2) abrasion and (3) polishing are apparent on all
bridges Severe winter conditions and maintenance common in Minnesota appear to
cause abrasion that rapidly reduces the life of a high friction overlay system
Several conclusions can be drawn about the skid numbers and abrasion when results are
compared to other pavement types
Novachip systems perform better in regards to abrasion The viscoelastic response
of asphalt allows for the continual embedment of aggregates into the matrix which
helps to reduce the amount of aggregate loss
Novachip systems have a superior aggregate retention which results in an ability
to maintain higher friction values
Novachip systems have the lowest performance in the torque bond test because of
asphaltrsquos inferior tensile strength compared to epoxy
Novachip systems appear to have some permeability into the system However the
large aggregate on the surface prevent an adequate seal for testing equipment
Therefore it is not possible to determine the rate of permeability and how deep
water is able to penetrate
Poly-Carb systems had the fewest sample removals during torque testing
124
Significant abrasion especially in the non-wheel path occurred on the Poly-Carb
and SafeLane bridges when comparing their MTD values from 2013 to 2014
Dynamic Friction Testing was conducted in order to acquire friction values
specific to the wheel and non-wheel path The coefficient of friction results are
comparable with skid numbers however DFT testing is able to reduce some
uncertainties associated with skid testing
The two Transpo systems vary heavily from each other The system in Osceola
(Br 6347) is a more complete system (thicker system larger aggregates less
distresses) The system in Minneapolis (Br 27758) is very worn down with the
bridge deck exposed across a significant portion of the bridge
The combination of water presence under a bridge and poor expansion joints may
play a role in the delamination of epoxy systems from a bridge deck due to
moisture presence and expansioncontraction of the bridge deck
Correlations between skid numbers (skid trailer) and coefficient of friction
(dynamic friction tester) exist Both tests provide similar results DFT testing is
preferred because of its localized testing ability and its reduction in errors due to
testing in a moving vehicle
Higher friction values are achieved faster while increasing the mean texture depth
(MTD) through the use of smaller aggregates (0187 NMAS compared to 0375
NMAS)
When properly placed and when compromising distresses have not occurred
HFO systems have the ability to protect infrastructure from chloride ion
penetration
When distresses such as delamination cracking or removal of the HFO system
occur the HFO systemrsquos ability to protect the infrastructure from chloride ion
penetration can be compromised Once compromised chloride ion penetration
will occur in local areas of the bridge deck near the distresses Based on field
observations from other parts in this study fifty percent of the bridges being
researched have such compromising distresses in their HFO systems
125
Chapter 5 Crash Data Analysis
This section analyzed crash data to evaluate the effectiveness of high friction overlays in
reducing crashes This study was completed by analyzing ten years of data for nine
bridges encompassing four different proprietary overlay systems Within one of the
overlay systems three different aggregate types were also compared Crash
characteristics analyzed included the crash time weather conditions bridge surface
conditions average daily traffic (ADT) and severity of crashes
The analysis of data suggests that although there is a decreasing trend in overall crashes
a reduction in crashes on bridges cannot be completely attributed to the use of high
friction overlays The presence of high friction overlays may be unable to play a role in
winter crash prevention
Causes of Crashes in Minnesota
In order to reduce the number of crashes occurring on a roadway a transportation agency
must first identify what is causing the crashes The following is a summary of why
crashes in Minnesota are occurring Data was taken from the Minnesota Motor Vehicle
Crash Facts 2013 Report This report is published annually by the Minnesota Department
of Public Safety About one-third of all crashes are single vehicle accidents For single-
vehicle accidents illegal or unsafe speed is the most common cause followed by
inattentive or distracted driving In the multi-vehicle accidents that account for the other
two-thirds of total accidents inattention or distraction is the most common cause (MN
Department of Safety 2014)
In 2013 77707 crashes were reported to Public Safety in Minnesota This was an
increase of 109 from 2012 Deaths were reduced by 20 from 2012 with 387
occurring in 2013 It should be noted that 2013 displayed harsh winter conditions above
the statersquos average Although not stated by MnDOT or any other organizations this study
attributes the harsh winter conditions for the increase in crash rates between 2012 and
2013 The number of crashes occurring in 2013 was the highest number of annual crashes
126
to occur in Minnesota since 2008 When looking at longer trends of crash rates in
Minnesota the number of crashes occurring each year generally decrease The number of
crashes occurring in the state is down from 94048 in 2003 to 69236 in 2012 (MnDOT
2013)
This decreasing trend is occurring both in overall crashes as well as critical emphasis
areas identified by state agencies Critical emphasis areas are crash specific
characteristics that are used to help identify specific ways to reduce crashes These areas
are based on guidelines set by the Strategic Highway Safety Plan (SHSP) created by the
Federal Highway Association (FHWA) The SHSP recommends that states should
identify between four and eight emphasis areas to help direct efforts and make a more
ldquostrategicrdquo and effective plan for improving safety (FHWA 2013) The Minnesota
emphasis areas listed in
127
Table 21 and were identified by state agencies based on an analysis of safety data
(MnDOT 2014B) This decreasing trend provides proof that the increase in education
engineering enforcement and emergency medical and trauma services through the
Towards Zero Deaths program is helping to provide safer driving conditions
128
Table 21 Percent Change of Crash Emphasis Areas
Emphasis Area Percent Change
2003 to 2012
Percent Change
2008 to 2012
All Fatal amp Serious
Injuries -51 -17
Unbelted -66 -30
Impaired -41 -13
Speed -67 -35
Inattention -64 -24
Lane Departure -46 -16
Intersection -57 -21
Older Driver -39 -90
Young Driver -69 -38
Commercial Vehicles -42 -14
According to the National Highway Traffic Safety Administration the causation of a
crash is attributed to the driver 94 of the time the other 6 is evenly distributed
between the vehicles environment and other unknown reasons (USDOT 2015) While
the vast majority of crashes occur due to human error the elimination of poor roadway
conditions through engineering and proper maintenance can assist in a reduction of
crashes Since HFO systems are designed to create higher friction surfaces that help to
reduce crash rates this study focuses on crash characteristics pertaining to the surface
conditions
Data Collection
In total nine bridges in six different locations were included in the crash reduction study
The two bridges excluded from the crash data analysis were Bridges 27758 and 86019
Bridge 27758 (Penn Ave Poly-Carb) was excluded because only one accident was
reported in this section during the ten years of provided data The event occurred after the
129
epoxy overlay installation however it occurred with clear and dry conditions during rush
hour and therefore it can be assumed this accident was caused from extraneous factors
that the overlay surface could not prevent
Bridge 86019 [Novachip] is a southbound ramp that connects traffic from CASH 36 to
TH 101 in Otsego MN The bridge crosses over Crow River During the ten years of data
provided there were no reported accidents
The following comparison of crashes and certain site conditions between the nine bridges
used data from the Public Safety Database provided by MnDOT The study compared
eleven years of data from 2003 through 2013 This data provides information from both
before and after installation of the HFO systems The installation dates for these systems
vary between 2007 and 2010 When the data was procured for bridges in the Metro
district (Bridges 6347 27019 and 86013) the data from 2003 was incomplete and was
therefore omitted from the analysis For the same three bridges the data for 2013 extends
through May while the six bridges from other districts have data through December of
2013 Finally it should also be noted that Bridge 6347 crosses the St Croix River
connecting Minnesota and Wisconsin For this study only data for the Minnesota half of
the bridge was provided and analyzed
Analytical Comparison
In this analysis a total of 293 crashes were included for the nine bridges The public
safety database provides an abundance of information pertaining to each crash however
not every factor provided a useful comparison for this report Several aspects of the
crashes were investigated including
Total number of crashes
Bridge deck surface condition
Weather
Before and after HFO system installation
Average Daily Traffic (ADT)
130
It is important to note that for some of the bridges in this study the total number of
crashes is very small analysis for some of these bridges may appear skewed due to the
small sample size This skewing must be noted when comparing different statistics in
percentages and is especially true for Bridge 86013 [Novachip] and Bridge 6347
[Transpo] where only two and four crashes occurred respectively during the ten year time
span
Cause of Crashes
Of the 293 crashes occurring on the nine bridges 40 did not list a contributing factor For
the remaining 253 crashes the following are the top five contributing factors listed with
their percentage of occurrences
1 Illegal or unsafe speed 37
2 No clear factor 23
3 Following too closely 8
4 InattentiveDistracted Driving 8
5 Weather 7
A second factor was listed in about half of the crashes with the top four secondary factors
including weather (30) inattentivedistracted driving (15) skidding (11) and
illegal or unsafe speed (10) While a majority of accidents are attributed to human
error weather and surface conditions of the bridges exacerbate conditions in which
speeding or distracted driving may result in a crash This data reinforces the focus on
crash characteristics pertaining to the surface conditions for bridges with an HFO system
installed
Another factor that may lead to crashes occurring includes the physical factors of a
roadway including geometry elevation and traffic levels on the bridge Geometry and
elevation of the bridges were not covered in the scope of this research A strong
correlation exists when comparing the total number of crashes occurring to the Average
Daily Traffic (ADT) As shown below in Figure 90 as the ADT increases so does the
number of crashes This is a fairly intuitive result however it helps to illustrate that many
131
factors other than the friction values of the bridge surface cause a crash As ADT
increases the proximity of vehicles increases and driving tendencies may change with
other vehicles present on the bridge
Figure 90 Total Crashes Compared to the ADT
Severity of Crashes
The Public Safety Database has the severity of a crash broken down into five different
categories These categories are based on bodily injury caused by the crash ranging from
no apparent injury to fatality The majority of crashes (76) did not result in any injury
Two separate crashes occurred on westbound I-94 in Barnesville (Bridge 14809
[SafeLane]) that resulted in a fatality A fatal crash occurred both before and after the
HFO system was installed
Rsup2 = 08274
0
10
20
30
40
50
60
70
80
90
100
0 5000 10000 15000 20000 25000 30000 35000
To
tal
Cra
shes
(2
00
3-2
01
3)
Average Daily Traffic (in vehicles)
132
Time of Crashes
A majority (75) of the crashes occurred during the winter months (October-March)
This is expected because of poor driving conditions and roadway surfaces due to
inclement weather and the presence of water snow and ice on roadways HFO systems
were designed to improve roadway conditions during this time of poor weather The main
way these systems were designed to improve roadway conditions is through their coarse
macrotexture created from aggregates with a high microtexture Both microtexture and
macrotexture are important to improving friction values
Surface Conditions
The surface conditions that were present during crashes are provided in
Table 22 Dry and ice packed snow conditions were by far the two most common surface
conditions at 37 and 39 respectively It should be noted that a large percentage of
crashes occur on a dry surface due to the fact that roadways are dry for a majority of
days
Table 22 Surface Conditions during all Crashes
Surface Condition Percent of
Crashes ()
Dry 37
Ice Packed Snow 39
Slush 3
Snow 9
Wet 7
Other 5
Ice packed snow conditions are at the opposite end of the spectrum compared to dry
conditions While ice and snow produces slippery conditions on roadways it also reduces
the effectiveness of the macrotexture found in HFO systems As snow falls onto the
bridge surface snow and ice are packed into the macrotexture by traffic loads crossing the
133
bridge The snow and ice fill the voids between individual aggregate particles reducing
the friction available from a system (Figure 91)
Figure 91 Accumulation of Packed Ice and Snow due to Traffic Loads
With the assumption that HFO systems have a greatly reduced effectiveness during ice
packed snow conditions and their purpose is not to prevent crashes during dry
conditions it can be concluded that 76 of the crashes occurred with surface conditions
during which high friction systems are covered and therefore are not effective
A total of 55 of these crashes occurred when the weather was either clear or cloudy
This means that half of the crashes with this surface condition occurred during a time
when inclement weather was not present Such a high percentage presents the conclusion
that many of the crashes occurred directly as a result of the surface containing ice packed
snow Thus the removal of ice packed snow surface conditions would help to reduce the
Clear
Conditions
Snowfall and
Accumulation
Packed Ice and
Snow
134
number of crashes on bridge decks Several methods currently exist to reduce this
condition including automated deicing systems
The two bridges in Moorhead Bridges 9066 and 9067 [Poly-Carb Flint] have an
automated deicing system in place Such a system uses sensors embedded in the bridge
deck to detect potential freezing conditions When these conditions occur the deicing
chemicals are sprayed onto the bridge deck using an embedded application system The
main purpose of such a system is to prevent ice buildup on bridge decks This is different
than traditional deicing techniques such as salt which are used to break down ice that has
already formed on the surface Even with a deicing system in place 34 of the 73 (47)
crashes on Bridge 9066 and 15 of the 90 (17) of the crashes on Bridge 9067 occurred
with ice packed snow surface conditions For this report there is no information regarding
these deicing systems effectively preventing any conclusions from being drawn Several
factors may account for ice packed snow conditions occurring even with these systems
present including (1) when the system was installed (2) performance of systems (3)
maintenance required and (4) if the system was not functioning during winter months
Looking further into crashes with ice packed snow surface conditions and better methods
to effectively remove such conditions could help to further reduce the number of crashes
occurring on bridges in cold climates
Crashes Before and After HFO System Installation
One of the most important aspects to analyze performance of HFO systems is the crash
rates before and after the installation of such a system The following provides such a
comparison In general the average number of crashes annually decreases after
installation The average number of crashes on the bridges was reduced from 352 crashes
per year before an HFO system to 260 crashes per year In other words an annual
reduction of nearly one crash per bridge per year Several factors including severity of
crashes and surface condition were analyzed to verify whether systems with a higher
friction bridge surface provide a safer bridge deck
135
Severity Before and After
The comparison of crash severity is broken down into the five different categories based
on bodily injury Overall the distribution of injury did not change with the installation of
an HFO system (Figure 92) The number of crashes without injury was the largest
category to increase at 54 from 712 to 766 It does not appear that HFO systems
play a role in decreasing the severity of a crash that occurs on such a surface
Figure 92 Severity of crashes before and after installation of an HFO system
Surface Conditions Before and After
The following provides a comparison of the surface conditions when crashes occurred
both before and after installation (Figure 93) The solid bars on the plot represent crashes
before installation while the bars with cross hatching are crashes after the installation of
overlays It should be noted that the ldquocombinedrdquo bars are a conglomerate of wet slush
0
10
20
30
40
50
60
70
80
90
100
Per
centa
ge
Out
of
To
tal
Cra
shs
Before After
136
and snow surface conditions In general the annual number of crashes that occurred
during the ldquocombinedrdquo and ldquoice packed snowrdquo conditions decreased On average the
ldquocombinedrdquo crashes were reduced by 03 crashes per year The ldquoice packed snowrdquo
condition crashes were reduced on average by 08 crashes per year The average number
of crashes per year on dry surfaces remained constant for most bridges Before
installation the average number of crashes on Bridge 9067 (Poly-Carb Flint) was 36
crashes per year and doubled to 74 crashes per year after the installation of the HFO
system There are not any factors about the crashes or bridge that provide information as
to why this rate increased
Figure 93 Average number of crashes annually per surface condition before and after
installation of HFO systems
0
1
2
3
4
5
6
7
8
6347 9066 9067 9823 14809 14810 27019 69006 86013
Annual
Num
ber
of
Cra
shes
Dry Before Installation Dry After InstallationIce Packed Snow Before Installation Ice Packed Snow After InstallationCombined Before Installation Combined After Installation
137
Normalized to Traffic Levels Before and After
The traffic levels of a roadway can also play a large role in the amount of crashes that
occur The average number of crashes that occurred was normalized to the average daily
traffic (ADT) The general trend is once the HFO system was installed the number of
crashes per million vehicles was reduced However the amount at which they were
reduced is not that significant On average after a system was installed the crash rate
dropped by 03 crashes per million vehicles crossing This translates to a reduction of
about 1 or 2 vehicles per year The bridge with the best performance was Bridge 27019
[Novachip] with a reduction of 58 crashes per year There were eighteen crashes that
occurred during the five years before installation of an HFO system In the five years
after installation there was only one recorded crash This bridge shows the largest
reduction of crashes analyzed in this study
Comparison of Year-1 and Year-2 Crashes
The following is a comparison of the number of crashes that occurred during the first and
second year of this study The years 2012 (before the study) 2013 (Year 1) and 2014
(Year 2) are compared below in Figure 94 The total number of crashes to occur on the
nine bridges analyzed in this comparison are tallied below in Table 23
Table 23 Total Number of Crashes to Occur (2012- Oct 2014)
Year Total Number
of Crashes
2012 13
2013 37
2014 14
138
The number of crashes that occurred in the first year of this study (2013) was nearly triple
the number of crashes to occur during the previous year Through the first ten months of
year two more crashes had occurred than in 2012 This number is expected to increase as
November and December are two of the top three months in regard to this studyrsquos crash
rates It should be noted that Minnesota experienced an abnormally harsh winter season
from during the 2013-2014 winter season and this plays an important role in the increase
of crashes during this study From October 2013 to March 2014 30 of the 51 crashes in
this two year study occurred Thus 59 of the crashes occurred during a 27 span of the
total study time
The crashes that occurred on each bridge are broken down in the summer (April to
September) and winter (October to March) months (Figure 94) In the first year of this
study every bridge had a winter-time crash and number of crashes to occur in the winter
were the either the same or higher than in the year 2012
There was also a total of nine summer time crashes in 2013 compared to five that
occurred in 2012 Through the first ten months of 2014 three summer crashes have
occurred
139
Figure 94 Number of Crashes on Each Bridge during Summer (April-September) and
Winter (October-March) Months
The harsh winter season from 2013 to 2014 is also shown with the large amount of ice
packed snow conditions present during crashes in 2013 and 2014 Forty-nine percent of
the crashes that occurred during 2013 and 62 of the crashes in 2014 had ice packed
snow surface conditions present (Figure 95) Ice packed snow surface conditions mitigate
the effectiveness of the high friction values found on HFO systems
0
1
2
3
4
5
6
7
6347 9067 9066 9823 14809 14810 27019 69006 86013
Num
ber
of
Cra
shes
per
Yea
r
Summer (2012) Summer (2013) Summer (2014) Winter (2012) Winter (2013) Winter (2014)
140
Figure 95 Surface Conditions Present during Crashes in from 2012 to 2014
The comparison of crashes that occurred during the two years of this study reinforce the
need to reduce the ice packed snow condition from bridge decks An HFO system is not
an effective way of removing such a condition reducing the value of such a system in
Minnesota and cold climate regions
Comparison of Different HFO Systems
As discussed previously in the Scope of Analysis section there are several differences
between every bridge in this study These variables can lead to certain systems to
comparatively perform better than other systems The main variables that may cause
differences in performance are the types of systems and the types of aggregates thus a
comparison between the four HFO systems may detect whether any particular system is
0
2
4
6
8
10
12
14
16
18
20
Dry Ice Packed Snow Combined
Num
ber
of
Cra
shes
per
Yea
r
2012 2013 2014
141
performing better than the others A similar comparison of the four Poly-Carb bridges is
also made in order to compare the influence of different types of aggregates
Comparing the Four Different Proprietary HFO Systems
In order to compare the different types of systems the crash data was averaged from the
bridges for each system listed below
Poly-Carb (Bridges 9066 9067 9823 and 69006)
SafeLane (Bridges 14809 and 14810)
Transpo (Bridge 6347)
Novachip (Bridges 27019 and 86013)
The four different systems were compared using the present surface conditions during
crashes (Figure 96) Poly-Carb SafeLane and Novachip systems showed a significant
decrease in crashes during ldquoice packed snowrdquo and ldquocombinedrdquo conditions With crash
reductions ranging from 35 to 100 for the different combinations of systems and
surface conditions A similar amount of crashes occurred both before and after
installation of a Transpo system
142
Figure 96 Comparing the average number of crashes annually per surface conditions
before and after installation of different HFO systems
Comparing the amount of crashes occurring before and after installation of the different
systems normalized to traffic crossing the bridges reveals similar conclusions as
previously mentioned in the section Normalized to Traffic Loads Before and After An
average reduction of 03 crashes per million vehicles which translates into 1 or 2 vehicles
per bridge per year occurs after the installation of a system This is shown graphically
below in Figure 97 SafeLane and Novachip systems have the largest reductions
normalized to traffic (53 and 88 respectively) Poly-Carb had a reduction of 27
while the average number of crashes on the Transpo systems doubled after installation
0
05
1
15
2
25
3
Poly-Carb SafeLane Transpo T-48 NovaChip
Annual
Aver
age
Num
ber
of
Acc
iden
ts
Dry Before Installation Dry After Installation
Ice Packed Snow Before Installation Ice Packed Snow After Installation
Combined Before Installation Combined After Installation
143
Figure 97 Number of crashes per million vehicles crossing bridge before and after
installation of different HFO systems
Based on the comparisons made in Figure 96 and Figure 97 the Novachip systems appear
to have the best performance followed closely by SafeLane and Poly-Carb systems
0
01
02
03
04
05
06
07
08
09
1
Poly-Carb SafeLane Transpo NovaChip
Num
ber
of
Cra
shes
per
Mil
lio
n V
ehic
les
Before Installation After Installation
144
Comparison of Poly-Carb Systems Using Different Aggregates
The two comparisons discussed in the previous section were also conducted for the
different aggregates used within Poly-Carb systems Three different aggregates are used
by the systems in this study
Taconite on Bridge 69006 in Virginia MN
Flint on Bridge 9066 and 9067 in Moorhead MN
Basalt on Bridge 9823 in Atkinson MN
A comparison of crashes occurring during certain surface conditions before and after
installation is shown below in Figure 98 The two most significant themes are (1) the
taconite system had a large decrease in the amount of crashes occurring with ice packed
snow surface conditions and (2) the number of crashes with dry surface conditions
doubled for flint systems
145
Figure 98 Comparing the average number of crashes annually per surface condition
before and after installation of Poly-Carb systems with different aggregates
When comparing the Poly-Carb systems to one another normalized to traffic the number
of crashes per million vehicles is reduced by 47 and 38 for Taconite and Basalt
respectively However there is not a significant reduction in crashes with the installation
of a system using flint aggregates (2) Based on the comparisons made in Figure 98 it
appears that taconite is the best performing aggregate in terms of crashes of the Poly-
Carb systems
Comparison of Side by Side Bridges with and without HFO System Overlays
Several locations in this study allow side by side comparison of bridge decks with and
without HFO systems Three different bridges in the study carry one direction of traffic
with an HFO system while a counterpart bridge carries the other direction of traffic
without Details for these bridges are provided in Table 24
0
1
2
3
4
5
6
Taconite Flint Basalt
Annual
Aver
age
Num
ber
of
Cra
shes
Dry Before Installation Dry After InstallationIce Packed Snow Before Installation Ice Packed Snow After InstallationCombined Before Installation Combined After Installation
Solid Bars Crashes before installation of HFO systems
Crosshatched Bars Crashes after installation of HFO systems
146
Table 24 Details of Bridges in Side by Side Comparison
Location
Bridge
with
HFO
system
Bridge
without
HFO
System
HFO
Type
Aggregate
Type
Atkinson 9823 9824 Poly-Carb Basalt
Otsego 27019 27020 Novachip NA
Virginia 69006 69005 Poly-Carb Taconite
In Figure 99 the bridges without HFO systems are denoted with bars that have horizontal
hatch patterns The ldquoafter installationrdquo refers to the installation of a single system for each
location in order to compare a bridge with and without a system For example Bridge
69006 had an HFO system installed in 2009 thus the ldquoafter installationrdquo for both Bridge
69005 and 69006 is from 2010 through 2013 despite a system not actually being installed
on Bridge 69005
Previous research has looked at crashes occurring before and after the installation of an
HFO system The results provided the perceived benefit of crash reduction however this
perceived benefit occurs on bridges without an HFO installation As shown in Figure 99
the average number of crashes occurring on a bridge deck is reduced regardless of
whether or not an HFO system was installed and at about the same rate for each location
While crash rates are decreasing on bridges with an HFO system this reduction cannot be
solely attributed to the installation of such a system
147
Figure 99 Side by side comparison of average number of crashes annually before and
after the installation of HFO systems
Comparison of Crashes Normalized to Total Crashes in Minnesota
Using data from the Minnesota Vehicle Crash Facts Reports for the years 2004 through
2012 the crashes for each bridge location were normalized to the total crashes occurring
in the state The percentages of crashes occurring on each bridge both before and after the
installation of an HFO system are compared in Figure 100 For example on average
007 of crashes in Minnesota occurred annually on Bridge 9067 [Poly-Carb Flint]
while only 003 of crashes in Minnesota occurred on that bridge after the installation of
an HFO system Interestingly the bridges discussed earlier without HFO systems also saw
a drop in the average percentage of Minnesotarsquos crashes On average bridges with an
HFO system saw a drop of 0021 while bridges without an HFO system dropped
0025
0
1
2
3
4
5
6
9823 9824 69006 69005 27019 27020
Aver
age
Annual
Num
ber
of
Cra
shes
Before After
Solid Bars Bridges with HFO systems installed
Crosshatched Bars Bridges without HFO systems installed
148
Figure 100 Average percentage of total Minnesotan crashes occurring on each bridge
before and after installation of HFO systems
During the years of this study the general trend across the state of Minnesota was a
decrease in the total number of crashes The crashes occurring on bridges in this study
became a smaller percentage of the total crashes in the state however rate the amount in
which they dropped is comparable to bridge decks in the same location without an HFO
A comparison of Bridge 69005 and Bridge 69006 (Poly-Carb Taconite) throughout the
analyzed years is shown in Figure 101 The same decreasing trend in percentage of total
statewide accidents is present for both bridges even after an epoxy system was installed
on the deck of Bridge 69006 (Poly-Carb Taconite)
000
001
002
003
004
005
006
007
008
9066 9067 9823 9824 14809 14810 69005 69006 27019 27020 86013 6347
Aver
age
Per
centa
ge
of
Annual
Cra
shes
in M
innes
ota
Before After
Solid Bars Bridges with HFO systems
Crosshatched Bars Bridges without HFO systems
149
Figure 101 Side by side comparison of the percentage of total accidents in Minnesota
across time
Figure 100 and Figure 101 provide further evidence that although there is a decrease in
crashes on bridges with HFO systems the reduction does not conclusively appear to be
the direct result of an HFO installation creating a perceived benefit of HFO systems
Comparison of Crashes with the Sitersquos Surface Friction Values
Since a minimum skid resistance value does not exist for crash reduction it is possible to
improve skid resistance of a bridge deck without actually improving the safety of the
bridge The following comparison will compare skid number (SN) values with the
number of crashes per million vehicles at each bridge location (Figure 102) In this
figure the triangle markers indicate curved sections while tangent sections are identified
with circle markers The bridges are also split into three categories by speed limit under
55 mph [89 kmh] 55 mph [89 kmh] and over 55 mph [89 kmh]
0000
0001
0002
0003
0004
0005
0006
0007
0008
0009
0010
-6 -5 -4 -3 -2 -1 0 1 2
Per
centa
ge
of
To
tal
Cra
shes
in M
innes
ota
Years Relative to Installation
69005 69006
150
Figure 102 Skid Numbers versus the number of crashes per million vehicles
Below in Figure 103 the same data as Figure 102 is displayed except the x-axis has
coefficient of friction values Skid numbers are divided by 100 in order to put them in the
coefficient of friction form The coefficient of friction (Cf) values in the plot are results
from the DFT testing in Chapter 5
0
01
02
03
04
05
06
07
08
09
30 35 40 45 50 55 60
Num
ber
of
Cra
shes
per
Mil
lio
n V
ehic
les
Skid Number
SN (lt55mph) SN (55 mph) SN (gt55mph)
Triangle markers indicate curved sections
Circle markers indicate tangent sections
151
Figure 103 Coefficient of Friction and SN100 versus the number of crashes per million
vehicles
From this data roads with lower speeds roads tend to have a lower crash rate and curved
sections have a larger crash compared to tangent sections which correlates with previous
research (Long 2014)
However when comparing the SN or Cf values with crash rates there is not a noticeable
trend The number of crashes per million vehicles are not consistent when comparing
different bridges with similar skid numbers Furthermore there is not a consistently
descending crash rate as the SN values increase suggesting that SN values are not a good
indicator for crash rate reductions on bridges This is confirmed by both types of testing
lacking trends in their results
0
01
02
03
04
05
06
07
08
09
0000 0100 0200 0300 0400 0500 0600 0700 0800
Num
ber
of
Cra
shes
per
Mil
lio
n V
ehic
les
Coefficient of Friction [Skid Number100]
Cf (lt55mph) Cf (55mph) Cf (gt55mph) SN100 (lt55mph) SN100 (55 mph) SN100 (gt55mph)
Triangle (SN100) and diamond
(Cf) markers indicate curved
sections
Circle markers (SN100) and
square (Cf) indicate tangent
sections
152
Benefit-Cost Ratio Analysis
A benefit-cost ratio analysis similar to previous research was conducted The purpose of
this analysis is to compare the benefits of HFO systemrsquos through a monetary lens As
discussed in the Literature Review the severity of a crash can have an associated cost
The cost association created by MnDOT (Table 5) was used in this calculation The
average annual associated cost of crashes were found for each bridge before and after the
installation of an HFO system The average annual benefit is the difference between the
average annual associated costs before and after installation This average annual benefit
was multiplied by four years and compared to the estimated cost of installation Several
reasons justify the use of four years for this analysis
(1) The previous research predicted that the life expectancy of HFO systems in
Minnesota was between three to five years
(2) In Chapter 4 when looking at the skid numbers several bridges fell below an SN
of 50 around the fourth year in service
(3) The average life of an HFO system in this study is 483 years
Based on these factors it is reasonable to place the effective lifespan of an HFO system
between four to five years Systems that exist past that time are not necessarily
detrimental to the safety of a bridge deckrsquos surface safety but their benefits may be
significantly compromised
The benefits costs and benefit-cost (BC) ratio are found below in Table 25 while a
complete calculation is found in the Appendix It should be noted that the estimated cost
of installation is based on a unit price for the different HFO systems and an estimated
surface area of the bridge The cost is not based on any bid or construction data A
benefit-cost ratio larger than one means that the monetary benefit provided by an HFO
system installation is greater than the cost of installation Five of the nine bridges have a
BC ratio above one
153
Table 25 Average Annual Benefits Estimated Costs of HFO Installation and Four Year
Benefit-Cost Ratios
Bridge
Average Annual
Associated Cost of
Crashes
Average
Annual
Benefit
Estimated
Cost of
Installation
Average Four
Year Benefit
Four
Year
BC
Ratio Before
Installation
After
Installation
6347 $58667 $1108571 -$1049905 $18872000 -$4199619 -022
9066 $11429333 $3457143 $7972190 $35750000 $31888762 089
9067 $14152000 $13851429 $300571 $35750000 $1202286 003
9823 $6640000 $684444 $5955556 $3477600 $23822222 685
14809 $82880000 $55926154 $26953846 $3511998 $107815385 3070
14810 $2706667 $1209231 $1497436 $3511998 $5989744 171
69006 $13569231 $3448889 $10120342 $3585792 $40481368 1129
27019 $9807273 $80000 $9727273 $5720000 $38909091 680
86013 $000 $1189091 -$1189091 $4670600 -$4756364 -102
A perceived benefit exists in these benefit-cost ratios similar to the perceived benefit
discussed above when comparing side by side bridges and comparing the crashes
normalized to total crashes in Minnesota The reduction in total crashes over time reduces
the cost associated to crashes This benefit is also available in bridges without an HFO
installation (Table 26) As shown below two bridges without an HFO system have a
reduction in costs associated with crashes A benefit-cost ratio for these bridges cannot be
calculated because the ldquocostrdquo is zero
154
Table 26 Average Annual Benefits of Bridges without an HFO System Installed
Bridge
Average Annual Associated
Cost of Crashes Average
Annual
Benefit Before
Installation
After
Installation
9824 $3356923 $488889 $2868034
69005 $4070769 $4235556 -$164786
27020 $7574545 $2315556 $5258990
Crash Analysis Summary
Effectiveness of crash prevention potential of high-friction overlay treatments in
Minnesota was evaluated through analysis of crash and weather condition data The data
was provided by MnDOT from the Public Safety Database The crash data compared in
this paper occurred during the time frame from 2003 through 2013 and corresponded to
eleven different bridges in this study This analysis was completed to gain perspective on
the performance of bridge decks with high-friction overlay treatments The main concern
for the wear courses assessed through this analysis was the additional safety provided due
to the higher friction of such overlay systems The use of high friction overlays is
increasing in colder climate locations due to their perceived benefit of providing safer
driving conditions during inclement weather
On the basis of crash data analysis the following conclusions can be drawn
A majority of crashes occur in either dry or ice packed snow surface conditions
The friction properties of an HFO system have little effect in preventing crashes
during such instances Even bridges equipped with automated deicing systems
had a significant number of ice packed snow surface condition crashes
The main purpose of an HFO is to provide higher SN values to facilitate safer
roads and reduce crash rates HFO systems do provide an increase in surface
155
friction however noticeable trends between SN values and crash rates do not exist
suggesting that skid numbers are not a reliable indicator of crash rate reductions
There was a negligible change in the distribution of crash severity after HFO
systems were placed on the bridge decks
Five of the nine bridges had a benefit-cost (BC) ratio over one however the
benefits cannot be directly attributed to the installation of an HFO system
Further research is recommended for efficient and effective removal of ice packed
snow from bridge decks The removal of such conditions would significantly help
reduce the number of crashes on bridge decks in cold climates such as Minnesota
Although minimal crash prevention occurs of the systems the thin-bonded open
graded asphalt overlay [Novachip] provided the best performance in crash
reduction however it was closely followed by two of the epoxy based systems
[SafeLane and Poly-Carb]
Of the Poly-Carb systems with different aggregates the taconite aggregate
showed best performance in reduction of crashes as compared to flint or basalt
Previous research has looked at crashes occurring before and after the installation
of an HFO system The results provided the perceived benefit of crash reduction
however this perceived benefit occurs on bridges without an HFO installation
The average number of crashes occurring on a bridge deck is reduced regardless
of whether or not an HFO system was installed and at about the same rate for each
location
Overall crashes in the state of Minnesota are on a reducing trend but the reduction in
crashes on bridge decks with HFO systems cannot be completely attributed to the use of
such systems
The results and discussions presented herein are part of a larger encompassing study of
HFO systems in Minnesota Several other factors are being researched that attribute to the
performance of the systems in the field Based on this analysis high friction overlays are
not the primary reason for a reduction in crashes when placed on a bridge however HFO
systems do have other tangible benefits HFO systems provide a strong waterproof seal
156
over bridge decks reducing chloride ion penetration and thus mitigating corrosion of
reinforcing steel Other aspects such as geometrics play an important role in crashes and
should be incorporated into future studies
157
Chapter 6 Summary Conclusions and Recommendations
Summary
This study was proposed to continue the investigation of high friction overlay (HFO)
systems in Minnesota in which the Minnesota Department of Transportation (MnDOT)
has invested The investments were in efforts to provide safer surface conditions on
bridge decks The recommendation for further investigation came after a study and report
of SafeLane HFO products placed in Minnesota published by MnDOT (Evans 2010) A
larger scope of study was possible due to the continued use of HFO systems in
Minnesota Four different types of proprietary HFO systems were investigated on
fourteen different bridges This study encompassed more bridges more testing and
longer time intervals since the installation of the HFO systems than both the predeceasing
research and research previously conducted in other states
A comparative analysis of the different HFO systems was completed with the purpose of
investigating the HFO systems in regard to their field performance and the safety benefits
they provide A second objective of this study is to serve as a model for future research
involving HFO systems and their benefits in the reduction of crashes and ultimately the
safety of roadways they are placed on Through the observation testing and data analysis
of different conditions and performances for each HFO system the study looked to
answer several question regarding HFO systems including
(1) How do HFO systems perform in cold weather climates that exist in Minnesota
(2) Do HFO systems provide benefits that reduce crash rates on bridges
(3) Is there is a correlation between the SN values of an HFO system and their crash
rates
(4) Do the benefits HFO systems provide to Minnesota bridge decks justify their use
in the state
158
Conclusions
High friction overlay (HFO) systems are marketed to provide three main benefits for
infrastructure they are placed on (1) high friction (2) an impermeable surface and (3)
crash rate reduction
HFO Systems provide high friction values at the time of installation however those
values steadily decrease over time Different bridge sites are performing at varying states
of satisfaction Aggregate raveling heavy abrasion and aggregate polishing are three
distresses that exist on every bridge deck These distresses are mostly caused due to the
heavy use of snow plows for winter maintenance in the cold climate and ultimately
reduce the systemsrsquo surface friction
Novachip systems perform better in regards to abrasion The ductility of asphalt
allows for the continual embedment of aggregates into the matrix which helps to
reduce the amount of aggregate loss
Poly-Carb systemsrsquo mean texture depth values (measure of surface macro-texture)
are reduced on average by 6-8 a year
SafeLane systemsrsquo MTD values are reduced on average by 5 a year
Significant abrasion especially in the non-wheel path occurred on the Poly-Carb
and SafeLane bridges when comparing their MTD values from 2013 to 2014
The significant high friction values of HFO systems are limited in cold climates due to
their harsh maintenance operations which rapidly deteriorate the high friction surfaces
The lifespan of an HFO system in Minnesota is only about four or five years After this
time friction values of HFO systems are very similar to those provided by conventional
concrete or asphalt overlays
HFO systems provide an impermeable surface but only provided the systems do not
become distressed enough where delamination cracking or abrasion to the bridge deck
occurs
159
Of the fourteen bridges in this study
Two bridges had delaminated HFO systems (Br 4190 and 9036 both Poly-Carb)
Three bridges had cracks in the HFO systems (Br 27019 86013 and 86019 - all
Novachip)
One bridge had delamination an cracking (Br 6347 Transpo)
One bridge had cracking and complete removal system sections due to abrasion
(Br 27758 Transpo)
Thus fifty percent of the bridges in this study have compromised systems where water
and chloride ions are able to penetrate into the bridge deck Through the chloride ion
penetration testing it was found that when properly placed and when compromising
distresses have not occurred HFO systems have the ability to protect infrastructure from
chloride ion penetration However distresses of the system such as delamination
abrasion or cracking mitigate this protection in a localized area near the distress
reducing the infrastructure protection effectiveness of an HFO system
The main concern for the wear courses assessed through this analysis was the additional
safety provided due to the higher friction of such overlay systems The use of high
friction overlays is increasing in colder climate locations however they have a perceived
benefit of providing safer driving conditions during inclement weather
Ice packed snow surface conditions create situations where the friction properties
of an HFO system have little effect in preventing crashes Even bridges equipped
with automated deicing systems had a significant number of ice packed snow
surface condition crashes
The main purpose of an HFO is to provide higher SN values to facilitate safer
roads and reduce crash rates HFO systems do provide an increase in surface
friction however noticeable trends between SN values and crash rates do not exist
suggesting that skid numbers are not a reliable indicator of crash rate reductions
There was a negligible change in the distribution of crash severity after HFO
systems were placed on the bridge decks
160
Five of the nine bridges had a benefit-cost (BC) ratio over one however the
benefits cannot be directly attributed to the installation of an HFO system
Previous research has looked at crashes occurring before and after the installation
of an HFO system The results provided the perceived benefit of crash reduction
however this perceived benefit occurs on bridges without an HFO installation
The average number of crashes occurring on a bridge deck is reduced regardless
of whether or not an HFO system was installed and at about the same rate for each
location
Overall crashes in the state of Minnesota are on a reducing trend but the reduction in
crashes on bridge decks with HFO systems cannot be completely attributed to the use of
such systems
Of the different aggregates tested Flint aggregate is the least desirable aggregate
Although it had comparable performances with the other aggregates in the laboratory
testing Flint aggregates had the worst performance in the field Poly-Carb bridges with a
flint aggregate (Br 9066 and 9067) had some of the lowest MTD values and coefficients
of friction The bridges also had a significant amount of polished areas and aggregate
removal The Transpo system with Flint (Br 6347) had a significant amount of polished
areas where too much epoxy was applied which may have been caused by the flat and
elongated characteristics of the aggregate The particles required less epoxy to be covered
and when this adjustment was not made polished areas were created
Of the four different systems in this study Novachip systems appear to have the best
performance in the field Novachip systems are constructed similar to asphalt overlays
thus the system is compacted with a roller during construction This compaction helps to
push the aggregates further into the asphalt matrix and achieve a higher bond
Additionally asphalt remains pliable while it ages Aggregate in the Novachip systems
are able to compress into the asphalt under a load even after the initial placement
The elasticity of asphalt allows the system to absorb some of the energy caused by
abrasion Epoxy systems cannot compress and cannot absorb the energy as the stiffness
of epoxy is very high This results in the applied forces breaking the bonds formed
161
between the epoxy and aggregates and removing aggregates from the system Thus
Novachip systems are superior compared to epoxy systems in aggregate retention This
aggregate retention also helps to maintain a high friction throughout the systemrsquos service
life The two main distresses occurring in the Novachip systems were reflective cracking
and snowplow abrasion Both the reflective cracks and areas of extensive snow plow
abrasion came from settlement in the approach panels or sections of the bridge Thus the
major distresses are preventable by placing Novachip systems on well-functioning
bridges The negative aspect of Novachip systems is that asphalt is not a completely
impervious surface like hardened epoxy so Novachip systems have a lower potential for
infrastructure protection
Recommendations
Common surface conditions during the winter such as ice packed snow surfaces the
presence of water and winter maintenance practices with snow plows are all detrimental
to an HFO systemrsquos performance in cold weather climates A life span of only four or
five years exists due to distresses that occur on HFO systems caused by common winter
conditions These distresses severely mitigate the benefits HFO systems provide
Furthermore at an average cost of around $550 per square foot the higher costing HFO
systems also do not provide an economical benefit Since the friction and infrastructure
protection benefits are not long-lasting or are compromised due to distresses a crash
reduction does not occur as a direct result of HFO systems and the systems come at a
higher cost than conventional overlays it is recommended that HFO systems are not used
in Minnesota
HFO systems in mild climates may provide more benefits because (1) their friction
values may not be compromised due to a lesser use of snow plows and (2) ice packed
snow conditions which were present for 39 of the crashes in this study are not as
prevalent in mild climate areas Other cold climate region transportation agencies should
conduct similar studies to justify the use of HFO systems Most notably the crash rate
reductions on HFO systems should be compared to the overall crash rate reduction in
162
their jurisdiction Looking solely at the crashes before and after the installation of an
HFO system provides the perceived benefit that a reduction in crashes is occurring if the
trend of overall crashes is also decreasing
Although this research shows that a reduction in crashes is not occurring due to the
installation of HFO systems it cannot conclusively state whether HFO systems in fact
increase the crash rate potential on a bridge This potential increase in crash rates is
suggested by data in this research such as (1) an increase in crashes during dry surface
conditions (2) a significant number of crashes occurring during ice packed snow
conditions along with the larger mean texture depth which may facilitate ice packed snow
conditions to occur and (3) an increase in polished or raveled areas as systems age It is
recommended that further research looks more in depth into the possibility of HFO
systems having adverse effects on crash rates
Overall the DFT and skid trailer tests provide similar surface friction values It is
recommended that DFT testing becomes a more prevalent test method because of the
benefits it provides compared to the skid trailer It allows for multiple tests run in the
same location providing higher precision It also eliminates error that may interfere with
test results such as bouncing lateral movement improper water spray film thickness or
incorrect speeds of the skid trailer which must be in motion for its testing procedure The
fact that testing is done in a static location for DFT testing provides the opportunity to
test more accurately in wheel and non-wheel paths It also provides the opportunity to test
specific distressed areas to compare with non-distressed areas
Several recommendations can be made for research into the improvement of HFO
products Research on construction practices and education of contractors should be
conducted in order to provide a more consistent finished product Improper levels of
epoxy during the placement of HFO systems can lead to polished areas from excessive
epoxy or aggregate raveling due to an insignificant amount of placed epoxy HFO
systems must be placed more consistently in order to improve the consistency of their
friction values Research should be conducted into a mechanized placement system for
163
epoxy systems the research should look mostly into how a machine could improve the
consistency of construction and if such a machine has a cost benefit
Based on comparisons between asphalt based and epoxy based HFO systems Companies
that produce epoxy based systems should research more ductile epoxies Increasing the
ductility may allow for absorption of abrasion loads This absorption may help to reduce
the amount of aggregate raveling occurring in epoxy based systems This ductility
however must not compromise the overall bond strength between the HFO system and
the underlying concrete deck
It appears that as the mean texture depth (MTD) of an HFO system increases so does the
coefficient of friction However faster rates at which the coefficient of friction increases
occur with systems that use a nominal maximum aggregate size (NMAS) of 0187 inches
[5 mm] compared to 0375 inches [95 mm] Further research should be conducted to
verify if the use of 0187 inch [5 mm] aggregates is more beneficial
Testing of the complete HFO systems in a laboratory setting should be researched
Material testing such as impact abrasion and bending strength testing of HFO systems in
a laboratory setting may provide insight on ways to improve HFO systems and could also
aid in the study of previously recommended improvements
164
References
AASHTO LRFD Bridge Design Specifications Customary US Units (6th Edition) with
2012 and 2013 Interim Revisions and 2012 Errata (2012) American Association
of State Highway and Transportation Officials (AASHTO)
AASHTO T103-08 (2012) ldquoStandard Method of Test for Soundness of Aggregates by
Freezing and Thawingrdquo Standard Specifications for Transportation Materials and
Methods of Sampling and Testing 32rd Edition American Association of State
Highway and Transportation Officials Washington DC
AASHTO T277 (2013) ldquoStandard Method of Test for Rapid Determination of the
Chloride Permeability of Concreterdquo Standard Specifications for Transportation
Materials and Methods of Sampling and Testing 33rd Edition American
Association of State Highway and Transportation Officials Washington DC
Anderson K W Russell M Sheets J Burkey D Uhlmeyer J S amp Weston J
(2012) ldquoEvaluation of Tyregripreg High-Friction Surfacingrdquo WA-RD 7881 Post-
Construction Rep Washington State Department of Transportation Olympia
WA
ASTM C1202-12 (2012) ldquoStandard test method for electrical indication of Concretersquos
ability to resist chloride ion penetrationrdquo ASTM International West
Conshohocken PA
ASTM C1252-06 (2006) ldquoStandard Test Methods for Uncompacted Void Content of
Fine Aggregate (as Influenced by Particle Shape Surface Texture and Grading)rdquo
ASTM International West Conshohocken PA
ASTM C127-12 (2012) ldquoStandard Test Method for Density Relative Density (Specific
Gravity) and Absorption of Coarse Aggregaterdquo ASTM International West
Conshohocken PA
ASTM C128-12 (2012) ldquoStandard Test Method for Density Relative Density (Specific
Gravity) and Absorption of Fine Aggregaterdquo ASTM International West
Conshohocken PA
165
ASTM C131-14 (2014) ldquoStandard Test Method for Resistance to Degradation of Small-
Size Coarse Aggregate by Abrasion and Impact in the Los Angeles Machinerdquo
ASTM International West Conshohocken PA
ASTM C136-06 (2006) ldquoStandard Test Method for Sieve Analysis of Fine and Coarse
Aggregatesrdquo ASTM International West Conshohocken PA
ASTM D4791-10 (2010) ldquoStandard Test Method for Flat Particles Elongated Particles
or Flat and Elongated Particles in Coarse Aggregaterdquo ASTM International West
Conshohocken PA
ASTM D5821-13 (2013) ldquoStandard Test Method for Determining the Percentage of
Fractured Particles in Coarse Aggregaterdquo ASTM International West
Conshohocken PA
ASTM E1911-09 (2009) ldquoStandard test method for measuring paved surface frictional
properties using the dynamic friction testerrdquo ASTM International West
Conshohocken PA
ASTM E274 (2011) ldquoStandard test method for skid resistance of paved surfaces using a
full-scale tirerdquo ASTM International West Conshohocken PA
ASTM E965-96 (2006) ldquoStandard Test Method for Measuring Pavement Macrotexture
Depth Using a Volumetric Techniquerdquo ASTM International West
Conshohocken PA
Clemena G G and Virmani P (1998) ldquoCorrosion protectionmdashconcrete bridgesrdquo
FHWA-RD-98-088 Federal Highway Administration Washington DC
Costa Jorge (2010) ldquoCorrosion of Steel Reinforcing in Concrete and Masonry
Structuresrdquo Structures Congress 2010 American Society of Civil Engineers
Dave E V Kostick R D amp Dailey J (2014) ldquoComparative performance study of
chip seal and bonded wear course systems applied to bridge decks and
approaches Field cracking debonding and wearing evaluation year-1rdquo
Minnesota Department of Transportation St Paul MN
166
Evans J F (2010) ldquoEvaluation of the SafeLane overlay system for crash reduction on
bridge deck surfacesrdquo MNRC 2010-13 Minnesota Department of Transportation
St Paul MN
FHWA (2013) ldquoStrategic Highway Safety Plans ndash A Championrsquos Guidebook to Saving
Lives Second Editionrdquo FHWA-SA-12-034 US Department of Transportation
Washington DC
Harper J (2007) ldquoInvestigations of Failures of Epoxy Polymer Overlays in Missourirdquo
R106-020 Missouri Department of Transportation Jefferson City MO
Izeppi E Flintsch GW amp McGhee K K (2010) ldquoField performance of high friction
surfacesrdquo FHWAVTRC 10-CR6 Federal Highway Administration Richmond VA
Long K Wu H Zhang Z amp Murphy M (2014) ldquoQuantitative relationship between
crash risks and pavement skid resistancerdquo FHWATX-130-6713-1 Texas
Department of Transportation Austin TX
Pavia Systems Inc (2012) Los Angeles Abrasion Pavement Interactive Web 02 Oct
2013 lthttpwwwpavementinteractiveorgarticlelos-angeles-abrasiongt
Mamlouk Michael S Zaniewski John P (2011) Materials for Civil and Construction
Engineers Third Edition New Jersey Pearson Education Inc Print
Midland (2014) ldquoNovaChiprdquo Products amp Processes Web 11 Dec 2014
lthttpwwwmidlandasphaltcomproducts-processesnovachipgt
MN Department of Public Safety (2014) ldquoMinnesota motor Vehicle Crash Facts 2013rdquo
Minnesota Department of Public Safety St Paul MN
MnDNR (2014a) ldquoGeneral Climate Description for Minnesotardquo General Statistics and
Summaries Web 27 Nov 2014
lthttpwwwdnrstatemnusclimatesummaries_and_publicationsindexhtmlgt
MnDNR (2014b) ldquoNormals Means and Extremes for Major Airport Weather Stationsrdquo
General Statistics and Summaries Web 27 Nov 2014
lthttpwwwdnrstatemnusclimatesummaries_and_publicationsindexhtmlgt
167
MnDOT (2013) ldquoFacts about crashes budget fatality ratesrdquo Transportation Fact
Cards Web 23 Mar 2015 lt
lthttpwwwdotstatemnustrafficengpubltriviacardgt
MnDOT (2014a) ldquoAbout MN TZDrdquo Minnesota Towards Zero Deaths Web 15 Aug
2014 lthttpwwwminnesotatzdorggt
MnDOT (2014b) ldquoCritical Emphasis Areasrdquo Transportation Fact Cards Web 25 Mar
2015 lt httpwwwdotstatemnustrafficengpubltriviacardtrivia12critical-
emphasis-areaspdfgt
Nelson T (2011) ldquoEvaluation of Skid Resistance of Turf Drag Textured Concrete
Pavementsrdquo MNRC 2011-12 Minnesota Department of Transportation
Maplewood MN
Poly-Carb (2013)POLY-CARB MARK-174 Product By Poly-Carb Mark Web 25
Sept 2013 lthttpwwwpoly-carbcomproductsdetailsaspid=187gt
Cargill (2014) SafeLanereg surface overlay for increased safety ice prevention and
infrastructure protection SafeLane Surface Overlay Web 11 Dec 2014
lthttpwwwcargillcomproductssaltwintersafelanegt
FHWA (2010) ldquoTechnical Advisory Pavement Friction Managementrdquo Web 6 Nov
2013 lthttpwwwfhwadotgovpavementt504038cfmgt
Tremblay Jason P (2013) ldquoAssessment of the Poly-Carb Flexogrid Bridge Deck
Overlay Systemrdquo U2013-02 Research Update Vermont Agency of
Transportation VT
USDOT (2015) ldquoCritical Reasons for Crashes Investigated in the National Motor
Vehicle Crash Causation Surveyrdquo DOT HS 812-115 US Department of
Transportation Washington DC
Watson M Clyne T and Izevbekhai B (2011) ldquoHot Mixed Asphalt Pavement Surface
Characteristics Related to Ride Texture Friction Noise and Durabilityrdquo Report
Number LRRB INV 868 MPR-6(029) Task 5 Minnesota Department of
Transportation Maplewood MN
168
Young L M Durham S A amp Bindel M K (2012) ldquoThin bonded epoxy overlays on
concrete bridge deck surfacesrdquo Paper presented at the Transportation Research
Board 91st Annual Meeting (12-3418)
Zanko L Fosnacht D amp Hopstock D (2009) Construction aggregate potential of
Minnesota taconite industry byproducts (pp 252-274) American Society of Civil
Engineers doi10106141072(359)27
169
Appendix
Chapter 3 Appendix
This section provides raw data and calculations used to complete the results section in
Chapter 3
Density Specific Gravity amp Absorption (Fine Aggregate) Data
The results in Table 9 and Table 10 (See Results section) were calculated using Equations
1-6 and the Data found in Table 27 Data from Table 28 and equation 7 were used to
calculate the values found in Table 11 of the results section
Table 27 Specimen Mass Data
Basalt Flint Taconite A Taconite B SafeLane
A 481 4636 4744 4768 4758
B 6662 6662 6662 6662 6662
C 9725 9601 9908 9871 9768
S 5017 5019 5002 5009 5018
A= Mass of oven dry specimen (g)
B= Mass of pycnometer filled with water (g)
C= Mass of pycnometer filled with specimen and water (g)
S= Mass of saturated surface-dry specimen (g)
Oven Dry Density (kgm3) =9975[A
(B+SminusC)] (1)
SSD Density (kgm3) =9975[S
(B+SminusC)] (2)
Apparent Density (kgm3) = 9975 lowast [A
(B+AminusC)] (3)
170
Oven Dry Relative Density (Specific Gravity) = 9975 lowast [A
(B+SminusC)] (4)
SSD Relative Density (Specific Gravity) = 9975 lowast [S
(B+SminusC)] (5)
Apparent Relative Density (Specific Gravity) = 9975 lowast [A
(B+AminusC)] (6)
Table 28 Absorption Data
Aggregate Initial
Mass (g)
SSD Mass
(g)
Basalt 22125 2243
Flint 2138 2167
Taconite A 23465 23745
Taconite B 26245 26525
SafeLane 2450 2486
Absorption () = 100 lowast [(119872119886119904119904119878119878119863minus119872119886119904119904119889119903119910)
119872119886119904119904119878119878119863] (7)
171
Resistance to Degradation Los Angeles Machine Data
The results in Table 12 (See Results section) were calculated using the data from Table
29 in Equations 8
Table 29 Los Angeles Machine Degradation (Test Samples of Grading D)
Aggregate Mass Before (g) Mass After (g)
Basalt 49721 481683
Flint 498247 483112
SafeLane 496658 473684
Taconite A 497551 481806
Taconite B 497962 477832
Percent Loss by Abrasion = 100 lowast [Mass AfterminusMass Before
Mass Before] (8)
Uncompacted Voids Data
The results in Table 13 (See Results section) were calculated using the data from
Table 30 in Equations 9-10
Table 30 Uncompacted Voids Data
V 100 100 100 100 100
E 1896 1896 1896 1896 1896
T1 3552 3308 3531 3342 3406
T2 3557 332 3532 333 3408
T3 3554 3314 3533 3323 3407
Ta 3554 3314 3532 3332 3407
F 1658 1418 1636 1436 1511
Gs 265 223 27 249 246
U 3740 3640 3940 4230 3860
172
Where V= Volume of cylindrical measure (ml)
E= Mass of cylindrical measure (g)
T= Gross mass of filled cylindrical measure (g)
F= Net mass of fine aggregate (g)
Gs= Dry relative density (specific gravity)
U= Uncompacted voids in the material ()
F = Ta minus E (9)
U = 100[Vminus(
F
Gs)
V] (10)
FlatElongated Particles
The data shown below in Table 31 thru Table 34 are summarized for comparison in
Figure 17 through Figure 19 (See Results Section)
Table 31 Basalt - FlatElongated Particles
FlatElongated
Ratio
Number of Particles and Percentage
2 to 1 3 to 1 5 to 1
Flat 30 28 4 4 0 0
Elongated 2 2 0 0 0 0
FlatElongated 1 1 0 0 0 0
None 75 69 104 96 108 100
Total 108 100 108 100 108 100
173
Table 32 Taconite A- FlatElongated Particles
FlatElongated
Ratio
Number of Particles and Percentage
2 to 1 3 to 1 5 to 1
Flat 68 58 28 24 4 3
Elongated 4 3 0 0 0 0
FlatElongated 3 3 0 0 0 0
None 42 36 89 76 113 97
Total 117 100 117 100 117 100
Table 33 Taconite B- FlatElongated Particles
FlatElongated
Ratio
Number of Particles and Percentage
2 to 1 3 to 1 5 to 1
Flat 72 57 21 17 1 1
Elongated 5 4 0 0 0 0
FlatElongated 2 2 0 0 0 0
None 47 37 105 83 125 99
Total 126 100 126 100 126 100
Table 34 SafeLane- FlatElongated Particles
FlatElongated
Ratio
Number of Particles and Percentage
2 to 1 3 to 1 5 to 1
Flat 46 43 11 10 0 0
Elongated 5 5 0 0 0 0
FlatElongated 2 2 0 0 0 0
None 54 50 96 90 107 100
Total 107 100 107 100 107 100
174
Soundness of Aggregate Freeze Thaw Data
The results in Figure 8 (See Results section) were calculated using the data from Table 35
in Equations 11
Table 35 Freeze Thaw Resistance Data
Sample
(Sieve Size)
Mass of
Water
(g)
Mass of
Salt
(g)
Aggregate Mass (g) Loss of
Mass
(g)
Percent
of Mass
Lost () Original Final
Basalt 8 946 284 150 1465 35 23
Flint 8 959 288 150 147 3 20
Flint 16 949 285 150 1465 35 23
Taconite A
8 945 284 150 1455 45 30
Taconite A
16 982 295 150 147 3 20
Taconite B
8 988 296 150 1485 15 10
Taconite B
16 947 284 150 1485 15 10
Safe Lane
4 980 294 150 1475 25 17
Safe Lane
8 951 285 150 1495 05 03
Note Flint 8 stands for Flint retained on the 8 sieve
Percent of Mass Lost () = 100 lowast [Loss of Mass (g)
Aggregate Original Mass (g)] (11)
175
Sieve Analysis
Below are the gradations (Table 36 through Table 40) for the five aggregate samples The
gradations are summarized in the Chapter 3 Results section in Figure 22
Table 36 Basalt Sieve Analysis
Sieve Size Mass Retained (g) Cumulative Mass (g) Percent Passing ()
0375 inch 0 0 10000
4 214 214 9853
8 13684 13898 444
16 642 1454 002
50 02 14542 001
100 0 14542 001
200 01 14543 000
Pan 0 14543 000
Total 14543
Table 37 Flint Sieve Analysis
Sieve Size Mass Retained
(g)
Cumulative Mass
(g)
Percent Passing
()
0375 inch 0 0 10000
4 14 14 9992
8 12664 12678 2940
16 5196 17874 047
50 76 1795 004
100 02 17952 003
200 02 17954 002
Pan 04 17958 000
Total 17958
176
Table 38 Taconite A Sieve Analysis
Sieve Size Mass Retained
(g)
Cumulative Mass
(g)
Percent Passing
()
0375 inch 0 0 10000
4 694 694 9582
8 1320 13894 1630
16 2694 16588 007
50 03 16591 005
100 01 16592 004
200 01 16593 004
Pan 06 16599 000
Total 16599
Table 39 Taconite B Sieve Analysis
Sieve Size Mass Retained
(g)
Cumulative Mass
(g)
Percent Passing
()
95 0 0 10000
4 28 28 9895
8 20185 20465 2350
16 6216 26681 026
30 41 26722 011
100 18 2674 004
200 07 26747 001
Pan 04 26751 000
Total 26751
177
Table 40 SafeLane Sieve Analysis
Sieve Size Mass Retained
(g)
Cumulative Mass
(g)
Percent Passing
()
95 0 0 10000
4 847 847 6136
8 12828 21298 284
100 56 21858 028
200 12 2187 023
Pan 5 2192 000
Total 2192
178
Chapter 4 Appendix
This section provides additional equations data and plots used to complete Chapter 4
Mean Texture Depth
Equation 12 is used to find the Mean Texture Depth (MTD) as described in ASTM E965
ndash 96
MTD = 4119881
1205871198632 (12)
Where MTD = Mean Texture Depth (in)
V = sample volume (in3)
D = average diameter of the area covered by material (in)
Sample Calculation using Test from Bridge 9823 (Atkinson MN)
100 cubic centimeters of sand was used in the test with the resulting 4 diameter
measurements of 1325rdquo 135rdquo 135rdquo and 1375rdquo for an average diameter of 135rdquo
MTD = 4119881
1205871198632 = 4lowast(100 1198881198983lowast [
1 119894119899
254 119888119898]3
)
120587lowast(135 119894119899)2 = 00426 in
Coefficient of Permeability
Equation 13 is used to find the coefficient of permeability as described by the NCAT
Asphalt Field Permeameter Kit AP-1B operating manual
K = (
119886lowast119871
119860lowast119905)
ln(ℎ1ℎ2
) (13)
Where K = Coefficient of permeability
a = 285 cm2 = Inside cross sectional area of standpipe
L = 09525 cm = Length of sample (Thickness of epoxy system)
A = 16753 cm2 = Cross-sectional area of Permeameter
t = Elapsed time between h1 and h2
h1 = Initial head cm
h2 = Final head cm
179
Sample calculation using data from a test on Bridge 9067
K = (
119886lowast119871
119860lowast119905)
ln(ℎ1ℎ2
)=
(285 1198881198982lowast09525 119888119898
16753 1198881198982lowast600 119904119890119888)
ln(59 119888119898
585 119888119898)
= 226x10-7 cmsec
Friction Testing
The following data provides the average skid number results throughout the years of
testing conducted by MnDOT (Table 41)
Table 41 Average Skid Number Test Results
Date 2007 2008 2009 2010 2011 2012 2013 2014
Bri
dge
6347 0 0 0 0 0 0 5824 548
9066 0 0 0 120 5225 4705 4168 0
9067 0 0 0 120 0 4668 44 0
9823 0 0 NA 649 6025 541 0 0
14809 635 503 4795 456 381 3645 0 0
14810 652 502 4627 4003 3873 351 0 0
27019 0 0 566 571 571 5385 545 0
27758 0 0 0 598 487 502 5467 541
69006 0 0 120 613 617 5473 0 0
86013 0 0 0 0 0 0 5635 0
86019 0 0 0 0 0 0 5605 0
9036 0 0 0 0 0 0 0 579
Note
0 = No friction test was conducted
NA = a test was conducted but resulted in poor test data or a faulty test
180
Chloride Ion Penetration
Data for Bridge 9823 is found in Table 42 and Table 43 while data for Bridge 69006 is
found in Table 44 through Table 46
Table 42 Chloride Content on Bridge 9823 (Tested Oct 11 2011)
Depth
(in)
Chloride Content (ppm Cl)
Core 1 Core 2 Core 3 Core 4 Core 5 Core 6
Average Driving
Lane
Driving
Lane
Driving
Lane
Passing
Lane
Passing
Lane
Passing
Lane
0-1 5382 6849 5118 4869 4139 5676 5339
1-2 3828 4309 2082 1483 2853 4038 3099
2-3 3063 2895 140 116 2459 3792 2078
3-4 3074 2007 116 NA NA NA 1732
Table 43 Chloride Content on Bridge 9823 (Tested Dec 1 2014)
Depth
(in)
Chloride Content (ppm Cl)
Core 1 Core 2
Average Driving
Lane
Passing
Lane
0-05 4106 4655 4381
05-1 3309 5437 4373
1-15 2377 3552 2965
15-2 1642 2776 2209
2-3 758 1436 1097
3-4 466 321 394
4-5 NA 300 300
181
Table 44 Chloride Content on Bridge 69006 (Tested Oct 15 2010)
Depth
(in)
Chloride Content (ppm Cl)
Core 1 Core 2 Core 3 Core 4 Core 5 Core 6
Average Driving
Lane
Driving
Lane
Driving
Lane
Passing
Lane
Passing
Lane
Passing
Lane
0-1 4028 4453 3805 3972 4614 4175 4175
1-2 2330 2486 2476 1078 2078 1968 2069
2-3 1099 1404 1341 907 366 622 957
3-4 812 582 839 1351 1563 785 989
4-5 482 226 438 1122 432 721 570
5-6 384 241 116 953 117 298 352
Table 45 Chloride Content on Bridge 69006 (Tested Sep 5 2011)
Depth
(in)
Chloride Content (ppm Cl)
Core 1 Core 2 Core 3 Core 4 Core 5 Core 6
Average Driving
Lane
Driving
Lane
Driving
Lane
Passing
Lane
Passing
Lane
Passing
Lane
0-1 4340 4172 5025 4072 4738 3745 4349
1-2 1676 2788 2263 1560 2353 2445 2181
2-3 830 564 487 948 1208 1731 961
3-4 NA NA NA NA NA 1981 1981
182
Table 46 Chloride Content on Bridge 69006 (Tested Dec 1 2014)
Depth
(in)
Chloride Content (ppm Cl)
Core 1 Core 2
Average Driving
Lane
Passing
Lane
0-05 4338 4472 4405
05-1 4116 5108 4612
1-15 3176 4406 3791
15-2 1922 3845 2884
2-3 654 3357 2006
3-4 1062 3142 2102
4-5 NA 2530 2530
183
Chapter 5 Appendix
Data for Contributing Factors in Crashes
The following provides the number of crashes with each contributing factor by bridge
Table 47 Data for Contributing Factors
Contributing Factor Number of Crashes by Bridge per Contributing Factor
6347 9066 9067 9823 14809 14810 27019 69006 86013
Not Specified 0 14 19 2 2 0 1 1 1
No Clear Factor 1 11 31 3 1 0 8 3 1
Failure to Yield 0 0 0 0 0 0 0 1 0
Illegal or Unsafe
Speed 2 29 10 17 7 7 1 21 0
Following Too
Closely 0 3 11 0 1 1 3 0 0
Disregard Traffic
Control Device 0 0 0 0 0 0 1 0 0
Improper Passing 0 0 0 0 0 1 0 0 0
Improper or Unsafe
Lane Use 0 2 2 2 0 0 0 0 0
Improper
ParkingStopping 0 2 0 0 0 0 0 0 0
Over-Correcting 0 1 0 0 2 0 0 0 0
InattentiveDistracted
Driver 1 2 7 0 2 2 3 3 0
Driver Inexperience 0 1 0 0 1 0 0 0 0
Chemical
Impairment 0 1 1 0 1 0 0 3 0
Other Human
Contributing Factor 0 2 2 0 1 0 1 0 0
Vehicle Obscured 0 0 0 0 1 0 0 0 0
Defective TireTire
Failure 0 0 1 0 0 0 0 0 0
Skidding 0 1 1 0 0 1 0 4 0
Other Vehicle
Defects or Factors 0 0 2 0 0 0 0 0 0
Weather 0 4 1 1 3 2 0 6 0
OtherUnknown 0 0 2 0 0 0 1 2 0
Total 4 73 90 25 22 14 19 44 2
184
Sample Calculation Number of Accidents per Million Vehicles Crossing
For a given bridge the number of accidents per million vehicles was found by dividing
the number of accidents per year by the bridgersquos AADT The values were then averaged
for the number of years before and after an epoxy overlay was installed This average is a
small percentage and for the sake of presenting the data this percentage was reported in
terms of millions of vehicles The following is a sample calculation using data from
Bridge 9066 [Poly-Carb Flint] using data from Table 48
Table 48 Data to Calculate Number of Crashes Normalized to AADT for Bridge 9066
Year
Year
Relative to
Installation
Number
of
Accidents
Yearly
Accidents
per Yearly
Traffic
2003 -7 9 795404E-07
2004 -6 3 265135E-07
2005 -5 11 972161E-07
2006 -4 3 265135E-07
2007 -3 9 795404E-07
2008 -2 6 53027E-07
2009 -1 12 106054E-06
2010 0 3 265135E-07
2011 1 6 53027E-07
2012 2 3 265135E-07
2013 3 8 707026E-07
Bridge AADT 31000 vehiclesday
Yearly Accidents per Yearly Traffic = of Accidents
AADTlowast365
185
For 2003 Yearly Accidents per Yearly Traffic =9
31000lowast365= 795404E minus 07
To find the number of accidents per million vehicles before installation
Σ(Yearly Accidents per Yearly Traffic)
Number of Years Before Installation=
0000495
7= 0000071 = 0707
Accidents
Million Vehices
Benefit-Cost Ratio Calculation
A complete example of this calculation is provided below using data from Bridge 69006
as an example
In order to calculate the Benefit-Cost Ratio the number of crashes based on their severity
must be tallied for before and after the installation of an HFO system (Table 49)
Table 49 Number of Crashes per Year by Severity (Bridge 69006)
Year
Relative to
Installation
Year No
Injury
Possible
Injury
Non-
Incapacitating
Injury
Incapacitating
Injury Killed
-6 2003 5 0 1 0 0
-5 2004 3 1 0 0 0
-4 2005 5 2 0 1 0
-3 2006 6 0 0 0 0
-2 2007 4 0 0 0 0
-1 2008 1 0 1 1 0
0 2009 1 0 0 0 0
05 2009 0 1 0 0 0
1 2010 1 1 0 0 0
2 2011 2 1 0 0 0
3 2012 1 1 0 0 0
4 2013 4 0 0 0 0
Total
Number of
Crashes
Before 25 4 2 2 0
After 8 4 0 0 0
186
With the totals calculated (Table 49) the averages are found for each severity and
multiplied by the associated cost of crashes based on the figures given in
Table 5 The difference between the before and after associated costs is the average
annual benefit (Table 50) This average annual benefit is multiplied by four in order to
find the benefit over the average lifespan of an HFO system The average four year
benefit is divided by the estimated cost of an HFO installation (found in Table 51) to
obtain the benefit-cost ratio
Table 50 Benefit-Cost Ratio Calculation (Bridge 69006)
Severity
Average Annual Number of
Crashes
Cost of
Crash per
Severity
Associated Cost of
Crashes
Before After Before After
No Apparent Injury 3846 1778 $4400 $1692308 $782222
Possible Injury 0462 0889 $30000 $1384615 $2666667
Non-Incapacitating
Injury 0308 0 $61000 $1876923 $0
Incapacitating Injury 0308 0 $280000 $8615385 $0
Killed 0 0 $3600000 $0 $0
Total $13569231 $3448889
Average Annual Benefit (Difference) $10120342
Average Four Year Benefit $40481368
Estimated Cost of HFO Installation (From
Table 51) $3585792
Benefit-Cost Ratio (BC) 1129
187
Table 51 Calculation for Estimated Cost of HFO System Installation
Bridge
Estimated
Cost of
HFO
Installation
($ft2)
Width
(ft)
Length
(ft)
Area
(ft2)
Total
Estimated
Cost of HFO
Installation
($)
6347 $1000 28 674 18872 $18872000
9066 $500 55 1300 71500 $35750000
9067 $500 55 1300 71500 $35750000
9823 $368 42 225 9450 $3477600
14809 $567 38 163 6194 $3511998
14810 $567 38 163 6194 $3511998
69006 $368 42 232 9744 $3585792
27019 $550 40 260 10400 $5720000
86013 $550 44 193 8492 $4670600
Notes
(1) The Estimated Cost per square foot was provided by MnDOT
for every bridge except 27019 and 86013 for these two
bridges an average of $550ft2 was used based off of the other
bridges
(2) The bridge widths were estimated during site visits and with
the use of satellite imagery
(3) The bridge lengths were provided by MnDOT

copy Robert Kostick 2015
i
Acknowledgements
Dr Eshan Dave
o For making my continued academic pursuits possible and providing the
opportunity to head this project Also thanks for the confidence and
support to submit my research for publication
Jay Dailey ndash Research Engineer
o For assisting with every aspect of my research going the extra mile and
the countless times you reviewed my writing Thank you especially for the
helpful advice whenever I got in a pickle
Ben Helmer - Graduate Researcher
o Always offering to help and providing it whenever necessary
Chelsea Hoplin ndashGraduate Researcher
o For taking the time to proof read my thesis and providing valuable edits
Jared Munch - Undergraduate Researcher
o Helping with field research when an extra hand was needed
Minnesota Department of Transportation
o Providing the funding traffic control personnel for field testing and data
to make this project happen
Without the contributions made by all of the aforementioned individuals I could not have
completed this project I also want to thank my family and friends for their support and
interest in the progression of my research
ii
Abstract
In recent history the Minnesota Department of Transportation has looked to improve the
safety of bridges One improvement method is placing high friction overlays (HFO) on
bridge decks The primary goal of this research was to complete a comprehensive study
of different proprietary HFO systems placed on bridges throughout the state of
Minnesota Four different proprietary HFO systems placed on fourteen different bridges
were studied
Research was split into three separate tasks The first task was laboratory testing on
different aggregate sources used in HFO systems Second a two year field study was
conducted including observation and testing of different HFO systems placed on bridges
throughout the state of Minnesota Testing was conducted to obtain the mean texture
depth bond strength permeability and friction values of the HFO systems The third task
was the comprehensive analysis of ten years of crash data encompassing before and after
HFO systems were installed on the bridge decks Crash characteristics analyzed included
the accident time weather conditions bridge surface conditions Average Daily Traffic
and severity of accidents
Field testing and observations revealed that the extensive use of snowplows during winter
months extensively abrade the high friction systems This abrasion causes a reduction in
the surfaces friction values and reduces the life of such a system The analysis of crash
data suggests that although there is a reducing trend in overall accidents a reduction in
accidents cannot be completely attributed to the use of high friction overlays
Furthermore the presence of ice packed snow on HFO systems nullifies their high
friction values The reduction in crashes directly correlated to the installation of HFO
systems is minimal It is recommended that use of HFO systems in Minnesota be
reevaluated
iii
Table of Contents
Table of Contentshelliphelliphelliphelliphelliphelliphelliphelliphelliphelliphelliphelliphelliphelliphelliphelliphelliphelliphelliphelliphelliphelliphelliphelliphelliphelliphellip iii
List of Tableshelliphelliphelliphelliphelliphelliphelliphelliphelliphelliphelliphelliphelliphelliphelliphelliphelliphelliphelliphelliphelliphelliphelliphelliphelliphelliphelliphelliphellipviii
List of Figureshelliphelliphelliphelliphelliphelliphelliphelliphelliphelliphelliphelliphelliphelliphelliphelliphelliphelliphelliphelliphelliphelliphelliphelliphelliphelliphelliphelliphellipx
Chapter 1 Introduction of the Project 1
Introduction to High Friction Overlay Systems 1
Need for this Study 2
Objective of this Study 2
Organization of Thesis 3
Background Information 4
High Friction Overlay Systems 4
Construction of an Epoxy High Friction Overlay System 5
Bridges with an HFO system installed 8
Bridge Site Descriptions 10
Chapter 2 Literature Review 14
Minnesota Climate 14
Aggregates 16
Macrotexture and Microtexture of Aggregates 17
HFO Systems in Minnesota 18
HFO Systems in Other Sates 19
Field Observations 19
Crash Analysis 21
Skid Numbers 22
Building Off of Previous Research 24
iv
Chapter 3 Comprehensive Aggregate Testing 26
Testing Procedures and Methodology 31
Description of Standard Tests 32
Density Specific Gravity amp Absorption (Coarse Aggregate) 32
Resistance to Degradation 32
Uncompacted Void Content 33
FlatElongated Particles 34
Percent of Fractured Particles 35
Soundness of Aggregates 35
Sieve Analysis 35
Results 36
Density Specific Gravity amp Absorption 36
Resistance to Degradation 38
Uncompacted Void Content 38
FlatElongated Particles 39
Percent of Fractured Particles 42
Soundness of Aggregates 43
Sieve Analysis 44
Aggregate Laboratory Testing Summary 46
Chapter 4 Field Observations and Testing 47
Scope of Observations and Field Testing 47
Observations 48
Distresses 48
Delamination of High Friction Overlay Systems 67
v
Differences in Thickness of High Friction Overlay Systems 73
Testing Procedure and Methodology 73
Pavement Macrotexture Depth 75
Torque Bond Strength 75
Pavement Permeability 77
Skid Resistance of Paved Surfaces 79
Chloride Ion Penetration 81
Results 83
Pavement Macrotexture Depth Results 83
Bond Strength Results 92
Permeability Results 99
Surface Friction Results 102
Chloride Ion Penetration Results 116
Field Observations and Testing Summary 123
Chapter 5 Crash Data Analysis 125
Causes of Crashes in Minnesota 125
Data Collection 128
Analytical Comparison 129
Cause of Crashes 130
Severity of Crashes 131
Time of Crashes 132
Surface Conditions 132
Crashes Before and After HFO System Installation 134
Severity Before and After 135
vi
Surface Conditions Before and After 135
Normalized to Traffic Levels Before and After 137
Comparison of Year-1 and Year-2 Crashes 137
Comparison of Different HFO Systems 140
Comparing the Four Different Proprietary HFO Systems 141
Comparison of Poly-Carb Systems Using Different Aggregates 144
Comparison of Side by Side Bridges with and without HFO System Overlays 145
Comparison of Crashes Normalized to Total Crashes in Minnesota 147
Comparison of Crashes with the Sitersquos Surface Friction Values 149
Benefit-Cost Ratio Analysis 152
Crash Analysis Summary 154
Chapter 6 Summary Conclusions and Recommendations 157
Summary 157
Conclusions 158
Recommendations 161
References 164
Appendix 169
Chapter 3 Appendix 169
Density Specific Gravity amp Absorption (Fine Aggregate) Data 169
Resistance to Degradation Los Angeles Machine Data 171
Uncompacted Voids Data 171
FlatElongated Particles 172
Soundness of Aggregate Freeze Thaw Data 174
Sieve Analysis 175
vii
Chapter 4 Appendix 178
Mean Texture Depth 178
Coefficient of Permeability 178
Friction Testing 179
Chloride Ion Penetration 180
Chapter 5 Appendix 183
Data for Contributing Factors in Crashes 183
Sample Calculation Number of Accidents per Million Vehicles Crossing 184
Benefit-Cost Ratio Calculation 185
viii
List of Tables
Table 1 Property of Bridges with an HFO system 9
Table 2 Bridges Located in Each of the Three Regions 15
Table 3 Average Winter Temperatures Precipitation and Snowfall for the Different
Regions of Minnesota (October-March) 16
Table 4 Test Methods and the High Friction Overlay Benefit Evaluated 20
Table 5 Associated Costs with Different Crash Types (MnDOT) 22
Table 6 Average Skid Numbers for HFO Systems on Bridges (Data from 2011 to 2013)
24
Table 7 Aggregate Information 27
Table 8 Properties and Preliminary Test Method 31
Table 9 Density 36
Table 10 Specific Gravity 37
Table 11 Absorption 37
Table 12 Loss by Abrasion in LA Abrasion Machine 38
Table 13 Uncompacted Void Content Data 38
Table 14 MnDOT Chip Seal Gradation Requirements 45
Table 15 Site Visit Dates 48
Table 16 Properties and Test Method 74
Table 17 Number of Sample Cores Taken in Various Years 83
Table 18 Baseline Surface Texture Attributes 84
Table 19 Permeability Results 100
Table 20 Coefficient of Permeability Ranges for Different Paved Surfaces 101
Table 21 Percent Change of Crash Emphasis Areas 128
Table 22 Surface Conditions during all Crashes 132
Table 23 Total Number of Crashes to Occur (2012- Oct 2014) 137
Table 24 Details of Bridges in Side by Side Comparison 146
Table 25 Average Annual Benefits Estimated Costs of HFO Installation and Four Year
Benefit-Cost Ratios 153
ix
Table 26 Average Annual Benefits of Bridges without an HFO System Installed 154
Table 27 Specimen Mass Data 169
Table 28 Absorption Data 170
Table 29 Los Angeles Machine Degradation (Test Samples of Grading D) 171
Table 30 Uncompacted Voids Data 171
Table 31 Basalt - FlatElongated Particles 172
Table 32 Taconite A- FlatElongated Particles 173
Table 33 Taconite B- FlatElongated Particles 173
Table 34 SafeLane- FlatElongated Particles 173
Table 35 Freeze Thaw Resistance Data 174
Table 36 Basalt Sieve Analysis 175
Table 37 Flint Sieve Analysis 175
Table 38 Taconite A Sieve Analysis 176
Table 39 Taconite B Sieve Analysis 176
Table 40 SafeLane Sieve Analysis 177
Table 41 Average Skid Number Test Results 179
Table 42 Chloride Content on Bridge 9823 (Tested Oct 11 2011) 180
Table 43 Chloride Content on Bridge 9823 (Tested Dec 1 2014) 180
Table 44 Chloride Content on Bridge 69006 (Tested Oct 15 2010) 181
Table 45 Chloride Content on Bridge 69006 (Tested Sep 5 2011) 181
Table 46 Chloride Content on Bridge 69006 (Tested Dec 1 2014) 182
Table 47 Data for Contributing Factors 183
Table 48 Data to Calculate Number of Crashes Normalized to AADT for Bridge 9066
184
Table 49 Number of Crashes per Year by Severity (Bridge 69006) 185
Table 50 Benefit-Cost Ratio Calculation (Bridge 69006) 186
Table 51 Calculation for Estimated Cost of HFO System Installation 187
x
List of Figures
Figure 1 Sandblasting a Concrete Deck to Prepare the Surface for an HFO System 5
Figure 2 Construction Joints are Prepared 6
Figure 3 Epoxy is Placed and Leveled 6
Figure 4 Aggregate is sprayed onto the Layer of Epoxy 7
Figure 5 Construction Chain in a Small Proximity 7
Figure 6 Final Epoxy HFO System (Left Side Epoxy HFO Lane Right Side Concrete
Deck that Still Requires the Placement of an HFO Surface) 8
Figure 7 Macrotexture and Microtexture of Aggregates (Source Nelson 2011) 18
Figure 8 Basalt Aggregate 28
Figure 9 Flint Aggregate 29
Figure 10 Taconite-A Aggregate 29
Figure 11 Taconite-B Aggregate 30
Figure 12 SafeLane Aggregate 30
Figure 13 Los Angeles Machine 33
Figure 14 Aggregate Sample Falling into Calibrated Cylinder 34
Figure 15 FlatElongation Measuring Equipment with Sorted Aggregate 35
Figure 16 Particle Dimensions per ASTM D4791-10 (Source ASTM D4791-10 2010)
39
Figure 17 Flat and Elongated Particles (21 Ratio) 40
Figure 18 Flat and Elongated Particles (31 Ratio) 41
Figure 19 Flat and Elongated Particles (51 Ratio) 42
Figure 20 Percent Lost Due to Freeze Thaw 43
Figure 21 Percent Lost Due to Freeze Thaw (Normalized to Sample Size) 44
Figure 22 Sieve Analysis Compared to MnDOT Chip Seal Requirements 45
Figure 23 Construction Joint (Bridge 9066) 49
Figure 24 Differences on Both Sides of the Construction Joint (Bridge 14809) 50
Figure 25 Polished Areas along Bridge 6347 51
xi
Figure 26 Proper Epoxy Levels (Left Side) Next to Area with Excessive Epoxy (Right
Side) 51
Figure 27 Transverse Snowplow Abrasion (Br 4190) 52
Figure 28 Existing Macrotexture on Bridge 27758 53
Figure 29 Polished Area on Bridge 27758 along with Transverse Cracks 53
Figure 30 Excessive Snow Plow Abrasion (Br 27758) 54
Figure 31 Thin Epoxy System (Br 27758) 55
Figure 32 Uneven Snowplow Abrasion due to Uneven Roadway Elevation (Br 86019) 56
Figure 33 Missing Overlay System near Expansion Joints on Transpo System (Br 27758)
56
Figure 34 Joint Abrasion on Bridge 69006 (Traffic Moves from Left to Right) 57
Figure 35 Joint Damage on Bridge 9066 (Traffic Moves from Left to Right) 58
Figure 36 Damage near Approach Panels on Poly-Carb System (Bridge 69006) 59
Figure 37 System Removal near Joint on NovaChip System (Bridge 86019) 59
Figure 38 Texture Comparison of Br 4190 (Left Proper Aggregate Macrotexture Right
Aggregate Raveling) 60
Figure 39 Comparison of Loss of Aggregate between Novachip (Left) SafeLane
(Middle) and Poly-Carb (Right) Systems 62
Figure 40 Wheel Path Polishing (Br 9066) 63
Figure 41 Close View of Polished Area (Br 9066) 63
Figure 42 Transverse Cracks on Bridge 27758 64
Figure 43 Transverse Crack near Expansion Joint of Bridge 6347 65
Figure 44 Longitudinal Crack in Novachip System (Br 27019) 66
Figure 45 Reflective Cracking in Novachip System (Br 27019) 66
Figure 46 Delamination of Transpo System on Bridge 6347 along Centerline 67
Figure 47 Delamination of HFO on Robert Street Bridge (Br 9036) 68
Figure 48 Minimal Bond Strength Existed in the Distressed Areas (Br 9036) 69
Figure 49 Delaminated Area during Maintenance (Br 4190) 69
Figure 50 Expansion Joint on Bridge 9066 70
xii
Figure 51 Robert Street (Br 9036) Expansion Joints Both North (Bottom) and South
(Top) of Delamination 72
Figure 52 Bridge 4190 (TH 55) Expansion Joint 72
Figure 53 System Thickness Comparison Left Poly-Carb System Right Novachip
System 73
Figure 54 Mean Texture Depth 75
Figure 55 Torque Wrench and Attached Plates (Br 69006) 76
Figure 56 Plate with Debonded Overlay (Br 9036) 76
Figure 57 Plate with Debonded Overlay (Br 14810) 77
Figure 58 Permeability Test over Cracked Overlay (Br 9823) 78
Figure 59 Dynamic Friction Tester 80
Figure 60 Cutting Configuration of a Sample Core 82
Figure 61 Mean Texture Depth (Year-1 Driving Lane) 85
Figure 62 Mean Texture Depth (Year-2 Driving Lane) 86
Figure 63 Mean Texture Depth (Year-2 Passing Lane) 87
Figure 64 Mean Texture Depth Comparison 89
Figure 65 Mean Texture Depth Comparison of 2013 (Year-1) to 2014 (Year-2) Values 90
Figure 66 Relative Difference between Wheel and Non-Wheel Path MTD Normalized to
Total Traffic 91
Figure 67 Year-1 Torque Test Results 93
Figure 68 Various Degree of Removal Including No Removal (Left) Partial
Removal (Middle) and Total Removal (Right) 95
Figure 69 Torque Bond Test Results 96
Figure 70 Comparison of Poly-Carb with Flint (Left) and SafeLane Torque Removal
Samples 97
Figure 71 Percentage of Tests in the Driving Lane Removing HFO Systems from the
Bridge Deck 98
Figure 72 Percentage of Tests in the Passing Lane Removing HFO Systems from the
Bridge Deck 99
xiii
Figure 73 Area of Bridge 9824 Tested for Permeability 101
Figure 74 Average Ribbed Tire Skid Number over Time 103
Figure 75 Average Smooth Tire Skid Number over Time 104
Figure 76 Bridge 14810 (Barnesville MN) Average Skid Numbers 106
Figure 77 Skid Number Comparison (2012 vs 2013) 107
Figure 78 Skid Numbers for Bridge 27758 (Penn Ave Minneapolis) 108
Figure 79 Distresses Helping to Increase the MTD and Skid Numbers on Bridge 27758
109
Figure 80 Coefficient of Friction throughout Duration of DFT Testing 110
Figure 81 Average Coefficient of Friction at 60 kmh for Wheel and Non-Wheel Paths
Results from Dynamic Friction Tester Results 111
Figure 82 Comparison of Coefficient of Friction Found using the Skid Trailer and DFT
112
Figure 83 Coefficient of Friction versus the Number of Years in Service 114
Figure 84 Trends between the Mean Texture Depth and Coefficient of Friction for the
Different HFO Systems 115
Figure 85 Driving Lane Chloride Content in parts per million during 2011 (Bridge 9823)
117
Figure 86 Driving Lane Average Chloride Content in parts per million (Bridge 9823) 118
Figure 87 Passing Lane Average Chloride Content in parts per million (Bridge 9823) 119
Figure 88 Driving Lane Average Chloride Content in parts per million (Bridge 69006)
120
Figure 89 Passing Lane Average Chloride Content in parts per million (Bridge 69006)
121
Figure 90 Total Crashes Compared to the ADT 131
Figure 91 Accumulation of Packed Ice and Snow due to Traffic Loads 133
Figure 92 Severity of crashes before and after installation of an HFO system 135
Figure 93 Average number of crashes annually per surface condition before and after
installation of HFO systems 136
xiv
Figure 94 Number of Crashes on Each Bridge during Summer (April-September) and
Winter (October-March) Months 139
Figure 95 Surface Conditions Present during Crashes in from 2012 to 2014 140
Figure 96 Comparing the average number of crashes annually per surface conditions
before and after installation of different HFO systems 142
Figure 97 Number of crashes per million vehicles crossing bridge before and after
installation of different HFO systems 143
Figure 98 Comparing the average number of crashes annually per surface condition
before and after installation of Poly-Carb systems with different aggregates 145
Figure 99 Side by side comparison of average number of crashes annually before and
after the installation of HFO systems 147
Figure 100 Average percentage of total Minnesotan crashes occurring on each bridge
before and after installation of HFO systems 148
Figure 101 Side by side comparison of the percentage of total accidents in Minnesota
across time 149
Figure 102 Skid Numbers versus the number of crashes per million vehicles 150
Figure 103 Coefficient of Friction and SN100 versus the number of crashes per million
vehicles 151
1
Chapter 1 Introduction of the Project
Introduction to High Friction Overlay Systems
Improving the safety of roadways has been an objective since the arrival of automobiles
at the turn of the 20th century and the advent of paving roadways Beginning in the 1990rsquos
the Minnesota Departments of Public Safety and Transportation began looking at ways to
reduce serious injuries and fatal crashes on Minnesota roadways In 2003 a program
called Towards Zero Deaths (TZD) was initiated It is an interdisciplinary safety program
through the Departments of Public Safety Transportation and Health With this program
the state strives for zero deaths on roadways through education engineering
enforcement and emergency medical and trauma services Over the past decade the TZD
program has been a spearhead in traffic safety (MnDOT 2014)With the harsh winter
conditions that exist in the state of Minnesota there is a great need to provide safe driving
conditions throughout the entire year Over the last ten years the Minnesota Department
of Transportation (MnDOT) has employed high friction overlays (HFO) as a possible
anti-icing and anti-skid solution
A high friction overlay is a thin overlay (less than one inch [25 cm]) which consists of
fine aggregate embedded into an epoxy or asphalt overlay creating a pavement wear
course Epoxy overlays are generally constructed in two lifts in order to ensure that the
aggregate does not settle to the bottom of the binder (Cargill 2014) Asphalt overlays are
constructed in a single lift (Midland 2014) Although more expensive compared to a
traditional overlay (asphalt or concrete) an HFO has several benefits (1) lighter dead
load (2) fast cure time (3) shallow depths eliminating the need to raise approach panels
(4) a waterproof wear surface and (5) high skid resistance (Harper 2007) Several
different HFO systems have been placed on bridge decks across the state of Minnesota in
order to observe and assess how high friction overlay systems work in cold climates and
if they provide benefits for Minnesotarsquos roadways
2
Need for this Study
With the continual strive for safer roads MnDOT has invested resources into the use of
HFO systems In 2010 a report was published by MnDOT summarizing research
conducted on SafeLane high friction overlays placed within the state This past research
studied three bridge locations for three years after the installation of SafeLane HFO
systems A more in depth summary of this study is found later in the literature review
(Chapter 2) however one of the major conclusions in the report was the recommendation
for further research of HFO systems (Evans 2010) Funding for the current research was
allocated based on this recommendation Several additional HFO systems were placed in
Minnesota between 2008 and 2011 This current research improves upon the past
research by encompassing these additional bridges and conducting research several years
after their installation These conditions allow for a study encompassing more bridges
more testing and longer time intervals since the installation of the HFO systems
Objective of this Study
The purpose of this project is to provide a comparative analysis of the different HFO
systems with two objectives The first is to investigate the HFO systems and provide a
comparative analysis of the different systems that evaluates the safety aspects they
provide The second objective is to serve as a model for future research involving HFO
systems and their benefits in the reduction of crashes
In order to ascertain the benefits of placing an HFO system on a bridge deck extensive
research of each system and the multiple variables at each location is required A
comparative analysis can be provided through the observation testing and data analysis
of different conditions and performances for each HFO system
This study will look to answer several questions regarding HFO systems including
(1) How do HFO systems perform in cold weather climates that exist in Minnesota
(2) Do HFO systems provide benefits that reduce crash rates on bridges
3
(3) Is there a correlation between surface friction values of an HFO system and their
crash rates
(4) Do the benefits that HFO systems provide to Minnesota bridge decks justify their
use in the state
Organization of Thesis
This thesis begins by providing background information of the high friction overlay
systems that are covered in this study as well as the locations across the state where the
different systems were installed An extensive literature review was performed to gain
insight on previous research conducted on HFO systems in Minnesota as well as in other
states (Chapter 2) Following the literature review research was broken into three
different tasks Chapter 3 is a compilation of laboratory tests performed on different
aggregate sources used in HFO systems Chapter 4 is a two year field investigation which
encompassed site visits to the different bridges with HFO systems Field tests and
extensive observations were conducted Chapters 3 and 4 are broken down into two main
parts First is the scope of testing and observations completed second the results of
testing and observations are presented Chapter 5 is a comparative analysis of crash data
for the bridges with HFO systems This analysis covers over a decade of crash data
provided by MnDOT The thesis culminates with a summary that ties together the results
of the three tasks in order to make appropriate conclusions and recommendations for the
entire study (Chapter 6) Following Chapter 6 are the References and Appendices These
sections provide sources data and calculations used to complete the research
4
Background Information
The following is a short overview of the four different proprietary HFO systems studied
as well as a look at the different locations in Minnesota where the HFO systems were
installed
High Friction Overlay Systems
Four types of proprietary high friction overlays are included in this study
Poly-Carb HFO systems (product of POLY-CARB Inc a subsidiary of The
Dow Chemical Company) are epoxy based overlay systems that use Mark 174
epoxy with a nominal maximum aggregate size (NMAS) of 0187 inch (476
mm) Poly-Carb HFO systems are placed in a similar method as a chip seal
SafeLane HFO systems (product of Cargill Inc) are an epoxy overlay system
with a nominal maximum aggregate size (NMAS) of 0375 inch (95 mm)
SafeLane HFO systems are placed in a similar method as a chip seal
Transpo HFO systems (product of Transpo Industries Inc) are an epoxy overlay
system using T-48 epoxy with a nominal maximum aggregate size (NMAS) of
0187 inch (476 mm) Transpo HFO systems are placed in a similar method as a
chip seal
Novachip HFO system (patented system of RoadScience LLC) are a thin-bonded
open graded asphalt overlay with a 0375 inch (95 mm) nominal maximum
aggregate size (NMAS) Novachip HFO systems are placed in a similar method as
a thin asphalt overlay Novachip systems act more like thin asphalt overlays than
like the epoxy based systems above
In this study three different types of aggregates were used in Poly-Carb systems overlays
including basalt flint and taconite A description of the aggregates is found in the
Aggregate section of Chapter 2
5
Several different variables exist between the proprietary HFO systems including (1)
epoxy or asphalt overlay system type (2) type and source of aggregate (3) type of epoxy
(4) date of construction and (5) contractor performing installation
Construction of an Epoxy High Friction Overlay System
A short summary of construction processes observed during a site visit to Bridge 5718 in
Sandstone MN is provided for better insight on how an HFO system is placed on a
bridge deck
The system placed was a Poly-Carb system with basalt aggregate Construction was
performed by PCiRoads a highway construction company based out of St Michael MN
and was observed on September 4 2013
First the bridge deck is prepared by sandblasting the surface (Figure 1) This is done to
provide a rough surface that will provide more surface area for the epoxy to adhere to
Figure 1 Sandblasting a Concrete Deck to Prepare the Surface for an HFO System
6
The deck is cleaned after the sandblasting operation and the construction joints are
prepared in order to create a level surface where adjacent lanes meet (Figure 2)
Figure 2 Construction Joints are Prepared
Epoxy is sprayed onto the roadway from a tanker truck and leveled using squeegee
brooms (Figure 3)
Figure 3 Epoxy is Placed and Leveled
7
Aggregate is sprayed onto the fresh epoxy from a hopper Once the aggregate is placed in
the epoxy it is not adjusted (Figure 4)
Figure 4 Aggregate is sprayed onto the Layer of Epoxy
The entire construction process is conducted from a single truck keeping the work within
a small proximity (Figure 5)
Figure 5 Construction Chain in a Small Proximity
8
Once the aggregate is placed the system is left to cure (Figure 6) The epoxy used in
HFO systems has a fast curing time and is able to take traffic loads within a few hours of
installation completion
Figure 6 Final Epoxy HFO System (Left Side Epoxy HFO Lane Right Side Concrete
Deck that Still Requires the Placement of an HFO Surface)
Bridges with an HFO system installed
In total fourteen bridges in ten different locations were included in the study however
only eleven of the bridges are the main focus of research The bridges are of various
dimensions and carry different traffic loads at various speeds These various
characteristics of the bridges will be discussed further in subsequent sections The eleven
main bridges in this study were identified in the research work plan provided by MnDOT
Due to construction and maintenance schedules three other bridges with epoxy systems
outside the work planrsquos scope were visited The observations conducted on these three
bridges provided further data to compliment the study Bridge 4190 (TH 55) and Bridge
9036 (Robert St) had traffic control in place to repair damaged sections of the epoxy
systems Bridge 5718 (TH 123) had an epoxy system placed in 2013 allowing for the
observation of construction practices Basic bridges properties are contained in Table 1
All bridges in this study have the HFO system placed on top of concrete decking
9
Table 1 Property of Bridges with an HFO system
Bridge
Number Location
Road-
way
System
Type
Year
HFO
Installed
Year
Bridge
Built
ADT SR
6347 Osceola TH
243 Transpo 2010 1953 7600
656
(Adeq)
9066 Moorhead I-94
WB
Poly-
Carb 2010 1958 31000
916
(FO)
9067 Moorhead I-94
EB
Poly-
Carb 2010 1958 31000
936
(Adeq)
9823 Atkinson I-35
SB
Poly-
Carb 2009 1965 8200
943
(Adeq)
14809 Barnesville I-94
WB SafeLane 2007 1968 7900
925
(Adeq)
14810 Barnesville I-94
WB SafeLane 2007 1968 7900
974
(Adeq)
27019 Otsego TH
101 Novachip 2008 1993 19750
985
(Adeq)
27758 Minneapolis Penn
Ave Transpo 2008 1986 10300
922
(Adeq)
69006 Virginia US 53
NB
Poly-
Carb 2009 1969 11950
962
(Adeq)
86013 Otsego CSAH
36 Novachip 2008 2006 7700
994
(Adeq)
86019 Otsego CSAH
36 Novachip 2008 2006 5000
996
(Adeq)
10
Additional Bridges
4190 St Paul TH 55 Poly-
Carb 2011 1926 42500
848
(Adeq)
5718 Sandstone TH
123
Poly-
Carb 2013 1948 2050
623
(Adeq)
9036 St Paul Robert
St
Poly-
Carb 2011 1926 19000
740
(FO)
ADT = Average Daily Traffic
SR = Sufficiency Rating
Adeq = Adequate Structure
FO = Functionally Obsolete
Note All information in this table was taken from the List of Minnesota Bridges as
reported by the Minnesota Department of Transportation dated June 23 2009
Bridge Site Descriptions
Different variables exist between the bridge locations Some of these differences include
(1) the average daily traffic (ADT) (2) traffic speeds (3) roadway alignment (4) bridge
structure and (5) winter maintenance practices The different lengths and widths of each
bridge are listed in the Appendix and used for some later calculations The following
subsections provide a short description of each bridge Multiple lanes were considered for
bridges numbered between 9066 and 14810
Bridge 4190
Bridge 4190 is located in St Paul MN and is one of the three additional bridges in the
study The bridge is a four lane roadway with two outside shoulders and two four-foot
interior shoulders with a concrete median The bridge allows Trunk Highway (TH) 55 to
cross over the Minnesota River The eastbound lane was studied during the site visit
11
Bridge 5718
Bridge 5718 is located in Sandstone MN and is one of the three additional bridges in the
study It is a two lane bridge with one shoulder and a concrete sidewalk The bridge
allows Trunk Highway 123 to cross over the Kettle River
Bridge 6347
Bridge 6347 is located at the Minnesota border crossing the St Croix River to Osceola
WI It is a two lane bridge with two four-foot shoulders The bridge connects Minnesota
and Wisconsin via Trunk Highway 243 An HFO system exists across the entire bridge
surface The eastbound lane was studied during the site visit however due to inclement
weather minimal testing was conducted
Bridge 9036
Bridge 9036 is a four lane bridge that allows Robert Street to cross over the Mississippi
River It is one of the three additional bridges in the study The bridge is located in
downtown St Paul MN The northbound lane was studied during the site visit
Bridge 9066
Bridge 9066 is located in Moorhead MN It is a three lane bridge with two shoulders that
allows westbound Interstate 94 to cross over the Red River
Bridge 9067
Bridge 9067 is located in Moorhead MN It is a three lane bridge with two shoulders that
allows westbound Interstate 94 to cross over the Red River
Bridge 9823
Bridge 9823 is located on southbound Interstate 35 near Atkinson MN The bridge
crosses over a county road (Old Highway 61) and has two lanes and a shoulder The
bridge has a curve in its alignment as well as a negative grade
12
Bridge 14809
Bridge 14809 is located in Barnesville MN The bridge has two lanes and a shoulder It
is a railroad overpass allowing westbound Interstate 94 to cross over the tracks The
location of the bridge is completely surrounded by open farm land
Bridge 14810
Bridge 14810 is located in Barnesville MN The bridge has two lanes and a shoulder It
is a two lane railroad overpass allowing eastbound Interstate 94 to cross over the tracks
The location of the bridge is completely surrounded by open farm land
Bridge 27019
Bridge 27019 is located in Otsego MN The bridge allows the two southbound lanes of
Trunk Highway 101 to cross over the Crow River
Bridge 27758
Bridge 27758 is located in Minneapolis MN The bridge allows a local road Penn Ave
to cross over Interstate 394 just west of downtown Minneapolis The bridge has four
lanes (two driving lanes and two turn lanes) with a curb median separating the two
directions of traffic The overlay system only covers the northbound lanes
Bridge 69006
Bridge 69006 is located on US Highway 53 headed northbound in Virginia MN The two
lane bridge crosses over a local road and has a curve in its alignment as well as a negative
grade
Bridge 86013
Bridge 86013 allows CSAH 36 to cross over TH 101 in Otsego MN The bridge crosses
just north of Bridge 27019rsquos location has six lanes (four driving lanes and two turn lanes)
and two shoulders The HFO system is only placed on the westbound lanes
13
Bridge 86019
Bridge 86019 allows CSAH 36 to connect with TH 101 in Otsego MN The bridge
crosses over the Crow River and merges with TH 101 just south of Bridge 27019rsquos
location The bridge has one lane and two four-foot shoulders
14
Chapter 2 Literature Review
Literature from the different proprietary companies market the HFO systems to provide
three features that improve the infrastructure they are placed on (1) increased friction (2)
infrastructure protection and (3) crash reduction These three features are all provided by
HFO systems to keep drivers safer (Cargill 2014) Previous research has been conducted
in order to evaluate if HFO systems provide the benefits they claim and such evaluation
is also the main objective of this research This study however varies from previous
research in two ways the climate the research is conducted in and the scale of the project
The first difference is the climate Harsh winter climates exist in Minnesota and often
these climates last four to six months out of the year Not only do the winter elements
take a toll on infrastructure but so do the winter maintenance practices A large portion
of previous research has taken place in more mild climates that does not encounter such
extreme conditions and heavy use of snow plows The second variation from previous
research is that this research has a larger scope Previous studies have had a similar time
frame number of bridges investigated number of proprietary products investigated
number of tests conducted or scale of analytical comparison for crash data but each
previous study has only focused on a few of these variables
This study is comprehensive and provides a complete look at different HFO systems and
the variables that affect the life of the system The research was conducted in an
environment that truly tests the HFO systemrsquos winter performance
Minnesota Climate
Minnesota part of the Upper Midwest Region is located in the northern part of the
continental United States The state has a continental climate which is a climate with
large annual variations in temperature With a record minimum temperature of -60
degrees Fahrenheit [-51 Celsius] in 1996 and record maximum temperature of 114
degrees Fahrenheit [46 Celsius] in 1936 (MnDNR 2014a) roadways in Minnesota are
exposed to a variety of conditions The mean annual temperature ranges from 36 degrees
15
Fahrenheit [2 Celsius] in the northern part of the state to 49 degrees Fahrenheit [9
Celsius] in the south Average annual precipitation in the state ranges from 19 inches [48
cm] in the north to 39 inches [99 cm] in the south Seasonal snowfall averages from 70
inches [178 cm] in the northeast to 40 inches [102 cm] in the south Heavy snowfalls of
over four inches [10 cm] are common place between the months of November and April
(MnDNR 2014a)
Snowfall and cold temperatures during these months can create safety concerns on
roadways and especially bridges as surfaces become wet andor frozen It is because of
these conditions that authorities are constantly researching ways to improve the winter
time safety of roadways and the reason high friction overlays are being looked at by the
statersquos Department of Transportation The bridges in this study can be broken into three
distinct regions of the state northwest northeast and central Minnesota The bridges
located in each region are listed below in Table 2 Climatic information regarding these
three regions can be found below in Table 3 The information in this table is from the
Minnesota Department of Natural Resources and was collected by major airport weather
stations in Fargo ND (northwest region) Duluth (northeast region) and MinneapolisSt
Paul (central region) (MnDNR 2014b) The main weather concerns occur during the
winter months which for this research is considered between the months of October and
March
Table 2 Bridges Located in Each of the Three Regions
Region Bridges Located in Region
Northwest 9066 9067 14809 and 14810
Northeast 9823 69006
Central 6347 4190 5718 9036 27019 27758 86013 and 86019
16
Table 3 Average Winter Temperatures Precipitation and Snowfall for the Different
Regions of Minnesota (October-March)
Region Northwest Northeast Central
Weather Station Location Fargo Duluth Minneapolis
St Paul
Mean Daily Max (degF) [degC] 310 [-05] 303 [-09] 354 [19]
Mean Daily Min (degF) [degC] 128 [-107] 134 [-103] 191 [-72]
Normal Precipitation
(inches) [cm] 10 [25] 15 [38] 15 [38]
Normal Snowfall per Month
(inches) [cm] 74 [188] 127 [323] 87 [221]
This cold region provides an excellent location to test and observe if HFO systems
provide their design benefits during winter conditions
Aggregates
In this study three different types of aggregates were used in Poly-Carb overlays The
three different aggregates are basalt flint and taconite The basalt aggregate is a crushed
(igneous) river rock from Washington The flint aggregate was quarried in Oklahoma
and the taconite aggregate is a byproduct of mining operations in northern Minnesota A
more geological description of taconite is that ldquotaconite is an iron-bearing sedimentary
rock composed of alternating chert and slate units of varying thicknessrdquo (Zanko
Fosnacht amp Hopstock 2009) SafeLane uses a proprietary aggregate that consists of
Limestone (Cargill 2014)
Since the friction values of the HFO systems come from the macrotexture and
microtexture of the aggregate its strength and integrity are important The soundness and
durability of aggregates are especially important when used in cold climate regions
(Mamlouk 2011) Cold climate regions require aggregates to have a high resistance of
degradation due to abrasion and freeze thaw damage This resistance to degradation is
17
especially important in HFO systems as opposed to traditional concrete pavements
because the aggregates are directly exposed to loads abrasion and weather The abrasion
resistance of aggregates can be tested through several tests including the use of a Los
Angeles abrasion machine (ASTM C131 2014) and in a freeze-thaw chamber in
accordance to AASHTO T103-08
The shape of aggregate particles can help improve the resistance to abrasion and friction
values of aggregates Aggregate particles with multiple faces have sharper corners
compared to particles with smooth features HFO systems need aggregates with these
rough features to increase the overall surface friction as well as improving the bonding
with an epoxy or asphalt binder (Mamlouk 2011) Flat and elongated aggregates have a
dimension that is significantly smaller compared to the other dimensions of the particle It
is desirable to have aggregates with even dimensions because thin aggregates are more
likely to break along a plane parallel to its smallest dimension Aggregates of cubical
shape will create an even friction surface once placed into an epoxy or asphalt matrix
The shape of aggregates in HFO systems are tested through ASTM D5821-13 (percent of
fractured faces) and ASTM D4791 (flat and elongated particles)
Macrotexture and Microtexture of Aggregates
The macro- and microtexture of aggregates are an important aspect of HFO systems
These two types of texture contribute to the higher friction found in such systems
Macrotexture is the texture supplied by the shape of an aggregate Aggregates with sharp
edges and crushed faces have a higher macrotexture compared to rounded aggregates
Microtexture is the texture found on the surface of an aggregate High microtexture
indicates that an aggregate has a rough or unpolished surface An illustration of these two
types of textures relative to a roadway is shown in Figure 7
18
Figure 7 Macrotexture and Microtexture of Aggregates (Source Nelson 2011)
Both types of texture are important for the high friction in HFO systems Distresses that
reduce these textures over time are discussed later in Chapter 4
HFO Systems in Minnesota
MnDOT has previously performed a study evaluating HFO systems for crash reduction
on bridges The three year study was conducted from 2006 to 2009 and looked at three
different locations where SafeLane HFO systems were installed The locations were
Alexandria Barnesville (the SafeLane bridges in this study) and Bemidji The
researchers also observed the installation of a SafeLane HFO system in Hibbing The
research looked at several aspects of the system including (1) bonding to the deck (2)
chloride intrusion prevention (3) chloride retention on surface (4) traction
measurements and (5) accident reduction
The study came to several conclusions including that when properly placed a strong
adherent bond between the HFO system and the bridge deck is developed This bond
provides excellent protection against the intrusion of chloride and it is inferred that this
protection will help decrease the corrosion of reinforcing steel in the underlying bridge
19
deck over its service life The overlays provided an improved traction and retained
deicing chemicals on the surface to help prevent the buildup of ice The research
concluded that the HFO systems reduce accident rates both directly (improved traction)
and indirectly (deicing chemical retention)
The study also concluded that ldquosignificant rapid wearrdquo occurs primarily due to snow
plow shearing forces (abrasion) as well as from traffic loads in the wheel path One of the
bridges in the study (Hibbing MN) had a skid number (SN) of 80 when installed in 2006
By 2009 the SN of the HFO system had dropped to 35 (Evans 2010) A description of
skid numbers is later in this chapter Due to heavy abrasion the service life of an HFO
system in Minnesota is estimated at 35 to 5 years
Finally the report concluded that the study was too short and a more comprehensive study
that encompasses other proprietary HFO systems should be conducted (Evans 2010)
HFO Systems in Other Sates
Previous research of HFO systems has been conducted in other states including Missouri
(Harper 2007) Colorado (Young Durham amp Bindel 2012) Vermont (Tremblay 2013)
Washington (Anderson et al 2012) and Wisconsin (Izeppi 2010) When discussing
HFO systems with a Transpo representative during a site visit he mentioned that HFO
systems were becoming especially popular in Kansas and Missouri Previous research can
be broken down into two different tasks field observation and crash analysis
Field Observations
Previous research of HFO systems has been conducted to evaluate the performance of
such systems in the field The two main questions research has looked to answer are (1)
how do HFO systems perform in the field (2) What is the service life of an HFO
system The most extensive research is in the field performance of HFO systems Several
studies test the mean texture depth bond strength chloride penetration and skid
resistance (Young Durham amp Bindel 2012) Each of these test methods help to evaluate
different aspects of HFO systems in order to answer the previous questions about HFO
systems Below in Table 4 the different test methods used by previous research are listed
20
Each test is used to help evaluate one or more of the three benefits that HFO systems
provide It should be noted that the permeability test was added to this table because of its
use in this study A further description of how tests are conducted is provided later in
Chapter 4
Table 4 Test Methods and the High Friction Overlay Benefit Evaluated
Test Method HFO System Benefit
Mean Texture Depth Higher Friction
Bond Strength Infrastructure Protection
Permeability Test Infrastructure Protection
Chloride Ion Penetration Infrastructure Protection
Skid Resistance Higher Friction and Crash Reduction
A declination in the mean texture depth and skid resistance over time are both common
results found in previous research The skid resistance is often monitored to observe how
long systems keep skid numbers over 50 (Tremblay 2013) Skid numbers and their use in
research is expanded upon in its own section later in this literature review
Along with the performance of the aforementioned tests another important aspect to
observe during site visits include distresses that occur in HFO systems
Distresses observed in previous studies that can lead to the failure of an overlay system
include aggregate raveling delamination or polishing of the aggregate (Izeppi 2010)
Aggregate raveling and polishing reduce the friction values of HFO systems while
delamination eliminates the infrastructure protection benefit (Harper 2007) Research
conducted in Missouri looked into the cause of an HFO system delamination which is
the separation of the HFO system from the bridge deck surface The research noted that
data sheets of the Sikadur 22 Lo-Mod (Epoxy System) states that a concrete bridge deck
should be free of moisture before installation however some contractors consider ldquofree of
moisturerdquo to be no standing water on the bridge deck The research recommends the use
of ASTM D 4263 ldquoStandard Test Method for Indicating Moisture in Concrete by the
21
Plastic Sheet Methodrdquo in order to ascertain whether there is any moisture in the bridge
deck (Harper 2007)
The testing and observations are conducted in order to evaluate the performance of HFO
systems and to assess their life span (Izeppi 2010) This life span can be shortened even
before traffic is placed on an HFO system due incorrect application and distribution of
epoxy and aggregates during construction Often it is difficult to apply the correct
amounts of material and inexperienced personnel may be unable to apply HFO systems to
bridge decks uniformly (Anderson 2012) The multitude of variables that can lead to a
shorter life span in HFO systems highlights the need for comprehensive field
observations and evaluation
Crash Analysis
Previous research has used crash analysis as a means to justify the use of an HFO system
Research has been conducted on HFO systems in order to answer two questions
regarding crashes on bridges (1) does the higher friction reduce the amount of crashes or
the severity of crashes on a bridge (2) If so do HFO systems provide an economical
benefit through this reduction in crashes
Several studies have investigated the crash rates both before and after the installation of
HFO systems In Wisconsin the study looked at four different bridges and studied a six
year span of crash data including three years of data before and three years after the
installation (Izeppi 2010) The study notes a decrease in crash rates during the post-
installation years A study conducted in Colorado investigated HFO systems Part of the
study looked at accident history with results that were inconclusive if the number of
weather related accidents was reduced after the installation of an HFO system (Young
Durham amp Bindel 2012)
An economical benefit is a second way to justify the use of HFO systems on bridge
decks Does the reduction in costs due to a reduction in crashes have a greater monetary
value than the cost of an HFO system installation and maintenance The cost of accidents
vary from different sources however MnDOT has a typical monetary value associated
22
with each crash severity class (Izeppi 2010) These values are shown below in Table 5
Using such values a benefit-cost analysis can be conducted
Table 5 Associated Costs with Different Crash Types (MnDOT)
No Apparent Injury $4400
Possible Injury $30000
Non-Incapacitating Injury $61000
Incapacitating Injury $280000
Killed $3600000
The previously mentioned Wisconsin study performed a benefit-cost (BC) analysis on
several bridges using the monetary values in Table 5 The ratio compares the reduced
cost of crashes against the cost of installing an HFO system A value over 10 means that
the benefits outweighed the costs of installation The BC ratios in the Wisconsin study
ranged from 046 to 845 with an overall BC ratio of 186 (Izeppi 2010)
Skid Numbers
This subsection on skid number measurements provides an overview of the current
practice used to measure the surface friction properties of roadway surfaces This section
used the measured skid numbers for HFO systems in this research to compliment the
literature review of skid numbers The results are used later in the paper to make
comparisons with crash reduction efficiencies of various HFO types
Skid numbers are used to compare the friction values of different roadway surfaces and
current research uses skid numbers as indicators for roadway safety A skid number (SN)
is a calculated number that allows the comparison of frictional values for different
roadways (Watson 2011) Equipment used to determine these values and their test
procedures are further discussed in Chapter 4 An SN value is the ratio of the horizontal
force to the vertical load while an object moves over a surface multiplied by 100 Water
is sprayed onto the roadway in front of the test tire in order to simulate the ldquoworst caserdquo
23
scenario of a wet road MnDOT collects skid numbers for roadways using a
KJ Law (Dynatest) Skid Trailer Ribbed tires which have a tread design and smooth
tires were used for this testing Ribbed tires are more sensitive to the microtexture of a
surface while smooth tires are more sensitive to the macrotexture (Watson 2011) A
certain skid number however does not necessary correlate to a safe or unsafe road
condition (FHWA 2010)
Although no relationship currently exists recommended threshold values were
determined based on research sponsored by the Texas Department of Transportation
(Long 2014) Of these recommendations two important thresholds exist The first is a
range of SN where roadways are ldquopotential action segmentsrdquo These segments may
require testing or inspection to determine if treatment is required to improve the
roadwayrsquos safety The second threshold is where an increased SN values has little effect
on reducing crash rates (Long 2014) According to the Texas research for the type of
highway segments found in the following research conducted an SN value between 10
and 50 are in the ldquopotential action segmentrdquo threshold SN values over 50 have little
effect in reducing crash rates by increasing the SN Furthermore some research cited by
this Texas study has concluded that relationships between skid resistance values and
crash rates are not significant especially on freeways or higher speed roadways (Long
2014)
The SN values for nine bridges in this study are shown below in Table 6 Testing was
conducted from 2011 to 2013 (Three to Five years after the HFO installation) The SN
values shown in Table 6 show that several HFO systems are still above 50 several years
after installation while others have fallen below 50 into the ldquopotential action segmentrdquo
threshold
24
Table 6 Average Skid Numbers for HFO Systems on Bridges (Data from 2011 to 2013)
Bridge 6347 9066 9067 9823 14809 14810 27019 69006 86013
SN 583 417 440 541 365 351 545 588 564
Year of
HFO
Installation
2010 2010 2010 2009 2007 2007 2008 2009 2008
As roadways age their SN values deteriorate Abrasion from traffic and snowplows
facilitate the deterioration of SN values The heavy use of snowplows in Minnesota due
to the statersquos harsh winter climate creates higher abrasion rates compared to mild-climate
regions For a comparison the SN values of a Portland cement concrete (PCC) pavement
(traditional bridge deck overlay in Minnesota) are as follows Immediately after
construction SN values range from 55-60 (ribbed tires) or 45-50 (smooth tires) Five
years after construction the skid numbers drop to 45-50 for ribbed tires and to 25-30 for
smooth tires (Nelson 2011)
Since a minimum skid resistance value does not exist for crash reduction it is possible to
improve skid resistance of a bridge deck without actually improving the safety of the
bridge Using crash data provided by MnDOT from the public safety database this
research will analysis and evaluate the effectiveness of HFO systems in reducing crashes
on bridges
Building Off of Previous Research
Previous research in other states have conducted field tests very similar to the tests in this
study including (1) mean texture depth (2) bond strength (3) skid resistance and (4)
chloride penetration While previous research has been conducted on the performance of
HFO systems and several assessments of crashes on HFO systems exist a robust crash
analysis has not been conducted Minimal research has taken a significant look at how
effective systems are in reducing crashes This research will look at a decade of crash
data in order to ascertain the effectiveness of HFO systems in terms of crash reduction
25
In the study conducted by MnDOT (Evans 2010) the recommendation to create a more
comprehensive study was the motivation for this current research This study looks at
four different types of HFO systems instead of one The field testing will compare the
wheel to non-wheel path areas and finally an analysis of ten years of crash data will be
conducted The hope is that this study will be able to either confirm or disprove the
conclusions of the previous research as well as conclude if the use of HFO systems in
Minnesota is beneficial
26
Chapter 3 Comprehensive Aggregate Testing
The role of aggregates in these systems is critical to ensure that necessary friction is
maintained over the service life of the wear courses The main areas of concern in context
of the performance of wear courses include (1) retention of aggregate particles (2)
degradation and polishing of aggregate particles under the actions of traffic and snow
plows and (3) durability of aggregates under repeated freezing and thawing conditions A
number of laboratory tests can be conducted to get insight on the aforementioned areas of
concern with respect to aggregates
A comparison of several different aggregate sources that were implemented in variations
of these systems follows including the five aggregate types used in Poly-Carb Transpo
and SafeLane systems that were investigated Table 7 provides details of the five
aggregate samples that were chosen to undergo the testing These products were chosen
on the basis of systems actively in service as well as availability of sample material
27
Table 7 Aggregate Information
Aggregate Bridge Roadway Location Source
Basalt
4190 Hwy 55
(EB) St Paul
Washington Rock
Quarries (Pierce WA) 9036 Robert St St Paul
9823 I-35 (SB) Atkinson
Flint
6347 TH 243 Otsego
Flint Rock Products
(Picher OK) 9066 I-94 (WB) Moorhead
9067 I-94 (EB) Moorhead
Taconite
A 69006
TH 53
(NB) Virginia
United Taconite
(Eveleth MN)
Taconite
B NA NA NA
ArcelorMittal Minorca
Mines (Virginia MN)
SafeLane
14809 I-94 (WB) Barnesville
NA
14810 I-94 (EB) Barnesville
A couple additional notes about the processing of the aggregate include
Basalt consists of river rock that was crushed to specifications for an HFO system
Flint Both Poly-Carb and Transpo products use flint from Oklahoma
Taconite-A was prepped at the Ulland Brothersrsquo Kinmount location in Orr MN
SafeLane is a proprietary aggregate by Cargill and at this time Cargill will not
disclose the source location
The aggregate source used for the Novachip systems in this study is unknown
Trap Rock was used for Bridge 27758 (Penn Ave Transpo) however the
aggregate was not provided for this portion of the study
28
Pictures of all five aggregates with a reference scale are found below in Figure 8 through
Figure 12
Figure 8 Basalt Aggregate
29
Figure 9 Flint Aggregate
Figure 10 Taconite-A Aggregate
30
Figure 11 Taconite-B Aggregate
Figure 12 SafeLane Aggregate
31
Testing Procedures and Methodology
Testing was completed on aggregate samples in order to acquire material properties The
desired properties tests and their corresponding ASTM or AASHTO specification
designations are in Table 8 Testing was conducted at the University of Minnesota Duluth
civil engineering laboratory
Table 8 Properties and Preliminary Test Method
Property Test Method
Density Specific
Gravity and
Absorption
ASTM C127-12 ndash Standard Test Method for Density Relative
Density (Specific Gravity) and Absorption of Coarse Aggregate
ASTM C128-12 ndash Standard Test Method for Density Relative
Density (Specific Gravity) and Absorption of Fine Aggregate
Resistance to
Degradation
ASTM C 131-14 ndash Standard Test Method for Resistance to
Degradation of Small-Size Coarse Aggregate by Abrasion and
Impact in the Los Angeles Machine
Uncompacted Void
Content
ASTM C 1252-06 ndash Standard Test Methods for Uncompacted
Void Content of Fine Aggregate (as Influenced by Particle
Shape Surface Texture and Grading
FlatElongated
Particles
ASTM D4791-10 ndash Standard Test Methods for Flat Particles
Elongated Particles or Flat and Elongated Particles in Coarse
Aggregate
Percent of
Fractured Particles
ASTM D5821-13 ndash Standard Test Method for Determining the
Percentage of Fractured Particles in Coarse Aggregate
Soundness of
Aggregates
AASHTO T 103-08 ndash Standard Method of Test for Soundness of
Aggregates by Freezing and Thawing
Sieve Analysis ASTM C136-06 ndash Standard Test Method for Sieve Analysis of
Fine and Coarse Aggregates
32
Description of Standard Tests
The following sections provide a brief overview for each of the tests completed during
this task
Density Specific Gravity amp Absorption (Coarse Aggregate)
The ASTM C127-04 and ASTM C128-07 find the saturated-surface dry and dried mass
values of an aggregate in order to calculate density specific gravity and absorption of
coarse aggregate using gravimetric relationships High specific gravity usually correlates
with high toughness and strength High absorption is an indicator of potentially low
durability which can lead to a shorter life span on an aggregate in an HFO system
Resistance to Degradation
ASTM C131-06 uses a Los Angeles abrasion machine to measure the degradation of
mineral aggregates due to abrasion impact and grinding in a rotating steel drum The
Los Angeles Machine is pictured in Figure 13 This provides an indication of aggregate
toughness and potential for breakdown under abrasive actions such as traffic and snow
plows
Testing in this study had one deviation from the ASTM standards The standard requires
the aggregate retained on the 12 sieve to be washed after rotating in the steel drum For
this testing aggregate retained on or above the 10 sieve was used because a 12 sieve
was unavailable at the time of testing
33
Figure 13 Los Angeles Machine
Uncompacted Void Content
The uncompacted void content can be measured using a funnel and calibrated cylinder
(Figure 14) The uncompacted void content is the difference between the volume of the
standard cylinder and the absolute volume of the fine aggregate collected in the cylinder
Uncompacted voids provide an indication of the angularity of aggregates and hence
provide an approximation of the friction that will be offered through macrotexture The
higher the uncompacted void content the larger the spacing is between aggregates which
allows for a well-drained system
34
Figure 14 Aggregate Sample Falling into Calibrated Cylinder
FlatElongated Particles
Individual aggregate particles are measured to determine the ratios of width to thickness
length to width or length to thickness Figure 15 displays the equipment used to measure
aggregate particles Ratios of 21 31 and 51 were measured Flat and elongated
particles are susceptible to break down due to a thin dimension in the individual particles
Higher percentages of flat and elongated particles in an aggregate stockpile may signify
the potential for low durability and a shorter life span of the HFO system
35
Figure 15 FlatElongation Measuring Equipment with Sorted Aggregate
Percent of Fractured Particles
ASTM D5821-01 has individual particles of aggregate surveyed to find the percentage of
fractured particles in an aggregate Fractured particles are important to provide high
friction surfaces as well as provide surface area for epoxy to properly bond
Soundness of Aggregates
The resistance to disintegration of aggregates by freezing and thawing is found by the
AASHTO T 103-08 specification This testing subjects a sample of aggregate particles to
freeze thaw cycles in a controlled chamber Weather in MN is conducive to repeated
freezing and thawing thus it is important to know if an aggregate has sufficient durability
for such conditions More resistant aggregates are desirable for longer lasting systems
and maintaining a high friction surface
Sieve Analysis
A sieve analysis was run on all five aggregate samples to determine the relative
proportions of different grain sizes A sieve analysis is done to evaluate an aggregatersquos
gradation to ensure (1) a limited amount of fines to allow proper bonding between epoxy
layers and the aggregate particles (2) an open graded nature to provide good
36
macrotexture drainage and friction and (3) to compare to MnDOT chip seal
requirements since epoxy systems are constructed in a similar fashion
Results
Results found from the aforementioned standard test methods are provided below with
additional equations data and calculations in the Appendix
Density Specific Gravity amp Absorption
Density (Table 9) Specific Gravity (Table 10) and Absorption (Table 11) were found
using gravimetric measurements in accordance to ASTM standards
Table 9 Density
Aggregate Oven Dry
Density (kgm3)
SSD Density
(kgm3)
Apparent
Density (kgm3)
Basalt 2455 2561 2746
Flint 2223 2407 2725
Taconite A 2695 2841 3159
Taconite B 2642 2776 3051
SafeLane 2482 2618 2873
37
Table 10 Specific Gravity
Aggregate
Oven Dry
Relative Density
(Specific
Gravity)
SSD Relative
Density
(Specific
Gravity)
Apparent
Relative Density
Basalt 246 257 275
Flint 223 241 273
Taconite A 270 285 317
Taconite B 265 278 306
SafeLane 249 262 288
Table 11 Absorption
Aggregate Absorption ()
Basalt 136
Flint 134
Taconite A 118
Taconite B 106
SafeLane 145
Taconite-A and Taconite-B respectively are the two densest aggregate samples tested
SafeLane and Basalt are of similar density Flint was the lightest of the five aggregates
SafeLane had the highest abortion percentage compared to the other samples the two
Taconite samples had the lowest absorption percentage
38
Resistance to Degradation
Resistance to degradation is determined by measuring the percent of mass lost due to
abrasion and impact Table 12 provides the results for the five different samples
Table 12 Loss by Abrasion in LA Abrasion Machine
Aggregate Loss by Abrasion and
Impact
Basalt 31
Flint 30
Taconite A 32
Taconite B 40
SafeLane 46
All of the samples displayed similar results and performed well in the abrasion test In
comparison according to the Pavement Interactive website a typical loss for hard
igneous rocks is around 10 (Pavia Systems Inc 2012) Both Taconite samples and
SafeLane had higher relative loss due to abrasion These were also the aggregates with
the highest specific gravity There may be a correlation with the higher mass particles
which create a higher impact with one another when tumbling in the LA abrasion drum
Uncompacted Void Content
The uncompacted voids for the five aggregate samples is provided in Table 13 The
calculation process can be found in the Appendix
Table 13 Uncompacted Void Content Data
Aggregate Basalt Flint Taconite A Taconite B SafeLane
Uncompacted
Voids () 3860 3640 3940 3740 4230
39
The sample with the largest uncompacted void content was SafeLane The Poly-Carb
aggregate samples all had similar uncompacted void percentages The four Poly-Carb
samples had a 3 variation while the SafeLane aggregate was 3 higher than the Poly
Carb sample with the largest uncompacted void content Since SafeLane aggregates are
larger in size compared to the Poly-Carb aggregates logically more space will exist in
between particles
FlatElongated Particles
This test was performed on particles that were retained on the 4 sieve Particles were
characterized by being flat elongated flat and elongated or no characteristics The
ratios tested were 21 31 and 51 The percentages of different shaped particles for each
sample are plotted in Figure 17 through Figure 19 A flat particle is a particle that has a
width to thickness ratio larger than the specified ratio An elongated particle is a particle
that has a length to thickness ratio larger than the specified ratio Flat and elongated
particles have both ratios larger than the specified ration A visual of the particle
dimensions is shown below in Figure 16
Figure 16 Particle Dimensions per ASTM D4791-10 (Source ASTM D4791-10 2010)
For the 21 ratio a particle that is twice as wide as it is thick is considered flat A particle
that is twice as long as it is thick is elongated A particle matching both requirements is a
40
flat and elongated particle It should be noted that the Flint sample did not have enough
particles retained on the 4 sieve to perform this test
Figure 17 Flat and Elongated Particles (21 Ratio)
0
10
20
30
40
50
60
70
80
90
100
Flat Elongated FlatElongated None
Per
cent
of
Par
ticl
es (
)
Type of Particle
Basalt Taconite A Taconite B SafeLane
41
Figure 18 Flat and Elongated Particles (31 Ratio)
0
10
20
30
40
50
60
70
80
90
100
Flat Elongated FlatElongated None
Per
cent
of
Par
ticl
es (
)
Type of Particle
Basalt Taconite A Taconite B SafeLane
42
Figure 19 Flat and Elongated Particles (51 Ratio)
All four of the samples tested have a significant portion of flat particles in the 21 ratio
However this falls off quickly as the ratio is increased Taconite ldquoArdquo contains the most
flat particles across all three ratios with Taconite ldquoBrdquo following closely behind Basalt
has the lowest percentage of flat and elongated particles which may contribute to its low
mass loss due to abrasion It should be noted that although the Flint aggregate had
particle sizes too small to run this test on Based on visual inspection the aggregate
sample contains more flat and elongated particles compared to the other samples
Percent of Fractured Particles
After examination of the five crushed aggregate sources it was determined that 100 of
the particles in all five sources have at least 2 fractured faces This is a reasonable
0
10
20
30
40
50
60
70
80
90
100
Flat Elongated FlatElongated None
Per
cent
of
Par
ticl
es (
)
Type of Particle
Basalt Taconite A Taconite B SafeLane
43
characteristic because most of the aggregate samples are mechanically crushed in order to
obtain the desired aggregate sizes
Soundness of Aggregates
The sieve sizes used during this testing were based off of the Sieve Analysis Sieve sizes
with minor amounts of particles retained after freeze-thaw conditioning were excluded
from testing This is shown in Figure 20 with the text ldquoNo Datardquo For each aggregate
sample the different sieve sizes were combined to create a total mass The total mass lost
after being subjected to freeze-thaw conditions was normalized with the total sample size
for each aggregate allowing for a comparison between the different aggregates (Figure
21)
Figure 20 Percent Lost Due to Freeze Thaw
00
05
10
15
20
25
30
35
Sieve 4 Sieve 8 Sieve 16
Per
cent
Lo
st (
)
Sieve Size
Basalt Flint Taconite A Taconite B SafeLane
No
Dat
a
No
Dat
a
No
Dat
a
No
Dat
a
No
Dat
a
No
Dat
a
44
Figure 21 Percent Lost Due to Freeze Thaw (Normalized to Sample Size)
Taconite ldquoBrdquo and SafeLane were the best performers losing about half as much mass
compared to the other three samples Taconite ldquoArdquo lost the largest amount of mass during
testing
Freeze thaw damage indirectly measures the porosity of aggregate particles Pore space in
an aggregate particle allows for water penetration The presence of water in pore space
during freezing temperatures leads to aggregate degradation Damage to an aggregate
particle is caused from the abrasion of ice while water molecules are expanding from
freezing
Sieve Analysis
A gradation for each of the five samples was conducted and compared to the MnDOT
chip seal requirements shown in Table 14
00
05
10
15
20
25
30
Basalt Flint Taconite A Taconite B SafeLane
Per
cen
t Lo
st (
)
Aggregate Type
45
Table 14 MnDOT Chip Seal Gradation Requirements
In Figure 22 it is shown that the Poly-Carb systems all have similar gradations The main
difference in the systems the amount retained on the 8 and 16 sieves SafeLanersquos
gradation is significantly different than the Poly-Carb systemrsquos gradation It is also the
only aggregate sample to follow the MnDOT chip seal requirements
Figure 22 Sieve Analysis Compared to MnDOT Chip Seal Requirements
0
10
20
30
40
50
60
70
80
90
100
0375 4 8 16 50 100 200 Pan
Per
cen
t P
ass
ing
(
)
Sieve SizeBasalt FlintSafeLane Taconite ATaconite B MnDOT Upper LimitMnDOT Lower Limit
Sieve Size Passing by Weight
No 4 100
No 8 30 ndash 75
No 16 0 ndash 5
No 30 0 ndash 1
46
The most important aspect of the sieve analysis is that all aggregate samples have a
majority of their particles falling bewteen the 95 mm and 16 sieve This is created to
allow for an open gradation that provides a high macrotexture when placed in the HFO
binder
Aggregate Laboratory Testing Summary
A number of laboratory tests were conducted to gain perspective on aggregate samples
used in conjunction with epoxy and asphalt binders for high friction overlay systems on
bridge decks The main concerns regarding aggregates assessed through this testing are
the strength to endure abrasion and to provide both a solid macro- and microtexture
during the service life of HFO systems
All five aggregate samples performed satisfactorily through the battery of tests conducted
in this task While all five aggregates showed good physical and mechanical properties on
a relative basis the best abrasion performance was observed in basalt flint and taconite
ldquoArdquo The aggregates with the best freeze thaw performance were taconite ldquoBrdquo and
SafeLane Overall all aggregate is expected to perform well in HFO systems
47
Chapter 4 Field Observations and Testing
This task includes field observations and testing conducted on the different HFO systems
Systems looked at in this research were designed to provide a strong waterproof and
skid resistant traffic surfaces The main areas of concern in context of the performance of
wear courses include (1) retention of aggregate particles (2) degradation and polishing
of aggregate particles due to the actions of traffic loading and snow plow abrasion and
(3) durability of aggregate under repeated freezing and thawing conditions Field tests
were conducted to ascertain the effects of the aforementioned areas of concern The scope
of testing is contained in the following section Test procedures observations field test
results and comparisons are in subsequent sections and finally a summary is presented
This task is similar to several other studies that have been conducted regarding the use
and performance of high friction overlay systems (Anderson et al 2012)
Scope of Observations and Field Testing
The scope of this project is to provide a comparative analysis of different systems
conditions and performances This comparison is based on two years of field testing and
observations conducted at bridge sites where HFO systems have been exposed to the
climatic conditions and roadway maintenance operations prevalent in Minnesota and
similar cold climate regions Data from Year-1 and Year-2 will be presented The results
will not only compare the different systems and bridges against one another it will also
compare the systems against the proclaimed benefits of an HFO system The dates for the
site visits are listed below in Table 15
48
Table 15 Site Visit Dates
Bridge
Number
Date Visited
Year-1 Year-2
6347 NA 10314
9066 91613 6214
9067 91613 6214
9823 82913 8614
14809 NA 6414
14810 91713 6414
27019 91312 82014
27758 NA 10214
69006 82813 61814
86013 91312 82014
86019 91312 82014
4190 9413 NA
5718 10113 52814
9036 9413 NA
Observations
The observation of an HFO system in service is equally as important as the standard tests
completed The observations compliment test results and also help to explain why
specific test results or trends have occurred The following section provides a discussion
of such observations including distresses that have occurred and differences between
HFO systems
Distresses
Distresses in the HFO systems are one of the most common parameters observed during
site visits The inspection of different distresses is important since distresses may cause
49
issues that reduce the life of HFO The following subsections describe each type of
distress observed with examples from different bridges
Construction Joints and Uneven Aggregate Distribution
Uneven distribution of aggregates was apparent in several of the systems visited This is
caused by the manual process of adding aggregate to the epoxy matrix It is difficult to
evenly spread aggregate with shovels Applying too much aggregate in an area leads to
insufficient epoxy coating on the aggregates and without proper bonding these
aggregates are more prone to popping out of the matrix An insufficient amount of
aggregates in the matrix creates areas prone to polishing The construction joint in Figure
23 is the line running down the center of the figure that looks similar to a crack This
joint was caused by either a pause in construction or the application of too much
aggregate in one spot Construction joints are mostly a cosmetic distress unless an
insufficient amount of aggregates are placed which can affect the skid properties
Figure 23 Construction Joint (Bridge 9066)
This uneven application can lead to higher amounts of distresses during the life span of
an HFO system Bridge 14809 provided a good example of how the quality of
construction during installation can play a role in the performance of epoxy overlay
systems Such a difference is depicted below in Figure 24 The view of the picture is
50
looking against the direction of traffic A construction joint exists in the middle of the
picture The system on the left side of the picture is a bit lighter in color On the right side
there appears to be a higher rate of raveling This is shown best when looking at the
bottom right side of the picture
Figure 24 Differences on Both Sides of the Construction Joint (Bridge 14809)
Excessive Placement of Epoxy
Another type of distress caused by construction is polished areas due to the excessive
placement of epoxy This distress occurred on Bridge 6347 where a significant amount of
polished areas existed Looking along the wheel path in Figure 25 the darker areas are
where polished areas exist The magnified section of this figure provides an example of
the difference in texture between a polished (left side) and normal (right side) area As
vehicle traffic and snow plows cause abrasion to the roadway the aggregates are broken
along the plane of the epoxy leaving the polished area
51
Figure 25 Polished Areas along Bridge 6347
This abrasion along the epoxy plane is exemplified in Figure 26 where the right half of
the picture includes an area where the epoxy level is near the top of the aggregate layer
Any aggregate exposed in this heavy epoxy area is now flush with the top of the epoxy
due to abrasion
Figure 26 Proper Epoxy Levels (Left Side) Next to Area with Excessive Epoxy (Right
Side)
52
Snowplow abrasion
A common distress in snowy regions such as Minnesota is damage caused from the
service of snowplows Driving a snowplow blade across a roadway can cause severe
abrasion and involves a series of impact events Damage most often occurs at the crown
of a roadway or in between rutted wheel paths This snowplow abrasion is shown in
Figure 27 The damage is most prevalent along the centerline as well the right wheel path
in the driving lane On this bridge the abrasion removes some of the aggregate which
gives the roadway the appearance of a lighter color Snow plow abrasion is detrimental to
HFO systems because even with the use of aggregates that are proficient against
deterioration due to abrasion the bond between epoxy and aggregates are not strong
enough to resist the shear force a plow blade imposes Also if aggregate is being removed
from the surface the potential safety benefit quickly diminishes
Figure 27 Transverse Snowplow Abrasion (Br 4190)
The macrotexture of Bridge 27758 still exists along parts of the bridge but heavy
abrasion has taken its toll on the overlay system As shown below (Figure 28) areas of
the bridge have minimal aggregate pop-out but finer material has been removed between
53
the ldquolargerrdquo aggregate exposing the bridge deck Some locations have the opposite
distress where severe aggregate pop-out exists and leaving polished areas as well as areas
with minimal aggregate particles (Figure 29) Other areas of this bridge have parts of the
overlay system that are completely missing
Figure 28 Existing Macrotexture on Bridge 27758
Figure 29 Polished Area on Bridge 27758 along with Transverse Cracks
54
One distress on Bridge 27758 that has not occurred with any other system is the complete
removal of epoxy and aggregates from the bridge deck surface due to abrasion The
removal from snow plow abrasion has occurred near joints or at the edges of other
systems but not in the middle of the system as seen on Bridge 27758 Depicted below in
Figure 30 the localized abrasion has removed strips of the system The pattern of
removal suggests that the epoxy was removed due to the high impact of a bouncing snow
plow blade This system is thinner than any other system in the study with a thinner cross
section less removal of material is required to reach the deck surface
Figure 30 Excessive Snow Plow Abrasion (Br 27758)
The thin cross section of this system is shown in Figure 31 In this picture there is not a
distinguishable elevation difference between the bridge deck and the epoxy overlay
55
Figure 31 Thin Epoxy System (Br 27758)
In the Novachip systems the worst snowplow abrasion came from an uneven roadway
elevation The right side of the Novachip system on Bridge 86019 (Figure 32) has a
significant amount of abrasion compared to the left side During the site visit settlement
was visible on the left side of the bridge suggested by uneven approach panels and
mismatched Jersey barrier heights This settlement has lowered the left side of the bridge
causing uneven seating of snowplow blades on the right side This seating increases the
rate of abrasion compared to the left side of the system
56
Figure 32 Uneven Snowplow Abrasion due to Uneven Roadway Elevation (Br 86019)
The area most damaged on this system is along the expansion joints A common distress
among the different epoxy systems snowplows seem to cause catastrophic deterioration
near joints As shown in Figure 33 traffic is flowing from left to right The right side of
the figure is the concrete departure panel of the bridge More area is missing on the
departure side of the expansion joint
Figure 33 Missing Overlay System near Expansion Joints on Transpo System (Br 27758)
57
Damage at the joints is common on all HFO systems The systems are not constructed to
be flush with joints so abrasion due to traffic and snowplows causes a raveling distress
by removing aggregate from the epoxy This damage is apparent in Figure 34 The figure
shows a joint from Bridge 69006 In the figure traffic is moving from left to right As the
snow plow blade crosses the joint it drops off the epoxy system until it is flush with the
joint It then scrapes away the system on the other side of the joint
This damage is also shown in Figure 35 with a joint from Bridge 9066 Bridge 69006 and
9066 had their overlay systems placed in 2009 and 2010 respectively So the damage in
Figure 34 is from three winters and the damage in Figure 35 was caused over two
winters
Figure 34 Joint Abrasion on Bridge 69006 (Traffic Moves from Left to Right)
58
Figure 35 Joint Damage on Bridge 9066 (Traffic Moves from Left to Right)
Damage is also produced as snow plows cross from approach panels to the bridge deck
The mismatch between the approach panel and the bridge deck causes part of the epoxy
system to be scrapped off the bridge deck (Figure 36) Transverse abrasion from snow
plows in high elevation areas is also apparent in Figure 36
59
Figure 36 Damage near Approach Panels on Poly-Carb System (Bridge 69006)
As shown in Figure 37 the HFO system removal due to snow plows occurs across all
HFO types The removal in Figure 37 is especially bad due to the uneven elevation
between the roadway and the approach panel The asphalt roadway on the left side of the
figure has settled exposing the concrete approach panel and overlying HFO system
Figure 37 System Removal near Joint on NovaChip System (Bridge 86019)
60
Due to the thin nature of the epoxy systems aggregates that are placed on the top layer
may not receive adequate epoxy cover to stay embedded in the system Abrasion from
snow plows and traffic will remove aggregate from the epoxy matrix This distress was
common across all epoxy bridges
Aggregate Raveling
Removal of aggregates from the HFO system is due to inadequate binding to the system
Abrasion forces are most commonly responsible for aggregate removal in the epoxy
based systems Poly-Carb SafeLane and Transpo Aggregate raveling was more
apparent in the wheel path and was more common in polished areas These systems had
large amounts of aggregate raveling at every bridge location Figure 38 contrasts a
surface with the proper aggregate coating against a surface with significant amount of
polishing and raveling
Figure 38 Texture Comparison of Br 4190 (Left Proper Aggregate Macrotexture Right
Aggregate Raveling)
61
In Figure 39 there is a comparison of a typical section along the driving lane for three
different systems On the left is Novachip (Br 86013) which has minimal aggregate
raveling compared to its epoxy counterparts In the middle is a typical SafeLane surface
(Br 14810) and a typical Poly-Carb surface (Br 9067) on the right The reason Novachip
systems have minimal loss of their aggregates is due to the fact that the system is a thin-
bonded open-graded asphalt overlay The asphalt binder has viscoelastic properties
whereas the epoxy based systems are much stiffer elastic-plastic response The
viscoelastic properties may allow the asphalt system to absorb the shock exerted by snow
plow action
Two different scenarios occur when a shearing force such as a snow plow pushes across
the top of the overlay surface The first occurs with asphalt system When forces are
applied an aggregate is allowed to compress into the asphalt binder at a microscopic
level The asphalt then has an elastic recovery after the force is removed placing the
aggregate back into its original location This elasticity of asphalt allows the system to
absorb some of the energy caused by abrasion In the second scenario with elasto-plastic
epoxy the system cannot compress and cannot absorb the energy as the stiffness of
epoxy is very high This results in the applied forces breaking the bonds formed between
the epoxy and aggregates and removing aggregates from the system
Novachip systems are constructed similar to asphalt overlays thus the system is
compacted with a roller during construction This compaction helps to push the
aggregates further into the asphalt matrix and achieve a higher bond Additionally
asphalt remains pliable while it ages therefore aggregate in the Novachip systems are
able to compress into the asphalt under a load even after the initial placement The
continued embedment of aggregate into the asphalt membrane is noticeable in the
Novachip systems (Figure 39 left) These two features prevent the excessive raveling
found in epoxy systems In an epoxy system once hardened the aggregates do not have
the capability to compress further into the epoxy matrix which may lead to protruding
aggregate These protruding aggregates are more susceptible to abrasion polishing and
raveling
62
Figure 39 Comparison of Loss of Aggregate between Novachip (Left) SafeLane
(Middle) and Poly-Carb (Right) Systems
63
Aggregate Polishing
Aggregate polishing was a common distress found in the wheel paths An extreme case of
polishing was found on Bridge 9066 In Figure 40 and Figure 41 the reflection of sunlight
on polished areas makes it much easier to spot locations with poor friction
Figure 40 Wheel Path Polishing (Br 9066)
Figure 41 Close View of Polished Area (Br 9066)
64
Cracking
Similar to concrete and asphalt pavements cracks in HFO systems also occur Several
hairline cracks exist in the Poly-Carb and SafeLane systems but none of the cracks
appeared to propagate through the entire thickness of the system In the Transpo systems
cracks that propagated through the entire system did occur On Bridge 27758 (Penn Ave)
the cracks appear to be due to the system being thinner than any other system allowing
reflective cracks from the underlying bridge deck to propagate through the system These
cracks are shown below in Figure 42
Figure 42 Transverse Cracks on Bridge 27758
Cracking also occurred on Bridge 6347 This cracking was completely through the
thickness of the HFO systems The approach panels on either side of the bridge have a
transverse crack near the expansion joints The transverse crack occurs along the back
edge of the concrete abutment wall (Figure 43) which suggests that settlement behind the
abutment has occurred The settlement lowered and cracked the approach panel and the
HFO system This settlement may also have detrimental effects on the expansion joint
and could render the joint ineffective
65
Figure 43 Transverse Crack near Expansion Joint of Bridge 6347
Transverse cracking (Figure 44) and reflective cracking along expansion joints (Figure
45) both existed in the Novachip systems The Novachip systems are asphalt overlays and
thus distress differently than the other epoxy systems Novachip systems distress similar
to conventional asphalt pavements The cracks reflected through the Novachip systems
from existing cracks or settlement in the approach panels and bridge decks The
placement of Novachip systems on well-performing bridge decks would eradicate a
majority of the crack distresses observed in this study
66
Figure 44 Longitudinal Crack in Novachip System (Br 27019)
Figure 45 Reflective Cracking in Novachip System (Br 27019)
Several different types of cracking existed Cracking that propagates through the entire
HFO system is detrimental because it provides an area where water and chloride ions are
able to penetrate into the concrete deck
67
Delamination of High Friction Overlay Systems
Several bridges in this study have sections where the epoxy overlay has delaminated from
the bridge deck On Bridge 6347 the delamination of the epoxy overlay system has
occurred along the centerline of the roadway The majority of the delamination has
occurred along the construction joint which runs down the middle of the bridge Some of
the worst delamination is shown below in Figure 46 The construction joint can be seen in
between the no passing lines
Figure 46 Delamination of Transpo System on Bridge 6347 along Centerline
Delamination also occurred in several Poly-Carb systems (Bridge 4190 and 9036)
Depictions of such delamination are shown in Figure 47 through Figure 49
68
Figure 47 Delamination of HFO on Robert Street Bridge (Br 9036)
69
Figure 48 Minimal Bond Strength Existed in the Distressed Areas (Br 9036)
Figure 49 Delaminated Area during Maintenance (Br 4190)
70
During the first year of investigation Bridge 4190 (TH 55 in St Paul Poly-Carb) and
Bridge 9036 (Robert St in St Paul Poly-Carb) were visited in addition to the bridges in
this study Both bridges had delamination of their HFO systems After visiting these two
bridges they were repaired however delamination occurred again on these epoxy systems
during the second year of this study (2014) The two bridges were not visited during the
second year of this study (2014)
There appears to be two similarities between the bridges where this delamination occurs
crossing water and lower functioning expansion joints The epoxy systems crossing water
in this study are found on Bridges 6347 (TH 243 in Otsego Transpo) 9066 and 9067 (I-
94 in Moorhead Poly-Carb) Delamination has occurred on Bridge 6347 but not on either
9066 or 9067 One main difference between Bridges 9066 9067 and the other bridges
with delamination is the expansion joints On Bridge 9066 and 9067 the expansion joints
are significantly larger compared to the other bridges The expansion joint of Bridge
9066 is shown below in Figure 50
Figure 50 Expansion Joint on Bridge 9066
The expansion joints of bridges with delamination are smaller in comparison and in
some cases do not appear to be in the best condition The Robert Street Bridge expansion
joints (Figure 51) did not appear to be functioning well The smaller joint shown on the
top of Figure 51 was south of the delamination and appeared to be sealed The northern
71
joint (Bottom of Figure 51) was larger but contained a significant amount of fine
incompressible material in the joint A similar joint in similar condition is found on
Bridge 4190 (TH 55) and is shown in Figure 52 This joint was also filled with fine
material
The constant presence of water under a bridge with an epoxy system may play a role in
the delamination of the system Moisture from the river may infiltrate from the underside
of the bridge and reduce the bonding between the epoxy overlay and the bridge deck As
previously discussed in the Literature Review moisture may be present in the concrete
deck even if water is not visually apparent on the surface
Concrete and epoxy have different coefficients of thermal expansion thus expanding at
different rates This difference causes internal pressures on the epoxy system during
thermal expansion and the pressure is further compounded with the presence of small or
ill-functioning expansion joints If moisture is present in the bridge deck during
installation a weaker bond between the epoxy and concrete may occur Internal stresses
emphasized by small or ill performing joints may be enough to delaminate HFO systems
with a weaker bond
Bridge 27019 and 86019 (Otsego Novachip) also cross water however the Novachip
systems with their elastic properties from asphalt would be able to absorb the internal
stresses compared to the rigid epoxy system As discussed in the previous section Bridge
6347 (TH 243 in Osceola Transpo) has settlement behind its abutment which could be
interfering with its expansion joints ability to operate
72
Figure 51 Robert Street (Br 9036) Expansion Joints Both North (Bottom) and South
(Top) of Delamination
Figure 52 Bridge 4190 (TH 55) Expansion Joint
When cracks or delamination occur in HFO systems their ability to protect the underlying
deck from chloride infiltration is compromised This infiltration can lead to reinforcement
steel corrosion
73
Differences in Thickness of High Friction Overlay Systems
In this study the different HFO systems have different thicknesses The thickest system
is Novachip (34 inch [19mm]) followed by SafeLane (38 inch [95mm]) and then Poly-
Carb (14 inch [65mm]) A visual of the difference in thickness is provided below
(Figure 53) The figure shows steel plate samples that removed a section of an HFO
system during the torque bond testing A Poly-Carb system sample (Left) is side by side
with a Novachip system sample (Right) Since epoxy has a higher tensile strength
compared to asphalt epoxy systems can have smaller cross-sections and still achieve
adequate binding to the bridge deck as well as the aggregates in the HFO system The
slight difference in thickness between SafeLane and Poly-Carb systems is due to the
selected aggregate size SafeLane is slightly thicker because it uses larger aggregates in
its system compared to Poly-Carb
Figure 53 System Thickness Comparison Left Poly-Carb System Right Novachip
System
The main advantage for thinner epoxy systems is a reduction in dead load on bridges
Assuming the HFO systems have a relatively similar density epoxy systems place half
the weight on a bridge deck compared to asphalt based systems
Testing Procedure and Methodology
Testing was completed on overlay systems in order to acquire friction permeability and
bond strength properties The tests and their corresponding ASTM designations or
74
procedures are described in Table 16 Several testing locations along the length of the
bridges were used to collect data and reduce bias At each test location the bridge decks
were tested in both wheel path and non-wheel path areas In general the wheel path was
located by measuring 25 feet [76 cm] into the lane from the fog line The non-wheel
pathrsquos location was considered to be 6 feet [18 m] from the fog line In some instances
wearing of the deck due to wheel loads were used to identify the wheel path
Table 16 Properties and Test Method
Property Test Method
Pavement Macrotexture Depth
ASTM E 965-96 Standard Test Method for
Measuring Pavement Macrotexture Depth Using a
Volumetric Technique
Torque Bond Strength
There is currently not an ASTM standard for this
test However results are to be used for comparison
of systems within this project only
Pavement Permeability
Testing was performed based on the operating
manual for the NCAT Asphalt Field Permeameter
Kit AP-1B which was used for testing
Skid Resistance of Paved
Surface
ASTM E 274 Standard Test Method for Skid
Resistance of Paved Surfaces Using a Full-Scale
Tire
ASTM E1911-09 Standard Test Method for
Measuring Paved Surface Frictional Properties
Using the Dynamic Friction Tester
Chloride Ion Penetration
AASHTO T277 Standard Method of Test for Rapid
Determination of the Chloride Permeability of
Concrete
75
Pavement Macrotexture Depth
The ASTM 965-96 test method finds the mean texture depth of a pavement through a
volumetric procedure A known volume of evenly graded silica sand is spread evenly
over an area of pavement with the known sand volume and surface area of the space it
fills one can solve for the mean texture depth (MTD) This MTD is used to compare the
texture of HFO systems A larger MTD means more texture and inherently higher
friction An example of this process is shown below in Figure 54 The equation used to
calculate the mean texture depth and other data used is provided in the Appendix
Figure 54 Mean Texture Depth
Torque Bond Strength
In this test a steel plate is bonded to the overlay system using a fast setting epoxy Once
this epoxy is set (approximately two hours) the plate is removed using a torque wrench
This wrench has a readout that provides the torque required to remove the plate This test
measures how well a system is bonding with the concrete bridge deck Removal of the
epoxy system when torque is applied advocates for a poor bond between the system and
bridge deck Figure 55 shows the torque wrench attached to a plate just before testing
Figure 56 and Figure 57 show plates with debonded overlay material at Bridges 9036 and
14810 respectively
76
Figure 55 Torque Wrench and Attached Plates (Br 69006)
Figure 56 Plate with Debonded Overlay (Br 9036)
77
Figure 57 Plate with Debonded Overlay (Br 14810)
During the first year of bridge deck wear course evaluation the torque bond strength
testing was conducted using a two inch [5 cm] extension piece to connect the end of the
wrench with the steel plate During the second year of testing this extension was removed
and the wrench was directly connected to the steel plate This brought the wrench closer
to the steel plate Since this distance was reduced the force applied to the wrench was
more effectively transferred into the torque placed on the steel plate With the extension
piece in place it is believed that some force applied to the wrench was exerted in a
bending mode rather than pure rotational torque when transferring force from the wrench
to the steel plate likely resulting in a reduction of torque required during testing For this
reason the torque values from Year-1 should not be directly compared to the values found
in Year-2
Pavement Permeability
This test is performed to provide the coefficient of permeability of a pavement This is
accomplished by timing the rate at which the water level decreases in the testing
equipment shown below in Figure 58 The purpose of the epoxy system is to provide a
waterproof system to add protection to the bridge deck Some deicing chemicals used on
78
roadways have detrimental effects on the concrete and reinforcement bars in the bridge
deck By providing an impervious surface these soluble chemicals are unable to infiltrate
the bridge deck and thus reduce the degradation of the infrastructure It is important to
visually inspect the epoxy system and perform permeability tests on any surface cracks in
the system to find if water is able to infiltrate the epoxy system Figure 58 is a test
performed on a crack in the system However as shown in the bottom of the figure the
crack does not extend through the entire thickness of the system Evidence of this is the
water permeating back to the surface outside of the testing equipment The equation used
to calculate the coefficient of permeability and other data used is provided in the
Appendix
Figure 58 Permeability Test over Cracked Overlay (Br 9823)
79
Skid Resistance of Paved Surfaces
Two different tests were completed to find the skid resistance of the HFO systems The
first test found resistance values using a skid trailer This test was conducted by MnDOT
and was completed during both Year-1 and Year-2
The second test measured resistance values using the Dynamic Friction Tester Testing
was only completed during Year-2 of the study and was conducted by MnDOTrsquos Office
of Materials and Road Research Below are descriptions of the two different testing
procedures
Measuring Surface Frictional Properties with a Skid Trailer
An apparatus with a test wheel and recording instrumentation is driven over a roadway at
a determined speed While at this speed the test wheel has its brakes locked The force
required to slide the locked test tire over the roadway is used to determine the skid
number Water is sprayed onto the roadway in front of the test tire in order to simulate the
ldquoworst caserdquo scenario of a wet road Minnesota Department of Transportation (MnDOT)
collects skid numbers for roadways using a KJ Law (Dynatest) Skid Trailer Two types of
tires are used during testing ribbed tires which have a tread design and smooth tires
The ribbed tire is more sensitive to microtexture while the smooth tire is more sensitive
to macrotexture (M Watson 2011) Smooth tires also display more variation to water
film depth (FHWA 2010) Although this test is conducted to find the surface friction a
certain skid number does not necessary correlate to a safe or unsafe road condition
(FHWA 2010) A major drawback of the skid trailer is its use on a tangent curve When
driving on a tangent curve the weight of the skid trailer is not perpendicular to the road
surface due to the super elevation of the roadway thus skewing the coefficient of friction
results It may also be unsafe to test some tangent curves because traffic simply cannot
drive at the test speed required on some curves
80
Measuring Surface Frictional Properties with the Dynamic Friction Tester
This test is performed using an apparatus that houses a rotating disk with three rubber
sliders attached on the bottom of the disk The test procedure is standardized through
ASTM E1911-09 specification The disk is mounted in a plane parallel to the driving
surface The disk is rotated and brought up to its maximum tangential velocity of 90 kmh
(55 mph) Once the disk is up to its maximum tangential velocity water is pumped in
front of the rubber sliders as the disk is lowered to make contact with the surface The
torque is monitored as the friction between the roadway and rubber sliders reduce the
diskrsquos rotational velocity The friction at various tangential velocities is recorded for later
analysis The testing apparatus is depicted below in Figure 59 The piece of equipment
placed on the roadway surface placed to the right of the bucket in Figure 59 houses the
rotational disk Each test location ran five repetitions of the Dynamic Friction Tester
(DFT) test Tests were run at one to three different locations for both the wheel and non-
wheel path regions of each bridge The number of test-runs was based on time constraints
due to traffic control
Figure 59 Dynamic Friction Tester
There are some benefits for the use of the DFT as compared to a skid trailer The first is
reliability and ability to quantify repeatability The DFT is set up and used in a singular
location This allows for multiple tests to be run in the same location for higher precision
81
It also eliminates error that may interfere with test results This error can be caused by the
bouncing or lateral movement of the skid trailer which must be in motion for its testing
procedure The fact that testing is done in a static location for DFT testing provides the
opportunity to test more accurately in wheel and non-wheel paths Draw backs for the
localization of this test include that the friction values of a surface are based on a very
small percentage of the surface however for this study the higher accuracy allowing us to
compare multiple bridges and systems outweighs the disadvantage
Chloride Ion Penetration
This test is conducted to test the content of chloride ions present in bridge decks with an
HFO system The purpose of this test is to determine if HFO systems protect bridge decks
from chloride ion penetration which facilitates corrosion of reinforcing steel inside the
concrete deck Samples are cored out of the bridge deck and vary from four to six inches
in depth Each sample is cut at corresponding depths crushed and tested for the chloride
ion content according to the AASHTO T-277 test method These cuts are made to
determine the chloride levels present at different depths throughout the bridge deck An
illustration of where a core sample is cut is shown below (Figure 60)
82
Figure 60 Cutting Configuration of a Sample Core
The typical range at which corrosion may begin is 059 to 070 kgm3 or 250 to 330 parts
per million (Costa 2010) The chloride content threshold of 06 kgm3 was identified by a
Federal Highway of Administration (FHWA) corrosion study as the lower value where
corrosion can occur (Clemena 1998) The important depth to look at is the depth closest
to reinforcing steel (Young Durham amp Bindel 2012) For concrete bridge decks this
depth is two inches the minimum cover required for reinforcing steel (AASHTO 2012)
The purpose of this testing is to see whether HFO systems are protecting the bridge decks
from chloride ion penetration
For this testing sample cores were removed from the field by MnDOT The preparation
and testing of samples was conducted by the MnDOT Office of Materials and Road
Research A limited amount of samples were removed for this testing Core samples were
collected from Bridge 9823 (Atkinson MN Poly-Carb system) and Bridge 69006
(Virginia MN Poly-Carb system) Tabulated below in Table 17 are the year and
83
corresponding number of sample cores taken from the bridge decks Samples are cored
out of the bridge deck and vary from four to sixes inches in depth
Table 17 Number of Sample Cores Taken in Various Years
Bridge Year
Number of Sample Cores
Driving
Lane
Passing
Lane
9823 2011 3 3
2014 1 1
69006
2010 3 3
2011 3 3
2014 1 1
The 2010 and 2011 cores were cut at every inch along the deckrsquos depth The 2014 cores
were cut at every half inch for the first two inches and every inch after The results from
this testing are discussed in the following section
Results
The field results and their analysis for the different bridges and their HFO systems are
below Additional equations data and calculations are presented in the Appendix
Pavement Macrotexture Depth Results
The following section discusses the results found from the pavement macrotexture depth
testing This test is useful for comparing different physical characteristics of the bridges
and how they affect the mean texture depth (MTD) Three lines are placed on Figure 61
and Figure 62 as a baseline comparison against normal bridge surfaces Table 18
summarizes the attributes of these baseline surfaces
84
Table 18 Baseline Surface Texture Attributes
Surface Type MTD (in) Remarks
New Asphalt 00161 Taken within 6 months of construction
New Brushed Concrete 00295 Taken within 6 months of construction
Worn Tined Concrete 00138 Low speed bridge deck surface after 14 years
of service with an ADT of less than 200
The mean texture depths are found below for both the driving lane (Year-1 Figure 61
Year-2 Figure 62) and passing lane (Year-2 Figure 63) There are two general trends for
the mean texture depth These trends are divided by the different types of HFO systems
The first trend is for the epoxy based systems Poly-Carb (Bridges 9066 9067 9823 and
69006) Transpo (Bridges 6347 and 27758) and SafeLane (Bridges 14809 and 14810)
In this trend the mean texture depth varies with the smallest depth in the wheel path the
largest depth in the shoulder The non-wheel path has a depth somewhere in between
The logic behind this trend is that snow plow abrasion causes more severe abrasion on
driving lanes lowering its depth compared to the shoulder The wheels from traffic further
abrade the wheel path lowering its depth compared to the non-wheel path This trend
exists in both the driving and passing lanes
The second trend is for the Novachip system (Bridge 27019 and 86013) On these
systems the shoulder depth is smaller compared to driving lanes The reason for this is the
maintenance operations performed on these bridges Snow is plowed onto the shoulders
and then removed over the edge using a snow thrower The blades on the snow thrower
cause additional heavy abrasion on the shoulder
On Bridges 9036 (Poly-Carb) 27758 (Transpo) and 86013 (Novachip) the wheel and
non-wheel path depths are very comparable A small variance between the wheel and
non-wheel path is reasonable since this is a lower traffic volume lower speed bridge On
Bridge 27019 the wheel path has a larger depth compared to the non-wheel path A
possible explanation for this is the existence of a construction joint along the non-wheel
path section tested
85
Figure 61 Mean Texture Depth (Year-1 Driving Lane)
0
001
002
003
004
005
006
007
69006 9823 4190 9036 9066 9067 14810
Mea
n T
extu
re D
epth
(in
)
Non-Wheel Path Wheel PathNew Asphalt Brush ConcreteWorn Tined Concrete
86
Figure 62 Mean Texture Depth (Year-2 Driving Lane)
00000
00100
00200
00300
00400
00500
00600
00700
00800
6347 9066 9067 9823 14809 14810 27019 27758 69006 86013
Mea
n T
extu
re D
epth
(in
ches
)
Wheel Path (Driving Ln) Non-Wheel Path (Driving Ln)Shoulder New AsphaltBrushed Concrete Worn Tined Concrete
87
Figure 63 Mean Texture Depth (Year-2 Passing Lane)
The bridges with a Poly-Carb system (Br 9066 9067 9823 and 69006) or Transpo
system (Br 6347 and 27758) installed all have mean texture depth values near or below
that of brushed concrete When comparing the driving lane to the shoulders it shows that
these systems have lost a significant amount of texture and depth due to snowplow and
traffic abrasion
The Poly-Carb systems use smaller aggregates compared to Novachip and SafeLane
systems therefore Poly-Carb systems are more susceptible to a reduction in depth
bringing the mean texture depth closer to traditionally paved roadway surfaces However
the SafeLane bridges (14809 and 14810) also had a significant reduction in depth when
comparing their driving lanes and shoulders With the assumption that little abrasion has
occurred on shoulder lanes for Poly-Carb and SafeLane an estimate can be made for the
00000
00100
00200
00300
00400
00500
00600
00700
00800
9066 9067 9823 14809 14810
Mea
n T
extu
re D
epth
(In
ches
)
Wheel Path (Passing Ln) Non-Wheel Path (Passing Ln) Shoulder
88
original MTD when the system was first installed and had no abrasion or distresses
Based on the shoulder depth SafeLane systems have a starting MTD between 006 and
007 while Poly-Carb systems start with an MTD between 0045 and 005 With these
assumed starting numbers the Poly-Carb and SafeLane systems have had a 30 to 35
reduction in MTD values Using the dates of installation SafeLane has a reduction of
about 5 per year Poly-Carb has a reduction of 6-8 a year It should be noted that
reduction in MTD values are greatly influenced by winter weather and the use of
snowplows From 2013 to 2014 (Figure 65) the percent of MTD reduction for bridges in
this study which endured harsh winter conditions varied from 4-20 Transpo systems
were excluded from this comparison because testing of the shoulders on bridges with a
Transpo system was not conducted
The difference between the MTD in the driving lane passing lane and shoulder for some
Poly-Carb and SafeLane systems is illustrated below in Figure 64 In general the passing
lane has a larger depth and it is reasonable to attribute this trend to higher traffic loads
(especially truck loads) traveling in the driving lane
89
Figure 64 Mean Texture Depth Comparison
Five bridges were tested in both the first and second year of this study including the Poly-
Carb bridges 9066 9067 9823 and 69006 as well as the SafeLane Bridge 14810 The
comparison between the two years is shown in Figure 65 As expected another year of
abrasion has caused a reduction in depth For Bridge 9066 (Moorhead I-94 Westbound)
the depth in the wheel path actually increased As explained in the year one field
observations this bridge has several significantly polished areas and measurements of
these areas were taken Thus the 2013 values for this bridge targeted polished areas
whereas the 2014 values are more representative of the mean texture depth Bridge 9067
(Moorhead I-94 Eastbound) saw the most significant drop in depth from 2013 to 2014
Bridge 14810 (Barnesville I-94 Eastbound) had significant abrasion to its non-wheel
path reducing its average depth and bringing it much closer to the wheel path values The
00000
00100
00200
00300
00400
00500
00600
00700
00800
9066 9067 9823 14809 14810
Mea
n T
extu
re D
epth
(In
ches
)
Wheel Path (Driving Ln) Wheel Path (Passing Ln) Non-Wheel Path (Driving Ln)
Non-Wheel Path (Passing Ln) Shoulder
90
2013-2014 winter was very harsh which may have resulted in above average snow plow
abrasion
Figure 65 Mean Texture Depth Comparison of 2013 (Year-1) to 2014 (Year-2) Values
An estimation for the number of vehicles passing over each bridge was found using the
average daily traffic (ADT) and number of years the HFO system has been in place
Using this data the relative difference between the wheel and non-wheel path was found
for every one million passing vehicles This relative difference normalized to traffic is
displayed in Figure 66 This data does not account for unequal lane or directional
distributions Additionally it assumes that every vehicle causes the same amount of
abrasion to the bridge aggregates
00000
00100
00200
00300
00400
00500
00600
9066 9067 9823 14810 69006
Mea
n T
extu
re D
epth
(In
ches
)
Wheel Path (2013) Wheel Path (2014) Non-Wheel Path (2013) Non-Wheel Path (2014)
91
Figure 66 Relative Difference between Wheel and Non-Wheel Path MTD Normalized to
Total Traffic
By comparing the relative difference between wheel and non-wheel MTD normalized to
total traffic several conclusions are made
Taconite performs best against wheel path abrasion
Bridge 9823 (Atkinson MN) and Bridge 14810 (Barnesville MN) had
significantly higher wheel abrasion compared to the other bridges
Channelized driving patterns on roadways with higher speeds such as Bridge 9823
(Atkinson MN) and Bridge 14810 (Barnesville MN) are more apparent with the
higher relative difference
0
00005
0001
00015
0002
00025
0003
00035
0004
4190 9036 9066 9067 9823 14810 69006
Rel
ativ
e D
iffe
rence
bet
wee
n W
hee
l a
nd
No
n-W
hee
l P
ath
(inch
mil
lio
n v
ehic
les)
92
An aggregate type does not wear evenly in every location Considering basalt as
an example it clearly shows that different traffic loads speeds and conditions all
affect the abrasion rate
Overall several conclusions can be drawn based on the test results
The wheel path abrasion is significantly higher on bridges where channelized
driving is common (high speeds or high ADT) This is apparent on the higher
speed Interstate bridges (Br 9823 Br 9066 Br 9067 Br 14809 and Br 14810) and
the higher ADT bridge (Br 4190)
Taconite (Br 69006) appears to have the best performance of the aggregates for
abrasion due to wheels
The small difference between non-wheel and wheel path depths for Br 9036
(Robert St in St Paul Poly-Carb) and Br 86013 (CSAH 36 in Otsego Novachip)
is due to the slower speed limit which limits the abrasion damage Also since this
bridge is a local road lane changes may be more frequent causing a more even
abrasion across the entire lane
The smaller depth of Br 9066 compared to Br 9067 suggests that higher traffic
levels travel in the westbound driving lane This supports the claim that Bridge
9066 is functionally obsolete Higher traffic in this lane is most likely due to the
traffic exiting to the area Universities
Bridge 9066 (WB I-94 in Moorhead Poly-Carb) and Bridge 9823 (SB I-35 in
Atkinson Poly-Carb) had the smallest reductions in mean texture depth from the
year 2013 to 2014
Bond Strength Results
The bond strength of the different HFO systems was tested during both years of the
study As previously mentioned in the Chapter 4 Testing Procedure and Methodology
section a slight variation in testing methods occurred between the years and for that
reason torque values from Year-1 should not be compared to the values found in Year-2
93
Year-1 Results
The torque bond test was conducted on four bridges Some bridges visited during Year-1
were not tested due to time restrictions with traffic control The results for the testing
conducted are presented in Figure 67
Figure 67 Year-1 Torque Test Results
Three of the four bridges tested recorded a torque strength of around 500 Nm Although
the strength on Bridge 9036 (Robert St) was lower only one of the tests removed the
epoxy system from the bridge deck All other tests performed on Robert Street broke the
epoxy securing the steel plate to the system Weather conditions on the day of testing are
most likely the cause for this lower epoxy strength The conditions were sunny with
temperatures above 90degF [32degC] With even higher roadway surface temperatures the
epoxy used to secure the steel plate was reaching its upper operating temperature limit
Two tests removed the epoxy system from the bridge deck
0
50
100
150
200
250
300
350
400
450
500
4190 9036 9066 9067 9823 14810 69006
Req
uir
ed T
orq
ue
(Nm
)
Non-Wheel Path Wheel Path
No
Dat
a
No
Dat
a
No
Dat
a
No
Dat
a
No
Dat
a
No
Dat
a
94
Bridge 9036 (Robert St) Non-wheel path test removed the system with a torque
of 210 Nm This test was the test performed closest to the damaged section of the
system This indicates that the debonding of the system may slowly be spreading
away from the already damaged area
Bridge 14810 (Barnesville MN) Non-wheel path test removed the system with a
torque of 500 Nm [370 ftmiddotlb] The system was removed after the strength gauge
on the torque wrench was maxed out
Year-2 Results
A more robust analysis of the bond strength was completed during the second year of the
study The torque bond test was conducted on eight bridges during the year two study
Bond strength results varied greatly compared to results from the first year of study but
the variation is most likely from the small change in the testing procedure In the second
year the required torque for removal of the steel plates was much lower and the removal
of the HFO system was more common In the first year excluding Bridge 9036 because it
is considered an additional bridge one of the eighteen tests conducted on three different
bridges removed the HFO system from the bridge deck In Year-2 30 of the 53 tests
conducted on eight bridges removed the HFO system from the bridge deck A varying
degree of removal occurred This various degree of removal is illustrated below in Figure
68 and is quantified by ldquono removalrdquo (left) ldquopartial removalrdquo (middle) and ldquototal
removalrdquo (right)
95
Figure 68 Various Degree of Removal Including No Removal (Left) Partial
Removal (Middle) and Total Removal (Right)
The results for the testing conducted are displayed in Figure 69 in the unit of Newton-
meters From the data below it is hard to find a conclusive general trend for the strength
of systems
Torque for bridges with the same systems have similar torque values
Novachip systems varied from 100 Nm to 150 Nm [74 to 111 ftmiddotlb]
SafeLane systems varied from 150 Nm to 200 Nm [111 to 148 ftmiddotlb]
Poly-Carb systems varied from 175 Nm to 450 Nm [129 to 332 ftmiddotlb]
Transpo systems varied from 120 Nm to 420 Nm [89 to 310 ftmiddotlb]
Poly-Carb and SafeLane are epoxy overlay systems while Novachip is a thin-bonded
open graded asphalt overlay With epoxy having better tensile strength properties
compared to asphalt Novachip has the smallest required torque when internal tensile
stresses are placed on the HFO systems as a result of the torque placed on the system
96
Figure 69 Torque Bond Test Results
Values from the non-wheel and wheel path are similar for each individual bridge with a
variance of 50 Nm [37 ftmiddotlb] When comparing the difference between passing lane and
driving lane values that variance increases to 75 Nm [55 ftmiddotlb] Bridges 9066 and 9067
(I-94 in Moorhead Poly-Carb) have a Poly-Carb system with Flint aggregate These
bridges had an average variance of 100 Nm [74 ftmiddotlb] between non-wheel and wheel
path The flint aggregate particles are the smallest used in the HFO systems in this study
and tend to be more flat compared to aggregates in other systems During installation of
systems with flint it is possible to have many of the flat particles placed with similar
orientation This orientation and small particle size reduces the amount of aggregate
interlock and can cause a weak plane in the system This is illustrated below in Figure 70
The figure shows two samples that were removed using the torque bond test On the left
0
50
100
150
200
250
300
350
400
450
9066 9067 9823 14809 14810 9066 9067 9823 27019 27758 69006 86013
Req
uir
ed T
orq
ue
(Nm
)
Wheel path Non-Wheel Path
Passing Lanes Driving Lanes
97
is the partial removal of a Poly-Carb system with Flint aggregates (Br 9067) while the
sample on the right is a partial removal of a SafeLane system (Br 14810) The partial
removal of flint happened in a horizontal plane where the SafeLane partial removal depth
varies across the sample
Figure 70 Comparison of Poly-Carb with Flint (Left) and SafeLane Torque Removal
Samples
98
In the driving lane both of the bridges with a Novachip system had 100 of the tests
with at least a partial removal of the HFO system The only other removals in the driving
lane occurred in the wheel path of Bridge 9066 (WB I-94 in Moorhead Poly-Carb) and
Bridge 69006 (TH 53 in Virginia Poly-Carb) (Figure 71)
Figure 71 Percentage of Tests in the Driving Lane Removing HFO Systems from the
Bridge Deck
The removal rate of the HFO systems in passing lanes during torque testing is provided in
Figure 72 Of the five passing lanes tested four had 100 of the tests remove at least a
portion of the HFO system The other bridge (Br 9823 TH 53 in Virginia Poly-Carb) did
not have any system removal in the passing lane There are not any apparent conditions
that point to why removals are more common in the passing lane compared to the driving
lane One possibility is the variation of construction As previously discussed visual
0
10
20
30
40
50
60
70
80
90
100
6347 9066 9067 9823 27019 27758 69006 86013
Per
centa
ge
of
Tes
ts C
ond
uct
ed i
n t
he
Pas
sing L
ane
for
Eac
h
Bri
dge
()
No Removal () Wheel Path Total Removal ()
Wheel Path Partial Removal () Non-Wheel Path Total Removal ()
Non-Wheel Path Partial Removal ()
99
inspection can often reveal different distress and abrasion patterns on different sides of
construction joints This variability may cause the variability in torque testing both
laterally and transversely along the bridge
Figure 72 Percentage of Tests in the Passing Lane Removing HFO Systems from the
Bridge Deck
Permeability Results
The permeability factor found during all testing was very small and for practical purposes
may be considered zero The macrotexture that exists from the aggregate used in these
overlay systems creates void space between some aggregate particles Water slowly
infiltrates these void pockets throughout the duration of the test This infiltration is the
reason behind permeability coefficients (K values) that are very small but not zero For
the SafeLane (Br 14809 and Br 14810) and the Novachip (Br 27019 and Br 86013)
0
10
20
30
40
50
60
70
80
90
100
9066 9067 9823 14809 14810
Per
centa
ge
of
Tes
ts C
ond
uct
ed i
n t
he
Pas
sing L
ane
for
Eac
h
Bri
dge
()
No Removal () Wheel Path Total Removal ()Wheel Path Partial Removal () Non-Wheel Path Total Removal ()Non-Wheel Path Partial Removal ()
100
systems the aggregates were too large to allow for permeability testing The large
aggregate on the surface of these systems prevented a strong and complete seal when
attaching the testing equipment to the roadway Weather prevented testing from occurring
for both Transpo bridges Results are presented in Table 19
Table 19 Permeability Results
Bridge
Coefficient of Permeability (K)
Year-1 Year-2
Wheel Path
(cmsec)
Non-Wheel
Path (cmsec)
Wheel Path
(cmsec)
Non-Wheel
Path (cmsec)
6347 NA NA NA NA
9036 226x10-7 1855x10-7 NA NA
9066 0 2102x10-7 219x10-7 232x10-7
9067 1779x10-7 NA 0 228x10-7
9823 9046x10-7 2016x10-7 0 234x10-7
14809 NA NA NA NA
14810 3811x10-6 NA NA NA
27019 NA NA NA NA
27758 NA NA NA NA
69006 0 1007x10-6 439x10-7 0
86013 9814x10-5 5520x10-6 NA NA
86019 NA NA NA NA
This test was also conducted on a traditional concrete bridge deck to provide a
benchmark for comparison to bridges without an HFO system In Year-2 this test was
also conducted on Bridge 9824 which is the counterpart for Bridge 9823 in Atkinson
MN Bridge 9824 does not have an HFO system it has a tined concrete bridge deck The
test was conducted on the bridge deck in two locations The first did not have any
distresses and resulted with a K value of 0 cms The second test was over an unsealed
101
crack in the bridge deck (Figure 73) with a resulting K value of 153x10-6 cms Some
Department of Transportation agencies have permeability criteria for asphalt pavements
with an acceptable range between 0 and 125x10-5 cms (Williams 2009) Table 20
displays the ranges discussed to provide a visual of the differences between the values
Table 20 Coefficient of Permeability Ranges for Different Paved Surfaces
Different Paved Surfaces Coefficient of Permeability (cms)
Acceptable Range for Asphalt pavement 0 to 125x10-5
Concrete with Crack (Br 9824) 0 to 153x10-6
HFO systems 0 to 439x10-7
Figure 73 Area of Bridge 9824 Tested for Permeability
HFO systems provide a much more impervious surface which is one of their design
benefits This impervious barrier helps to protect bridge decks from harmful deterioration
and corrosion from chloride penetration
The aggregates used for the Novachip systems were too large to allow a proper seal for
permeability testing A test was conducted on the shoulder where high abrasion had
reduced the macro texture During this test it appeared that a proper seal was achieved
102
and some water was permeating into the system After a short duration of time (one or
two minutes) water would percolate back to the surface from outside the diameter of the
testing apparatus This suggests that water may be infiltrating into the system and moving
laterally however it is impossible to say at what rate and how far into the system water is
able to infiltrate
Surface Friction Results
This section discusses the testing conducted on the surface of HFO systems Results of
testing provide skid numbers or the coefficient of friction for a given surface A
discussion of skid numbers is found above in Chapter 2
Surface Friction Using a Skid Trailer
A skid trailer provides surface friction values in the form of skid numbers which were
provided by MnDOT The bridge deck skid numbers are plotted against time in Figure
74 (ribbed tire) and Figure 75 (smooth tire) Figure 76 is the average skid numbers for
Bridge 14810 and is provided as an example in this section Some bridge decks were
reported to have too much friction to properly test This is represented in the plots with
year one skid numbers that are larger than 100 The ranges found for PCC pavements are
also in Figure 74 and Figure 75 They are labeled Turf Drag PCC and appear as an area
with cross-hatching It should be noted that the dashed portions of the lines in the
following figures indicate an approximation based on the available data
The SN values in Figure 74 and Figure 75 show that several HFO systems are still above
a SN of 50 several years after installation while others have fallen below 50 and into the
ldquopotential action segmentrdquo threshold
103
Figure 74 Average Ribbed Tire Skid Number over Time
In general the first year of service has a significantly larger loss compared to subsequent
years After this first year the slopes for the different bridges are approximately the same
This means the friction of all systems is degrading at a similar rate Abrasion is more
likely to occur with particles that have substantial angularity As the edges of angular
aggregates are rounded over time due to abrasion the rate at which they degrade
significantly decreases Aggregate particles not fully bonded with epoxy matrix may be
removed with relative ease The Novachip system (BR 27019) is the only bridge that did
not have a significant reduction in its skid number over the first year of service
Comparison to normal pavement skid numbers is possible by comparing these systems to
the skid numbers of Turf Drag PCC Of the eight bridges tested seven of them are above
the Turf Drag PCC range while the other bridge (Br 27019) is within the range However
0
10
20
30
40
50
60
70
80
90
100
1 2 3 4 5 6
Aver
age
Skid
Num
ber
Years in ServiceTurf Drag PCC 69006 9823
9066 9067 14809
14810 27758 27019
104
after three years five of the bridges are at or below the bottom of this range Interestingly
the Novachip system (Br 27019) is the only system inside the range at year one but is
one of the three bridges above the range after the third year The fact that these systems
approach this range within three to five years reveals that HFO systems only have
comparatively higher friction values for a short period of time in regions that rely heavily
on snow plows Severe winter conditions and maintenance common in Minnesota cause
abrasion that rapidly reduces the life of a high friction system This does not suggest that
systems are by any means unsafe but that skid numbers quickly become comparable to
that of a traditional bridge deck
Figure 75 Average Smooth Tire Skid Number over Time
0
10
20
30
40
50
60
70
80
90
100
1 2 3 4 5 6
Aver
age
Skid
Num
ber
Years in Service
Turf Drag PCC 9066 69006 9823 9067 14810
105
On the smooth tire plot some of the slopes have a positive slope This is evidence that the
smooth tire is sensitive to water film depth The large macrotexture in the epoxy systems
have the capacity to hold more water which may cause the variance in results The bridge
decks all stay above the range of Turf Drag PCC This suggests that the microtexture of
the epoxy systems are better than that of a PCC pavement
Bridge 14809 and 14810 (Barnesville MN) have skid numbers for the bridge deck before
and after the installation of the epoxy system in 2007 A major reason for the installation
of these epoxy systems is the improved friction in poor weather condition This
information is useful to analyze how long the HFO system provides a system with better
skid numbers higher than conditions without such a system Figure 76 is the average skid
numbers for Bridge 14810 As shown the skid numbers for the bridge deck before the
installation of the SafeLane epoxy system were 443 (ribbed) and 349 (smooth) The
latest test conducted on July 24 2012 resulted with skid numbers of 351 (ribbed) and
376 (smooth) In the five years since the placement of the system the bridge deck skid
numbers have reduced to skid numbers similar to a bridge deck without an HFO system
in place
106
Figure 76 Bridge 14810 (Barnesville MN) Average Skid Numbers
In Year-2 the skid numbers for Bridges 6437 (Osceola) 86013 (Otsego) and 86019
(Otsego) were provided (Figure 77) but there is not any previous data to compare with
The Poly-Carb systemsrsquo (9066 and 9067 I-94 Moorhead) skid numbers continue to
diminish The Novachip systemrsquos (Bridge 27019 TH 101 Otsego) skid numbers remained
the same from 2012 to 2013 The Novachip system is the only bridge that did not have a
significant reduction in its skid number over the first year of service and its skid numbers
reduce at a slower rate This is due in large to the fact that Novachip is asphalt based and
as explained previously has more elastic properties This elasticity preserves the systems
aggregates which in turn provides better friction values
0
10
20
30
40
50
60
70
80
90
100
2007 (Pre) 2007 (Post) 2008 2009 2010 2011 2012
Skid
Num
ber
Year Tested
Ribbed Tires Smooth Tires
107
Figure 77 Skid Number Comparison (2012 vs 2013)
Since 2011 the skid numbers for Bridge 27758 (Penn Ave in Minneapolis Transpo) have
increased from 487 to 547 (Figure 78) Originally the rise from 487 in 2011 to 504 in
2012 was written off as either an error in testing or testing a different section of the
bridge with better friction values However it is now evident with the continual increase
that it cannot be attributed to an error in the testing procedure
0
10
20
30
40
50
60
70
6437 9066 9067 27019 27758 86013 86019
Sk
id N
um
ber
2012 2013
108
Figure 78 Skid Numbers for Bridge 27758 (Penn Ave Minneapolis)
The HFO system placed on Bridge 27758 is very thin and as described earlier
(Observation Section) the system is being removed completely in thin strips exposing the
bridge deck As parts of the bridge deck are being exposed the mean texture depth (MTD)
is actually increasing In an area of the system that is not distressed the MTD is from the
top of the aggregate layer to where the aggregates are embedded into the epoxy In a
distressed are the MTD is from the top of the aggregates to the top of the concrete deck
Since the removed areas are small relative to contact area of a tire the distress is actually
increasing the MTD and improving the skid number of the system This is illustrated in
Figure 79
0
10
20
30
40
50
60
70
2010 2011 2012 2013
Skid
Num
ber
Year
109
Figure 79 Distresses Helping to Increase the MTD and Skid Numbers on Bridge 27758
Surface Friction Using a Dynamic Friction Tester
The surface friction values are provided by the Dynamic Friction Tester (DFT) as the
coefficient of friction Each test conducted generated a report with values for the
coefficient of friction at 0 20 40 60 and 80 kmh (0 124 249 373 497 mph) as well
as a chart graphing the coefficient of friction throughout the duration of the test (Figure
80)
110
Figure 80 Coefficient of Friction throughout Duration of DFT Testing
Below are the average values for the coefficient of friction at 60 kmh for the wheel and
non-wheel path of each bridge (Figure 81) For Bridge 14809 (WB I-94 Barnesville
SafeLane) data for the passing lane was lost in the field The passing lane for Bridge
9823 (SB I-35 in Atkinson Poly-Carb) was not tested In general the wheel path has
lower friction values compared to the non-wheel path On average there is a 17
difference between the wheel and non-wheel path Also the driving lane has lower
friction values compared to the passing lane with an average difference of 10 The
trends match up with the mean texture depth (MTD) trends discussed earlier Higher
abrasion (in the wheel path compared to the non-wheel path and the driving lane
compared to the passing lane) reduces the MTD a reduction in the texture results in a
reduction of friction This correlation will be studied more and expanded upon in the
upcoming final report
There is very little difference between the driving and passing lane values for Bridge
9066 (WB I-94 in Moorhead Poly-Carb) which matches the visual observation that this
bridge was heavily worn with a lot of aggregate polishing present Both the driving lane
111
wheel and non-wheel path values are lower than any values in the passing lane on Bridge
9823 (SB I-35 in Atkinson Poly-Carb) This bridge has a negative grade and curves
horizontally to the right When a snowplow drives over this particular geometry the
snowplowrsquos blade places a lot of pressure on the right side of the bridge
Figure 81 Average Coefficient of Friction at 60 kmh for Wheel and Non-Wheel Paths
Results from Dynamic Friction Tester Results
Comparison of Dynamic Friction Tester and Skid Trailer Values
Since the skid numbers found using the skid trailer are the coefficient of friction
multiplied by 100 dividing the SN values by 100 allows for the comparison between the
DFT and skid trailer values Below in Figure 82 the coefficient of friction from both the
skid trailer and DFT are plotted It should be noted that the skid trailer testing is
0000
0100
0200
0300
0400
0500
0600
0700
0800
6347 9066 9067 9823 14809 14810 27019 27758 69006 86013
Co
effi
cien
t o
f F
rict
ion
Driving Lane Wheel Path Driving Lane Non-Wheel Path
Passing Lane Wheel Path Passing Lane Non-Wheel Path
112
conducted at 30 mph (482 kmh) and the DFT plots values at 249 mph (40 kmh) and
373 mph (60 kmh)
Figure 82 Comparison of Coefficient of Friction Found using the Skid Trailer and DFT
For most of the bridges the coefficient of friction found using the skid trailer and the DFT
are similar The values vary the most in Bridges 6347 14809 14810 and 27019 Bridges
14809 (SafeLane) 14810 (SafeLane) and 27019 (Novachip) have HFO systems that use
larger aggregates This larger macrotexture may prevent the skid trailer from properly
testing the surface The larger aggregates sit higher out of the epoxy or asphalt they are
embedded in When a wheel drives across the surface it is only in contact with the tops of
the aggregate This reduced area requires less horizontal force and thus produces lower
coefficients of friction Bridge 6347 (Transpo) as previously discussed had excess epoxy
placed during construction and thus has smooth spots A DFT test was run specifically on
a smooth location resulting in a coefficient of 058 (40 kmh) and 059 (60kmh) which
0
01
02
03
04
05
06
07
08
6347 9066 9067 9823 14809 14810 27019 27758 69006 86013
Co
effi
cien
t o
f F
rict
ion
SN100 (2014) SN100 (2013) SN100 (2012) Cf (60kmh) Cf (40 kmh)
SN100 are results of skid trailer testsCf are results of DFT tests
113
are significantly lower than the average DFT values for these speeds Thus when a skid
trailer is run over a longitudinal section of the roadway to obtain the coefficient of
friction it combines these smooth areas and normal areas resulting in a reduced
coefficient of friction
Overall the DFT and skid trailer tests provide similar surface friction values It is
recommended that DFT testing becomes a more prevalent test method because of the
benefits it provides compared to the skid trailer It allows for multiple tests run in the
same location providing higher precision It also eliminates error that may interfere with
test results such as bouncing lateral movement improper water spray film thickness or
incorrect speeds of the skid trailer which must be in motion for its testing procedure The
fact that testing is done in a static location for DFT testing provides the opportunity to
test more accurately in wheel and non-wheel paths It also provides the opportunity to test
specific distressed areas to compare with non-distressed areas
Comparison of the Coefficient of Friction to the Age of an HFO System
The coefficient of friction results from DFT testing were compared against the number of
years each system has been in service (Figure 83) This comparison will provide
information about the retention of surface friction over time Similar comparisons were
made above mapping the skid numbers of systems over time however with only one year
of DFT data this is not possible
114
Figure 83 Coefficient of Friction versus the Number of Years in Service
As shown by this data the different epoxy systems reach the coefficient of friction of 05
(equivalent of a 50 SN value) between the third and seventh year of service The
Novachip system however averaged 065 after six years in service Novachip systems are
able to maintain a higher coefficient of friction for a longer time period compared to
epoxy systems This is due to the fact that aggregate raveling is not a common distress
with Novachip systems and they are able to retain their aggregates
Comparison of the Coefficient of Friction to the Mean Texture Depth
The coefficient of friction results from DFT testing were compared with the mean texture
depth (MTD) results from the sand patch testing The comparison shows that as MTD
increases so does the coefficient of friction (Figure 84)
0000
0100
0200
0300
0400
0500
0600
0700
0800
0 1 2 3 4 5 6 7 8
Co
effi
cien
t o
f F
rict
ion
Number of Years in Service
Transpo Poly-Carb SafeLane Novachip
115
Figure 84 Trends between the Mean Texture Depth and Coefficient of Friction for the
Different HFO Systems
The rate at which the coefficient of friction increases can be broken into two different
groups The first group is Poly-Carb and Transpo systems which both use 0187 inch [5
mm] aggregates The second group includes SafeLane and Novachip which use 0375
inch [95 mm] aggregates The smaller aggregate grouprsquos coefficient of friction increases
more rapidly compared to the second group This suggests that smaller aggregates have a
higher ability to create a frictional surface compared to larger aggregates If aggregates
become too large the majority of frictional properties will come from the aggregatersquos
microtexture whereas tightly grouped aggregates of a smaller size provide frictional
properties based off of their macrotexture Based on this it is recommended that HFO
systems use aggregates under 0375 inches [95 mm] in their system in order to utilize the
macrotexture of aggregates for frictional properties
y = 33953x + 03739y = 19427x - 00631
y = 21396x - 00973y = 11365x + 00323
0
01
02
03
04
05
06
07
08
0 001 002 003 004 005 006 007
Co
effi
cien
t o
f Fr
icti
on
Mean Texture Depth (in)
SafeLane Poly-Carb Transpo Novachip
Linear (SafeLane) Linear (Poly-Carb) Linear (Transpo) Linear (Novachip)
116
Chloride Ion Penetration Results
The following section provides results of the chloride ion content testing conducted by
MnDOT as well as an analysis of the data Tables containing the chloride content data are
provided in the Appendix The average chloride content for Bridge 9823 and Bridge
69006 are below in Figure 86 through Figure 89 The figures are separated into driving
and passing lanes for each bridge It is important to note that the chloride content lower
limit at which corrosion can occur (discussed above) is also shown on the following
plots Data points to the left of this lower limit are in the range of possible corrosion The
lines between data points are dashed because there is not a linear correlation between two
different depths For instance the average chloride content at a depth of three inches
below the surface shown on the graph is the average content found in cross section of the
cores cut between two and three inches below the surface
Below in Figure 85 the data from Bridge 9823 in 2011 is displayed All six cores taken as
samples are displayed with a solid line while the averages for each lane are shown in
dashed lines The purpose of this figure is to illustrate the deviation between different
samples Depending on the sample location chloride content can vary upwards of 3000
ppm highlighting one of the downsides of this testing Although the test method is
reliable the sample size is small and localized relative to the surface of the bridge deck
117
Figure 85 Driving Lane Chloride Content in parts per million during 2011 (Bridge 9823)
0
05
1
15
2
25
3
35
4
010002000300040005000600070008000
Dep
th B
elo
w D
eck S
urf
ace
(in)
Chloride Content (ppm)
Occurance of Corrosion Lower Limit 2011 Driving Lane Average
2011 Passing Lane Average Driving Lane Core 1
Driving Lane Core 2 Driving Lane Core 3
Passing Lane Core 1 Passing Lane Core 2
Passing Lane Core 3
118
Figure 86 Driving Lane Average Chloride Content in parts per million (Bridge 9823)
0
1
2
3
4
5
6
01000200030004000500060007000
Dep
th B
elo
w D
eck S
urf
ace
(in)
Chloride Content (ppm)
2011 2014 Corrosion Occurrence Lower Limit
119
Figure 87 Passing Lane Average Chloride Content in parts per million (Bridge 9823)
0
1
2
3
4
5
6
0100020003000400050006000
Dep
th B
elo
w D
eck S
urf
ace
(in)
Chloride Content (ppm)
2011 2014 Corrosion Occurrence Lower Limit
120
Figure 88 Driving Lane Average Chloride Content in parts per million (Bridge 69006)
0
1
2
3
4
5
6
0500100015002000250030003500400045005000
Dep
th B
elo
w D
eck S
urf
ace
(in)
Chloride Content (ppm)
2010 2011 2014 Corrosion Occurrence Lower Limit
121
Figure 89 Passing Lane Average Chloride Content in parts per million (Bridge 69006)
In large the chloride content at similar depths remains relatively constant or decreases
throughout the various years of testing This trend is true for the driving lanes of both
bridges as well as the passing lane of Bridge 9823 For example the chloride content for
the driving lane of Bridge 69006 at a depth of two inches remains around 2500 ppm
while at three inches it drops from around 1200 ppm in 2010 to near 650 ppm in 2014 It
should be noted that all testing was conducted after the HFO systems were installed
however the bridge decks were constructed years before the installation of an HFO
system Therefore it is reasonable to assume that the chloride content found in these
samples penetrated the bridge deck before the installation of an HFO system
0
1
2
3
4
5
6
0100020003000400050006000
Dep
th B
elo
w D
eck S
urf
ace
(in)
Chloride Content (ppm)
2010 2011 2014 Corrosion Occurrence Lower Limit
122
This trend does not occur in the passing lane of Bridge 69006 (Figure 89) In this lane
the chloride content at a depth of two inches increased from 1700 ppm in 2010 to 4100
ppm in 2014 and this increasing trend occurs along all depths on this lane The reason for
this is that the sample taken in 2014 must have been cored at or near a distress in the
HFO system where the systemrsquos impermeability properties have been compromised
Distresses that compromise the systemrsquos properties include delamination cracking or
removal of the system due to snow plow abrasion When compromising distresses occur
they provide an environment that allows for the infiltration of chloride ions into the
bridge deck
The trends described above prove that when properly placed and when compromising
distresses have not occurred HFO systems have the ability to protect infrastructure from
chloride ion penetration However distresses of the system such as delamination
abrasion or cracking mitigate this protection in a localized area near the distress It is
also important to note that these systems do not help to reduce the amount of chloride
ions that had penetrated into the concrete bridge deck prior to the installation of an HFO
system
Based on the field observations conducted of the fourteen bridges in this study
Two bridges had delaminated HFO systems (Br 4190 and 9036 both Poly-Carb)
Three bridges had cracks in the HFO systems (Br 27019 86013 and 86019 - all
Novachip)
One bridge had delamination an cracking (Br 6347 Transpo)
One bridge had cracking and complete removal of system sections due to
abrasion (Br 27758 Transpo)
Thus fifty percent of the bridges in this study have compromised systems where water
and chloride ions are able to penetrate into the bridge deck The harsh winter conditions
and maintenance practices performed in Minnesota facilitate the distress of HFO systems
in such a way that the systemrsquos ability to protect bridge decks from chloride ion
penetration can be compromised near such distresses
123
Field Observations and Testing Summary
In this task a number of field tests and observations have been conducted to gain
perspective on the performance of bridge decks with epoxy system overlays This task
not only evaluated how the systems have been performing but also provided information
regarding changes in year-to-year performance by comparing results from Year-1 to
Year-2 The main concern for the wear courses assessed through testing include (1)
retention of aggregate particles (2) degradation and polishing of aggregate particles due
to the actions of traffic loading and snow plow abrasion (3) frictional characteristics of
the wear courses (4) deck sealing capabilities and (5) durability of aggregate under
repeated freezing and thawing conditions
The HFO systems visited are performing at varying states of satisfaction The three
distresses (1) aggregate raveling (2) abrasion and (3) polishing are apparent on all
bridges Severe winter conditions and maintenance common in Minnesota appear to
cause abrasion that rapidly reduces the life of a high friction overlay system
Several conclusions can be drawn about the skid numbers and abrasion when results are
compared to other pavement types
Novachip systems perform better in regards to abrasion The viscoelastic response
of asphalt allows for the continual embedment of aggregates into the matrix which
helps to reduce the amount of aggregate loss
Novachip systems have a superior aggregate retention which results in an ability
to maintain higher friction values
Novachip systems have the lowest performance in the torque bond test because of
asphaltrsquos inferior tensile strength compared to epoxy
Novachip systems appear to have some permeability into the system However the
large aggregate on the surface prevent an adequate seal for testing equipment
Therefore it is not possible to determine the rate of permeability and how deep
water is able to penetrate
Poly-Carb systems had the fewest sample removals during torque testing
124
Significant abrasion especially in the non-wheel path occurred on the Poly-Carb
and SafeLane bridges when comparing their MTD values from 2013 to 2014
Dynamic Friction Testing was conducted in order to acquire friction values
specific to the wheel and non-wheel path The coefficient of friction results are
comparable with skid numbers however DFT testing is able to reduce some
uncertainties associated with skid testing
The two Transpo systems vary heavily from each other The system in Osceola
(Br 6347) is a more complete system (thicker system larger aggregates less
distresses) The system in Minneapolis (Br 27758) is very worn down with the
bridge deck exposed across a significant portion of the bridge
The combination of water presence under a bridge and poor expansion joints may
play a role in the delamination of epoxy systems from a bridge deck due to
moisture presence and expansioncontraction of the bridge deck
Correlations between skid numbers (skid trailer) and coefficient of friction
(dynamic friction tester) exist Both tests provide similar results DFT testing is
preferred because of its localized testing ability and its reduction in errors due to
testing in a moving vehicle
Higher friction values are achieved faster while increasing the mean texture depth
(MTD) through the use of smaller aggregates (0187 NMAS compared to 0375
NMAS)
When properly placed and when compromising distresses have not occurred
HFO systems have the ability to protect infrastructure from chloride ion
penetration
When distresses such as delamination cracking or removal of the HFO system
occur the HFO systemrsquos ability to protect the infrastructure from chloride ion
penetration can be compromised Once compromised chloride ion penetration
will occur in local areas of the bridge deck near the distresses Based on field
observations from other parts in this study fifty percent of the bridges being
researched have such compromising distresses in their HFO systems
125
Chapter 5 Crash Data Analysis
This section analyzed crash data to evaluate the effectiveness of high friction overlays in
reducing crashes This study was completed by analyzing ten years of data for nine
bridges encompassing four different proprietary overlay systems Within one of the
overlay systems three different aggregate types were also compared Crash
characteristics analyzed included the crash time weather conditions bridge surface
conditions average daily traffic (ADT) and severity of crashes
The analysis of data suggests that although there is a decreasing trend in overall crashes
a reduction in crashes on bridges cannot be completely attributed to the use of high
friction overlays The presence of high friction overlays may be unable to play a role in
winter crash prevention
Causes of Crashes in Minnesota
In order to reduce the number of crashes occurring on a roadway a transportation agency
must first identify what is causing the crashes The following is a summary of why
crashes in Minnesota are occurring Data was taken from the Minnesota Motor Vehicle
Crash Facts 2013 Report This report is published annually by the Minnesota Department
of Public Safety About one-third of all crashes are single vehicle accidents For single-
vehicle accidents illegal or unsafe speed is the most common cause followed by
inattentive or distracted driving In the multi-vehicle accidents that account for the other
two-thirds of total accidents inattention or distraction is the most common cause (MN
Department of Safety 2014)
In 2013 77707 crashes were reported to Public Safety in Minnesota This was an
increase of 109 from 2012 Deaths were reduced by 20 from 2012 with 387
occurring in 2013 It should be noted that 2013 displayed harsh winter conditions above
the statersquos average Although not stated by MnDOT or any other organizations this study
attributes the harsh winter conditions for the increase in crash rates between 2012 and
2013 The number of crashes occurring in 2013 was the highest number of annual crashes
126
to occur in Minnesota since 2008 When looking at longer trends of crash rates in
Minnesota the number of crashes occurring each year generally decrease The number of
crashes occurring in the state is down from 94048 in 2003 to 69236 in 2012 (MnDOT
2013)
This decreasing trend is occurring both in overall crashes as well as critical emphasis
areas identified by state agencies Critical emphasis areas are crash specific
characteristics that are used to help identify specific ways to reduce crashes These areas
are based on guidelines set by the Strategic Highway Safety Plan (SHSP) created by the
Federal Highway Association (FHWA) The SHSP recommends that states should
identify between four and eight emphasis areas to help direct efforts and make a more
ldquostrategicrdquo and effective plan for improving safety (FHWA 2013) The Minnesota
emphasis areas listed in
127
Table 21 and were identified by state agencies based on an analysis of safety data
(MnDOT 2014B) This decreasing trend provides proof that the increase in education
engineering enforcement and emergency medical and trauma services through the
Towards Zero Deaths program is helping to provide safer driving conditions
128
Table 21 Percent Change of Crash Emphasis Areas
Emphasis Area Percent Change
2003 to 2012
Percent Change
2008 to 2012
All Fatal amp Serious
Injuries -51 -17
Unbelted -66 -30
Impaired -41 -13
Speed -67 -35
Inattention -64 -24
Lane Departure -46 -16
Intersection -57 -21
Older Driver -39 -90
Young Driver -69 -38
Commercial Vehicles -42 -14
According to the National Highway Traffic Safety Administration the causation of a
crash is attributed to the driver 94 of the time the other 6 is evenly distributed
between the vehicles environment and other unknown reasons (USDOT 2015) While
the vast majority of crashes occur due to human error the elimination of poor roadway
conditions through engineering and proper maintenance can assist in a reduction of
crashes Since HFO systems are designed to create higher friction surfaces that help to
reduce crash rates this study focuses on crash characteristics pertaining to the surface
conditions
Data Collection
In total nine bridges in six different locations were included in the crash reduction study
The two bridges excluded from the crash data analysis were Bridges 27758 and 86019
Bridge 27758 (Penn Ave Poly-Carb) was excluded because only one accident was
reported in this section during the ten years of provided data The event occurred after the
129
epoxy overlay installation however it occurred with clear and dry conditions during rush
hour and therefore it can be assumed this accident was caused from extraneous factors
that the overlay surface could not prevent
Bridge 86019 [Novachip] is a southbound ramp that connects traffic from CASH 36 to
TH 101 in Otsego MN The bridge crosses over Crow River During the ten years of data
provided there were no reported accidents
The following comparison of crashes and certain site conditions between the nine bridges
used data from the Public Safety Database provided by MnDOT The study compared
eleven years of data from 2003 through 2013 This data provides information from both
before and after installation of the HFO systems The installation dates for these systems
vary between 2007 and 2010 When the data was procured for bridges in the Metro
district (Bridges 6347 27019 and 86013) the data from 2003 was incomplete and was
therefore omitted from the analysis For the same three bridges the data for 2013 extends
through May while the six bridges from other districts have data through December of
2013 Finally it should also be noted that Bridge 6347 crosses the St Croix River
connecting Minnesota and Wisconsin For this study only data for the Minnesota half of
the bridge was provided and analyzed
Analytical Comparison
In this analysis a total of 293 crashes were included for the nine bridges The public
safety database provides an abundance of information pertaining to each crash however
not every factor provided a useful comparison for this report Several aspects of the
crashes were investigated including
Total number of crashes
Bridge deck surface condition
Weather
Before and after HFO system installation
Average Daily Traffic (ADT)
130
It is important to note that for some of the bridges in this study the total number of
crashes is very small analysis for some of these bridges may appear skewed due to the
small sample size This skewing must be noted when comparing different statistics in
percentages and is especially true for Bridge 86013 [Novachip] and Bridge 6347
[Transpo] where only two and four crashes occurred respectively during the ten year time
span
Cause of Crashes
Of the 293 crashes occurring on the nine bridges 40 did not list a contributing factor For
the remaining 253 crashes the following are the top five contributing factors listed with
their percentage of occurrences
1 Illegal or unsafe speed 37
2 No clear factor 23
3 Following too closely 8
4 InattentiveDistracted Driving 8
5 Weather 7
A second factor was listed in about half of the crashes with the top four secondary factors
including weather (30) inattentivedistracted driving (15) skidding (11) and
illegal or unsafe speed (10) While a majority of accidents are attributed to human
error weather and surface conditions of the bridges exacerbate conditions in which
speeding or distracted driving may result in a crash This data reinforces the focus on
crash characteristics pertaining to the surface conditions for bridges with an HFO system
installed
Another factor that may lead to crashes occurring includes the physical factors of a
roadway including geometry elevation and traffic levels on the bridge Geometry and
elevation of the bridges were not covered in the scope of this research A strong
correlation exists when comparing the total number of crashes occurring to the Average
Daily Traffic (ADT) As shown below in Figure 90 as the ADT increases so does the
number of crashes This is a fairly intuitive result however it helps to illustrate that many
131
factors other than the friction values of the bridge surface cause a crash As ADT
increases the proximity of vehicles increases and driving tendencies may change with
other vehicles present on the bridge
Figure 90 Total Crashes Compared to the ADT
Severity of Crashes
The Public Safety Database has the severity of a crash broken down into five different
categories These categories are based on bodily injury caused by the crash ranging from
no apparent injury to fatality The majority of crashes (76) did not result in any injury
Two separate crashes occurred on westbound I-94 in Barnesville (Bridge 14809
[SafeLane]) that resulted in a fatality A fatal crash occurred both before and after the
HFO system was installed
Rsup2 = 08274
0
10
20
30
40
50
60
70
80
90
100
0 5000 10000 15000 20000 25000 30000 35000
To
tal
Cra
shes
(2
00
3-2
01
3)
Average Daily Traffic (in vehicles)
132
Time of Crashes
A majority (75) of the crashes occurred during the winter months (October-March)
This is expected because of poor driving conditions and roadway surfaces due to
inclement weather and the presence of water snow and ice on roadways HFO systems
were designed to improve roadway conditions during this time of poor weather The main
way these systems were designed to improve roadway conditions is through their coarse
macrotexture created from aggregates with a high microtexture Both microtexture and
macrotexture are important to improving friction values
Surface Conditions
The surface conditions that were present during crashes are provided in
Table 22 Dry and ice packed snow conditions were by far the two most common surface
conditions at 37 and 39 respectively It should be noted that a large percentage of
crashes occur on a dry surface due to the fact that roadways are dry for a majority of
days
Table 22 Surface Conditions during all Crashes
Surface Condition Percent of
Crashes ()
Dry 37
Ice Packed Snow 39
Slush 3
Snow 9
Wet 7
Other 5
Ice packed snow conditions are at the opposite end of the spectrum compared to dry
conditions While ice and snow produces slippery conditions on roadways it also reduces
the effectiveness of the macrotexture found in HFO systems As snow falls onto the
bridge surface snow and ice are packed into the macrotexture by traffic loads crossing the
133
bridge The snow and ice fill the voids between individual aggregate particles reducing
the friction available from a system (Figure 91)
Figure 91 Accumulation of Packed Ice and Snow due to Traffic Loads
With the assumption that HFO systems have a greatly reduced effectiveness during ice
packed snow conditions and their purpose is not to prevent crashes during dry
conditions it can be concluded that 76 of the crashes occurred with surface conditions
during which high friction systems are covered and therefore are not effective
A total of 55 of these crashes occurred when the weather was either clear or cloudy
This means that half of the crashes with this surface condition occurred during a time
when inclement weather was not present Such a high percentage presents the conclusion
that many of the crashes occurred directly as a result of the surface containing ice packed
snow Thus the removal of ice packed snow surface conditions would help to reduce the
Clear
Conditions
Snowfall and
Accumulation
Packed Ice and
Snow
134
number of crashes on bridge decks Several methods currently exist to reduce this
condition including automated deicing systems
The two bridges in Moorhead Bridges 9066 and 9067 [Poly-Carb Flint] have an
automated deicing system in place Such a system uses sensors embedded in the bridge
deck to detect potential freezing conditions When these conditions occur the deicing
chemicals are sprayed onto the bridge deck using an embedded application system The
main purpose of such a system is to prevent ice buildup on bridge decks This is different
than traditional deicing techniques such as salt which are used to break down ice that has
already formed on the surface Even with a deicing system in place 34 of the 73 (47)
crashes on Bridge 9066 and 15 of the 90 (17) of the crashes on Bridge 9067 occurred
with ice packed snow surface conditions For this report there is no information regarding
these deicing systems effectively preventing any conclusions from being drawn Several
factors may account for ice packed snow conditions occurring even with these systems
present including (1) when the system was installed (2) performance of systems (3)
maintenance required and (4) if the system was not functioning during winter months
Looking further into crashes with ice packed snow surface conditions and better methods
to effectively remove such conditions could help to further reduce the number of crashes
occurring on bridges in cold climates
Crashes Before and After HFO System Installation
One of the most important aspects to analyze performance of HFO systems is the crash
rates before and after the installation of such a system The following provides such a
comparison In general the average number of crashes annually decreases after
installation The average number of crashes on the bridges was reduced from 352 crashes
per year before an HFO system to 260 crashes per year In other words an annual
reduction of nearly one crash per bridge per year Several factors including severity of
crashes and surface condition were analyzed to verify whether systems with a higher
friction bridge surface provide a safer bridge deck
135
Severity Before and After
The comparison of crash severity is broken down into the five different categories based
on bodily injury Overall the distribution of injury did not change with the installation of
an HFO system (Figure 92) The number of crashes without injury was the largest
category to increase at 54 from 712 to 766 It does not appear that HFO systems
play a role in decreasing the severity of a crash that occurs on such a surface
Figure 92 Severity of crashes before and after installation of an HFO system
Surface Conditions Before and After
The following provides a comparison of the surface conditions when crashes occurred
both before and after installation (Figure 93) The solid bars on the plot represent crashes
before installation while the bars with cross hatching are crashes after the installation of
overlays It should be noted that the ldquocombinedrdquo bars are a conglomerate of wet slush
0
10
20
30
40
50
60
70
80
90
100
Per
centa
ge
Out
of
To
tal
Cra
shs
Before After
136
and snow surface conditions In general the annual number of crashes that occurred
during the ldquocombinedrdquo and ldquoice packed snowrdquo conditions decreased On average the
ldquocombinedrdquo crashes were reduced by 03 crashes per year The ldquoice packed snowrdquo
condition crashes were reduced on average by 08 crashes per year The average number
of crashes per year on dry surfaces remained constant for most bridges Before
installation the average number of crashes on Bridge 9067 (Poly-Carb Flint) was 36
crashes per year and doubled to 74 crashes per year after the installation of the HFO
system There are not any factors about the crashes or bridge that provide information as
to why this rate increased
Figure 93 Average number of crashes annually per surface condition before and after
installation of HFO systems
0
1
2
3
4
5
6
7
8
6347 9066 9067 9823 14809 14810 27019 69006 86013
Annual
Num
ber
of
Cra
shes
Dry Before Installation Dry After InstallationIce Packed Snow Before Installation Ice Packed Snow After InstallationCombined Before Installation Combined After Installation
137
Normalized to Traffic Levels Before and After
The traffic levels of a roadway can also play a large role in the amount of crashes that
occur The average number of crashes that occurred was normalized to the average daily
traffic (ADT) The general trend is once the HFO system was installed the number of
crashes per million vehicles was reduced However the amount at which they were
reduced is not that significant On average after a system was installed the crash rate
dropped by 03 crashes per million vehicles crossing This translates to a reduction of
about 1 or 2 vehicles per year The bridge with the best performance was Bridge 27019
[Novachip] with a reduction of 58 crashes per year There were eighteen crashes that
occurred during the five years before installation of an HFO system In the five years
after installation there was only one recorded crash This bridge shows the largest
reduction of crashes analyzed in this study
Comparison of Year-1 and Year-2 Crashes
The following is a comparison of the number of crashes that occurred during the first and
second year of this study The years 2012 (before the study) 2013 (Year 1) and 2014
(Year 2) are compared below in Figure 94 The total number of crashes to occur on the
nine bridges analyzed in this comparison are tallied below in Table 23
Table 23 Total Number of Crashes to Occur (2012- Oct 2014)
Year Total Number
of Crashes
2012 13
2013 37
2014 14
138
The number of crashes that occurred in the first year of this study (2013) was nearly triple
the number of crashes to occur during the previous year Through the first ten months of
year two more crashes had occurred than in 2012 This number is expected to increase as
November and December are two of the top three months in regard to this studyrsquos crash
rates It should be noted that Minnesota experienced an abnormally harsh winter season
from during the 2013-2014 winter season and this plays an important role in the increase
of crashes during this study From October 2013 to March 2014 30 of the 51 crashes in
this two year study occurred Thus 59 of the crashes occurred during a 27 span of the
total study time
The crashes that occurred on each bridge are broken down in the summer (April to
September) and winter (October to March) months (Figure 94) In the first year of this
study every bridge had a winter-time crash and number of crashes to occur in the winter
were the either the same or higher than in the year 2012
There was also a total of nine summer time crashes in 2013 compared to five that
occurred in 2012 Through the first ten months of 2014 three summer crashes have
occurred
139
Figure 94 Number of Crashes on Each Bridge during Summer (April-September) and
Winter (October-March) Months
The harsh winter season from 2013 to 2014 is also shown with the large amount of ice
packed snow conditions present during crashes in 2013 and 2014 Forty-nine percent of
the crashes that occurred during 2013 and 62 of the crashes in 2014 had ice packed
snow surface conditions present (Figure 95) Ice packed snow surface conditions mitigate
the effectiveness of the high friction values found on HFO systems
0
1
2
3
4
5
6
7
6347 9067 9066 9823 14809 14810 27019 69006 86013
Num
ber
of
Cra
shes
per
Yea
r
Summer (2012) Summer (2013) Summer (2014) Winter (2012) Winter (2013) Winter (2014)
140
Figure 95 Surface Conditions Present during Crashes in from 2012 to 2014
The comparison of crashes that occurred during the two years of this study reinforce the
need to reduce the ice packed snow condition from bridge decks An HFO system is not
an effective way of removing such a condition reducing the value of such a system in
Minnesota and cold climate regions
Comparison of Different HFO Systems
As discussed previously in the Scope of Analysis section there are several differences
between every bridge in this study These variables can lead to certain systems to
comparatively perform better than other systems The main variables that may cause
differences in performance are the types of systems and the types of aggregates thus a
comparison between the four HFO systems may detect whether any particular system is
0
2
4
6
8
10
12
14
16
18
20
Dry Ice Packed Snow Combined
Num
ber
of
Cra
shes
per
Yea
r
2012 2013 2014
141
performing better than the others A similar comparison of the four Poly-Carb bridges is
also made in order to compare the influence of different types of aggregates
Comparing the Four Different Proprietary HFO Systems
In order to compare the different types of systems the crash data was averaged from the
bridges for each system listed below
Poly-Carb (Bridges 9066 9067 9823 and 69006)
SafeLane (Bridges 14809 and 14810)
Transpo (Bridge 6347)
Novachip (Bridges 27019 and 86013)
The four different systems were compared using the present surface conditions during
crashes (Figure 96) Poly-Carb SafeLane and Novachip systems showed a significant
decrease in crashes during ldquoice packed snowrdquo and ldquocombinedrdquo conditions With crash
reductions ranging from 35 to 100 for the different combinations of systems and
surface conditions A similar amount of crashes occurred both before and after
installation of a Transpo system
142
Figure 96 Comparing the average number of crashes annually per surface conditions
before and after installation of different HFO systems
Comparing the amount of crashes occurring before and after installation of the different
systems normalized to traffic crossing the bridges reveals similar conclusions as
previously mentioned in the section Normalized to Traffic Loads Before and After An
average reduction of 03 crashes per million vehicles which translates into 1 or 2 vehicles
per bridge per year occurs after the installation of a system This is shown graphically
below in Figure 97 SafeLane and Novachip systems have the largest reductions
normalized to traffic (53 and 88 respectively) Poly-Carb had a reduction of 27
while the average number of crashes on the Transpo systems doubled after installation
0
05
1
15
2
25
3
Poly-Carb SafeLane Transpo T-48 NovaChip
Annual
Aver
age
Num
ber
of
Acc
iden
ts
Dry Before Installation Dry After Installation
Ice Packed Snow Before Installation Ice Packed Snow After Installation
Combined Before Installation Combined After Installation
143
Figure 97 Number of crashes per million vehicles crossing bridge before and after
installation of different HFO systems
Based on the comparisons made in Figure 96 and Figure 97 the Novachip systems appear
to have the best performance followed closely by SafeLane and Poly-Carb systems
0
01
02
03
04
05
06
07
08
09
1
Poly-Carb SafeLane Transpo NovaChip
Num
ber
of
Cra
shes
per
Mil
lio
n V
ehic
les
Before Installation After Installation
144
Comparison of Poly-Carb Systems Using Different Aggregates
The two comparisons discussed in the previous section were also conducted for the
different aggregates used within Poly-Carb systems Three different aggregates are used
by the systems in this study
Taconite on Bridge 69006 in Virginia MN
Flint on Bridge 9066 and 9067 in Moorhead MN
Basalt on Bridge 9823 in Atkinson MN
A comparison of crashes occurring during certain surface conditions before and after
installation is shown below in Figure 98 The two most significant themes are (1) the
taconite system had a large decrease in the amount of crashes occurring with ice packed
snow surface conditions and (2) the number of crashes with dry surface conditions
doubled for flint systems
145
Figure 98 Comparing the average number of crashes annually per surface condition
before and after installation of Poly-Carb systems with different aggregates
When comparing the Poly-Carb systems to one another normalized to traffic the number
of crashes per million vehicles is reduced by 47 and 38 for Taconite and Basalt
respectively However there is not a significant reduction in crashes with the installation
of a system using flint aggregates (2) Based on the comparisons made in Figure 98 it
appears that taconite is the best performing aggregate in terms of crashes of the Poly-
Carb systems
Comparison of Side by Side Bridges with and without HFO System Overlays
Several locations in this study allow side by side comparison of bridge decks with and
without HFO systems Three different bridges in the study carry one direction of traffic
with an HFO system while a counterpart bridge carries the other direction of traffic
without Details for these bridges are provided in Table 24
0
1
2
3
4
5
6
Taconite Flint Basalt
Annual
Aver
age
Num
ber
of
Cra
shes
Dry Before Installation Dry After InstallationIce Packed Snow Before Installation Ice Packed Snow After InstallationCombined Before Installation Combined After Installation
Solid Bars Crashes before installation of HFO systems
Crosshatched Bars Crashes after installation of HFO systems
146
Table 24 Details of Bridges in Side by Side Comparison
Location
Bridge
with
HFO
system
Bridge
without
HFO
System
HFO
Type
Aggregate
Type
Atkinson 9823 9824 Poly-Carb Basalt
Otsego 27019 27020 Novachip NA
Virginia 69006 69005 Poly-Carb Taconite
In Figure 99 the bridges without HFO systems are denoted with bars that have horizontal
hatch patterns The ldquoafter installationrdquo refers to the installation of a single system for each
location in order to compare a bridge with and without a system For example Bridge
69006 had an HFO system installed in 2009 thus the ldquoafter installationrdquo for both Bridge
69005 and 69006 is from 2010 through 2013 despite a system not actually being installed
on Bridge 69005
Previous research has looked at crashes occurring before and after the installation of an
HFO system The results provided the perceived benefit of crash reduction however this
perceived benefit occurs on bridges without an HFO installation As shown in Figure 99
the average number of crashes occurring on a bridge deck is reduced regardless of
whether or not an HFO system was installed and at about the same rate for each location
While crash rates are decreasing on bridges with an HFO system this reduction cannot be
solely attributed to the installation of such a system
147
Figure 99 Side by side comparison of average number of crashes annually before and
after the installation of HFO systems
Comparison of Crashes Normalized to Total Crashes in Minnesota
Using data from the Minnesota Vehicle Crash Facts Reports for the years 2004 through
2012 the crashes for each bridge location were normalized to the total crashes occurring
in the state The percentages of crashes occurring on each bridge both before and after the
installation of an HFO system are compared in Figure 100 For example on average
007 of crashes in Minnesota occurred annually on Bridge 9067 [Poly-Carb Flint]
while only 003 of crashes in Minnesota occurred on that bridge after the installation of
an HFO system Interestingly the bridges discussed earlier without HFO systems also saw
a drop in the average percentage of Minnesotarsquos crashes On average bridges with an
HFO system saw a drop of 0021 while bridges without an HFO system dropped
0025
0
1
2
3
4
5
6
9823 9824 69006 69005 27019 27020
Aver
age
Annual
Num
ber
of
Cra
shes
Before After
Solid Bars Bridges with HFO systems installed
Crosshatched Bars Bridges without HFO systems installed
148
Figure 100 Average percentage of total Minnesotan crashes occurring on each bridge
before and after installation of HFO systems
During the years of this study the general trend across the state of Minnesota was a
decrease in the total number of crashes The crashes occurring on bridges in this study
became a smaller percentage of the total crashes in the state however rate the amount in
which they dropped is comparable to bridge decks in the same location without an HFO
A comparison of Bridge 69005 and Bridge 69006 (Poly-Carb Taconite) throughout the
analyzed years is shown in Figure 101 The same decreasing trend in percentage of total
statewide accidents is present for both bridges even after an epoxy system was installed
on the deck of Bridge 69006 (Poly-Carb Taconite)
000
001
002
003
004
005
006
007
008
9066 9067 9823 9824 14809 14810 69005 69006 27019 27020 86013 6347
Aver
age
Per
centa
ge
of
Annual
Cra
shes
in M
innes
ota
Before After
Solid Bars Bridges with HFO systems
Crosshatched Bars Bridges without HFO systems
149
Figure 101 Side by side comparison of the percentage of total accidents in Minnesota
across time
Figure 100 and Figure 101 provide further evidence that although there is a decrease in
crashes on bridges with HFO systems the reduction does not conclusively appear to be
the direct result of an HFO installation creating a perceived benefit of HFO systems
Comparison of Crashes with the Sitersquos Surface Friction Values
Since a minimum skid resistance value does not exist for crash reduction it is possible to
improve skid resistance of a bridge deck without actually improving the safety of the
bridge The following comparison will compare skid number (SN) values with the
number of crashes per million vehicles at each bridge location (Figure 102) In this
figure the triangle markers indicate curved sections while tangent sections are identified
with circle markers The bridges are also split into three categories by speed limit under
55 mph [89 kmh] 55 mph [89 kmh] and over 55 mph [89 kmh]
0000
0001
0002
0003
0004
0005
0006
0007
0008
0009
0010
-6 -5 -4 -3 -2 -1 0 1 2
Per
centa
ge
of
To
tal
Cra
shes
in M
innes
ota
Years Relative to Installation
69005 69006
150
Figure 102 Skid Numbers versus the number of crashes per million vehicles
Below in Figure 103 the same data as Figure 102 is displayed except the x-axis has
coefficient of friction values Skid numbers are divided by 100 in order to put them in the
coefficient of friction form The coefficient of friction (Cf) values in the plot are results
from the DFT testing in Chapter 5
0
01
02
03
04
05
06
07
08
09
30 35 40 45 50 55 60
Num
ber
of
Cra
shes
per
Mil
lio
n V
ehic
les
Skid Number
SN (lt55mph) SN (55 mph) SN (gt55mph)
Triangle markers indicate curved sections
Circle markers indicate tangent sections
151
Figure 103 Coefficient of Friction and SN100 versus the number of crashes per million
vehicles
From this data roads with lower speeds roads tend to have a lower crash rate and curved
sections have a larger crash compared to tangent sections which correlates with previous
research (Long 2014)
However when comparing the SN or Cf values with crash rates there is not a noticeable
trend The number of crashes per million vehicles are not consistent when comparing
different bridges with similar skid numbers Furthermore there is not a consistently
descending crash rate as the SN values increase suggesting that SN values are not a good
indicator for crash rate reductions on bridges This is confirmed by both types of testing
lacking trends in their results
0
01
02
03
04
05
06
07
08
09
0000 0100 0200 0300 0400 0500 0600 0700 0800
Num
ber
of
Cra
shes
per
Mil
lio
n V
ehic
les
Coefficient of Friction [Skid Number100]
Cf (lt55mph) Cf (55mph) Cf (gt55mph) SN100 (lt55mph) SN100 (55 mph) SN100 (gt55mph)
Triangle (SN100) and diamond
(Cf) markers indicate curved
sections
Circle markers (SN100) and
square (Cf) indicate tangent
sections
152
Benefit-Cost Ratio Analysis
A benefit-cost ratio analysis similar to previous research was conducted The purpose of
this analysis is to compare the benefits of HFO systemrsquos through a monetary lens As
discussed in the Literature Review the severity of a crash can have an associated cost
The cost association created by MnDOT (Table 5) was used in this calculation The
average annual associated cost of crashes were found for each bridge before and after the
installation of an HFO system The average annual benefit is the difference between the
average annual associated costs before and after installation This average annual benefit
was multiplied by four years and compared to the estimated cost of installation Several
reasons justify the use of four years for this analysis
(1) The previous research predicted that the life expectancy of HFO systems in
Minnesota was between three to five years
(2) In Chapter 4 when looking at the skid numbers several bridges fell below an SN
of 50 around the fourth year in service
(3) The average life of an HFO system in this study is 483 years
Based on these factors it is reasonable to place the effective lifespan of an HFO system
between four to five years Systems that exist past that time are not necessarily
detrimental to the safety of a bridge deckrsquos surface safety but their benefits may be
significantly compromised
The benefits costs and benefit-cost (BC) ratio are found below in Table 25 while a
complete calculation is found in the Appendix It should be noted that the estimated cost
of installation is based on a unit price for the different HFO systems and an estimated
surface area of the bridge The cost is not based on any bid or construction data A
benefit-cost ratio larger than one means that the monetary benefit provided by an HFO
system installation is greater than the cost of installation Five of the nine bridges have a
BC ratio above one
153
Table 25 Average Annual Benefits Estimated Costs of HFO Installation and Four Year
Benefit-Cost Ratios
Bridge
Average Annual
Associated Cost of
Crashes
Average
Annual
Benefit
Estimated
Cost of
Installation
Average Four
Year Benefit
Four
Year
BC
Ratio Before
Installation
After
Installation
6347 $58667 $1108571 -$1049905 $18872000 -$4199619 -022
9066 $11429333 $3457143 $7972190 $35750000 $31888762 089
9067 $14152000 $13851429 $300571 $35750000 $1202286 003
9823 $6640000 $684444 $5955556 $3477600 $23822222 685
14809 $82880000 $55926154 $26953846 $3511998 $107815385 3070
14810 $2706667 $1209231 $1497436 $3511998 $5989744 171
69006 $13569231 $3448889 $10120342 $3585792 $40481368 1129
27019 $9807273 $80000 $9727273 $5720000 $38909091 680
86013 $000 $1189091 -$1189091 $4670600 -$4756364 -102
A perceived benefit exists in these benefit-cost ratios similar to the perceived benefit
discussed above when comparing side by side bridges and comparing the crashes
normalized to total crashes in Minnesota The reduction in total crashes over time reduces
the cost associated to crashes This benefit is also available in bridges without an HFO
installation (Table 26) As shown below two bridges without an HFO system have a
reduction in costs associated with crashes A benefit-cost ratio for these bridges cannot be
calculated because the ldquocostrdquo is zero
154
Table 26 Average Annual Benefits of Bridges without an HFO System Installed
Bridge
Average Annual Associated
Cost of Crashes Average
Annual
Benefit Before
Installation
After
Installation
9824 $3356923 $488889 $2868034
69005 $4070769 $4235556 -$164786
27020 $7574545 $2315556 $5258990
Crash Analysis Summary
Effectiveness of crash prevention potential of high-friction overlay treatments in
Minnesota was evaluated through analysis of crash and weather condition data The data
was provided by MnDOT from the Public Safety Database The crash data compared in
this paper occurred during the time frame from 2003 through 2013 and corresponded to
eleven different bridges in this study This analysis was completed to gain perspective on
the performance of bridge decks with high-friction overlay treatments The main concern
for the wear courses assessed through this analysis was the additional safety provided due
to the higher friction of such overlay systems The use of high friction overlays is
increasing in colder climate locations due to their perceived benefit of providing safer
driving conditions during inclement weather
On the basis of crash data analysis the following conclusions can be drawn
A majority of crashes occur in either dry or ice packed snow surface conditions
The friction properties of an HFO system have little effect in preventing crashes
during such instances Even bridges equipped with automated deicing systems
had a significant number of ice packed snow surface condition crashes
The main purpose of an HFO is to provide higher SN values to facilitate safer
roads and reduce crash rates HFO systems do provide an increase in surface
155
friction however noticeable trends between SN values and crash rates do not exist
suggesting that skid numbers are not a reliable indicator of crash rate reductions
There was a negligible change in the distribution of crash severity after HFO
systems were placed on the bridge decks
Five of the nine bridges had a benefit-cost (BC) ratio over one however the
benefits cannot be directly attributed to the installation of an HFO system
Further research is recommended for efficient and effective removal of ice packed
snow from bridge decks The removal of such conditions would significantly help
reduce the number of crashes on bridge decks in cold climates such as Minnesota
Although minimal crash prevention occurs of the systems the thin-bonded open
graded asphalt overlay [Novachip] provided the best performance in crash
reduction however it was closely followed by two of the epoxy based systems
[SafeLane and Poly-Carb]
Of the Poly-Carb systems with different aggregates the taconite aggregate
showed best performance in reduction of crashes as compared to flint or basalt
Previous research has looked at crashes occurring before and after the installation
of an HFO system The results provided the perceived benefit of crash reduction
however this perceived benefit occurs on bridges without an HFO installation
The average number of crashes occurring on a bridge deck is reduced regardless
of whether or not an HFO system was installed and at about the same rate for each
location
Overall crashes in the state of Minnesota are on a reducing trend but the reduction in
crashes on bridge decks with HFO systems cannot be completely attributed to the use of
such systems
The results and discussions presented herein are part of a larger encompassing study of
HFO systems in Minnesota Several other factors are being researched that attribute to the
performance of the systems in the field Based on this analysis high friction overlays are
not the primary reason for a reduction in crashes when placed on a bridge however HFO
systems do have other tangible benefits HFO systems provide a strong waterproof seal
156
over bridge decks reducing chloride ion penetration and thus mitigating corrosion of
reinforcing steel Other aspects such as geometrics play an important role in crashes and
should be incorporated into future studies
157
Chapter 6 Summary Conclusions and Recommendations
Summary
This study was proposed to continue the investigation of high friction overlay (HFO)
systems in Minnesota in which the Minnesota Department of Transportation (MnDOT)
has invested The investments were in efforts to provide safer surface conditions on
bridge decks The recommendation for further investigation came after a study and report
of SafeLane HFO products placed in Minnesota published by MnDOT (Evans 2010) A
larger scope of study was possible due to the continued use of HFO systems in
Minnesota Four different types of proprietary HFO systems were investigated on
fourteen different bridges This study encompassed more bridges more testing and
longer time intervals since the installation of the HFO systems than both the predeceasing
research and research previously conducted in other states
A comparative analysis of the different HFO systems was completed with the purpose of
investigating the HFO systems in regard to their field performance and the safety benefits
they provide A second objective of this study is to serve as a model for future research
involving HFO systems and their benefits in the reduction of crashes and ultimately the
safety of roadways they are placed on Through the observation testing and data analysis
of different conditions and performances for each HFO system the study looked to
answer several question regarding HFO systems including
(1) How do HFO systems perform in cold weather climates that exist in Minnesota
(2) Do HFO systems provide benefits that reduce crash rates on bridges
(3) Is there is a correlation between the SN values of an HFO system and their crash
rates
(4) Do the benefits HFO systems provide to Minnesota bridge decks justify their use
in the state
158
Conclusions
High friction overlay (HFO) systems are marketed to provide three main benefits for
infrastructure they are placed on (1) high friction (2) an impermeable surface and (3)
crash rate reduction
HFO Systems provide high friction values at the time of installation however those
values steadily decrease over time Different bridge sites are performing at varying states
of satisfaction Aggregate raveling heavy abrasion and aggregate polishing are three
distresses that exist on every bridge deck These distresses are mostly caused due to the
heavy use of snow plows for winter maintenance in the cold climate and ultimately
reduce the systemsrsquo surface friction
Novachip systems perform better in regards to abrasion The ductility of asphalt
allows for the continual embedment of aggregates into the matrix which helps to
reduce the amount of aggregate loss
Poly-Carb systemsrsquo mean texture depth values (measure of surface macro-texture)
are reduced on average by 6-8 a year
SafeLane systemsrsquo MTD values are reduced on average by 5 a year
Significant abrasion especially in the non-wheel path occurred on the Poly-Carb
and SafeLane bridges when comparing their MTD values from 2013 to 2014
The significant high friction values of HFO systems are limited in cold climates due to
their harsh maintenance operations which rapidly deteriorate the high friction surfaces
The lifespan of an HFO system in Minnesota is only about four or five years After this
time friction values of HFO systems are very similar to those provided by conventional
concrete or asphalt overlays
HFO systems provide an impermeable surface but only provided the systems do not
become distressed enough where delamination cracking or abrasion to the bridge deck
occurs
159
Of the fourteen bridges in this study
Two bridges had delaminated HFO systems (Br 4190 and 9036 both Poly-Carb)
Three bridges had cracks in the HFO systems (Br 27019 86013 and 86019 - all
Novachip)
One bridge had delamination an cracking (Br 6347 Transpo)
One bridge had cracking and complete removal system sections due to abrasion
(Br 27758 Transpo)
Thus fifty percent of the bridges in this study have compromised systems where water
and chloride ions are able to penetrate into the bridge deck Through the chloride ion
penetration testing it was found that when properly placed and when compromising
distresses have not occurred HFO systems have the ability to protect infrastructure from
chloride ion penetration However distresses of the system such as delamination
abrasion or cracking mitigate this protection in a localized area near the distress
reducing the infrastructure protection effectiveness of an HFO system
The main concern for the wear courses assessed through this analysis was the additional
safety provided due to the higher friction of such overlay systems The use of high
friction overlays is increasing in colder climate locations however they have a perceived
benefit of providing safer driving conditions during inclement weather
Ice packed snow surface conditions create situations where the friction properties
of an HFO system have little effect in preventing crashes Even bridges equipped
with automated deicing systems had a significant number of ice packed snow
surface condition crashes
The main purpose of an HFO is to provide higher SN values to facilitate safer
roads and reduce crash rates HFO systems do provide an increase in surface
friction however noticeable trends between SN values and crash rates do not exist
suggesting that skid numbers are not a reliable indicator of crash rate reductions
There was a negligible change in the distribution of crash severity after HFO
systems were placed on the bridge decks
160
Five of the nine bridges had a benefit-cost (BC) ratio over one however the
benefits cannot be directly attributed to the installation of an HFO system
Previous research has looked at crashes occurring before and after the installation
of an HFO system The results provided the perceived benefit of crash reduction
however this perceived benefit occurs on bridges without an HFO installation
The average number of crashes occurring on a bridge deck is reduced regardless
of whether or not an HFO system was installed and at about the same rate for each
location
Overall crashes in the state of Minnesota are on a reducing trend but the reduction in
crashes on bridge decks with HFO systems cannot be completely attributed to the use of
such systems
Of the different aggregates tested Flint aggregate is the least desirable aggregate
Although it had comparable performances with the other aggregates in the laboratory
testing Flint aggregates had the worst performance in the field Poly-Carb bridges with a
flint aggregate (Br 9066 and 9067) had some of the lowest MTD values and coefficients
of friction The bridges also had a significant amount of polished areas and aggregate
removal The Transpo system with Flint (Br 6347) had a significant amount of polished
areas where too much epoxy was applied which may have been caused by the flat and
elongated characteristics of the aggregate The particles required less epoxy to be covered
and when this adjustment was not made polished areas were created
Of the four different systems in this study Novachip systems appear to have the best
performance in the field Novachip systems are constructed similar to asphalt overlays
thus the system is compacted with a roller during construction This compaction helps to
push the aggregates further into the asphalt matrix and achieve a higher bond
Additionally asphalt remains pliable while it ages Aggregate in the Novachip systems
are able to compress into the asphalt under a load even after the initial placement
The elasticity of asphalt allows the system to absorb some of the energy caused by
abrasion Epoxy systems cannot compress and cannot absorb the energy as the stiffness
of epoxy is very high This results in the applied forces breaking the bonds formed
161
between the epoxy and aggregates and removing aggregates from the system Thus
Novachip systems are superior compared to epoxy systems in aggregate retention This
aggregate retention also helps to maintain a high friction throughout the systemrsquos service
life The two main distresses occurring in the Novachip systems were reflective cracking
and snowplow abrasion Both the reflective cracks and areas of extensive snow plow
abrasion came from settlement in the approach panels or sections of the bridge Thus the
major distresses are preventable by placing Novachip systems on well-functioning
bridges The negative aspect of Novachip systems is that asphalt is not a completely
impervious surface like hardened epoxy so Novachip systems have a lower potential for
infrastructure protection
Recommendations
Common surface conditions during the winter such as ice packed snow surfaces the
presence of water and winter maintenance practices with snow plows are all detrimental
to an HFO systemrsquos performance in cold weather climates A life span of only four or
five years exists due to distresses that occur on HFO systems caused by common winter
conditions These distresses severely mitigate the benefits HFO systems provide
Furthermore at an average cost of around $550 per square foot the higher costing HFO
systems also do not provide an economical benefit Since the friction and infrastructure
protection benefits are not long-lasting or are compromised due to distresses a crash
reduction does not occur as a direct result of HFO systems and the systems come at a
higher cost than conventional overlays it is recommended that HFO systems are not used
in Minnesota
HFO systems in mild climates may provide more benefits because (1) their friction
values may not be compromised due to a lesser use of snow plows and (2) ice packed
snow conditions which were present for 39 of the crashes in this study are not as
prevalent in mild climate areas Other cold climate region transportation agencies should
conduct similar studies to justify the use of HFO systems Most notably the crash rate
reductions on HFO systems should be compared to the overall crash rate reduction in
162
their jurisdiction Looking solely at the crashes before and after the installation of an
HFO system provides the perceived benefit that a reduction in crashes is occurring if the
trend of overall crashes is also decreasing
Although this research shows that a reduction in crashes is not occurring due to the
installation of HFO systems it cannot conclusively state whether HFO systems in fact
increase the crash rate potential on a bridge This potential increase in crash rates is
suggested by data in this research such as (1) an increase in crashes during dry surface
conditions (2) a significant number of crashes occurring during ice packed snow
conditions along with the larger mean texture depth which may facilitate ice packed snow
conditions to occur and (3) an increase in polished or raveled areas as systems age It is
recommended that further research looks more in depth into the possibility of HFO
systems having adverse effects on crash rates
Overall the DFT and skid trailer tests provide similar surface friction values It is
recommended that DFT testing becomes a more prevalent test method because of the
benefits it provides compared to the skid trailer It allows for multiple tests run in the
same location providing higher precision It also eliminates error that may interfere with
test results such as bouncing lateral movement improper water spray film thickness or
incorrect speeds of the skid trailer which must be in motion for its testing procedure The
fact that testing is done in a static location for DFT testing provides the opportunity to
test more accurately in wheel and non-wheel paths It also provides the opportunity to test
specific distressed areas to compare with non-distressed areas
Several recommendations can be made for research into the improvement of HFO
products Research on construction practices and education of contractors should be
conducted in order to provide a more consistent finished product Improper levels of
epoxy during the placement of HFO systems can lead to polished areas from excessive
epoxy or aggregate raveling due to an insignificant amount of placed epoxy HFO
systems must be placed more consistently in order to improve the consistency of their
friction values Research should be conducted into a mechanized placement system for
163
epoxy systems the research should look mostly into how a machine could improve the
consistency of construction and if such a machine has a cost benefit
Based on comparisons between asphalt based and epoxy based HFO systems Companies
that produce epoxy based systems should research more ductile epoxies Increasing the
ductility may allow for absorption of abrasion loads This absorption may help to reduce
the amount of aggregate raveling occurring in epoxy based systems This ductility
however must not compromise the overall bond strength between the HFO system and
the underlying concrete deck
It appears that as the mean texture depth (MTD) of an HFO system increases so does the
coefficient of friction However faster rates at which the coefficient of friction increases
occur with systems that use a nominal maximum aggregate size (NMAS) of 0187 inches
[5 mm] compared to 0375 inches [95 mm] Further research should be conducted to
verify if the use of 0187 inch [5 mm] aggregates is more beneficial
Testing of the complete HFO systems in a laboratory setting should be researched
Material testing such as impact abrasion and bending strength testing of HFO systems in
a laboratory setting may provide insight on ways to improve HFO systems and could also
aid in the study of previously recommended improvements
164
References
AASHTO LRFD Bridge Design Specifications Customary US Units (6th Edition) with
2012 and 2013 Interim Revisions and 2012 Errata (2012) American Association
of State Highway and Transportation Officials (AASHTO)
AASHTO T103-08 (2012) ldquoStandard Method of Test for Soundness of Aggregates by
Freezing and Thawingrdquo Standard Specifications for Transportation Materials and
Methods of Sampling and Testing 32rd Edition American Association of State
Highway and Transportation Officials Washington DC
AASHTO T277 (2013) ldquoStandard Method of Test for Rapid Determination of the
Chloride Permeability of Concreterdquo Standard Specifications for Transportation
Materials and Methods of Sampling and Testing 33rd Edition American
Association of State Highway and Transportation Officials Washington DC
Anderson K W Russell M Sheets J Burkey D Uhlmeyer J S amp Weston J
(2012) ldquoEvaluation of Tyregripreg High-Friction Surfacingrdquo WA-RD 7881 Post-
Construction Rep Washington State Department of Transportation Olympia
WA
ASTM C1202-12 (2012) ldquoStandard test method for electrical indication of Concretersquos
ability to resist chloride ion penetrationrdquo ASTM International West
Conshohocken PA
ASTM C1252-06 (2006) ldquoStandard Test Methods for Uncompacted Void Content of
Fine Aggregate (as Influenced by Particle Shape Surface Texture and Grading)rdquo
ASTM International West Conshohocken PA
ASTM C127-12 (2012) ldquoStandard Test Method for Density Relative Density (Specific
Gravity) and Absorption of Coarse Aggregaterdquo ASTM International West
Conshohocken PA
ASTM C128-12 (2012) ldquoStandard Test Method for Density Relative Density (Specific
Gravity) and Absorption of Fine Aggregaterdquo ASTM International West
Conshohocken PA
165
ASTM C131-14 (2014) ldquoStandard Test Method for Resistance to Degradation of Small-
Size Coarse Aggregate by Abrasion and Impact in the Los Angeles Machinerdquo
ASTM International West Conshohocken PA
ASTM C136-06 (2006) ldquoStandard Test Method for Sieve Analysis of Fine and Coarse
Aggregatesrdquo ASTM International West Conshohocken PA
ASTM D4791-10 (2010) ldquoStandard Test Method for Flat Particles Elongated Particles
or Flat and Elongated Particles in Coarse Aggregaterdquo ASTM International West
Conshohocken PA
ASTM D5821-13 (2013) ldquoStandard Test Method for Determining the Percentage of
Fractured Particles in Coarse Aggregaterdquo ASTM International West
Conshohocken PA
ASTM E1911-09 (2009) ldquoStandard test method for measuring paved surface frictional
properties using the dynamic friction testerrdquo ASTM International West
Conshohocken PA
ASTM E274 (2011) ldquoStandard test method for skid resistance of paved surfaces using a
full-scale tirerdquo ASTM International West Conshohocken PA
ASTM E965-96 (2006) ldquoStandard Test Method for Measuring Pavement Macrotexture
Depth Using a Volumetric Techniquerdquo ASTM International West
Conshohocken PA
Clemena G G and Virmani P (1998) ldquoCorrosion protectionmdashconcrete bridgesrdquo
FHWA-RD-98-088 Federal Highway Administration Washington DC
Costa Jorge (2010) ldquoCorrosion of Steel Reinforcing in Concrete and Masonry
Structuresrdquo Structures Congress 2010 American Society of Civil Engineers
Dave E V Kostick R D amp Dailey J (2014) ldquoComparative performance study of
chip seal and bonded wear course systems applied to bridge decks and
approaches Field cracking debonding and wearing evaluation year-1rdquo
Minnesota Department of Transportation St Paul MN
166
Evans J F (2010) ldquoEvaluation of the SafeLane overlay system for crash reduction on
bridge deck surfacesrdquo MNRC 2010-13 Minnesota Department of Transportation
St Paul MN
FHWA (2013) ldquoStrategic Highway Safety Plans ndash A Championrsquos Guidebook to Saving
Lives Second Editionrdquo FHWA-SA-12-034 US Department of Transportation
Washington DC
Harper J (2007) ldquoInvestigations of Failures of Epoxy Polymer Overlays in Missourirdquo
R106-020 Missouri Department of Transportation Jefferson City MO
Izeppi E Flintsch GW amp McGhee K K (2010) ldquoField performance of high friction
surfacesrdquo FHWAVTRC 10-CR6 Federal Highway Administration Richmond VA
Long K Wu H Zhang Z amp Murphy M (2014) ldquoQuantitative relationship between
crash risks and pavement skid resistancerdquo FHWATX-130-6713-1 Texas
Department of Transportation Austin TX
Pavia Systems Inc (2012) Los Angeles Abrasion Pavement Interactive Web 02 Oct
2013 lthttpwwwpavementinteractiveorgarticlelos-angeles-abrasiongt
Mamlouk Michael S Zaniewski John P (2011) Materials for Civil and Construction
Engineers Third Edition New Jersey Pearson Education Inc Print
Midland (2014) ldquoNovaChiprdquo Products amp Processes Web 11 Dec 2014
lthttpwwwmidlandasphaltcomproducts-processesnovachipgt
MN Department of Public Safety (2014) ldquoMinnesota motor Vehicle Crash Facts 2013rdquo
Minnesota Department of Public Safety St Paul MN
MnDNR (2014a) ldquoGeneral Climate Description for Minnesotardquo General Statistics and
Summaries Web 27 Nov 2014
lthttpwwwdnrstatemnusclimatesummaries_and_publicationsindexhtmlgt
MnDNR (2014b) ldquoNormals Means and Extremes for Major Airport Weather Stationsrdquo
General Statistics and Summaries Web 27 Nov 2014
lthttpwwwdnrstatemnusclimatesummaries_and_publicationsindexhtmlgt
167
MnDOT (2013) ldquoFacts about crashes budget fatality ratesrdquo Transportation Fact
Cards Web 23 Mar 2015 lt
lthttpwwwdotstatemnustrafficengpubltriviacardgt
MnDOT (2014a) ldquoAbout MN TZDrdquo Minnesota Towards Zero Deaths Web 15 Aug
2014 lthttpwwwminnesotatzdorggt
MnDOT (2014b) ldquoCritical Emphasis Areasrdquo Transportation Fact Cards Web 25 Mar
2015 lt httpwwwdotstatemnustrafficengpubltriviacardtrivia12critical-
emphasis-areaspdfgt
Nelson T (2011) ldquoEvaluation of Skid Resistance of Turf Drag Textured Concrete
Pavementsrdquo MNRC 2011-12 Minnesota Department of Transportation
Maplewood MN
Poly-Carb (2013)POLY-CARB MARK-174 Product By Poly-Carb Mark Web 25
Sept 2013 lthttpwwwpoly-carbcomproductsdetailsaspid=187gt
Cargill (2014) SafeLanereg surface overlay for increased safety ice prevention and
infrastructure protection SafeLane Surface Overlay Web 11 Dec 2014
lthttpwwwcargillcomproductssaltwintersafelanegt
FHWA (2010) ldquoTechnical Advisory Pavement Friction Managementrdquo Web 6 Nov
2013 lthttpwwwfhwadotgovpavementt504038cfmgt
Tremblay Jason P (2013) ldquoAssessment of the Poly-Carb Flexogrid Bridge Deck
Overlay Systemrdquo U2013-02 Research Update Vermont Agency of
Transportation VT
USDOT (2015) ldquoCritical Reasons for Crashes Investigated in the National Motor
Vehicle Crash Causation Surveyrdquo DOT HS 812-115 US Department of
Transportation Washington DC
Watson M Clyne T and Izevbekhai B (2011) ldquoHot Mixed Asphalt Pavement Surface
Characteristics Related to Ride Texture Friction Noise and Durabilityrdquo Report
Number LRRB INV 868 MPR-6(029) Task 5 Minnesota Department of
Transportation Maplewood MN
168
Young L M Durham S A amp Bindel M K (2012) ldquoThin bonded epoxy overlays on
concrete bridge deck surfacesrdquo Paper presented at the Transportation Research
Board 91st Annual Meeting (12-3418)
Zanko L Fosnacht D amp Hopstock D (2009) Construction aggregate potential of
Minnesota taconite industry byproducts (pp 252-274) American Society of Civil
Engineers doi10106141072(359)27
169
Appendix
Chapter 3 Appendix
This section provides raw data and calculations used to complete the results section in
Chapter 3
Density Specific Gravity amp Absorption (Fine Aggregate) Data
The results in Table 9 and Table 10 (See Results section) were calculated using Equations
1-6 and the Data found in Table 27 Data from Table 28 and equation 7 were used to
calculate the values found in Table 11 of the results section
Table 27 Specimen Mass Data
Basalt Flint Taconite A Taconite B SafeLane
A 481 4636 4744 4768 4758
B 6662 6662 6662 6662 6662
C 9725 9601 9908 9871 9768
S 5017 5019 5002 5009 5018
A= Mass of oven dry specimen (g)
B= Mass of pycnometer filled with water (g)
C= Mass of pycnometer filled with specimen and water (g)
S= Mass of saturated surface-dry specimen (g)
Oven Dry Density (kgm3) =9975[A
(B+SminusC)] (1)
SSD Density (kgm3) =9975[S
(B+SminusC)] (2)
Apparent Density (kgm3) = 9975 lowast [A
(B+AminusC)] (3)
170
Oven Dry Relative Density (Specific Gravity) = 9975 lowast [A
(B+SminusC)] (4)
SSD Relative Density (Specific Gravity) = 9975 lowast [S
(B+SminusC)] (5)
Apparent Relative Density (Specific Gravity) = 9975 lowast [A
(B+AminusC)] (6)
Table 28 Absorption Data
Aggregate Initial
Mass (g)
SSD Mass
(g)
Basalt 22125 2243
Flint 2138 2167
Taconite A 23465 23745
Taconite B 26245 26525
SafeLane 2450 2486
Absorption () = 100 lowast [(119872119886119904119904119878119878119863minus119872119886119904119904119889119903119910)
119872119886119904119904119878119878119863] (7)
171
Resistance to Degradation Los Angeles Machine Data
The results in Table 12 (See Results section) were calculated using the data from Table
29 in Equations 8
Table 29 Los Angeles Machine Degradation (Test Samples of Grading D)
Aggregate Mass Before (g) Mass After (g)
Basalt 49721 481683
Flint 498247 483112
SafeLane 496658 473684
Taconite A 497551 481806
Taconite B 497962 477832
Percent Loss by Abrasion = 100 lowast [Mass AfterminusMass Before
Mass Before] (8)
Uncompacted Voids Data
The results in Table 13 (See Results section) were calculated using the data from
Table 30 in Equations 9-10
Table 30 Uncompacted Voids Data
V 100 100 100 100 100
E 1896 1896 1896 1896 1896
T1 3552 3308 3531 3342 3406
T2 3557 332 3532 333 3408
T3 3554 3314 3533 3323 3407
Ta 3554 3314 3532 3332 3407
F 1658 1418 1636 1436 1511
Gs 265 223 27 249 246
U 3740 3640 3940 4230 3860
172
Where V= Volume of cylindrical measure (ml)
E= Mass of cylindrical measure (g)
T= Gross mass of filled cylindrical measure (g)
F= Net mass of fine aggregate (g)
Gs= Dry relative density (specific gravity)
U= Uncompacted voids in the material ()
F = Ta minus E (9)
U = 100[Vminus(
F
Gs)
V] (10)
FlatElongated Particles
The data shown below in Table 31 thru Table 34 are summarized for comparison in
Figure 17 through Figure 19 (See Results Section)
Table 31 Basalt - FlatElongated Particles
FlatElongated
Ratio
Number of Particles and Percentage
2 to 1 3 to 1 5 to 1
Flat 30 28 4 4 0 0
Elongated 2 2 0 0 0 0
FlatElongated 1 1 0 0 0 0
None 75 69 104 96 108 100
Total 108 100 108 100 108 100
173
Table 32 Taconite A- FlatElongated Particles
FlatElongated
Ratio
Number of Particles and Percentage
2 to 1 3 to 1 5 to 1
Flat 68 58 28 24 4 3
Elongated 4 3 0 0 0 0
FlatElongated 3 3 0 0 0 0
None 42 36 89 76 113 97
Total 117 100 117 100 117 100
Table 33 Taconite B- FlatElongated Particles
FlatElongated
Ratio
Number of Particles and Percentage
2 to 1 3 to 1 5 to 1
Flat 72 57 21 17 1 1
Elongated 5 4 0 0 0 0
FlatElongated 2 2 0 0 0 0
None 47 37 105 83 125 99
Total 126 100 126 100 126 100
Table 34 SafeLane- FlatElongated Particles
FlatElongated
Ratio
Number of Particles and Percentage
2 to 1 3 to 1 5 to 1
Flat 46 43 11 10 0 0
Elongated 5 5 0 0 0 0
FlatElongated 2 2 0 0 0 0
None 54 50 96 90 107 100
Total 107 100 107 100 107 100
174
Soundness of Aggregate Freeze Thaw Data
The results in Figure 8 (See Results section) were calculated using the data from Table 35
in Equations 11
Table 35 Freeze Thaw Resistance Data
Sample
(Sieve Size)
Mass of
Water
(g)
Mass of
Salt
(g)
Aggregate Mass (g) Loss of
Mass
(g)
Percent
of Mass
Lost () Original Final
Basalt 8 946 284 150 1465 35 23
Flint 8 959 288 150 147 3 20
Flint 16 949 285 150 1465 35 23
Taconite A
8 945 284 150 1455 45 30
Taconite A
16 982 295 150 147 3 20
Taconite B
8 988 296 150 1485 15 10
Taconite B
16 947 284 150 1485 15 10
Safe Lane
4 980 294 150 1475 25 17
Safe Lane
8 951 285 150 1495 05 03
Note Flint 8 stands for Flint retained on the 8 sieve
Percent of Mass Lost () = 100 lowast [Loss of Mass (g)
Aggregate Original Mass (g)] (11)
175
Sieve Analysis
Below are the gradations (Table 36 through Table 40) for the five aggregate samples The
gradations are summarized in the Chapter 3 Results section in Figure 22
Table 36 Basalt Sieve Analysis
Sieve Size Mass Retained (g) Cumulative Mass (g) Percent Passing ()
0375 inch 0 0 10000
4 214 214 9853
8 13684 13898 444
16 642 1454 002
50 02 14542 001
100 0 14542 001
200 01 14543 000
Pan 0 14543 000
Total 14543
Table 37 Flint Sieve Analysis
Sieve Size Mass Retained
(g)
Cumulative Mass
(g)
Percent Passing
()
0375 inch 0 0 10000
4 14 14 9992
8 12664 12678 2940
16 5196 17874 047
50 76 1795 004
100 02 17952 003
200 02 17954 002
Pan 04 17958 000
Total 17958
176
Table 38 Taconite A Sieve Analysis
Sieve Size Mass Retained
(g)
Cumulative Mass
(g)
Percent Passing
()
0375 inch 0 0 10000
4 694 694 9582
8 1320 13894 1630
16 2694 16588 007
50 03 16591 005
100 01 16592 004
200 01 16593 004
Pan 06 16599 000
Total 16599
Table 39 Taconite B Sieve Analysis
Sieve Size Mass Retained
(g)
Cumulative Mass
(g)
Percent Passing
()
95 0 0 10000
4 28 28 9895
8 20185 20465 2350
16 6216 26681 026
30 41 26722 011
100 18 2674 004
200 07 26747 001
Pan 04 26751 000
Total 26751
177
Table 40 SafeLane Sieve Analysis
Sieve Size Mass Retained
(g)
Cumulative Mass
(g)
Percent Passing
()
95 0 0 10000
4 847 847 6136
8 12828 21298 284
100 56 21858 028
200 12 2187 023
Pan 5 2192 000
Total 2192
178
Chapter 4 Appendix
This section provides additional equations data and plots used to complete Chapter 4
Mean Texture Depth
Equation 12 is used to find the Mean Texture Depth (MTD) as described in ASTM E965
ndash 96
MTD = 4119881
1205871198632 (12)
Where MTD = Mean Texture Depth (in)
V = sample volume (in3)
D = average diameter of the area covered by material (in)
Sample Calculation using Test from Bridge 9823 (Atkinson MN)
100 cubic centimeters of sand was used in the test with the resulting 4 diameter
measurements of 1325rdquo 135rdquo 135rdquo and 1375rdquo for an average diameter of 135rdquo
MTD = 4119881
1205871198632 = 4lowast(100 1198881198983lowast [
1 119894119899
254 119888119898]3
)
120587lowast(135 119894119899)2 = 00426 in
Coefficient of Permeability
Equation 13 is used to find the coefficient of permeability as described by the NCAT
Asphalt Field Permeameter Kit AP-1B operating manual
K = (
119886lowast119871
119860lowast119905)
ln(ℎ1ℎ2
) (13)
Where K = Coefficient of permeability
a = 285 cm2 = Inside cross sectional area of standpipe
L = 09525 cm = Length of sample (Thickness of epoxy system)
A = 16753 cm2 = Cross-sectional area of Permeameter
t = Elapsed time between h1 and h2
h1 = Initial head cm
h2 = Final head cm
179
Sample calculation using data from a test on Bridge 9067
K = (
119886lowast119871
119860lowast119905)
ln(ℎ1ℎ2
)=
(285 1198881198982lowast09525 119888119898
16753 1198881198982lowast600 119904119890119888)
ln(59 119888119898
585 119888119898)
= 226x10-7 cmsec
Friction Testing
The following data provides the average skid number results throughout the years of
testing conducted by MnDOT (Table 41)
Table 41 Average Skid Number Test Results
Date 2007 2008 2009 2010 2011 2012 2013 2014
Bri
dge
6347 0 0 0 0 0 0 5824 548
9066 0 0 0 120 5225 4705 4168 0
9067 0 0 0 120 0 4668 44 0
9823 0 0 NA 649 6025 541 0 0
14809 635 503 4795 456 381 3645 0 0
14810 652 502 4627 4003 3873 351 0 0
27019 0 0 566 571 571 5385 545 0
27758 0 0 0 598 487 502 5467 541
69006 0 0 120 613 617 5473 0 0
86013 0 0 0 0 0 0 5635 0
86019 0 0 0 0 0 0 5605 0
9036 0 0 0 0 0 0 0 579
Note
0 = No friction test was conducted
NA = a test was conducted but resulted in poor test data or a faulty test
180
Chloride Ion Penetration
Data for Bridge 9823 is found in Table 42 and Table 43 while data for Bridge 69006 is
found in Table 44 through Table 46
Table 42 Chloride Content on Bridge 9823 (Tested Oct 11 2011)
Depth
(in)
Chloride Content (ppm Cl)
Core 1 Core 2 Core 3 Core 4 Core 5 Core 6
Average Driving
Lane
Driving
Lane
Driving
Lane
Passing
Lane
Passing
Lane
Passing
Lane
0-1 5382 6849 5118 4869 4139 5676 5339
1-2 3828 4309 2082 1483 2853 4038 3099
2-3 3063 2895 140 116 2459 3792 2078
3-4 3074 2007 116 NA NA NA 1732
Table 43 Chloride Content on Bridge 9823 (Tested Dec 1 2014)
Depth
(in)
Chloride Content (ppm Cl)
Core 1 Core 2
Average Driving
Lane
Passing
Lane
0-05 4106 4655 4381
05-1 3309 5437 4373
1-15 2377 3552 2965
15-2 1642 2776 2209
2-3 758 1436 1097
3-4 466 321 394
4-5 NA 300 300
181
Table 44 Chloride Content on Bridge 69006 (Tested Oct 15 2010)
Depth
(in)
Chloride Content (ppm Cl)
Core 1 Core 2 Core 3 Core 4 Core 5 Core 6
Average Driving
Lane
Driving
Lane
Driving
Lane
Passing
Lane
Passing
Lane
Passing
Lane
0-1 4028 4453 3805 3972 4614 4175 4175
1-2 2330 2486 2476 1078 2078 1968 2069
2-3 1099 1404 1341 907 366 622 957
3-4 812 582 839 1351 1563 785 989
4-5 482 226 438 1122 432 721 570
5-6 384 241 116 953 117 298 352
Table 45 Chloride Content on Bridge 69006 (Tested Sep 5 2011)
Depth
(in)
Chloride Content (ppm Cl)
Core 1 Core 2 Core 3 Core 4 Core 5 Core 6
Average Driving
Lane
Driving
Lane
Driving
Lane
Passing
Lane
Passing
Lane
Passing
Lane
0-1 4340 4172 5025 4072 4738 3745 4349
1-2 1676 2788 2263 1560 2353 2445 2181
2-3 830 564 487 948 1208 1731 961
3-4 NA NA NA NA NA 1981 1981
182
Table 46 Chloride Content on Bridge 69006 (Tested Dec 1 2014)
Depth
(in)
Chloride Content (ppm Cl)
Core 1 Core 2
Average Driving
Lane
Passing
Lane
0-05 4338 4472 4405
05-1 4116 5108 4612
1-15 3176 4406 3791
15-2 1922 3845 2884
2-3 654 3357 2006
3-4 1062 3142 2102
4-5 NA 2530 2530
183
Chapter 5 Appendix
Data for Contributing Factors in Crashes
The following provides the number of crashes with each contributing factor by bridge
Table 47 Data for Contributing Factors
Contributing Factor Number of Crashes by Bridge per Contributing Factor
6347 9066 9067 9823 14809 14810 27019 69006 86013
Not Specified 0 14 19 2 2 0 1 1 1
No Clear Factor 1 11 31 3 1 0 8 3 1
Failure to Yield 0 0 0 0 0 0 0 1 0
Illegal or Unsafe
Speed 2 29 10 17 7 7 1 21 0
Following Too
Closely 0 3 11 0 1 1 3 0 0
Disregard Traffic
Control Device 0 0 0 0 0 0 1 0 0
Improper Passing 0 0 0 0 0 1 0 0 0
Improper or Unsafe
Lane Use 0 2 2 2 0 0 0 0 0
Improper
ParkingStopping 0 2 0 0 0 0 0 0 0
Over-Correcting 0 1 0 0 2 0 0 0 0
InattentiveDistracted
Driver 1 2 7 0 2 2 3 3 0
Driver Inexperience 0 1 0 0 1 0 0 0 0
Chemical
Impairment 0 1 1 0 1 0 0 3 0
Other Human
Contributing Factor 0 2 2 0 1 0 1 0 0
Vehicle Obscured 0 0 0 0 1 0 0 0 0
Defective TireTire
Failure 0 0 1 0 0 0 0 0 0
Skidding 0 1 1 0 0 1 0 4 0
Other Vehicle
Defects or Factors 0 0 2 0 0 0 0 0 0
Weather 0 4 1 1 3 2 0 6 0
OtherUnknown 0 0 2 0 0 0 1 2 0
Total 4 73 90 25 22 14 19 44 2
184
Sample Calculation Number of Accidents per Million Vehicles Crossing
For a given bridge the number of accidents per million vehicles was found by dividing
the number of accidents per year by the bridgersquos AADT The values were then averaged
for the number of years before and after an epoxy overlay was installed This average is a
small percentage and for the sake of presenting the data this percentage was reported in
terms of millions of vehicles The following is a sample calculation using data from
Bridge 9066 [Poly-Carb Flint] using data from Table 48
Table 48 Data to Calculate Number of Crashes Normalized to AADT for Bridge 9066
Year
Year
Relative to
Installation
Number
of
Accidents
Yearly
Accidents
per Yearly
Traffic
2003 -7 9 795404E-07
2004 -6 3 265135E-07
2005 -5 11 972161E-07
2006 -4 3 265135E-07
2007 -3 9 795404E-07
2008 -2 6 53027E-07
2009 -1 12 106054E-06
2010 0 3 265135E-07
2011 1 6 53027E-07
2012 2 3 265135E-07
2013 3 8 707026E-07
Bridge AADT 31000 vehiclesday
Yearly Accidents per Yearly Traffic = of Accidents
AADTlowast365
185
For 2003 Yearly Accidents per Yearly Traffic =9
31000lowast365= 795404E minus 07
To find the number of accidents per million vehicles before installation
Σ(Yearly Accidents per Yearly Traffic)
Number of Years Before Installation=
0000495
7= 0000071 = 0707
Accidents
Million Vehices
Benefit-Cost Ratio Calculation
A complete example of this calculation is provided below using data from Bridge 69006
as an example
In order to calculate the Benefit-Cost Ratio the number of crashes based on their severity
must be tallied for before and after the installation of an HFO system (Table 49)
Table 49 Number of Crashes per Year by Severity (Bridge 69006)
Year
Relative to
Installation
Year No
Injury
Possible
Injury
Non-
Incapacitating
Injury
Incapacitating
Injury Killed
-6 2003 5 0 1 0 0
-5 2004 3 1 0 0 0
-4 2005 5 2 0 1 0
-3 2006 6 0 0 0 0
-2 2007 4 0 0 0 0
-1 2008 1 0 1 1 0
0 2009 1 0 0 0 0
05 2009 0 1 0 0 0
1 2010 1 1 0 0 0
2 2011 2 1 0 0 0
3 2012 1 1 0 0 0
4 2013 4 0 0 0 0
Total
Number of
Crashes
Before 25 4 2 2 0
After 8 4 0 0 0
186
With the totals calculated (Table 49) the averages are found for each severity and
multiplied by the associated cost of crashes based on the figures given in
Table 5 The difference between the before and after associated costs is the average
annual benefit (Table 50) This average annual benefit is multiplied by four in order to
find the benefit over the average lifespan of an HFO system The average four year
benefit is divided by the estimated cost of an HFO installation (found in Table 51) to
obtain the benefit-cost ratio
Table 50 Benefit-Cost Ratio Calculation (Bridge 69006)
Severity
Average Annual Number of
Crashes
Cost of
Crash per
Severity
Associated Cost of
Crashes
Before After Before After
No Apparent Injury 3846 1778 $4400 $1692308 $782222
Possible Injury 0462 0889 $30000 $1384615 $2666667
Non-Incapacitating
Injury 0308 0 $61000 $1876923 $0
Incapacitating Injury 0308 0 $280000 $8615385 $0
Killed 0 0 $3600000 $0 $0
Total $13569231 $3448889
Average Annual Benefit (Difference) $10120342
Average Four Year Benefit $40481368
Estimated Cost of HFO Installation (From
Table 51) $3585792
Benefit-Cost Ratio (BC) 1129
187
Table 51 Calculation for Estimated Cost of HFO System Installation
Bridge
Estimated
Cost of
HFO
Installation
($ft2)
Width
(ft)
Length
(ft)
Area
(ft2)
Total
Estimated
Cost of HFO
Installation
($)
6347 $1000 28 674 18872 $18872000
9066 $500 55 1300 71500 $35750000
9067 $500 55 1300 71500 $35750000
9823 $368 42 225 9450 $3477600
14809 $567 38 163 6194 $3511998
14810 $567 38 163 6194 $3511998
69006 $368 42 232 9744 $3585792
27019 $550 40 260 10400 $5720000
86013 $550 44 193 8492 $4670600
Notes
(1) The Estimated Cost per square foot was provided by MnDOT
for every bridge except 27019 and 86013 for these two
bridges an average of $550ft2 was used based off of the other
bridges
(2) The bridge widths were estimated during site visits and with
the use of satellite imagery
(3) The bridge lengths were provided by MnDOT